Submitted:
29 January 2026
Posted:
30 January 2026
You are already at the latest version
Abstract
Polycystic ovary syndrome (PCOS) is a heterogeneous endocrine–metabolic disorder as-sociated with insulin resistance (IR), visceral adiposity, and increased cardiometabolic risk. The visceral adiposity index (VAI) is a validated surrogate marker of adipose tissue dysfunction, but its relationship with circulating neurotrophins and adipokine balance in PCOS remains incompletely understood. In this study, 100 women with PCOS were strati-fied into lower- (n = 50) and higher-risk (n = 50) groups according to VAI. Anthropometric measures, fasting glucose and insulin concentrations, lipid profile, and serum levels of brain-derived neurotrophic factor (BDNF), nerve growth factor-β (NGFβ), leptin, adi-ponectin, and resistin were assessed. HOMA-IR, adipokine ratios and atherogenic indices were calculated. Multivariate regression revealed that BDNF was independently associ-ated with VAI and non-HDL-cholesterol, whereas NGFβ was independently associated with HDL-cholesterol and estradiol, indicating neurotrophin associations with metabolic and endocrine parameters independent of general adiposity. Correlation heatmap and network analyses demonstrated interconnected clusters linking visceral adiposity, IR, dyslipidemia, adipokine imbalance, and neurotrophins, with the leptin/adiponectin ratio emerging as a central integrative marker. These findings indicate that VAI-defined car-diometabolic risk in PCOS is accompanied by distinct and opposing neurotrophin–adipokine signatures, highlighting neurotrophin–adipokine networks underlying visceral adiposity-driven cardiometabolic and endocrine risk.
Keywords:
polycystic ovary syndrome
; visceral adiposity index
; cardiometabolic risk
; neurotrophins
; BDNF
; NGFβ
; adipokines
; insulin resistance
; estradiol
1. Introduction
Polycystic ovary syndrome (PCOS) is one of the most common endocrine disorders in women of reproductive age, affecting approximately 10–15% of the female population worldwide [1,2]. Beyond its reproductive manifestations, PCOS is increasingly recognized as a complex metabolic condition characterized by insulin resistance, dyslipidemia, visceral adiposity, and elevated cardiometabolic risk, which substantially contributes to the long-term development of type 2 diabetes mellitus and cardiovascular disease [3,4,5].
Visceral adiposity plays a pivotal role in the metabolic derangements associated with PCOS. Dysfunctional visceral adipose tissue acts as an active endocrine organ, secreting adipokines and bioactive mediators that influence insulin sensitivity, lipid metabolism, and low-grade inflammation [6,7]. The visceral adiposity index (VAI), which integrates anthropometric measures and lipid parameters, has emerged as a practical surrogate marker of visceral fat dysfunction and cardiometabolic risk, potentially outperforming body mass index (BMI) in women with PCOS [8,9].
Neurotrophins have recently attracted attention as molecular mediators linking metabolism, adipose tissue biology, and endocrine regulation. Brain-derived neurotrophic factor (BDNF) and nerve growth factor-β (NGFβ), classically known for their roles in neuronal development, are also expressed in adipose tissue and peripheral metabolic organs and exert regulatory effects on energy balance, lipid handling, and insulin signaling [10,11,12]. However, studies investigating circulating BDNF levels in obesity and PCOS have yielded inconsistent results, reporting both increased and decreased concentrations [13,14,15]. In contrast, NGFβ has been linked to ovarian function, steroidogenesis, and potentially favorable lipid profiles, yet data regarding its role in cardiometabolic risk in PCOS remain scarce and inconclusive [16,17].
Adipokines such as leptin, adiponectin, and resistin further modulate metabolic and inflammatory pathways in PCOS. Notably, adipokine ratios, including adiponectin/leptin and adiponectin/resistin, have been proposed as sensitive indicators of adipose tissue dysfunction and insulin resistance, providing greater pathophysiological insight than individual adipokine levels alone [18,19,20].
While individual roles of neurotrophins and adipokines in PCOS have been studied, their integrated association with VAI-defined visceral adiposity and cardiometabolic risk remains unexplored in a single cohort. Therefore, the present study aimed to investigate VAI-associated differences in circulating BDNF and NGFβ levels, adipokine ratios, and cardiometabolic parameters in women with PCOS, as well as their relationships with lipid fractions, insulin resistance indices, and estradiol levels.
2. Results
2.1. Clinical and Anthropometric Characteristics According to VAI
No significant differences were observed between the low- and high-VAI PCOS groups with respect to age or height. In contrast, women with high VAI exhibited significantly higher body weight and BMI (p < 0.001). Parameters reflecting central adiposity, including waist and hip circumferences, waist-to-hip ratio (WHR), and waist-to-height ratio (WHtR), were all significantly elevated in the high-VAI group (p < 0.01–0.001). Additionally, systolic blood pressure (SBP) was significantly higher among women with high VAI (p < 0.05), whereas diastolic blood pressure (DBP) did not differ significantly between groups (Table 1).
2.2. Adipokines and Neurotrophins
Circulating leptin and resistin concentrations tended to be higher in the high-VAI group (p > 0.05), whereas adiponectin levels were significantly lower (p = 0.001). Consequently, leptin/adiponectin (L/A) and adiponectin/resistin (A/R) ratios differed markedly between groups, with a shift toward an unfavorable adipokine balance in high-VAI PCOS (p < 0.01–0.001). Women with higher VAI exhibited significantly increased circulating BDNF levels, whereas NGFβ concentrations were significantly higher in the low-VAI group (Table 2).
2.3. Glucose Homeostasis and Insulin Resistance; Lipid Profile and Atherogenic Indices
Fasting plasma glucose (FBG) levels were comparable between groups. However, women with higher VAI demonstrated significantly elevated fasting immunoreactive insulin (FIRI) concentrations and HOMA-IR values, indicating increased insulin resistance (Table 3). Marked differences in lipid metabolism were observed between VAI groups. The high-VAI group exhibited significantly lower HDL-C and higher TG levels. LDL-C and TC concentrations were comparable; however, non-HDL-C, LDL/HDL ratio and AIP were significantly elevated in women with higher VAI (Table 3), indicating a more atherogenic lipid phenotype.
2.4. Hormonal Parameters
No statistically significant differences in gonadotropin or steroid hormone parameters were observed between PCOS patients with low and high VAI. Estradiol, androgen levels, sex hormone binding globulin (SHBG), and the free androgen index (FAI) showed only numerical differences without statistical significance (Table 4).
2.5. Correlation Analyses
Leptin exhibited strong positive correlations with BMI (r = 0.695, p < 0.001), WHR (r = 0.422, p = 0.001), WHtR (r = 0.628, p < 0.001, Figure 1), HOMA-IR (r = 0.408, p = 0.001, Figure 1), triglycerides (r = 0.273, p < 0.05), non-HDL-C (r = 0.274, p < 0.05, Figure 1), and BDNF levels (r = 0.471, p < 0.01, Figure 1), and a negative correlation with adiponectin (r = -0.330, p < 0.01).
Adiponectin showed inverse associations with anthropometric indices – BMI (r = -0.348, p < 0.01), WHR (r = -0.300, p < 0.05) and WHtR (r = -0.361, p < 0.01, Figure 2); with triglycerides (r = -0.411, p < 0.01), AIP (r = -0.421, p = 0.001, Figure 2), and HOMA-IR (r = -0.294, p < 0.05, Figure 3).
BDNF demonstrated positive correlations with TC (r = 0.271, p < 0.05), LDL-C (r = 0.435, p < 0.01), non-HDL-C (r = 0.455, p < 0.01), and L/A ratio (r = 0.376, p < 0.05) (Figure 3), suggesting an association with adiposity-related lipid alterations.
In contrast, NGFβ correlated negatively with non-HDL-C (r = -0.336, p < 0.05) and positively with HDL-C (r = 0.529, p = 0.001), (Figure 4). Importantly, NGFβ also showed a significant positive correlation with serum estradiol levels (r = 0.747, p < 0.001, Figure 4), indicating a potential link between neurotrophin signaling and ovarian steroidogenesis in PCOS.
2.6. Multivariate Regression Analysis
Multiple linear regression analyses assessed independent associations of circulating neurotrophins with metabolic and anthropometric parameters. BDNF and NGFβ were modeled separately as dependent variables, with BMI, WHtR, HOMA-IR, lipid fractions (TG, HDL-C, LDL-C, non-HDL-C), and VAI as predictors.
For BDNF, VAI (β = 0.312, p = 0.004) and non-HDL-C (β = 0.285, p = 0.011) remained significant after adjustment, indicating associations with visceral adiposity and atherogenic lipids independent of overall adiposity. For NGFβ, HDL-C (β = 0.398, p = 0.002) and estradiol (β = 0.547, p < 0.001) were independently associated, while BMI and WHtR had no significant effect, supporting a protective neurotrophin–endocrine profile in lower-risk PCOS phenotypes.
2.7. Correlation Network and Heatmap Visualization
Spearman correlation analyses were performed to evaluate pairwise relationships among key anthropometric, metabolic, adipokine, and neurotrophin markers, including BMI, WHtR, HOMA-IR, lipid fractions (TG, HDL-C, LDL-C, non-HDL-C), BDNF, NGFβ, leptin/adiponectin (L/A) and adiponectin/resistin (A/R) ratios, and estradiol. A heatmap (Figure 5) was generated to visualize the strength and direction of all correlations, highlighting clusters of positive and negative associations. The correlation network illustrates integrated relationships, showing that high VAI and L/A ratios cluster with BDNF and atherogenic lipids, whereas NGFβ clusters with HDL-C and estradiol, suggesting divergent neurotrophin–adipokine patterns according to cardiometabolic risk in PCOS. These visualizations complement the regression analyses, providing a holistic view of interrelated metabolic, hormonal, and neurotrophin alterations.
3. Discussion
In the present study, women with higher VAI exhibited markedly adverse anthropometric and metabolic profiles, including increased BMI, WHR, and WHtR, reflecting pronounced central obesity, together with elevated FIRI and HOMA-IR, indicative of enhanced IR. These findings are consistent with substantial evidence demonstrating that visceral adiposity, rather than generalized obesity, is a principal driver of cardiometabolic risk in PCOS. Previous studies have shown that WHtR and other indices of central fat distribution outperform BMI in predicting IR, dyslipidemia, and cardiovascular risk in women with PCOS [21,22]. Consistent with this, comprehensive reviews on cardiometabolic risk in PCOS emphasize that visceral fat accumulation is a key determinant of dyslipidemia and cardiometabolic risk, largely independent of overall adiposity [23,24].
The lipid abnormalities observed in the high-VAI group—characterized by elevated triglycerides, non-HDL cholesterol, and atherogenic indices alongside reduced HDL-C—reflect a classical atherogenic metabolic phenotype. These results align with the original validation studies of the visceral adiposity index, which established strong associations between elevated VAI, IR, and atherogenic dyslipidemia [8,25]. Subsequent investigations in PCOS populations have confirmed that higher VAI values are closely linked to unfavorable lipid patterns and increased cardiovascular risk markers [26,27], reinforcing the clinical utility of VAI as a surrogate marker of visceral adipose tissue dysfunction in this syndrome.
With regard to adipokines, leptin concentrations tended to be higher, while adiponectin levels were significantly lower in women with elevated VAI, resulting in substantially increased leptin/adiponectin (L/A) and decreased adiponectin/resistin (A/R) ratios. This adipokine imbalance is widely recognized as a hallmark of adipose tissue dysfunction in PCOS. A recent meta-analysis by Lin et al. focusing on nonobese women with PCOS demonstrated that leptin levels are significantly elevated, whereas adiponectin concentrations are consistently reduced compared to nonobese controls, indicating that these alterations occur independently of BMI and are associated with IR and metabolic risk [28]. Moreover, several studies suggest that the L/A ratio is a more sensitive marker of metabolic impairment than individual adipokine levels, particularly in PCOS cohorts [29,30]. The strong positive correlations observed in our study between leptin, anthropometric indices, IR, and atherogenic lipid parameters further support the central role of leptin as a mediator linking excess visceral adiposity to systemic metabolic dysregulation.
Our neurotrophin profiling revealed distinct patterns according to VAI-defined cardiometabolic risk. Circulating BDNF concentrations were higher in women with elevated VAI and showed positive associations with leptin and atherogenic lipid fractions. Although data on BDNF in PCOS are heterogeneous, accumulating evidence indicates that BDNF participates in metabolic regulation beyond its classical neurotrophic functions. Experimental studies have demonstrated that BDNF influences energy homeostasis, lipid metabolism, and adipokine expression in adipose tissue [31,32,33]. In human studies, some reports describe reduced BDNF levels in obese women with PCOS [34,35], whereas others have observed elevated circulating BDNF in conditions characterized by metabolic stress, dyslipidemia, or IR [36,37]. Our findings support the latter perspective and suggest that increased BDNF in high-VAI women may represent a compensatory response to visceral adiposity–related metabolic stress, potentially modulated by dyslipidemia and leptin signaling.
In contrast to BDNF, NGFβ levels were higher in women with low VAI and were favorably associated with HDL-C, non-HDL-C, and estradiol concentrations, suggesting a potentially protective neurotrophic–endocrine profile in lower-risk PCOS phenotypes. NGF is well established as a key regulator of ovarian physiology, follicular development, and steroidogenesis [38]. Experimental models have shown that alterations in ovarian NGF expression affect follicular morphology, ovulation, and steroid hormone production [39,40]. Human data further support a role for NGF in ovarian endocrine regulation, including modulation of estrogen synthesis [41]. The strong positive correlation between NGFβ and estradiol observed in our cohort is therefore consistent with the concept that neurotrophin signaling interfaces with ovarian steroidogenic pathways and may contribute to more favorable endocrine and metabolic profiles in PCOS.
Taken together, our findings demonstrate that VAI-defined cardiometabolic risk in PCOS is accompanied by distinct and opposing neurotrophin and adipokine signatures. Elevated BDNF and L/A ratios in high-VAI individuals reflect adiposity-related metabolic stress and dyslipidemia, whereas higher NGFβ levels in low-VAI women may indicate protective neurotrophic and endocrine modulation. The correlation heatmap and network further highlight these interconnections, showing that BDNF clusters with VAI and atherogenic lipid fractions, consistent with previous reports linking circulating BDNF to obesity-related dyslipidemia in individuals with insulin resistance [42,43]. Conversely, NGFβ clustered with estradiol and favorable lipid parameters, supporting a potential protective role in ovarian endocrine regulation and metabolic homeostasis. This observation is consistent with human and translational evidence demonstrating that NGF signaling interfaces with ovarian steroidogenesis and follicular function, including estrogen synthesis, and is implicated in the pathophysiology of PCOS [39,41]. Importantly, the L/A ratio emerged as a central integrative marker connecting IR, dyslipidemia, and visceral adiposity, in line with prior evidence that adipokine ratios better reflect adipose tissue dysfunction than individual adipokine levels [44,45]. Overall, these observations underscore the complex interplay between visceral adiposity, adipokine imbalance, neurotrophin signaling, and cardiometabolic risk in PCOS, supporting the concept of a compensatory neurotrophin–adipokine network as an adaptive or maladaptive response to metabolic and endocrine dysregulation.
Several limitations should be acknowledged. The cross-sectional design precludes causal inferences between VAI, adipokines, neurotrophins, and metabolic parameters, and longitudinal studies are needed to clarify temporal relationships. Circulating BDNF and NGFβ may not fully reflect tissue-specific expression or local signaling in adipose tissue, ovary, or the central nervous system. Although VAI is a validated surrogate of visceral adiposity, direct imaging (e.g., MRI or CT) was not performed. Potential confounders such as diet, physical activity, psychological stress, and genetic variability were not comprehensively assessed. Finally, the cohort size and its clinical characteristics may limit generalizability to broader PCOS populations. Nevertheless, this integrated evaluation of neurotrophins and adipokines in relation to VAI provides novel insights into cardiometabolic risk signatures in PCOS.
4. Materials and Methods
4.1. Study Design and Participants
This cross-sectional study included 100 women diagnosed with polycystic ovary syndrome (PCOS) according to the Rotterdam criteria 2003 [46]. Participants were recruited from the Clinic of Endocrinology and Metabolic Diseases, “St. George” University Hospital of Plovdiv, Bulgaria between June 2020 and June 2023. Women were stratified into lower-risk (low-VAI, n = 50) and higher-risk (high-VAI, n = 50) groups based on the Visceral Adiposity Index (VAI). VAI was calculated according to the formula proposed by Amato et al. Participants were stratified into low- and high-VAI groups using established cut-off values indicative of visceral adipose tissue dysfunction and increased cardiometabolic risk, as previously described in a Caucasian population. A VAI cut-off value of 1.9 was applied for women, corresponding to increased cardiometabolic risk [47].
Women aged 18–35 years with a confirmed diagnosis of PCOS who had not received hormonal or metabolic treatments in the preceding six months were eligible for inclusion. Participants were excluded if they were pregnant or lactating, had type 2 diabetes mellitus, cardiovascular disease, chronic inflammatory or autoimmune disorders, thyroid or adrenal pathology, or were using insulin-sensitizing or lipid-lowering agents (e.g., metformin, statins) or hormonal contraceptives, or if they were active smokers.
All participants provided written informed consent. The study protocol was approved by the Medical University of Plovdiv Institutional Ethics Committee (protocol code 2444/26 October 2020), in accordance with the Declaration of Helsinki.
4.2. Anthropometric and Clinical Assessment
Body weight and height were measured using standard calibrated scales and stadiometers. BMI was calculated as weight (kg) divided by height squared (m2). Waist and hip circumferences were measured with a flexible tape at the midpoint between the lowest rib and iliac crest (waist) and at the widest part of the hips, respectively. WHR and WHtR were calculated accordingly. Blood pressure was measured in the seated position after a 5-minute rest using an automated sphygmomanometer.
4.3. Biochemical and Hormonal Measurements
Venous blood samples for laboratory analyses were collected under standardized conditions in the early morning, following an overnight fast of 12 hours, during the follicular phase of the menstrual cycle (2nd to 5th day after a spontaneously occurring cycle). Samples for the determination of fasting blood glucose (FBG) and fasting insulin (FIRI), lipid profile, standard hormonal parameters, neurotrophins, and adipokines were processed at the Central Clinic Laboratory, St. George University Hospital, Plovdiv, Bulgaria. Serum was separated by centrifugation at 3000 rpm for 10 minutes and stored at −80 °C until analysis.
4.3.1. Glucose Metabolism:
Fasting serum glucose levels were determined using a standard glucose oxidase-peroxidase (GOD-POD) method. Serum insulin concentrations were measured using a chemiluminescent immunoassay (CLIA) kit (Beckman Coulter, Inc., Chaska, MN, USA; manufactured in Ireland). The assay demonstrated high analytical performance, with a dilution recovery of 96–104%, sensitivity of 0.03 μIU/mL, intra-assay coefficient of variation (CV) of 2.0–4.2%, and inter-assay CV of 3.1–5.6%. No cross-reactivity was observed with bilirubin (10 mg/dL), triglycerides (20.32 mmol/L), or C-peptide (20,000 pmol/L), and the reference range was 1.9–23.0 μIU/mL.
Insulin resistance was assessed using the homeostasis model assessment of insulin resistance (HOMA-IR) was calculated as (fasting immunoreactive insulin [µU/mL] × fasting blood glucose [mmol/L])/22.5.
4.3.2. Lipid Profile:
Serum lipid concentrations were determined enzymatically. Total cholesterol (TC) was measured using the ChOD-PAP method, triglycerides (TG) using the GPO-PAP method, and HDL cholesterol (HDL-C) following MgSO4-dextran sulfate precipitation. All analyses were performed using reagents from Schneiders Medizintechnik (Zwolle, Netherlands) on a Delta Kone autoanalyser (Kone Instruments, Espoo, Finland). Low-density lipoprotein cholesterol (LDL-C) was calculated according to the Friedewald formula, non-HDL cholesterol was defined as TC minus HDL-C, and the Atherogenic Index of Plasma (AIP) was calculated as log(TG/HDL-C).
4.3.3. Neurotrophins and Adipokines:
Serum adipokine and neutrophin concentrations were measured using commercially available ELISA kits according to the manufacturers’ instructions.
Leptin levels were determined using a solid-phase human ELISA kit (DRG Instruments GmbH, Marburg, Germany) with a sensitivity of 0.2 ng/mL, intra-assay CV < 8.7%, and inter-assay CV < 5.4%. Adiponectin concentrations were quantified using a human ELISA kit (BioVendor – Laboratorní medicína a.s., Heidelberg, Germany) with a sensitivity of 26 ng/mL, intra-assay CV < 5.9%, and inter-assay CV < 7.0%. Resistin levels were measured using a competitive solid-phase human EIA kit (Phoenix Pharmaceuticals, Inc., Burlingame, CA, USA), with a sensitivity of 1.16 ng/mL, intra-assay CV < 14.0%, and inter-assay CV < 5.0%.
Brain-derived neurotrophic factor (BDNF) concentrations were measured using a human BDNF ELISA kit (R&D Systems, Minneapolis, MN, USA), with a sensitivity of 0.01 ng/mL, intra-assay CV < 6.5%, and inter-assay CV < 7.2%. Nerve growth factor beta (NGFβ) levels were determined using a human NGFβ ELISA kit (Abcam, Cambridge, UK) with a sensitivity of 1 pg/mL, intra-assay CV < 6%, and inter-assay CV < 6.5%. All serum samples were stored at −80 °C until analysis.
Adipokine ratios (L/A, A/R) were calculated for each participant.
4.3.4. Hormonal Parameters:
Serum luteinizing hormone (LH) and follicle-stimulating hormone (FSH) concentrations were measured using automated chemiluminescent immunoassays (CLIA) (Beckman Coulter, Inc., Ireland) based on a sandwich immunochemical principle. The LH assay had a sensitivity of 0.2 IU/L, dilution recovery of 96.9–102.8%, intra-assay CVs of 3.6–3.8%, and inter-assay CVs of 4.3–6.4%, with no detectable cross-reactivity. The reference range for LH in the follicular phase was 2.12–10.89 IU/L. The FSH assay demonstrated a sensitivity of 0.2 mIU/mL, dilution recovery of 96.6–104.3%, intra-assay CVs of 3.1–4.3%, and inter-assay CVs of 4.3–5.6%, with a follicular-phase reference range of 3.85–8.78 mIU/mL. Serum estradiol (E2) concentrations were measured using a chemiluminescent immunoassay (CLIA) kit (Beckman Coulter, Inc., Ireland) based on a competitive immunochemical principle. The assay demonstrated dilution recovery ranging from 97% to 118% and an analytical sensitivity of 73 pmol/L. Intra-assay coefficients of variation (CVs) ranged from 3.1% to 19.7%, while inter-assay CVs ranged from 5.0% to 20.0%. The method showed high analytical specificity, with no detectable cross-reactivity with bilirubin, triglycerides, hemoglobin, estriol, aldosterone, or testosterone. The reference range for estradiol during the follicular phase of the menstrual cycle was 99–448 pmol/L. The LH/FSH ratio was calculated for all participants.
Serum androgen and sex hormone–binding globulin (SHBG) concentrations were measured using automated chemiluminescent immunoassays (CLIA) according to the manufacturers’ instructions. Total testosterone (TT) levels were determined using a CLIA kit (Beckman Coulter, Inc., Brea, CA, USA) with an analytical sensitivity of 0.35 ng/mL, dilution recovery of 96–115%, intra-assay CVs of 1.7–3.9%, and inter-assay CVs of 4.2–7.1%. The assay demonstrated high specificity, with no significant cross-reactivity, and a reference interval for women of 0.1–0.75 ng/mL.
Serum androstenedione (A4) concentrations were assessed using a CLIA kit (catalog no. L2KAO2; Siemens Healthcare Diagnostics, Tarrytown, NY, USA), with a sensitivity of 1.0 nmol/L, intra-assay CVs of 6.2–15.1%, and total imprecision of 8.5–17.8%; the reference range for women in the follicular phase was 0.75–3.1 ng/mL. Dehydroepiandrosterone sulfate (DHEA-S) levels were quantified using a CLIA kit (Beckman Coulter, Inc.), with a sensitivity < 2 μg/dL, dilution recovery of 94.8–116.2%, intra-assay CVs of 1.6–8.3%, and inter-assay CVs of 4.4–11.3%; age-specific reference ranges were applied.
SHBG concentrations were measured on the Access 2 Immunoassay System (Beckman Coulter, Inc.) with an analytical sensitivity of 0.33 nmol/L and a reportable range up to 180 nmol/L; intra- and inter-assay CVs were generally <10%. The free androgen index (FAI) was calculated using the formula: TT (nmol/L) × 100/SHBG (nmol/L).
4.4. Statistical Analysis
Statistical analyses were performed using SPSS software (version 21.0; IBM Corp., Armonk, NY, USA). Data distribution was assessed using the Kolmogorov–Smirnov test. Variables with non-normal distribution, including LH concentrations and the LH/FSH ratio, were log10-transformed prior to analysis. Normally distributed data are presented as mean ± standard deviation (SD), whereas non-normally distributed variables are expressed as median (interquartile range). Comparisons between groups were conducted using Student’s t-test or the Mann–Whitney U test, as appropriate. All statistical tests were two-tailed, and a p-value < 0.05 was considered statistically significant.
In addition to univariate comparisons, multivariate linear regression analyses were performed to assess the independent associations of circulating neurotrophins with anthropometric and metabolic parameters. BDNF and NGFβ were modeled separately as dependent variables. Independent predictors included BMI, WHtR, VAI, HOMA-IR, lipid fractions (TG, HDL-C, LDL-C, non-HDL-C), and estradiol. Multicollinearity was assessed using variance inflation factors (VIF), and only models with VIF < 5 were accepted. Standardized β-coefficients and corresponding p-values are reported.
Correlation analyses were conducted to explore associations between anthropometric indices, metabolic parameters, adipokines, and neurotrophins. Spearman’s rank correlation coefficients were used for correlation network and heatmap visualization to account for non-normal distributions and to capture monotonic relationships among variables. Pearson correlation coefficients were used for selected pairwise associations displayed as scatter plots.
To provide an integrative overview of interrelationships among variables, correlation heatmap and network analyses were generated based on Spearman correlation matrices. The heatmap visualizes the strength and direction of pairwise correlations among key markers, including BMI, WHtR, VAI, HOMA-IR, lipid fractions, adipokine ratios (L/A and A/R), BDNF, NGFβ, and estradiol. The correlation network highlights clusters of closely related variables and opposing patterns according to cardiometabolic risk profiles.
5. Conclusions
Our study demonstrates that visceral adiposity–driven cardiometabolic risk in women with PCOS is associated with distinct neurotrophin and adipokine signatures. High VAI is linked to elevated BDNF levels and unfavorable leptin/adiponectin and adiponectin/resistin ratios, reflecting adiposity-related metabolic stress and insulin resistance. Conversely, higher NGFβ concentrations in low-VAI women may indicate protective neurotrophic and endocrine modulation, including favorable lipid handling and estradiol regulation. These findings highlight a dual neurotrophin–adipokine axis as a potential integrative mediator of metabolic and endocrine alterations in PCOS. Future longitudinal and mechanistic studies are warranted to explore whether modulation of neurotrophin and adipokine profiles could serve as therapeutic targets to mitigate cardiometabolic and reproductive risks in this population.
6. Patents
The authors declare that no patents have resulted from this study.
Author Contributions
Conceptualization: D.K.-T, M.I.-G and E.B.; methodology: D.K.-T and E.B.; software: D.K.-T; validation: D.K.-T, M.I.-G, and M.O.; formal analysis: T.D.; investigation: T.D.; resources: M.O.; data curation: M.I.-I.; writing—original draft preparation: D.K.-T and E.B.; writing—review and editing: M.O.; visualization: T.D.; supervision: M.O.; project administration: D.K.-T. All authors have read and agreed to the published version of the manuscript.
Funding
This research received no external funding.
Institutional Review Board Statement
The study was conducted in accordance with the Declaration of Helsinki and approved by the Ethics Committee of the Medical University of Plovdiv (protocol code 2444/26 October 2020).
Informed Consent Statement
Informed consent was obtained from all subjects involved in the study.
Data Availability Statement
The data that support the findings of this study are available from the corresponding author upon reasonable request. Due to ethical restrictions and participant confidentiality, the dataset is not publicly available.
Acknowledgments
The authors would like to thank the laboratory staff and clinical personnel at “Sт. George” University Hospital of Plovdiv, Bulgaria, for their assistance with sample collection and processing.
Conflicts of Interest
The authors declare no conflicts of interest.
Abbreviations
The following abbreviations are used in this manuscript:
| PCOS | Polycystic Ovary Syndrome |
| IR | Insulin Resistance |
| BMI | Body Mass Index |
| HOMA-IR | Homeostatic Model Assessment for Insulin Resistance |
| WHtR | Waist-to-Height Ratio |
| AIP | Atherogenic Index of Plasma |
| HDL-C | High-Density Lipoprotein Cholesterol |
| LDL-C | Low-Density Lipoprotein Cholesterol |
| TG | Triglycerides |
| L/A | Leptin-to-Adiponectin Ratio |
| A/R | Adiponectin-to-Resistin Ratio |
| VAI | Visceral Adiposity Index |
| BDNF | Brain-derived Neurotrophic Factor |
| NGFβ | Nerve Growth Factor-β |
| ELISA | Enzyme-Linked Immunosorbent Assay |
| LH FSH E2 |
Luteinizing hormone Follicle-Stimulating Hormone Estradiol |
| TT | Total Testosterone |
| SHBG | Sex Hormone Binding Globulin |
| DHEA-S FAI |
Dehydroepiandrosterone Sulfate Free Androgen Index |
References
- Bozdag, G.; Mumusoglu, S.; Zengin, D.; Karabulut, E.; Yildiz, B.O. The prevalence and phenotypic features of polycystic ovary syndrome: A systematic review and meta-analysis. Hum. Reprod. 2016, 31(12), 2841–2855. [Google Scholar] [CrossRef] [PubMed]
- Azziz, R.; Woods, K.S.; Reyna, R.; Key, T.J.; Knochenhauer, E.S.; Yildiz, B.O. The prevalence and features of the polycystic ovary syndrome in an unselected population. J. Clin. Endocrinol. Metab. 2004, 89(6), 2745–2749. [Google Scholar] [CrossRef] [PubMed]
- Dunaif, A. Insulin resistance and the polycystic ovary syndrome: Mechanism and implications for pathogenesis. Endocr. Rev. 1997, 18(6), 774–800. [Google Scholar] [CrossRef] [PubMed]
- Moran, L.J.; Misso, M.L.; Wild, R.A.; Norman, R.J. Impaired glucose tolerance, type 2 diabetes and metabolic syndrome in polycystic ovary syndrome: A systematic review and meta-analysis. Hum. Reprod. Update 2010, 16(4), 347–363. [Google Scholar] [CrossRef]
- Randeva, H.S.; Tan, B.K.; Weickert, M.O.; Lois, K.; Nestler, J.E.; Sattar, N.; Lehnert, H. Cardiometabolic aspects of the polycystic ovary syndrome. Endocr. Rev. 2012, 33(5), 812–841. [Google Scholar] [CrossRef]
- Wajchenberg, B.L. Subcutaneous and visceral adipose tissue: Their relation to the metabolic syndrome. Endocr. Rev. 2000, 21(6), 697–738. [Google Scholar] [CrossRef]
- Després, J.P. Body fat distribution and risk of cardiovascular disease: An update. Circulation 2012, 126(10), 1301–1313. [Google Scholar] [CrossRef]
- Amato, M.C.; Giordano, C.; Galia, M.; Criscimanna, A.; Vitabile, S.; Midiri, M.; Galluzzo, A.; AlkaMeSy Study Group. Visceral Adiposity Index: A reliable indicator of visceral fat function associated with cardiometabolic risk. Diabetes Care 2010, 33(4), 920–922. [Google Scholar] [CrossRef]
- Oh, J.Y.; Sung, Y.A.; Lee, H.J. The visceral adiposity index as a predictor of insulin resistance in young women with polycystic ovary syndrome. Obesity (Silver Spring) 2013, 21(8), 1690–1694. [Google Scholar] [CrossRef]
- Nakagawa, T.; Tsuchida, A.; Itakura, Y.; Nonomura, T.; Ono, M.; Hirota, F.; Inoue, T.; Nakayama, C.; Taiji, M.; Noguchi, H. Brain-derived neurotrophic factor regulates glucose metabolism by modulating energy balance in diabetic mice. Diabetes 2000, 49(3), 436–444. [Google Scholar] [CrossRef]
- Fargali, S.; Sadahiro, M.; Jiang, C.; Frick, A.L.; Indall, T.; Cogliani, V.; Welagen, J.; Lin, W.-J.; Salton, S.R. Role of neurotrophins in the development and function of neural circuits that regulate energy homeostasis. J. Mol. Neurosci. 2012, 48(3), 654–659. [Google Scholar] [CrossRef] [PubMed]
- Aloe, L.; Vinciguerra, M.; Tonchev, A.B.; Fiore, M.; Deleva, N.; Frohlich, J.; Chaldakov, G.N. A growing journey from neurotrophins to metabotrophins in cardiometabolic diseases. Adipobiology 2021, 11, 5–10. [Google Scholar] [CrossRef]
- Krabbe, K.S.; Nielsen, A.R.; Krogh-Madsen, R.; Plomgaard, P.; Rasmussen, P.; Erikstrup, C.; Fischer, C.P.; Lindegaard, B.; Petersen, A.M.W.; Taudorf, S.; et al. Brain-derived neurotrophic factor (BDNF) and type 2 diabetes. Diabetologia 2007, 50(2), 431–438. [Google Scholar] [CrossRef]
- Robeva, R.; Elenkova, A.; Kirilov, G.; Zacharieva, S. Plasma-free metanephrines, nerve growth factor, and renalase significance in patients with PCOS. Endocrine 2023, 81(3), 602–612. [Google Scholar] [CrossRef]
- Alfatlawy, N.K.; AL–Taee, H.A.; Rahim, A.I. A Comparative Study of Nerve Growth Factor Level in the Follicular Fluid of Polycystic and Non-Polycystic Ovary Syndrome Women Undergoing ICSI: A Cross-sectional Study. Indian J Forensic Med Toxicol 2020, 14, 2794–2799. [Google Scholar] [CrossRef]
- Streiter, S.; Fisch, B.; Sabbah, B.; Ao, A.; Abir, R. The importance of neuronal growth factors in the ovary. Mol. Hum. Reprod. 2016, 22(1), 3–17. [Google Scholar] [CrossRef]
- Wilson, J.L.; Chen, W.; Dissen, G.A.; Ojeda, S.R.; Cowley, M.A.; Garcia-Rudaz, C.; Enriori, P.J. Excess of nerve growth factor in the ovary causes a polycystic ovary-like syndrome in mice, which closely resembles both reproductive and metabolic aspects of the human syndrome. Endocrinology 2014, 155(11), 4494–4506. [Google Scholar] [CrossRef]
- Orszulak, D.; Niziński, K.; Matonóg, A.; Zięba-Domalik, M.; Stojko, R.; Drosdzol-Cop, A. Adipokines as biochemical marker of polycystic ovary syndrome in adolescents – review. Front. Endocrinol. 2025, 16, 1475465. [Google Scholar] [CrossRef]
- Frühbeck, G.; Catalán, V.; Rodríguez, A.; Gómez-Ambrosi, J. Adiponectin-leptin ratio: A promising index to estimate adipose tissue dysfunction. Relation with obesity-associated cardiometabolic risk. Adipocyte 2018, 7(1), 57–62. [Google Scholar] [CrossRef]
- Senghor, K.A.; Meera, S.; Vinodhni, V.M.; Anuradha, M. Adiponectin-resistin ratio: Beneficial index of insulin sensitivity in women with PCOS. J. Pharm. Negative Results 2022, 13(S1), 239. [Google Scholar] [CrossRef]
- Cooney, L.G.; Dokras, A. Cardiometabolic risk in polycystic ovary syndrome: Current guidelines. Endocrinol. Metab. Clin. North Am. 2021, 50(1), 83–95. [Google Scholar] [CrossRef] [PubMed]
- Ashwell, M.; Gibson, S. Waist-to-height ratio as an indicator of “early health risk”: Simpler and more predictive than using a “matrix” based on BMI and waist circumference. BMJ Open 2016, 6(3), e010159. [Google Scholar] [CrossRef] [PubMed]
- Pililis, S.; Lampsas, S.; Kountouri, A.; Pliouta, L.; Korakas, E.; Livadas, S.; Thymis, J.; Peppa, M.; Kalantaridou, S.; Oikonomou, E.; et al. The cardiometabolic risk in women with polycystic ovarian syndrome (PCOS): From pathophysiology to diagnosis and treatment. Medicina 2024, 60(10), 1656. [Google Scholar] [CrossRef]
- Després, J.-P. Visceral Obesity with Excess Ectopic Fat: A Prevalent and High-Risk Condition Requiring Concerted Clinical and Public Health Actions. Cardiometab Syndr J. Published online. 2021, 1(1), 1–17. [Google Scholar] [CrossRef]
- Jiang, K.; Luan, H.; Pu, X.; Wang, M.; Yin, J.; Gong, R. Association Between Visceral Adiposity Index and Insulin Resistance: A Cross-Sectional Study Based on US Adults. Front. Endocrinol. (Lausanne) 2022, 13, 921067. [Google Scholar] [CrossRef]
- Agrawal, H.; Aggarwal, K.; Jain, A. Visceral Adiposity Index: Simple tool for assessing cardiometabolic risk in women with polycystic ovary syndrome. Indian J. Endocrinol. Metab. 2019, 23(2), 232–237. [Google Scholar] [CrossRef]
- Akkus, C.; Oner, O.; Kilic, A.O.; Duran, C. Visceral Adiposity Index (VAI) Levels and Metabolic Risk Across Phenotypes of Polycystic Ovary Syndrome (PCOS). Medicina (Kaunas) 2025, 61(9), 1673. [Google Scholar] [CrossRef]
- Lin, K.; Sun, X.; Wang, X.; Wang, H.; Chen, X. Circulating adipokine levels in nonobese women with polycystic ovary syndrome and in nonobese control women: A systematic review and meta-analysis. Front. Endocrinol. 2021, 11, 537809. [Google Scholar] [CrossRef]
- Gupta, V.; Mishra, S.; Mishra, S.; Gupta, V. L:A ratio, insulin resistance and metabolic risk in women with polycystic ovarian syndrome. Diabetes Metab. Syndr. Clin. Res. Rev. 2017, 11 (Suppl. 2), S697–S701. [Google Scholar] [CrossRef]
- Mohana, C.A.; Hasanat, M.A.; Rashid, E.U.; Jahan, I.A.; Morshed, M.S.; Banu, H.; Jahan, S. Leptin and leptin/adiponectin ratio may be promising markers for polycystic ovary syndrome and cardiovascular risks. Bangladesh Med. Res. Counc. Bull. 2021, 47, 266–272. [Google Scholar] [CrossRef]
- Chaldakov, G.N.; Fiore, M.; Hristova, M.G.; Aloe, L. Metabotrophic potential of neurotrophins: Implication in obesity and related diseases? Med. Sci. Monit. 2003, 9, HY19–HY21. [Google Scholar]
- Rios, M. BDNF and the central control of feeding: Accidental bystander or essential player? Trends Neurosci. 2013, 36, 83–90. [Google Scholar] [CrossRef]
- Ichimura-Shimizu, M.; Kurr, K. Emerging Insights into the Role of BDNF on Health and Disease in Periphery. Biomolecules 2024, 14(4), 444. [Google Scholar] [CrossRef] [PubMed]
- Kowalska, I.; Karczewska-Kupczewska, M.; Adamska, A.; Nikolajuk, A.; Lebkowska, A.; Otziomek, E.; Wolczynski, S.; Straczkowski, M. Plasma brain-derived neurotrophic factor is decreased in women with polycystic ovary syndrome and related to the markers of endothelial dysfunction. Endocr. Abstracts 2015, 37, GP06.08. [Google Scholar] [CrossRef]
- Sandrini, L.; Di Minno, A.; Amadio, P.; Ieraci, A.; Tremoli, E.; Barbieri, S.S. Association between obesity and circulating brain-derived neurotrophic factor (BDNF) levels: Systematic review of literature and meta-analysis. Int. J. Mol. Sci. 2018, 19, 2281. [Google Scholar] [CrossRef]
- Karczewska-Kupczewska, M.; Kowalska, I.; Nikolajuk, A.; Adamska, A.; Zielińska, M.; Kamińska, N.; Otziomek, E.; Górska, M.; Straczkowski, M. Circulating brain-derived neurotrophic factor concentration is downregulated by intralipid/heparin infusion or high-fat meal in young healthy male subjects. Diabetes Care 2012, 35, 358–362. [Google Scholar] [CrossRef]
- Huang, X.; Xie, Z.; Wang, C.; Wang, S. Elevated peripheral brain-derived neurotrophic factor level associated with decreasing insulin secretion may forecast memory dysfunction in patients with long-term type 2 diabetes. Front. Physiol. 2022, 12, 686838. [Google Scholar] [CrossRef]
- Dissen, G.A.; Mayerhofer, A.; Ojeda, S.R. Participation of nerve growth factor in the regulation of ovarian function. Zygote 1996, 4(4), 309–312. [Google Scholar] [CrossRef]
- Dissen, G.A.; Garcia-Rudaz, C.; Paredes, A.; Mayer, C.; Mayerhofer, A.; Ojeda, S.R. Excessive ovarian production of nerve growth factor facilitates development of cystic ovarian morphology in mice and is a feature of polycystic ovarian syndrome in humans. Endocrinology 2009, 150(6), 2906–2914. [Google Scholar] [CrossRef]
- Dissen, G.A.; Garcia-Rudaz, C.; Ojeda, S.R. Role of neurotrophic factors in early ovarian development. Semin. Reprod. Med. 2009, 27(1), 24–31. [Google Scholar] [CrossRef]
- Chang, H.-M.; Wu, H.-C.; Sun, Z.-G.; Lian, F.; Leung, P.C.K. Neurotrophins and glial cell line-derived neurotrophic factor in the ovary: Physiological and pathophysiological implications. Hum. Reprod. Update 2019, 25(2), 224–242. [Google Scholar] [CrossRef]
- Suwa, M.; Kishimoto, H.; Nofuji, Y.; Nakano, H.; Sasaki, H.; Radak, Z.; Kumagai, S. Serum brain-derived neurotrophic factor level is increased and associated with obesity in newly diagnosed female patients with type 2 diabetes mellitus. Metabolism 2006, 55(7), 852–857. [Google Scholar] [CrossRef] [PubMed]
- Boyuk, B.; Degirmencioglu, S.; Atalay, H.; Guzel, S.; Acar, A.; Celebi, A.; Ekizoglu, I.; Simsek, C. Relationship between levels of brain-derived neurotrophic factor and metabolic parameters in patients with type 2 diabetes mellitus. J. Diabetes Res. 2014, 2014, 978143. [Google Scholar] [CrossRef]
- Diamanti-Kandarakis, E.; Papavassiliou, A.G.; Kandarakis, S.A.; Chrousos, G.P. Pathophysiology and types of dyslipidemia in PCOS. Trends Endocrinol. Metab. 2007, 18(7), 280–285. [Google Scholar] [CrossRef]
- Kieć-Klimczak, M.; Malczewska-Malec, M.; Huszno, B. Leptin to adiponectin ratio, as an index of insulin resistance and atherosclerosis development. Przegl. Lek. (In Polish). 2008, 65(12), 844–849. [Google Scholar] [PubMed]
- Lizneva, D.; Suturina, L.; Walker, W.; Brak, S.; Gavrilova-Jordan, L.; Azziz, R. Criteria, prevalence, and phenotypes of polycystic ovary syndrome. Fertil. Steril. 2016, 106, 6–15. [Google Scholar] [CrossRef] [PubMed]
- Amato, M.C.; Giordano, C.; Pitrone, M.; Galluzzo, A. Cut-off points of the visceral adiposity index (VAI) identifying a visceral adipose dysfunction associated with cardiometabolic risk in a Caucasian Sicilian population. Lipids Health Dis. 2011, 10, 183. [Google Scholar] [CrossRef]
Figure 1.
Associations of Leptin with WHtR, HOMA-IR, non-HDL Cholesterol, and BDNF in the Whole Study Group.
Figure 1.
Associations of Leptin with WHtR, HOMA-IR, non-HDL Cholesterol, and BDNF in the Whole Study Group.
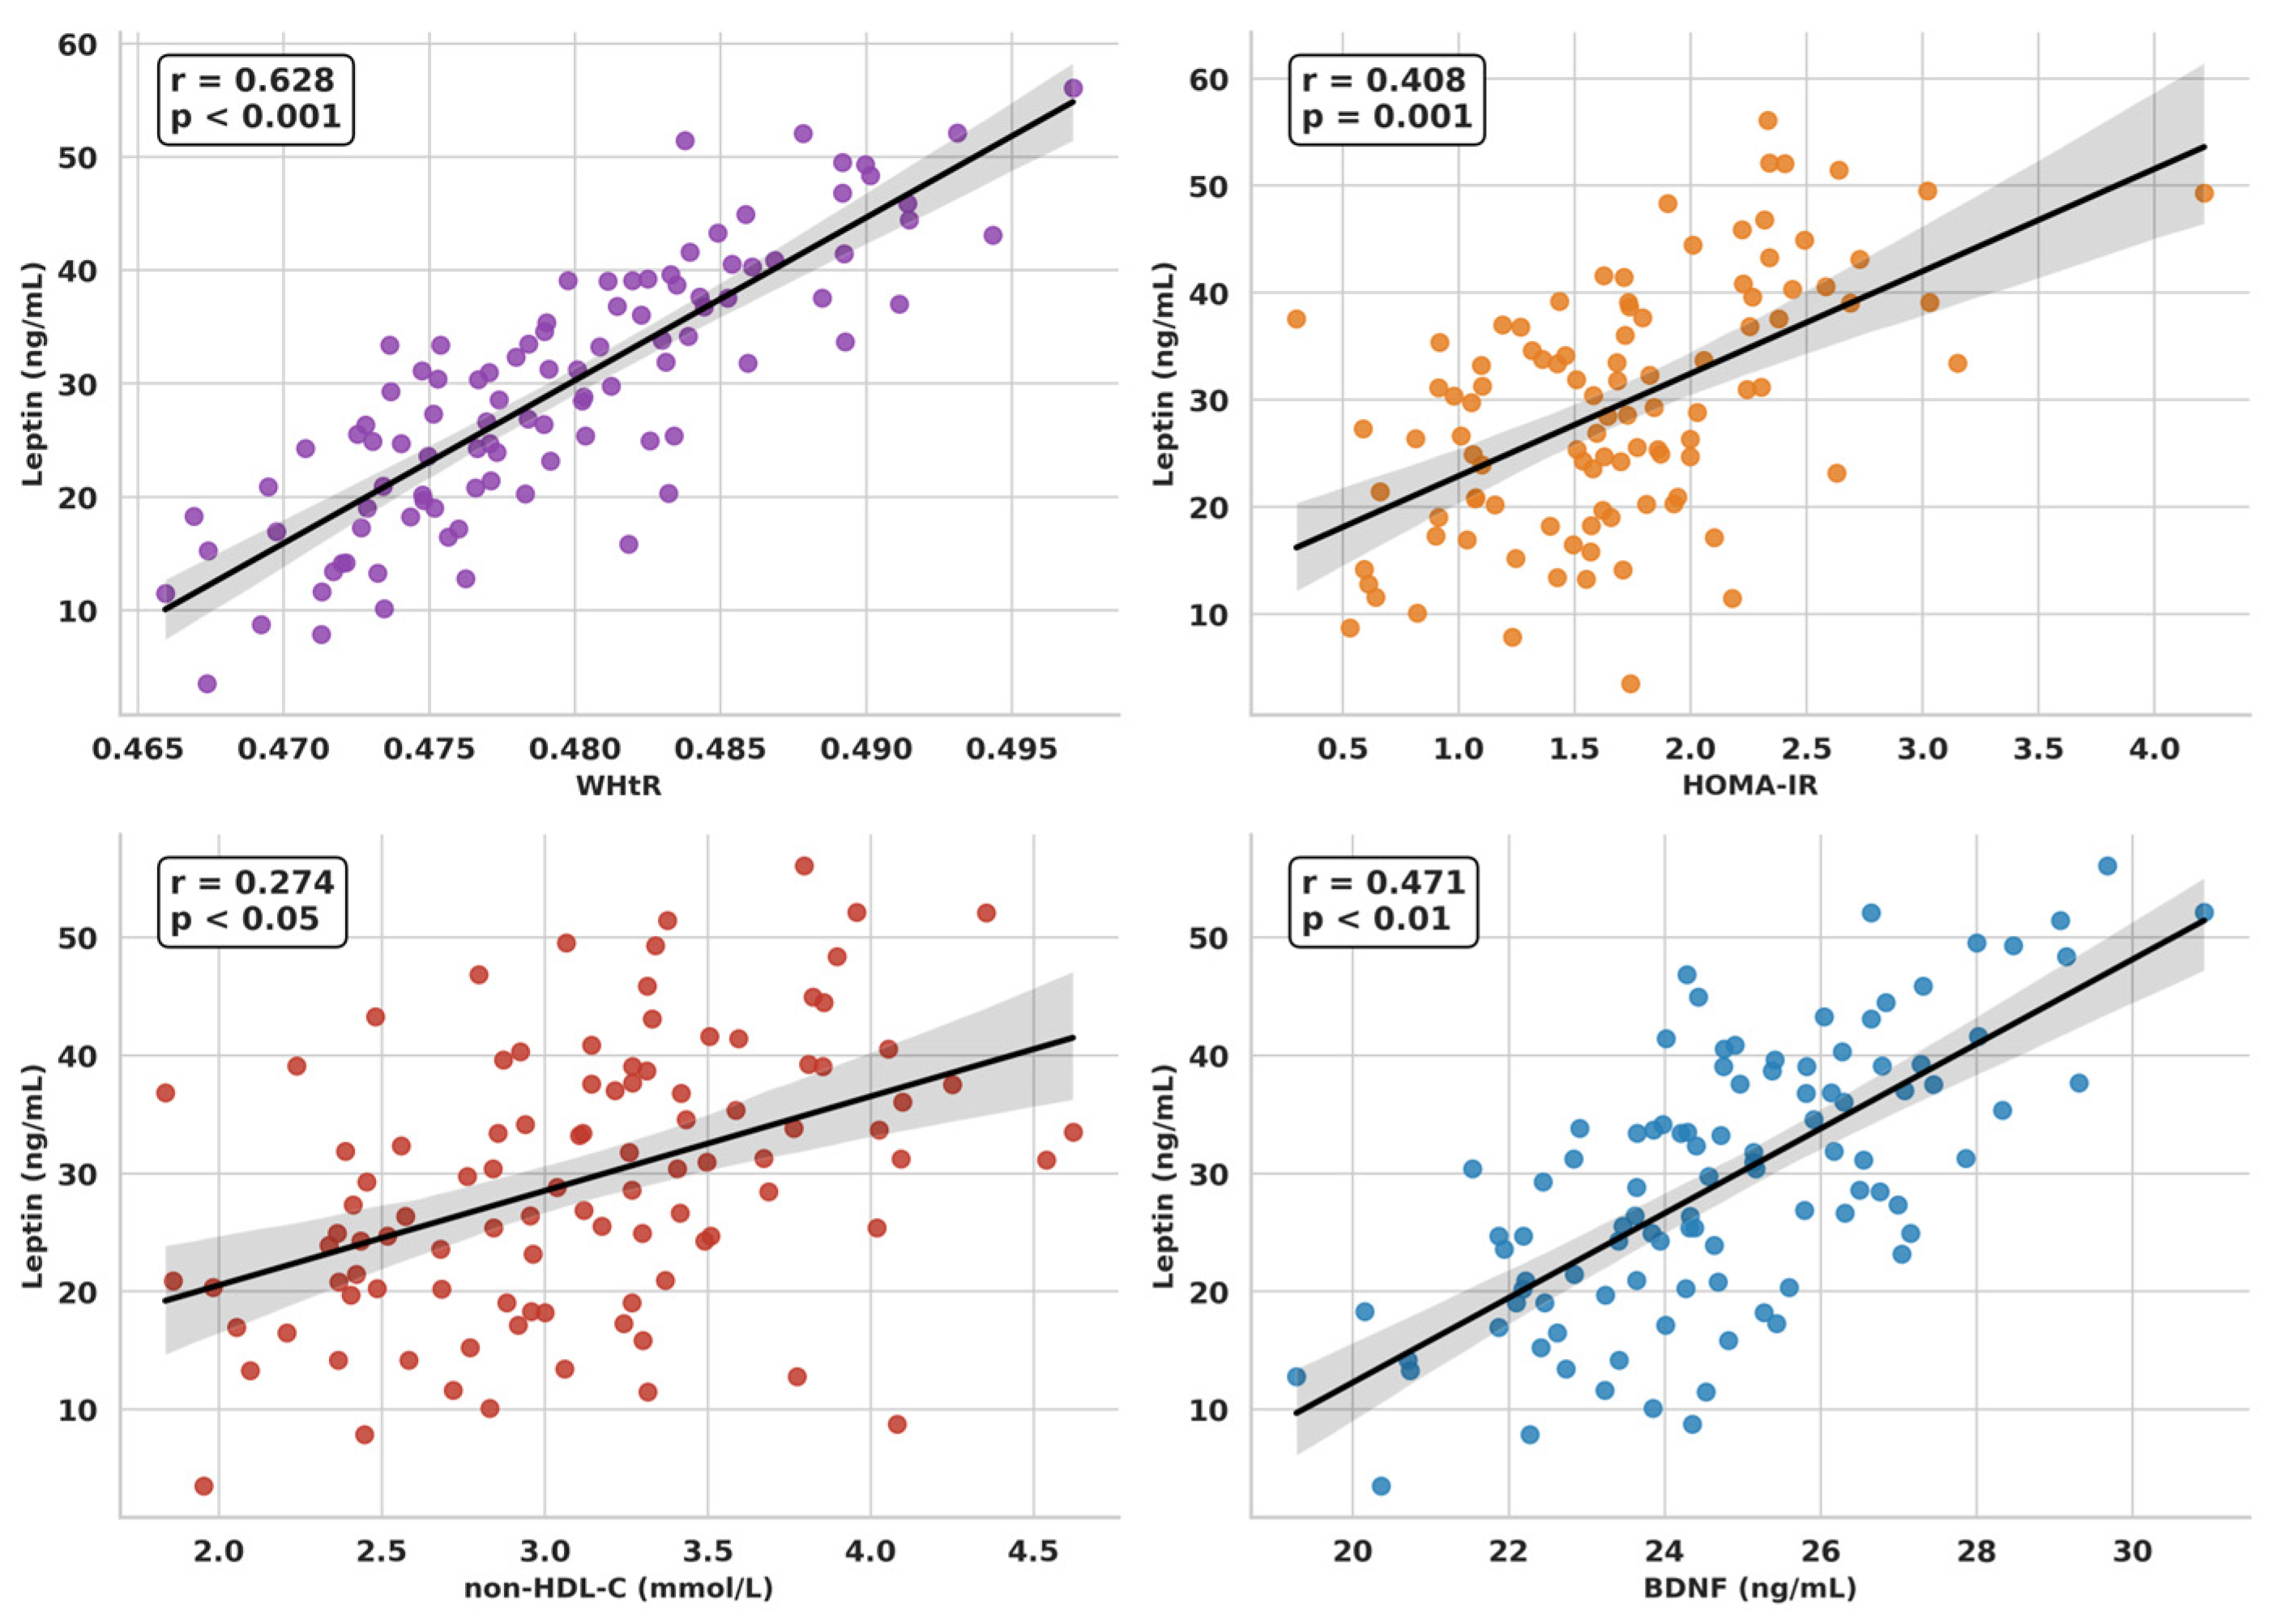
Figure 2.
Associations of Adiponectin with WHtR, AIP and HOMA-IR in the Whole Study Group.
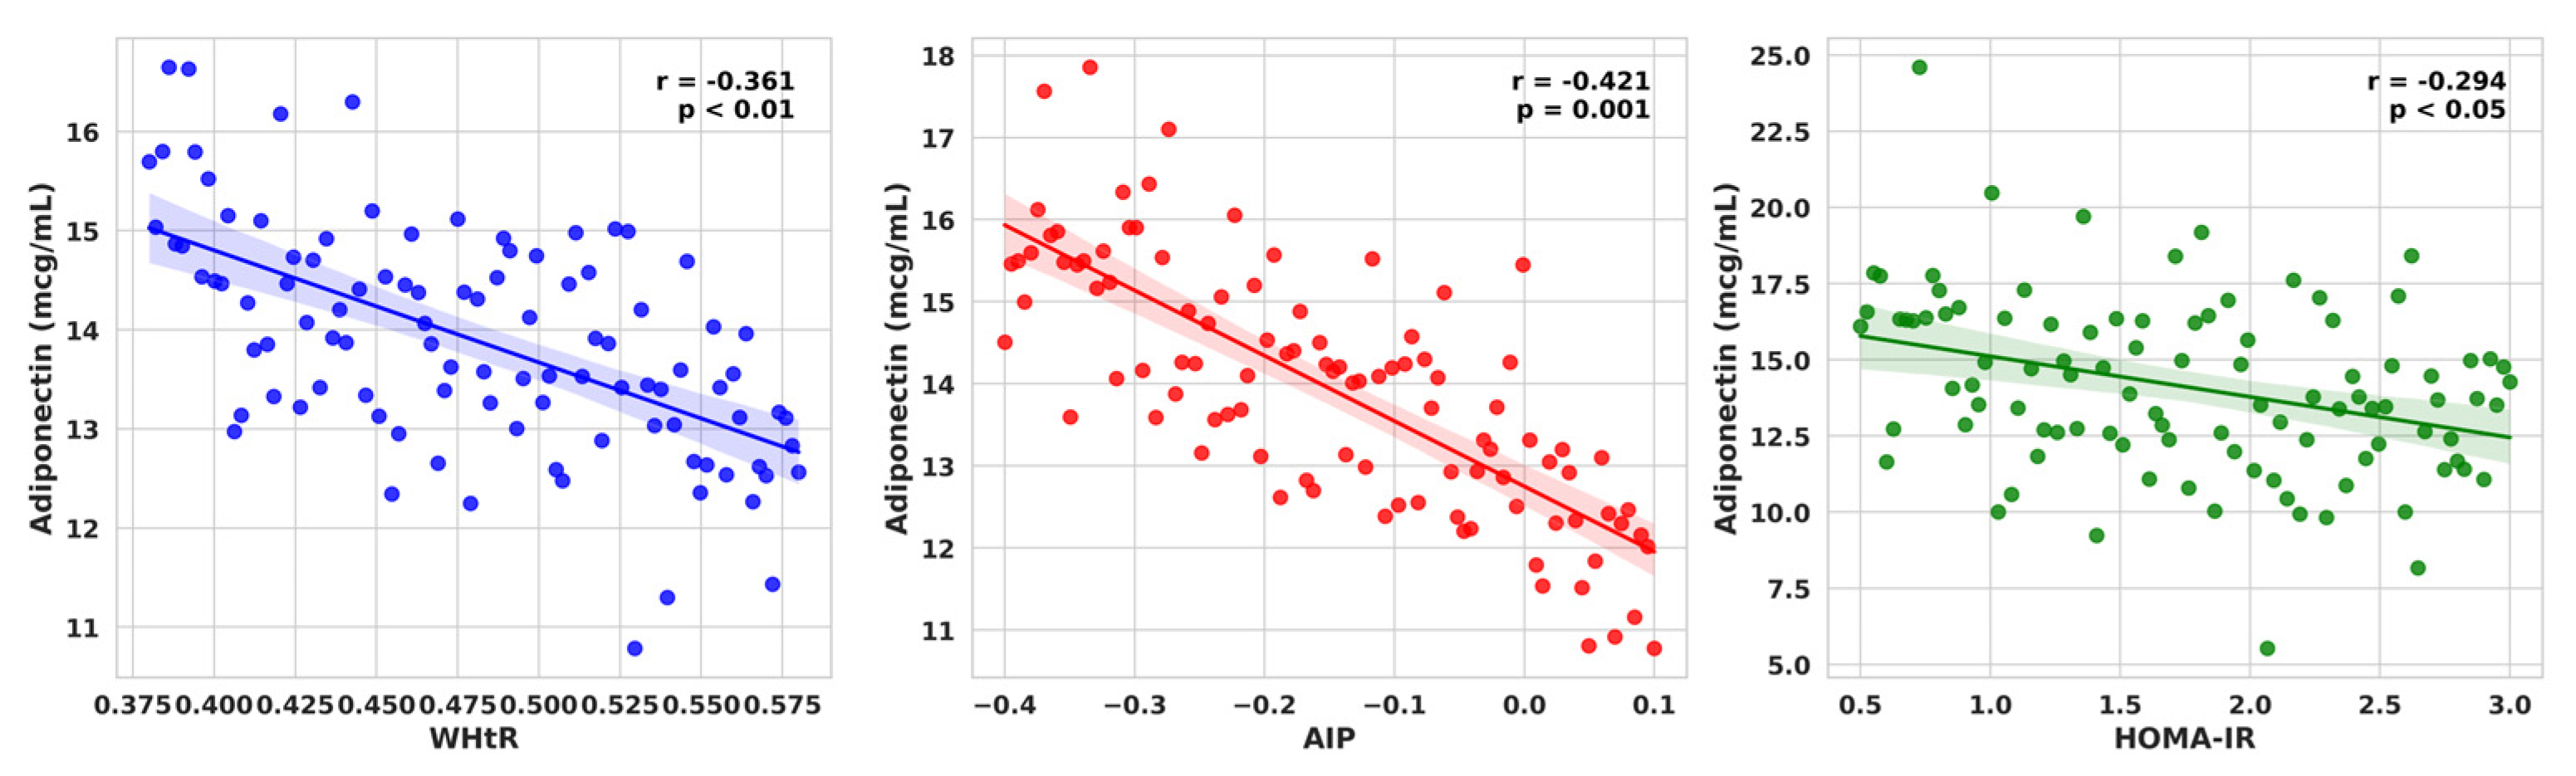
Figure 3.
Associations of BDNF with TC, LDL-C, non-HDL-C and L/A ratio in the Whole Study Group.
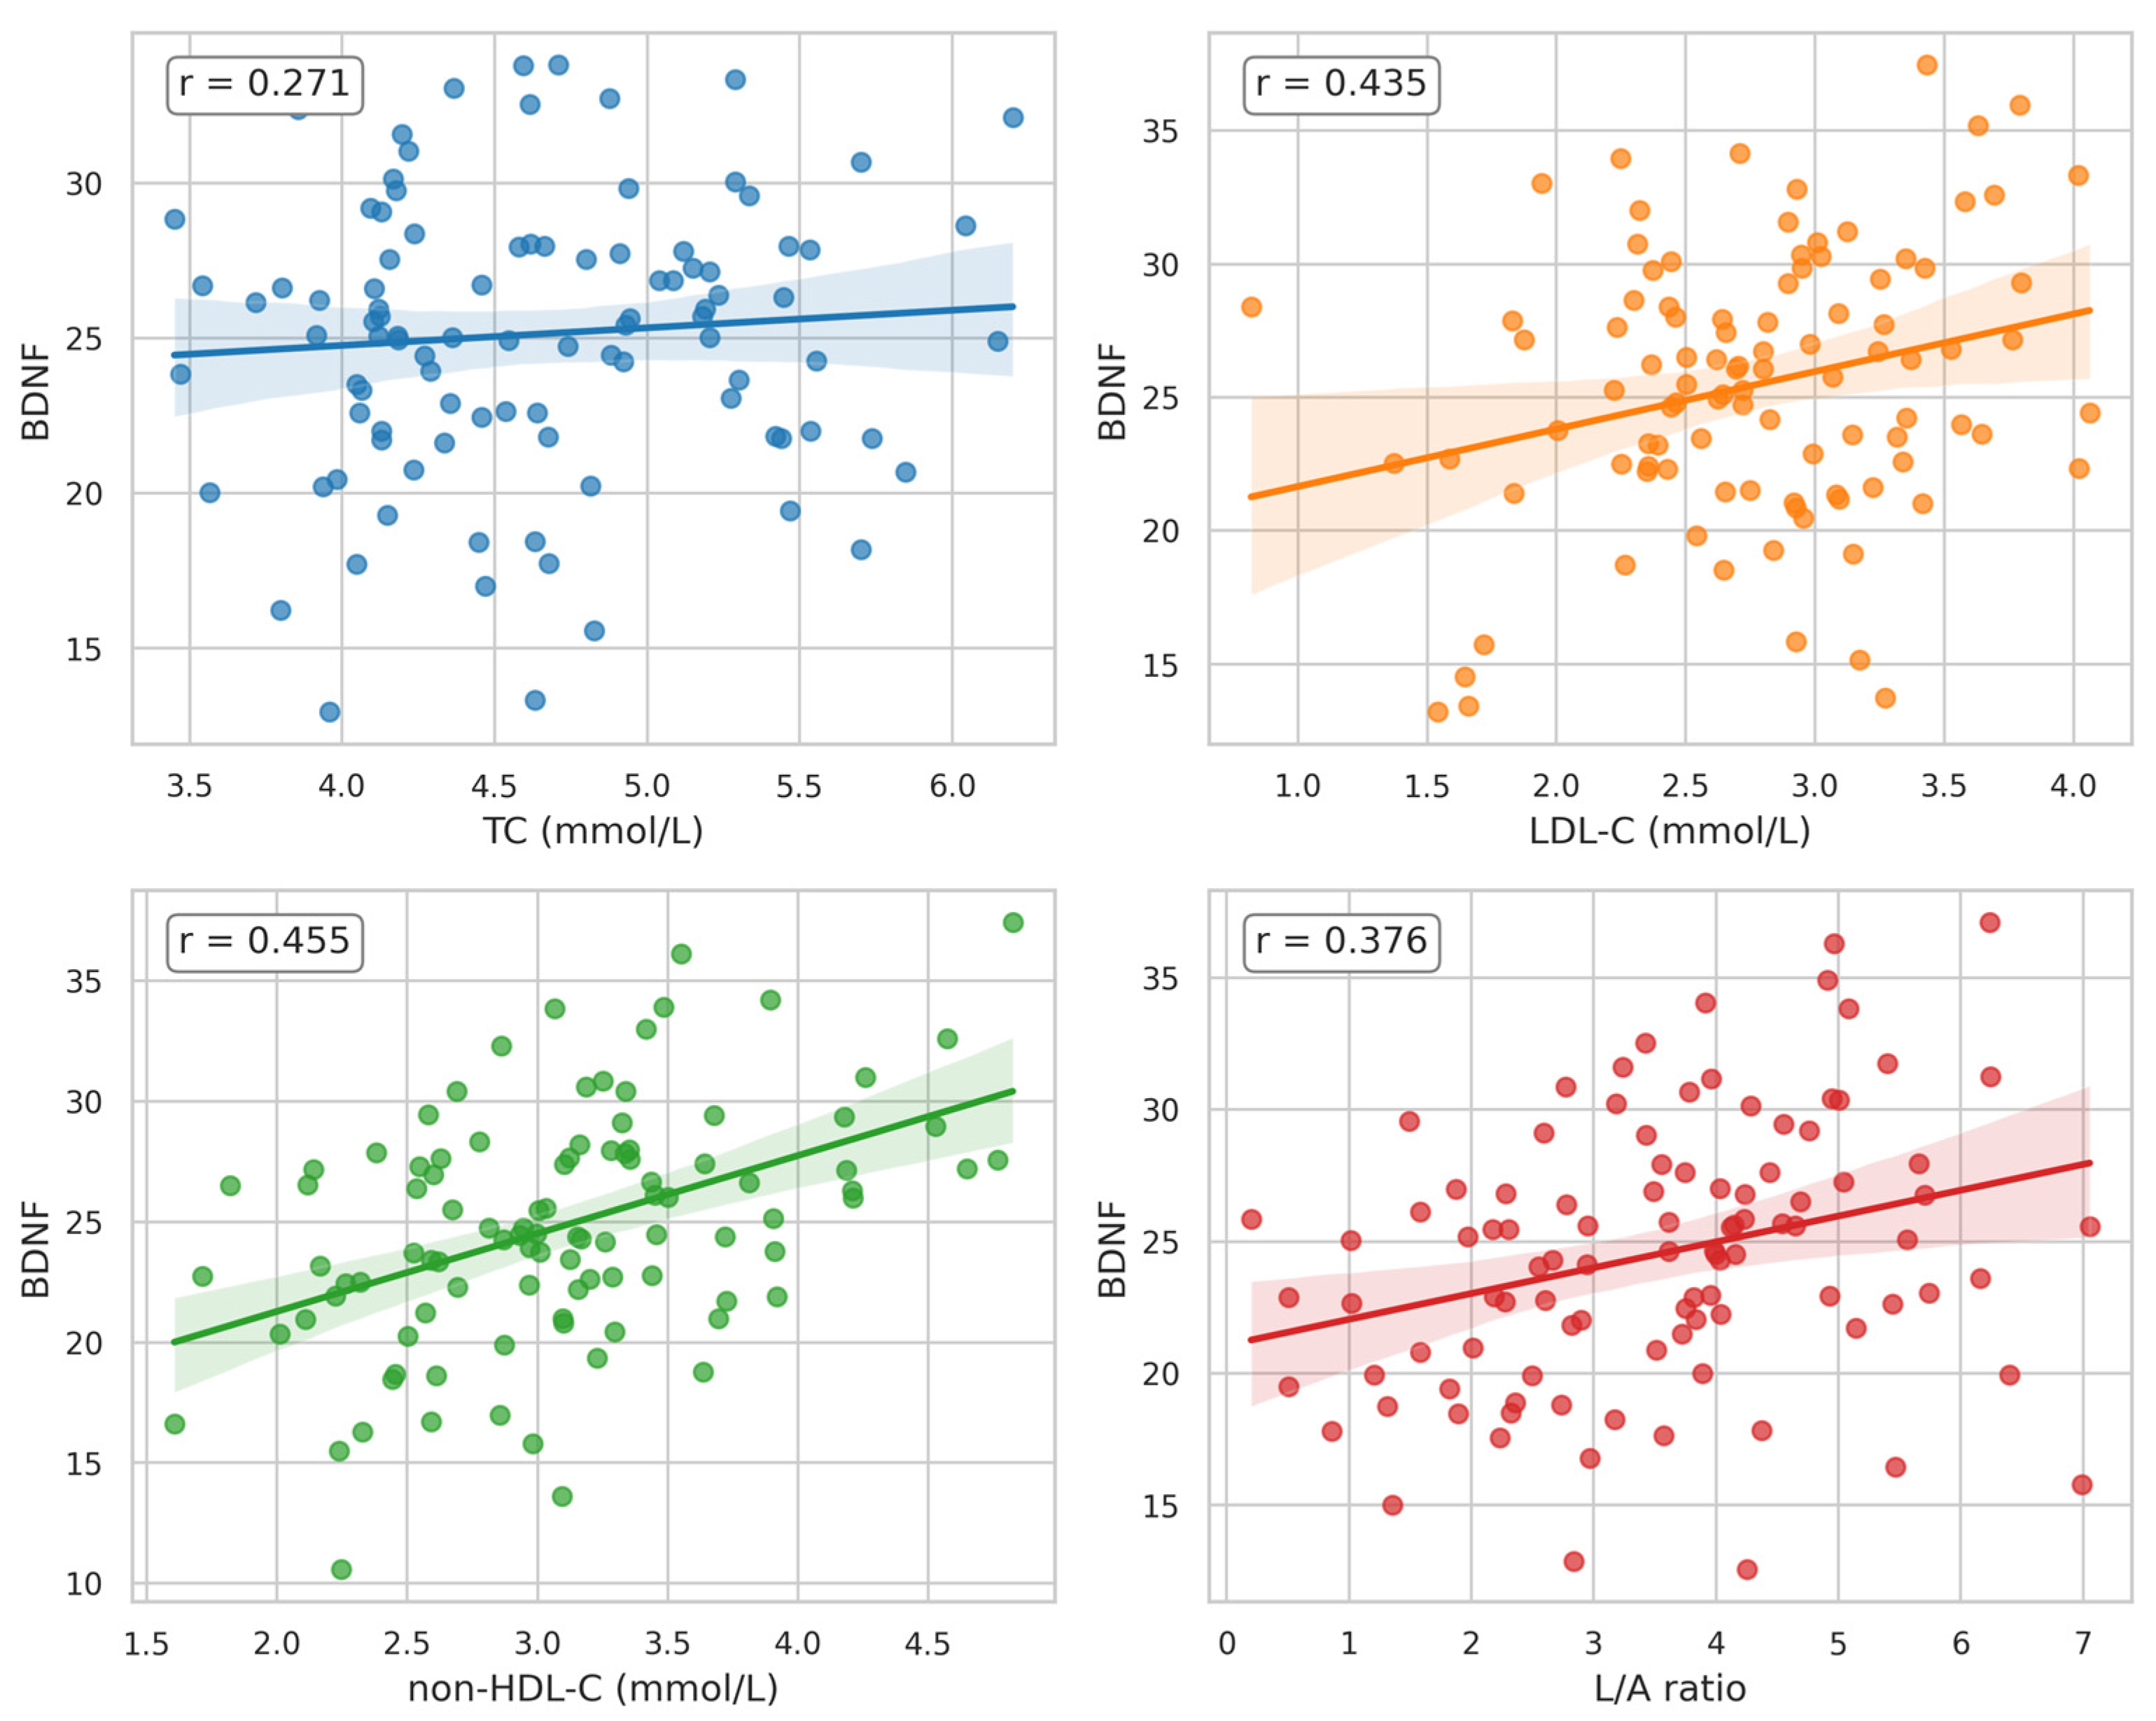
Figure 4.
Associations of NGFβ with non-HDL-C, HDL-C and Estradiol in the Whole Study Group.
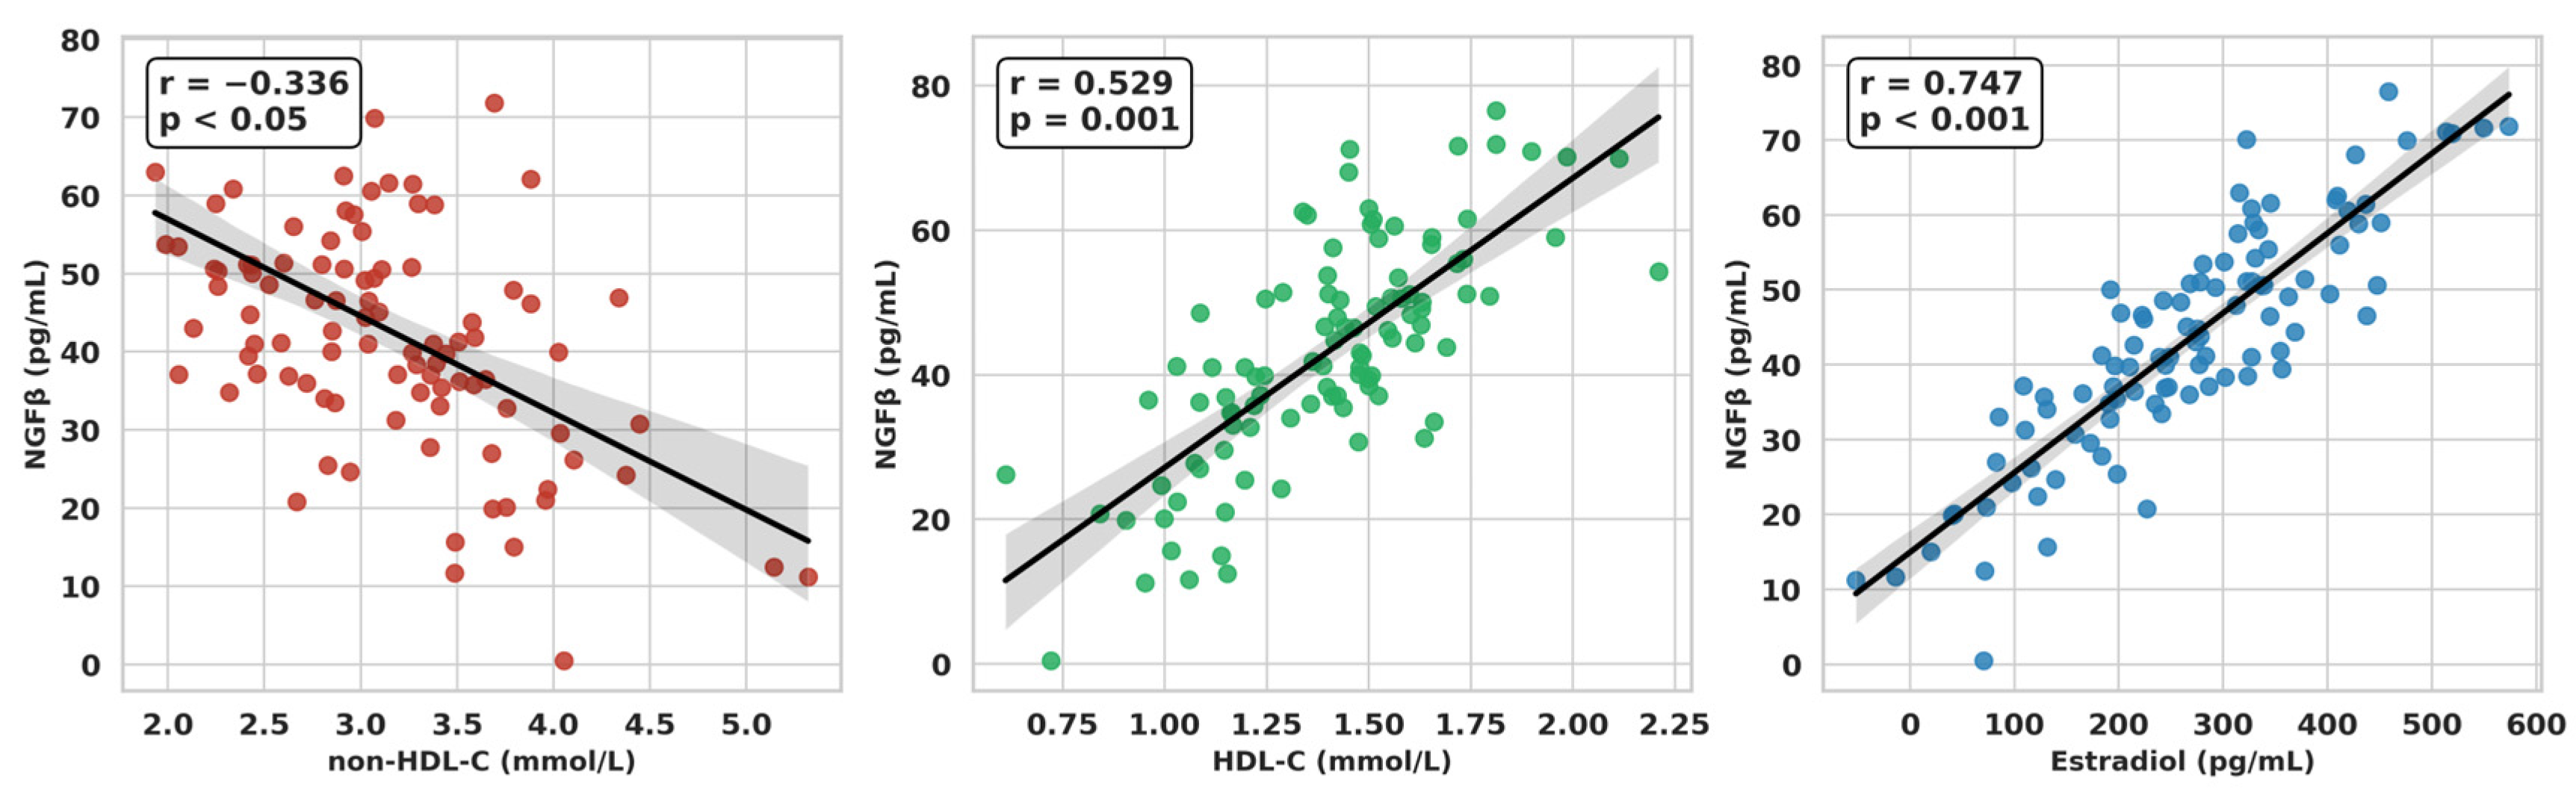
Figure 5.
Correlation Heatmap of Neurotrophins, Adipokines, Anthropometric and Metabolic Markers. Colors represent the strength and direction of Spearman correlations (blue = negative, red = positive).
Figure 5.
Correlation Heatmap of Neurotrophins, Adipokines, Anthropometric and Metabolic Markers. Colors represent the strength and direction of Spearman correlations (blue = negative, red = positive).
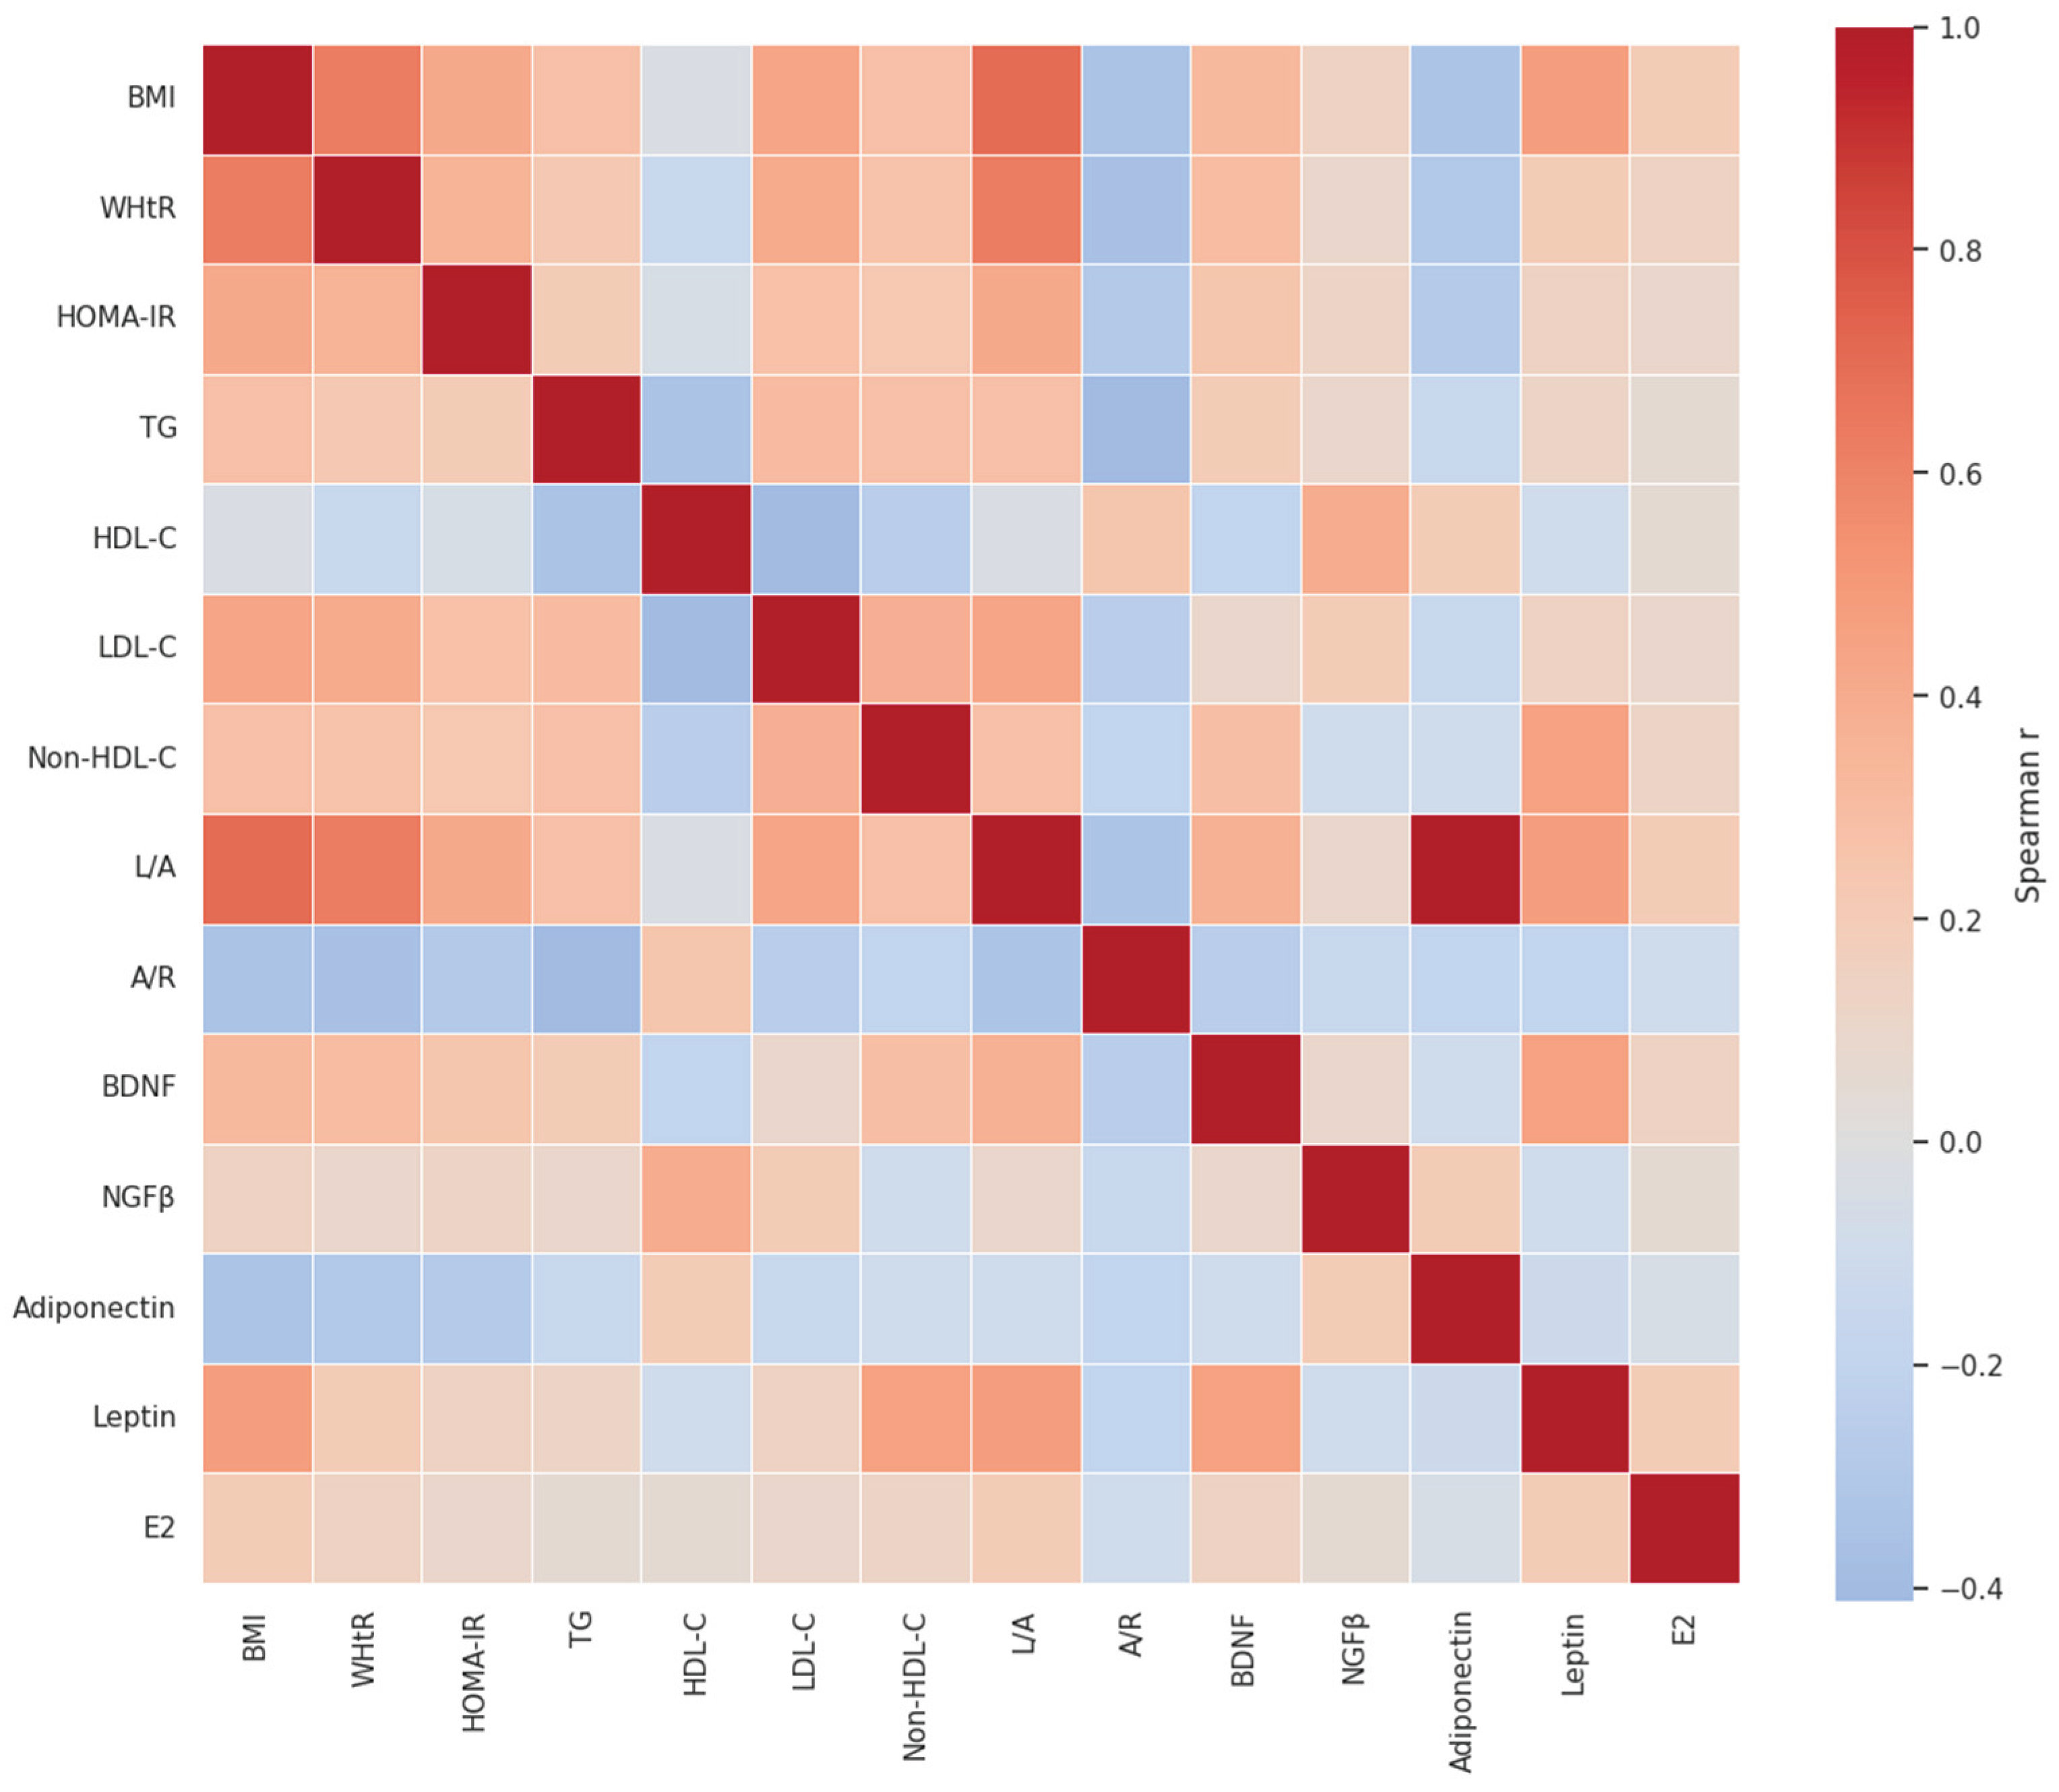

Table 1.
Age, anthropometric and clinical parameters in the two studied groups of women with PCOS.
| Parameters | Low-VAI PCOS (n=50) |
High-VAI PCOS (n=50) |
|---|---|---|
| Age (years) | 23.87 ± 4.05 | 24.36 ± 5.24 NS |
| Height (cm) | 166.48 ± 8.33 | 166.64 ± 5.85 NS |
| Weight (kg) | 61.75 ± 12.19 | 76.84 ± 16.12 *** |
| BMI (kg/m2) | 22.21 ± 3.81 | 27.64 ± 5.57 *** |
| Waist (cm) | 71.17 ± 7.83 | 88.85 ± 14.27 *** |
| Hip (cm) | 97.30 ± 9.51 | 105.15 ± 11.07 ** |
| WHR | 0.73 ± 0.05 | 0.84 ± 0.08 *** |
| WHtR | 0.43 ± 0.04 | 0.53 ± 0.09 *** |
| SBP (mmHg) | 109.57 ± 12.52 | 116.09 ± 11.05 * |
| DBP (mmHg) | 71.96 ± 9.14 | 73.04 ± 9.16 NS |
NS–not significant (p > 0.05); *–p < 0.05; **–p < 0.01; ***–p < 0.001.
Table 2.
Adipokines and neurotrophins levels; values of leptin-to-adiponectin ratio (L/A) and adiponectin-to-resistin ratio (A/R) in the two studied groups of women with PCOS.
Table 2.
Adipokines and neurotrophins levels; values of leptin-to-adiponectin ratio (L/A) and adiponectin-to-resistin ratio (A/R) in the two studied groups of women with PCOS.
| Parameters | Low-VAI PCOS (n=50) |
High-VAI PCOS (n=50) |
|---|---|---|
| Leptin (ng/mL) | 27.43 ± 13.27 | 34.06 ± 19.92 NS |
| Adiponectin (mcg/mL) | 17.52 ± 8.70 | 9.95 ± 4.71 *** |
| Resistin (ng/mL) | 5.47 ± 2.42 | 6.85 ± 4.62 NS |
| BDNF (ng/mL) | 23.03 ± 3.05 | 26.11 ± 4.14 * |
| NGFβ (pg/mL) | 51.40 ± 29.20 | 39.15 ± 4.38 * |
| L/A | 1.94 ± 1.06 | 4.30 ± 2.81 ** |
| A/R | 26.80 ± 14.66 | 14.61 ± 8.21 *** |
NS–not significant (p > 0.05); *–p < 0.05; **–p < 0.01; ***–p < 0.001.
Table 3.
Glucose homeostasis and insulin resistance parameters; lipid profile and atherogenic indices in the two studied groups of women with PCOS.
Table 3.
Glucose homeostasis and insulin resistance parameters; lipid profile and atherogenic indices in the two studied groups of women with PCOS.
| Parameters | Low-VAI PCOS (n=50) |
High-VAI PCOS (n=50) |
|---|---|---|
| FBG (mmol/L) | 4.71 ± 0.47 | 4.90 ± 0.66 NS |
| FIRI (μIU/mL) | 5.97 ± 2.26 | 9.48 ± 4.44 ** |
| HOMA-IR | 1.27 ± 0.59 | 2.13 ± 1.17 ** |
| TC (mmol/L) | 4.48 ± 1.14 | 4.47 ± 0.75 NS |
| LDL-C (mmol/L) | 2.57 ± 1.11 | 2.77 ± 0.69 NS |
| HDL-C (mmol/L) | 1.67 ± 0.49 | 1.15 ± 0.25 *** |
| TG (mmol/L) | 0.54 ± 0.16 | 1.18 ± 0.44 *** |
| Non-HDL-C | 2.82 ± 1.14 | 3.31 ± 0.73 * |
| AIP | -0.19 ± 0.12 | 0.03 ± 0.15 *** |
NS–not significant (p > 0.05); *–p < 0.05; **–p < 0.01; ***–p < 0.001.
Table 4.
Hormonal parameters in the two studied groups of women with PCOS.
| Parameters | Low-VAI PCOS (n=50) |
High-VAI PCOS (n=50) |
|---|---|---|
| Log LH (IU/L) | 0.80 ± 0.26 | 0.79 ± 0.36 NS |
| FSH (mIU/mL) | 5.90 ± 1.26 | 5.46 ± 2.12 NS |
| Log LH/FSH | 0.04 ± 0.26 | 0.09 ± 0.34 NS |
| E2 (pg/mL) | 314.67 ± 176.14 | 228.68 ± 183.03 NS |
| Total testosterone (ng/mL) | 0.66 ± 0.17 | 0.70 ± 0.20 NS |
| Androstenedione (ng/mL) | 4.16 ± 2.34 | 3.75 ± 1.44 NS |
| DHEA-S (μg/dL) | 275.77 ± 122.91 | 289.72 ± 103.67 NS |
| SHBG (nmol/L) | 46.78 ± 10.25 | 37.20 ± 18.64 NS |
| FAI | 5.01 ± 2.47 | 9.43 ± 5.46 NS |
NS–not significant (p > 0.05).
Disclaimer/Publisher’s Note: The statements, opinions and data contained in all publications are solely those of the individual author(s) and contributor(s) and not of MDPI and/or the editor(s). MDPI and/or the editor(s) disclaim responsibility for any injury to people or property resulting from any ideas, methods, instructions or products referred to in the content. |
© 2026 by the authors. Licensee MDPI, Basel, Switzerland. This article is an open access article distributed under the terms and conditions of the Creative Commons Attribution (CC BY) license.
Copyright: This open access article is published under a Creative Commons CC BY 4.0 license, which permit the free download, distribution, and reuse, provided that the author and preprint are cited in any reuse.


