Submitted:
22 August 2025
Posted:
26 August 2025
You are already at the latest version
Abstract
Polycystic ovary syndrome (PCOS) is a prevalent endocrine disorder commonly linked to insulin resistance (IR), low-grade chronic inflammation, dyslipidemia, and altered adi-pokine secretion. This study aimed to assess serum concentrations of key adi-pokines—leptin, adiponectin, visfatin, and resistin—in women with PCOS, stratified by IR status, and to examine their relationship with anthropometric, metabolic, inflammatory, and atherogenic parameters. A total of 150 women diagnosed with PCOS were divided into two subgroups: with IR (n = 76) and without IR (n = 74). Serum adipokines were measured using ELISA, and atherogenic indices (TG/HDL-C, LDL-C/HDL-C, and AIP) were calculated from fasting lipid profiles. Anthropometric data included body weight, BMI, waist and hip circumferences, and waist-to-hip ratio. IR was evaluated using HOMA-IR, QUICKI, and the Matsuda index. Women with IR had significantly higher lep-tin, visfatin, and resistin levels, and lower adiponectin. Leptin correlated positively with HOMA-IR, body weight, and lipid ratios, while adiponectin showed inverse links to tri-glycerides, TG/HDL-C, and AIP. Resistin was positively related to IR indices, and visfatin showed a negative correlation with HDL-C and insulin sensitivity. These findings suggest that IR in PCOS is associated with a proinflammatory and atherogenic adipokine profile, potentially increasing cardiometabolic risk and guiding treatment approaches.
Keywords:
polycystic ovary syndrome
; insulin resistance
; adipokines
; atherogenic indices
; metabolic dysfunction
; inflammation
1. Introduction
Polycystic ovary syndrome (PCOS) is a multifactorial endocrine disorder affecting approximately 10–15% of women at reproductive age, depending on the applied diagnostic criteria, and represents one of the most common ovarian pathologies worldwide [1]. It is classically defined by the presence of oligo- or anovulation, clinical and/or biochemical hyperandrogenism, and polycystic ovarian morphology [2]. While historically regarded as a reproductive disorder, PCOS is now recognized as a complex metabolic condition, characterized by insulin resistance (IR), dyslipidemia, central obesity, and chronic low-grade inflammation [3,4,5].
Insulin resistance occurs in up to 70% of women with PCOS, independent of body mass index (BMI), and plays a pivotal role in the development of both reproductive and metabolic abnormalities [6]. IR contributes to compensatory hyperinsulinemia, which stimulates ovarian androgen production, disrupts folliculogenesis, and alters adipose tissue signaling [7]. Dysfunctional adipose tissue, through altered secretion of adipokines—bioactive cytokines produced by adipocytes—has emerged as a key component of this metabolic–inflammatory axis, influencing insulin sensitivity, lipid metabolism, and immune responses [8,9].
Among adipokines, leptin, adiponectin, visfatin, and resistin have been most extensively studied due to their distinct insulin-sensitizing or pro-inflammatory actions. Leptin and resistin levels are generally elevated in insulin-resistant states and show positive correlations with adiposity, pro-inflammatory cytokines, and cardiometabolic risk markers [10,11]. Adiponectin, an insulin-sensitizing and anti-inflammatory adipokine, is typically reduced in PCOS and inversely related to IR and dyslipidemia [12,13]. Visfatin has been reported to exert both insulin-mimetic and pro-inflammatory effects, although findings remain inconsistent [14]. Alterations in adipokine profiles may not only reflect underlying metabolic dysfunction but also contribute to systemic inflammation and reproductive impairment in PCOS [15].
Beyond IR, PCOS is frequently associated with atherogenic dyslipidemia, characterized by elevated triglycerides (TG), reduced high-density lipoprotein cholesterol (HDL-C), increased small dense low-density lipoprotein (sdLDL) particles, and unfavorable lipid ratios such as TG/HDL-C and LDL-C/HDL-C [16,17]. These alterations can be summarized by composite indices such as the Atherogenic Index of Plasma (AIP), a sensitive marker of cardiovascular risk [18]. Evidence suggests that certain adipokines may directly influence lipid metabolism, thereby linking adipose tissue dysfunction to atherogenesis [19].
However, few studies have simultaneously examined adipokines, IR, and lipid-related atherogenic markers in PCOS populations. Moreover, the extent to which insulin resistance drives adipokine–lipid associations, independently of obesity or androgen excess, remains unclear.
Therefore, the aim of this study was to compare serum concentrations of leptin, adiponectin, visfatin, and resistin in women with PCOS stratified by insulin resistance status, and to explore their relationships with anthropometric, metabolic, inflammatory, and atherogenic parameters. Elucidating these interactions may help clarify mechanisms underlying cardiometabolic risk in PCOS and identify potential targets for individualized metabolic intervention.
2. Results
2.1. Age and Anthropometric Parameters
Table 1 summarizes the age and anthropometric parameters of insulin-resistant (IR) and non–insulin-resistant (non-IR) women with PCOS. Both groups were similar in age and height. Compared to non-IR women, those with IR had significantly higher body weight, BMI, waist circumference, and hip circumference (p < 0.01). Waist-to-hip ratio (WHR) did not differ significantly.
2.2. Glucose and Insulin Dynamics
The oral glucose tolerance test (OGTT) revealed significantly elevated fasting, 60′, and 120′ glucose and insulin levels in the IR group compared to non-IR women (p < 0.001) (Figure 1 and Figure 2).
In the IR cohort, HOMA-IR was significantly elevated (3.11 ± 1.77 vs. 1.28 ± 0.48; p < 0.001), accompanied by a reduction in QUICKI (0.33 ± 0.03 vs. 0.38 ± 0.03; p < 0.001) and a markedly lower Matsuda index (3.97 ± 1.73 vs. 11.77 ± 5.55; p < 0.001) (Figure 3, Figure 4 and Figure 5). These findings confirm the validity of the insulin resistance classification applied in this study.
2.3. Lipid Profile and Atherogenic Indices
Table 2 presents lipid parameters and atherogenic indices in both groups. Compared to non-IR women, the IR group demonstrated significantly higher values of triglycerides (TG) (p < 0.001), TG/HDL-C ratio (p < 0.01), and Atherogenic Index of Plasma (AIP) (p < 0.001). No significant differences concerning total cholesterol (TC), HDL-C, LDL-C, or LDL-C/HDL-C ratios were observed (Table 2).
2.4. Adipokine Profiles
Adipokine profiles differed significantly between groups (Table 3). Compared with non-IR women, those with IR exhibited higher visfatin (p < 0.05), leptin (p < 0.01), log₁₀-transformed resistin (p < 0.05) values, and lower adiponectin levels (p < 0.01).
2.5. Correlation Analyses
2.5.1. Leptin
Serum leptin levels showed significant positive correlations with several anthropometric and metabolic parameters. Specifically, leptin was found to be strongly associated with body weight (r = 0.732, p < 0.001; Figure 6), BMI (r = 0.694, p < 0.001), and waist circumference (r = 0.679, p < 0.001). Moreover, a significant moderate positive correlation between the adipokine and HOMA-IR was observed (r = 0.409, p < 0.001; Figure 7), indicating a potential link between circulating leptin concentrations, adiposity, and insulin resistance.
In addition, leptin showed a negative correlation with both QUICKI (r = –0.430, p < 0.001; Figure 8) and Matsuda index (r = –0.423, p < 0.001; Figure 9).
Using linear regression analysis, it was found that weight explains 54% of the variations in leptin levels (R = 0.732, R² = 0.536, P < 0.001, F = 73.96). Thus, an increase in weight by 1 kg leads to an increase in leptin levels by 0.87 ng/mL. HOMA-IR explains 17% of the variations in serum leptin levels (R = 0.409, R² = 0.167, P < 0.001, F = 12.85).
2.5.2. Adiponectin
Adiponectin demonstrated inverse correlations with weight, BMI, waist circumference, hip circumference, WHR, GLU 60’, IRI 0’, IRI 60’, IRI 120’, HOMA-IR, TG, TG/HDL-C, and AIP. Conversely, a significant positive relationship between adiponectin and calculated insulin sensitivity indices (QUICKI and Matsuda index) was observed (Table 4).
2.5.3. Visfatin
A negative correlation between visfatin and HDL-C was established (r = –0.376, p = 0.024). Furthermore, this adipokine showed a trend toward inverse association with Matsuda index (Kendall’s tau = –0.226, p = 0.051).
2.5.4. Resistin
Study results showed positive relationships between resistin and the following glucose and insulin metabolism parameters – GLU 0’ (r = 0.278, p = 0.024), IRI 120’ (r = 0.315 p = 0.015) and HOMA-IR (r = 0.272, p = 0.027). Additionally, resistin was found to be inversely correlated with QUICKI (r = –0.246, p = 0.046) and Matsuda index (r = –0.243, p = 0.050).
3. Discussion
This study provides compelling evidence that IR significantly alters the adipokine profile in women with PCOS, independent of potential confounders such as age and BMI. The observed elevation in leptin, visfatin, and resistin levels, along with decreased adiponectin concentrations, reflects a proinflammatory and metabolically dysregulated phenotype. These findings support the concept that IR is not merely a downstream consequence but also an upstream driver of endocrine and metabolic dysfunction in PCOS, contributing to the amplification of both reproductive and cardiometabolic abnormalities.
Our finding of elevated leptin levels in IR women with PCOS is consistent with numerous previous reports [20,21]. Hyperleptinemia in this context likely reflects a state of leptin resistance, characterized by impaired hypothalamic feedback despite high circulating levels [22]. The strong correlations between leptin and anthropometric indices, HOMA-IR, and QUICKI in our cohort mirror results from Panidis et al. [23] and Nyangasa et al. [24], who also noted leptin’s positive associations with markers of central obesity. Additionally, Chakrabarti et al. observed that leptin concentrations were more than 2-fold higher in IR PCOS patients compared with controls and showed strong positive correlations with circulating insulin [25]. Similarly, Jahromi et al. demonstrated robust associations between leptin and HOMA-IR, QUICKI, body weight, and BMI in infertile women with PCOS, identifying HOMA-IR as the most sensitive marker of insulin resistance [26].
In agreement with our data, Daghestani et al. found that leptin correlated positively with BMI, WHR, total cholesterol (TC), LDL-C, and TG, and inversely with HDL-C, with circulating insulin emerging as the strongest determinant of leptin levels [27]. Furthermore, the established positive relationship between leptin and atherogenic lipid ratios (e.g., TG/HDL-C, AIP) aligns with emerging evidence suggesting leptin as an independent predictor of cardiometabolic risk in PCOS [12,28]. Lee et al. reported that TG/HDL-C was significantly higher in PCOS and served as a useful surrogate marker of insulin IR and cardiometabolic risk [29], while Demirci et al. showed that AIP was elevated in PCOS and independently predicted by both PCOS status and HOMA-IR [30].
Experimental data provide further insight into the reproductive interface: in vitro studies in human theca and granulosa cells show that leptin can inhibit IGF-I–mediated augmentation of LH-induced androgen and progesterone synthesis at concentrations typical of obesity, suggesting dysregulated ovarian leptin signaling in PCOS [31,32].
Adiponectin, in contrast, exhibited significantly lower concentrations in IR subjects and was positively associated with Matsuda and QUICKI indices, in agreement with several meta-analyses [33,34]. Its inverse correlations with TG and AIP reinforce its recognized anti-atherogenic properties, possibly mediated via AMPK activation, enhanced fatty acid oxidation, and suppression of foam cell formation [19,35]. While low adiponectin is a consistent hallmark of PCOS across most populations [36], some studies have noted that its predictive utility varies by phenotype, obesity status, and ethnicity [37,38].
A systematic review and meta-analysis by Toulis et al. [33] reported that, after controlling for BMI-related effects, adiponectin levels were significantly lower in women with PCOS compared to non-PCOS controls - a finding present in both lean and obese phenotypes. Similarly, Patil et al. [39] observed that serum adiponectin levels were decreased in women with PCOS and inversely associated with BMI, TC, and TG, suggesting potential diagnostic and prognostic value.
The association between adiponectin and IR in PCOS has also been highlighted by Shirazi et al. [40], who demonstrated a significant correlation between insulin levels and the free androgen index independent of obesity. This underscores the central role of IR in PCOS pathophysiology. Phenotypic variations further modulate adiponectin levels, as shown by Barrea et al. [41], who reported that obese PCOS patients exhibited greater prevalence of metabolic and reproductive disturbances compared to lean counterparts, suggesting that obesity and PCOS phenotype influence circulating adiponectin concentrations. In contrast, genetic studies such as that by Nowak et al. [42] found that adiponectin gene polymorphisms (e.g., rs17300539) were not significantly associated with metabolic syndrome in PCOS, indicating that environmental and metabolic factors may play a more prominent role than genetics in determining adiponectin levels in this population.
Visfatin’s role in PCOS remains controversial. Initially described as an insulin-mimetic adipokine (nicotinamide phosphoribosyltransferase, NAMPT) [43], subsequent research has highlighted its pro-inflammatory actions through NF-κB activation and upregulation of IL-6 [44]. In our study, increased visfatin levels in IR women, together with negative associations with HDL-C and Matsuda index, suggest that visfatin may contribute both to impaired insulin sensitivity and atherogenic dyslipidemia. Similar associations were reported by Kowalska et al. [45], whereas other studies have found no significant differences in visfatin levels between PCOS phenotypes [46], underscoring the need for stratified analyses based on metabolic status.
Building upon these observations, evidence from a comprehensive meta-analysis encompassing 1,341 women (695 with PCOS and 646 clinically healthy controls) provides further insight into visfatin dynamics in PCOS [47]. The primary objective of this study was to evaluate serum visfatin levels across the two cohorts and to perform a comparative analysis. The results unequivocally demonstrated significantly elevated serum visfatin concentrations in women with PCOS relative to controls. Notably, stratified and univariate analyses revealed no significant associations between heightened visfatin levels and BMI, HOMA-IR, or testosterone concentrations [47]. These findings suggest that elevated circulating visfatin may constitute a distinct intragroup characteristic of PCOS, highlighting the potential utility of this adipokine as a diagnostic biomarker for the syndrome.
El-Said et al. reported significantly elevated plasma visfatin concentrations in a cohort of IR women with PCOS (72.94 ± 33.3 ng/mL) compared with clinically healthy controls (54.69 ± 31.5 ng/mL, P = 0.039). Within the PCOS group, visfatin demonstrated positive correlations with BMI, waist circumference, HOMA-IR, and free androgen index (FAI), and inverse correlations with luteinizing hormone (LH), total testosterone, and sex hormone-binding globulin (SHBG). Аcross the overall study population, plasma visfatin concentrations were inversely associated with HDL-C (r = –0.349, P = 0.013), highlighting a potential link with atherogenic risk [48]. Interestingly, in contrast to these observations, Gen et al. reported a positive correlation between plasma visfatin and HDL-C in a cohort of women with PCOS who exhibited normal body weight, suggesting that the relationship between visfatin and lipid metabolism may be modulated by metabolic status [49]. Taken together, these findings underscore the complexity of visfatin’s role in PCOS and emphasize the importance of stratified analyses according to insulin resistance and body composition.
Resistin, although less studied in PCOS, showed positive correlations with fasting/postprandial insulin, and inverse relationships with QUICKI and Matsuda indices. These results are consistent with findings from Estienne et al. [50] and Bril et al. [51], who linked elevated resistin to systemic inflammation, IR, and endothelial dysfunction in PCOS. Similarly, Lewandowski et al. [52] reported that serum resistin levels were significantly higher in PCOS patients compared to BMI-matched controls and correlated with HOMA-IR and markers of subclinical inflammation, supporting a role in metabolic dysregulation. In a study by Yildiz et al. [53], resistin was found to be positively associated with pro-inflammatory cytokines such as TNF-α and CRP, suggesting its involvement in low-grade chronic inflammation characteristic of PCOS. Mechanistically, resistin may impair insulin signaling by upregulating suppressor of cytokine signaling-3 (SOCS-3) and enhancing vascular inflammation [54], while experimental data indicate that resistin can also promote hepatic gluconeogenesis and reduce glucose uptake in adipocytes, further exacerbating insulin resistance [52]. Collectively, these findings suggest that resistin not only reflects metabolic and inflammatory disturbances in PCOS but may also actively contribute to the pathophysiology of insulin resistance and cardiometabolic risk in this population.
Our data support the hypothesis that adipokine dysregulation in PCOS is closely linked to IR, adiposity, systemic inflammation, and lipid abnormalities, all of which synergistically contribute to an elevated cardiometabolic risk profile [55]. Notably, we extend prior knowledge by demonstrating that specific adipokines—particularly leptin and adiponectin—correlate with composite atherogenic indices such as AIP, which are seldom evaluated in PCOS research.
From a clinical perspective, these results highlight the potential value of adipokine profiling in early risk stratification and phenotype-specific management of PCOS. Interventions targeting IR—such as metformin, inositol isomers, and GLP-1 receptor agonists—have been shown to modulate adipokine levels and improve metabolic and reproductive outcomes [56,57,58]. Likewise, lifestyle interventions focusing on weight reduction, physical activity, and dietary patterns with low glycemic load or anti-inflammatory potential have demonstrated beneficial effects on adipokine balance and cardiometabolic markers [59,60].
Nevertheless, certain limitations should be acknowledged. The cross-sectional nature of the study precludes causal inference, and circulating adipokine concentrations may not fully reflect tissue-specific activity or receptor sensitivity. Moreover, we did not assess genetic variants in adipokine-related genes, which may influence individual responses. Future longitudinal and interventional studies are warranted to clarify the causal pathways linking adipokine changes with long-term cardiovascular and reproductive outcomes in PCOS.
4. Materials and Methods
4.1. Study Design and Population
This cross-sectional, observational study included 150 women aged 18–35 years, diagnosed with polycystic ovary syndrome (PCOS) according to the Rotterdam criteria (2003) [2]. Participants were recruited from the Clinic of Endocrinology and Metabolic Diseases at “Sv. Georgy” Uviversity Hospital of Plovdiv between June 2020 and June 2023. The diagnosis of PCOS required at least two of the following: oligo/anovulation, clinical and/or biochemical hyperandrogenism, and polycystic ovarian morphology on ultrasound, with exclusion of other etiologies (e.g., congenital adrenal hyperplasia, Cushing’s syndrome, androgen-secreting tumors, thyroid dysfunction, and hyperprolactinemia).
Exclusion criteria included: chronic inflammatory or autoimmune disorders, current use of hormonal or insulin-sensitizing medications, and pregnancy.
Participants were stratified into two groups based on insulin resistance (IR) status: 1. PCOS group without IR (n = 74), and 2. PCOS group with IR (n = 76), defined by HOMA-IR ≥ 2.5 [61].
4.2. Anthropometric and Clinical Measurements
Anthropometric evaluation included body weight, height, waist circumference (W), and hip circumference (H), measured using standard techniques. Waist circumference was determined after the act of expiration measuring the area between the bottom edges of the ribs and the iliac crests. Hip circumference was assessed at the level of the greater trochanters. Body mass index (BMI) {weight (kg)/height² (m²)} and Waist-to-hip ratio (WHR) were calculated.
4.3. Biochemical, Hormonal and Adipokine Assessment
Venous blood for laboratory tests was taken under standard conditions − early in the morning, after an overnight 12-hour fast period, during the follicular phase of the menstrual cycle (2nd to 5th day after a spontaneously obtained menstrual cycle) or 7 days after gestagen-induced bleeding. A 75 g oral glucose tolerance test (OGTT) was performed with blood sampling at 0, 60, and 120 minutes for plasma glucose (GLU) and insulin (IRI) levels. Samples for determination of GLU and IRI, lipid parameters, standard hormonal parameters and adipokines were taken to the Central Clinic Laboratory, “Sv. Georgy” University Hospital of Plovdiv, Bulgaria.
Serum insulin levels were determined using a chemiluminescent immunoassay (CLIA) kit from Beckman Coulter, Inc., Ireland. This sandwich immunoassay method showed the following characteristics: dilution recovery - 96–104%; sensitivity - 0.03 μIU/mL; intra-assay variation (CV) - 2.0–4.2%; inter-assay variation (CV) - 3.1–5.6%; specificity - no cross-reactivity with bilirubin (10 mg/dL), triglycerides (20.32 mmol/L), or C-peptide (20,000 pmol/L) was observed; reference range: 1.9–23.0 μIU/mL. Serum glucose levels were tested by a standard GOD-POD method.
Insulin resistance and sensitivity were evaluated using the following indices: HOMA-IR = (Fasting insulin [µU/mL] × Fasting glucose [mmol/L]) / 22.5; QUICKI = 1 / (log fasting insulin [µU/mL] + log fasting glucose [mg/dL]); Matsuda index = 10,000 / √[(Fasting glucose [mg/dL] × Fasting insulin [µU/mL]) × (Mean OGTT glucose × Mean OGTT insulin)].
Serum lipids were measured enzymatically. Concentrations of total cholesterol (TC) were determined by ChOD, PAP; those of TG − by GPO, PAP and HDL-C - by MgSO4-dextran SO4 precipitation, Schneiders Analysers; Netherlands test; Delta Kone Autoanalyser. LDL-C was calculated using Friedewald formula. Calculated atherogenic indices included the TG/HDL-C ratio, LDL-C/HDL-C ratio, and the Atherogenic Index of Plasma (AIP), which is defined as log₁₀ of the TG/HDL-C ratio.
Serum leptin levels were quantified by a solid-phase human ELISA method using a commercial kit from DRG, Germany with the following characteristics: sensitivity - 0.2 ng/mL; intra-assay CV < 8.7%; inter-assay CV < 5.4%. Serum adiponectin concentrations were determined using a human ELISA kit from BioVendor, Heidelberg, Germany with the following features: sensitivity - 26 ng/mL; intra-assay CV < 5.9%; inter-assay CV < 7.0%. Visfatin concentrations were measured by ELISA using a kit from Gentaur Molecular Products, Kampenhout, Belgium (catalog No. CSB-E08940h) with: sensitivity - 0.16 ng/mL; intra-assay CV 4.0–6.0%; inter-assay CV 8.0–12.0% and specificity - no detected cross-reactivity with similar proteins. Levels of serum resistin were measured by a competitive solid-phase human EIA using a kit from PHOENIX PHARMACEUTICAL INC, USA characterized by sensitivity: 1.16 ng/mL; Intra-assay CV < 14.0%; inter-assay CV < 5.0%.
4.4. Statistical Analysis
All statistical analyses were conducted using SPSS software, version 21.0 for Windows. The normality of data distribution was assessed using the Kolmogorov–Smirnov test. Resistin levels were log₁₀-transformed prior to analysis to achieve a normal distribution. Data for normally distributed variables were presented as mean ± standard deviation (SD), whereas non-normally distributed variables were expressed as median and interquartile range. Group comparisons were performed using independent sample t-tests or the Mann–Whitney U test, as appropriate. Correlation analyses employed Pearson, Spearman, or Kendall’s tau correlation coefficients, depending on the data type and distribution. Stepwise linear regression models were applied to identify predictors of leptin levels and to explore associations between adipokines and insulin resistance. A two-tailed p-value < 0.05 was considered statistically significant. No imputation was performed for missing data.
5. Conclusions
This study underscores the presence of a distinct metabolic and inflammatory adipokine profile in women with PCOS and insulin resistance. Elevated serum levels of leptin, visfatin, and resistin, alongside reduced adiponectin concentrations, were strongly associated with markers of impaired glucose metabolism, increased adiposity, and adverse atherogenic indices. These findings suggest that adipokine dysregulation not only reflects underlying metabolic dysfunction, but may actively contribute to the progression of cardiometabolic risk in insulin-resistant PCOS phenotypes.
The observed correlations between adipokines and insulin resistance/sensitivity indices (HOMA-IR, QUICKI, Matsuda), as well as atherogenic ratios such as TG/HDL-C and AIP, reinforce their potential utility as integrated biomarkers for metabolic risk stratification in PCOS. Moreover, the data point toward adipocytokines as plausible therapeutic targets in the management of this heterogeneous disorder.
Future studies should focus on longitudinal follow-up and mechanistic investigations to determine whether modifying adipokine profiles through pharmacological or lifestyle interventions can translate into improved metabolic, reproductive, and cardiovascular outcomes in women with PCOS.
6. Patents
The authors declare that there are no patents resulting from this work.
Author Contributions
Conceptualization, D.K. and M.I..; methodology, D.K.; software, D.K.; validation, D.K., M.I. and M.O.; formal analysis, T.D.; investigation, T.D.; resources, M.O.; data curation, M.I.; writing—original draft preparation, D.K.; writing—review and editing, M.O.; visualization, T.D.; supervision, M.O.; project administration, D.K. All authors have read and agreed to the published version of the manuscript.
Funding
This research received no external funding.
Institutional Review Board Statement
The study was conducted in accordance with the Declaration of Helsinki, and approved by the Ethics Committee of MEDICAL UNIVERSITY OF PLOVDIV (protocol code 2444/26.10.2020).
Informed Consent Statement
Informed consent was obtained from all subjects involved in the study.
Data Availability Statement
The data that support the findings of this study are available from the corresponding author upon reasonable request. Due to ethical restrictions and participant confidentiality, the dataset is not publicly available.
Acknowledgments
The authors would like to thank the laboratory staff and clinical personnel at “Sv. Georgy” University Hospital of Plovdiv, Bulgaria for their assistance with sample collection and processing.
Conflicts of Interest
The authors declare no conflict of interest.
Abbreviations
The following abbreviations are used in this manuscript:
| PCOS | Polycystic Ovary Syndrome |
| IR | Insulin Resistance |
| BMI | Body Mass Index |
| HOMA-IR | Homeostatic Model Assessment for Insulin Resistance |
| QUICKI | Quantitative Insulin Sensitivity Check Index |
| AIP | Atherogenic Index of Plasma |
| HDL-C | High-Density Lipoprotein Cholesterol |
| LDL-C | Low-Density Lipoprotein Cholesterol |
| TG | Triglycerides |
| ELISA | Enzyme-Linked Immunosorbent Assay |
| IL-6 | Interleukin 6 |
| OGTT | Oral Glucose Tolerance Test |
References
- Lizneva, D.; Suturina, L.; Walker, W.; Brak, S.; Gavrilova-Jordan, L.; Azziz, R. Criteria, prevalence, and phenotypes of polycystic ovary syndrome. Fertil. Steril. 2016, 106, 6–15. [Google Scholar] [CrossRef]
- Rotterdam ESHRE/ASRM-Sponsored PCOS Consensus Workshop Group. Revised 2003 consensus on diagnostic criteria and long-term health risks related to polycystic ovary syndrome. Fertil. Steril. 2004, 81, 19–25. [Google Scholar] [CrossRef]
- Dumesic, D.A.; Oberfield, S.E.; Stener-Victorin, E.; Marshall, J.C.; Laven, J.S.; Legro, R.S. Scientific statement on the diagnostic criteria, epidemiology, pathophysiology, and molecular genetics of PCOS. Endocr. Rev. 2015, 36, 487–525. [Google Scholar] [CrossRef]
- Azziz, R.; Carmina, E.; Chen, Z.; Dunaif, A.; Laven, J.S.; Legro, R.S.; Lizneva, D.; Natterson-Horowitz, B.; Teede, H.J.; Yildiz, B.O. Polycystic ovary syndrome. Nat. Rev. Dis. Primers 2016, 2, 16057. [Google Scholar] [CrossRef]
- González, F. Inflammation in polycystic ovary syndrome: underpinning of insulin resistance and ovarian dysfunction. Steroids 2012, 77, 300–305. [Google Scholar] [CrossRef]
- Diamanti-Kandarakis, E.; Dunaif, A. Insulin resistance and the polycystic ovary syndrome revisited: an update on mechanisms and implications. Endocr. Rev. 2012, 33, 981–1030. [Google Scholar] [CrossRef]
- Nestler, J.E. Insulin regulation of human ovarian androgens. Hum. Reprod. 1997, 12, 53–62. [Google Scholar] [CrossRef]
- Ouchi, N.; Parker, J.L.; Lugus, J.J.; Walsh, K. Adipokines in inflammation and metabolic disease. Nat. Rev. Immunol. 2011, 11, 85–97. [Google Scholar] [CrossRef]
- Fasshauer, M.; Blüher, M. Adipokines in health and disease. Trends Pharmacol. Sci. 2015, 36, 461–470. [Google Scholar] [CrossRef]
- Reinehr, T.; Karges, B.; Meissner, T.; Wiegand, S.; Stoffel-Wagner, B.; Holl, R.W.; Woelfle, J. Inflammatory markers in obese adolescents with type 2 diabetes and their relationship to hepatokines and adipokines. J. Pediatr. 2016, 173, 131–135. [Google Scholar] [CrossRef]
- Al-Daghri, N.M.; Al-Attas, O.S.; Al-Rubeaan, K.; Mohieldin, M.; Al-Katari, M. , Jones, A.F., Kumar, S. Serum leptin and its relation to anthropometric measures of obesity in pre-diabetic Saudis. Cardiovasc Diabetol. 2007, 7, 18. [Google Scholar] [CrossRef]
- Behboudi-Gandevani, S.; Ramezani Tehrani, F.; Yarandi, R.B.; Noroozzadeh, M.; Hedayati, M.; Azizi,, F. The association between polycystic ovary syndrome, obesity, and the serum concentration of adipokines. J Endocrinol Invest. 2017, 40, 859–866. [Google Scholar] [CrossRef]
- Panidis, D.; Kourtis, A.; Farmakiotis, D.; Mouslech, T.; Rousso, D.; Koliakos, G. Serum adiponectin levels in women with polycystic ovary syndrome. Hum Reprod. 2003, 18, 1790–1796. [Google Scholar] [CrossRef]
- Chang, Y.H.; Chang, D.M.; Lin, K.C.; Shin, S.J.; Lee, Y.J. Visfatin in overweight/obesity, type 2 diabetes mellitus, insulin resistance, metabolic syndrome and cardiovascular diseases: a meta-analysis and systemic review. Diabetes Metab Res Rev. 2011, 27, 515–527. [Google Scholar] [CrossRef]
- Barber, T.M.; Franks, S. Obesity and polycystic ovary syndrome. Clin. Endocrinol. 2021, 95, 529–687. [Google Scholar] [CrossRef]
- Wild, R.A.; Rizzo, M.; Clifton, S.; Carmina, E. Lipid levels in polycystic ovary syndrome: systematic review and meta-analysis. Fertility and Sterility 2011, 3, 1073–1079. [Google Scholar] [CrossRef]
- Sam, S.; Haffner, S.; Davidson, M.H.; D’Agostino, R., Jr.; Feinstein, S.; Kondos, G.; Perez, A. Relation of abdominal fat depots to systemic markers of inflammation in type 2 diabetes. Diabetes Care 2009, 32, 932–937. [Google Scholar] [CrossRef]
- Dobiasova, M. Atherogenic index of plasma [log(TG/HDL-C)]: theoretical and practical implications. Clin. Chem. 2004, 50, 1113–1115. [Google Scholar] [CrossRef]
- Luo, J.; He, Z.; Li, O.; Lv, M.; Cai, Y.; Ke, W.; Niu, X.; Zhang, Z. Adipokines in atherosclerosis: unraveling complex roles. Front. Cardiovasc. Med. 2023, 10, 1–20. [Google Scholar] [CrossRef]
- Considine, R.V.; Sinha, M.K.; Heiman, M.L.; Kriauciunas, A.; Stephens, T.W.; Nyce, M.R.; Ohannesian, J.P.; Marco, C.C.; McKee, L.J.; Bauer, T.L.; et al. Serum immunoreactive-leptin concentrations in normal-weight and obese humans. N. Engl. J. Med. 1996, 334, 292–295. [Google Scholar] [CrossRef]
- Orio, F.; Giallauria, F.; Palomba, S.; Cascella, T.; Manguso, F.; Vuolo, L.; Russo, T.; Labella, D.; Savastano, S.; Lombardi, G.; Colao, A. Leptin levels in women with polycystic ovary syndrome. J. Clin. Endocrinol. Metab. 2003, 88, 2619–2623. [Google Scholar] [CrossRef]
- Myers, M.G.; Cowley, M.A.; Münzberg, H. Mechanisms of leptin action and leptin resistance. Annu. Rev. Physiol. 2008, 70, 537–556. [Google Scholar] [CrossRef]
- Panidis, D.K.; Rousso, D.H; Matalliotakis, I.M; Kourtis, A.I.; Stamatopoulos, P.; Koumantakis, E. The influence of long-term administration of conjugated estrogens and antiandrogens to serum leptin levels in women with polycystic ovary syndrome. Gynecol. Endocrinol. 2000, 14, 169–172. [Google Scholar] [CrossRef]
- Nyangasa, M.A; Buck, C.; Kelm, S.; Sheikh, M.A.; Günther, K.; Hebestreit, A. The association between leptin and inflammatory markers with obesity indices in Zanzibari children, adolescents, and adults. Obes Sci Pract. 2020, 7, 71–81. [Google Scholar] [CrossRef]
- Chakrabarti, J. Serum leptin level in women with polycystic ovary syndrome: correlation with adiposity, insulin, and circulating testosterone. Ann Med Health Sci Res. 2013, 3, 191–196. [Google Scholar] [CrossRef]
- Jahromi, B.N.; Dabaghmanesh, M.H.; Parsanezhad, M.E.; Fatehpoor, F. Association of leptin and insulin resistance in PCOS: A case-controlled study. Int J Reprod Biomed. 2017, 15(7), 423–428. [Google Scholar]
- Daghestani, M.H.; Daghestani, M.; Daghistani, M.; El-Mazny, A.; Bjørklund, G.; Chirumbolo, S.; Al Saggaf, S.H.; Warsy, A. A study of ghrelin and leptin levels and their relationship to metabolic profiles in obese and lean Saudi women with polycystic ovary syndrome (PCOS). Lipids Health Dis. 2018, 17, 195. [Google Scholar] [CrossRef]
- Mohana, C.A.; Hasanat, M.A; Rashid, E.U.; Jahan, I.A.; Morshed, M.Sh.; Banu, H; Jahan, Sh. Leptin and Leptin Adiponectin Ratio may be Promising Markers for Polycystic Ovary Syndrome and Cardiovascular Risks. Bangladesh Med Res Counc Bull. 2021, 47, 266–272. [Google Scholar] [CrossRef]
- Song, D.K.; Lee, H.; Sung, Y.-A.; Oh, J.-Y. Triglycerides to high-density lipoprotein cholesterol ratio can predict impaired glucose tolerance in young women with polycystic ovary syndrome. Yonsei Med J 2016, 57, 1404–1411. [Google Scholar] [CrossRef]
- Demirci, H.; Menekse, B.; Ucgul, E.; Onaran, Y.; Bayram, S.M.; Cakal, E. Impact of polycystic ovary syndrome on the atherogenic plasma index: A retrospective analysis. BMC Endocr Disord. 2025, 25, 185. [Google Scholar] [CrossRef]
- Аgarwal, S.K.; Vogel, K.; Weitsman, S.R.; Magoffin, D.A. Leptin antagonizes the insulin-like growth factor-I augmentation of steroidogenesis in granulosa and theca cells of the human ovary. J Clin Endocrinol Metab 1999, 84, 1072–1076. [Google Scholar] [CrossRef]
- Moschos, S.; Chan, J.L.; Mantzoros Ch., S. Leptin and reproduction: a review. Fertility and Sterility 2002, 433–444. [Google Scholar] [CrossRef]
- Toulis, K.A.; Goulis, D.G.; Farmakiotis, D.; Georgopoulos, N.A.; Katsikis, I.; Tarlatzis, B.C. , Papadimas, I.; Panidis, D. et al. Adiponectin levels in women with polycystic ovary syndrome: a systematic review and a meta-analysis. Human Reproduction Update. (Oxf.). 2009, 3, 297–307. [Google Scholar] [CrossRef]
- Liu, Z.; Liang, S.; Que, S.; Zhou, L.; Zheng, S.; Mardinoglu, A. Meta-Analysis of Adiponectin as a Biomarker for the Detection of Metabolic Syndrome. Front. Physiol. 2018, 9, 1238. [Google Scholar] [CrossRef]
- Yoo, H.J.; Choi, K.M. Adipokines as a Novel Link Between Obesity and Atherosclerosis. World J. Diabetes. 2014, 5, 357–363. [Google Scholar] [CrossRef]
- Jeanes, Y.M.; Reeves, S. Metabolic Consequences of Obesity and Insulin Resistance in Polycystic Ovary Syndrome: Diagnostic and Methodological Challenges. Nutr. Res. Rev. 2017, 30, 97–105. [Google Scholar] [CrossRef]
- Obirikorang, C.; Owiredu, W.K.B.A.; Adu-Afram, S.; Acheampong, E.; Asamoah, E.A.; Antwi-Boasiakoh, E.K.; Owiredu, E-W. Assessing the Variability and Predictability of Adipokines (Adiponectin, Leptin, Resistin and Their Ratios) in Non-Obese and Obese Women with Anovulatory Polycystic Ovary Syndrome. BMC Res. Notes 2019, 12, 513. [Google Scholar] [CrossRef]
- Yang, J.; Lin, M.; Tian, X.; Li, C.; Wu, H.; Deng, L.; Li, X.; Chen, X. Serum Adiponectin Level Is Negatively Related to Insulin Resistance in Women with Polycystic Ovary Syndrome. Endocr. Connect. 2025, 14, e240401. [Google Scholar] [CrossRef]
- Patil, S.; Veerabhadra Goud, G.K.; Shivashankar, R.N.; Anusuya, S.K.; Ganesh, V. Association of adiponectin levels with polycystic ovary syndrome among Indian women. J Obstet Gynaecol India. 2022, 72, 36–42. [Google Scholar] [CrossRef]
- Shirazi, F.K.H.; Khodamoradi, Z.; Jeddi, M. Insulin resistance and high molecular weight adiponectin in obese and non-obese patients with Polycystic Ovarian Syndrome (PCOS). BMC Endocr Disord. 2021, 21, 45. [Google Scholar] [CrossRef]
- Barrea, L.; Frias-Toral, E.; Verde, L.; Ceriani, F.; Cucalón, G.; Garcia-Velasquez, E.; Moretti, D.; Savastano, S.; Colao, A.; Muscogiuri, G. PCOS and nutritional approaches: Differences between lean and obese phenotype. Metabolism Open. 2021, 12, 100123. [Google Scholar] [CrossRef]
- Nowak, I.; Ciećwież, S.; Łój, B.; Brodowski, J.; Brodowska, A. Adiponectin gene polymorphism (rs17300539) has no influence on the occurrence of metabolic syndrome in women with polycystic ovary syndrome. Genes. 2021, 12, 1902. [Google Scholar] [CrossRef]
- Chen, X.; Jia, X.; Qiao, J.; Guan, Y.; Kang, J. Adipokines in Reproductive Function: A Link between Obesity and Polycystic Ovary Syndrome. J. Mol. Endocrinol. 2013, 50, 21–37. [Google Scholar] [CrossRef]
- Tosatti, J.A.G.; Alves, M.T.; Cândido, A.L.; Reis, F.M.; Araújo, V.E.; Gomes, K.B. Influence of n-3 Fatty Acid Supplementation on Inflammatory and Oxidative Stress Markers in Patients with Polycystic Ovary Syndrome: A Systematic Review and Meta-Analysis. Br. J. Nutr. 2021, 125, 657–668. [Google Scholar] [CrossRef]
- Kowalska, I.; Straczkowski, M.; Nikolajuk, A.; Adamska, A.; Karczewska-Kupczewska, M.; Otziomek, E.; Wolczynski, S.; Gorska, M. Serum visfatin in relation to insulin resistance and markers of hyperandrogenism in lean and obese women with polycystic ovary syndrome. Human Reproduction 2007, 22, 1824–1829. [Google Scholar] [CrossRef]
- Skrzyńska, K.; Skrzyński, M.; Kwiatkowska, M.; Kwiatkowska, E.; Zawisza, K.; Skrzyński, J.; Skrzyński, J. Visfatin and VEGF levels are not increased in adolescent girls with polycystic ovary syndrome. Journal of Pediatric and Adolescent Gynecology 2024, 37, 42–47. [Google Scholar] [CrossRef]
- Sun, Y.; Wu, Z.; Wei, L.; Liu, C.; Zhu, S.; Tang, S. High-visfatin levels in women with polycystic ovary syndrome: evidence from a meta-analysis. Gynecol Endocrinol. 2015, 31: 808–814. [CrossRef]
- El-Said, M.H.; El-Said, N.H.; El-Ghaffar, M.N.A. Plasma Visfatin Concentrations in Polycystic Ovary Syndrome: Relationships with Indices of Insulin Resistance and Hyperandrogenism. Med. J. Cairo Univ. 2009, 77, 1–7. [Google Scholar]
- Gen, R.; Akbay, E.; Muslu, N.; Sezer, K.; Cayan, F. Plasma Visfatin Level in Lean Women with PCOS: Relation to Proinflammatory Markers and Insulin Resistance. Gynecol. Endocrinol. 2009, 25, 241–245. [Google Scholar] [CrossRef]
- Estienne, A.; Bongrani, A.; Reverchon, M.; Ramé, C.; Ducluzeau, P.-H.; Froment, P.; Dupont, J. Involvement of Novel Adipokines, Chemerin, Visfatin, Resistin and Apelin in Reproductive Functions in Normal and Pathological Conditions in Humans and Animal Models. Int. J. Mol. Sci. 2019, 20, 4431. [Google Scholar] [CrossRef]
- Bril, F.; Ezeh, U.; Amiri, M.; Hatoum, S.; Pace, L.; Chen, Y.-H.; Bertrand, F.; Gower, B.; Azziz, R. Adipose Tissue Dysfunction in Polycystic Ovary Syndrome. J. Clin. Endocrinol. Metab. 2023, 109, 10–24. [Google Scholar] [CrossRef]
- Lewandowski, K.C.; Szosland, K.; O'Callaghan, C.; Tan, B.K.; Randeva, H.S.; Lewinski, A. Adiponectin and resistin serum levels in women with polycystic ovary syndrome during oral glucose tolerance test: a significant reciprocal correlation between adiponectin and resistin independent of insulin resistance indices. Mol Genet Metab. 2005, 85, 61–69. [Google Scholar] [CrossRef]
- Yilmaz, M.; Bukan, N.; Demirci, H.; Oztürk, C.; Kan, E.; Ayvaz, G.; Arslan, M. Serum resistin and adiponectin levels in women with polycystic ovary syndrome. Gynecol. Endocrinol. 2009, 25, 246–252. [Google Scholar] [CrossRef]
- Benomar, Y.; Gertler, A.; De Lacy, P.; Crépin, D.; Ould Hamouda, H.; Riffault, L.; Taouis, M. Central Resistin Overexposure Induces Insulin Resistance Through Toll-Like Receptor 4. Diabetes 2012, 62, 102–114. [Google Scholar] [CrossRef]
- Deng, H.; Chen, Y.; Xing, J.; Zhang, N.; Xu, L. Systematic Low-Grade Chronic Inflammation and Intrinsic Mechanisms in Polycystic Ovary Syndrome. Front. Immunol. 2024, 15, 1470283. [Google Scholar] [CrossRef]
- Saadati, S.; Mason, T.; Godini, R.; Vanky, E.; Teede, H.; Mousa, A. Metformin Use in Women with Polycystic Ovary Syndrome (PCOS): Opportunities, Benefits, and Clinical Challenges. Diabetes Obes. Metab. 2025, 27, 31–47. [Google Scholar] [CrossRef]
- Han, Y.; Li, Y.; He, B. GLP-1 Receptor Agonists versus Metformin in PCOS: A Systematic Review and Meta-Analysis. Reprod. Biomed. Online 2019, 39, 332–342. [Google Scholar] [CrossRef]
- Zhang, J.-Q.; Xing, C.; He, B. Short Period-Administration of Myo-Inositol and Metformin on Hormonal and Glycolipid Profiles in Patients with Polycystic Ovary Syndrome: A Systematic Review and Updated Meta-Analysis of Randomized Controlled Trials. Eur. Rev. Med. Pharmacol. Sci. 2022, 26, 1792–1802. [Google Scholar] [CrossRef]
- Gautam, R.; Maan, P.; Jyoti, A.; Kumar, A.; Malhotra, N.; Arora, T. The Role of Lifestyle Interventions in PCOS Management: A Systematic Review. Nutrients 2025, 17, 310. [Google Scholar] [CrossRef]
- Cowan, S.; Lim, S.; Alycia, C.; Pirotta, S.; Thomson, R.; Gibson-Helm, M.; Blackmore, R.; Naderpoor, N.; Bennett, C.; Ee, C.; Rao,V. ; Mousa, A.; Alesi, S.; Moran, L. Lifestyle Management in Polycystic Ovary Syndrome—Beyond Diet and Physical Activity. BMC Endocr. Disord. 2023, 23, 14. [Google Scholar] [CrossRef]
- Geloneze, B.; Vasques, A.C.; Stabe, C.F.; Pareja, J.C.; Rosado, L.E.; Queiroz, E.C.; Tambascia, M.A. HOMA1-IR and HOMA2-IR indexes in identifying insulin resistance and metabolic syndrome: Brazilian Metabolic Syndrome Study (BRAMS). Arq Bras Endocrinol Metabol. 2009, 53, 281–287. [Google Scholar] [CrossRef]
Figure 1.
Glucose levels at baseline and during OGTT in IR and non–IR women with PCOS. *** – p< 0.001.
Figure 1.
Glucose levels at baseline and during OGTT in IR and non–IR women with PCOS. *** – p< 0.001.
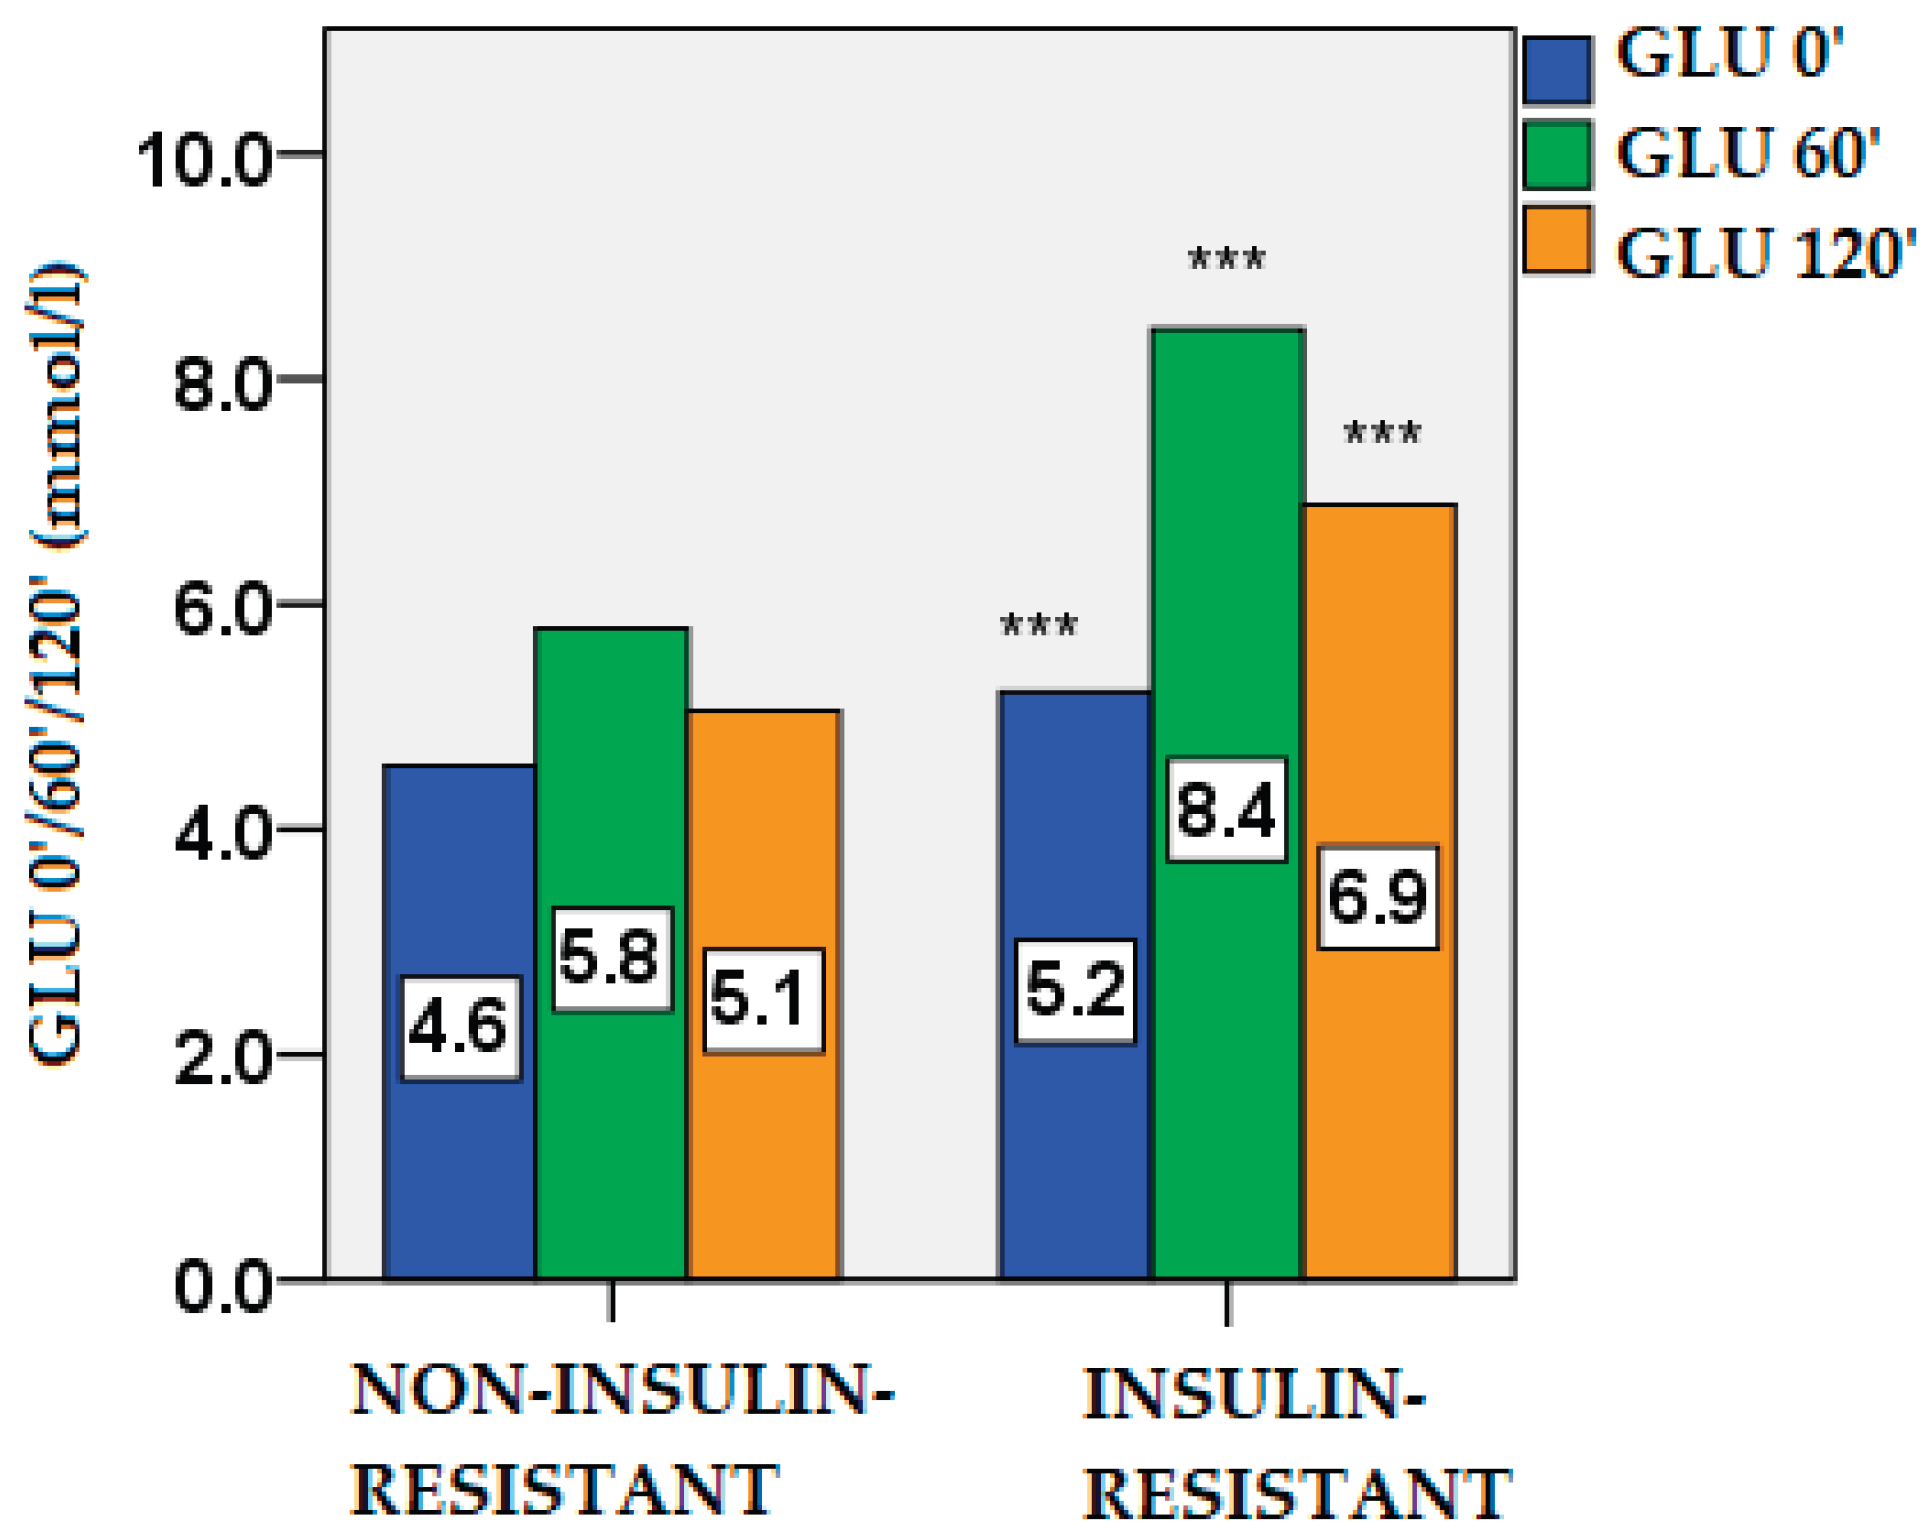
Figure 2.
Insulin levels at baseline and during OGTT in IR and non–IR PCOS women. *** – p < 0.001.
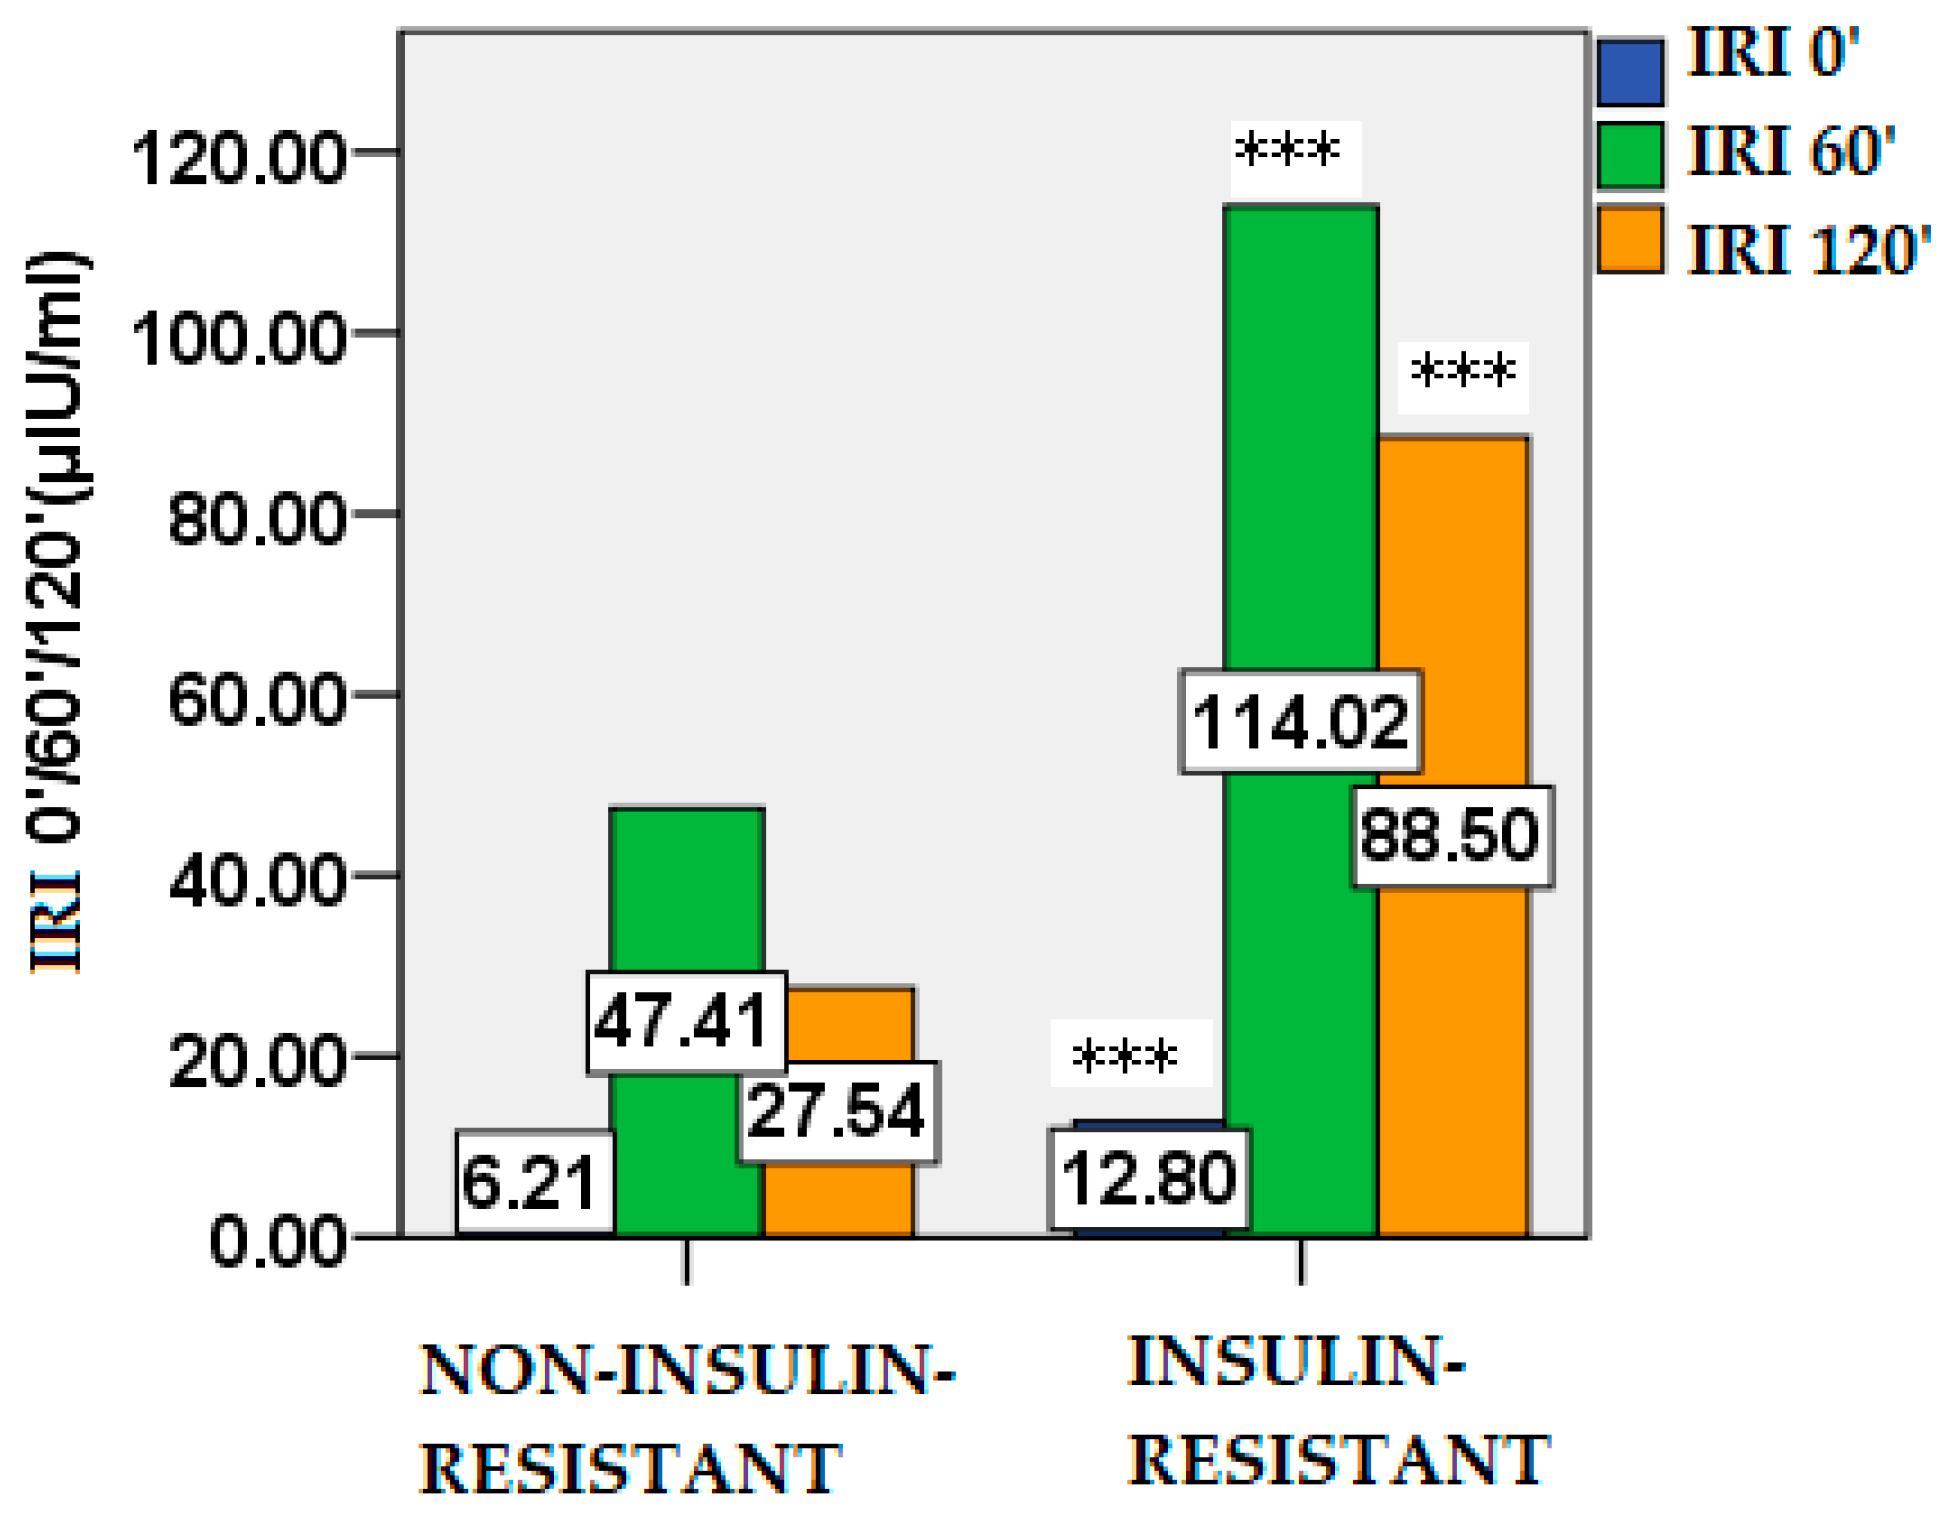
Figure 3.
HOMA-IR values in IR and non–IR women with PCOS. *** – p < 0.001.
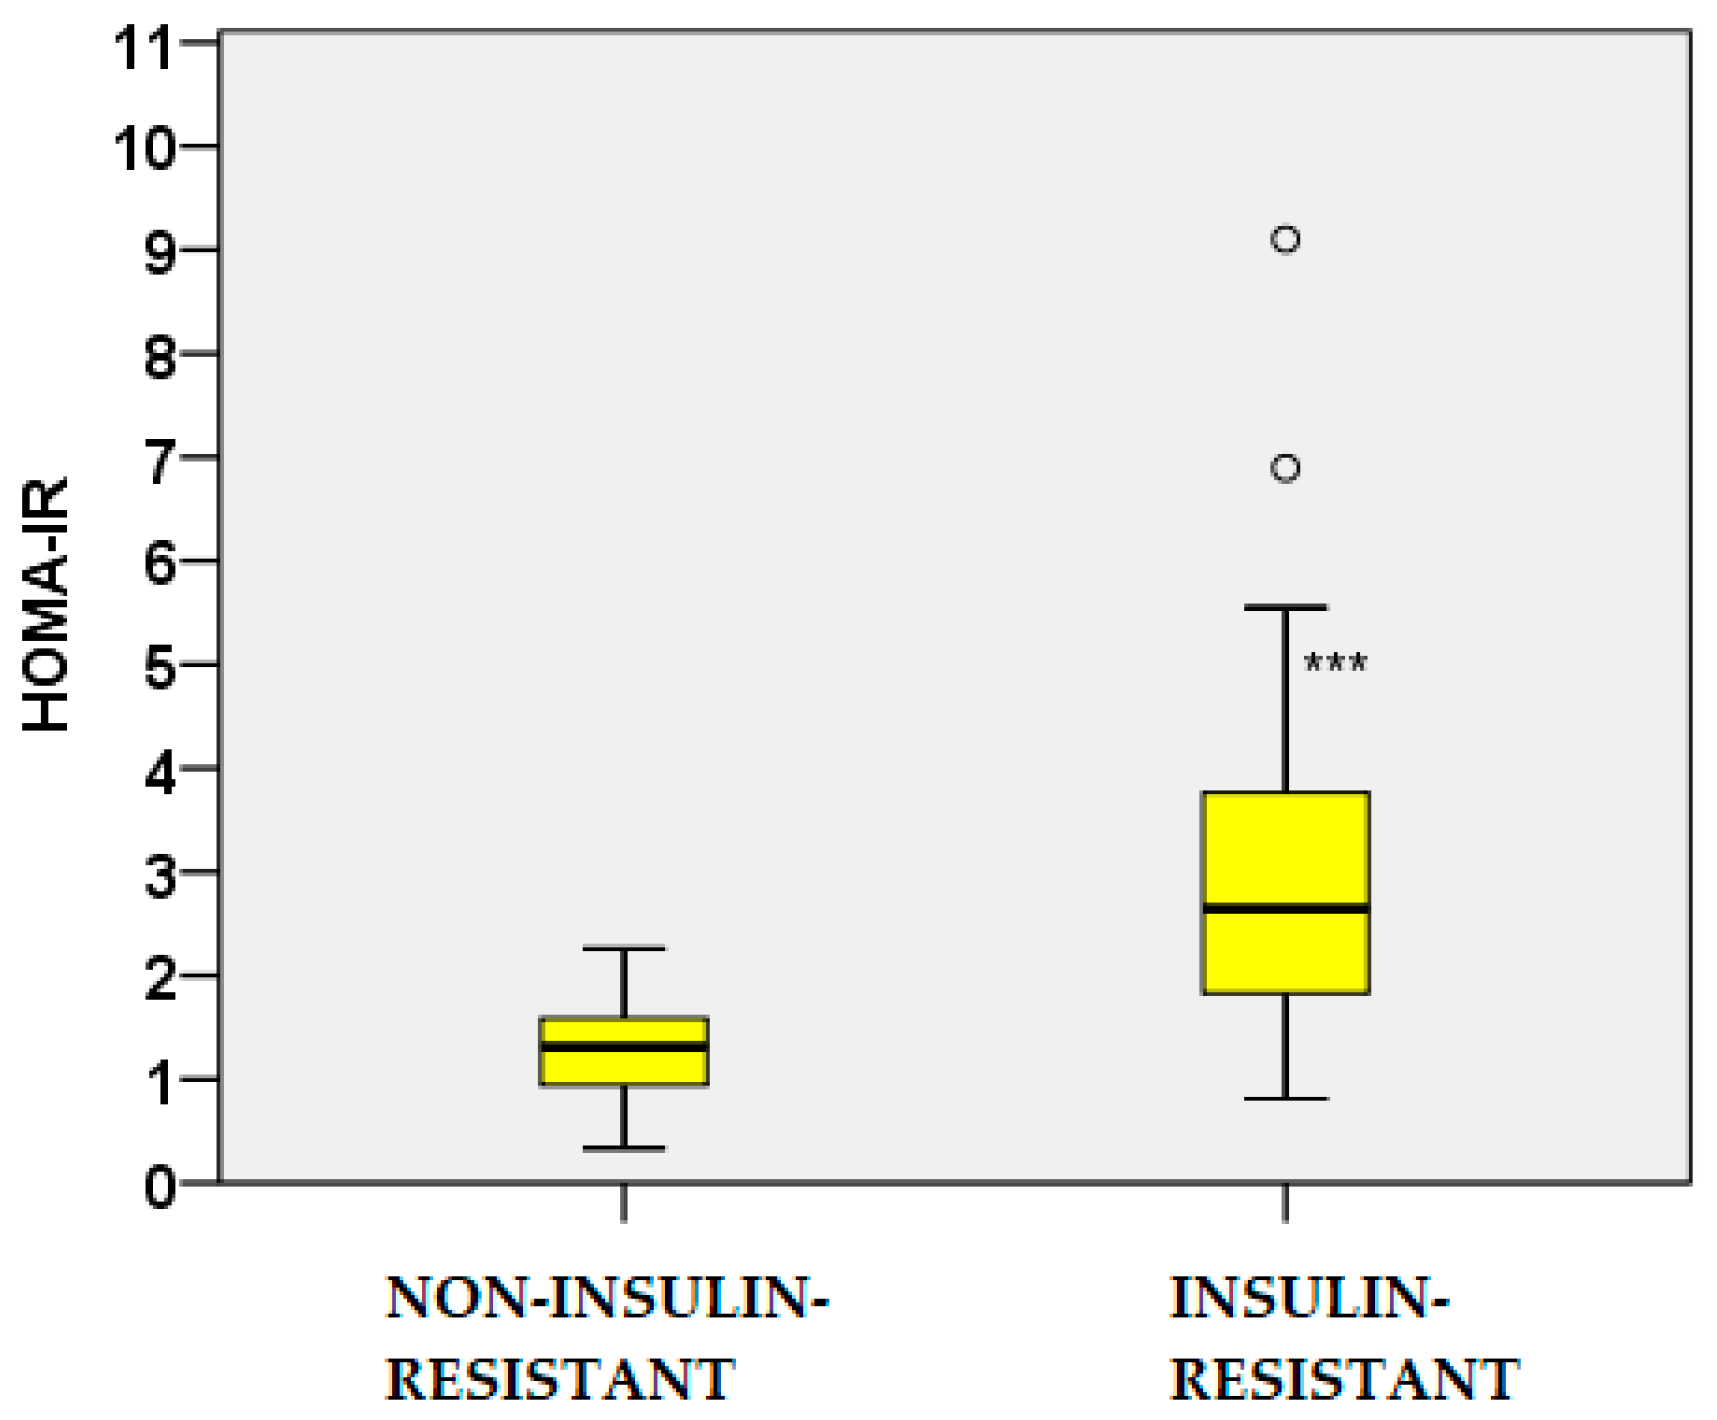
Figure 4.
QUICKI values in IR and non–IR women with PCOS. *** – p < 0.001.
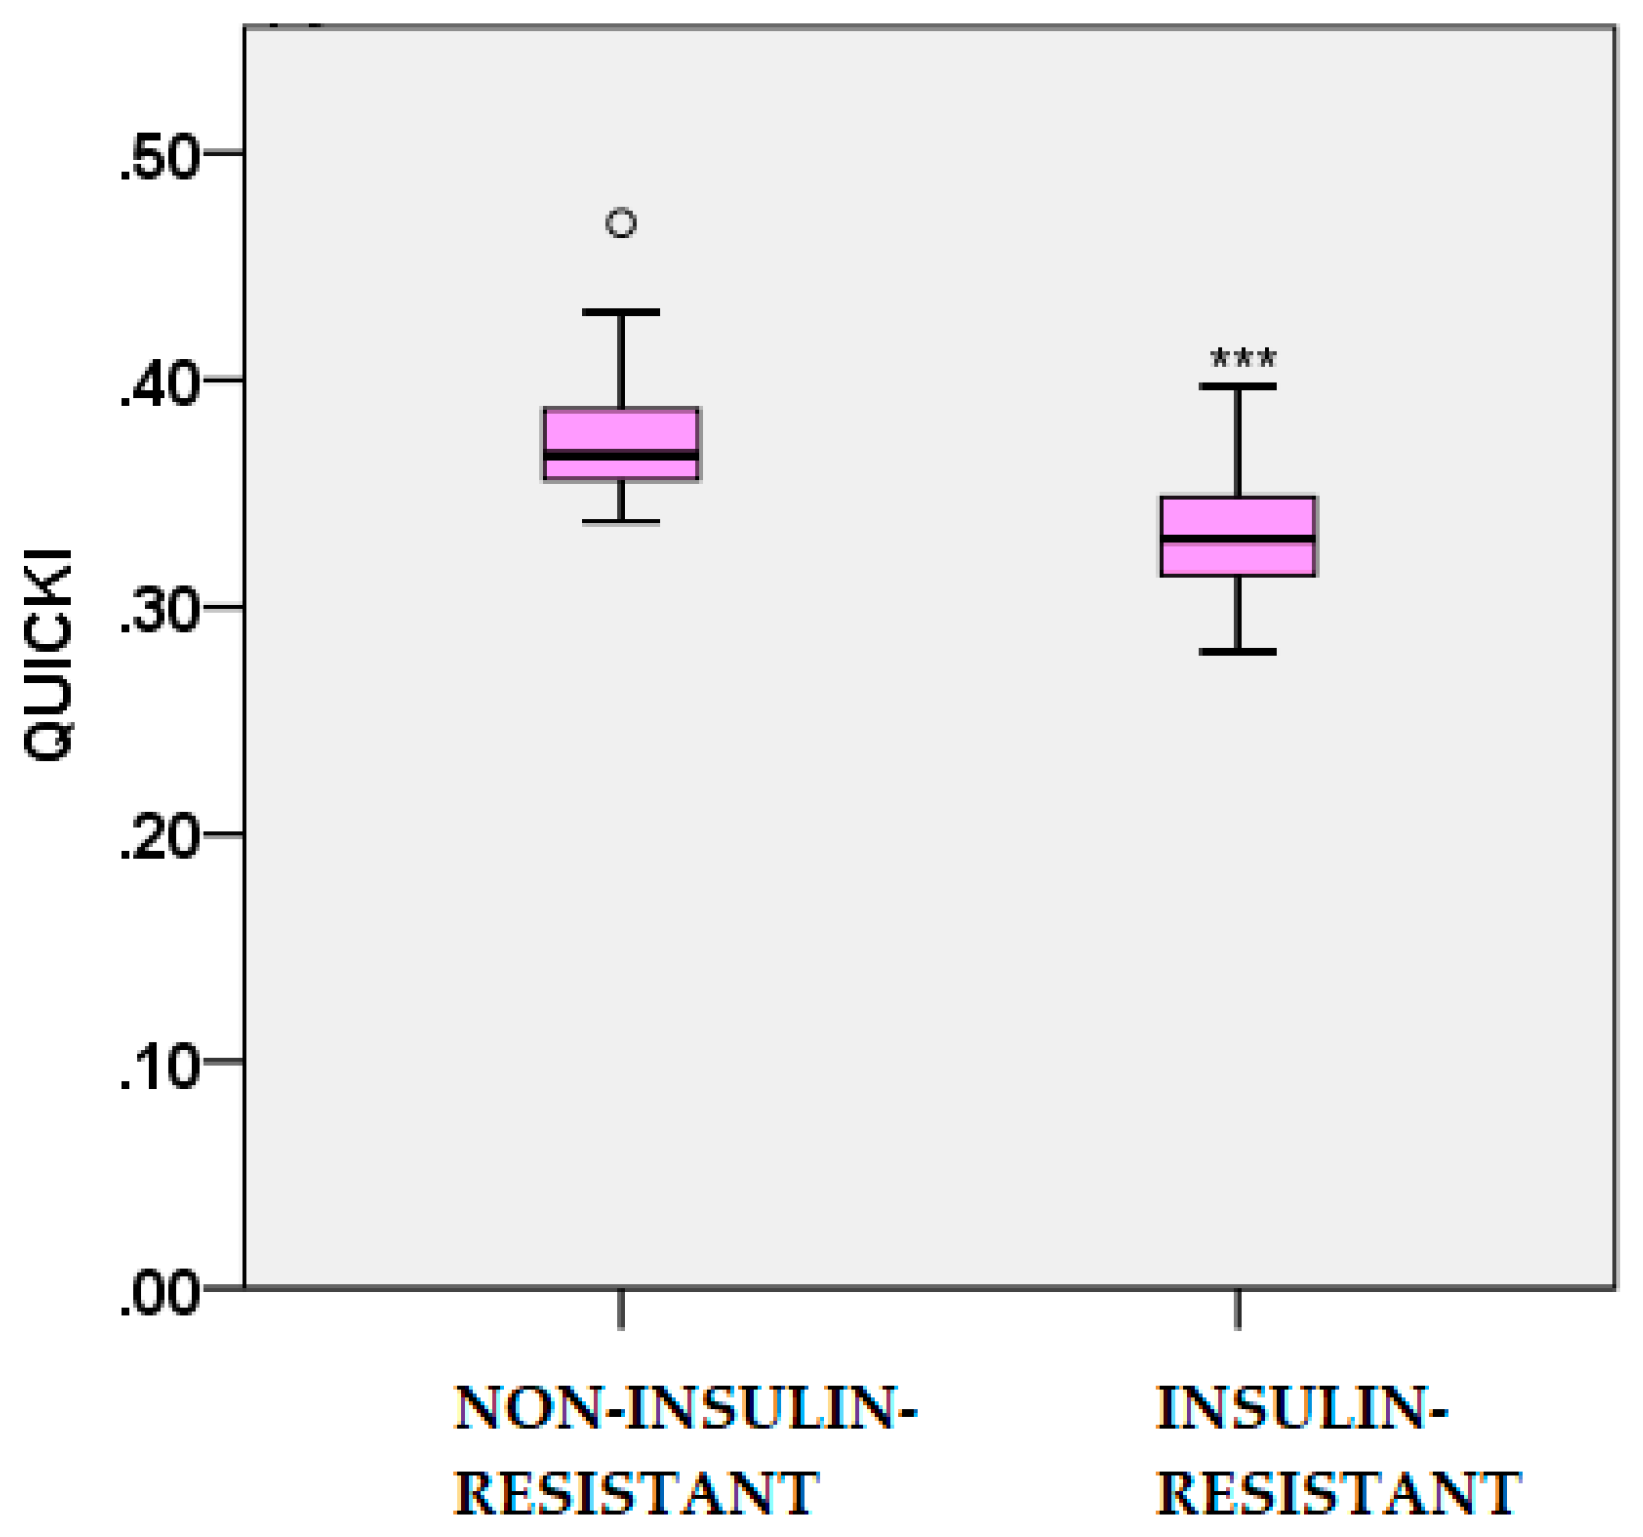
Figure 5.
MATSUDA index values in IR and non–IR women with PCOS. *** – p < 0.001.
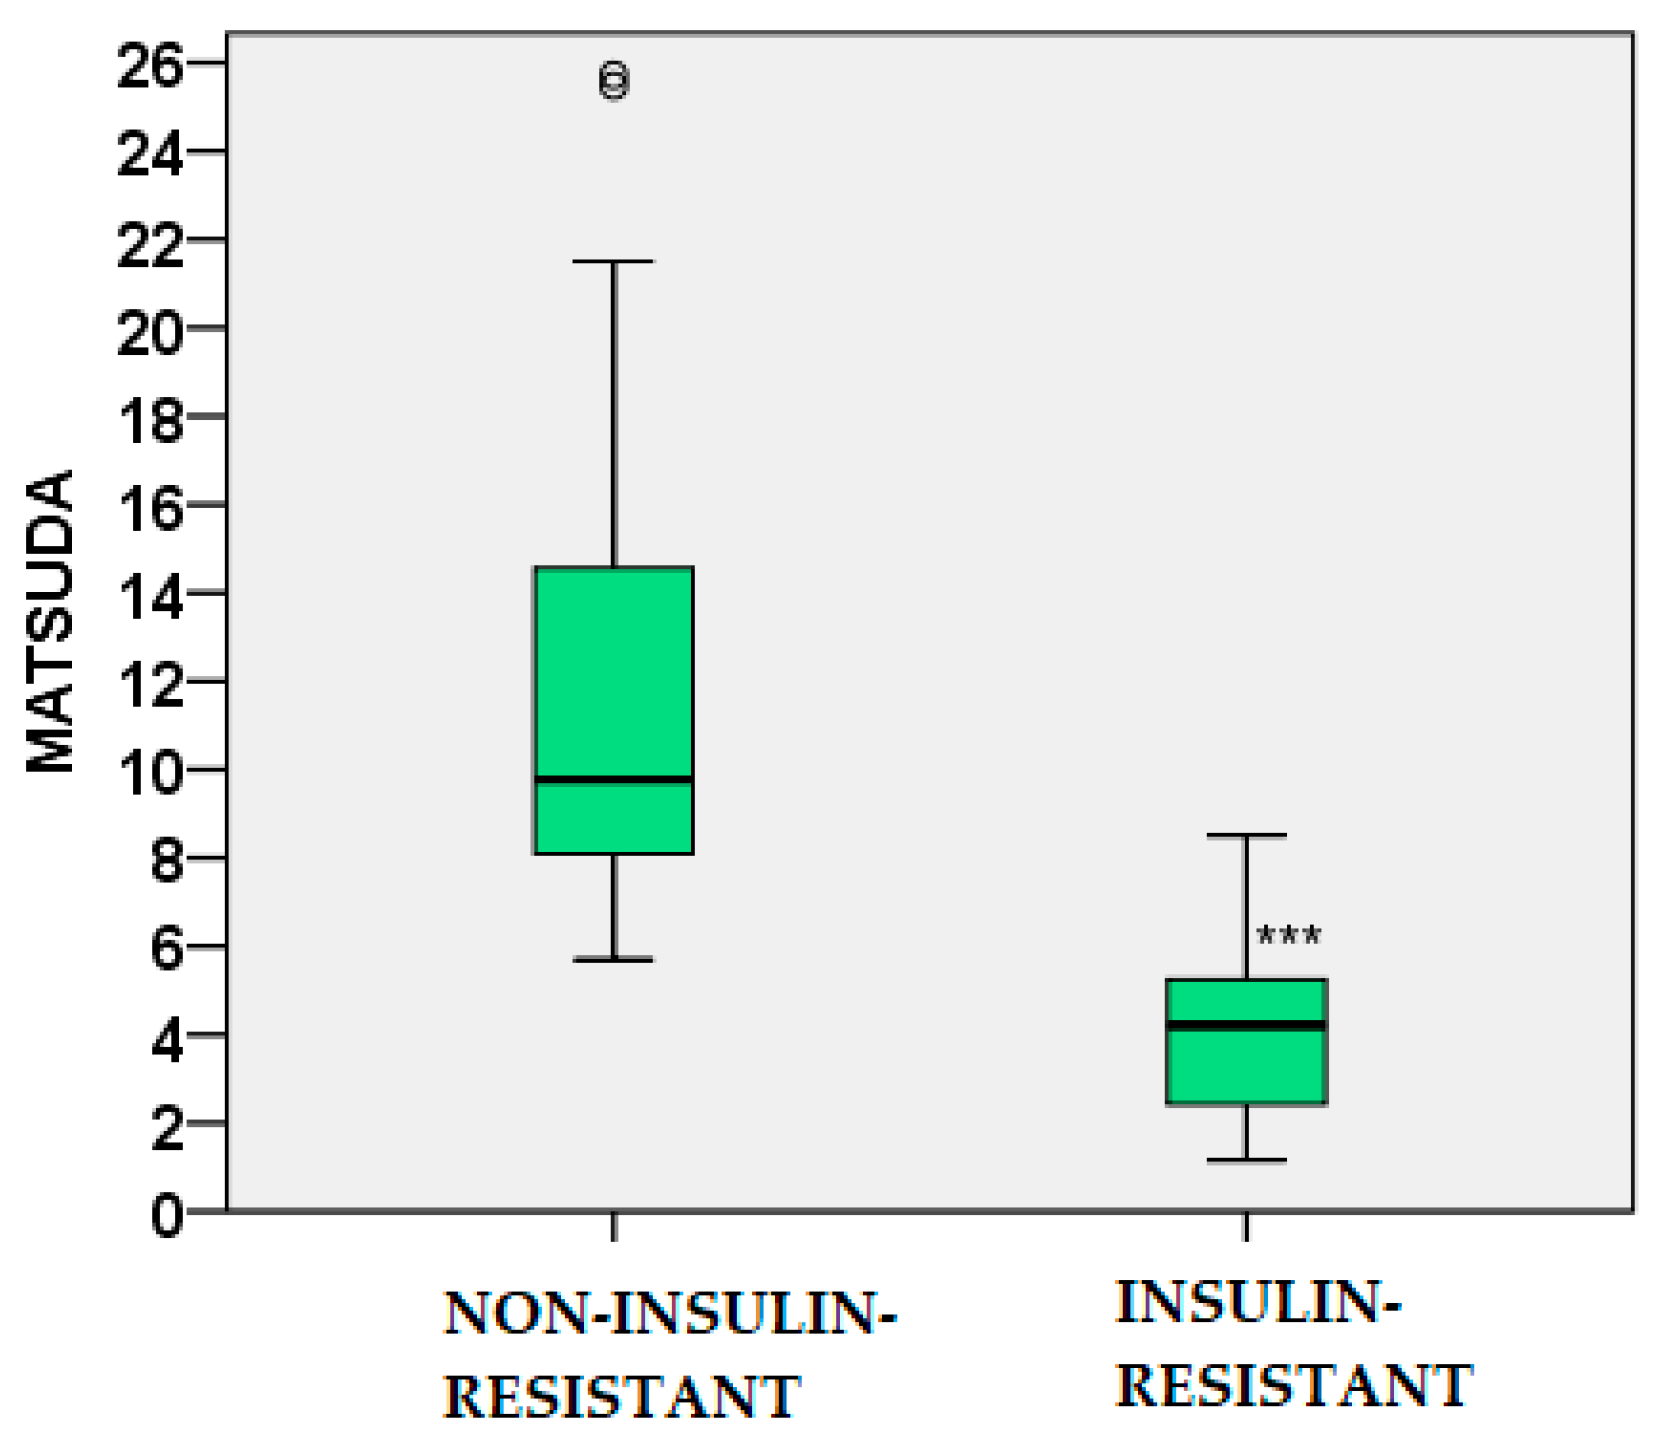
Figure 6.
Scatter plot showing the positive correlation between leptin levels and body weight in the study population.
Figure 6.
Scatter plot showing the positive correlation between leptin levels and body weight in the study population.
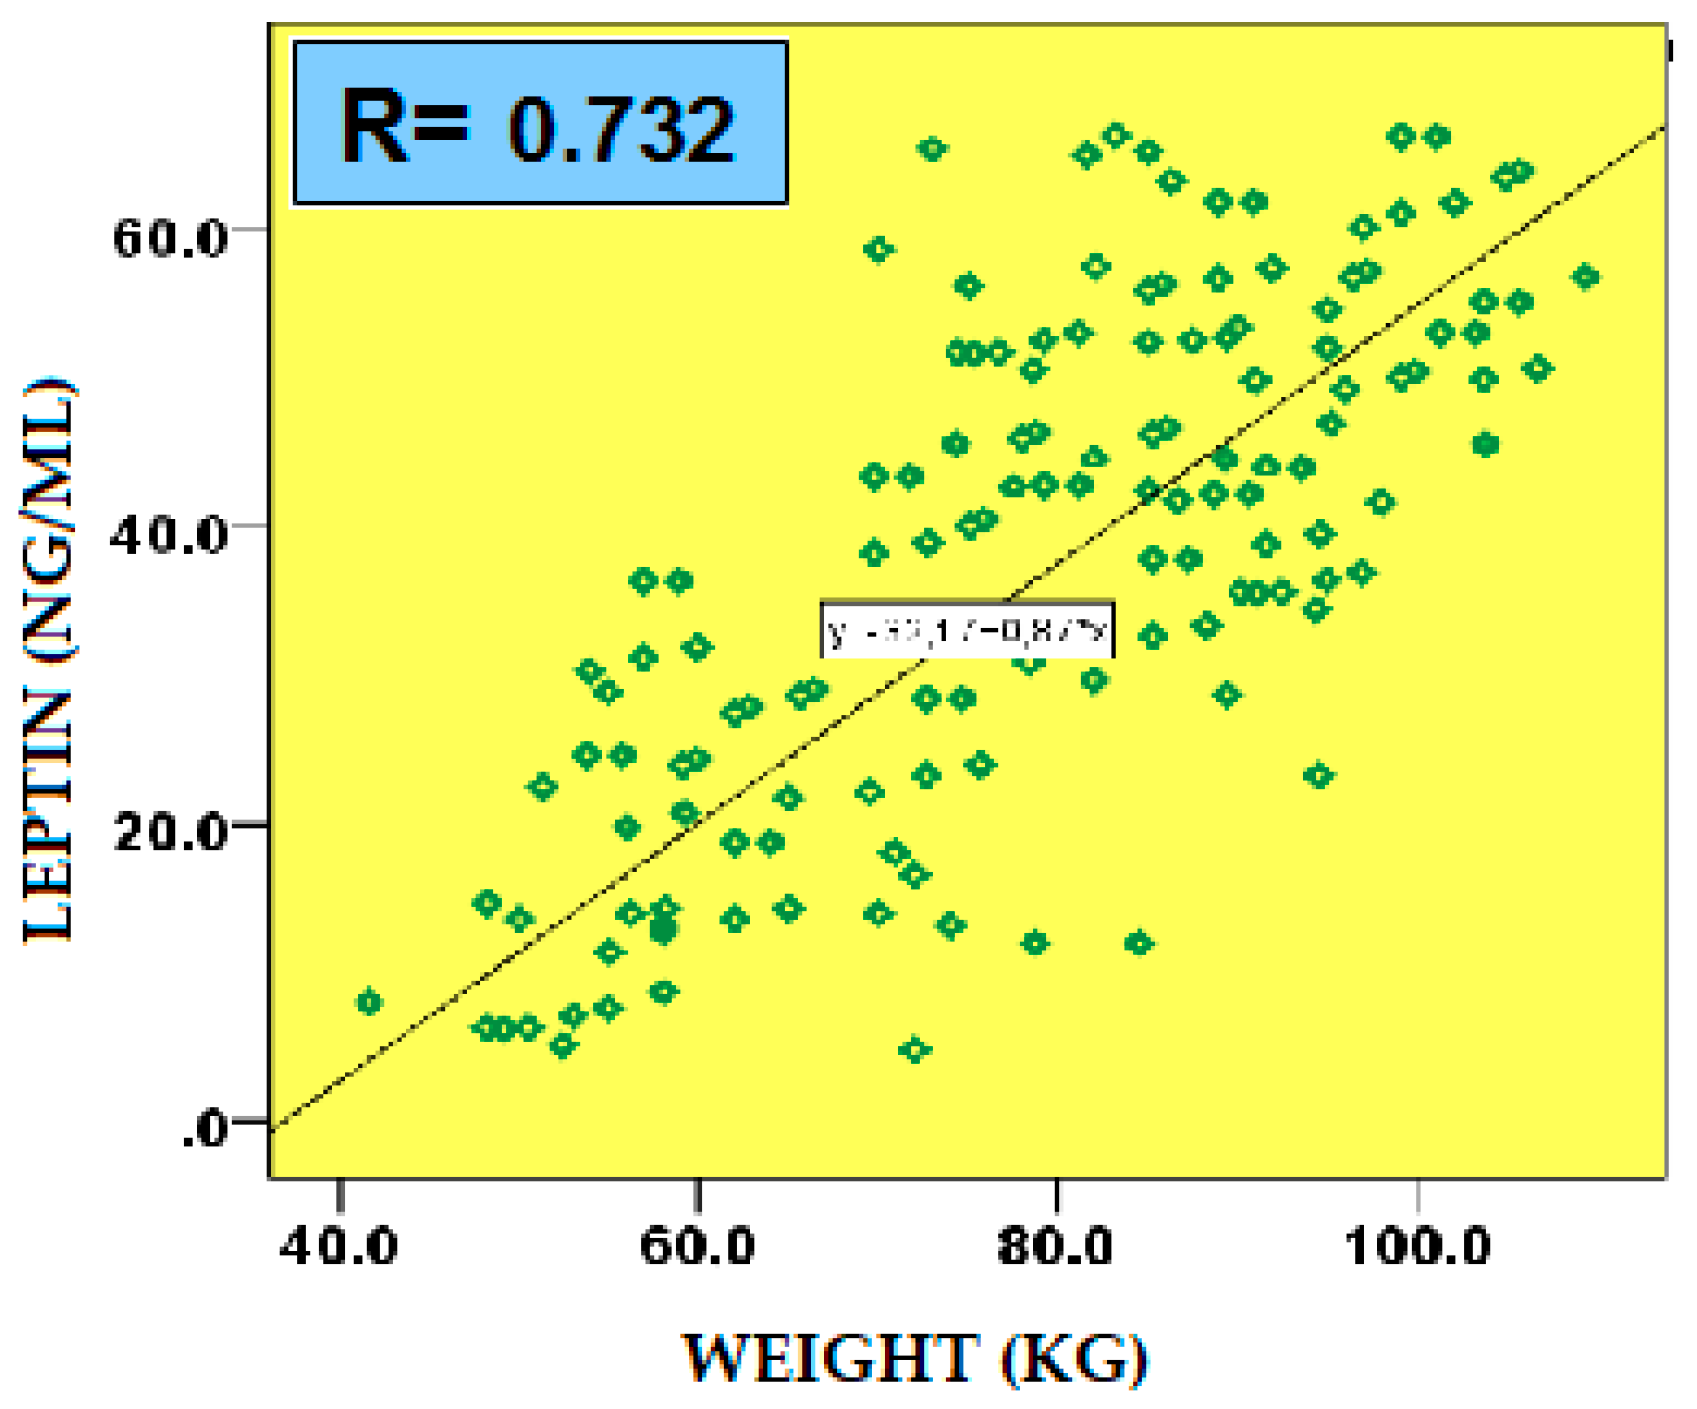
Figure 7.
Scatter plot showing the positive correlation between leptin levels and HOMA-IR in the study population.
Figure 7.
Scatter plot showing the positive correlation between leptin levels and HOMA-IR in the study population.
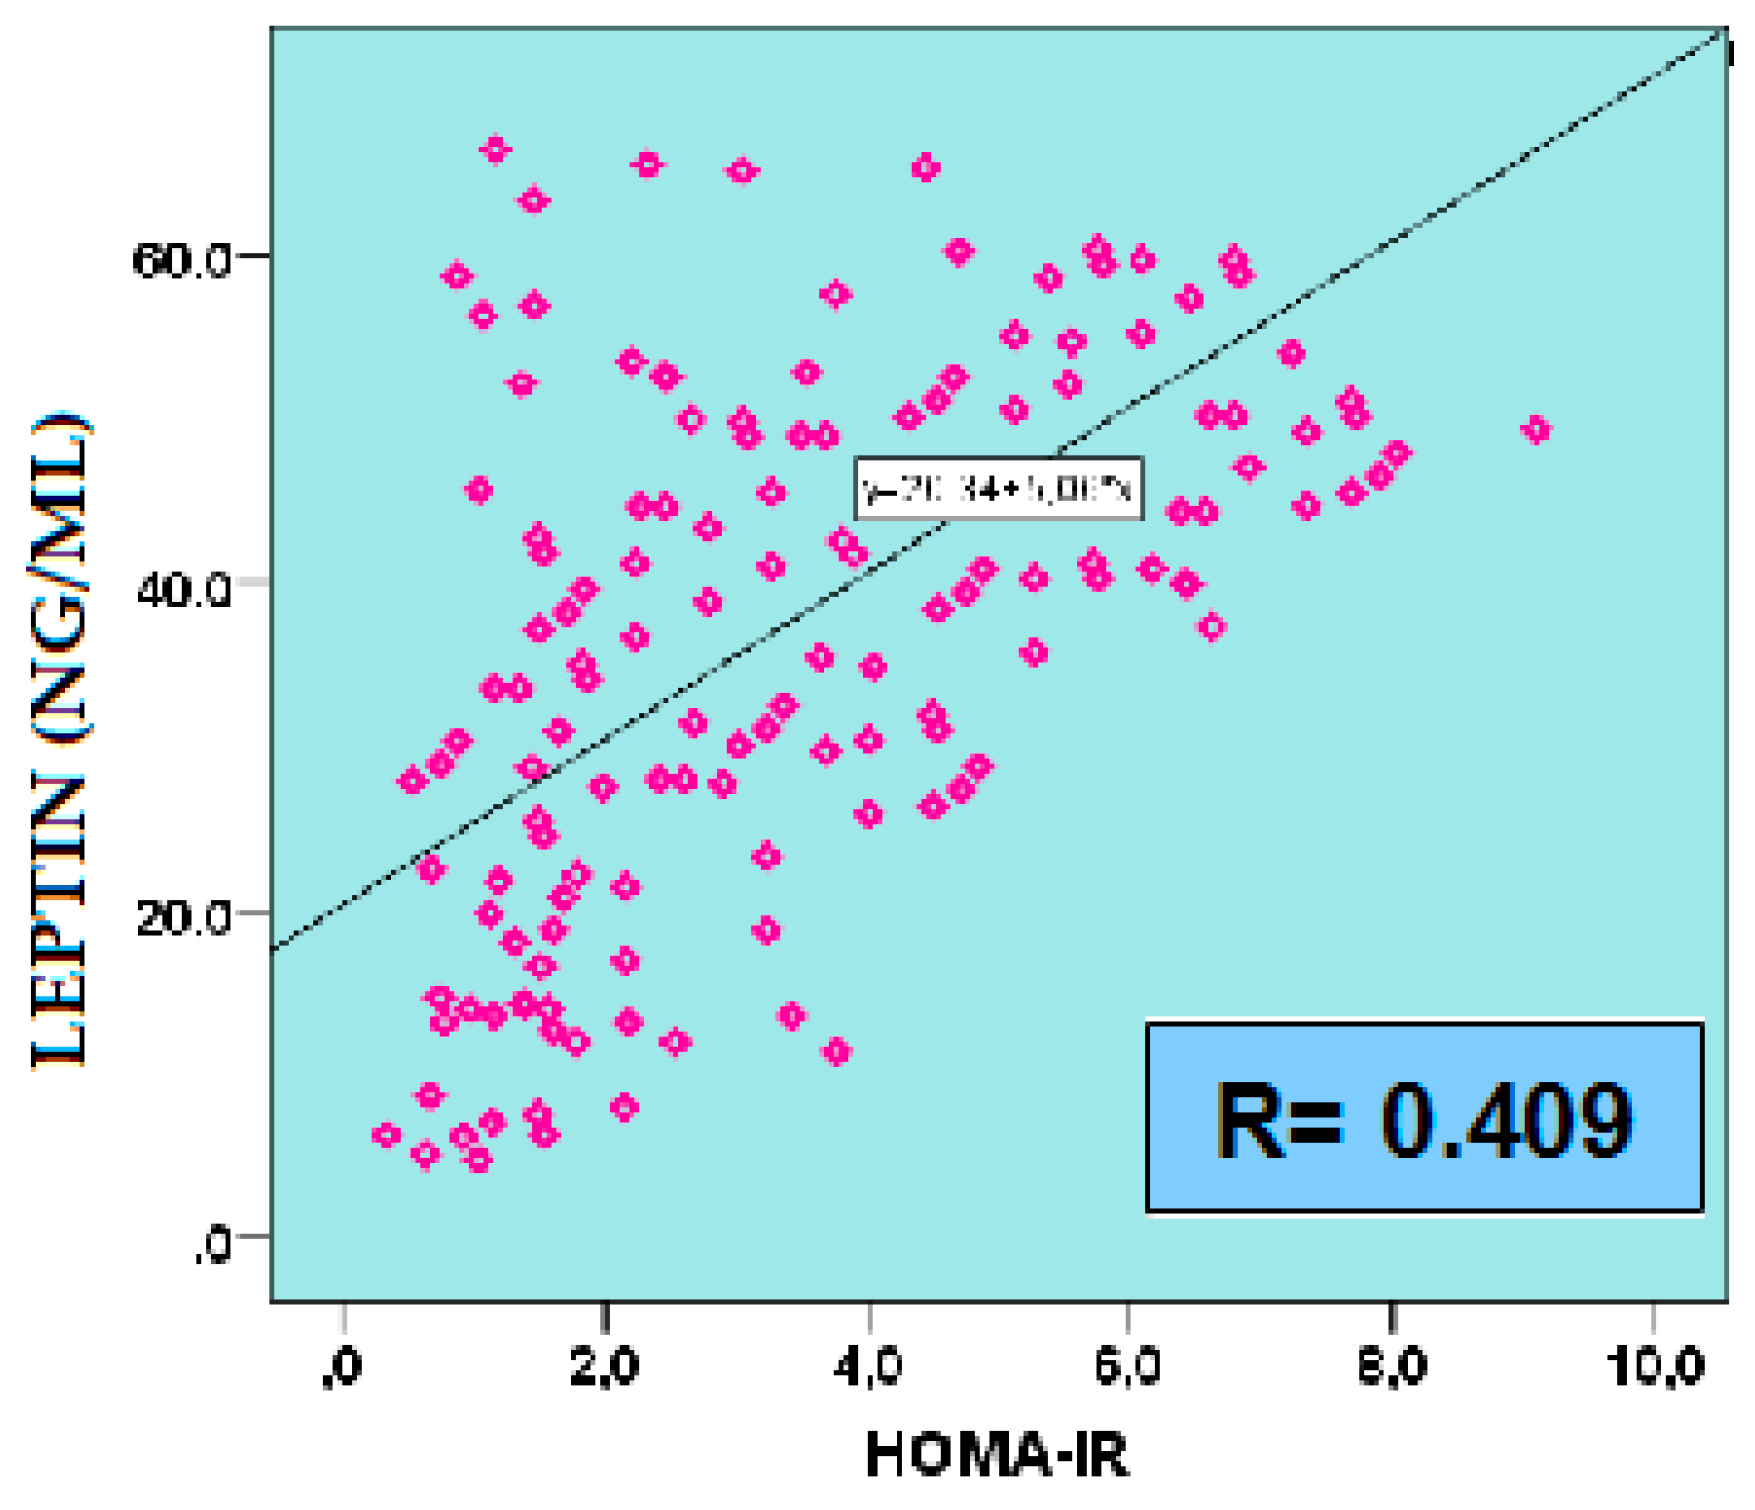
Figure 8.
Scatter plot showing the negative correlation between leptin levels and QUICKI in the study population.
Figure 8.
Scatter plot showing the negative correlation between leptin levels and QUICKI in the study population.
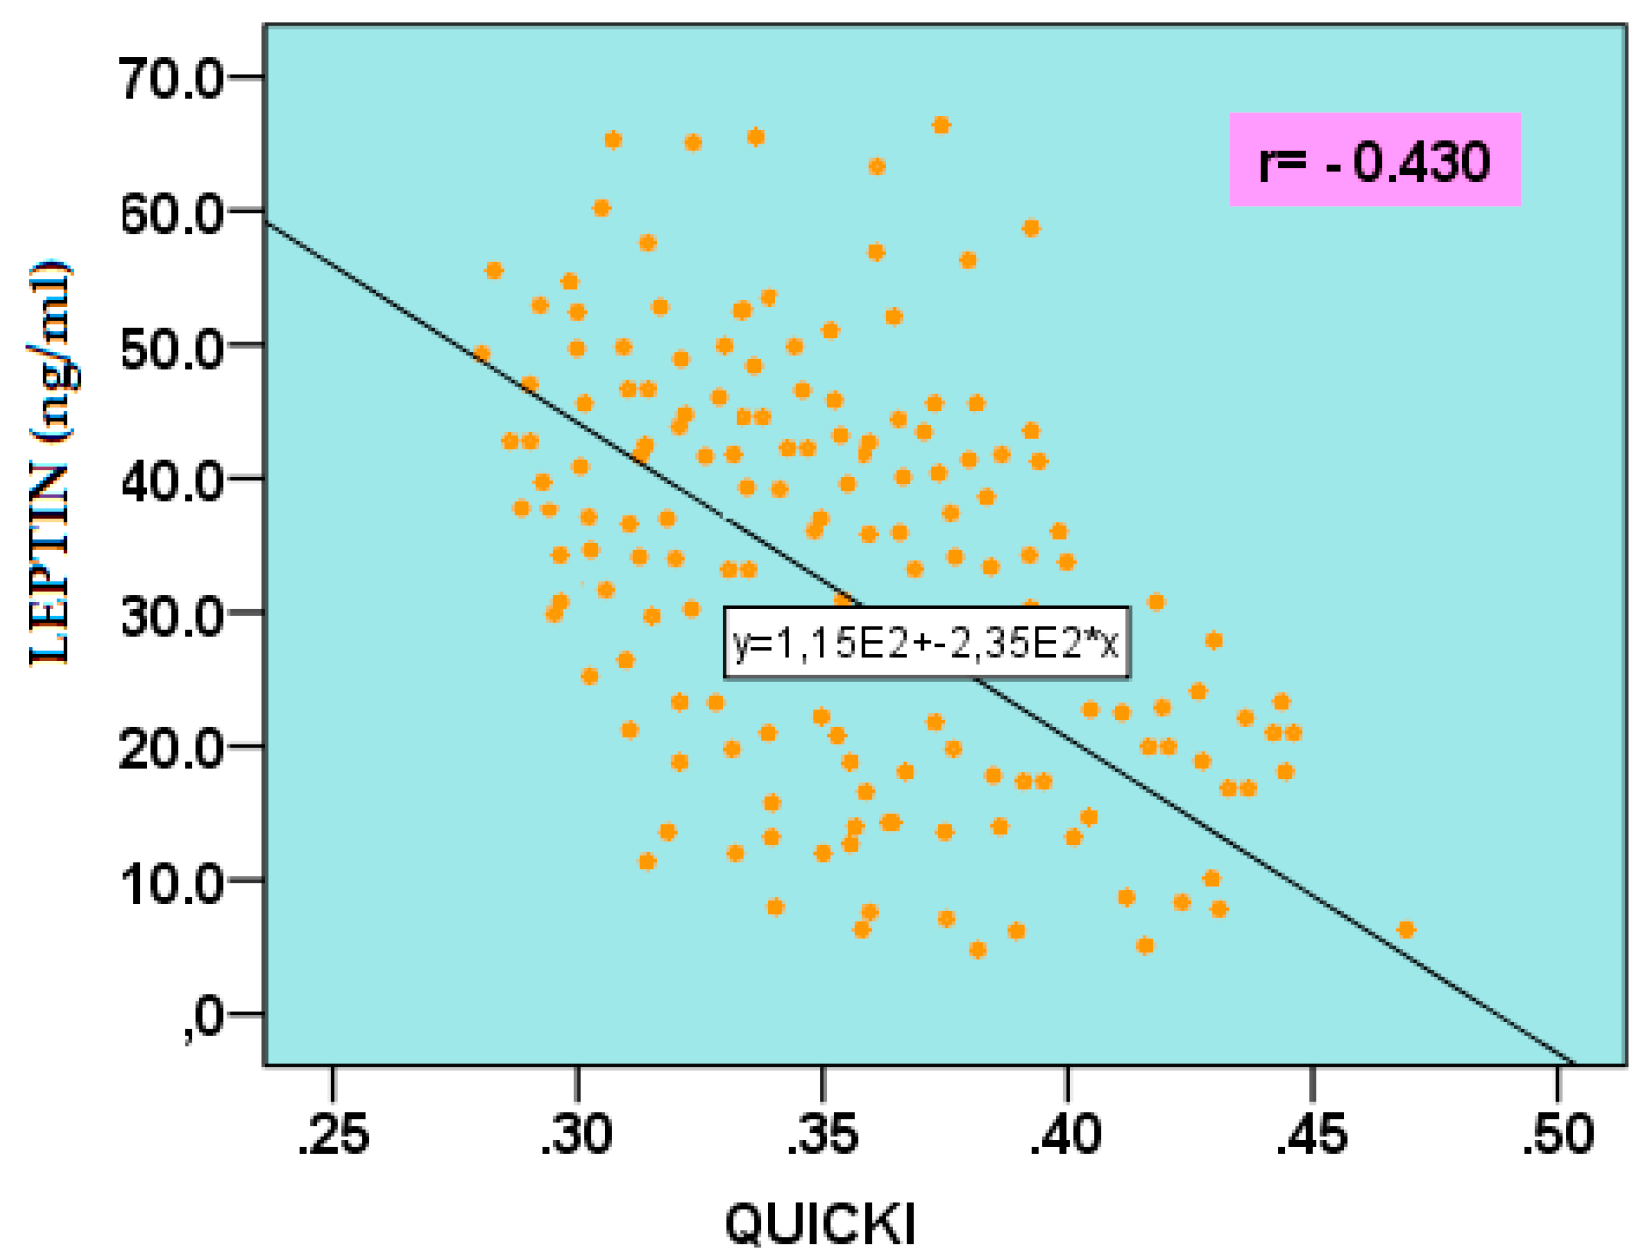
Figure 9.
Scatter plot showing the negative correlation between leptin levels and MATSUDA in the study population.
Figure 9.
Scatter plot showing the negative correlation between leptin levels and MATSUDA in the study population.
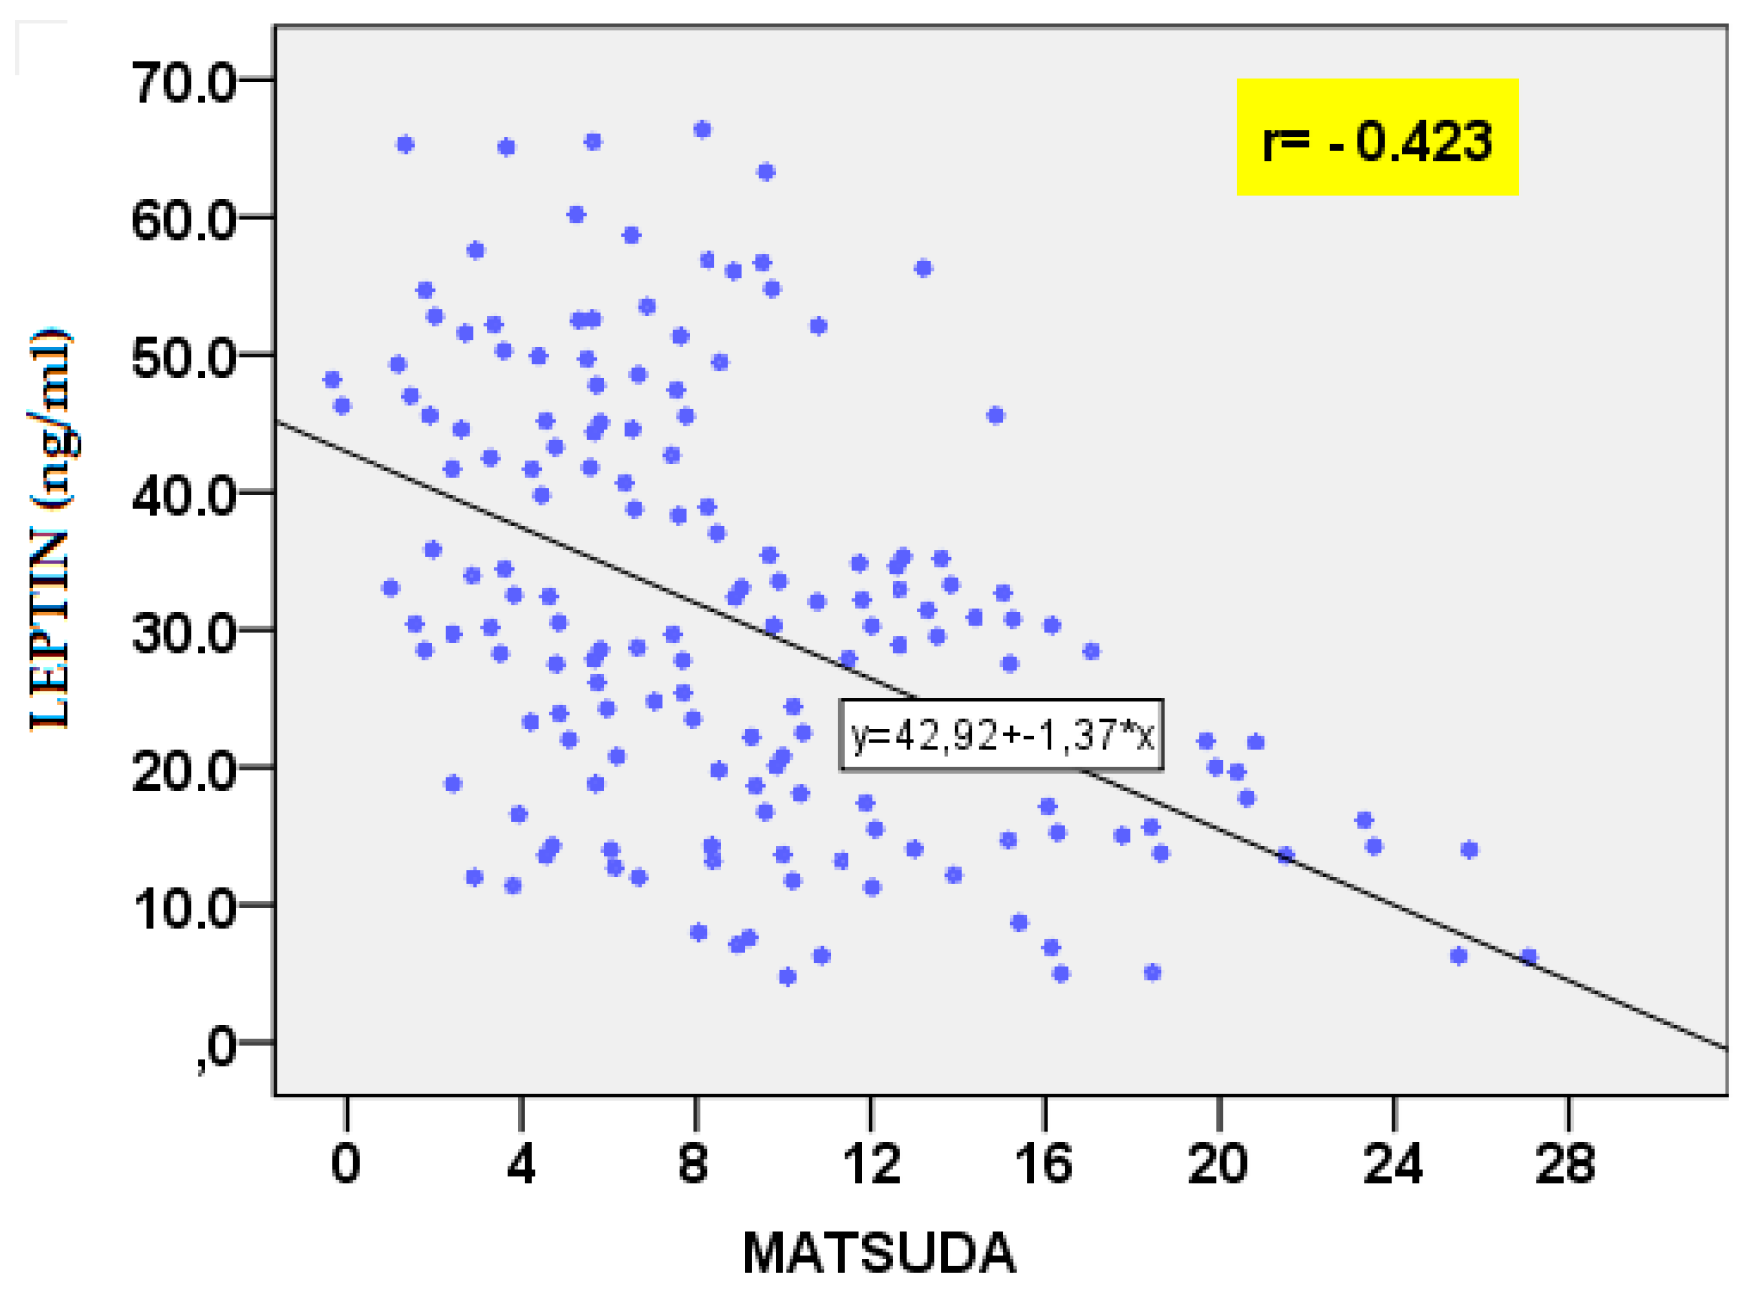

Table 1.
Age and anthropometric parameters in the two studied groups of PCOS women.
| Parameters | Non-IR PCOS (n=74) |
IR PCOS (n=76) |
|---|---|---|
| Age (years) | 24.60 ± 4.53 | 24.03 ± 5.86 NS |
| Height (m) | 1.67 ± 0.08 | 1.66 ± 0.05 NS |
| Weight (kg) | 67.92 ± 15.94 | 78.08 ± 16.00 ** |
| BMI (kg/m2) | 24.31 ± 5.28 | 28.40 ± 5.56 ** |
| Waist (cm) | 79.16 ± 13.45 | 89.21 ± 16.17 ** |
| Hip (cm) WHR |
99.49 ± 10.75 0.79 ± 0.08 |
107.82 ± 10.68 ** 0.82 ± 0.10 NS |
NS – not significant, (p > 0.05); ** – p < 0.01.
Table 2.
Lipid profile parameters and calculated atherogenic indices in the two studied groups of PCOS women.
Table 2.
Lipid profile parameters and calculated atherogenic indices in the two studied groups of PCOS women.
| Parameters | Non-IR PCOS (n=74) |
IR PCOS (n=76) |
|---|---|---|
| TC (mmol/l) | 4.48 ± 0.93 | 4.46 ± 0.86 NS |
| HDL-C (mmol/l) | 1.37 ± 0.49 | 1.23 ± 0.28 NS |
| LDL-C (mmol/l) | 2.78 ± 0.92 | 2.67 ± 0.84 NS |
| TG (mmol/l) | 0.80 ± 0.30 | 1.22 ± 0.60 *** |
| AIP LDL-C/HDL-C TG/HDL-C |
-0.09 ± 0.14 2.23 ± 0.92 0.67 ± 0.34 |
0.03 ± 0.19 *** 2.32 ± 0.92 NS 1.06 ± 0.60 ** |
NS – not significant, (p > 0.05); ** – p < 0.01; *** – p < 0.001.
Table 3.
Adipokines in the two studied groups of PCOS women.
| Adipokines | Non-IR PCOS (n=74) |
IR PCOS (n=76) |
|---|---|---|
| Visfatin (ng/ml) | 7.23 ± 3.76 | 14.05 ± 11.03 * |
| Leptin (ng/ml) | 24.90 ± 18.37 | 39.56 ± 18.54** |
| Adiponectin (mcg/ml) | 14.70 ± 7.74 | 9.19 ± 4.53 ** |
| Log10 Resistin (ng/ml) | 0.67 ± 0.20 | 0.81 ± 0.23 * |
* – p < 0.05; ** – p < 0.01.
Table 4.
Correlations between adiponectin and anthropometric, metabolic, and lipid parameters.
| Parameter | r | p |
| Weight | -0.385 | 0.001 |
| BMI | -0.361 | 0.003 |
| Waist | -0.411 | 0.001 |
| Hip | -0.341 | 0.005 |
| WHR | -0.317 | 0.009 |
| GLU 60’ IRI 0’ IRI 60’ IRI 120’ HOMA-IR MATSUDA QUICKI TG TG/HDL-C AIP |
-0.291 -0.332 -0.288 -0.259 -0.308 0.408 0.395 -0.409 -0.363 -0.422 |
0.025 0.006 0.027 0.047 0.012 0.001 0.001 0.01 0.003 <0.001 |
Disclaimer/Publisher’s Note: The statements, opinions and data contained in all publications are solely those of the individual author(s) and contributor(s) and not of MDPI and/or the editor(s). MDPI and/or the editor(s) disclaim responsibility for any injury to people or property resulting from any ideas, methods, instructions or products referred to in the content. |
© 2025 by the authors. Licensee MDPI, Basel, Switzerland. This article is an open access article distributed under the terms and conditions of the Creative Commons Attribution (CC BY) license (http://creativecommons.org/licenses/by/4.0/).
Copyright: This open access article is published under a Creative Commons CC BY 4.0 license, which permit the free download, distribution, and reuse, provided that the author and preprint are cited in any reuse.


