Submitted:
17 July 2025
Posted:
18 July 2025
You are already at the latest version
Abstract
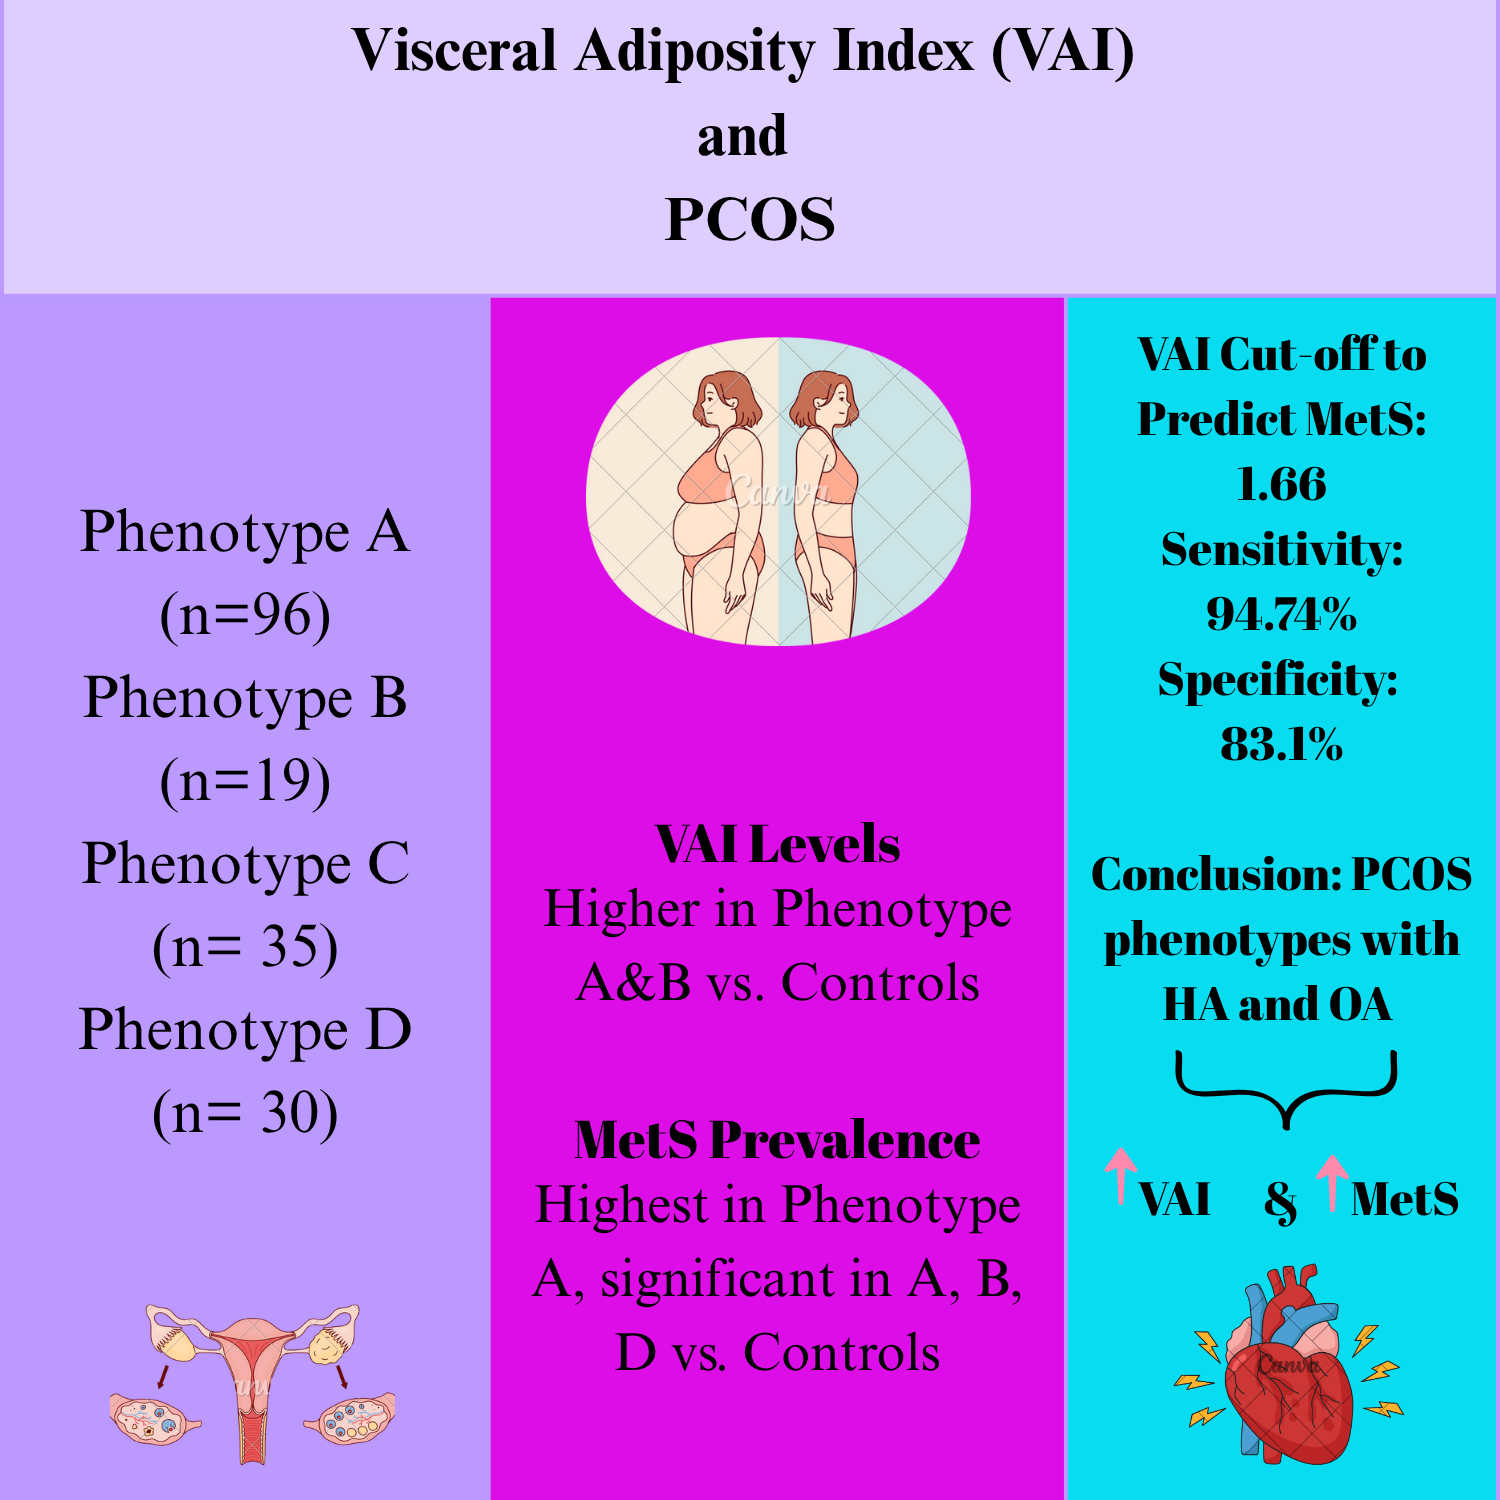
Background and Objectives: We aimed to compare visceral adiposity index (VAI) levels among polycystic ovary syndrome (PCOS) subtypes in this study. Matherials and Methods: A total of 180 PCOS patients and 51 controls were included. Patients were divided into the following subtypes: Phenotype A (n=96), clinical and/or biochemical hyperandrogenism (HA)+oligo-anovulation (OA)+polycystic ovarian morphology (PCOM); Phenotype B (n=19), HA+OA; Phenotype C (n=35), HA+PCOM; and, Phenotype D (n=30), OA+PCOM. VAI was calculated for women by the following formula:
(Waist circumference/[36.58+(1.89xBody mass index)])x[(triglyceride(mmol/L)/0.81)x(1.52xHigh density lipoprotein-cholesterol(mmol/L))]. Results: In the total PCOS patients, VAI levels were higher than controls [1.21 (0.39-10.89) and 0.85 (0.32-1.87), respectively] (p< 0.001). VAI levels were higher in Phenotype A [1.46 (0.39-10.89)] and Phenotype B [1.31 (0.43-4.39)] than in controls [0.85 (0.32-1.87)], and also higher in Phenotype A than in Phenotype C [1.00 (0.41-4.79)] and Phenotype D [1.01 (0.4-3.21)] (p=0.003 and p=0.001, respectively). While present in 38 patients (21.1%) in the PCOS group, there was no metabolic syndrome (MetS) in controls (p< 0.001). In Phenotypes A, B, and D, while more patients had MetS than controls (p< 0.001, 0.004, and 0.021, respectively), more patients had MetS in Phenotype A, compared to Phenotypes C and D (p=0.003 and p=0.021, respectively). Given ROC analysis, the VAI cut-off value in predicting MetS in the PCOS group was 1.66 (sensitivity: 94.74% and specificity: 83.1%). Conclusions: PCOS phenotypes characterized by HA and OA, particularly Phenotypes A and B, are associated with higher VAI values and an increased frequency of MetS, underscoring the importance of early metabolic assessment in these patient groups.
Keywords:
phenotype
; polycystic ovary syndrome
; subtype
; visceral adiposity index
1. Introduction
Polycystic ovary syndrome (PCOS) is one of the most common metabolic disorders and affects 5-20% of women of childbearing age [1,2]. The general characteristics of the condition are oligo-anovulation (OA), clinical or biochemical hyperandrogenemia (HA), and the appearance of polycystic ovaries (PCO) on ultrasonography (USG), and the diagnosis is performed under the Rotterdam criteria [1,2]. Such components of metabolic syndrome (MetS) as obesity, especially abdominal obesity, dyslipidemia, high blood sugar, and hypertension (HT) are frequently witnessed in patients with PCOS [3,4,5,6,7].
Until recent years, only the presence or absence of PCOS was considered significant. However, due to the heterogeneity in clinical features and metabolic disturbances, patients are now classified into four phenotypic groups based on specific criteria: Phenotype A in which HA, OA, and the appearance of PCO in the ovaries exist on USG (PCOM); Phenotype B with HA and OA; Phenotype C characterized by HA and PCOM; and, Phenotype D characterized by OA and PCOM [8]. In PCOS, as the letters of phenotypes progress from A to D, the severity and frequency of accompanying metabolic disorders and inflammation decrease.
Based on the literature, it would be more appropriate to evaluate visceral obesity instead of generalized obesity in predicting cardiovascular morbidity and mortality [9]. Even if PCOS patients are of normal weight, the frequency of central obesity has been reported to be higher in these patients [10]. Compared with generalized obesity, central obesity is more associated with MetS components leading to cardiovascular morbidity and mortality, such as insulin resistance (IR), Type 2 diabetes mellitus (DM), HT, and dyslipidemia [11,12,13]. Although waist circumference (WC) provides a simple measure of central obesity, it may be confounded by increases in subcutaneous fat, which has fewer adverse metabolic effects, as well as by variations in ethnicity and gender. Although such methods as computerized tomography (CT) and dual-energy X-ray absorptiometry (DXA) have been recommended to assess the actual amount of visceral fat tissue, the radiation risk and cost of such methods restrict the use of CT and DXA [14,15]. Instead, the visceral adiposity index (VAI), an indicator of visceral fat function calculated from anthropometric [body mass index (BMI) and waist circumference (WC)] and biochemical [high-density lipoprotein (HDL) cholesterol and triglyceride (TG)] parameters, has been recommended for early detection and assessment of cardiovascular risk in various populations [16,17,18,19,20]. In one of our previous studies, while finding VAI levels to be similar between non-obese PCOS patients and the controls, we also detected higher VAI values in obese PCOS patients than in obese controls [21].
In the presented study, however, we aimed to compare VAI levels, an indicator of visceral adiposity, in PCOS patients having different phenotypes.
2. Materials and Methods
The presented study with a prospective and case-controlled design was conducted in the Departments of Internal Medicine, Endocrinology and Metabolism Diseases, and Gynecology and Obstetrics of the Training and Research Hospital at Usak University between April 1st, 2022, and July 20th, 2023. The study was performed in line with the principles of the 1961 Declaration of Helsinki and its later amendments. Approval was granted by the Ethics Committee of the Medical School of Usak University (Date: 25/05/2022 and no: 90-90-13). Informed consent was obtained from all individual participants included in the study. Those admitted to the hospital due to such complaints as pubescence, acne, menstrual irregularity, or infertility and diagnosed with PCOS under the 2003 Rotterdam criteria [1,2] were included in the study, based on the biochemical, hormonal, and USG examinations.
PCOS was diagnosed in the presence of two of these three criteria: 1) OA, 2) Clinical (hirsutism and/or acne) and/or biochemical signs of HA, and 3) Appearance of PCO on USG, and in the absence of other clinical conditions, such as Cushing's syndrome, congenital adrenal hyperplasia or androgen-secreting tumor [2]. The patients were divided into four phenotypes [8]: Phenotypes A, B, C, and D included 96, 19, 35, and 30 PCOS patients, respectively (Figure 1). Even so, the control group was composed of 51 age-matched women between 18-35 years (Figure 1), without diagnoses of PCOS and any known cancers, liver and kidney failures, taking no medication to affect IR, with no active infection, hirsutism and acne, PCO on USG, and having normal menstrual cycle. Height, weight, and WC were measured in all participants, with height and weight recorded in underwear. Hair assessment was repeated by the same researcher (CD). WC was measured as the minimum size between the iliac crest and lateral costal margin. BMI was calculated as weight (kg) divided by height square (m2). To measure the levels of androgen, all blood samples were drawn in the morning after overnight fasting between the 3rd and 5th days of the menstruation, separated by centrifugation, and stored in deep freeze at -70°C until being analyzed. The levels of androgen were measured in none of the controls.
All cases were re-evaluated in terms of PCOM by the same researcher (OO) using a transabdominal USG with a transducer frequency of 3-6.6 mHz and/or a transvaginal USG with a transducer frequency of 3-5 mHz probe using the Mindray DC-7 device (Shenzhen Mindray Bio-Medical Electronics Co., Ltd. Shenzhen, PRC), and the presence of 12 or more follicles in each ovary measuring 2-9 mm in diameter, and/or increased ovarian volume >10 mL was accepted to be compatible with PCOM.
Glucose levels [normal range (NR), 70-105 mg/dL] were measured by Olympus AU 5800 (Beckman Coulter Inc. USA) through the hexokinase method. Insulin levels were measured by Immulite 2000 (Siemens Healthcare Diagnostics, Siemens AG, Germany) with the chemiluminescence method, and the intra- and inter-assay coefficients of the variations for insulin were found as 4.6 and 5.9, respectively. While HDL-cholesterol levels were measured by Olympus AU 5800 (Beckman Coulter Inc. USA) with the immune reaction (antigen-anticore complex), the levels of TG were assessed with a routine enzymatic method using an auto-analyzer by Olympus AU 5800 (Beckman Coulter Inc. USA). Even so, the luteinizing hormone (NR: 1.9-12.5 IU/L), follicle-stimulating hormone (NR: 2.59-10.2 IU/L), estradiol (NR: 19.5-144.2 pg/mL) and total testosterone (NR: 12-60 ng/dL) were evaluated through the chemiluminescent immunoassay method on the Abbot Advia Centaur (Tarrytown, NY, USA) device. Also, dehydroepiandrosterone-sulfate levels (NR: 1.9-12.5 IU/L) were measured using the Chemiluminescent immunoassay method with the Siemens Immulate 2000 device (Cary, NC, USA), and 17 OH-progesterone (NR: <2.6 ng/mL) and free testosterone (NR: <4.2 pg/mL) were evaluated using the Chemiluminescent immunoassay method with the Snibe Maglumi 4000 plus (Shenzhen, China) device. However, MetS was diagnosed under the criteria by the National Cholesterol Education Program Adult Treatment Panel (NCEP-ATP) III [22].
While IR was calculated by homeostasis model assessment-insulin resistance (HOMA-IR) [fasting plasma glucose (mmol/l) x fasting serum insulin (µIU/mL)/22.5], VAI was calculated for women by the formula of (WC/[36.58+(1.89xBMI)])x[(TG (mmol/l)/0.81)x(1.52xHDL-cholesterol (mmol/l))] [17].
Statistical Analysis
The statistical analyses of the data were carried out with the Statistical Package for Social Sciences for Windows, version 22.0 (SPSS, IBM Corp. Armonk, NY, USA). The analyses of data normality were conducted using Shapiro-Wilk tests. In group comparisons, the student t-test was used for continuous variables with normal distribution, and the Mann-Whitney-U test was used for the variables without normal distribution. While Fisher's exact test was used for the comparisons of binary groups for categorical variables, Pearson's chi-square test was used for the comparisons of more than two groups. Additionally, normally distributed continuous variables were given as mean±standard deviation (SD), and non-normally distributed continuous variables were presented as median (min: max). However, the receiver operating characteristic (ROC) analysis was carried out to calculate the values of sensitivity, specificity, and area under curve (AUC). Upon finding the AUC value to be significant, the Youden J index and cut-off VAI values were calculated to find the cut-off VAI value predicting the presence of MetS. The statistical significance of the findings was evaluated at a 95% confidence interval (CI), and a p-value of ≤0.05 was accepted to be significant.
3. Results
A total of 231 participants, 180 patients with PCOS, and 51 healthy controls were included in the study. Compared the total PCOS group, including all PCOS patients, with the controls; BMI levels, weight, WC, insulin, TG, and HOMA-IR levels were found to be higher, and HDL cholesterol levels were detected to be lower (all p<0.001) (Table 1). Additionally, the levels of VAI levels were also higher in the total PCOS group than in the controls [1.21 (0.39-10.89) and 0.85 (0.32-1.87), respectively] (p<0.001) (Table 1, Figure 2).
Compared PCOS subtypes with controls, BMI levels were determined to be higher in Phenotype A, Phenotype B, and Phenotype D than those in the controls (p<0.001, p=0.028, and p=0.006, respectively), and also higher in Phenotype A compared to Phenotype C (p<0.001) and Phenotype D (p=0.031). However, the levels of WC were higher in Phenotype A (p<0.001) and Phenotype B (p=0.041), compared to the controls, and also higher in Phenotype A than those in Phenotype C (p<0.001) and Phenotype D (p=0.005). Compared PCOS patients with the controls, Phenotype A was detected to have higher levels of weight, insulin, HOMA-IR, and TG (for all; p<0.001); Phenotype B to have higher insulin and HOMA-IR levels (p<0.001 and p<0.001, respectively); Phenotype C to have higher insulin (p=0.010) and HOMA-IR (p=0.012); Phenotype D to have higher insulin (p=0.024) and HOMA-IR (p=0.024) levels. Even so, Phenotype A and Phenotype B were found to have lower HDL-cholesterol levels (for both, p<0.001) (Table 1). The levels of insulin, HOMA-IR, and TG were higher in Phenotype A than in Phenotype C (p=0.009, p=0.008, and p=0.010, respectively) and Phenotype D (p=0.006, p=0.008, and p=0.002, respectively). In contrast, HDL-cholesterol levels were lower in Phenotypes C and D (p=0.001 and p=0.021, respectively). In addition, the levels of HDL-cholesterol were lower in Phenotype B than in Phenotype C (p=0.022).
When PCOS subtypes were compared to the controls, VAI levels were observed to be higher in Phenotypes A [1.46 (0.39-10.89)] and B [1.31 (0.43-4.39)] than in the controls [0.85 (0.32-1.87)] (Table 1). When intergroup comparisons were performed among PCOS subtypes, VAI levels were found higher in Phenotype A than in Phenotypes C [1.00 (0.41-4.79)] and D [1.01 (0.4-3.21)] (p=0.003 and p=0.001, respectively).
In the presented study, while 38 patients (21.1%) in the PCOS group had MetS, none of those in the controls were found to have MetS (p<0.001) (Table 2). More patients in Phenotypes A, B, and D had MetS, compared to the controls (p<0.001, 0.004, and 0.021, respectively. In addition, more patients in Phenotype A had MetS, compared to Phenotypes C and D (p=0.003 and p=0.021). Given the findings of ROC analyses, the VAI cut-off value in predicting MetS in the PCOS patient group was found to be 1.66 (sensitivity: 94.74% and specificity: 83.1%, AUC: 0.952, standard error (SE): 0.0153, Youden J index=0.7784, and p<0.001) (Figure 3 a and b).
When the correlation analysis was performed, there was a positive correlation between VAI and age levels (Spearman’s Rho 0.214, p=0.001) and HOMA-IR (Spearman’s Rho=0.348, p<0.001) (Table 3).
4. Discussion
In the presented study, VAI levels were evaluated across different PCOS phenotypes. VAI was higher in the total PCOS group, as well as in Phenotypes A and B compared to controls, and higher in Phenotype A compared to Phenotypes C and D. Additionally, the prevalence of MetS was greater in the total PCOS group and in Phenotypes A, B, and C than in controls. The VAI cut-off value for predicting MetS in PCOS patients was calculated as 1.66
IR and MetS components are frequently present in patients with PCOS [3,4,5,6,23]. Also, IR is considered one of the specific features of PCOS, independent of adiposity [7]. On the other hand, hyperinsulinism existing in PCOS leads to a vicious cycle in these patients, triggering hyperandrogenism [23]. Due to the heterogeneity of clinical features and metabolic disturbances, PCOS patients are classified into distinct phenotypes. Metabolic complications are more common in Phenotype A, which represents the classic PCOS features, and in Phenotype B, characterized by HA and OA. The severity and frequency of metabolic disturbances and inflammation progressively decrease from Phenotype A to D. [8]. Patients with PCOS tend to accumulate more central and visceral fat, particularly in the trunk and upper body, compared to BMI-matched controls, which contributes to increased proinflammatory activity, insulin resistance (IR), diabetes mellitus (DM), dyslipidemia, and hypertension (HT), ultimately elevating the risk of atherosclerosis and cardiovascular mortality [17,24]. Although waist circumference (WC) provides a simple measure of central obesity, VAI has been shown to better reflect cardiometabolic risk by distinguishing between subcutaneous and visceral adiposity [17].
In the presented study, VAI levels were also found higher in all PCOS patient groups and Phenotype A and B subtypes than in the controls and also in Phenotype A, compared to Phenotype C and D subtypes (Table 1, Figure 2). In the study performed by Amato et al. [25], on a total of 220 Sicilian PCOS patients (82 with Phenotype A, 43 with Phenotype B, 52 with Phenotype C, and 43 with Phenotype D) and 144 controls, VAI levels were found to be 2.45±1.63, 2.49±1.46, 1.68±1.0, 2.25±1.40, and 1.62±0.84 in Phenotypes A, B, C, D and controls, respectively. In the same study, the researchers also reported that oligomenorrheic phenotypes had higher VAI levels. The levels of VAI determined by Amato et al. [25] are 1.5-2 times higher than those found in our patient and control groups, which may be attributed to the fact that both studies were conducted in different ethnic groups. In another study by Agrawal et al. [26], in which VAI levels were evaluated in 100 PCOS patients with different phenotypes and 50 healthy controls, it was reported that VAI levels were higher in all PCOS patients than in controls, and also higher in Phenotype A than in Phenotype D, which is consistent with our study findings (VAI levels in all PCOS cases: Phenotypes A, B, C and D, and controls: 2.07, 2.46, 2.48, 1.47, 1.7, and 1.27, respectively). When patients were classified by cardiometabolic risk, Agrawal et al. reported that 56% were in the risk group and 12% in the high-risk group overall. Among Phenotype A cases, 64% were in the risk group and 24% in the high-risk group; for Phenotype B, 17% and 50%; for Phenotype C, 67% were in the risk group; and for Phenotype D, 53% and 2%, respectively [26]. However, the small number of patients in the study by Agrawal et al., especially in Phenotype B and Phenotype C (six and three patients, respectively), makes it difficult to analyze the study accurately. In addition, the lack of comparisons of VAI levels in PCOS subtypes with the controls can be considered another limitation. In the study by Ramezani Tehrani et al. [27] , although women with PCOS were older and had higher BMI and waist circumference compared to healthy controls, VAI levels were found to be similar between PCOS subgroups and the control group. Considering that the prevalence of obesity and visceral adiposity increases with age [27] and that both BMI and WC levels are the components of the VAI formula, it can be interpreted that such differences affected the study findings.
In our study, the HOMA-IR index, an indicator of IR in the total PCOS patient group and all phenotypic subtypes, was found to be higher than the control group. Upon the comparisons of subtypes, HOMA-IR levels were detected to be higher in Phenotype A than in Phenotypes C and D; even so, no difference was found in HOMA-IR levels among other subtypes. Phenotypes A and B are severe subtypes of PCOS [26,28], and as PCOS subtypes progress from A to D, the severity of metabolic disorders decreases. In their study, although not attributing to HOMA-IR levels in terms of PCOS subtypes, Agrawal et al. emphasized a strong correlation between VAI and HOMA-IR levels as a result of correlation analysis (r=0.455, p<0.001) [26]. On the other hand, Amato et al. reported that HOMA-IR levels were significantly higher only in Phenotype B compared to controls (p=0.037), while Phenotype C demonstrated a lower Matsuda insulin sensitivity index (p=0.02) [25]. As opposed to the findings by Amato et al. Ramezani Tehrani et al. reported that when HOMA-IR levels were taken as ≥2.3, IR was present in more patients in all three PCOS subgroups compared to controls although HOMA-IR levels in PCOS subtypes were similar to those in the controls.
In our study, while 38 patients (21.1%) in the total PCOS group had MetS, no MetS was detected in the control group (p<0.001) (Table 2). When the subtypes were examined, the frequency of MetS was 31.3% in Phenotype A including the component of OA, 15.8% in Phenotype B, and 10% in Phenotype C, and this rate was higher than that in the controls (p<0.001, p=0.004 and p=0.021, respectively). In addition, given the intergroup comparisons of PCOS subtypes, more patients in Phenotype A had MetS than in Phenotypes C and D (p=0.003 and p=0.021). When the findings of ROC analysis were investigated, we found the VAI cut-off value as 1.66 (sensitivity: 94.74% and specificity: 83.1%) in predicting MetS in the PCOS patient group (Figure 3 a and b). Amato et al. [25] reported that the frequency of MetS was significantly higher only in Phenotypes A (p=0.005) and B (p=0.024) compared to controls. They also observed that MetS prevalence was higher in OA-containing phenotypes, consistent with our study findings. Although MetS prevalence was elevated in Phenotype D as well, this difference did not reach statistical significance. Furthermore, a limitation of their study was the absence of direct comparison of MetS prevalence among PCOS subtypes. In our study, the small number of patients in the control group and the absence of patients with MetS among the controls were other limitations. In planning the study, our primary aim was to compare VAI levels among PCOS phenotypes; therefore, the patients in the study were appropriate for our inclusion criteria and the predicted number of patients. After adding the controls, 51 control cases meeting the criteria were included in the study. In the study by Shreenidhi et al. [29], which compared VAI and lipid accumulation product (LAP) levels in PCOS patients classified as metabolically healthy (MH-PCOS) and metabolically unhealthy (MU-PCOS) according to NCEP-ATP III criteria, 38% of patients were in Phenotype A, 3% in Phenotype B, 12% in Phenotype C, and 47% in Phenotype D. MU-PCOS cases were most frequently observed in Phenotypes A (43%) and D (36.3%). Shreenidhi et al. also found the VAI cut-off value to be ≥2.767 [(sensitivity: 84.09%, specificity: 85.26%, AUC: 95%CI:0.89 (0.82-0.95)] in distinguishing MU and MH-PCOS in the Asian-Indian population, and reported that the risk of having MetS increased by 9.42 (95%CI: 3.25-27.26) times above this value. In their study where VAI levels were compared, Shreenidhi et al. found no difference between the subtypes (from Phenotype A to D: 2.3, 2.1, 1.57, and 2.12, respectively), and no relationship between VAI and HOMA-IR levels [30]. On the other hand, Ramezani Tehrani et al. reported the VAI cut-off value as 3.1 (sensitivity: 81% and specificity: 78%, AUC: 0.8) in predicting MetS [29].
As parallel to the positive correlation between VAI and HOMA-IR levels reported in several previous studies [26,31,32], there was also a positive correlation between VAI and HOMA-IR (Spearman’s Rho=0.348, p<0.001) levels in our study, However, while finding no relationship between VAI and HOMA-IR (r:0.12, p=0.08) levels, Shreenidhi et al. [30] detected a relationship between LAP and VAI (r=0.23, p=0.001) levels.
5. Conclusions
In the presented study, we evaluated VAI levels in different phenotypic PCOS subtypes and demonstrated that PCOS subtypes containing components such as HA and OA had higher VAI levels than the controls and other subtypes. We also determined that more patients in these groups had negative metabolic disorders such as MetS and IR. Therefore, our study presents the findings emphasizing the importance of taking the necessary precautions and the need to combat possible metabolic disorders early and effectively in PCOS patients, especially in phenotypes containing such components as HA and OA.
Informed Consent Statement
Informed consent was obtained from all individual participants involved in the study. Written informed consent has been obtained from the patient(s) to publish this paper.
Data Availability Statement
Dataset available on request from the authors.
Supplementary Materials
The following supporting information can be downloaded at the website of this paper posted on Preprints.org. Table 1: Some demographic and laboratory data of the cases; Table 2: The relationship between visceral adiposity index levels and the presence of metabolic syndrome; Table 3: The relationship between visceral adiposity index levels and some parameters; Figure 1- Flowchart of the study population; Figure 2- Visceral adiposity index (VAI) levels in total polycystic ovary syndrome (PCOS) patients and PCOS subtypes; Figure 3- The receiver operating characteristic (ROC) curves of visceral adiposity indexes (VAI) in predicting metabolic syndrome (MetS) in patients with polycystic ovary syndrome (PCOS), (a) Scattering graph of VAI, (b) According to the determined VAI cut-off value.
Author Contributions
All authors contributed to the conception and design of the study. Conceptualization, C.D. and C.A. and O.O.; Methodology, C.D., O.O. and C.A.; Software: C.D. and A.O.K.; Validation, C.A., O.O., C.D. and A.O.K.; Formal Analysis, C.D., O.O. and A.O.K.; Investigation, C.A., O.O., C.D. and A.O.K.; Resources, C.A., C.D. and O.O.; Data Curation, C.A., A.O.K. and C.D.; Writing-Original Draft Preparation, C.D. and C.A.; Writing-Review&Editing, C.A. and C.D.; Visualization, C.A. and C.D.; Supervision, C.D.; Project Administration, C.A., C.D. and O.O.; Funding Acquisition, C.A., O.O. and A.O.K.
Funding
The work submitted did not receive any specific grant from funding agencies in the public, commercial, or not-for-profit sectors. This research received no external funding.
Institutional Review Board Statement
The study was conducted according to the guidelines of the Declaration of Helsinki, and approved by the Ethics Committee of the School of Medicine at University Usak with date and number: 25/05/2022, 90-90-13. The Clinical Trials Registry number of our study is NCT06358300.
Acknowledgments
The authors thank Numan Duran for language editing.
Conflicts of Interest
The authors have no relevant financial or non-financial interests to disclose. The authors declare no conflict of interest.
Abbreviations
The following abbreviations are used in this manuscript:
| VAI Visceral adiposity index PCOS Polycystic Ovary Syndrome HA Hyperandrogenism OA Oligo-anovulation PCOM Polycystic ovarian morphology BMI Body mass index HDL High density lipoprotein MetS Metabolic Syndrome ROC Receiver Operating Characteristic USG Ultrasonography PCO Polycystic ovaries HT Hypertension IR Insulin resistance DM Type 2 diabetes mellitus WC Waist circumference CT Computerized tomography DXA Dual-energy X-ray absorptiometry NCEP-ATP National Cholesterol Education Program Adult Treatment Panel HOMA-IR Homeostasis model assessment-insulin resistance TG Triglyceride NR Normal range SD Standard deviation AUC Area under curve CI Confidence interval LAP Lipid accumulation product MH-PCOS Metabolically healthy Polycystic Ovary Syndrome MU-PCOS Metabolically unhealthy Polycystic Ovary Syndrome |
References
- Azziz, R.; Carmina, E.; Chen, Z.; Dunaif, A.; Laven, J.S.; Legro, R.S.; Lizneva, D.; Natterson-Horowtiz, B.; Teede, H.J.; Yildiz, B.O. Polycystic ovary syndrome. Nat Rev Dis Primers 2016, 2, 16057. [Google Scholar] [CrossRef] [PubMed]
- Rotterdam, E.A.-S.P.c.w.g. Revised 2003 consensus on diagnostic criteria and long-term health risks related to polycystic ovary syndrome (PCOS). Hum Reprod 2004, 19, 41–47. [Google Scholar] [CrossRef]
- Brower, M.; Brennan, K.; Pall, M.; Azziz, R. The severity of menstrual dysfunction as a predictor of insulin resistance in PCOS. J Clin Endocrinol Metab 2013, 98, E1967–1971. [Google Scholar] [CrossRef] [PubMed]
- Landay, M.; Huang, A.; Azziz, R. Degree of hyperinsulinemia, independent of androgen levels, is an important determinant of the severity of hirsutism in PCOS. Fertil Steril 2009, 92, 643–647. [Google Scholar] [CrossRef]
- Reaven, G.M. Syndrome X: is one enough? Am Heart J 1994, 127, 1439–1442. [Google Scholar] [CrossRef]
- Rojas, J.; Chavez, M.; Olivar, L.; Rojas, M.; Morillo, J.; Mejias, J.; Calvo, M.; Bermudez, V. Polycystic ovary syndrome, insulin resistance, and obesity: navigating the pathophysiologic labyrinth. Int J Reprod Med 2014, 2014, 719050. [Google Scholar] [CrossRef]
- Diamanti-Kandarakis, E.; Dunaif, A. Insulin resistance and the polycystic ovary syndrome revisited: an update on mechanisms and implications. Endocr Rev 2012, 33, 981–1030. [Google Scholar] [CrossRef]
- Azziz, R. Epidemiology, phenotype, and genetics of the polycystic ovary syndrome in adults. Available online: https://www.uptodate.com/contents/epidemiology-phenotype-and-genetics-of-the-polycystic-ovary-syndrome-in-adults?
- Lee, H.; Oh, J.Y.; Sung, Y.A.; Chung, H. Is insulin resistance an intrinsic defect in asian polycystic ovary syndrome? Yonsei Med J 2013, 54, 609–614. [Google Scholar] [CrossRef]
- Lim, S.S.; Davies, M.J.; Norman, R.J.; Moran, L.J. Overweight, obesity and central obesity in women with polycystic ovary syndrome: a systematic review and meta-analysis. Hum Reprod Update 2012, 18, 618–637. [Google Scholar] [CrossRef]
- Mahabadi, A.A.; Massaro, J.M.; Rosito, G.A.; Levy, D.; Murabito, J.M.; Wolf, P.A.; O'Donnell, C.J.; Fox, C.S.; Hoffmann, U. Association of pericardial fat, intrathoracic fat, and visceral abdominal fat with cardiovascular disease burden: the Framingham Heart Study. Eur Heart J 2009, 30, 850–856. [Google Scholar] [CrossRef]
- Lim, S.S.; Norman, R.J.; Davies, M.J.; Moran, L.J. The effect of obesity on polycystic ovary syndrome: a systematic review and meta-analysis. Obesity reviews : an official journal of the International Association for the Study of Obesity 2013, 14, 95–109. [Google Scholar] [CrossRef]
- Glintborg, D.; Petersen, M.H.; Ravn, P.; Hermann, A.P.; Andersen, M. Comparison of regional fat mass measurement by whole body DXA-scans and anthropometric measures to predict insulin resistance in women with polycystic ovary syndrome and controls. Acta obstetricia et gynecologica Scandinavica 2016. [Google Scholar] [CrossRef]
- Rossner, S.; Bo, W.J.; Hiltbrandt, E.; Hinson, W.; Karstaedt, N.; Santago, P.; Sobol, W.T.; Crouse, J.R. Adipose tissue determinations in cadavers--a comparison between cross-sectional planimetry and computed tomography. Int J Obes 1990, 14, 893–902. [Google Scholar] [PubMed]
- Sasai, H.; Brychta, R.J.; Wood, R.P.; Rothney, M.P.; Zhao, X.; Skarulis, M.C.; Chen, K.Y. Does Visceral Fat Estimated by Dual-Energy X-ray Absorptiometry Independently Predict Cardiometabolic Risks in Adults? J Diabetes Sci Technol 2015, 9, 917–924. [Google Scholar] [CrossRef] [PubMed]
- Amato, M.C.; Giordano, C. Visceral adiposity index: an indicator of adipose tissue dysfunction. Int J Endocrinol 2014, 2014, 730827. [Google Scholar] [CrossRef]
- Amato, M.C.; Giordano, C.; Galia, M.; Criscimanna, A.; Vitabile, S.; Midiri, M.; Galluzzo, A.; AlkaMeSy Study, G. Visceral Adiposity Index: a reliable indicator of visceral fat function associated with cardiometabolic risk. Diabetes Care 2010, 33, 920–922. [Google Scholar] [CrossRef]
- Amato, M.C.; Guarnotta, V.; Forti, D.; Donatelli, M.; Dolcimascolo, S.; Giordano, C. Metabolically healthy polycystic ovary syndrome (MH-PCOS) and metabolically unhealthy polycystic ovary syndrome (MU-PCOS): a comparative analysis of four simple methods useful for metabolic assessment. Hum Reprod 2013, 28, 1919–1928. [Google Scholar] [CrossRef]
- Liu, P.J.; Ma, F.; Lou, H.P.; Chen, Y. Visceral Adiposity Index Is Associated with Pre-Diabetes and Type 2 Diabetes Mellitus in Chinese Adults Aged 20-50. Ann Nutr Metab 2016, 68, 235–243. [Google Scholar] [CrossRef]
- Vogel, P.; Stein, A.; Marcadenti, A. Visceral adiposity index and prognosis among patients with ischemic heart failure. Sao Paulo Med J 2016, 134, 211–218. [Google Scholar] [CrossRef]
- Durmus, U.; Duran, C.; Ecirli, S. Visceral adiposity index levels in overweight and/or obese, and non-obese patients with polycystic ovary syndrome and its relationship with metabolic and inflammatory parameters. J Endocrinol Invest 2017, 40, 487–497. [Google Scholar] [CrossRef]
- Expert Panel on Detection, E.; Treatment of High Blood Cholesterol in, A. Executive Summary of The Third Report of The National Cholesterol Education Program (NCEP) Expert Panel on Detection, Evaluation, And Treatment of High Blood Cholesterol In Adults (Adult Treatment Panel III). JAMA 2001, 285, 2486–2497. [Google Scholar] [CrossRef]
- Dunaif, A. Insulin resistance and the polycystic ovary syndrome: mechanism and implications for pathogenesis. Endocr Rev 1997, 18, 774–800. [Google Scholar] [CrossRef] [PubMed]
- Svendsen, P.F.; Nilas, L.; Norgaard, K.; Jensen, J.E.; Madsbad, S. Obesity, body composition and metabolic disturbances in polycystic ovary syndrome. Hum Reprod 2008, 23, 2113–2121. [Google Scholar] [CrossRef] [PubMed]
- Amato, M.C.; Verghi, M.; Galluzzo, A.; Giordano, C. The oligomenorrhoic phenotypes of polycystic ovary syndrome are characterized by a high visceral adiposity index: a likely condition of cardiometabolic risk. Hum Reprod 2011, 26, 1486–1494. [Google Scholar] [CrossRef] [PubMed]
- Agrawal, H.; Aggarwal, K.; Jain, A. Visceral Adiposity Index: Simple Tool for Assessing Cardiometabolic Risk in Women with Polycystic Ovary Syndrome. Indian J Endocrinol Metab 2019, 23, 232–237. [Google Scholar] [CrossRef]
- Reyes-Farias, M.; Fos-Domenech, J.; Serra, D.; Herrero, L.; Sanchez-Infantes, D. White adipose tissue dysfunction in obesity and aging. Biochem Pharmacol 2021, 192, 114723. [Google Scholar] [CrossRef]
- Amato, M.C.; Giordano, C.; Pitrone, M.; Galluzzo, A. Cut-off points of the visceral adiposity index (VAI) identifying a visceral adipose dysfunction associated with cardiometabolic risk in a Caucasian Sicilian population. Lipids Health Dis 2011, 10, 183. [Google Scholar] [CrossRef]
- Ramezani Tehrani, F.; Minooee, S.; Azizi, F. Comparison of various adiposity indexes in women with polycystic ovary syndrome and normo-ovulatory non-hirsute women: a population-based study. Eur J Endocrinol 2014, 171, 199–207. [Google Scholar] [CrossRef]
- Shreenidhi, R.A.; Mahey, R.; Rajput, M.; Cheluvaraju, R.; Upadhyay, A.D.; Sharma, J.B.; Kachhawa, G.; Bhatla, N. Utility of Visceral Adiposity Index and Lipid Accumulation Products to Define Metabolically-Unhealthy Polycystic Ovary Syndrome in Asian Indian Women - A Cross Sectional Study. J Hum Reprod Sci 2024, 17, 50–57. [Google Scholar] [CrossRef]
- Mario, F.M.; Graff, S.K.; Spritzer, P.M. Adiposity Indexes as Phenotype-Specific Markers of Preclinical Metabolic Alterations and Cardiovascular Risk in Polycystic Ovary Syndrome: A Cross-Sectional Study. Exp Clin Endocrinol Diabetes 2017, 125, 307–315. [Google Scholar] [CrossRef]
- Banu, H.; Morshed, M.S.; Sultana, T.; Shah, S.; Afrine, S.; Hasanat, M.A. Lipid Accumulation Product Better Predicts Metabolic Status in Lean Polycystic Ovary Syndrome than that by Visceral Adiposity Index. J Hum Reprod Sci 2022, 15, 27–33. [Google Scholar] [CrossRef]
Figure 1.
Flowchart of the study population.
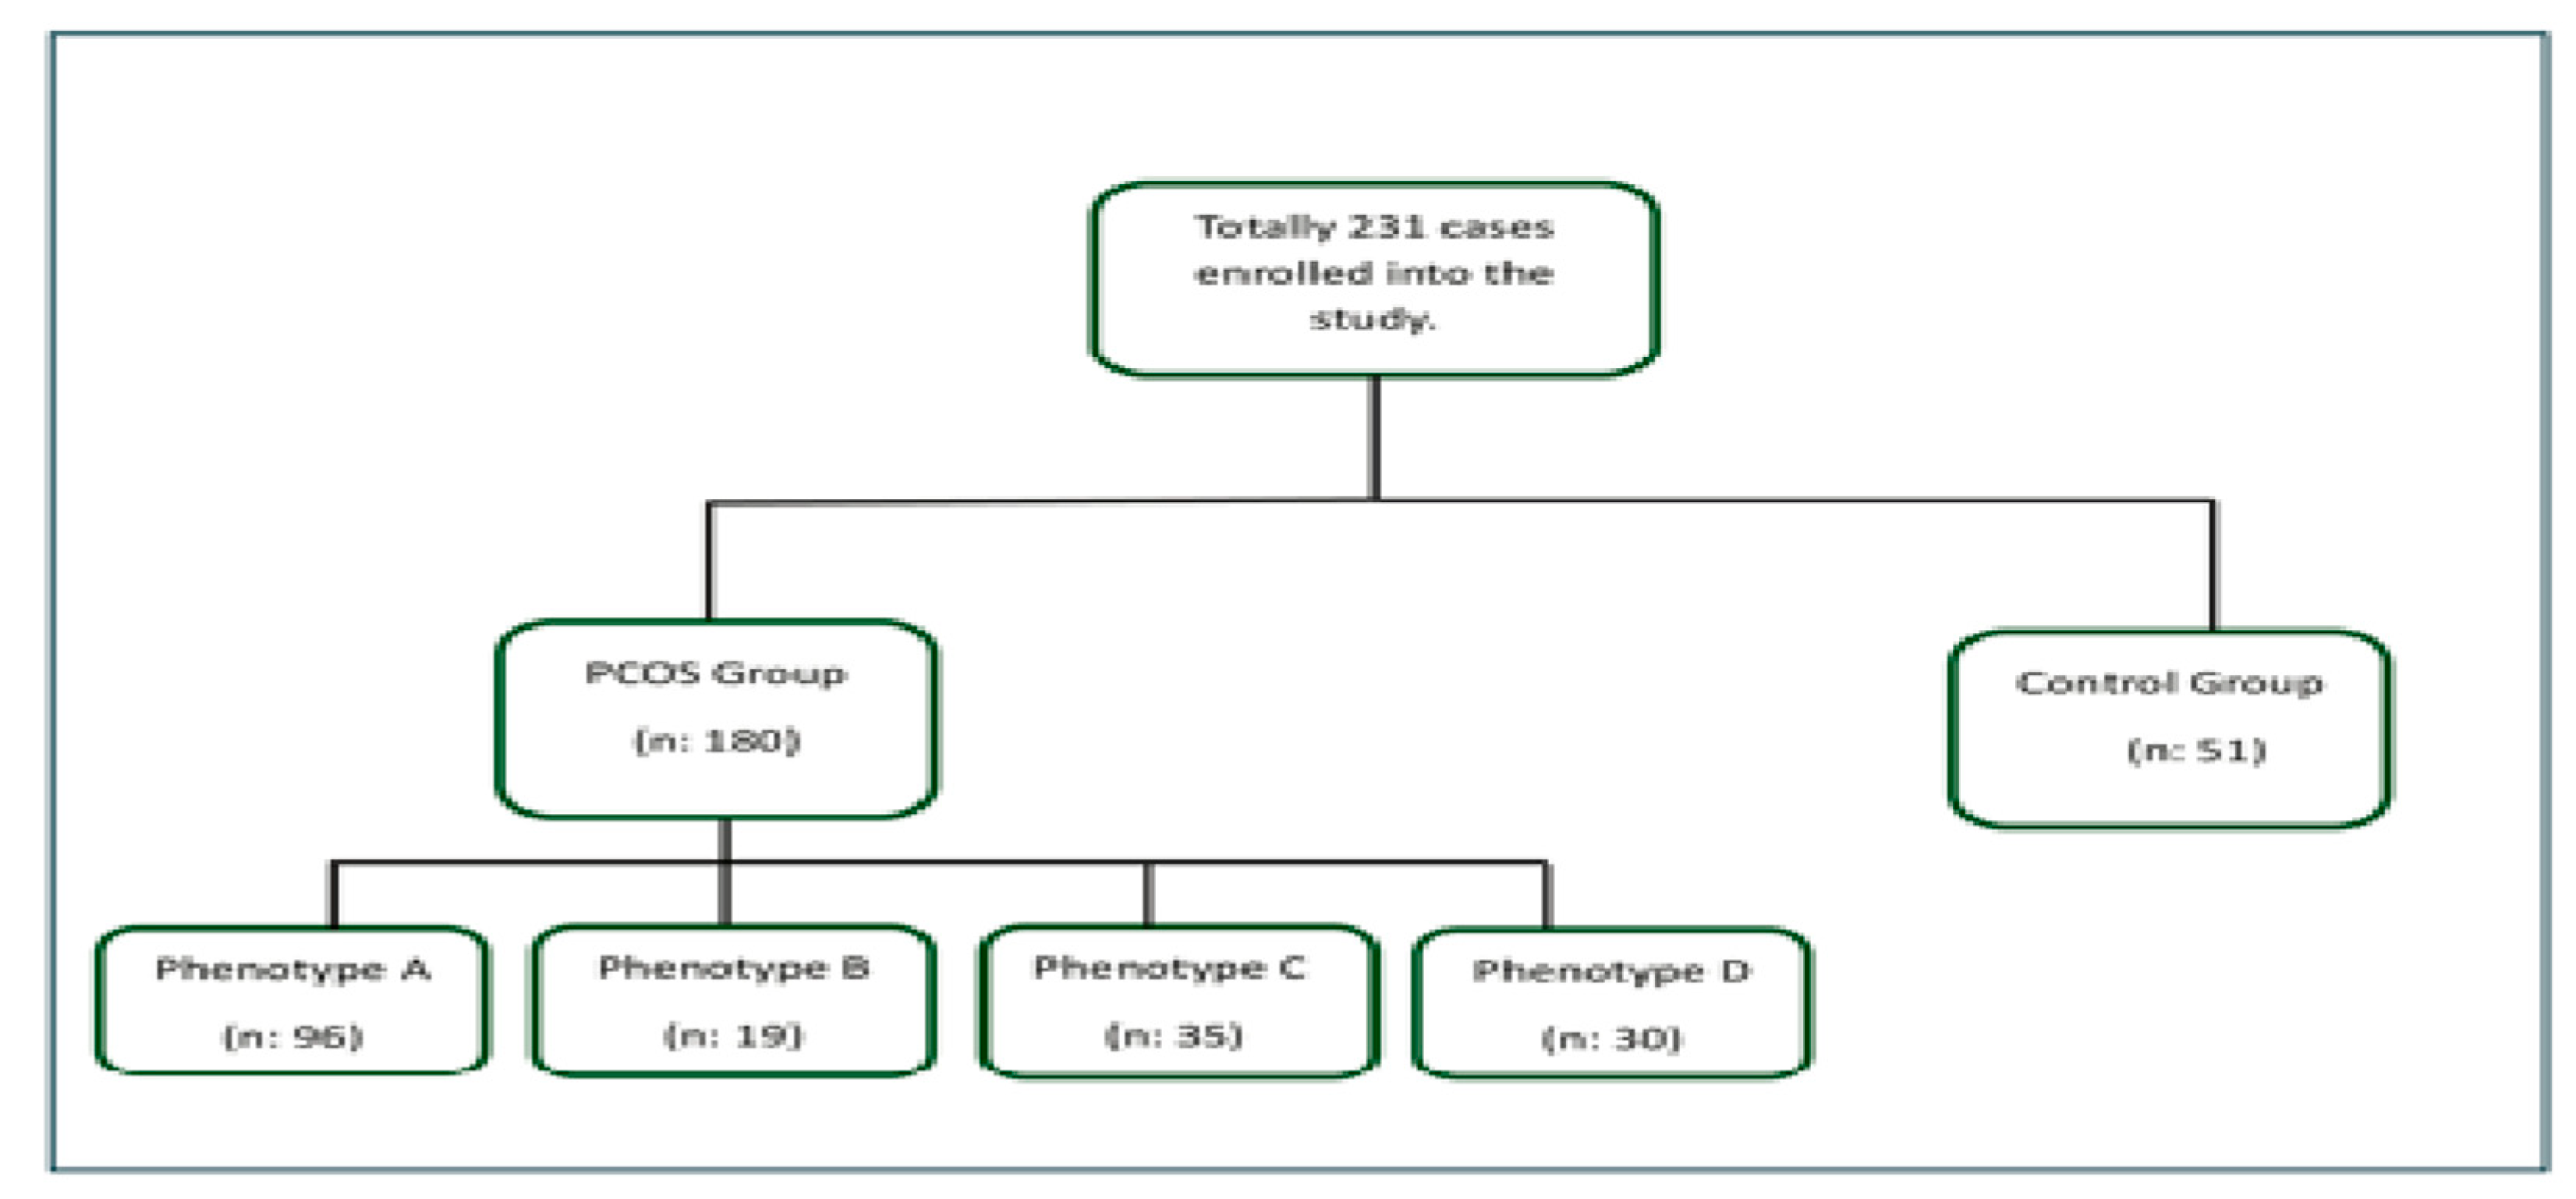
Figure 2.
Visceral adiposity index (VAI) levels in total polycystic ovary syndrome (PCOS) patients and PCOS subtypes;.
Figure 2.
Visceral adiposity index (VAI) levels in total polycystic ovary syndrome (PCOS) patients and PCOS subtypes;.
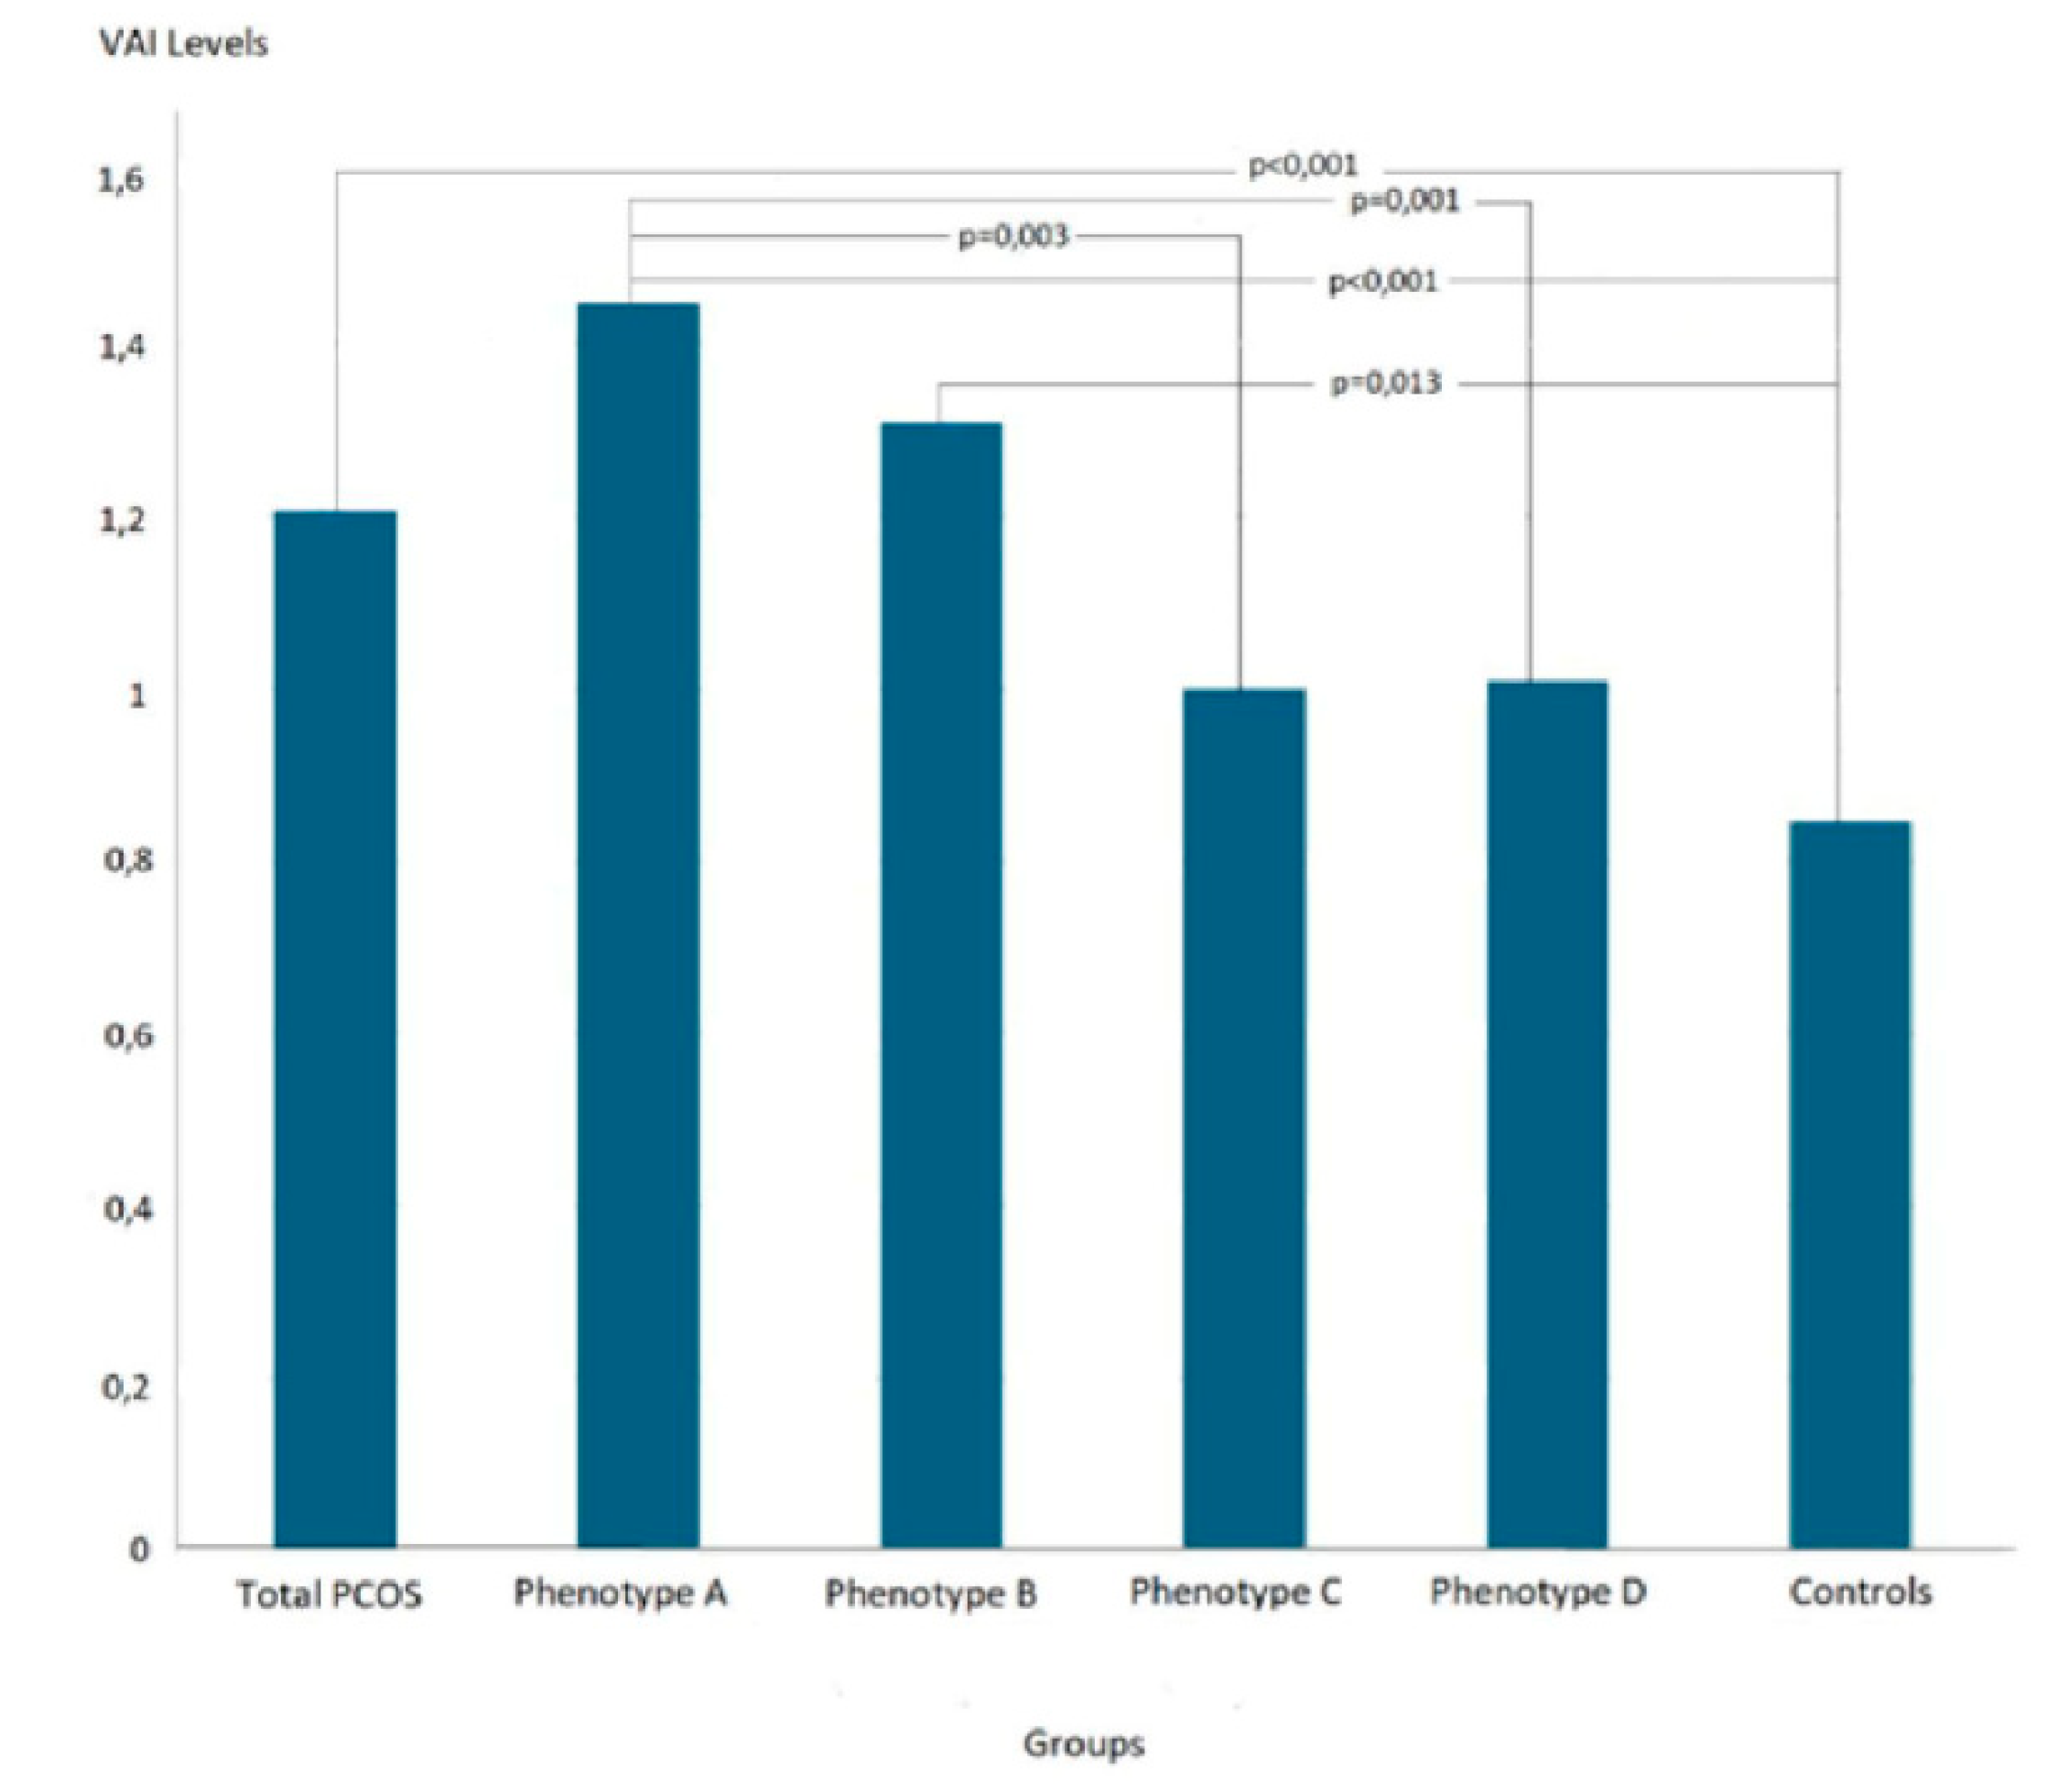
Figure 3.
The receiver operating characteristic (ROC) curves of visceral adiposity indexes (VAI) in predicting metabolic syndrome (MetS) in patients with polycystic ovary syndrome (PCOS), (a) Scattering graph of VAI, (b) According to the determined VAI cut-off value.
Figure 3.
The receiver operating characteristic (ROC) curves of visceral adiposity indexes (VAI) in predicting metabolic syndrome (MetS) in patients with polycystic ovary syndrome (PCOS), (a) Scattering graph of VAI, (b) According to the determined VAI cut-off value.
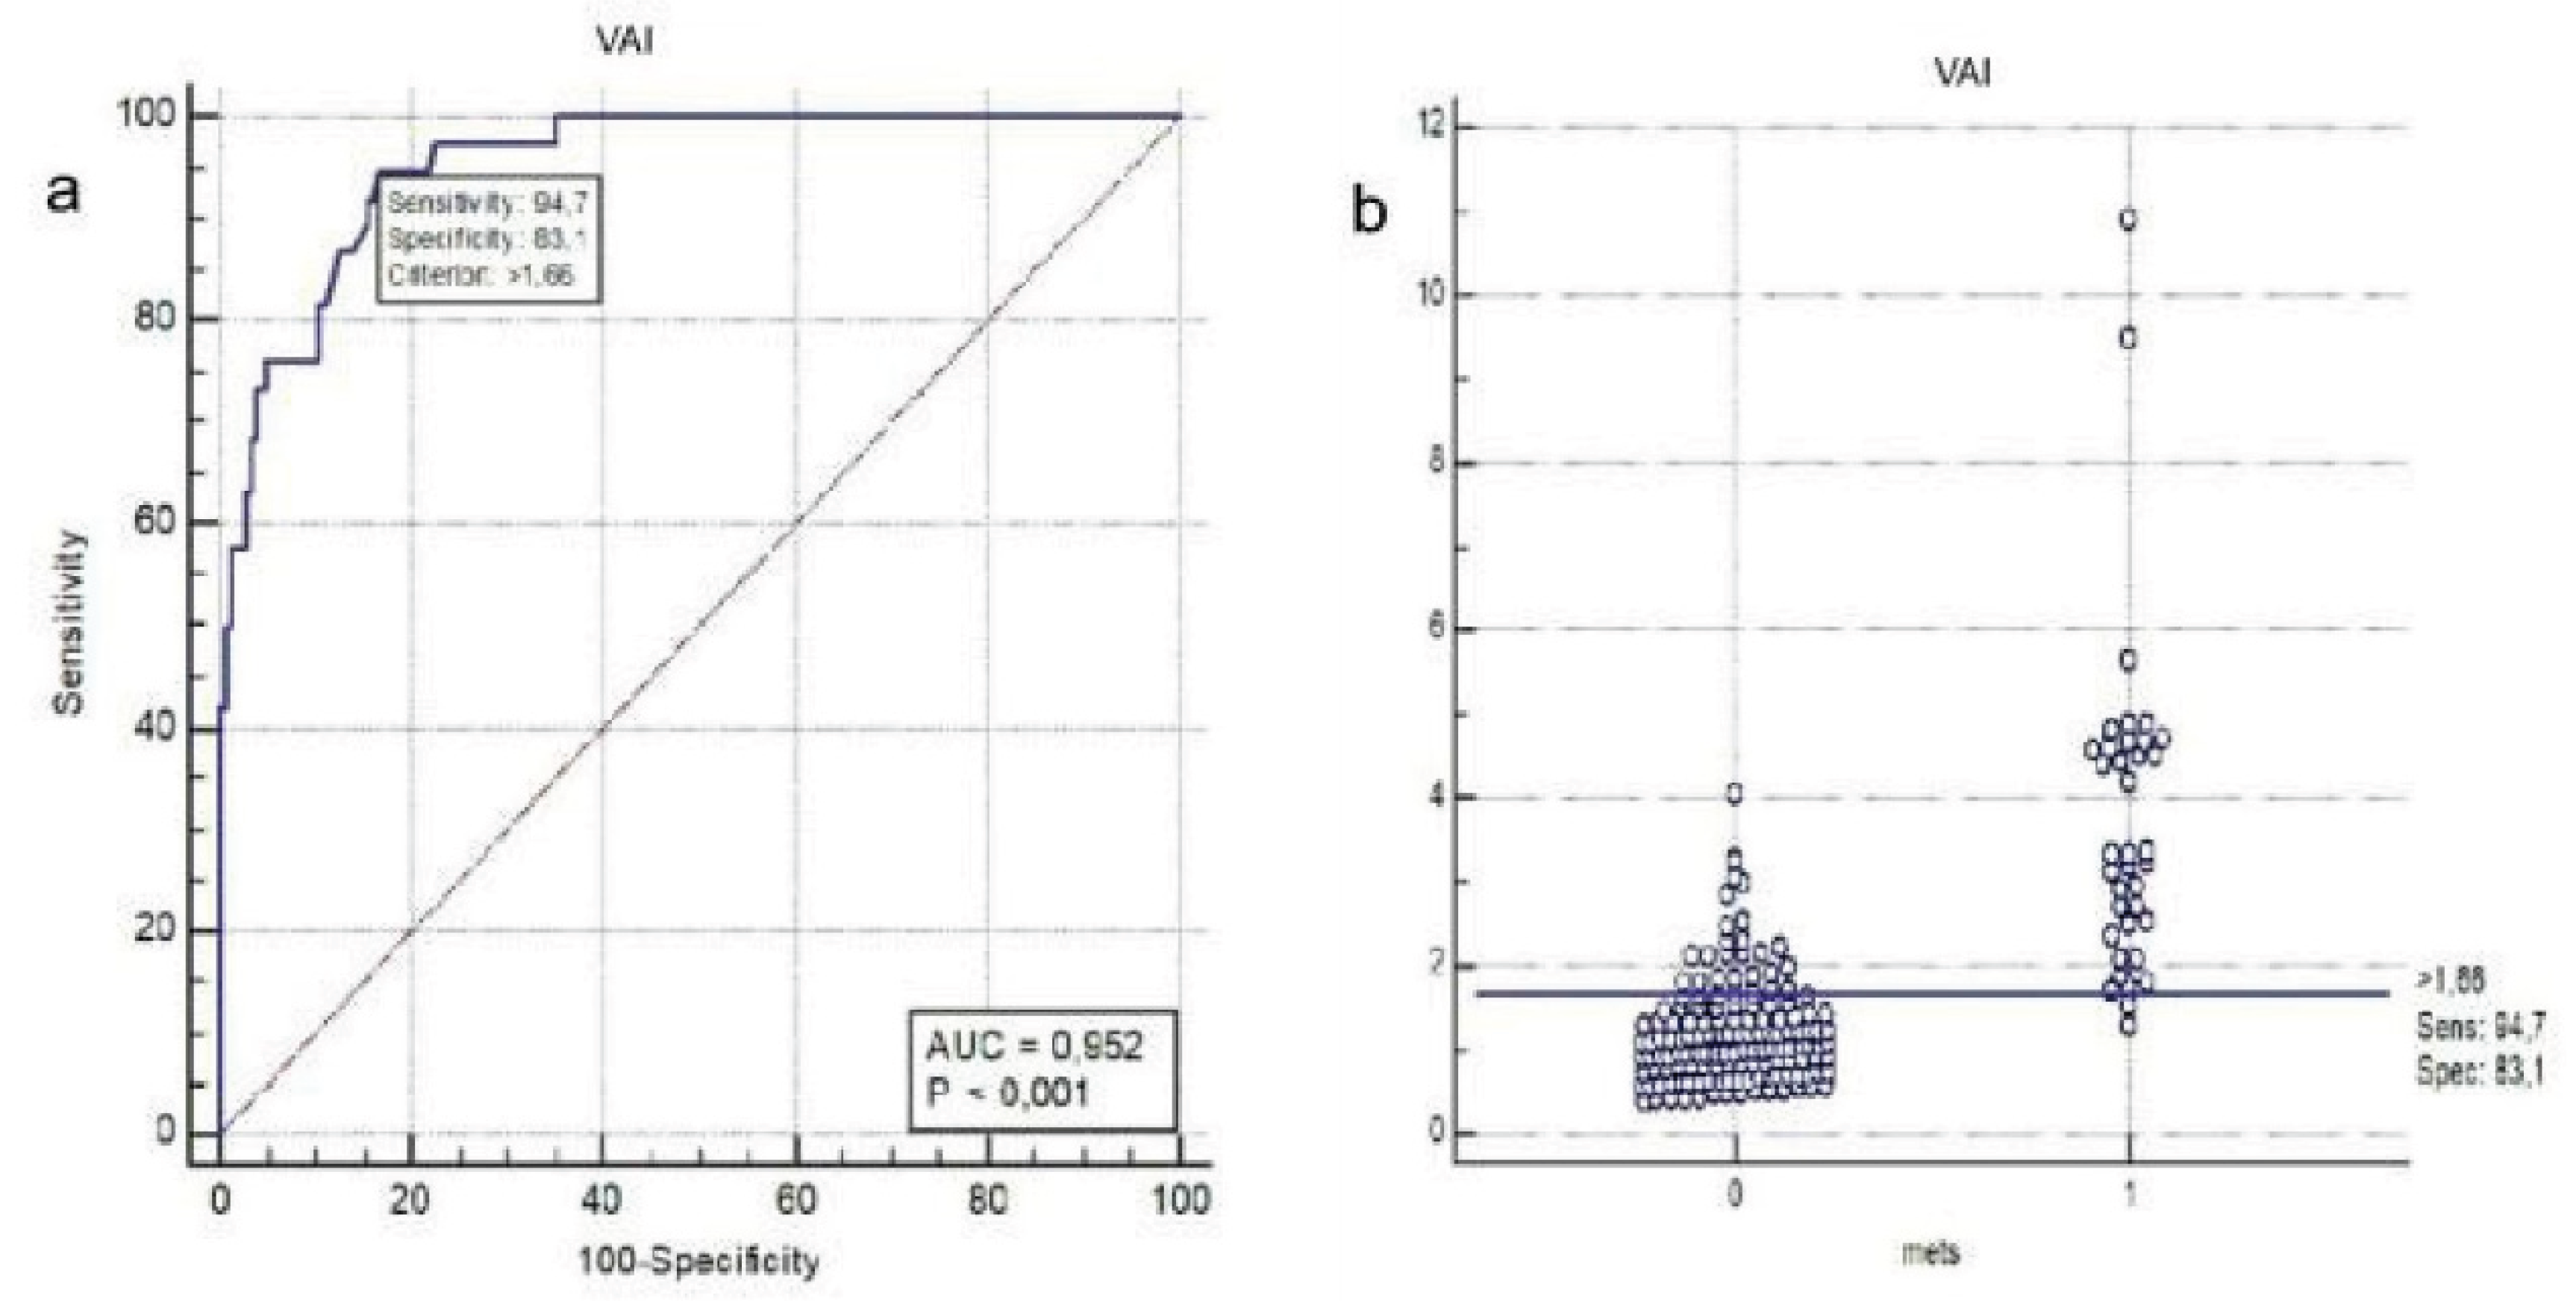

Table 1.
Some demographic and laboratory data of the cases.
| Total PCOSn=180 | Phenotype An=96 | Phenotype Bn=19 | Phenotype Cn=35 | Phenotype Dn=30 | Control Groupn=51 | p1 | p2 | p3 | p4 | p5 | p6 | p7 | p8 | p9 | p10 | p11 | |
|---|---|---|---|---|---|---|---|---|---|---|---|---|---|---|---|---|---|
| Age (year) | 24 (18-35) | 25 (18-35) | 22 (18-34) | 25 (18-35) | 24 (20-35) | 23 (22-33) | .457 | .191 | .191 | .950 | .408 | .103 | .353 | .954 | .322 | .099 | .500 |
| Weight (kg) | 70.5 (45-129) | 65 (44-103) | 60 (44-98) | 63.5 (44-116) | 58 (47-79) | <.001 | <.001 | .065 | .351 | .025 | .082 | <.001 | .022 | .273 | .805 | .304 | |
| BMI (kg/m²) | 25.49 (15.59-50.22) | 27.19 (17.15-49.77) | 24.83 (15.78-39.84) | 22.14 (15.59-34.08) | 24.88 (17.19-50.22) | 21.48 (17.78-27.34) | <.001 | <.001 | .028 | .146 | .006 | .111 | <.001 | .031 | .174 | .766 | .184 |
| WC (cm) | 83.5 (58-129) | 89 (61-129) | 82 (60-120) | 77 (58-105) | 78 (60-116) | 75 (59-100) | <.001 | <.001 | .041 | .237 | .160 | .065 | <.001 | .005 | .269 | .689 | .562 |
| Glucose (mg/dL) | 89 (56-142) | 90 (56-142) | 88 (75-109) | 88 (66-103) | 88 (78-103) | 87 (73-98) | .082 | .054 | .204 | .588 | .327 | .976 | .280 | .521 | .462 | .622 | .732 |
| Insulin (μU/mL) | 12.3 (2-100.5) | 13.6 (3.6-100.5) | 13.5 (4.4-35.7) | 10.1 (2.5-37.8) | 9.6 (2-30.5) | 7.3 (2.8-22) | <.001 | <.001 | <.001 | .010 | .024 | .810 | .009 | .006 | .094 | .071 | .797 |
| HOMA-IR | 2.75 (0.38-25.57) | 2.96 (0.77-25.57) | 3.06 (0.92-7.31) | 2.30 (0.55-7.54) | 2.13 (0.38-6.55) | 1.63 (0.58-4.35) | <.001 | <.001 | <.001 | .012 | .024 | .775 | .008 | .008 | .094 | .071 | .813 |
| HDL-cholesterol (mmol/L) | 1.4 (0.9-2.4) | 1.3 (0.9-2.4) | 1.4 (0.9-1.9) | 1.6 (1-2.2) | 1.5 (1-2.4) | 1.6 (1.1-2.3) | <.001 | <.001 | <.001 | .493 | .124 | .737 | .001 | .021 | .022 | .071 | .617 |
| Triglyceride (mmol/L) | 0.9 (0.3-5.6) | 1.1 (0.3-5.6) | 0.8 (0.5-2.4) | 0.9 (0.4-2.8) | 0.8 (0.5-1.8) | 0.8 (0.3-1.5) | <.001 | <.001 | .212 | .149 | .343 | .123 | .010 | .002 | .751 | .572 | .650 |
| VAI | 1.21 (0.39-10.89) | 1.46 (0.39-10.89) | 1.31 (0.43-4.39) | 1.00 (0.41-4.79) | 1.01 (0.4-3.21) | 0.85 (0.32-1.87) | <.001 | <.001 | .013 | .117 | .244 | .331 | .003 | .001 | .289 | .124 | .803 |
Results are given as median (minimum-maximum), * Mann-Whitney Test, §Kruskal Wallis Test. p1. Total PCOS cases vs Controls, p2: Phenotype A vs Controls, p3: Phenotype B vs Controls, p4: Phenotype C vs Controls, p5: Phenotype D vs Controls, p6: Phenotype A vs Phenotype B, p7: Phenotype A vs Phenotype C, p8: Phenotype A vs Phenotype D, p9: Phenotype B vs Phenotype C, p10: Phenotype B vs Phenotype D, p11: Phenotype C vs Phenotype D. BMI: Body Mass Index, WC: Waist Circumference, HOMA-IR: Homeostasis Model Assessment of Insulin Resistance, HDL: High-Density Lipoprotein, VAI: Visceral Adiposity Index.
Table 2.
The relationship between visceral adiposity index levels and some parameters.
| Sperarman’s rho | P | |
|---|---|---|
| Age | 0.214 | 0.001 |
| Glucose | 0.077 | 0.246 |
| HOMA-IR | 0.348 | <0.001 |
HOMA-IR: Homeostasis Model Assessment of Insulin Resistance.
Table 3.
The relationship between visceral adiposity index levels and some parameters.
| Total PCOSn=180 | Phenotype A, n=96 | Phenotype B, n=19 | Phenotype C, n=35 | Phenotype D n=30 | Controlsn=51 | p1 | p2 | p3 | p4 | p5 | |
|---|---|---|---|---|---|---|---|---|---|---|---|
| Presence of MetS, n (%) | 38 (21.1) | 30 (31.3)*§ | 3 (15.8) | 2 (5.7)* | 3 (10) § | 0 (0) | <0.001 | <0.001 | 0.004 | 0.084 | 0.021 |
p1; Total PCOS cases vs Controls, p2; Phenotype A vs Controls, p3 , Phenotype B vs Controls, p4; Phenotype C vs Controls, p5; Phenotype D vs Controls. For comparisons between other groups: Phenotype A vs B p= 0.173, *Phenotype A vs C p= 0.003, §Phenotype A vs D p= 0.021, Phenotype B vs C p= 0.222, Phenotype B vs D p= 0.547, Phenotype C vs D p= 0.517. Mets: Metabolic Syndrome.
Disclaimer/Publisher’s Note: The statements, opinions and data contained in all publications are solely those of the individual author(s) and contributor(s) and not of MDPI and/or the editor(s). MDPI and/or the editor(s) disclaim responsibility for any injury to people or property resulting from any ideas, methods, instructions or products referred to in the content. |
© 2025 by the authors. Licensee MDPI, Basel, Switzerland. This article is an open access article distributed under the terms and conditions of the Creative Commons Attribution (CC BY) license (http://creativecommons.org/licenses/by/4.0/).
Copyright: This open access article is published under a Creative Commons CC BY 4.0 license, which permit the free download, distribution, and reuse, provided that the author and preprint are cited in any reuse.


