
Submitted:
29 January 2026
Posted:
02 February 2026
You are already at the latest version
Abstract
This paper outlines a planning-oriented framework for placement of shunt compensation in power systems for post-contingency (N-1) while improving voltage profiles and minimizing active power loss. Unlike other works these authors do not rely solely on heuristic optimization or voltage post-contingency severity. These authors propose a structured two-step decision-making process linking severity of contingency and system-wide active power support to reactive power. First, N-1 contingency analysis is done to find out which scenarios in the system are the most critical and what the severity index of the contingency is. Then, for the most critical scenario a Sensitivity-based composite index is defined ( ∂ contingency index ∂ reactive power injection) which ranks the candidate buses to get the system optimal position for shunt compensation and thus retains the systems planning perspective. The chosen position is then assessed using an AC optimal power flow model to evaluate the improvements of the system on the voltage profiles and the losses of active power of the system for both normal and contingency operational states. The proposed framework is implemented and tested on the IEEE 14-bus system. The results show that the bus with the lowest post-contingency voltage is not necessarily the optimal place for reactive compensation. In contrast, the sensitivity-based planning criterion identifies sites of higher overall system benefits, including quantifiable reductions in active power losses and improved voltage recovery in the event of N–1 contingencies. The results substantiate the efficiency and clarity of the proposed planning-oriented approach in the operation and planning of reactive power management in power systems.
Keywords:
contingency index
; optimal reactive power dispatch
; power systems
; power system planning
; reactive power
1. Introduction
Modern Electric Power Systems (EPS), due to their connection to increased energy demand and the integration of renewable energy sources, are becoming increasingly complex by the day. This, in turn, has heightened the difficulty in maintaining stable and efficient power delivery. Among these challenges, two key operating challenges are reactive power dispatch and minimizing energy losses, which are crucial for system dependability and resilience [1].
Poorly controlled reactive power not only creates instability within the system, but it also increases transmission losses and causes the infrastructure to be used inefficiently. In this regard, scheduling and installing reactive compensation devices are regarded as one of the top priorities in power system planning. In this paper, we formulate and solve the problem of optimal placement of shunt compensators with an objective function that actively minimizes power losses and improves the voltage profile for both everyday and N-1 contingency scenarios. In this context, planning-oriented strategies that explicitly consider contingency conditions and their impact on voltage stability and power losses become increasingly relevant for modern power systems [2].
The methodology includes a critical node selection process based on a contingency index, while the AC optimal power flow (OPF-AC) problem is solved using a deterministic nonlinear programming formulation. The proposed framework is evaluated on the IEEE 14-bus test system, demonstrating that the incorporation of fixed shunt reactive compensation improves voltage profiles and reduces active power losses under both normal operating conditions and N-1 contingency scenarios. The planning-oriented nature of the proposed approach supports transparent and rational decision-making for reactive power management under stressed system conditions. .
1.1. Literature Review
This section discusses pertinent state-of-the-art contributions which have analyzed the reactive power dispatch problem in dispatching power systems.
On a global scale, the Electric Power Systems (EPS) are evolving in the face of unprecedented electricity demand leading to system saturation. Such assimilation, in turn, has prompted restructuring the network topology, which in turn leads to efficiency problems that increasingly undermine the EPS’s ability to sustain sufficient operational functionality [3]. Such a prediction has caused inconveniences, and new challenges leading the systems innovations and new technologies to cope with the new aspects [4].
At the present moment, one of the most important problems that the EPS is facing is the ability to cope with the increased demand whilst ensuring that the reliability, efficiency and quality of the electricity supplied is at the desired levels. In other words, a certain flexibility is required in the systems to cope with the changes in the topology [3]. Among the problems caused by the growth in demand is the increase in power losses due to the distance between generation and consumption, which implies a decrease in efficiency and limits the expansion of the EPS [5]. Another latent problem is the inadequate management of reactive power dispatch, which affects the stability of the electrical power system due to voltage fluctuations. This can affect the operation of the EPS equipment and, therefore, the efficiency and quality of the electricity supply [6,7].
For these reasons, energy losses, resource optimization, and system stability are currently the primary areas of study in electrical system planning and management, aiming to improve the performance of EPSs [8,9]. This includes the most optimal point for the placing of compensation devices, optimization methods [10,11], the optimal power flow analysis [6], and the addition of EPS-inserted renewable energy sources are just some of the techniques for which methodologies are reviewed to this end [12,13,14].
In the Electric Power System (EPS), the assessment of the reactive power still remains very critical. The active power is the one that is most systemically and fundamentally considered, but those are worth noticing that reactive power is also enlisted in the flow of the system. It is, in fact, very pivotal in the stabilization of the voltages and in the transfer of the power within the system [15]. The study of active power dispatch in EPSs led to the discovery of reactive power dispatch, prompting researchers to develop techniques and algorithms that provide solutions for optimal reactive power dispatch. Thus, in [4,16,17], algorithms are developed to identify the optimal location of compensators within the electrical power system to maintain system stability and minimize power losses and voltage deviations. On the other hand, some authors, such as [18,19], take already developed algorithms and improve them, correcting errors in the base algorithms and comparing their efficiency and response.
Likewise, some authors propose metaheuristic solutions such as [5], which, to solve the problem of optimal reactive power dispatch, develops an algorithm called JAVA whose objective is to achieve the optimal allocation of control variables to minimize power losses; this algorithm is tested and compared with methodologies implemented by other authors for the same purpose. All this research and these methods are developed to achieve one or more objectives. In [20], for example, the minimization of losses and voltage deviation is established as the primary analysis topic. In contrast, [21] extends the study to include system stability and generation costs, in addition to the two objectives mentioned above. In this way, multi-objective studies aim to solve more than one existing problem in the network.
The main problems observed in the electrical network are power losses and the uncontrolled flow of reactive power, which can lead to a loss of voltage stability in the EPS. To minimize losses, there must be proper network elements management and resource streamlining [6]. Reactive power dispatch is the process of determining the generation, use, and compensation of reactive power at various points in the power system, such that the voltages are held within acceptable levels and system is operational and stable [22].
The search for more effective ways of managing power flows within a system has sparked interest in a multitude of operational optimization techniques, as well as technological augmentation of the system. From the vast pool of methodologies and techniques, there is much interest in the optimization of power flow through the use of flexible AC transmission systems (FACTS) devices [23]. Such devices are capable of improving and sustaining the dynamic and static response of power systems and reducing operational losses through effective flow control [24,25,26].
Under this set of circumstances, devising a means of defining the appropriate location of parallel compensation in the EPS would help in ascertaining the extent to which energy losses associated with the transmission and distribution phases can be minimized, and, in turn, managed via appropriate exploitation of reactive power flow, ensuring continued operational integrity and system stability. The literature is quite voluminous on the subject of optimal reactive power dispatch as well as on the positioning of shunt compensators; however, it is still controversial as many studies appear to be based primarily on the assumption of the normal operational paradigm without consideration of the N-1 contingency paradigm in the planning phase. Furthermore, there is a growing tendency among some of the recent studies, which appears to be based on the considerable numerical accomplishments of some metaheuristic optimization techniques, to ignore the qualitative aspects of transparent and comprehensible explanation of how and why the particular location of compensation was selected.
Furthermore, there appears to be insufficient focus on the direct relationship among the degree of a contingency, the degree of reduction in the nodal voltage, and the optimal placement of shunt compensation. These studies tend to lack the organization of a structure, and the reproducibility of the interrelated system would be extremely difficult as it relates to the assessment of contingency in a node for the reactive power support. Consequently, the heuristic rules in the planning phase, as well as post-optimization investigation, are left with no alternative but to operate within the framework of a single contingency approach.
To overcome these issues, this research introduces a contingency-driven planning framework for optimal placement of shunt reactive compensation within a transmission system. This approach combines N-1 contingencies, voltage profile assessments, and sensitivity indices coupled with an AC optimal power flow to create a lucid and physically meaningful placement of compensation.
1.2. Main Contribution
The following is a summary of contributions of this work:
- 1.
- A planning framework motivated by the N-1 contingency to draw a link between the severity of the contingency and nodal voltage degradation for the placement of shunt compensation.
- 2.
- A composite sensitivity-based index that ranks the candidate buses for reactive power support on a given contingency c and is of significance in the loss reduction problem.
- 3.
- Incorporation of the proposed framework with an AC optimal power flow in the literature to assess loss reduction on the given contingency and the improvement of the voltage profile.
- 4.
- Unlike previous contingency-based FACTS placement approaches, the proposed framework focuses on planning-oriented shunt compensation using sensitivity-driven decision criteria, avoiding topology reconfiguration and heuristic optimization
1.3. Organization
Section 1 - This section presents the paper’s introduction and a review of the state of the art, showing the main research articles employed for shunt compensation.
Section 2 - This section reviews the most relevant related work, providing a general context on previous research on EPS performance optimization.
Section 3 - This section details the proposed methodology together with the mathematical formulation of the problem.
Section 4 - This section analyzes and discusses the simulation results, evaluating the impact of the implemented strategy on the test system.
Section 5 - Conclusions: presents the most relevant conclusions of the study, highlighting the findings and proposing lines for future research.
2. Related Works
The work carried out has addressed various approaches for the optimal location of compensating devices [27]. The existing literature highlights analytical and numerical methods that consider both the minimization of energy losses and the optimization of reactive power dispatch and the improvement of voltage profiles [17]. These methods include the creation of optimization algorithms and their integration with modeling and simulation tools that allow for a more accurate and effective evaluation of compensation strategies.
Thus, the authors in [4] propose a methodology for locating compensators in electrical systems, optimizing the reconfiguration of reactive power flows through transmission switching, similar to the N-1 constraint; using the contingency index to identify the greatest voltage degradation and optimal AC power flows to minimize operating costs; This methodology is tested in different IEEE systems, verifying system stability and determining the location and compensation value.
The work presented by [28], for example, is based on contingency ranking to achieve the strategic location of FACTS devices in the test electrical system in order to improve voltage stability by applying load.
On the other hand, to achieve optimal power dispatch, [6] proposes a multi-objective optimization methodology for active and reactive power dispatch to minimize losses and generation costs, using mixed-integer nonlinear programming (MINLP) through the epsilon constraint method and a fuzzy satisfaction approach. The algorithms were implemented in the GAMS and Digsilent software, where it was observed that the latter has a limitation, as it can only simulate single-objective problems.
Various approaches have been proposed for optimizing reactive power dispatch, such as in [10], which considers the minimization of active power losses in transmission lines and the improvement of voltage levels by applying the particle swarm optimization methodology.
2.1. Reactive Power Dispatch
Reducing energy losses in transmission lines is an effective solution to the problem of reactive power dispatch, while complying with EPS operational constraints. This is addressed using the model, where a power balance at one of the nodes (sending node or bus) or (receiving node or bus) yields equation (1), which defines the loss minimization objective function and can generally be applied to all EPSs.
Where, and represent the voltages at nodes i and j respectively, is the line conductance, the variable corresponds to the angular difference between the voltages at those points, and is the number of buses. Equation (1) is restricted by (2) and (3), which describe the active and reactive power flow through the transmission line as a function of the electrical parameters, i.e., the conductance () and susceptance () of the line. Equations (4) and (5) establish the operating limits for active power () and reactive power (). Likewise, (6) - (10) present the limits for voltage magnitude, angle, shunt compensation, the maximum capacity of the transmission lines, and the functional relationship between the power generated and the active and reactive power delivered by the generating units [6]
It is worth noting that the reactive power limits defined in (8) provide a generalized representation of shunt compensation devices. When the reactive power injection is fixed, the formulation corresponds to conventional shunt capacitor banks typically used in planning studies. However, by allowing to vary continuously within the specified bounds, the same formulation can represent dynamically controllable devices such as Static VAR Compensators (SVCs) or STATCOMs. In this case, the AC optimal power flow determines the optimal reactive power injection level in response to system operating conditions, enabling adaptive voltage support under contingency scenarios [29].
2.2. Contingency Index
The contingency index (J) allows the different contingencies in the electrical system to be evaluated, identifying those that can induce overloads in the transmission lines or exceed the permitted voltage ranges [30]. The most critical contingency is the one with the lowest voltage stability margin. Equation (11) defines the use of the contingency index.
Considering that will have a value of 2 and will have a value of 1, in order to give equal weight to all contingencies, the contingency index analysis is carried out by comparing the values of the electrical parameters in normal operation with those obtained under each scenario. Under these conditions, equation (12) defines the modified expression of the contingency index.
In addition to the contingency index J, a sensitivity-based composite index is employed to support the selection of candidate buses for reactive compensation. This index quantifies the sensitivity of the contingency index with respect to reactive power injection at a given bus k, expressed as . The proposed sensitivity measure captures the relative impact of local reactive power support on the overall post-contingency system performance and is used to rank candidate buses under critical N–1 contingencies. Higher values of indicate buses where reactive power injection yields a more significant reduction in contingency severity and system losses.
3. Methodology and Problem
The continuous increase in demand, coupled with the growing need for economic efficiency and optimal use of electrical infrastructure, creates inevitable challenges such as voltage fluctuations, system instability, significant losses, low energy quality, reliability issues, among others. Therefore, it is essential to implement innovative resources and technologies to optimize the use of electrical networks, efficiently manage power transmission, improve voltage profiles at nodes, and, consequently, increase the performance of EPSs.
Figure 1 summarizes the main stages of the proposed methodology, from contingency screening and severity assessment to sensitivity-based bus selection and AC–OPF evaluation.
It is important to note that, within the proposed framework, the contingency index is not used as the sole criterion for selecting the compensation location. Instead, the contingency analysis and voltage severity assessment are first employed to identify the most critical operating scenario and a reduced set of candidate buses. The final selection of the compensation location is then based on a sensitivity-based composite index, , which quantifies the system-wide effectiveness of reactive power injection at each candidate bus under the identified critical contingency. This two-stage decision process ensures that the selected location not only exhibits severe post-contingency voltage degradation, but also provides the greatest overall benefit in terms of loss reduction and voltage recovery.
Studies of the behavior of EPSs can be carried out using different techniques [4]; among them is Optimal Power Flow, which allows the power flows of the evaluated system to be calculated accurately and, based on this information, the appropriate method to be correctly applied in order to identify severe contingencies affecting the system.
When a contingency occurs in the electrical power system, the values of its electrical parameters are altered; among them, a reduction in the voltage stability margin may occur [28]. For this reason, it is essential to perform a contingency analysis to measure its impact, classify its severity, and determine which component causes the most damage to the EPS. [30].
The methodology suggested here relies on the analysis of voltage and reactive power metrics during normal and N–1 contingency operating states. The contingency index is first utilized to measure system-wide impact and pinpoint the most severe operating condition along with a smaller subset of target candidate buses with notable voltage drops after the contingency. Most importantly, this index is not used on its own as a selection criterion for the location of compensation. Rather, the location is determined by the sensitivity composite index, , which determines the system-wide impact of reactive power injection on each candidate bus. The two-step process described ensures that the chosen location is not just passively weak, but also offers the most substantial net positive impact in the form of reduced active power losses and an improved voltage profile.
The losses themselves are predicated by a set of operational constraints that guarantee the electrical system remains balanced and functions within a tolerance of its operational parameters. These operational tolerances include the limits of the system’s active and reactive power, and the tolerances of the system’s specified nodes voltage magnitudes and angles, and the thermal limits of the transmission lines. In this analysis, the voltage tolerance is defined to be within a margin of angles are taken to be within a margin of to radians. Finally, for the sake of ease and comparison of the results, a system base power of 100 MVA is taken. This allows the power levels of the system to be expressed in per unit values of [pu] for the remainder of the analysis to promote uniformity, and standardized values for the units.
To verify the proposed methodology, the IEEE 14-Bus test system, presented to address the loss minimization problem, will be used. The system consists of five generators connected to buses 1, 2, 3, 6, and 8. It also has 21 branches, distributed across five transformers and 16 transmission lines. Three of these transformers form a synchronous transformer connected to generator G4. Figure 2 shows the single-line diagram of the test system, and the data used for simulation and modeling are presented in Table 1, Table 2 and Table 3.
This study is based on a static analysis framework. Future extensions could incorporate a multi-year planning horizon (e.g., 10 or 15 years) to capture long-term system evolution, demand growth, and infrastructure changes.
Algorithm 1 presents the proposed contingency-driven planning procedure for shunt compensation placement considering optimal reactive power dispatch. Step 1 defines the system parameters and input data of the electrical power system. Step 2 solves the AC optimal power flow (OPF-AC) to characterize the initial operating point and compute the contingency index under normal operation. In Step 3, the optimal reactive power dispatch problem is formulated with the objective of minimizing active power losses, providing a reference operating condition for subsequent contingency assessment. Step 4 performs an N–1 contingency screening to identify the most critical contingency scenario by computing the contingency index for each line outage and selecting the case associated with the worst post-contingency system condition. In Step 5, a reduced set of candidate buses is ranked using the sensitivity-based composite index , and the optimal compensation location is selected as the bus that maximizes this index under the identified critical contingency. Step 6 applies shunt compensation at the selected bus and evaluates its impact through the ORPD formulation under the critical contingency. Finally, Step 7 reports the resulting voltage profiles, power losses, and performance indices obtained from the proposed methodology.
| Algorithm 1 Contingency-driven shunt compensation placement considering ORPD |
Step 1: Input data
Step 2: OPF-AC for initial conditions
Step 3: ORPD
Step 4: N–1 contingency screening (critical contingency identification)
Step 5: Candidate bus ranking using sensitivity index
Step 6: Compensation placement and evaluation
Step 7: Show results
|
In this system, four different scenarios will be modeled and analyzed, each designed to evaluate the behavior of the electrical power system (EPS) under various operating conditions. The first scenario corresponds to the performance of the EPS under normal operating conditions, without the presence of contingencies or additional compensation devices. The second scenario analyzes the voltage response to the N-1 contingency, considered the most critical for the system. The third scenario evaluates the behavior of the system after the incorporation of reactive compensation devices, with the aim of improving the voltage profile and operational stability. Finally, the fourth scenario represents the response of the EPS to an N-1 contingency, but considering that reactive compensation has already been implemented, thus allowing its effectiveness against fault events to be evaluated.
The OPF-AC problem was solved using the CONOPT solver. To improve the chances of achieving a global optimum, the optimization was repeated with various starting points, and results were cross-validated with deterministic methods for small test cases.
4. Results Analysis
The simulation was performed on a computer equipped with an Intel(R) Core(TM) i7-8550U CPU @ 1.80GHz processor and 8 GB of RAM. GAMS software was used for optimization, using the CONOPT solver, given that this is an OPF-AC and a nonlinear model. In addition, the results were analyzed using Matlab.
Figure 3 contains the total contingency index values for each of the simulated conditions, both in the case of normal operation and in the event of an N-1 contingency. Based on this, it is determined that the contingency with the greatest impact on the EPS occurs when the line between nodes 6 and 13 fails with a total value of J of 8.70762828; with the output of this line, there is a power loss value of 2.183. Additionally, the proposed methodology establishes as a restriction that reactive compensation is not allowed on buses that have a generator. This can be seen when analyzing the contingency of transformer , which, together with transformers and , forms a synchronous transformer, whose operation causes the disconnection of generator , a key element for the operation of the EPS.
Based on this initial finding, an analysis is performed to determine the optimal location for parallel compensation, taking into account the two nodes with the greatest voltage degradation. The first corresponds to node 13 and the second node with the lowest voltage is node 14. To determine the compensation location, the power loss results obtained under N-1 contingency for both nodes are analyzed. Figure 4 shows the results of three cases: the first shows the EPS losses in normal operation (base case), the second indicates the losses obtained considering the location of the compensator at node 13, and the last case evaluates the behavior of the system with the compensator located at node 14.
A sensitivity sweep revealed that bus 14 exhibits the highest composite index , which is more than larger than that of the next candidate (bus 13). This marked sensitivity—combined with the radial position of bus 14 makes it the most impactful location for installing reactive support. As a result of the analysis, it has been determined that, in order to minimize power losses in the EPS, reactive power support must be provided at node 14, as shown in Figure 5.
Compensating reactive power is an important aspect of power systems. A major computational parallell approach employs loss loss sensitivity factors and reactive load concentration. Based on this heuristic approach, compensation devices should be placed on highly reactive, or high voltage, consumption buses first; i.e., Bus 13. Unfortunately, during N-1 analysis, these simple workload placement methodologies completely ignore peripheral buses, severely downgrading voltage on local buses. After testing a new methodology developed in our team working on contingency driven losses, Bus 14 was determined to be the optimal choice with highest probable loss reduction and voltage recovery. All other buses analyzed (i.e., 13) under performed the optimal choice.
Table 4 delineates the differences concerning the effectiveness on the basis of severity of voltage and on the basis of sensitivity concerning the placement of shunt compensators under the most critical N–1 contingency. While in the case of bus 13, the post-contingency voltage magnitude is the lowest, and thus, post contingency voltage degradation is the most severe, the sensitivity analysis shows that bus 14 constitutes, in all respects, a much greater contribution toward the performance of the entire power system when reactive power injection is involved. This is supported by the bus 14 partition of the system where is a greater value, meaning that at this bus, the contribution of a single portion of reactive power is enough to cause a significant decrease in the value of the contingency index and, thus, in the system losses. This shows the bus with the most severe voltage profile is not effective and, thus, proves that bus 14 is the most system-wide planners optimal placement.
The incorporation of this support reduces active power losses both under normal operating conditions and in most of the N-1 contingencies considered in the study. The optimal reactive compensation value that leads to the lowest level of losses was identified as 12.5 Mvar. Once this compensation value has been implemented, the system’s behavior is verified again, evaluating the voltage profiles, phase angles, and active and reactive power flows, in order to ensure an overall improvement in the stability and operational efficiency of the EPS. Figure 6 shows the voltage profile and its behavior analyzed in four scenarios: scenario 1 shows the behavior of the electrical power system in normal operation; scenario 2 shows the voltage response to the output of line 6-13; a third scenario corresponds to the behavior of the system after the inclusion of reactive compensation at node 14; and finally, scenario 4 shows the voltage profile in the event of an N-1 contingency when compensation has already been included.
An improvement in the system voltage profile was observed both in normal operation and in the case of N-1 contingencies. This is particularly true for the nodes that presented the worst conditions, with node 13 showing a variation from 0.962 to 0.99 [pu] and node 14 showing a change from 0.97 to 1.012 [pu], recovering its voltage. Similarly, the contingency index improves with the compensation implemented, although the worst contingency remains the line output (6–13).
Figure 7 shows the flow of active power in the different transmission lines of the electrical power system. An analysis of the power system and the scenarios evaluated shows that even though there are small differences in the power system and the power requirements, the differences do not create significant changes in the power system’s overall functioning. The small weakly oscillating power flows and the overall system operational performance are stable and robust. The oscillating system’s large simulation case shows. The operational performance of the system is stable and robust. The case simulation study shows adequate stability and performance of the system.
There is however, changes are observed in the transmission lines that reflect the flow of reactive power. Specifically, in an N-1 contingency without reactive compensation, it is observed that there is an increase in the load of the remaining lines, and there are more significant voltage drops and more reactive power (Q) absorption. If reactive compensation devices are used, the absorption of reactive power by the loads will improve voltage stability more easily by compensating the reactive power locally. This system response is manifested in Figure 8.
Just as with the active power flow pattern, there are no considerable deviations in the angular profile illustrated in Figure 9. This holds true when one compares the normal and contingency states, with and without the implementation of reactive compensation. It is because reactive compensation has no direct impact on the angle.
5. Conclusions
The analysis of active and reactive power flows, evaluation of voltage profiles and phase angles, under different conditions confirmed that strategically positioned reactive compensation is vital to the improvement of voltage profile and dependable system stability under conditions of disturbance. The findings of these studies prove that reactive power is of great value in reducing severe post disturbance voltage spikes and that in loss reduction active power support is attainable. This of course assumes that loss reduction support is optimally situated within the planning approach of the system.
One of the main findings of this work relates to the fact that the bus that reached the highest level of voltage collapse under the most severe N-1 contingency condition is also the bus where it is least justifiable, socially, from the perspective of the whole system, to provide reactive power support. This is true despite the fact that the contingency index J is a very powerful tool in isolating the most relevant scenarios within the operational context and the most overloaded weak system components. However, the terminal decision of the location of compensation must also include the consideration of the system behavior on the reactive power reaction. The sensitivity composite index that we propose, , particularly answers and supports this concept, helping narrow the thoughts toward a structured, sequential, two-step technique that prevents overcompensated systems and yields answers that support efficient and improved planning.
The application of the proposed contingency-driven planning framework to the IEEE 14-bus system illustrates how combining contingency screening with sensitivity-based bus ranking results in improved voltage profiles and loss reduction across multiple operating scenarios. Although the numerical assessment is carried out on a test system of limited size, the methodology is general and can be extended to larger transmission networks, as its computational burden is dominated by standard AC optimal power flow and contingency analysis procedures.
Future work may extend the proposed framework by incorporating additional decision criteria, such as the economic cost of reactive compensation devices and their operational constraints. Furthermore, comparative assessments involving different types of compensation technologies, including dynamically controllable devices, could provide additional insight into the trade-offs between cost, flexibility, and system performance.
Author Contributions
Conceptualization, D.C.; Methodology, J.M.; Formal analysis, M.J.; Data curation, M.J.; Writing original draft, J.M.; Writing review & editing, D.C. and M.J.; Supervision, D.C.; Project administration, D.C.; Funding acquisition, D.C. All authors have read and agreed to the published version of the manuscript.
Funding
This work was supported by Salesian Polytechnic University and GIREI-Smart Grid Research Group under the project “Integration of Artificial Intelligence in the Planning, Operation, and Protection of Electrical Power Systems”, Resolution No.: 083-02-2024-04-12.
Data Availability Statement
The original contributions presented in this study are included in the article. Further inquiries can be directed to the corresponding author.
Conflicts of Interest
The authors declare no conflicts of interest.
References
- Baltensperger, D.; Rodrigues de Brito, H.;Mishra, S.;Øyvang, T.; Uhlen, K. An optimal reactive power pre-dispatch approach for minimizing active power losses, Front. Energy Res., vol. 13, no. November, pp. 1–12, 2025. [CrossRef]
- Sachan, S.; Mishra, S.; Øyvang, T.; Bordin, C. Reactive power reserve-constrained optimal reactive power dispatch for enhanced voltage stability, Energy Reports, vol. 14, no. October, pp. 3077–3092, 2025. [CrossRef]
- Pinzon, S.; Carrion, D.; Inga, E. Optimal Transmission Switching Considering N-1 Contingencies on Power Transmission Lines. IEEE Latin America Transactions 2021, 19, 534–541. [CrossRef]
- Carrión, D.; García, E.; Jaramillo, M.; González, J.W. A novel methodology for optimal svc location considering n-1 contingencies and reactive power flows reconfiguration. Energies 2021, 14. [CrossRef]
- Roy, R.; Das, T.; Mandal, K.K. Optimal reactive power dispatch using a novel optimization algorithm. Journal of Electrical Systems and Information Technology 2021, 8. [CrossRef]
- Villacrés, R.; Carrión, D. Optimizing Real and Reactive Power Dispatch Using a Multi-Objective Approach Combining the E-Constraint Method and Fuzzy Satisfaction. Energies 2023, 16. [CrossRef]
- Barutçu,İ. Ç.; Işiker, H.; Yamaçli, V.;Abaci, K.; Yetgin, Z. Optimal Reactive Power Dispatch Together with Uncertainties of Load and Renewable Energy Resources Proposing EBO-CMAR: Detailed Comparative Analysis with Literature, J. Electr. Eng. Technol., 2025. [CrossRef]
- Ismail, B.; Abdul Wahab, N.I.; Othman, M.L.; Radzi, M.A.M.; Naidu Vijyakumar, K.; Mat Naain, M.N. A Comprehensive Review on Optimal Location and Sizing of Reactive Power Compensation Using Hybrid-Based Approaches for Power Loss Reduction, Voltage Stability Improvement, Voltage Profile Enhancement and Loadability Enhancement. IEEE Access 2020, 8, 222733–222765. [CrossRef]
- Quinteros, F.; Carrión, D.; Jaramillo, M. Optimal Power Systems Restoration Based on Energy Quality and Stability Criteria. Energies 2022, 15. [CrossRef]
- Chamba, A.; Barrera-Singaña, C.; Arcos, H. Optimal Reactive Power Dispatch in Electric Transmission Systems Using the Multi-Agent Model with Volt-VAR Control. Energies 2023, 16, 1–25. [CrossRef]
- Megantoro, P.; Halim, S. A.; Kamari, N. A. M.; Awalin, L. J.; Ali, M. S.; Rosli, H. M. Optimizing reactive power dispatch with metaheuristic algorithms: A review of renewable distributed generation integration with intermittency considerations, Energy Reports, vol. 13, no. December 2024, pp. 397–423, 2025. [CrossRef]
- Abdel-Fatah, S.; Ebeed, M.; Kamel, S.; Yu, J. Reactive Power Dispatch Solution with Optimal Installation of Renewable Energy Resources Considering Uncertainties. IEEE Conference on Power Electronics and Renewable Energy, CPERE 2019 2019, pp. 118–122. [CrossRef]
- Ebeed, M.; Ali, A.; Mosaad, M.I.; Kamel, S. An improved lightning attachment procedure optimizer for optimal reactive power dispatch with uncertainty in renewable energy resources. IEEE Access 2020, 8, 168721–168731. [CrossRef]
- Feng, N.; Niu, T.; Yan, J.; Zhang, Y.; Feng, Y.;Lei, Y. Optimal Placement and Sizing of Reactive Power Compensation Devices in Power Grids with High Penetration of Distributed Generation, Processes, vol. 13, no. 9, pp. 1–16, 2025. [CrossRef]
- Saddique, M.S.; Bhatti, A.R.; Haroon, S.S.; Sattar, M.K.; Amin, S.; Sajjad, I.A.; ul Haq, S.S.; Awan, A.B.; Rasheed, N. Solution to optimal reactive power dispatch in transmission system using meta-heuristic techniques—Status and technological review. Electric Power Systems Research 2020, 178, 106031. [CrossRef]
- Khan, N.H.; Wang, Y.; Tian, D.; Jamal, R.; Kamel, S.; Ebeed, M. Optimal siting and sizing of SSSC using modified salp swarm algorithm considering optimal reactive power dispatch problem. IEEE Access 2021, 9, 49249–49266. [CrossRef]
- Jaramillo, M.; Tipán, L.; Muñoz, J. A novel methodology for optimal location of reactive compensation through deep neural networks. Heliyon 2022, 8. [CrossRef]
- Wei, Y.; Zhou, Y.; Luo, Q.; Deng, W. Optimal reactive power dispatch using an improved slime mould algorithm. Energy Reports 2021, 7, 8742–8759. [CrossRef]
- Shami, T.M.; El-Saleh, A.A.; Alswaitti, M.; Al-Tashi, Q.; Summakieh, M.A.; Mirjalili, S. Particle Swarm Optimization: A Comprehensive Survey. IEEE Access 2022, 10, 10031–10061. [CrossRef]
- Zhang, M.; Li, Y. Multi-Objective Optimal Reactive Power Dispatch of Power Systems by Combining Classification-Based Multi-Objective Evolutionary Algorithm and Integrated Decision Making. IEEE Access 2020, 8, 38198–38209. [CrossRef]
- Jamal, R.; Men, B.; Khan, N.H. A Novel Nature Inspired Meta-Heuristic Optimization Approach of GWO Optimizer for Optimal Reactive Power Dispatch Problems. IEEE Access 2020, 8, 202596–202610. [CrossRef]
- Hassan, M.H.; Kamel, S.; El-Dabah, M.A.; Khurshaid, T.; Dominguez-Garcia, J.L. Optimal Reactive Power Dispatch with Time-Varying Demand and Renewable Energy Uncertainty Using Rao-3 Algorithm. IEEE Access 2021, 9, 23264–23283. [CrossRef]
- Muhammad, Y.; Khan, R.; Raja, M.A.Z.; Ullah, F.; Chaudhary, N.I.; He, Y. Solution of optimal reactive power dispatch with FACTS devices: A survey. Energy Reports 2020, 6, 2211–2229. [CrossRef]
- Al Ahmad, A.; Sirjani, R. Optimal placement and sizing of multi-type FACTS devices in power systems using metaheuristic optimisation techniques: An updated review. Ain Shams Engineering Journal 2020, 11, 611–628. [CrossRef]
- Abou El-Ela, A.A.; El-Sehiemy, R.A.; Shaheen, A.M.; Eissa, I.A. Optimal coordination of static VAR compensators, fixed capacitors, and distributed energy resources in Egyptian distribution networks. International Transactions on Electrical Energy Systems 2020, 30, 1–26. [CrossRef]
- Chethan, M.; Kuppan, R. A review of FACTS device implementation in power systems using optimization techniques. Journal of Engineering and Applied Science 2024, 71, 1–36. [CrossRef]
- Jaramillo, M.D.; Carrión, D.F. Optimizing Critical Overloaded Power Transmission Lines with a Novel Unified SVC Deployment Approach Based on FVSI Analysis. Energies 2024, 17. [CrossRef]
- Gupta, S.K.; Mallik, S.K. Enhancement in Voltage Stability Using FACTS Devices Under Contingency Conditions. Journal of Operation and Automation in Power Engineering 2024, 12, 365–378. [CrossRef]
- Suarez-Patiño, J. E.; Gallego-Pareja, L. A.; Gómez-Carmona, O. Optimal placement, sizing and operation of D-STATCOMs in power distribution systems using a Mixed-Integer Linear Programming model, Results Eng., vol. 26, no. January, p. 104749, 2025. [CrossRef]
- Romero, D.; Carrión, D.; Jaramillo, M. Electrical Power Systems Reinforcement through Overall Contingency Index Analysis and Improvement. Energies 2024, 17, 1–15. [CrossRef]
Figure 1.
Overview of the contingency-driven planning framework for shunt compensation placement.
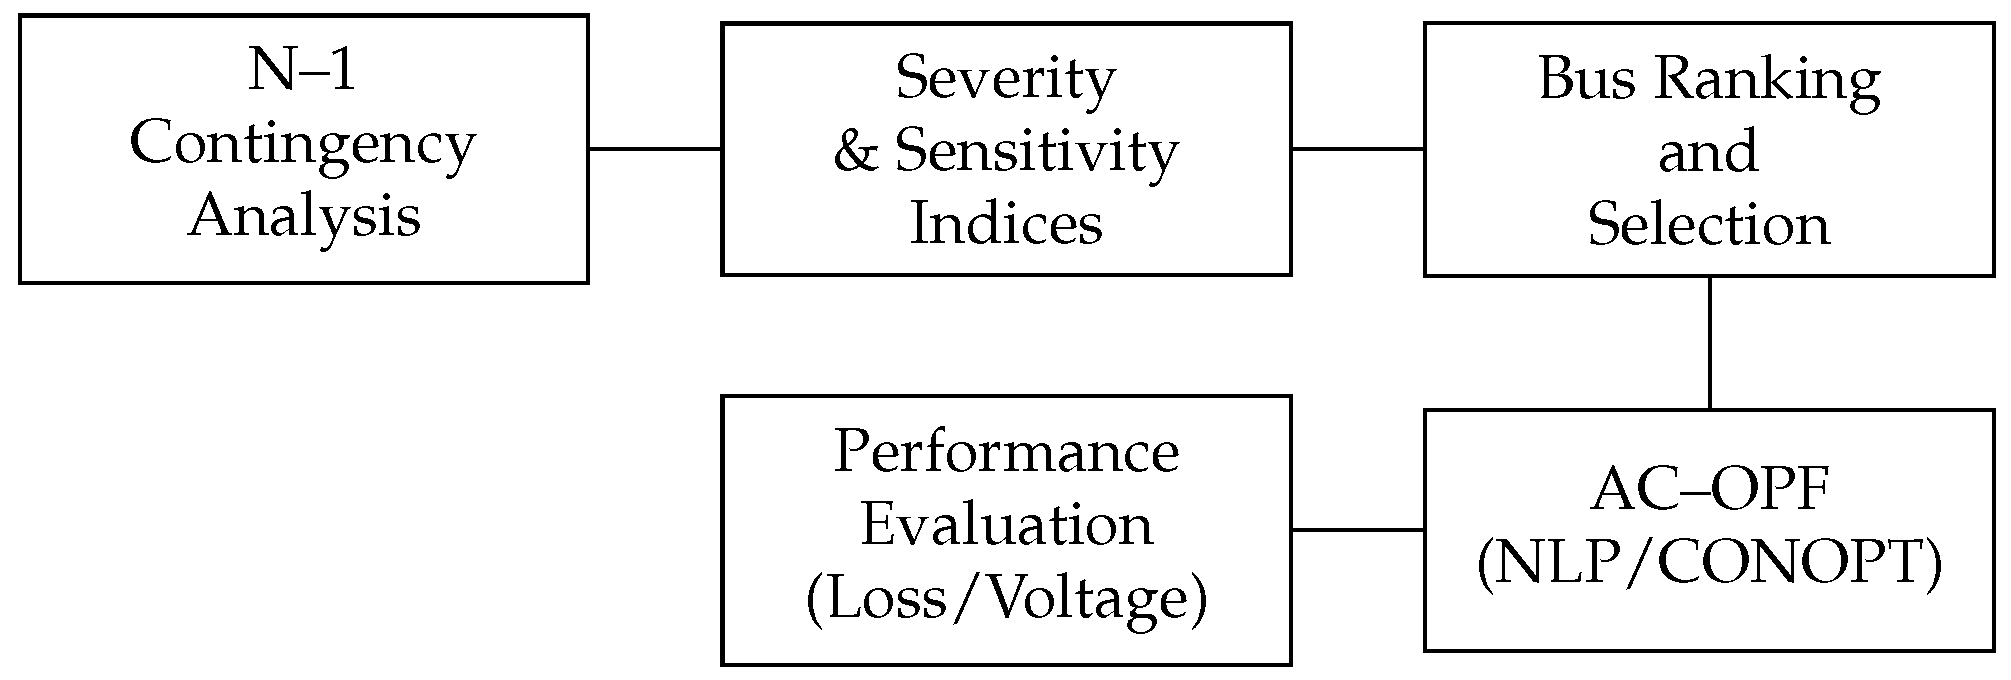
Figure 2.
IEEE 14-bar system
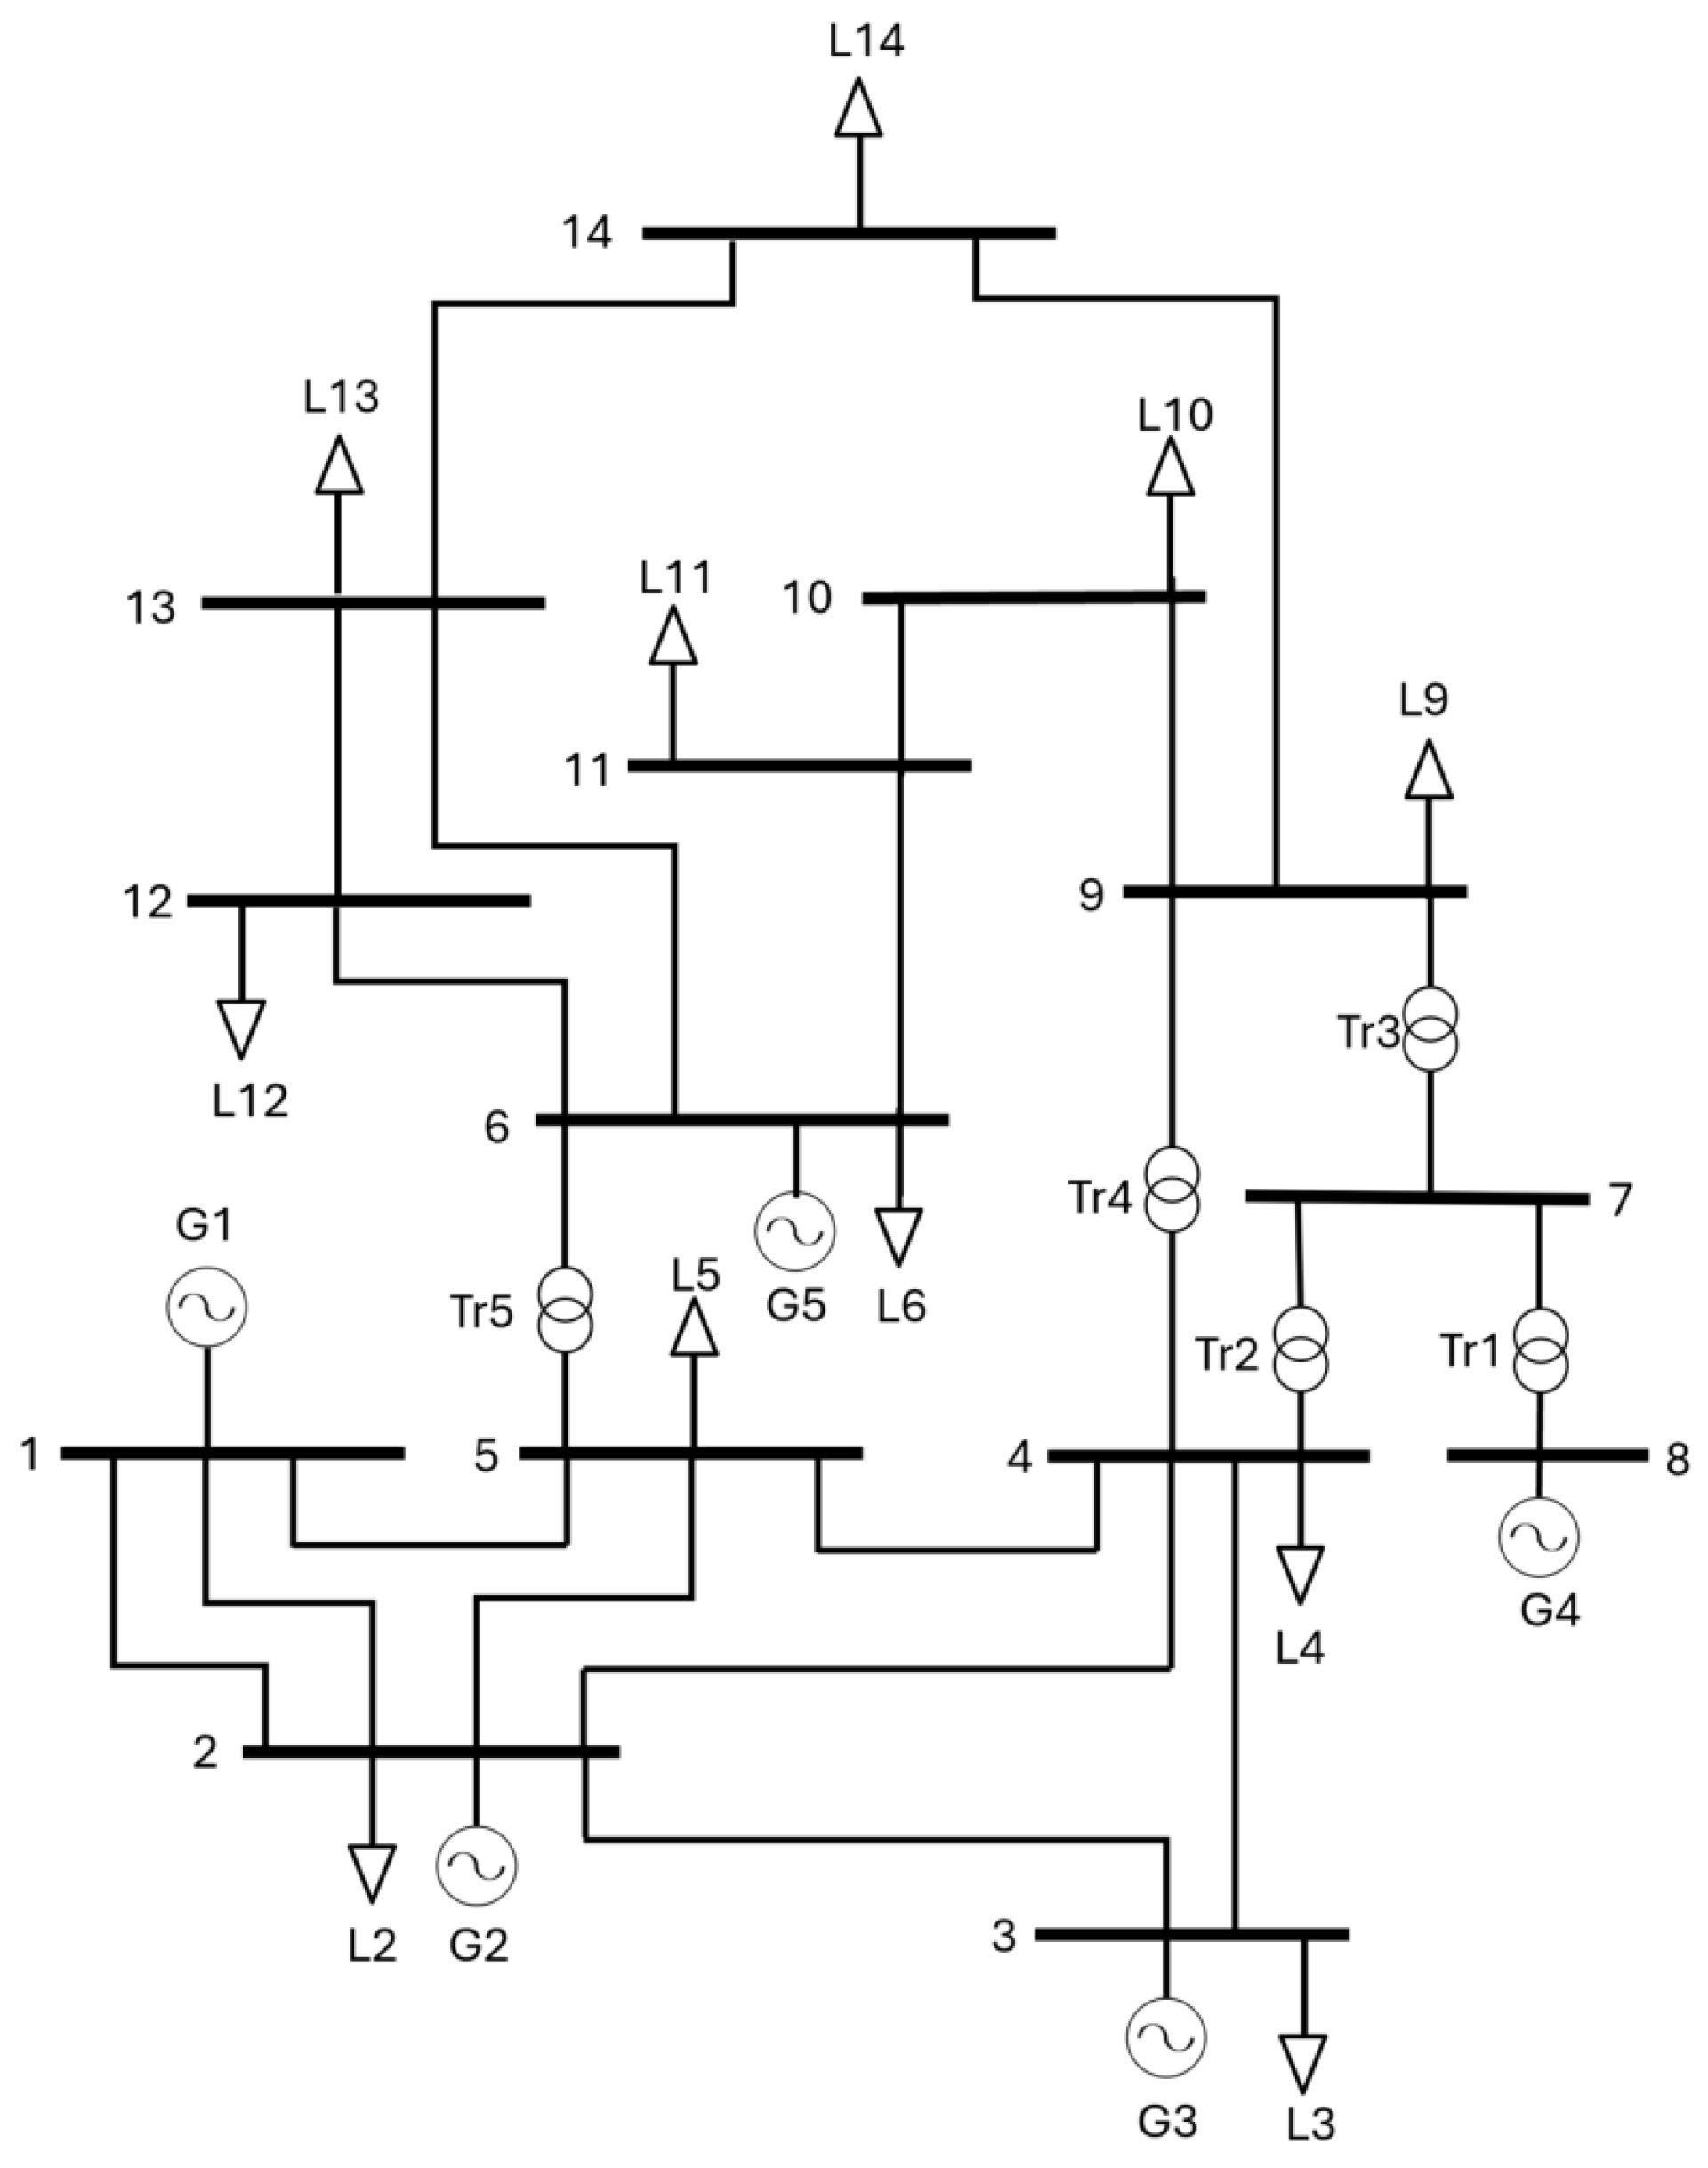
Figure 3.
Total J for each contingency N-1.
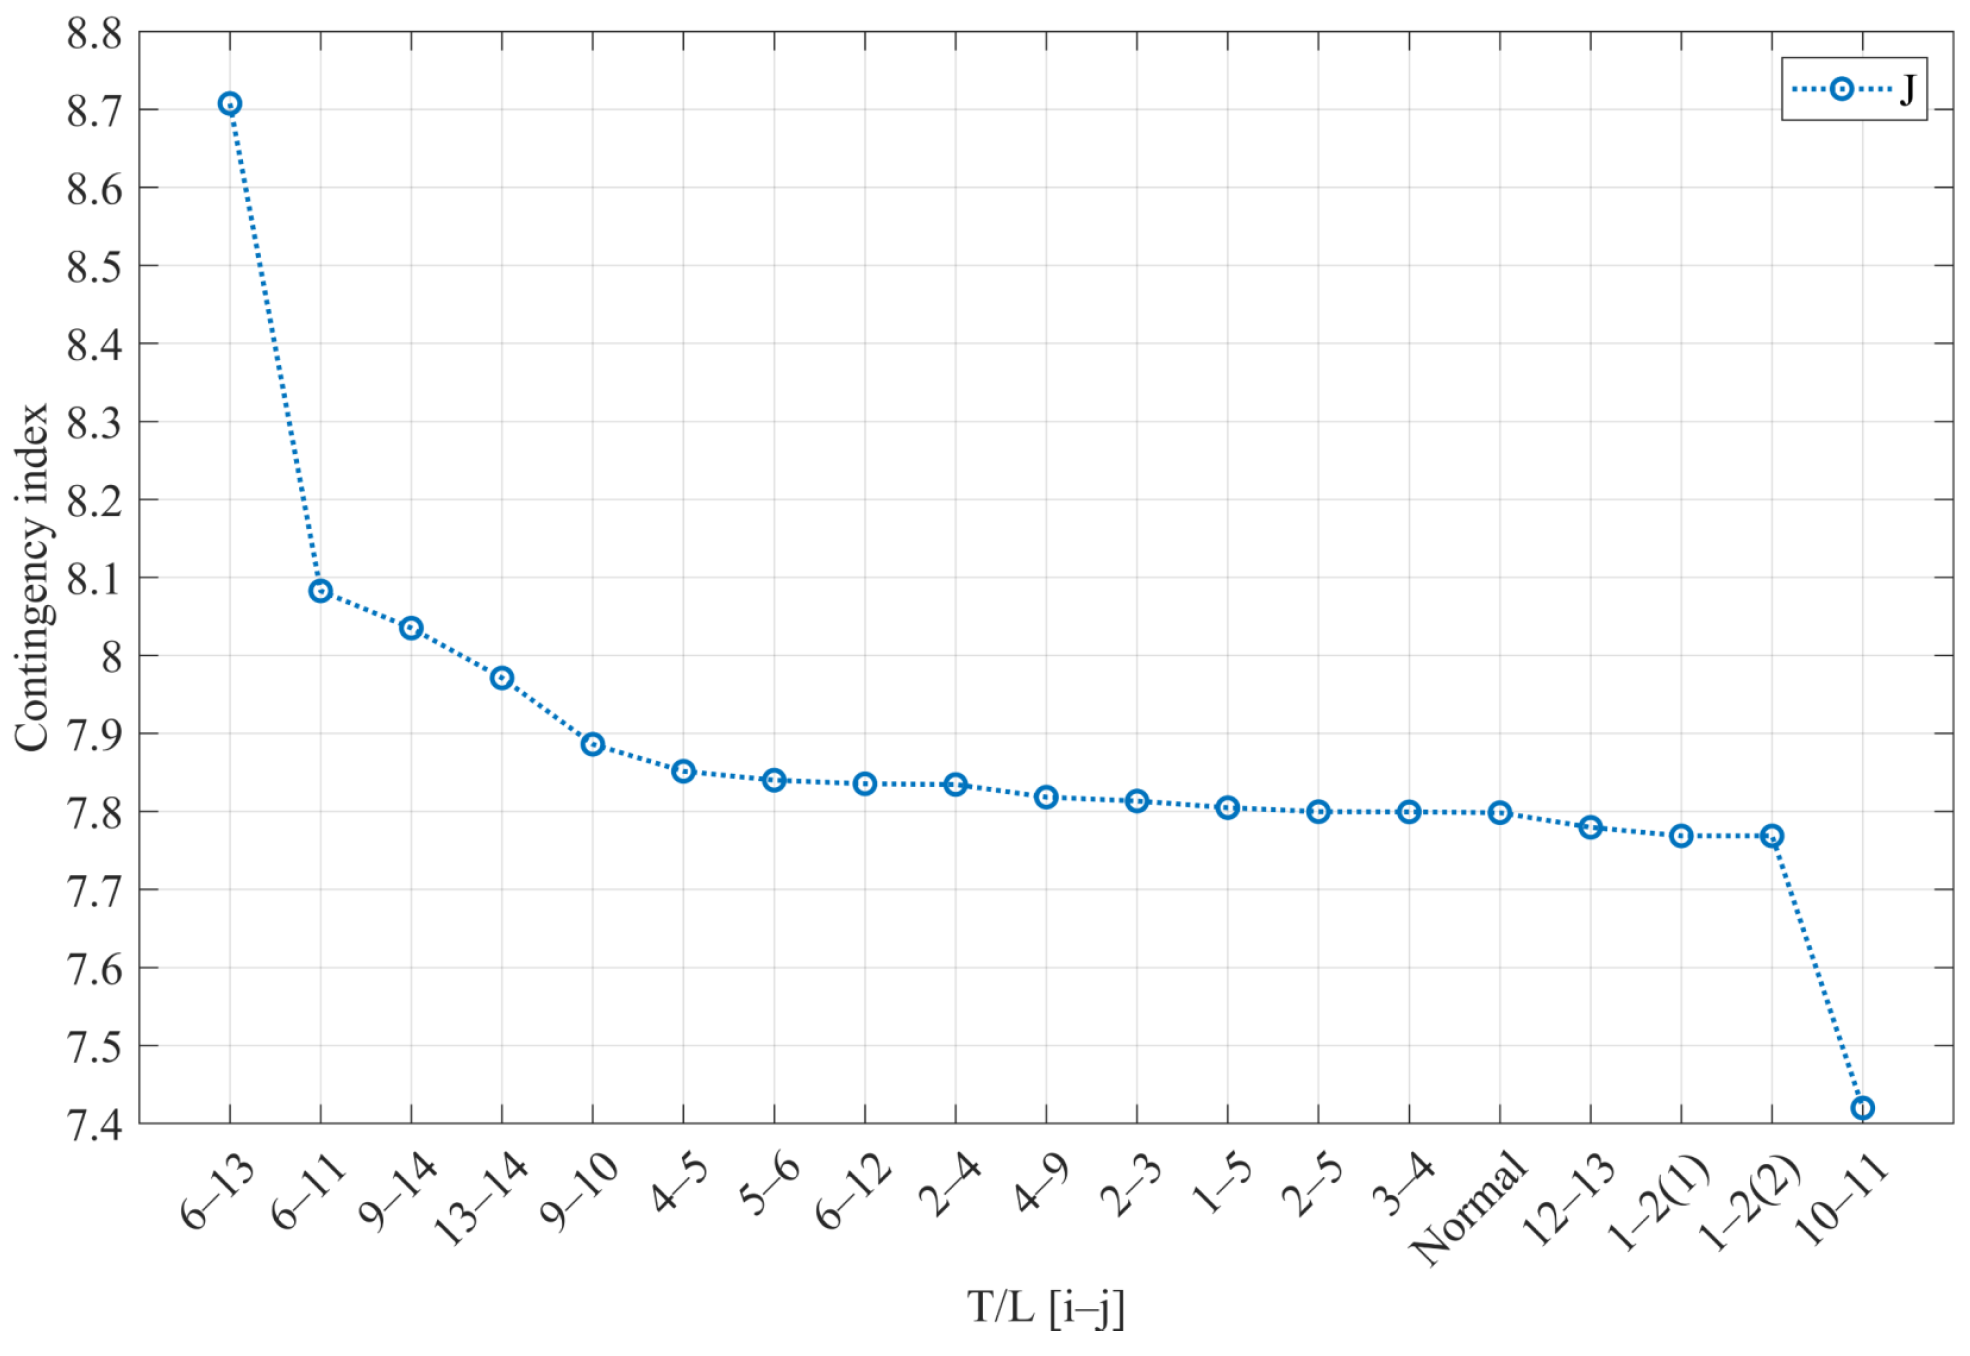
Figure 4.
Active power loss evaluation.
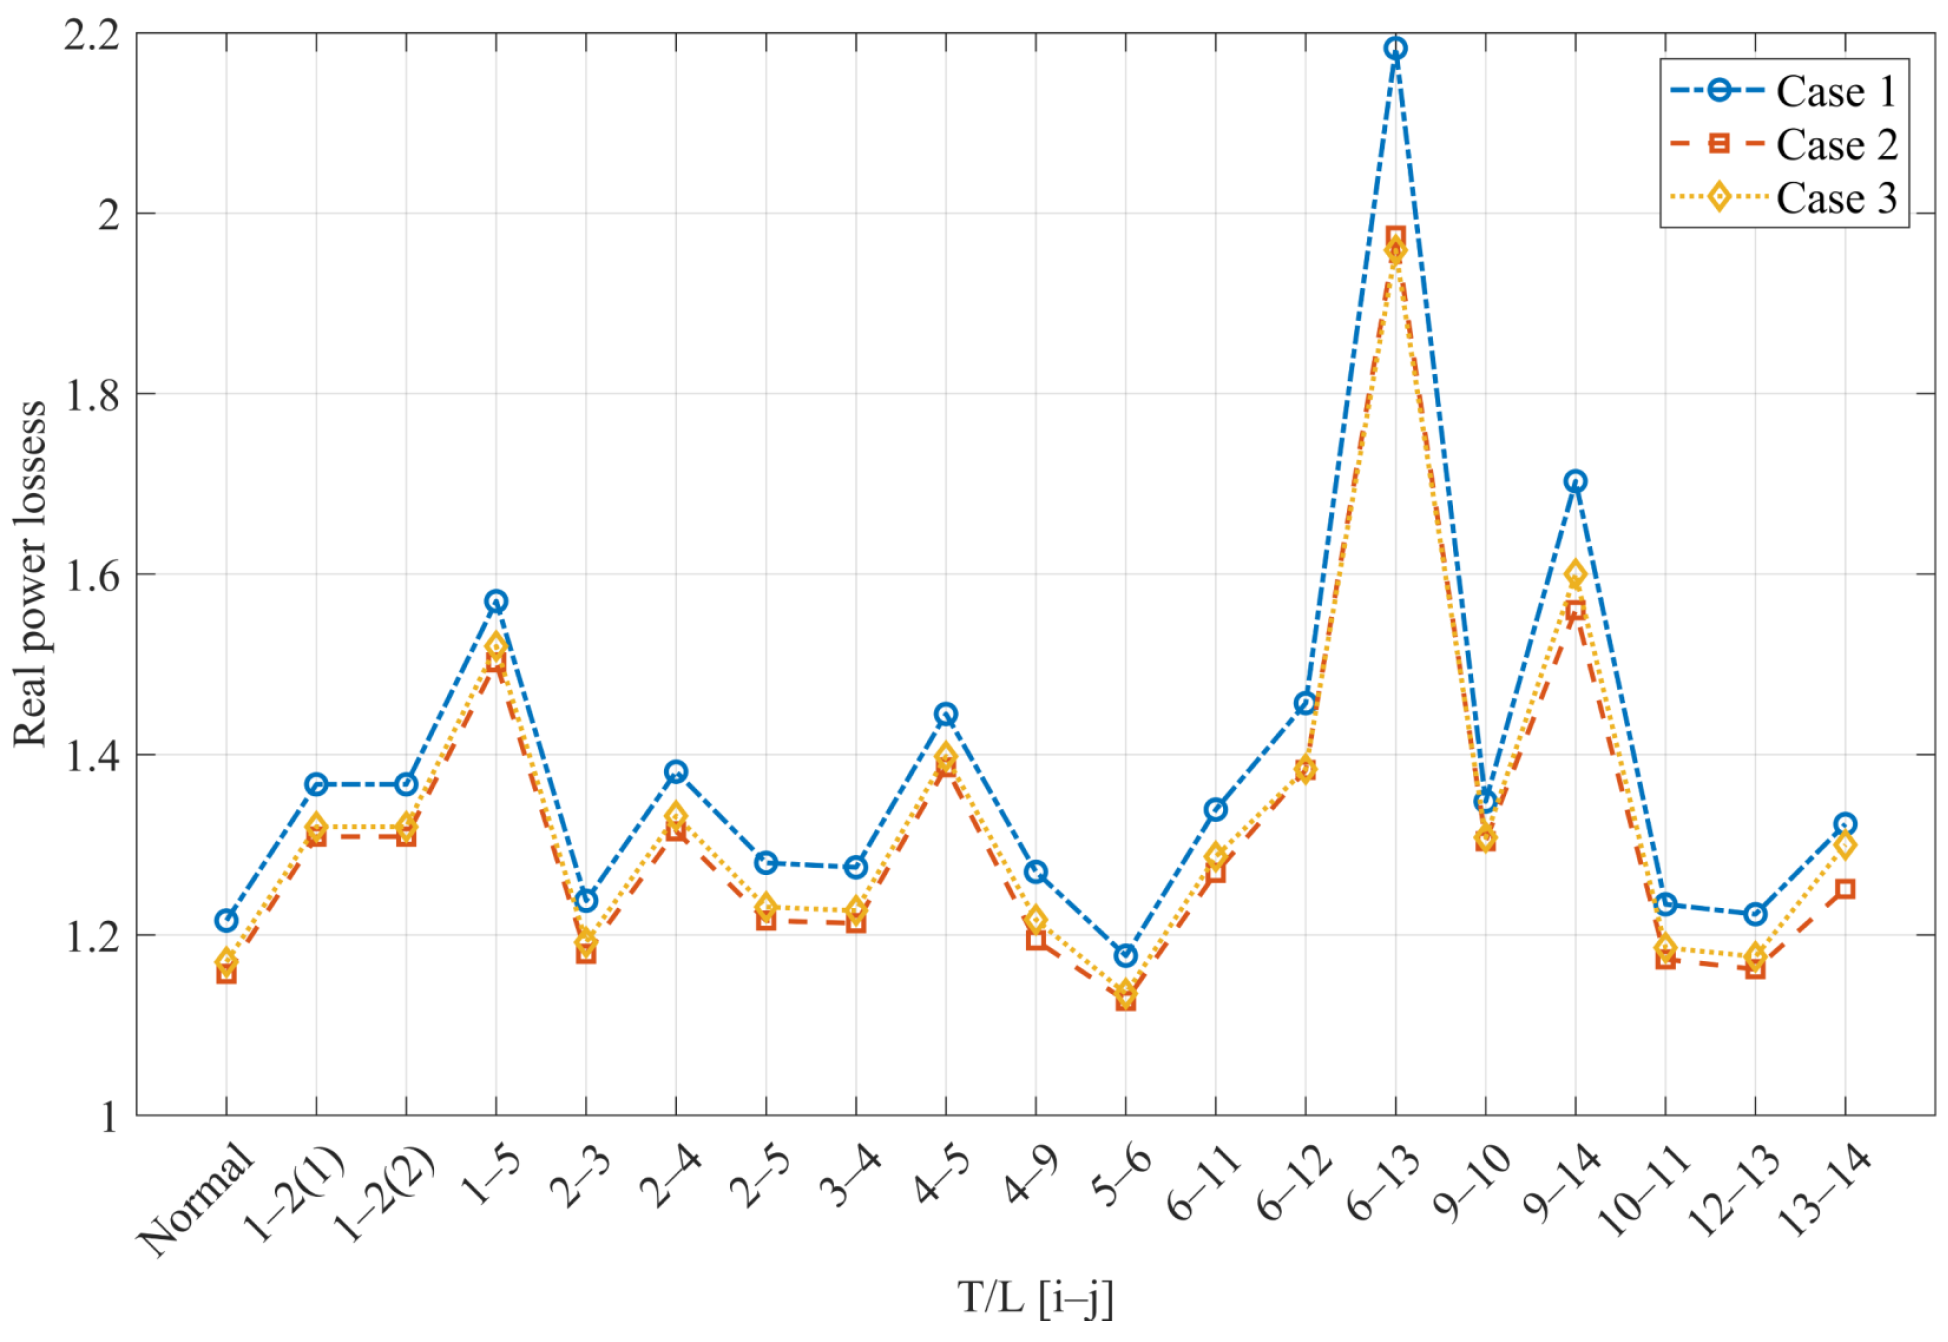
Figure 5.
14-bar IEEE system with compensation.
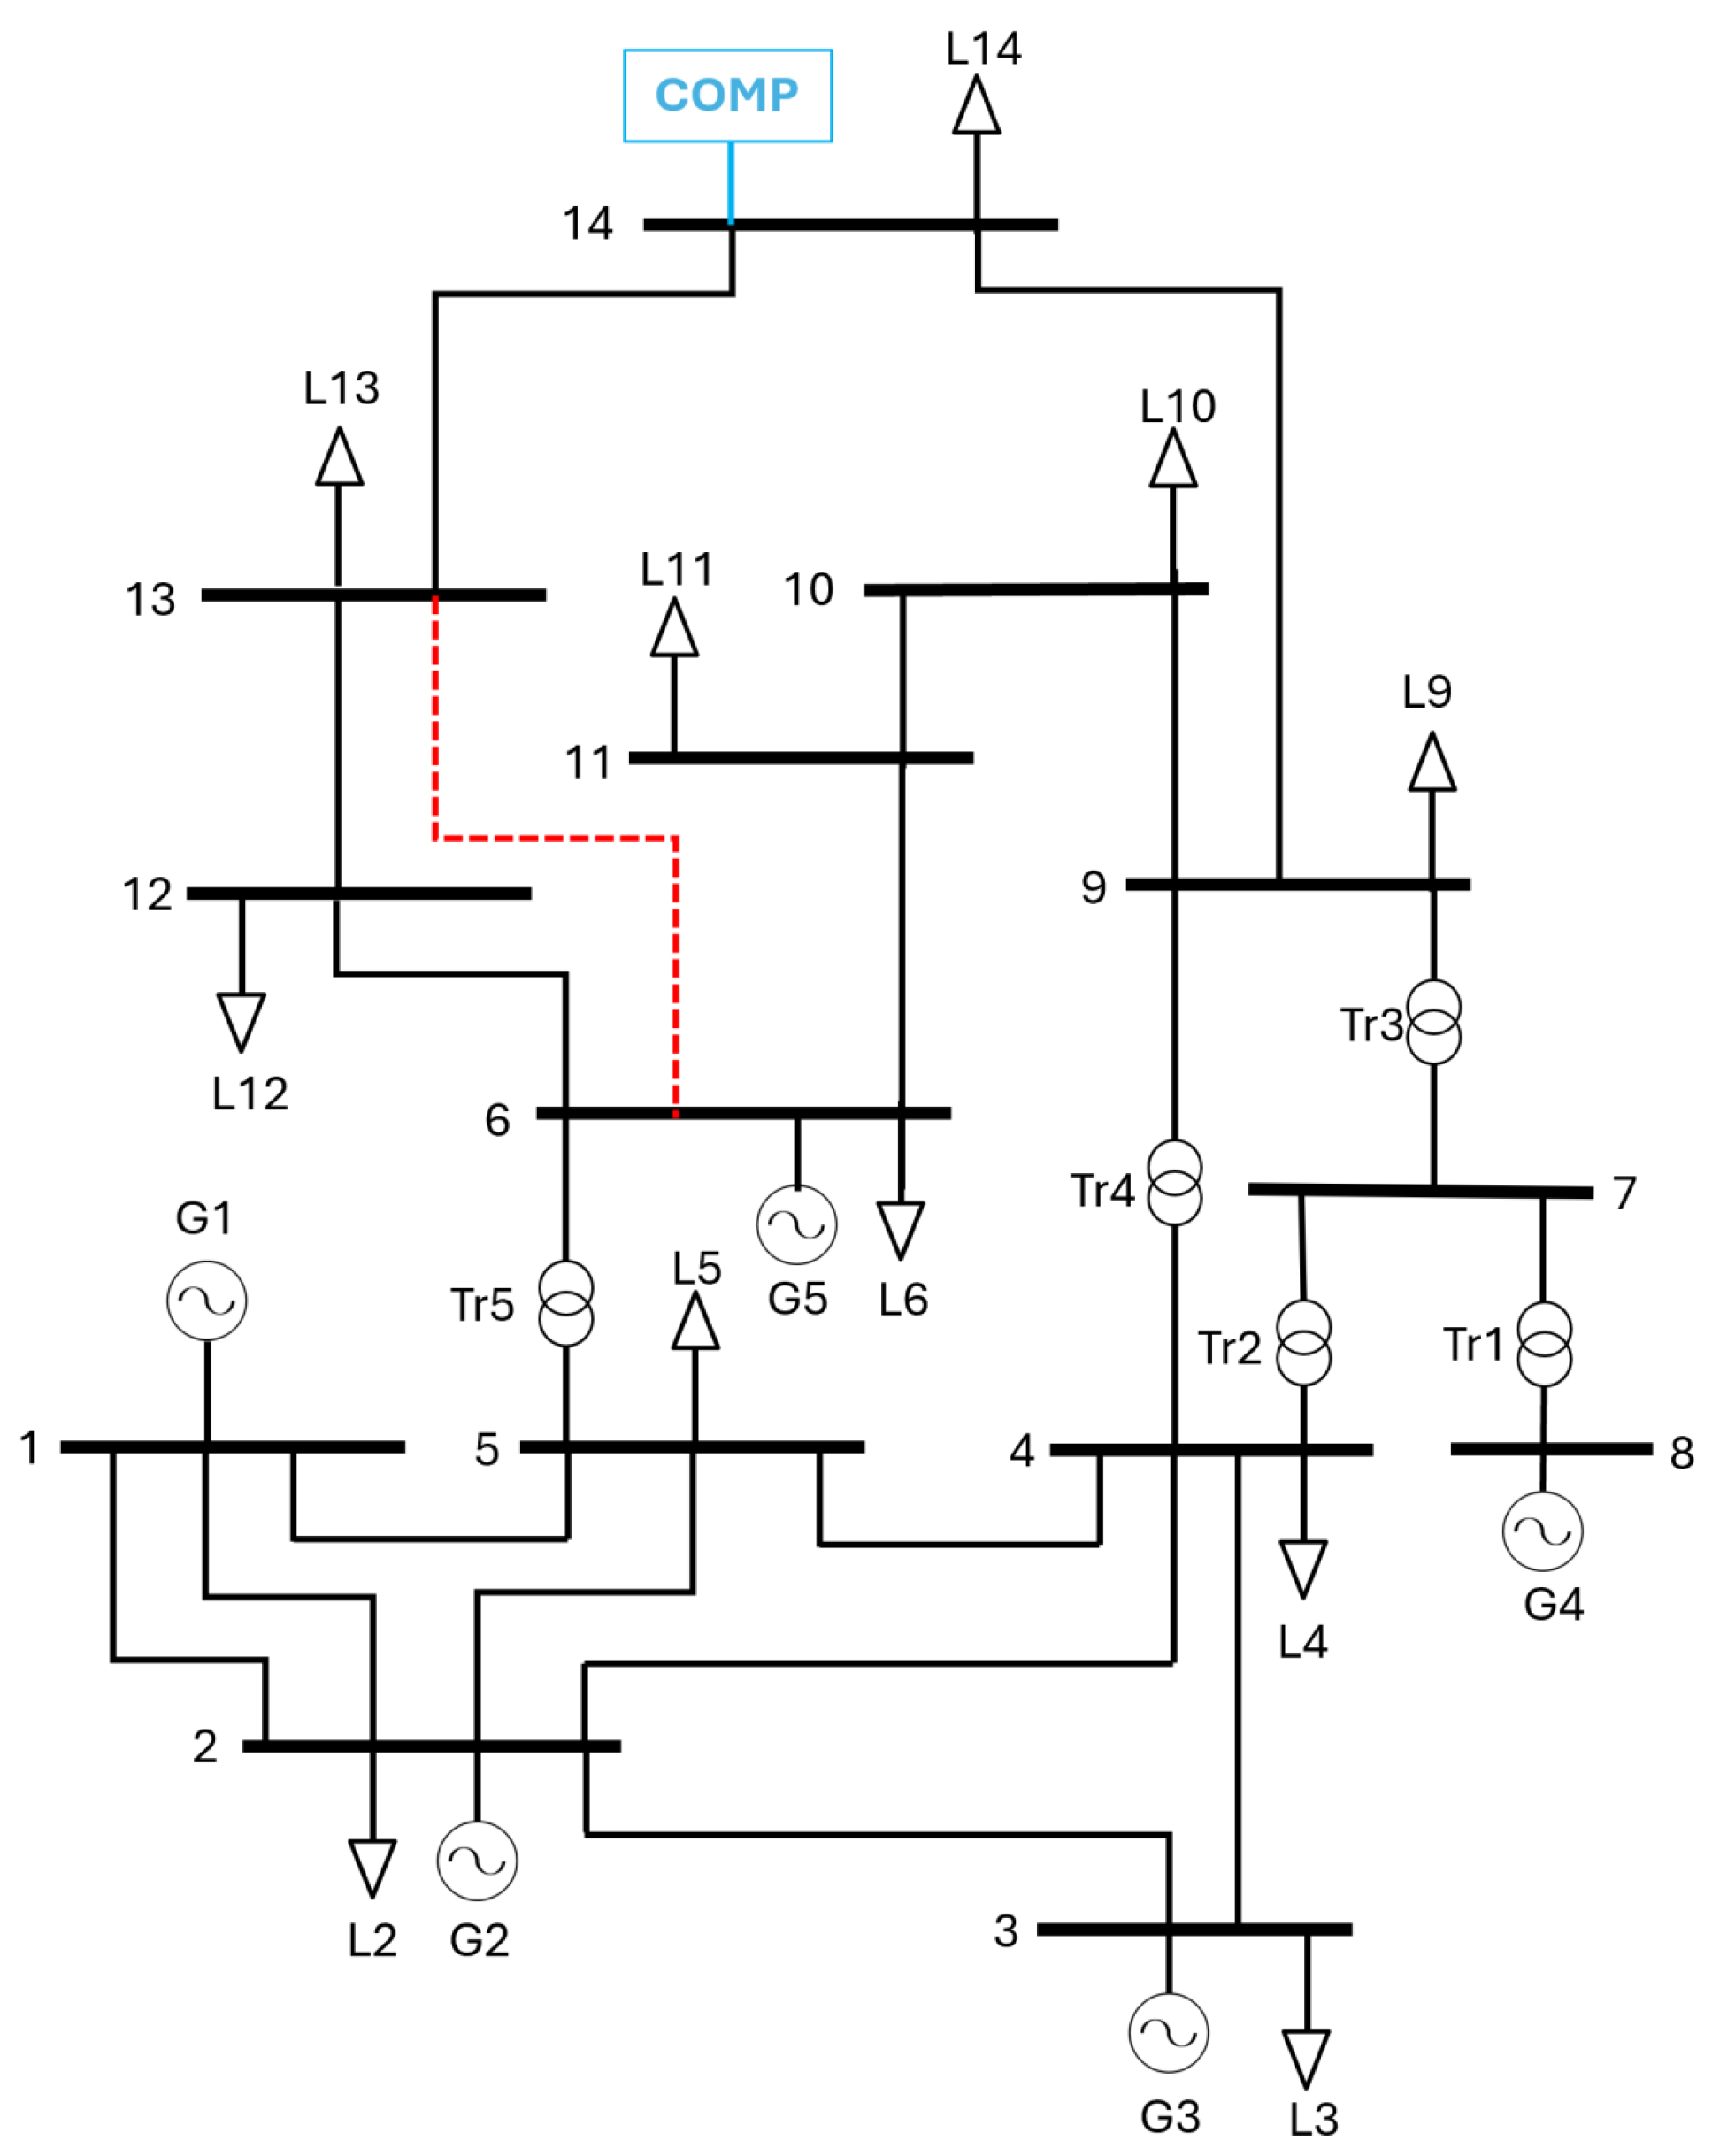
Figure 6.
Voltage profiles of the 14-bar IEEE system.
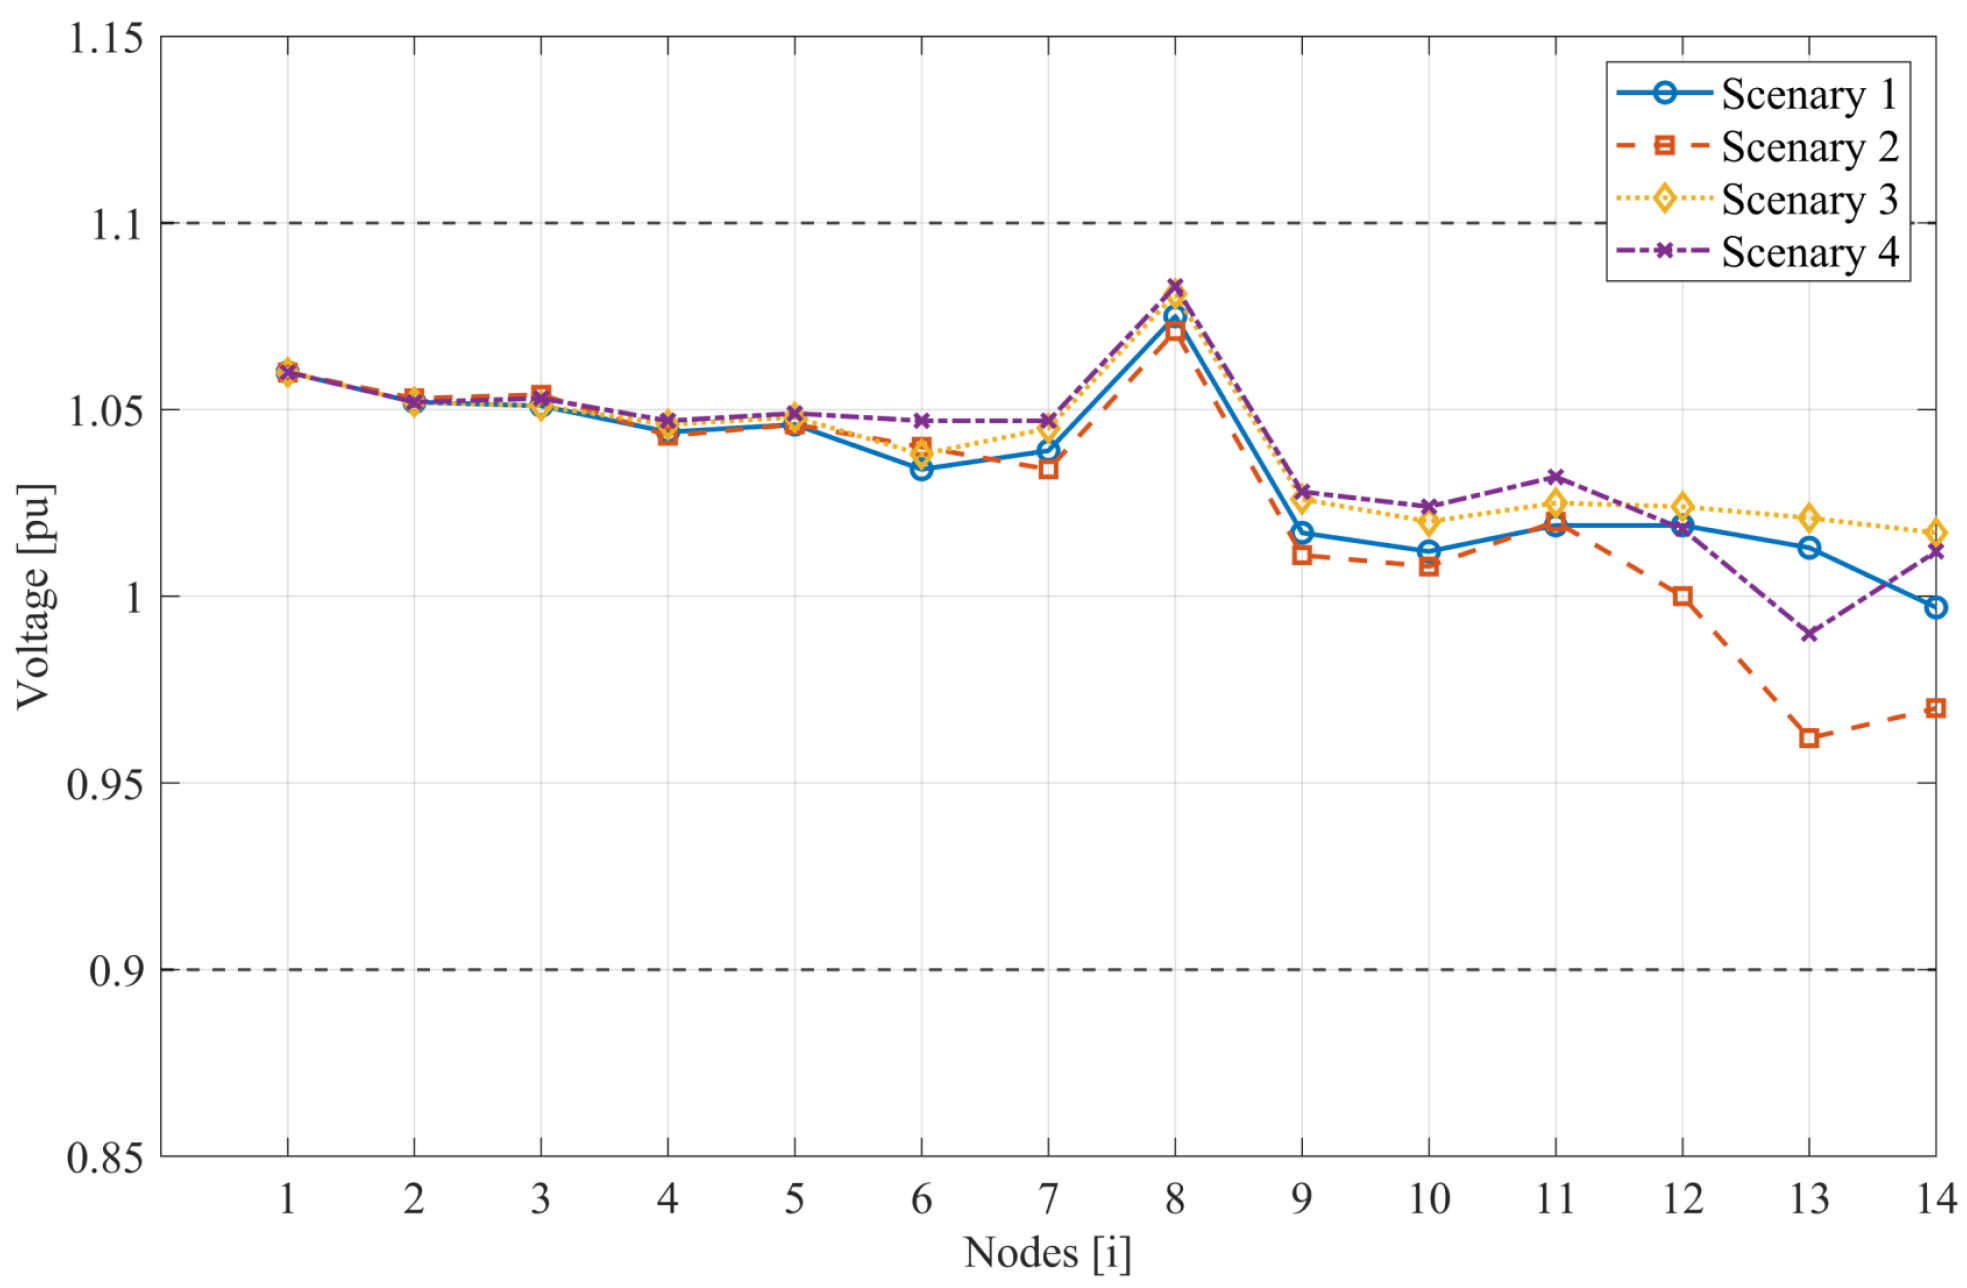
Figure 7.
Real power flow of the 14-bar IEEE system.
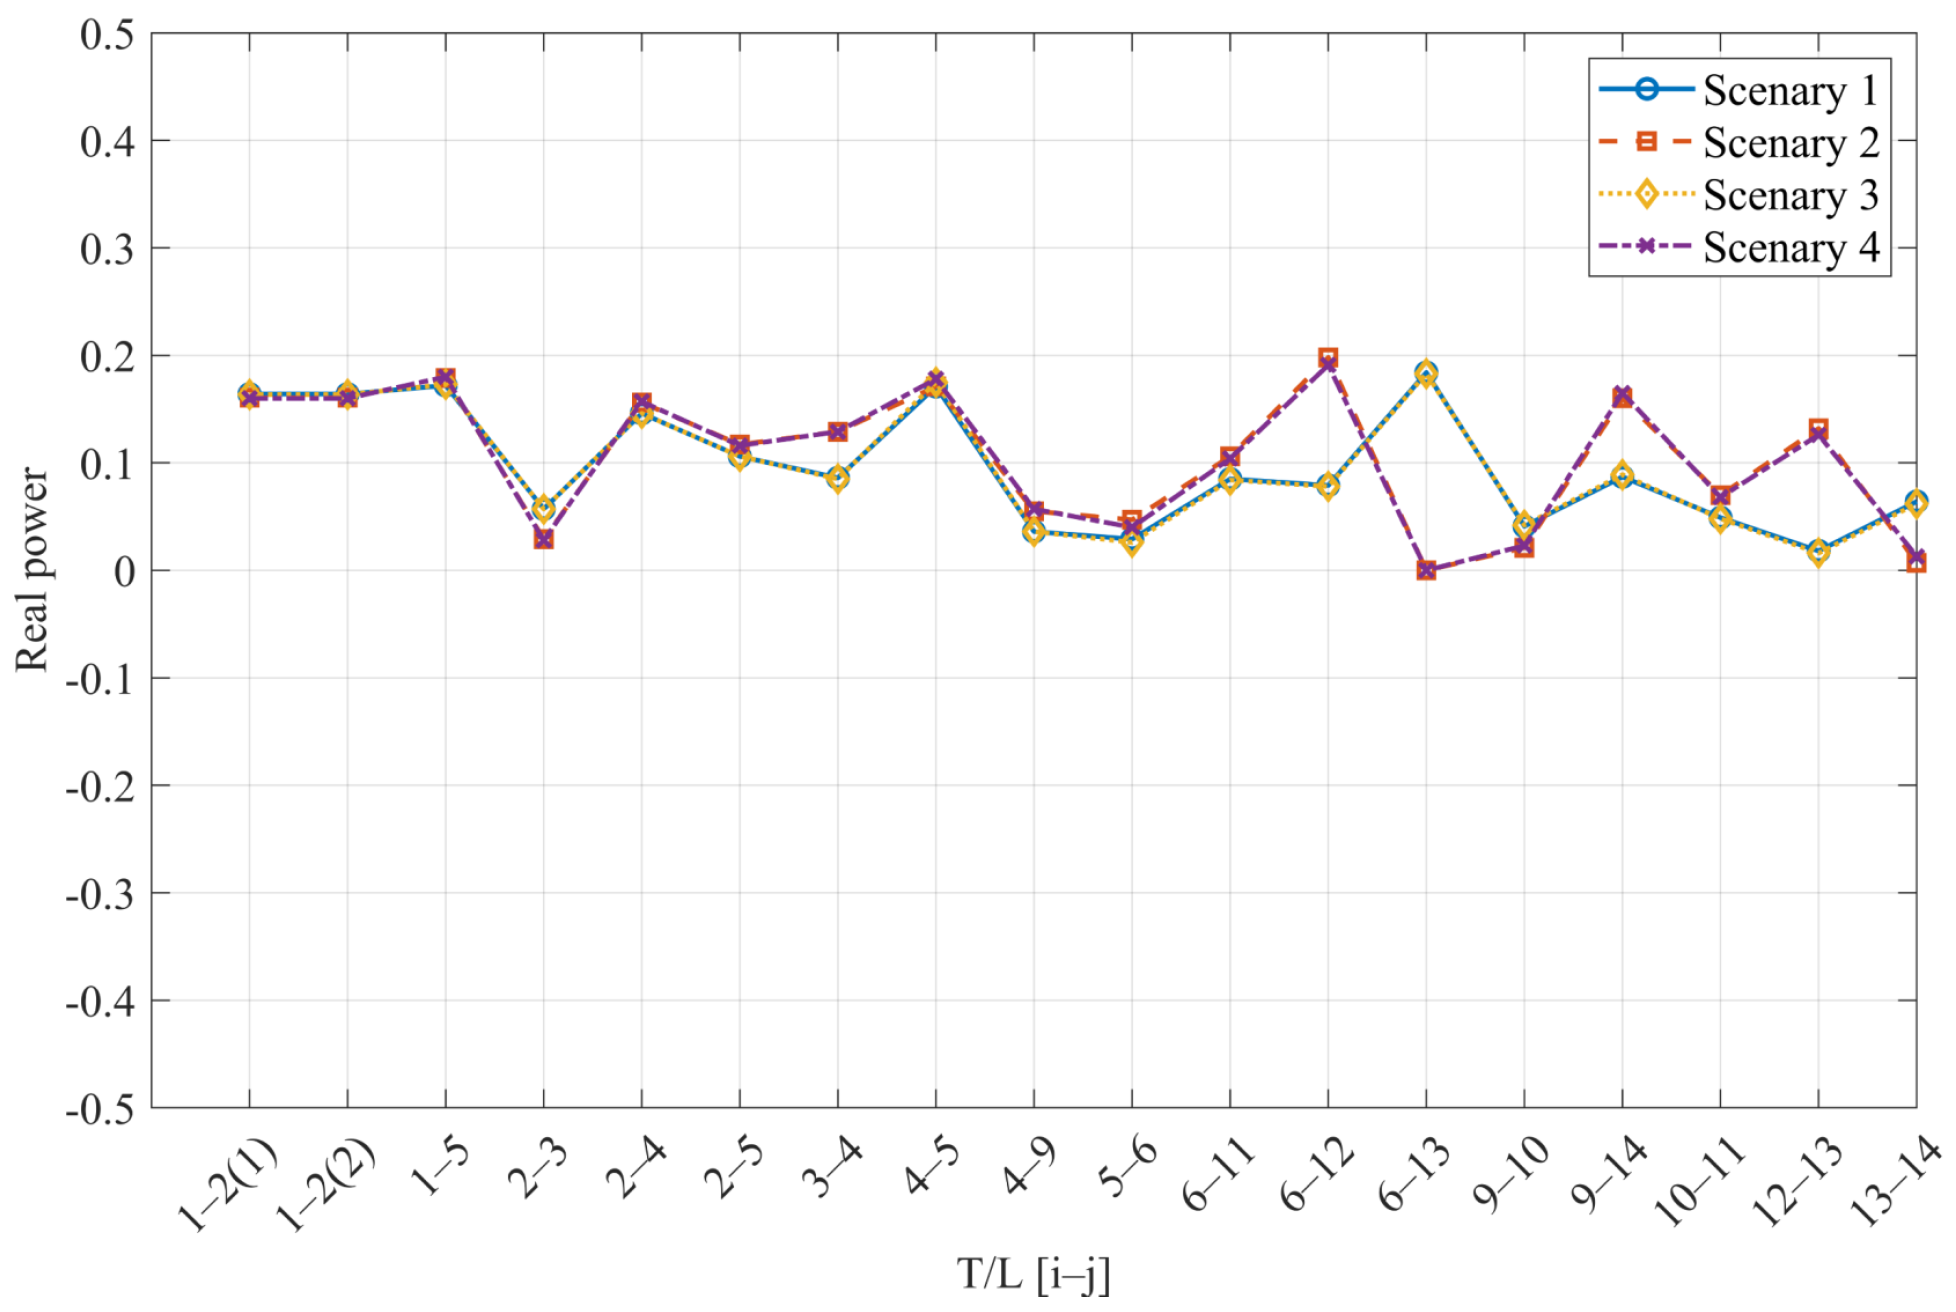
Figure 8.
Reactive power flow of the 14-bar IEEE system.
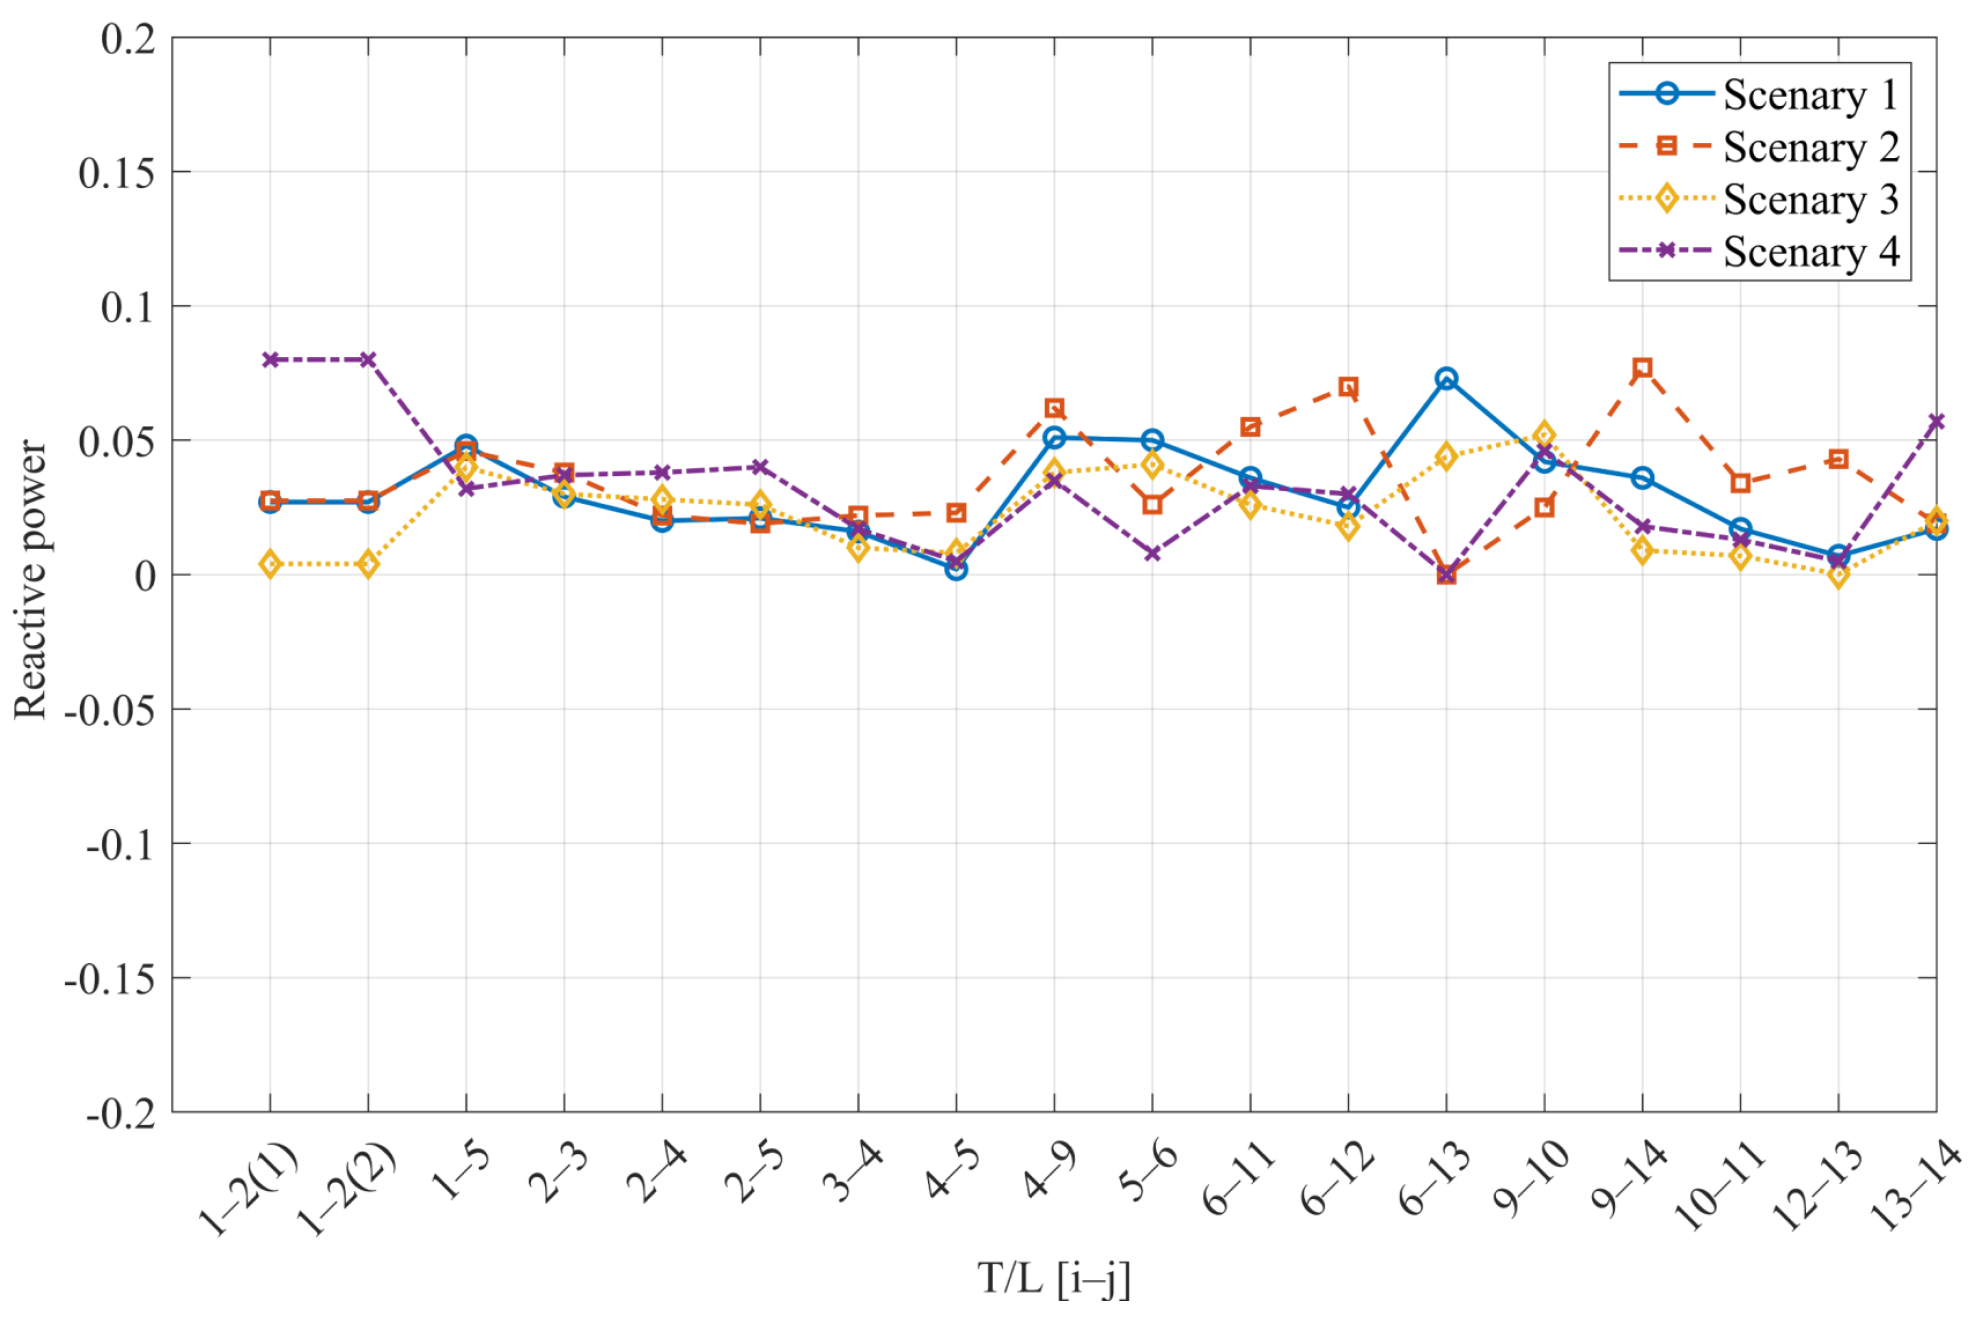
Figure 9.
Voltage angle of the 14-bar IEEE system.
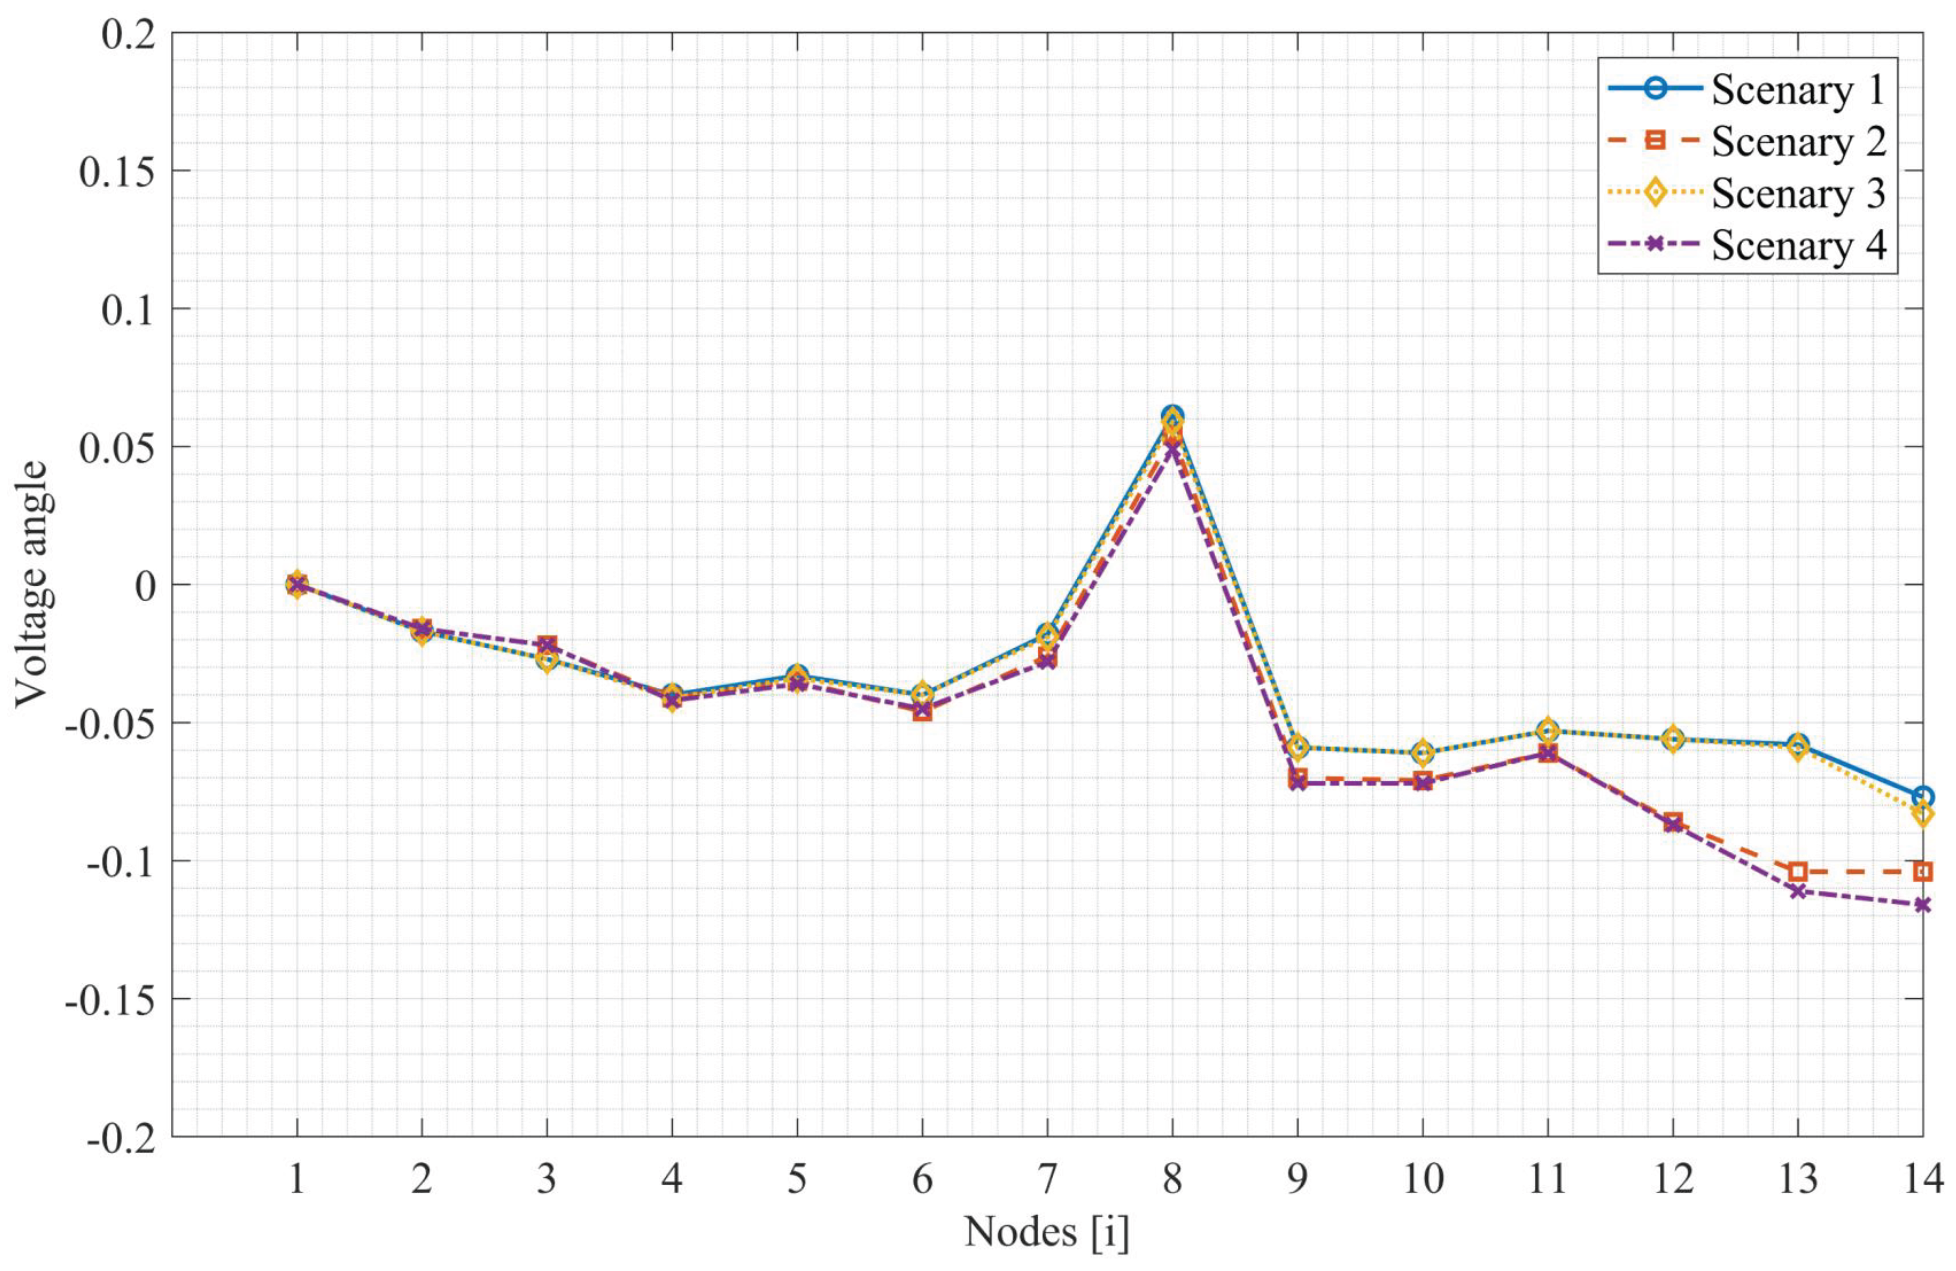

Table 1.
Generator data.
| Bus | a | b | c | |||||
|---|---|---|---|---|---|---|---|---|
| 1 | 50 | 500 | 0 | 10 | 0.007 | 7 | 240 | 1.06 |
| 2 | 20 | 200 | -40 | 50 | 0.0095 | 10 | 200 | 1.045 |
| 3 | 20 | 300 | 0 | 40 | 0.009 | 8.5 | 220 | 1.01 |
| 6 | 20 | 150 | -6 | 24 | 0.009 | 11 | 200 | 1.07 |
| 8 | 20 | 200 | -6 | 24 | 0.008 | 10.5 | 200 | 1.09 |
Table 2.
Load data.
| Bus | P | Q | Bus | P | Q |
|---|---|---|---|---|---|
| 1 | 0 | 0 | 8 | 0 | 0 |
| 2 | 21.7 | 12.7 | 9 | 0 | 0 |
| 3 | 94.2 | 19 | 10 | 9 | 5.8 |
| 4 | 47.8 | -3.9 | 11 | 3.5 | 1.8 |
| 5 | 7.6 | 1.6 | 12 | 6.1 | 1.6 |
| 6 | 11.2 | 7.5 | 13 | 13.5 | 5.8 |
| 7 | 0 | 0 | 14 | 14.9 | 5 |
Table 3.
Lines data.
| Line [i–j] | r | x | b | SIL |
|---|---|---|---|---|
| 1–2 | 0.01938 | 0.05917 | 0.0528 | 200 |
| 1–5 | 0.05403 | 0.22304 | 0.0492 | 100 |
| 2–3 | 0.04699 | 0.19797 | 0.0438 | 100 |
| 2–4 | 0.05811 | 0.17632 | 0.0340 | 100 |
| 2–5 | 0.05695 | 0.17388 | 0.0346 | 100 |
| 3–4 | 0.06701 | 0.17103 | 0.0128 | 50 |
| 4–5 | 0.01335 | 0.04211 | 0 | 100 |
| 4–7 | 0 | 0.20912 | 0 | 50 |
| 4–9 | 0 | 0.55618 | 0 | 50 |
| 5–6 | 0 | 0.25202 | 0 | 100 |
| 6–11 | 0.09498 | 0.19890 | 0 | 50 |
| 6–12 | 0.12291 | 0.25581 | 0 | 20 |
| 6–13 | 0.06615 | 0.13027 | 0 | 50 |
| 7–8 | 0 | 0.17615 | 0 | 50 |
| 7–9 | 0 | 0.11001 | 0 | 50 |
| 9–10 | 0.03181 | 0.08450 | 0 | 20 |
| 9–14 | 0.12711 | 0.27038 | 0 | 20 |
| 10–11 | 0.08205 | 0.19207 | 0 | 20 |
| 12–13 | 0.22092 | 0.19988 | 0 | 20 |
| 13–14 | 0.17093 | 0.34802 | 0 | 20 |
Table 4.
Ranking of candidate buses for shunt compensation under the critical N–1 contingency
| Bus | (p.u.) | Rank | |
|---|---|---|---|
| 14 | 0.970 | 0.041 | 1 |
| 13 | 0.962 | 0.025 | 2 |
| 12 | 1.000 | 0.018 | 3 |
| 10 | 1.008 | 0.012 | 4 |
| 9 | 1.011 | 0.009 | 5 |
Disclaimer/Publisher’s Note: The statements, opinions and data contained in all publications are solely those of the individual author(s) and contributor(s) and not of MDPI and/or the editor(s). MDPI and/or the editor(s) disclaim responsibility for any injury to people or property resulting from any ideas, methods, instructions or products referred to in the content. |
© 2026 by the authors. Licensee MDPI, Basel, Switzerland. This article is an open access article distributed under the terms and conditions of the Creative Commons Attribution (CC BY) license (http://creativecommons.org/licenses/by/4.0/).
Copyright: This open access article is published under a Creative Commons CC BY 4.0 license, which permit the free download, distribution, and reuse, provided that the author and preprint are cited in any reuse.


