Submitted:
29 January 2026
Posted:
30 January 2026
You are already at the latest version
Abstract
Background: Speckle-tracking echocardiography (STE) has been increasingly used to uncover subtle cardiac dysfunction in patients with extracardiac sarcoidosis (ECS) who show no clinical evidence of heart disease. However, prior investigations were mostly retrospective, methodologically heterogeneous, and focused primarily on left ventricular (LV) function. We conducted a prospective study to provide a broader evaluation of myocardial deformation across both ventricles and atria in ECS without fibrotic pulmonary involvement. Methods: Forty-one patients with ECS (mean age 57.4±10.2 years; 58.5% male) and 30 age- and sex-matched controls without ECS and without known structural heart disease (58.5±11.1 years; 53.3% male) were enrolled. All participants underwent conventional transthoracic echocardiography (TTE) supplemented by comprehensive STE analysis of ventricular and atrial function. Subclinical myocardial dysfunction was defined as LV global longitudinal strain (GLS) less negative than –20%, and potential predictors were analyzed. Results: Standard TTE did not show echocardiographic features suggestive of overt infiltrative cardiomyopathy but revealed higher E/average e′ ratios in the ECS group, suggesting subtle diastolic dysfunction. While traditional indices of biventricular systolic function remained preserved, STE demonstrated significant reductions in LV-GLS, LV global circumferential strain, right ventricular-GLS, and both left and right atrial reservoir strain. Multivariate analysis identified disease duration as the sole independent determinant of LV-GLS impairment (OR 2.26, 95%CI 1.10–4.65; p=0.03). A disease duration of ≥4.5 years predicted abnormal GLS with 88% sensitivity and 75% specificity (AUC 0.89; 95%CI 0.76–1.00). Conclusions: ECS without fibrotic pulmonary involvement is associated with early impairment of biventricular and biatrial strain despite preserved conventional function. The extent of dysfunction correlates strongly with disease duration, underscoring the value of STE for early detection and monitoring.
Keywords:
sarcoidosis
; subclinical myocardial dysfunction
; global longitudinal strain
; left atrial reservoir strain
; right atrial reservoir strain
; apical sparing pattern
1. Introduction
Sarcoidosis is a multisystem inflammatory disorder of unknown cause, defined by non-caseating granuloma formation in affected organs and associated with substantial morbidity [1]. Although pulmonary and mediastinal disease are most common—occurring in roughly 80% of cases—granulomatous inflammation can also involve the skin, parotid glands, spleen, liver, central nervous system, bone, eyes, lymph nodes, and the heart [2].
In systemic sarcoidosis, the reported prevalence of cardiac involvement varies widely (≈3.7%–54.9%), reflecting differences in the populations studied [3,4]. Up to one-third of patients with cardiac involvement are completely asymptomatic, while only about 5% manifest clinically overt cardiac sarcoidosis (CS) [5]. When present, CS most often presents with conduction disease, arrhythmias, or heart failure [6]. Because cardiac involvement is a leading cause of sarcoidosis-related mortality [7], early recognition of myocardial granulomatous infiltration is clinically crucial.
Initial screening for CS typically includes a targeted history, physical examination, and a 12-lead electrocardiogram (ECG) [8]. However, abnormal ECG findings are not specific for CS and therefore have limited diagnostic value on their own [9].
Late gadolinium enhancement cardiac magnetic resonance (LGE-CMR) and 18F-fluorodeoxyglucose positron emission tomography (FDG-PET) provide higher diagnostic sensitivity and specificity for CS [10,11]. Despite these advantages, routine use for systematic screening is constrained by cost and availability (CMR), patient-related limitations (e.g., obesity, renal dysfunction, or cardiac devices for CMR), and radiation exposure (PET). Endomyocardial biopsy is likewise unsuitable as a screening tool because it is invasive and has low sensitivity in a disease characterized by patchy myocardial involvement [8].
In contrast, conventional two-dimensional (2D) transthoracic echocardiography (TTE) is recommended as a first-line screening modality—together with ECG and clinical assessment—for patients with biopsy-proven extracardiac sarcoidosis (ECS) [12]. TTE is widely available, noninvasive, and less costly than CMR or FDG-PET, but standard systolic and diastolic indices have suboptimal sensitivity and specificity, particularly in early disease [13].
Advances in echocardiography have introduced 2D speckle-tracking echocardiography (2D-STE), an angle-independent technique that quantifies global and regional systolic function by measuring myocardial deformation (“strain”) and its rate (“strain rate”) [14]. 2D-STE can uncover subclinical dysfunction—commonly reflected by a less negative left ventricular (LV) global longitudinal strain (GLS) than −20% despite preserved left ventricular ejection fraction (LVEF) (≥55%) [15,16].
Over the last decade, several studies [17,18,19,20,21,22,23,24,25,26,27,28,29] have assessed patients with ECS without overt heart disease using conventional 2D-TTE supplemented by 2D-STE to detect early, subclinical myocardial impairment. These investigations were largely heterogeneous and often retrospective, and most focused primarily on LV-GLS without comprehensively evaluating deformation indices across all four chambers.
Accordingly, we designed a prospective case–control study to compare baseline biventricular and biatrial myocardial deformation parameters in consecutive patients with ECS without fibrotic pulmonary involvement against age- and sex-matched controls without ECS and without known structural heart disease. We also discuss the potential pathophysiological mechanisms that may drive subclinical myocardial dysfunction in ECS.
2. Materials and Methods
2.1. Study Population
The present study prospectively enrolled a consecutive cohort of patients with ECS from the Division of Pneumology, San Giuseppe MultiMedica IRCCS Hospital, between 13 January 2025 and 19 May 2025. This cohort was compared with individuals without ECS and without known structural heart disease, matched for age and sex [30]. Controls were identified from the Outpatient Cardiology Division of our institution.
ECS was diagnosed on the basis of chest computed tomography (CT) and bronchoscopy findings following consensus at a multidisciplinary team meeting. Histological confirmation of non-caseating granulomatous inflammation from extracardiac tissue samples obtained by bronchoscopy was mandatory for inclusion, in accordance with current diagnostic guidelines [31,32].
Inclusion criteria were: ECS diagnosed according to current practice guidelines [31,32]; pulmonary sarcoidosis stages 0–III; and clinical stability for at least 3 months prior to enrollment.
Exclusion criteria were: clinically evident cardiac sarcoidosis; end-stage fibrotic pulmonary sarcoidosis (stage IV lung fibrosis); hemodynamic instability; suboptimal echocardiographic windows that precluded adequate endocardial border definition of both ventricles and atria; and refusal to participate.
At baseline, data were extracted from hospital records for ECS patients, including demographics and anthropometrics (age, sex, body surface area, body mass index); cardiovascular risk factors (smoking, hypertension, type 2 diabetes mellitus, dyslipidemia); history of cardiovascular and/or cerebrovascular disease (prior surgical or percutaneous coronary intervention, stroke, or transient ischemic attack); electrocardiographic characteristics (rhythm, heart rate, intraventricular conduction pattern); major comorbidities [malignancy, chronic obstructive pulmonary disease (COPD), obstructive sleep apnea syndrome (OSAS), gastroesophageal reflux disease (GERD), rheumatoid arthritis, hypothyroidism, mixed anxiety–depressive disorder]; laboratory results [complete blood count with hemoglobin, red cell distribution width (RDW), neutrophil-to-lymphocyte ratio (NLR); serum creatinine and estimated glomerular filtration rate (eGFR) [33]; glucose and total cholesterol]; and current medications.
At the same baseline visit, all ECS patients underwent spirometry, diffusing capacity of the lungs for carbon monoxide (DLCO) assessment, six-minute walk test (6MWT), blood pressure measurement, a 12-lead ECG, comprehensive 2D-TTE with full STE analysis of both ventricles and atria, and carotid ultrasonography. All echocardiographic studies were performed on the same day by a single cardiologist and interpreted in a blinded fashion.
The study protocol was approved by the Comitato Etico Territoriale Lombardia 5 (reference number 597/24; approval date 17/12/2024).
2.2. Conventional Transthoracic Echocardiography
All examinations were performed with a commercially available Philips Sparq ultrasound system (Philips, Andover, Massachusetts, USA) using a 2.5-MHz transducer. Images were acquired with the patient in the left lateral decubitus position, and all measurements followed the recommendations of the American Society of Echocardiography and the European Association of Cardiovascular Imaging [34,35].
The following conventional 2D echo-Doppler variables were recorded: aortic root and ascending aorta diameters using the “leading edge-to-leading edge” convention; relative wall thickness (RWT), calculated as RWT = 2 × posterior wall thickness / LV end-diastolic internal diameter; left ventricular mass index (LVMi) by the Devereux formula; left ventricular end-diastolic and end-systolic volume indexed (LVEDVi, LVESVi); and LVEF by the biplane modified Simpson method as an index of LV systolic function [34]. Additional parameters included left atrial volume index (LAVi); right ventricular inflow tract (RVIT); tricuspid annular plane systolic excursion (TAPSE) as a marker of right ventricular (RV) systolic function; and inferior vena cava (IVC) diameter during quiet respiration.
Doppler assessment included the mitral E/A ratio and the E/average e′ ratio as indices of LV diastolic function and LV filling pressure, respectively [35]. Systolic pulmonary artery pressure (sPAP) was estimated using the modified Bernoulli equation: sPAP = 4 × [tricuspid regurgitation velocity (TRV)]2 + right atrial pressure, with the latter derived from IVC diameter and collapsibility [36]. Concomitant valvular disease was graded according to the AHA/ACC recommendations for valvular heart disease management [37].
2.3. Speckle-Tracking Echocardiography
Immediately after conventional TTE, high-resolution speckle-tracking analyses were performed on 2D images in the following sequence: apical four-, two-, and three-chamber views for LV longitudinal strain, and basal, mid, and apical short-axis views for LV circumferential strain, using automated function imaging and the Q-Analysis module [38].
Per Philips QLAB conventions, the LV wall was segmented into seven segments in each apical view. LV peak systolic strain was defined as the point of maximal systolic shortening for longitudinal and circumferential components. A single bull’s-eye plot was generated for LV-GLS and LV global circumferential strain (LV-GCS), displaying segmental values and global results. Early peak diastolic strain rate was derived from longitudinal and circumferential traces [38].
RV-GLS was computed as the average of individual strain curves from the apical four-chamber view. Right-ventricular free-wall longitudinal strain (RV-FWLS) was calculated as the mean of the basal, mid, and apical free-wall segments, excluding septal segments [39].
For left atrial (LA) strain, the software automatically divided the atrial wall into seven segments and a biplane method was used. The following indices were measured: peak positive LA longitudinal strain (left atrial conduit strain, LAScd), peak negative LA longitudinal strain (left atrial contractile strain, LASct), and their sum (left atrial reservoir strain, LASr). Mean LAScd, LASct, and LASr were calculated by averaging four- and two-chamber values. From 2D atrial strain, the following strain-rate curves were obtained: first positive global strain rate beginning with ventricular systole, global early-diastolic strain rate, and global late-diastolic strain rate [40]. An index of LA stiffness was also derived as LASr/E/ average e′ [41].
For right atrial reservoir strain (RASr), fiducial points were placed at the tricuspid annular edges and the endocardial surface of the superior right atrium.
2.4. Carotid Ultrasonography
Carotid studies were performed with the Philips Sparq system using a 12-MHz transducer, following a standardized protocol [46]. With the patient supine and the neck slightly extended and rotated contralaterally to optimize imaging, acquisitions were obtained at end-diastole (R-wave on the ECG).
The following 2D measurements were obtained manually: average intima-media thickness (IMT) of the left and right common carotid arteries (CCAs) and average end-diastolic internal diameter (CCA-EDD) of both CCAs. Measurements were taken in the distal CCA 1 cm proximal to the bifurcation. Average carotid RWT was calculated as 2 × average IMT / average CCA-EDD. Average CCA cross-sectional area (CSA, mm2) was computed as: [π × (2 × average IMT + average CCA-EDD)/2]2 − [π × (average CCA-EDD/2)2], as a surrogate of carotid arterial mass.
2.5. Endpoint Definition
The primary endpoint was to determine whether LV-GLS, LV-GCS, RV-GLS, LASr, and RASr were impaired in ECS patients compared with controls. The secondary endpoint was to identify predictors of subclinical LV dysfunction, defined as LV-GLS less negative than −20% [16].
2.6. Statistical Analysis
A priori power calculations indicated that enrolling 30 ECS patients and 30 age-, sex-, and cardiovascular risk-matched controls would provide 80% power to detect a 2-percentage-point difference in GLS magnitude (−20% vs −18%) at baseline, assuming a standard deviation of 2.5 for each group and using a two-sided equal-variance t test with α = 0.05.
Normality of continuous variables was assessed with the Kolmogorov–Smirnov test. Normally distributed data were presented as mean ± standard deviation; non-normally distributed data as median (range). Between-group comparisons used the independent two-tailed t test for normally distributed variables and the Mann–Whitney test for non-normal variables. Categorical variables were compared with the chi-square test.
Univariate and multivariate logistic regression was used to identify independent predictors of LV-GLS impairment (LV-GLS less negative than −20% [16]) in the full ECS cohort. In accordance with the one-in-ten rule, candidate predictors were limited to: male sex (demographic), years since diagnosis (disease duration), neutrophil-to-lymphocyte ratio (systemic inflammation), and systolic blood pressure (overall cardiovascular risk). Odds ratios with 95% confidence intervals (CIs) were reported. Variables significant in univariate analyses were entered into the multivariable model.
Receiver operating characteristic (ROC) analysis determined the sensitivity and specificity of significant continuous predictors for the secondary endpoint (subclinical LV-GLS impairment). The area under the curve (AUC) was estimated. Optimal cut-offs were identified using the Youden index (sensitivity + [1 − specificity]).
To assess measurement reproducibility for LV-GLS, a subset of 15 ECS patients underwent repeat analysis by the original echocardiographer (A.S.) and a second cardiologist (M.B.), both blinded to prior results. Intra- and inter-observer variability was quantified using the intraclass correlation coefficient (ICC) with 95% CI; an ICC ≥ 0.70 denoted acceptable reliability.
All statistical analyses were performed in SPSS version 28 (SPSS Inc., Chicago, Illinois, USA). Two-tailed p values < 0.05 were considered statistically significant.
3. Results
3.1. Clinical Findings
We prospectively enrolled 41 patients with pulmonary sarcoidosis and compared them with 30 age- and sex-matched controls (age 57.4 ± 10.2 vs 58.5 ± 11.1 years, p = 0.67; males 58.5% vs 53.3%, p = 0.85). Demographic, anthropometric, clinical, biochemical, and hemodynamic variables at baseline are reported in Table 1.
Patients with sarcoidosis showed a moderate prevalence of smoking, hypertension, and dyslipidemia and a low prevalence of type 2 diabetes, yielding a cardiovascular risk profile comparable with that of controls (all p > 0.05). No participant had a prior history of coronary artery disease or cerebrovascular events. Most sarcoidosis cases were stage II (56.1%), followed by stage I (26.8%) and stage III (17.1%); median disease duration was 7 years (range 1–20).
Spirometry indicated mild functional impairment: forced vital capacity (FVC) and forced expiratory volume in one second (FEV1) were slightly reduced yet near the lower limit of normal; mean FEV1/FVC was 76%, suggesting no major airflow obstruction on average. Total lung capacity (TLC) and DLCO were mildly decreased. A normal ventilatory pattern was present in 53.6% of patients, whereas 21.9% had an obstructive, 12.2% a restrictive, and 2.4% a mixed pattern. Diffusing capacity was impaired in 24.4%. On the 6MWT, patients covered 480.2 ± 93.9 m with a mean oxygen desaturation of 4.0 ± 2.9%.
Laboratory testing showed no group differences in hemoglobin, systemic inflammation indices (RDW, NLR), renal function (serum creatinine, eGFR), or metabolic parameters (glucose, total cholesterol). Non-pulmonary comorbidities (cancer, COPD, OSAS, GERD, rheumatoid arthritis, hypothyroidism, mixed anxiety–depressive disorder) were likewise similar between groups. Resting heart rate and blood pressure were within the normal range and did not differ significantly.
At baseline, 34% of patients were receiving corticosteroids or inhaled therapy and 7% were on immunosuppressants; one patient (2.4%) required oxygen therapy. Rates of cardioprotective and systemic medications were comparable, except for statins, which were more common in controls (40% vs 15%, p = 0.02).
3.2. Conventional Echocardiographic and Carotid Ultrasound Parameters
None of the enrolled patients showed echocardiographic or clinical evidence of overt cardiac sarcoidosis at baseline evaluation. Transthoracic echocardiography showed normal LV wall thickness, normal LVMi, normal chamber sizes, and preserved biventricular systolic function (LVEF and TAPSE) in sarcoidosis patients. LV geometry was normal in 70.7%, with concentric remodeling, eccentric hypertrophy, and concentric hypertrophy in 17.1%, 7.3%, and 4.9%, respectively. First-degree diastolic dysfunction was the most frequent transmitral filling pattern, and the E/average e′ ratio commonly fell within the gray zone (8–13) [35]. Valvular disease was not clinically significant and pulmonary hemodynamics were normal. Between-group comparisons revealed no significant differences in cardiac structure, valvular abnormalities, biventricular systolic indices, or sPAP; only the E/average e′ ratio was higher in the sarcoidosis group, suggesting subclinical elevation of LV filling pressures.
On carotid ultrasound, CCA-EDD and CCA-IMT were similar overall, with a trend toward higher IMT in sarcoidosis (0.99 vs 0.92 mm, p = 0.09). Carotid relative wall thickness was greater in the sarcoidosis group (0.26 vs 0.24, p = 0.04), while CCA-CSA tended to be larger without reaching significance. Although values remained within the mild range, carotid stenosis severity was greater in sarcoidosis on both the left (30% vs 22.5%, p = 0.001) and right sides (28.6% vs 23.3%, p = 0.02) (Table 2).
3.3. Speckle-Tracking Echocardiography–Derived Myocardial Strain Parameters
Table 3 summarizes regional and global biventricular and biatrial mechanics by STE.
LV mechanics showed a significant reduction in LV-GLS in sarcoidosis (−18.1% vs −20.4%, p = 0.001) with impairment across the apical four-, two-, and three-chamber views. A larger proportion of patients had LV-GLS less negative than −20% (80.5% vs 20.0%, p < 0.001). Global longitudinal strain rate was reduced in all views. LV-GCS was lower in sarcoidosis (median −20.2% vs −24.1%, p < 0.001), mainly due to reduced basal and mid-ventricular circumferential strain, with apical values preserved. More patients had GCS less negative than −23.3%, but the difference was not significant (19.5% vs 10.0%, p = 0.34). Global circumferential strain rate was also lower (−1.34 vs −1.60 s−1, p < 0.001).
Left atrial mechanics were significantly impaired in patients with sarcoidosis compared with controls: LAScd and LASr were reduced (22.9% vs 28.4%, p < 0.001; 30.2% vs 38.1%, p < 0.001, respectively), and a higher proportion of patients had abnormal LASr (<39%) (70.7% vs 20.0%, p < 0.001). Strain-rate analysis further showed lower systolic and early-diastolic indices, together with a reduced LASr/E/e′ ratio (3.56 vs 4.58%, p = 0.003), consistent with impaired LA function and elevated LV filling pressures in sarcoidosis.
Right ventricular mechanics were also markedly abnormal in sarcoidosis patients: free-wall longitudinal strain (RV-FWLS, −17.5% vs −24.6%, p < 0.001) and global longitudinal strain (RV-GLS, −16.8% vs −23.5%, p < 0.001) were significantly reduced, with abnormal RV-GLS (less negative than −20%) observed in 85.4% of patients versus only 6.7% of controls (p < 0.001). RV strain-rate indices were likewise decreased. Right atrial (RA) reservoir and conduit strain were impaired (RASr 28.5% vs 35.2%, p < 0.001; RAScd 21.6% vs 25.5%, p = 0.02), and abnormal RASr (<35%) was substantially more frequent in patients (68.3% vs 16.7%, p < 0.001). RA strain-rate analysis corroborated the presence of functional impairment.
The time required for strain analysis was slightly but significantly longer in sarcoidosis (9.1 ± 1.5 vs 8.0 ± 1.8 minutes, p = 0.009).
3.4. Variability Analysis
Reproducibility was high. Intra-observer agreement was excellent for LV-GLS and LV-GCS (ICC 0.93, 95% CI 0.81–0.98; and 0.92, 95% CI 0.80–0.97). Inter-observer reproducibility was good (LV-GLS ICC 0.82, 95% CI 0.54–0.93; LV-GCS ICC 0.83, 95% CI 0.56–0.94) (Table 4).
3.5. Univariate and Multivariate Logistic Regression
On univariate analysis, male sex was associated with higher odds of LV-GLS impairment (OR 6.00, 95% CI 1.04–34.7, p = 0.046), but this was not independent after adjustment (OR 3.04, 95% CI 0.26–35.5, p = 0.37). NLR showed a significant univariate association (OR 1.10, 95% CI 1.01–1.20, p = 0.025) that attenuated in the multivariable model (OR 1.12, 95% CI 0.98–1.28, p = 0.10). In contrast, years since diagnosis remained an independent predictor: each additional year more than doubled the odds of LV-GLS impairment in both univariate (OR 2.27, 95% CI 1.26–4.09, p = 0.006) and multivariate analyses (OR 2.26, 95% CI 1.10–4.65, p = 0.03). Systolic blood pressure was not associated with the outcome (OR 1.01, 95% CI 0.96–1.06, p = 0.62) (Table 5).
Receiver-operating characteristic analysis identified a disease duration of 4.5 years as the optimal cut-off to predict LV-GLS impairment, with 88% sensitivity and 75% specificity (AUC = 0.89; 95% CI 0.76–1.00) (Figure 3).
4. Discussion
4.1. Main Findings of the Present Study
In this prospective cohort of patients with ECS and only mild pulmonary impairment, conventional TTE excluded overt infiltrative cardiomyopathy and revealed subtly elevated LV filling pressures, consistent with early subclinical LV diastolic dysfunction. Despite preserved conventional systolic indices (LVEF and TAPSE), STE uncovered a diffuse pattern of subclinical myocardial impairment, characterized by significant reductions in LV global deformation in both longitudinal and circumferential directions, together with impaired RV free-wall and global strain. These findings indicate early biventricular mechanical dysfunction that would not have been detected using standard echocardiographic parameters alone.
Notably, LV-GCS impairment predominantly involved basal and mid-ventricular segments while sparing the apex, suggesting a relative apical preservation pattern that may reflect compensatory recruitment of apical mechanics in response to early regional myocardial involvement. In parallel, biatrial function was significantly altered, with reduced LA and RA reservoir and conduit strain values, likely reflecting the combined effects of elevated LV filling pressures, myocardial stiffening, and potential direct atrial involvement.
Importantly, on multivariable analysis, years since diagnosis emerged as the sole independent predictor of LV-GLS impairment (less negative than −20%), indicating that myocardial deformation abnormalities are more closely related to disease chronicity than to resting hemodynamics or systemic inflammatory burden alone. This temporal association supports the concept of a progressive, cumulative myocardial involvement in ECS, even in clinically stable patients without overt cardiac disease.
Despite a comparable traditional cardiovascular risk profile, patients with sarcoidosis also exhibited increased carotid relative wall thickness and greater carotid stenosis severity compared with controls, pointing toward early and accelerated vascular remodeling. Together with the observed myocardial strain abnormalities, these vascular findings suggest that ECS may be associated with a broader cardiometabolic and inflammatory vascular phenotype extending beyond the myocardium.
4.2. Comparison with Previous Studies and Interpretation of Results
Over the past decade, several echocardiographic studies have examined patients with ECS lacking overt heart disease using conventional 2D-TTE complemented by 2D-STE, with the goal of detecting early, subclinical myocardial dysfunction. These cohorts typically featured a high prevalence of pulmonary involvement, preserved cardiac structure and LVEF on TTE, and predominantly female participants with low-to-moderate rates of standard cardiovascular risk factors. Across studies, STE consistently revealed subclinical LV mechanical impairment despite normal LVEF. A recent meta-analysis from our group that pooled 13 studies (785 sarcoidosis patients and 567 controls) showed that sarcoidosis exerts a larger effect on LV-GLS than on LVEF [47]. This LV-GLS reduction was robust to multiple potential confounders, including age, sex, smoking, hypertension, type 2 diabetes, dyslipidemia, disease duration, and ultrasound platform. In the subset with both echocardiography and CMR, impaired LV-GLS correlated with the extent of myocardial inflammation/fibrosis on LGE [17,18,21]. Approximately half of the included studies further linked LV-GLS to adverse outcomes—overall mortality, incident heart failure, arrhythmias, device implantation, or subsequent development of cardiac sarcoidosis—over mid-term follow-up.
Our findings align with this literature: normal chamber sizes, preserved biventricular systolic function, grade I diastolic dysfunction with higher LV filling pressures, and normal pulmonary hemodynamics on conventional TTE, yet widespread subclinical abnormalities on STE. Extending prior work that largely focused on LV mechanics, we performed a comprehensive four-chamber assessment and observed mild but significant attenuation of biventricular and biatrial strain indices. Importantly, apical circumferential strain remained preserved relative to basal and mid-ventricular segments, suggesting a relative apical sparing pattern even at subclinical stages of cardiac involvement. While classically associated with cardiac amyloidosis [48], apical sparing can also appear in hypertrophic cardiomyopathy, hypertensive LV hypertrophy, end-stage renal disease, coronary disease (particularly right coronary or left circumflex territories), reverse Takotsubo syndrome, chemotherapy-related cardiomyopathy, and mitral valve prolapse [49,50,51]. Preservation of apical circumferential mechanics may help maintain a normal LVEF despite impaired longitudinal shortening, underscoring why LV-GLS is a more sensitive marker of early dysfunction [52]. In our cohort, LV-GLS impairment tracked with disease duration rather than with resting hemodynamics or systemic inflammation alone, emphasizing the value of early detection and longitudinal surveillance of myocardial function in sarcoidosis.
To our knowledge, this is the first study to couple detailed regional LV strain and strain-rate analysis in both longitudinal and circumferential directions with comprehensive RV (global and free-wall) and biatrial systolic/diastolic strain assessment. Beyond the diagnostic yield relative to conventional parameters, our reproducibility analysis supports the clinical reliability of STE-derived metrics, with low intra- and inter-observer variability for LV-GLS and LV-GCS.
Although atherosclerosis is not traditionally considered a hallmark of sarcoidosis, our vascular findings suggest a possible link between the two. Consistent with Yilmaz et al. [53], who demonstrated increased carotid IMT and impaired flow-mediated dilation in sarcoidosis—indicative of endothelial dysfunction and subclinical atherosclerosis—we observed carotid remodeling despite similar classic risk profiles. Notwithstanding the anti-inflammatory and anti-atherosclerotic properties of statins [54,55], these agents appeared underused in our sarcoidosis cohort.
4.3. Pathophysiological Mechanisms Underpinning Subclinical Myocardial Dysfunction in Sarcoidosis Patients
Cardiac sarcoidosis predominantly involves the myocardium, with pericardial and endocardial disease typically representing direct extension from myocardial lesions [56]. The key histopathologic hallmarks include heightened fibrotic activity, lymphocytic infiltration, interstitial edema, and non-caseating granulomas with a characteristically patchy, localized myocardial distribution [57]. The regions most frequently affected, in descending order, are the LV free wall, interventricular septum, papillary muscles, right ventricle, and atria [58].
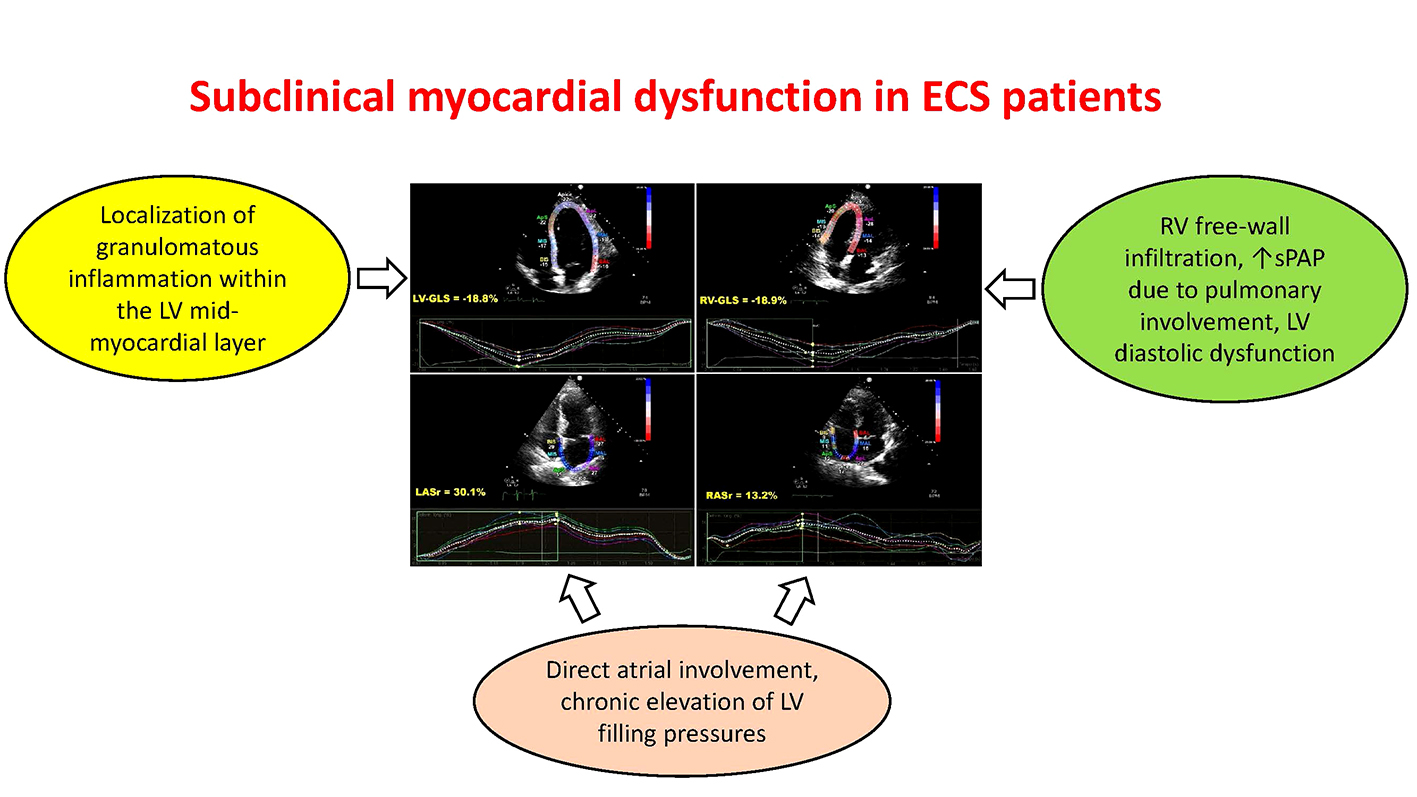
Impairment of LV-GLS is thought to arise from the preferential localization of granulomatous inflammation within the mid-myocardial layer, which is crucial for longitudinal shortening [59]. Inflammatory injury promotes myocardial fibrosis and scarring, thereby attenuating LV mechanics. Because early involvement is patchy and focal, the earliest abnormality is often a reduction in LV-GLS rather than a fall in LVEF, explaining why conventional echocardiography may appear normal at first. When damage becomes more transmural, concomitant reductions in LV-GCS are expected.
Multiple mechanisms may contribute to RV dysfunction. Reduced RV-GLS may reflect (1) direct RV free-wall infiltration, (2) increased sPAP secondary to pulmonary involvement, and (3) chronic exposure to elevated LV filling pressures resulting from LV diastolic dysfunction [19].
The observed reductions in biatrial reservoir function in ECS likely reflect either direct atrial involvement or chronic elevation of LV filling pressures—or both [60,61].
In our cohort, the modest burden of traditional risk factors, the absence of prior CAD and significant valvulopathy, and, importantly, the logistic regression results together support the interpretation that subclinical myocardial dysfunction is primarily attributable to sarcoidosis and its hemodynamic consequences rather than to confounding conditions.
4.4. Implications for Clinical Practice
To our knowledge, this is the first prospective study providing a comprehensive four-chamber myocardial deformation assessment in ECS patients without fibrotic pulmonary involvement. These findings support the potential role of STE as an intermediate screening tool between conventional echocardiography and advanced imaging modalities. The integration of LV-GLS into routine echocardiographic evaluation may facilitate earlier recognition of subclinical myocardial involvement and help guide timely referral for CMR or FDG-PET in selected patients, even in the presence of preserved conventional systolic function.
From a practical perspective, 2D-STE offers incremental diagnostic information beyond standard 2D-TTE and may be particularly valuable when advanced imaging is unavailable or contraindicated. In ECS patients presenting with palpitations or non-specific ECG abnormalities, a preserved LV-GLS (more negative than −20%) may reasonably argue against early cardiac involvement, whereas an abnormal LV-GLS (less negative than −20%) should prompt closer cardiological surveillance and consideration of further diagnostic work-up.
Beyond its diagnostic utility, LV-GLS may also provide relevant prognostic information. Sarcoidosis patients with lower LV-GLS values have been linked to higher risks of adverse cardiac outcomes over mid-term follow-up [25,26], suggesting a need for closer surveillance. It is also plausible—though unproven—that ECS patients with reduced LV-GLS could benefit from earlier therapy to forestall progression to overt CS and to reduce the risk of malignant arrhythmias and conduction disease; in this context, early immunosuppression with corticosteroids might be more effective before overt systolic dysfunction develops [62,63,64]. These hypotheses require confirmation in prospective studies.
4.5. Study Limitations
This investigation has several limitations. It is single-center with a modest sample size, although our a priori power calculation supports the numbers analyzed. The ECS cohort was heterogeneous with respect to disease duration, spirometric patterns, and respiratory therapy. The absence of systematic reference imaging, such as CMR or FDG-PET, precluded direct validation of echocardiographic strain abnormalities against myocardial inflammation or fibrosis and represents an important limitation of the present study. In addition, the lack of longitudinal outcome data did not allow assessment of the prognostic implications of the observed strain abnormalities. Biomarkers such as C-reactive protein and N-terminal pro-B-type natriuretic peptide were unavailable. Finally, strain imaging carries technical constraints—including inter-vendor variability, dependence on operator expertise and image quality, frame-rate selection (low frame rates can cause speckle loss), loading conditions, and external mechanical factors such as chest wall configuration—that can affect measurements [65,66,67,68].
5. Conclusions
Sarcoidosis is associated with early deterioration of biventricular and biatrial strain indices, and this impairment appears closely related to disease duration. Incorporating 2D-STE into routine evaluation may facilitate earlier recognition of cardiac involvement in ECS. Further prospective studies are warranted to determine whether 2D-STE can guide timely immunosuppressive therapy in ECS patients with reduced LV-GLS.
Author Contributions
Conceptualization, A.S., A.C. and S.H.; Methodology, A.S., F.D.C. and A.C.; software, A.S.; Validation, A.C. and S.H.; Formal Analysis, A.S.; Investigation, A.S., F.D.C. and A.C.; Resources, A.S. and S.H.; Data Curation, A.S., F.D.C., A.C. and A.L.; Writing—Original Draft Preparation, A.S.; Writing—Review and Editing, G.L.N.; Visualization, A.C., G.L.N. and S.H.; Supervision, M.L., M.B. and S.H.; Project Administration, S.H.; Funding Acquisition, A.S. All authors have read and agreed to the published version of the manuscript.
Funding
This research was funded by the Italian Ministry of Health, Ricerca Corrente IRCCS MultiMedica.
Institutional Review Board Statement
The study was conducted in accordance with the Declaration of Helsinki and approved by the Comitato Etico Territoriale Lombardia 5 (reference 597/24).
Informed Consent Statement
Informed consent was obtained from all individual participants included in the study.
Data Availability Statement
Data extracted from included studies will be publicly available on Zenodo (https://zenodo.org).
Acknowledgments
The authors wish to thank Monica Fumagalli for her graphical support. During the preparation of this work the authors used ChatGPT-5 in order to check spell and grammar. After using this tool, the authors reviewed and edited the content as needed.
Conflicts of Interest
The authors declare no conflicts of interest.
References
- Jain, R.; Yadav, D.; Puranik, N.; Guleria, R.; Jin, J.O. Sarcoidosis: Causes, Diagnosis, Clinical Features, and Treatments. J. Clin. Med. 2020, 9, 1081. [Google Scholar] [CrossRef] [PubMed]
- Iannuzzi, M.C.; Fontana, J.R. Sarcoidosis: Clinical presentation, immunopathogenesis, and therapeutics. JAMA 2011, 305, 391–399. [Google Scholar] [CrossRef] [PubMed]
- Silverman, K.J.; Hutchins, G.M.; Bulkley, B.H. Cardiac sarcoid: A clinicopathologic study of 84 unselected patients with systemic sarcoidosis. Circulation 1978, 58, 1204–1211. [Google Scholar] [CrossRef] [PubMed]
- Hulten, E.; Aslam, S.; Osborne, M.; Abbasi, S.; Bittencourt, M.S.; Blankstein, R. Cardiac sarcoidosis—State of the art review. Cardiovasc. Diagn. Ther. 2016, 6, 50–63. [Google Scholar] [CrossRef]
- Mankad, P.; Mitchell, B.; Birnie, D.; Kron, J. Cardiac sarcoidosis. Curr. Cardiol. Rep. 2019, 21, 152. [Google Scholar] [CrossRef]
- Jaiswal, R.; Vaisyambath, L.; Khayyat, A.; Unachukwu, N.; Nasyrlaeva, B.; Asad, M.; Fabara, S.P.; Balan, I.; Kolla, S.; Rabbani, R.; et al. Cardiac sarcoidosis diagnostic challenges and management: A case report and literature review. Cureus 2022, 14, e24850. [Google Scholar] [CrossRef]
- Perry, A.; Vuitch, F. Causes of death in patients with sarcoidosis: A morphologic study of 38 autopsies with clinicopathologic correlations. Arch. Pathol. Lab. Med. 1995, 119, 167–172. [Google Scholar]
- Trivieri, M.G.; Spagnolo, P.; Birnie, D.; Liu, P.; Drake, W.; Kovacic, J.C.; Baughman, R.; Fayad, Z.A.; Judson, M.A. Challenges in cardiac and pulmonary sarcoidosis: JACC state-of-the-art review. J. Am. Coll. Cardiol. 2020, 76, 1878–1901. [Google Scholar] [CrossRef]
- Mohsen, A.; Jimenez, A.; Hood, R.E.; Dickfeld, T.; Saliaris, A.; Shorofsky, S.; Saba, M.M. Cardiac sarcoidosis: Electrophysiological outcomes on long-term follow-up and the role of the implantable cardioverter-defibrillator. J. Cardiovasc. Electrophysiol. 2014, 25, 171–176. [Google Scholar] [CrossRef]
- Patel, M.R.; Cawley, P.J.; Heitner, J.F.; Klem, I.; Parker, M.A.; Jaroudi, W.A.; Meine, T.J.; White, J.B.; Elliott, M.D.; Kim, H.W.; et al. Detection of myocardial damage in patients with sarcoidosis. Circulation 2009, 120, 1969–1977. [Google Scholar] [CrossRef]
- Ohira, H.; Birnie, D.H.; Pena, E.; Bernick, J.; McArdle, B.; Leung, E.; Wells, G.A.; Yoshinaga, K.; Tsujino, I.; Sato, T.; et al. Comparison of 18F-fluorodeoxyglucose positron emission tomography and cardiac magnetic resonance in corticosteroid-naive patients with conduction system disease due to cardiac sarcoidosis. Eur. J. Nucl. Med. Mol. Imaging 2016, 43, 259–269. [Google Scholar] [CrossRef]
- Birnie, D.H.; Sauer, W.H.; Bogun, F.; Cooper, J.M.; Culver, D.A.; Duvernoy, C.S.; Judson, M.A.; Kron, J.; Mehta, D.; Cosedis Nielsen, J.; et al. HRS expert consensus statement on the diagnosis and management of arrhythmias associated with cardiac sarcoidosis. Heart Rhythm 2014, 11, 1305–1323. [Google Scholar] [CrossRef]
- Vignaux, O.; Dhote, R.; Duboc, D.; Blanche, P.; Devaux, J.Y.; Weber, S.; Legmann, P. Detection of myocardial involvement in patients with sarcoidosis applying T2-weighted, contrast-enhanced, and cine magnetic resonance imaging: Initial results of a prospective study. J. Comput. Assist. Tomogr. 2002, 26, 762–767. [Google Scholar] [CrossRef]
- Potter, E.; Marwick, T.H. Assessment of left ventricular function by echocardiography: The case for routinely adding global longitudinal strain to ejection fraction. JACC Cardiovasc. Imaging 2018, 11, 260–274. [Google Scholar] [CrossRef]
- Shah, B.N.; De Villa, M.; Khattar, R.S.; Senior, R. Imaging cardiac sarcoidosis: The incremental benefit of speckle tracking echocardiography. Echocardiography 2013, 30, E213–E214. [Google Scholar] [CrossRef]
- Galderisi, M.; Cosyns, B.; Edvardsen, T.; Cardim, N.; Delgado, V.; Di Salvo, G.; Donal, E.; Sade, L.E.; Ernande, L.; Garbi, M.; et al. Standardization of adult transthoracic echocardiography reporting in agreement with recent chamber quantification, diastolic function, and heart valve disease recommendations: An expert consensus document of the European Association of Cardiovascular Imaging. Eur. Heart J. Cardiovasc. Imaging 2017, 18, 1301–1310. [Google Scholar] [CrossRef]
- Kul, S.; Ozcelik, H.K.; Uyarel, H.; Karakus, G.; Guvenc, T.S.; Yalcınsoy, M.; Asoglu, E.; Kemik, A.S.; Tasal, A.; Gungor, S.; et al. Diagnostic value of strain echocardiography, galectin-3, and tenascin-C levels for the identification of patients with pulmonary and cardiac sarcoidosis. Lung 2014, 192, 533–542. [Google Scholar] [CrossRef] [PubMed]
- Orii, M.; Hirata, K.; Tanimoto, T.; Shiono, Y.; Shimamura, K.; Yamano, T.; Ino, Y.; Yamaguchi, T.; Kubo, T.; Tanaka, A.; et al. Myocardial damage detected by two-dimensional speckle-tracking echocardiography in patients with extracardiac sarcoidosis: Comparison with magnetic resonance imaging. J. Am. Soc. Echocardiogr. 2015, 28, 683–691. [Google Scholar] [CrossRef] [PubMed]
- Tigen, K.; Sunbul, M.; Karaahmet, T.; Tasar, O.; Dundar, C.; Yalcinsoy, M.; Takir, M.; Akkaya, E. Early detection of biventricular and atrial mechanical dysfunction using two-dimensional speckle tracking echocardiography in patients with sarcoidosis. Lung 2015, 193, 669–675. [Google Scholar] [CrossRef]
- Joyce, E.; Kamperidis, V.; Ninaber, M.K.; Katsanos, S.; Debonnaire, P.; Schalij, M.J.; Taube, C.; Bax, J.J.; Delgado, V.; Ajmone Marsan, N. Prevalence and correlates of early right ventricular dysfunction in sarcoidosis and its association with outcome. J. Am. Soc. Echocardiogr. 2016, 29, 871–878. [Google Scholar] [CrossRef] [PubMed]
- Murtagh, G.; Laffin, L.J.; Patel, K.V.; Patel, A.V.; Bonham, C.A.; Yu, Z.; Addetia, K.; El-Hangouche, N.; Maffesanti, F.; Mor-Avi, V.; et al. Improved detection of myocardial damage in sarcoidosis using longitudinal strain in patients with preserved left ventricular ejection fraction. Echocardiography 2016, 33, 1344–1352. [Google Scholar] [CrossRef]
- Değirmenci, H.; Demirelli, S.; Arısoy, A.; Ermiş, E.; Araz, Ö.; Bakırcı, E.M.; Hamur, H.; Büyüklü, M.; Topal, E. Myocardial deformation and total atrial conduction time in the prediction of cardiac involvement in patients with pulmonary sarcoidosis. Clin. Respir. J. 2017, 11, 68–77. [Google Scholar] [CrossRef]
- Schouver, E.D.; Moceri, P.; Doyen, D.; Tieulie, N.; Queyrel, V.; Baudouy, D.; Cerboni, P.; Gibelin, P.; Leroy, S.; Fuzibet, J.G.; et al. Early detection of cardiac involvement in sarcoidosis with two-dimensional speckle-tracking echocardiography. Int. J. Cardiol. 2017, 227, 711–716. [Google Scholar] [CrossRef] [PubMed]
- Chen, J.; Lei, J.; Scalzetti, E.; McGrath, M.; Feiglin, D.; Voelker, R.; Wang, J.; Iannuzzi, M.C.; Liu, K. Myocardial contractile patterns predict future cardiac events in sarcoidosis. Int. J. Cardiovasc. Imaging 2018, 34, 251–262. [Google Scholar] [CrossRef] [PubMed]
- Felekos, I.; Aggeli, C.; Gialafos, E.; Kouranos, V.; Rapti, A.; Sfikakis, P.; Koulouris, N.; Tousoulis, D. Global longitudinal strain and long-term outcomes in asymptomatic extracardiac sarcoid patients with no apparent cardiovascular disease. Echocardiography 2018, 35, 804–808. [Google Scholar] [CrossRef]
- Di Stefano, C.; Bruno, G.; Arciniegas Calle, M.C.; Acharya, G.A.; Fussner, L.M.; Ungprasert, P.; Cooper, L.T., Jr.; Blauwet, L.A.; Ryu, J.H.; Pellikka, P.A.; et al. Diagnostic and predictive value of speckle tracking echocardiography in cardiac sarcoidosis. BMC Cardiovasc. Disord. 2020, 20, 21. [Google Scholar] [CrossRef]
- Bayat, F.; Fahimi, A.; Tavana, S.; Tabary, M.; Khaheshi, I. Subclinical involvement of the heart and its associated factors in patients with sarcoidosis with normal systolic function using two-dimensional speckle tracking. Echocardiography 2020, 37, 41–46. [Google Scholar] [CrossRef] [PubMed]
- Kaptan Ozen, D.; Mutlu, B.; Kocakaya, D.; Turan, B.; Sert Sekerci, S.; Ceyhan, B.; Kepez, A.; Erdogan, O. The effect of global longitudinal strain on impaired six-minute walk test performance in patients with sarcoidosis. Sarcoidosis Vasc. Diffuse Lung Dis. 2020, 37, 66–73. [Google Scholar] [CrossRef]
- Kusunose, K.; Fujiwara, M.; Yamada, H.; Nishio, S.; Saijo, Y.; Yamada, N.; Hirata, Y.; Torii, Y.; Ise, T.; Yamaguchi, K.; et al. Deterioration of biventricular strain is an early marker of cardiac involvement in confirmed sarcoidosis. Eur. Heart J. Cardiovasc. Imaging 2020, 21, 796–804. [Google Scholar] [CrossRef]
- Piepoli, M.F.; Hoes, A.W.; Agewall, S.; Albus, C.; Brotons, C.; Catapano, A.L.; Cooney, M.T.; Corrà, U.; Cosyns, B.; Deaton, C.; et al. 2016 European guidelines on cardiovascular disease prevention in clinical practice. Eur. Heart J. 2016, 37, 2315–2381. [Google Scholar] [CrossRef]
- Crouser, E.D.; Maier, L.A.; Wilson, K.C.; Bonham, C.A.; Morgenthau, A.S.; Patterson, K.C.; Abston, E.; Bernstein, R.C.; Blankstein, R.; Chen, E.S.; et al. Diagnosis and detection of sarcoidosis: An official American Thoracic Society clinical practice guideline. Am. J. Respir. Crit. Care Med. 2020, 201, e26–e51. [Google Scholar] [CrossRef] [PubMed]
- Baughman, R.P.; Valeyre, D.; Korsten, P.; Mathioudakis, A.G.; Wuyts, W.A.; Wells, A.; Rottoli, P.; Nunes, H.; Lower, E.E.; Judson, M.A.; et al. ERS clinical practice guidelines on treatment of sarcoidosis. Eur. Respir. J. 2021, 58, 2004079. [Google Scholar] [CrossRef] [PubMed]
- Levey, A.S.; Bosch, J.P.; Lewis, J.B.; Greene, T.; Rogers, N.; Roth, D. A more accurate method to estimate glomerular filtration rate from serum creatinine: A new prediction equation. Ann. Intern. Med. 1999, 130, 461–470. [Google Scholar] [CrossRef] [PubMed]
- Lang, R.M.; Badano, L.P.; Mor-Avi, V.; Afilalo, J.; Armstrong, A.; Ernande, L.; Flachskampf, F.A.; Foster, E.; Goldstein, S.A.; Kuznetsova, T.; et al. Recommendations for cardiac chamber quantification by echocardiography in adults: An update from the American Society of Echocardiography and the European Association of Cardiovascular Imaging. J. Am. Soc. Echocardiogr. 2015, 28, 1–39.e14. [Google Scholar] [CrossRef]
- Nagueh, S.F.; Smiseth, O.A.; Appleton, C.P.; Byrd, B.F., III; Dokainish, H.; Edvardsen, T.; Flachskampf, F.A.; Gillebert, T.C.; Klein, A.L.; Lancellotti, P.; et al. Recommendations for the evaluation of left ventricular diastolic function by echocardiography: An update from the American Society of Echocardiography and the European Association of Cardiovascular Imaging. J. Am. Soc. Echocardiogr. 2016, 29, 277–314. [Google Scholar] [CrossRef]
- Humbert, M.; Kovacs, G.; Hoeper, M.M.; Badagliacca, R.; Berger, R.M.F.; Brida, M.; Carlsen, J.; Coats, A.J.S.; Escribano-Subias, P.; Ferrari, P.; et al. 2022 ESC/ERS guidelines for the diagnosis and treatment of pulmonary hypertension. Eur. Respir. J. 2023, 61, 2200879. [Google Scholar] [CrossRef]
- Nishimura, R.A.; Otto, C.M.; Bonow, R.O.; Carabello, B.A.; Erwin, J.P., III; Fleisher, L.A.; Jneid, H.; Mack, M.J.; McLeod, C.J.; O’Gara, P.T.; et al. 2017 AHA/ACC focused update of the 2014 AHA/ACC guideline for the management of patients with valvular heart disease. Circulation 2017, 135, e1159–e1195. [Google Scholar] [CrossRef]
- Voigt, J.U.; Pedrizzetti, G.; Lysyansky, P.; Marwick, T.H.; Houle, H.; Baumann, R.; Pedri, S.; Ito, Y.; Abe, Y.; Metz, S.; et al. Definitions for a common standard for two-dimensional speckle tracking echocardiography: Consensus document of the EACVI/ASE/Industry Task Force. Eur. Heart J. Cardiovasc. Imaging 2015, 16, 1–11. [Google Scholar] [CrossRef]
- Badano, L.P.; Muraru, D.; Parati, G.; Haugaa, K.; Voigt, J.U. How to do right ventricular strain. Eur. Heart J. Cardiovasc. Imaging 2020, 21, 825–827. [Google Scholar] [CrossRef]
- Voigt, J.U.; Mălăescu, G.G.; Haugaa, K.; Badano, L. How to do left atrial strain. Eur. Heart J. Cardiovasc. Imaging 2020, 21, 715–717. [Google Scholar] [CrossRef]
- Sonaglioni, A.; Vincenti, A.; Baravelli, M.; Rigamonti, E.; Tagliabue, E.; Bassi, P.; Nicolosi, G.L.; Anzà, C.; Lombardo, M. Prognostic value of global left atrial peak strain in patients with acute ischemic stroke and no evidence of atrial fibrillation. Int. J. Cardiovasc. Imaging 2019, 35, 603–613. [Google Scholar] [CrossRef]
- Yingchoncharoen, T.; Agarwal, S.; Popović, Z.B.; Marwick, T.H. Normal ranges of left ventricular strain: A meta-analysis. J. Am. Soc. Echocardiogr. 2013, 26, 185–191. [Google Scholar] [CrossRef] [PubMed]
- Muraru, D.; Onciul, S.; Peluso, D.; Soriani, N.; Cucchini, U.; Aruta, P.; Romeo, G.; Cavalli, G.; Iliceto, S.; Badano, L.P. Sex- and method-specific reference values for right ventricular strain by two-dimensional speckle-tracking echocardiography. Circ. Cardiovasc. Imaging 2016, 9, e003866. [Google Scholar] [CrossRef] [PubMed]
- Pathan, F.; D’Elia, N.; Nolan, M.T.; Marwick, T.H.; Negishi, K. Normal ranges of left atrial strain by speckle-tracking echocardiography: A systematic review and meta-analysis. J. Am. Soc. Echocardiogr. 2017, 30, 59–70.e8. [Google Scholar] [CrossRef] [PubMed]
- Krittanawong, C.; Maitra, N.S.; Hassan Virk, H.U.; Farrell, A.; Hamzeh, I.; Arya, B.; Pressman, G.S.; Wang, Z.; Marwick, T.H. Normal ranges of right atrial strain: A systematic review and meta-analysis. JACC Cardiovasc. Imaging 2023, 16, 282–294. [Google Scholar] [CrossRef]
- Stein, J.H.; Korcarz, C.E.; Hurst, R.T.; Lonn, E.; Kendall, C.B.; Mohler, E.R.; Najjar, S.S.; Rembold, C.M.; Post, W.S.; et al. Use of carotid ultrasound to identify subclinical vascular disease and evaluate cardiovascular disease risk: A consensus statement from the American Society of Echocardiography Carotid Intima-Media Thickness Task Force. J. Am. Soc. Echocardiogr. 2008, 21, 93–111. [Google Scholar] [CrossRef]
- Sonaglioni, A.; Fagiani, V.; Rigoni, M.; Nicolosi, G.L.; Lucidi, A.; Caminati, A.; Lombardo, M.; Harari, S. Echocardiographic evaluation of left ventricular mechanics in sarcoidosis patients without overt heart disease: A systematic review and meta-analysis. Sarcoidosis Vasc. Diffuse Lung Dis. 2024, 41, e2024042. [Google Scholar] [CrossRef]
- Phelan, D.; Collier, P.; Thavendiranathan, P.; Popović, Z.B.; Hanna, M.; Plana, J.C.; Marwick, T.H.; Thomas, J.D. Relative apical sparing of longitudinal strain using two-dimensional speckle-tracking echocardiography is both sensitive and specific for the diagnosis of cardiac amyloidosis. Heart 2012, 98, 1442–1448. [Google Scholar] [CrossRef]
- Leitman, M.; Tyomkin, V. Apical sparing in routine echocardiography: Occurrence and clinical significance. J. Cardiovasc. Dev. Dis. 2024, 11, 262. [Google Scholar] [CrossRef]
- Ferkh, A.; Tjahjadi, C.; Stefani, L.; Geenty, P.; Byth, K.; De Silva, K.; Boyd, A.C.; Richards, D.; Mollee, P.; Korczyk, D.; et al. Cardiac “hypertrophy” phenotyping: Differentiating aetiologies with increased left ventricular wall thickness on echocardiography. Front. Cardiovasc. Med. 2023, 10, 1183485. [Google Scholar] [CrossRef]
- Sonaglioni, A.; Fagiani, V.; Nicolosi, G.L.; Lombardo, M. Echocardiographic assessment of left ventricular mechanics in individuals with mitral valve prolapse: A systematic review and meta-analysis. Int. J. Cardiovasc. Imaging 2024, 40, 1617–1629. [Google Scholar] [CrossRef] [PubMed]
- Stokke, T.M.; Hasselberg, N.E.; Smedsrud, M.K.; Sarvari, S.I.; Haugaa, K.H.; Smiseth, O.A.; Edvardsen, T.; Remme, E.W. Geometry as a confounder when assessing ventricular systolic function: Comparison between ejection fraction and strain. J. Am. Coll. Cardiol. 2017, 70, 942–954. [Google Scholar] [CrossRef]
- Yilmaz, Y.; Kul, S.; Kavas, M.; Erman, H.; Aciksari, G.; Ozcan, F.B.; Yalcinkaya, E.; Kanbay, A.; Caliskan, M. Is there an association between sarcoidosis and atherosclerosis? Int. J. Cardiovasc. Imaging 2021, 37, 559–567. [Google Scholar] [CrossRef]
- Satny, M.; Hubacek, J.A.; Vrablik, M. Statins and inflammation. Curr. Atheroscler. Rep. 2021, 23, 80. [Google Scholar] [CrossRef]
- Liberale, L.; Carbone, F.; Montecucco, F.; Sahebkar, A. Statins reduce vascular inflammation in atherogenesis: A review of underlying molecular mechanisms. Int. J. Biochem. Cell Biol. 2020, 122, 105735. [Google Scholar] [CrossRef]
- Lehtonen, J.; Uusitalo, V.; Pöyhönen, P.; Mäyränpää, M.I.; Kupari, M. Cardiac sarcoidosis: Phenotypes, diagnosis, treatment, and prognosis. Eur. Heart J. 2023, 44, 1495–1510. [Google Scholar] [CrossRef]
- Kitai, T.; Nabeta, T.; Naruse, Y.; Taniguchi, T.; Yoshioka, K.; Miyakoshi, C.; Kurashima, S.; Miyoshi, Y.; Tanaka, H.; Okumura, T.; et al. Comparisons between biopsy-proven versus clinically diagnosed cardiac sarcoidosis. Heart 2022, 108, 1887–1894. [Google Scholar] [CrossRef]
- Lynch, J.P., III; Hwang, J.; Bradfield, J.; Fishbein, M.; Shivkumar, K.; Tung, R. Cardiac involvement in sarcoidosis: Evolving concepts in diagnosis and treatment. Semin. Respir. Crit. Care Med. 2014, 35, 372–390. [Google Scholar] [CrossRef]
- Aggeli, C.; Felekos, I.; Tousoulis, D.; Gialafos, E.; Rapti, A.; Stefanadis, C. Myocardial mechanics for the early detection of cardiac sarcoidosis. Int. J. Cardiol. 2013, 168, 4820–4821. [Google Scholar] [CrossRef] [PubMed]
- Fahy, G.J.; Marwick, T.; McCreery, C.J.; Quigley, P.J.; Maurer, B.J. Doppler echocardiographic detection of left ventricular diastolic dysfunction in patients with pulmonary sarcoidosis. Chest 1996, 109, 62–66. [Google Scholar] [CrossRef] [PubMed]
- Aydin Kaderli, A.; Gullulu, S.; Coskun, F.; Yilmaz, D.; Uzaslan, E. Impaired left ventricular systolic and diastolic functions in patients with early grade pulmonary sarcoidosis. Eur. J. Echocardiogr. 2010, 11, 809–813. [Google Scholar] [CrossRef]
- Kato, Y.; Morimoto, S.; Uemura, A.; Hiramitsu, S.; Ito, T.; Hishida, H. Efficacy of corticosteroids in sarcoidosis presenting with atrioventricular block. Sarcoidosis Vasc. Diffuse Lung Dis. 2003, 20, 133–137. [Google Scholar] [PubMed]
- Yodogawa, K.; Seino, Y.; Ohara, T.; Takayama, H.; Katoh, T.; Mizuno, K. Effect of corticosteroid therapy on ventricular arrhythmias in patients with cardiac sarcoidosis. Ann. Noninvasive Electrocardiol. 2011, 16, 140–147. [Google Scholar] [CrossRef] [PubMed]
- Nakano, S.; Kimura, F.; Osman, N.; Sugi, K.; Tanno, J.; Uchida, Y.; Shiono, A.; Senbonmatsu, T.; Nishimura, S. Improved myocardial strain measured by strain-encoded magnetic resonance imaging in a patient with cardiac sarcoidosis. Can. J. Cardiol. 2013, 29, 1531.e9–1531.e11. [Google Scholar] [CrossRef]
- Mirea, O.; Pagourelias, E.D.; Duchenne, J.; Bogaert, J.; Thomas, J.D.; Badano, L.P.; Voigt, J.U.; et al. Intervendor differences in the accuracy of detecting regional functional abnormalities: A report from the EACVI-ASE strain standardization task force. JACC Cardiovasc. Imaging 2018, 11, 25–34. [Google Scholar] [CrossRef]
- Negishi, T.; Negishi, K.; Thavendiranathan, P.; Cho, G.Y.; Popescu, B.A.; Vinereanu, D.; Kurosawa, K.; Penicka, M.; Marwick, T.H.; et al. Effect of experience and training on the concordance and precision of strain measurements. JACC Cardiovasc. Imaging 2017, 10, 518–522. [Google Scholar] [CrossRef] [PubMed]
- Rösner, A.; Barbosa, D.; Aarsæther, E.; Kjønås, D.; Schirmer, H.; D’hooge, J. The influence of frame rate on two-dimensional speckle-tracking strain measurements: A study on in silico-simulated models and images recorded in patients. Eur. Heart J. Cardiovasc. Imaging 2015, 16, 1137–1147. [Google Scholar] [CrossRef]
- Sonaglioni, A.; Fagiani, V.; Nicolosi, G.L.; Lombardo, M. The influence of pectus excavatum on biventricular mechanics: A systematic review and meta-analysis. Minerva Cardiol. Angiol. 2024. [Google Scholar] [CrossRef]
Figure 1.
Illustrative example of LV-GLS (A), RV-GLS (B), LASr (C) and RASr (D) assessment by speckle tracking echocardiography in an ECS patient participating in the present study. ECS, extra-cardiac sarcoidosis; GLS, global longitudinal strain; LASr, left atrial reservoir strain; LV, left ventricular; RASr, right atrial reservoir strain; RV, right ventricular.
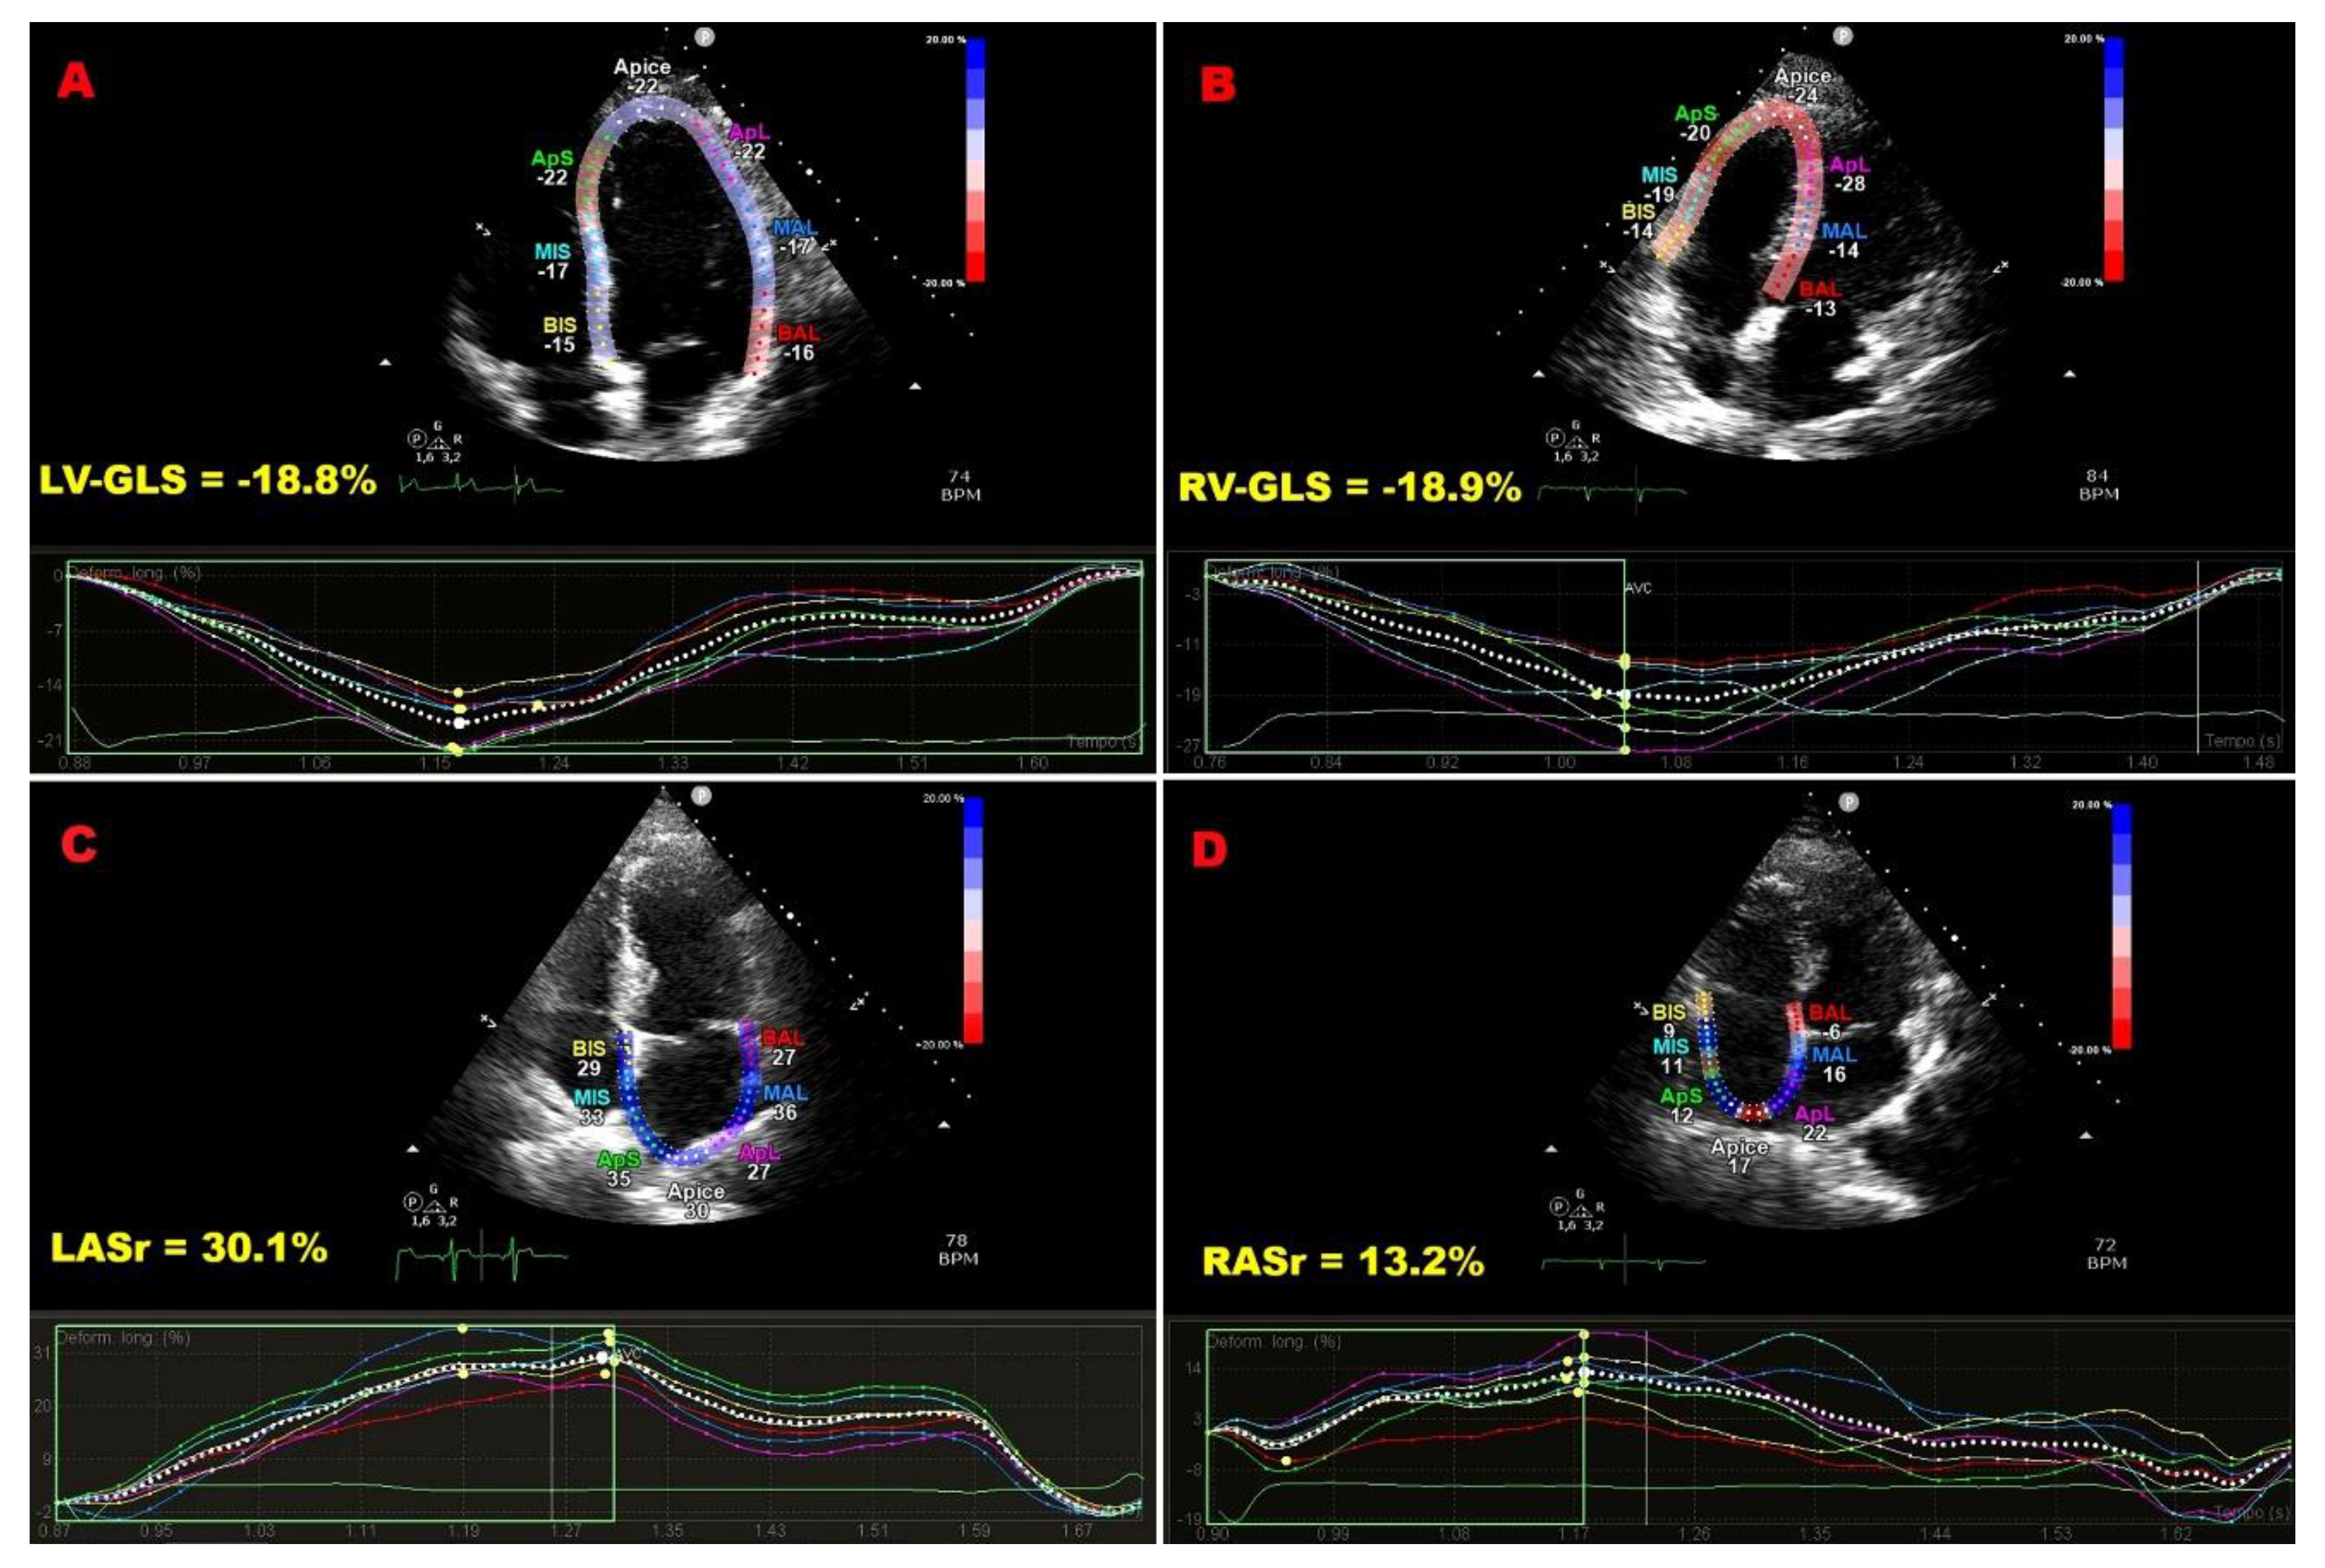
Figure 2.
Bull’s eye plots derived from 2D-STE illustrating LV-GLS and LV-GCS in an ECS patient (A and C, respectively) and in a control (B and D, respectively). 2D, two-dimensional; ECS, extra-cardiac sarcoidosis; GCS, global circumferential strain; GLS, global longitudinal strain; LV, left ventricular; STE, speckle tracking echocardiography.
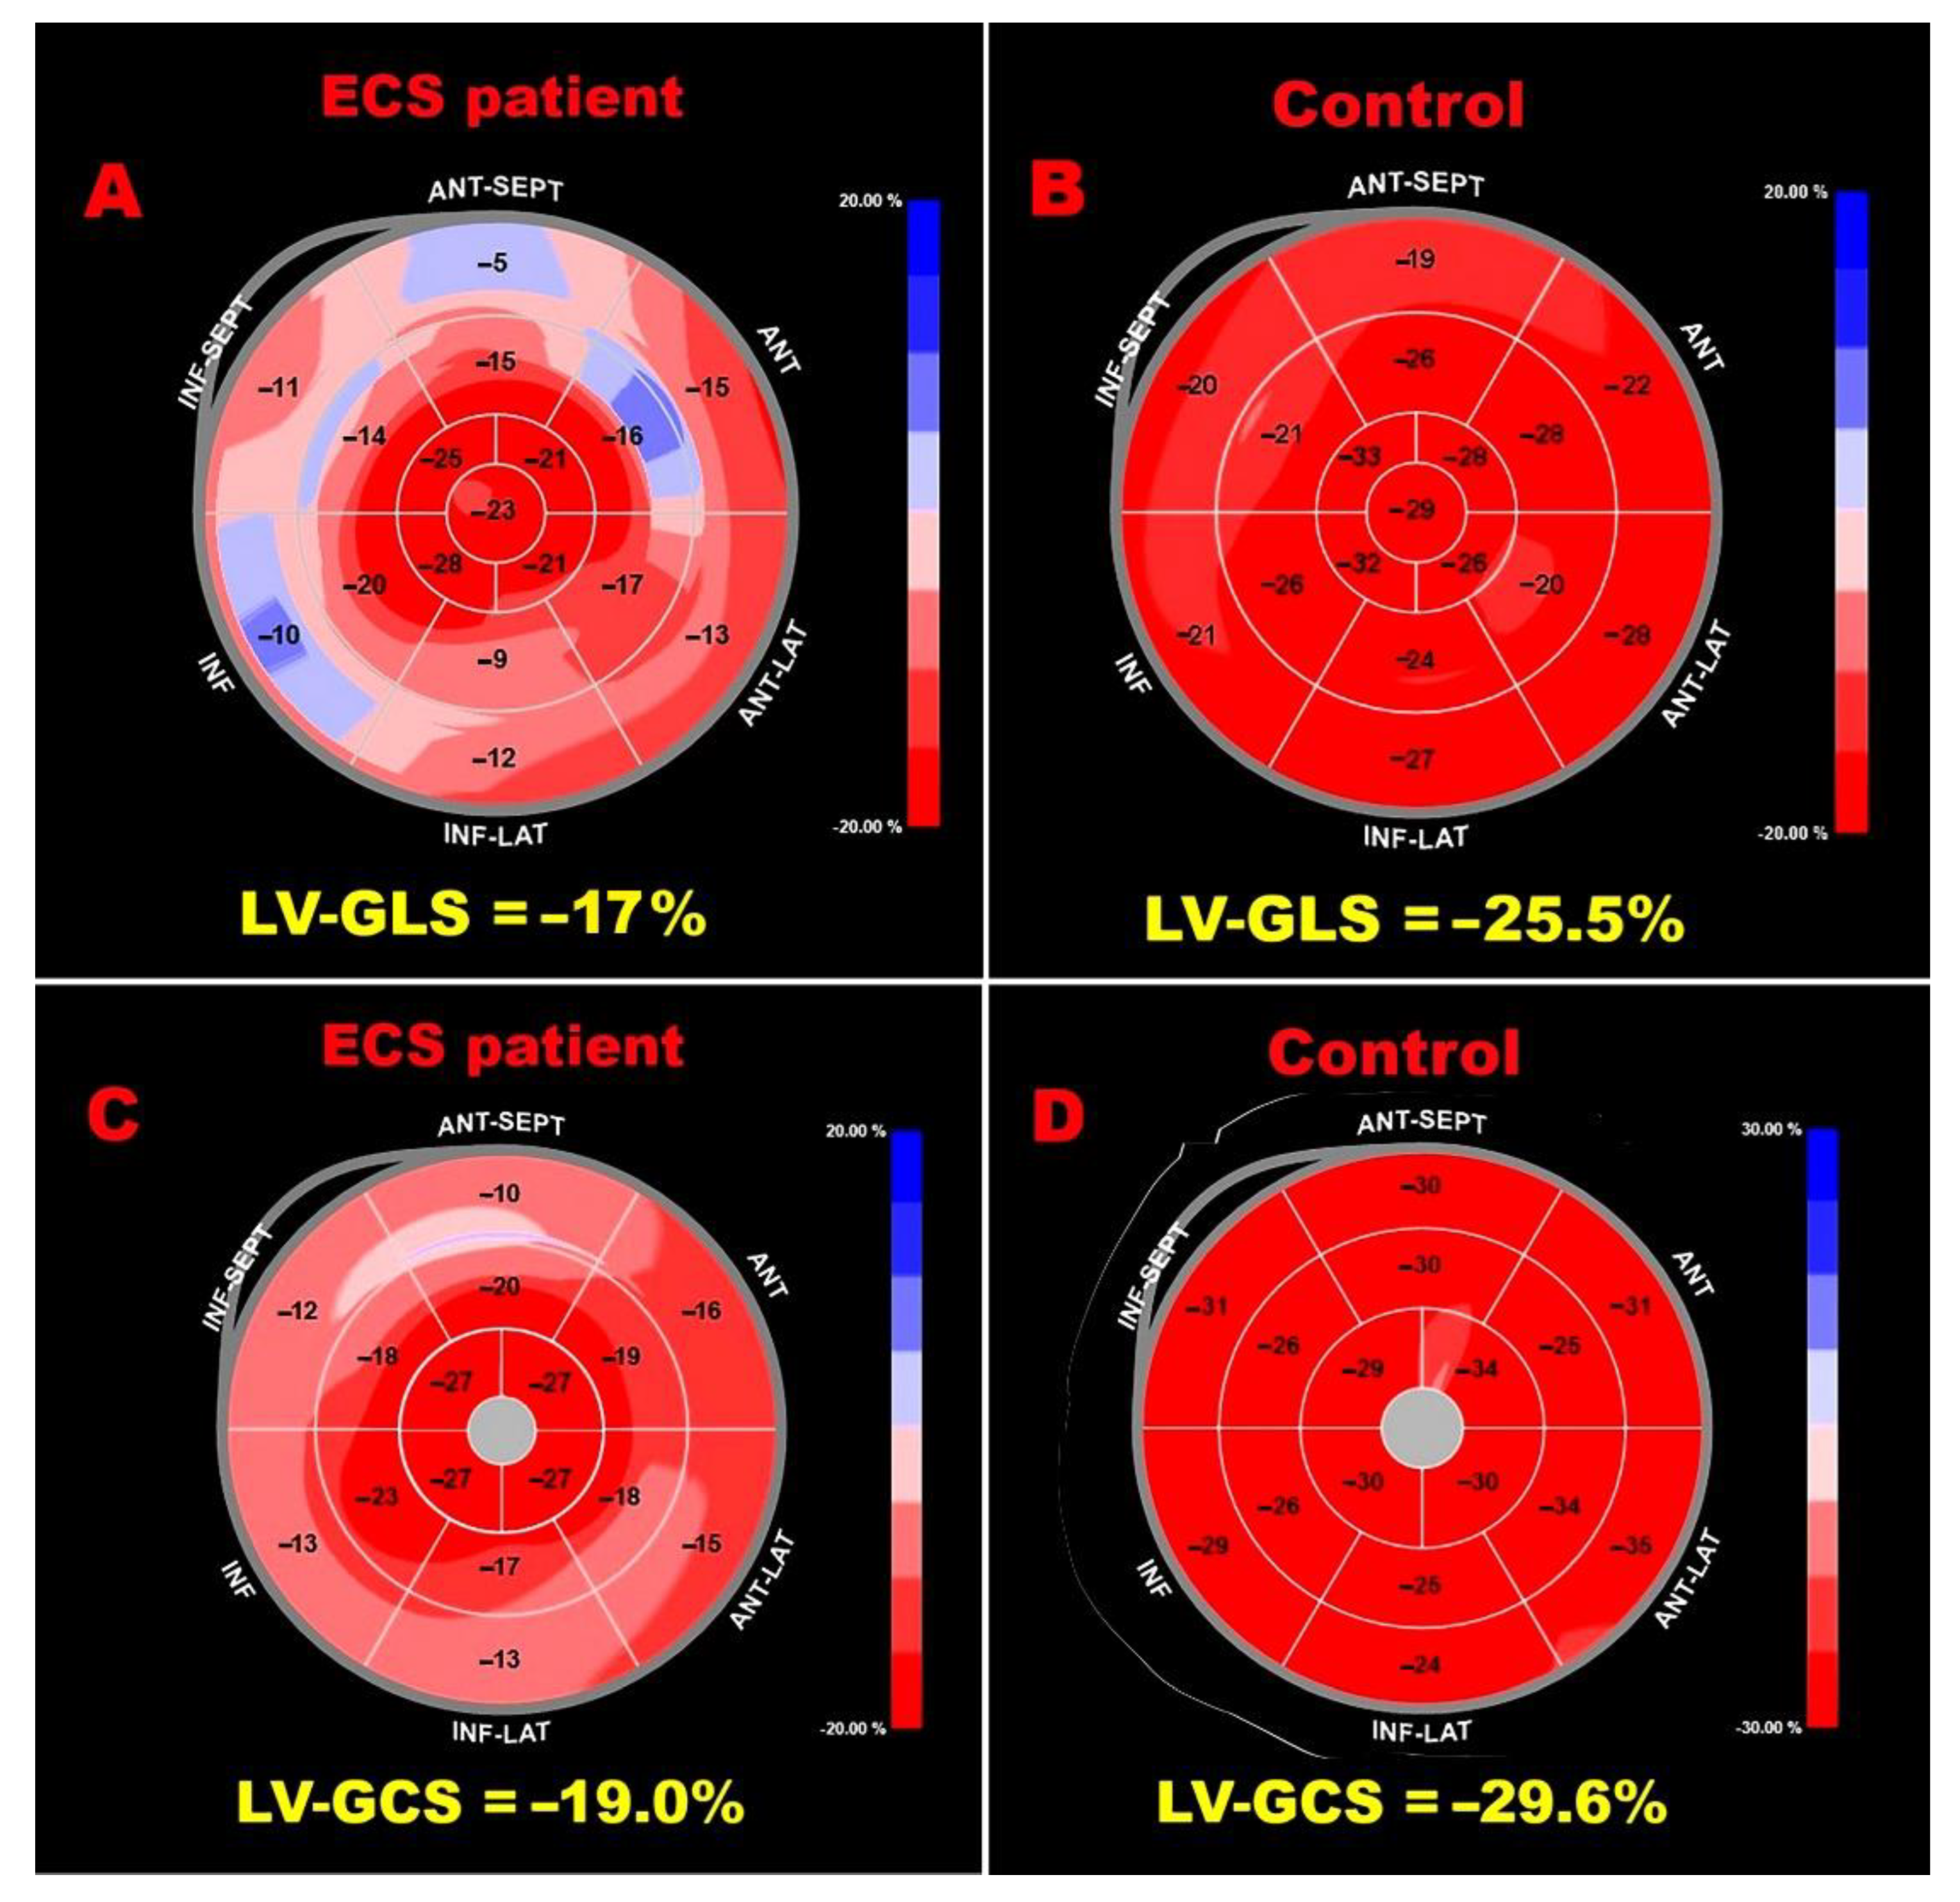
Figure 3.
ROC curve analysis performed to determine the optimal cutoff for disease duration in predicting impaired LV-GLS within the ECS cohort. ECS, extra-cardiac sarcoidosis; GLS, global longitudinal strain; LV, left ventricular; ROC, Receiver operating characteristic.
Figure 3.
ROC curve analysis performed to determine the optimal cutoff for disease duration in predicting impaired LV-GLS within the ECS cohort. ECS, extra-cardiac sarcoidosis; GLS, global longitudinal strain; LV, left ventricular; ROC, Receiver operating characteristic.
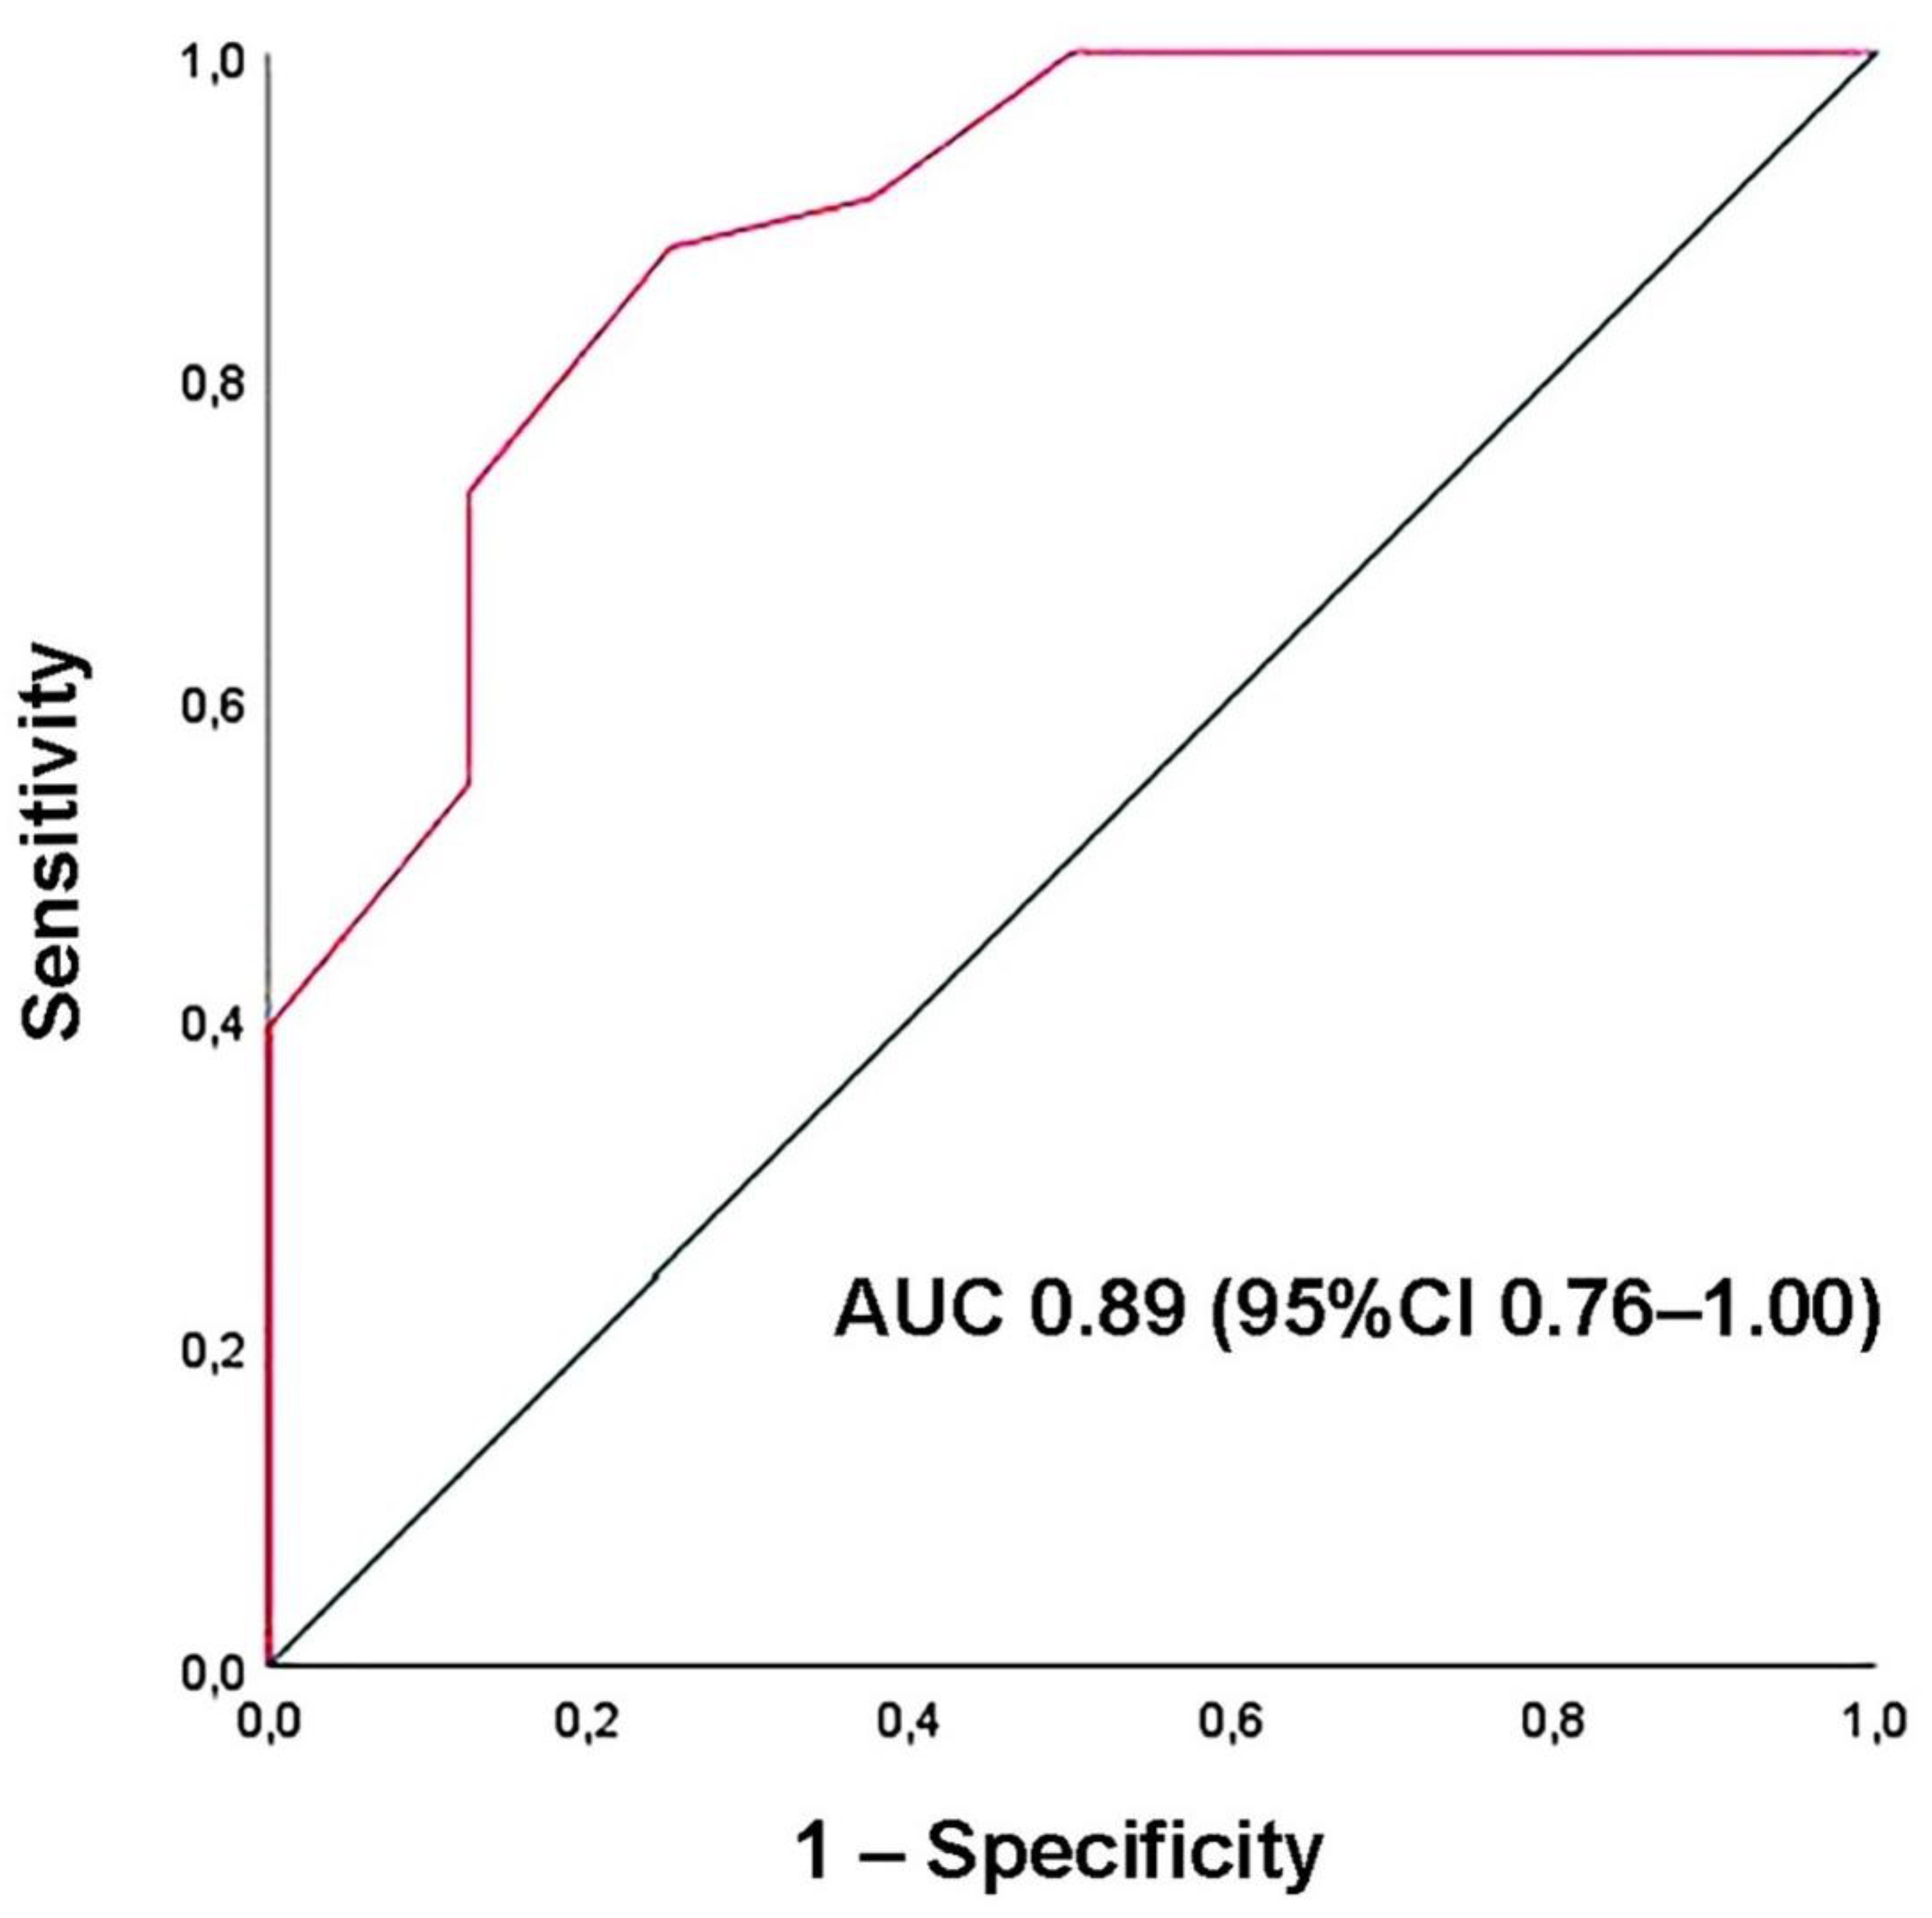

Table 1.
Baseline demographic, clinical, biochemical, and hemodynamic characteristics of ECS patients and controls.
Table 1.
Baseline demographic, clinical, biochemical, and hemodynamic characteristics of ECS patients and controls.
| CLINICAL VARIABLES | Sarcoidosis patients (n = 41) | Controls (n = 30) |
P Value |
|---|---|---|---|
| Demographics and anthropometrics | |||
| Age (yrs) | 57.4 ± 10.2 | 58.5 ± 11.1 | 0.67 |
| Male sex (%) | 24 (58.5) | 16 (53.3) | 0.85 |
| BSA (m2) | 1.96 ± 0.23 | 1.92 ± 0.13 | 0.36 |
| BMI (Kg/m2) | 27.9 ± 4.9 | 26.3 ± 3.5 | 0.11 |
| Cardiovascular risk factors | |||
| Smoking (%) | 13 (31.7) | 10 (33.3) | 0.89 |
| Hypertension (%) | 18 (43.9) | 15 (50.0) | 0.61 |
| Type 2 diabetes (%) | 4 (9.7) | 7 (23.3) | 0.18 |
| Dyslipidemia (%) | 11 (26.8) | 8 (26.7) | 0.99 |
| Clinical staging | |||
| I (%) | 11 (26.8) | / | / |
| II (%) | 23 (56.1) | / | / |
| III (%) | 7 (17.1) | / | / |
| Yrs from diagnosis | 7.2 (1-20) | / | / |
| Spirometry parameters | |||
| FVC (l) | 3.7 ± 1.1 | / | / |
| FVC (%) | 91.3 ± 14.4 | / | / |
| FEV (l) | 2.79 (1.21-6.04) | / | / |
| FEV1 (%) | 88.4 ± 17.6 | / | / |
| FEV1/FVC ratio | 76.1 ± 8.9 | / | / |
| TLC (l) | 5.5 ± 1.4 | / | / |
| TLC (%) | 88 (50-116) | / | / |
| DLCO (ml/min/mmHg) | 6.7 ± 1.5 | / | / |
| DLCO (%) | 81.8 ± 14.1 | / | / |
| Normal pattern (%) | 22 (53.6) | / | / |
| Obstructive pattern (%) | 9 (21.9) | / | / |
| Restrictive pattern (%) | 5 (12.2) | / | / |
| Mixed pattern (%) | 1 (2.4) | / | / |
| Impaired diffusion capacity (%) | 10 (24.4) | / | / |
| 6MWT (m) | 480.2 ± 93.9 | / | / |
| ΔSaO2 (%) | 4.0 ± 2.9 | / | / |
| Blood tests | |||
| Serum hemoglobin (g/dl) | 13.6 ± 1.3 | 13.7 ± 1.2 | 0.74 |
| RDW (%) | 13.3 ± 0.9 | 13.1 ± 0.8 | 0.33 |
| NLR | 0.63 ± 0.14 | 0.59 ± 0.12 | 0.20 |
| Serum creatinine (mg/dl) | 0.85 ± 0.17 | 0.90 ± 0.14 | 0.18 |
| eGFR (ml/min/1.73 m2) | 87.9 ± 18.4 | 93.8 ± 15.5 | 0.15 |
| Serum glucose (mg/dl) | 95.5 ± 11.4 | 100.1 ± 18.2 | 0.23 |
| Serum total cholesterol (mg/dl) | 196.6 ± 52.7 | 204.1 ± 43.4 | 0.51 |
| Comorbidities | |||
| Cancers (%) | 1 (2.4) | 2 (6.7) | 0.57 |
| COPD (%) | 3 (7.3) | 1 (3.3) | 0.63 |
| OSAS (%) | 3 (7.3) | 1 (3.3) | 0.63 |
| GERD (%) | 6 (14.6) | 6 (20.0) | 0.74 |
| Rheumatoid arthritis (%) | 4 (9.7) | 1 (3.3) | 0.39 |
| Hypothyroidism (%) | 4 (9.7) | 4 (13.3) | 0.71 |
| Mixed anxiety–depressive disorder (%) | 1 (2.4) | 3 (10.0) | 0.32 |
| Hemodynamics | |||
| Heart rate (bpm) | 72.1 ± 12.2 | 69.0 ± 8.4 | 0.23 |
| SBP (mmHg) | 129.8 (104-190) | 132.5 (105-165) | 0.46 |
| DBP (mmHg) | 77.6 (63-100) | 79.3 (65-100) | 0.45 |
| Respiratory treatment | |||
| Oxygen therapy (%) | 1 (2.4) | / | / |
| Oral corticosteroids (%) | 14 (34.1) | / | / |
| Inhalation therapy (%) | 14 (34.1) | / | / |
| Immunosuppressants (%) | 3 (7.3) | / | / |
| Nonrespiratory treatment | |||
| Antiplatelets (%) | 4 (9.7) | 4 (13.3) | 0.72 |
| Anticoagulants (%) | 1 (2.4) | 2 (6.7) | 0.57 |
| ACEi-ARBs (%) | 13 (31.7) | 11 (36.7) | 0.66 |
| Calcium channel blockers (%) | 6 (14.6) | 6 (20.0) | 0.57 |
| Beta blockers (%) | 11 (26.8) | 12 (40.0) | 0.25 |
| Diuretics (%) | 6 (14.6) | 7 (23.3) | 0.37 |
| Statins (%) | 6 (14.6) | 12 (40.0) | 0.02 |
| Hydroxychloroquine (%) | 4 (9.7) | 1 (3.3) | 0.39 |
| Oral hypoglycaemic agents (%) | 4 (9.7) | 7 (23.3) | 0.11 |
| Proton pump inhibitors (%) | 6 (14.6) | 6 (20.0) | 0.74 |
Normally distributed data are presented as mean ± SD, while non-normal data as median (range). Categorical variables are expressed as percentages. Significant p values are in bold. ΔSaO2, change in oxygen saturation from stress to rest; 6MWT, Six-Minute Walk Test; ACEi/ARBs, Angiotensin-Converting Enzyme Inhibitors/Angiotensin II Receptor Blockers; BMI, body mass index; BSA, body surface area; COPD, chronic obstructive pulmonary disease; DBP, diastolic blood pressure; DLCO, diffusing capacity of the lung for carbon monoxide; ECS, extra-cardiac sarcoidosis; eGFR, estimated glomerular filtration rate; FEV1, forced expiratory volume in one second; FVC, forced vital capacity; GERD, gastroesophageal reflux disease; NLR, neutrophil-to-lymphocyte ratio; OSAS, obstructive sleep apnea syndrome; RDW, red cell distribution width; SBP, systolic blood pressure; TLC, total lung capacity.
Table 2.
Conventional TTE and carotid ultrasound parameters obtained in ECS patients and controls at basal evaluation.
Table 2.
Conventional TTE and carotid ultrasound parameters obtained in ECS patients and controls at basal evaluation.
| Conventional TTE variables | Sarcoidosis (n = 41) | Controls (n = 30) | P value |
|---|---|---|---|
| LV size and systolic function | |||
| IVS thickness (mm) | 11.5 ± 2.3 | 11.3 ± 2.6 | 0.74 |
| PW thickness (mm) | 8.6 ± 1.3 | 8.7 ± 1.5 | 0.77 |
| LVEDD (mm) | 47.2 ± 4.1 | 48.2 ± 3.6 | 0.28 |
| RWT | 0.37 ± 0.06 | 0.36 ± 0.07 | 0.53 |
| LVMi (g/m2) | 87.1 (40.2–165.8) | 89.3 (48–123) | 0.70 |
| LVEDVi (ml/m2) | 39.2 (24.2–71.9) | 42.5 (29.3–58.8) | 0.13 |
| LVESVi (ml/m2) | 13.6 (7.0–30.8) | 15.2 (12.6–17.7) | 0.13 |
| LVEF (%) | 65.8 (45–75) | 64.2 (57–70) | 0.21 |
| LV geometric pattern | |||
| Normal (%) | 29 (70.7) | 20 (66.7) | 0.80 |
| Concentric remodeling (%) | 7 (17.1) | 2 (6.7) | 0.29 |
| Eccentric hypertrophy (%) | 3 (7.3) | 5 (16.6) | 0.27 |
| Concentric hypertrophy (%) | 2 (4.9) | 3 (10.0) | 0.64 |
| LV diastolic function | |||
| E/A ratio | 0.87 (0.51–2.0) | 0.80 ± 0.20 | 0.26 |
| E/average e’ ratio | 10.1 (6.0–21.5) | 8.5 (4.5–12.4) | 0.03 |
| LA size | |||
| LA A-P diameter (mm) | 40.8 (27.5–62.0) | 40.4 (35–46) | 0.73 |
| LA longitudinal diamerer (mm) | 51.7 (40.0–89.0) | 50.3 (42–55) | 0.37 |
| LAVi (ml/m2) | 28.5 (14.8–90.6) | 32.1 (22.0–43.3) | 0.16 |
| Valvular regurgitation | |||
| More than mild MR (%) | 2 (4.9) | 3 (13.3) | 0.64 |
| More than mild AR (%) | 1 (2.4) | 3 (13.3) | 0.30 |
| More than mild TR (%) | 5 (12.2) | 5 (16.6) | 0.73 |
| RV size and systolic function | |||
| RVIT (mm) | 30.6 (24.5–52.0) | 31.1 (25–37) | 0.59 |
| TAPSE (mm) | 22.4 ± 3.7 | 22.5 ± 3.0 | 0.90 |
| Pulmonary hemodynamics | |||
| TRV (m/sec) | 2.45 (2.0–2.95) | 2.47 (2.18–2.74) | 0.71 |
| sPAP (mmHg) | 29.3 (21–39) | 30.1 (24–40) | 0.49 |
| Aortic dimensions | |||
| Aortic root (mm) | 34.8 (27–49) | 34.2 (29–44) | 0.56 |
| Ascending aorta (mm) | 33.4 (26.5–41.0) | 33.1 (28–42.5) | 0.76 |
| Aortic arch (mm) | 28.3 (22.5–35.0) | 27.5 (23.5–34) | 0.21 |
| Carotid ultrasound variables | |||
| CCA-EDD (mm) | 7.6 (6.2–9.5) | 7.5 (7.0–8.3) | 0.49 |
| CCA-IMT (mm) | 0.99 (0.55–1.50) | 0.92 (0.60–1.10) | 0.09 |
| Carotid RWT | 0.26 (0.18–0.32) | 0.24 (0.16–0.30) | 0.04 |
| Carotid CSA (mm2) | 26.9 (12.8–47.1) | 24.4 (15.3–29.2) | 0.08 |
| Left carotid artery stenosis (%) | 30 (15–45) | 22.5 (10–40) | 0.001 |
| Right carotid artery stenosis (%) | 28.6 (20–45) | 23.3 (10–45) | 0.02 |
Normally distributed data are presented as mean ± SD, while non-normal data as median (range). Categorical variables are expressed as percentages. Significant p values are in bold. A-P, antero-posterior; AR, aortic regurgitation; CCA, common carotid artery; CSA, cross-sectional area; ECS, extra-cardiac sarcoidosis; EDD, end-diastolic diameter; IMT, intima-media thickness; IVS, interventricular septum; LA, left atrial; LAVi, left atrial volume index; LVEDD, left ventricular end-diastolic diameter; LVEDVi, left ventricular end-diastolic volume index; LVEF, left ventricular ejection fraction; LVESVi, left ventricular end-systolic volume index; LVMi, left ventricular mass index; MR, mitral regurgitation; PW, posterior wall; RVIT, right ventricular inflow tract; RWT, relative wall thickness; sPAP, systolic pulmonary artery pressure; TAPSE, tricuspid annular plane systolic excursion; TR, tricuspid regurgitation; TRV, tricuspid regurgitation velocity; TTE, transthoracic echocardiography.
Table 3.
STE-derived myocardial strain parameters measured in ECS patients and controls at basal evaluation.
Table 3.
STE-derived myocardial strain parameters measured in ECS patients and controls at basal evaluation.
| STE variables | Sarcoidosis (n = 41) | Controls (n = 30) | P value |
|---|---|---|---|
| LV regional and global longitudinal strain | |||
| LS 4C view (%) | –18.5 ± 2.5 | –20.7 ± 2.7 | <0.001 |
| LS 2C view (%) | –18.4 ± 3.2 | –20.5 ± 2.9 | 0.005 |
| LS 3C view (%) | –17.4 ± 3.6 | –20.1 ± 3.1 | 0.001 |
| GLS (%) | –18.1 ± 2.6 | –20.4 ± 2.9 | 0.001 |
| LV-GLS less negative than -20% (%) | 33 (80.5) | 6 (20.0) | <0.001 |
| LV regional and global longitudinal strain rate | |||
| LSR 4C view (s-1) | –1.01 (–0.7,–1.3) | –1.15 (–0,97,–1.33) | 0.001 |
| LSR 2C view (s-1) | –0.98 ± 0.14 | –1.13 ± 0.16 | <0.001 |
| LSR 3C view (s-1) | –1.00 (–0.6,–1.3) | –1.11 (–0.94,–1.28) | 0.01 |
| GLSR (s-1) | –1.00 ± 0.11 | –1.13 ± 0.17 | <0.001 |
| LV regional and global circumferential strain | |||
| CS at base level (%) | –16.5 ± 4.5 | –21.3 ± 2.2 | <0.001 |
| CS at papillary muscles level (%) | –19.4 ± 4.5 | –24.5 ± 2.9 | <0.001 |
| CS at apex level (%) | –27.2 ± 6.2 | –26.5 ± 6.4 | 0.65 |
| GCS (%) | –20.2 (–13.6,–29.6) | –24.1 (–20,3,–32.9) | <0.001 |
| LV-GCS less negative than -23.3% (%) | 8 (19.5) | 3 (10.0) | 0.34 |
| LV regional and global circumferential strain rate | |||
| CSR 4C view (s-1) | –1.14 ± 0.20 | –1.37 ± 0.22 | <0.001 |
| CSR 2C view (s-1) | –1.29 ± 0.26 | –1.65 ± 0.29 | <0.001 |
| CSR 3C view (s-1) | –1.80 ± 0.36 | –1.78 ± 0.35 | 0.81 |
| GCSR (s-1) | –1.34 ± 0.23 | –1.60 ± 0.29 | <0.001 |
| LA phasic strain | |||
| LAScd (%) | 22.9 (5.7–36.8) | 28.4 (21–37.5) | <0.001 |
| LASct (%) | –7.4 (–1,–19) | –9.6 (–1,–16.4) | 0.07 |
| LASr (%) | 30.2 (17–55.8) | 38.1 (27.8–46) | <0.001 |
| LASr less positive than 39% (%) | 29 (70.7) | 6 (20.0) | <0.001 |
| LA phasic strain rate | |||
| SRs (s-1) | 1.61 (0.6–2.7) | 1.98 (1.2–3.8) | 0.008 |
| SRe (s-1) | –1.65 (–0.9,–3.7) | –2.47 (–1.7,–4.2) | <0.001 |
| SRl (s-1) | –2.44 ± 0.66 | 2.74 ± 0.56 | 0.04 |
| LASr/E/average e’ ratio (%) | 3.56 ± 1.34 | 4.58 ± 1.37 | 0.003 |
| RV regional and global strain | |||
| FWLS (%) | –17.5 (–12,–27.5) | –24.6 (–19.0,–29.6) | <0.001 |
| GLS (%) | –16.8 (–11.5,–26.5) | –23.5 (–18,–28.5) | <0.001 |
| RV-GLS less negative than -20% (%) | 35 (85.4) | 2 (6.7) | <0.001 |
| RV global strain rate | |||
| GLSR (s-1) | –1.06 ± 0.18 | 1.22 ± 0.19 | <0.001 |
| RA phasic strain | |||
| RAScd (%) | 21.6 ± 7.5 | 25.5 ± 5.8 | 0.02 |
| RASct (%) | –6.9 (–1,–20) | –9.7 (–4,–25) | 0.02 |
| RASr (%) | 28.5 (17–49.4) | 35.2 ± 7.7 | <0.001 |
| RASr less positive than 35% (%) | 28 (68.3) | 5 (16.7) | <0.001 |
| RA phasic strain rate | |||
| SRs (s-1) | 1.79 (1–3.3) | 2.01 (1.21–3.51) | 0.12 |
| SRe (s-1) | –1.46 ± 0.41 | –1.68 ± 0.44 | 0.04 |
| SRl (s-1) | –1.85 ± 0.56 | –2.15 ± 0.61 | 0.04 |
| Timing (minutes) | 9.1 ± 1.5 | 8.0 ± 1.8 | 0.009 |
Normally distributed data are presented as mean ± SD, while non-normal data as median (range). Categorical variables are expressed as percentages. Significant p values are in bold. CS, circumferential strain; CSR 2C view, circumferential strain rate in two-chamber view; CSR 3C view, circumferential strain rate in three-chamber view; CSR 4C view, circumferential strain rate in four-chamber view; ECS, extra-cardiac sarcoidosis; FWLS, free-wall longitudinal strain; GCS, global circumferential strain; GCSR, global circumferential strain rate; GLS, global longitudinal strain; GLSR, global longitudinal strain rate; LAScd, left atrial strain during conduit phase; LASct, left atrial strain during contraction phase; LASr, left atrial strain during reservoir phase; LS 4C, longitudinal strain in four-chamber view; LS 2C view, longitudinal strain in two-chamber view; LS 3C view, longitudinal strain in three-chamber view; LSR 2c view, longitudinal strain rate in two-chamber view; LSR 3C view, longitudinal strain rate in three-chamber view; LSR 4C view, longitudinal strain rate in four-chamber view; RA, right atrial; RAScd, right atrial strain during conduit phase; RASct, right atrial strain during contraction phase; RASr, right atrial strain during reservoir phase; RV, right ventricular; SRe, strain rate during early diastole; SRl, strain rate during late diastole; SRs, strain rate during systole; STE, speckle tracking echocardiography.
Table 4.
The intra- and inter-observer reproducibility of STE-based measurements of LV-GLS and LV-GCS, performed in a subgroup of 15 randomly selected ECS patients.
Table 4.
The intra- and inter-observer reproducibility of STE-based measurements of LV-GLS and LV-GCS, performed in a subgroup of 15 randomly selected ECS patients.
| LV-GLS | LV-GCS | |||||
|---|---|---|---|---|---|---|
| PATIENT LIST | INITIAL MEASUREMENT | REMEASUREMENTS | INITIAL MEASUREMENT | REMEASUREMENTS | ||
| Rater 1 | Rater 2 | Rater 1 | Rater 2 | |||
| 1) L.B. | 15.3 | 16 | 16.5 | 20.4 | 20.8 | 22 |
| 2) A.D. | 16.8 | 17 | 17.1 | 19 | 19.5 | 21 |
| 3) A.C. | 19 | 18 | 17 | 22.7 | 20.3 | 19.5 |
| 4) F.N. | 15.1 | 13.5 | 12 | 13.6 | 15 | 15.6 |
| 5) M.L. | 19.6 | 20 | 20.2 | 13.8 | 13.1 | 12.6 |
| 6) M.B. | 16.6 | 16.9 | 17 | 14.7 | 13.5 | 13 |
| 7) C.M. | 18.4 | 18.5 | 18.8 | 15.4 | 15 | 14.5 |
| 8) M.F. | 18 | 17 | 16.5 | 16.5 | 16 | 15 |
| 9) F.B. | 18.9 | 18 | 16 | 17 | 16.1 | 15.8 |
| 10) L.S. | 16.4 | 15.5 | 15 | 17.1 | 17 | 17.1 |
| 11) S.R. | 19.8 | 19 | 19 | 17.3 | 16.7 | 16.5 |
| 12) G.S. | 24.4 | 23.5 | 23 | 17.5 | 17 | 16.8 |
| 13) M.P. | 16.2 | 17 | 17.1 | 17.5 | 18 | 18.1 |
| 14) P.B. | 19.2 | 20 | 20.2 | 18 | 18.3 | 18.9 |
| 15) D.S. | 17.9 | 18.8 | 18.9 | 18.2 | 17.5 | 17 |
| ICC (95%CI) | 0.93 (0.81–0.98) |
0.82 (0.54–0.93) |
0.92 (0.80–0.97) |
0.83 (0.56–0.94) |
||
ECS, extra-cardiac sarcoidosis; GCS, global circumferential strain; GLS, global longitudinal strain; LV, left ventricular; STE, speckle tracking echocardiography.
Table 5.
Univariate and multivariate logistic regression analysis performed for identifying the independent predictors of subclinical myocardial dysfunction (defined as LV-GLS less negative than –20%) in the whole cohort of ECS patients.
Table 5.
Univariate and multivariate logistic regression analysis performed for identifying the independent predictors of subclinical myocardial dysfunction (defined as LV-GLS less negative than –20%) in the whole cohort of ECS patients.
| UNIVARIATE LOGISTIC REGRESSION ANALYSIS |
MULTIVARIATE LOGISTIC REGRESSION ANALYSIS |
|||||
|---|---|---|---|---|---|---|
| VARIABLES | OR | 95% CI | P value | OR | 95% CI | P value |
| Male sex | 6.00 | 1.04–34.7 | 0.046 | 3.04 | 0.26–35.5 | 0.37 |
| Years from diagnosis | 2.27 | 1.26–4.09 | 0.006 | 2.26 | 1.10–4.65 | 0.03 |
| NLR | 1.10 | 1.01–1.20 | 0.025 | 1.12 | 0.98–1.28 | 0.10 |
| SBP (mmHg) | 1.01 | 0.96–1.06 | 0.62 | |||
ECS, extra-cardiac sarcoidosis; GLS, global longitudinal strain; LV, left ventricular; NLR, neutrophil-to-lymphocyte ratio; SBP, systolic blood pressure.
Disclaimer/Publisher’s Note: The statements, opinions and data contained in all publications are solely those of the individual author(s) and contributor(s) and not of MDPI and/or the editor(s). MDPI and/or the editor(s) disclaim responsibility for any injury to people or property resulting from any ideas, methods, instructions or products referred to in the content. |
© 2026 by the authors. Licensee MDPI, Basel, Switzerland. This article is an open access article distributed under the terms and conditions of the Creative Commons Attribution (CC BY) license (http://creativecommons.org/licenses/by/4.0/).
Copyright: This open access article is published under a Creative Commons CC BY 4.0 license, which permit the free download, distribution, and reuse, provided that the author and preprint are cited in any reuse.


