Submitted:
29 January 2026
Posted:
30 January 2026
You are already at the latest version
Abstract
Background/Objectives: Sweeteners and sweetness enhancers (S&SEs) have been proposed to potentially impair appetite regulation by stimulating sweet taste receptors beyond the perception of sweetness, similar to caloric sweeteners. The evidence is, however, not clear. Methods: This sub-study investigated the acute effects of a mixture of acesulfame potassium and cyclamate (Ace-K/Cyc) versus water on postprandial appetite sensations and energy intake at baseline, after a 2-month weight loss period, and after a 4–month weight loss maintenance period, including (S&SE group) or ex-cluding S&SEs (Sugar group) in the diet. A total of 26 participants (18-65 years; BMI≥25.0 kg/m2) were recruited from the 1-year randomized controlled SWEET trial. Subjective appetite sensations were measured via visual analogue scales fasting and 9 times during a 250-minute postprandial period. During this period first a standardized breakfast (0-10 minutes) and 2 hours later a test drink containing either Ace-K/Cyc or water (120-130 minutes) were given. After 265 minutes, an ad libitum test meal was served. Results: The S&SEs group rated lower feelings of hunger, prospective con-sumption, and desire to eat something sweet after the test drink with Ace-K/Cyc com-pared to the Sugar group consuming water (p< 0.05). This was true for all 3 test days. Adjusting for taste of the test drinks removed the differences for hunger. Ad libitum energy intake did not differ (p>0.05). Conclusions: Ace-K/Cyc compared to water re-duced feelings of prospective consumption and desire to eat something sweet acutely, after 2 months weight loss, and after 4 months weight loss maintenance.
Keywords:
non-caloric sweeteners
; low-caloric sweeteners
; hunger
; satiety
; sweet desire
1. Introduction
Non-caloric sweeteners (NCS) are food additives that possess the ability to sweeten food intensely without contributing with significant energy [1,2]. Low-caloric sweeteners (LCS) are food additives that offer sweetness while containing a reduced amount of energy (on average 7.7 kJ/g) compared to e.g. sucrose (16.8 kJ/g) [1,3,4]. As a group, NCS and LCS can be defined as sweeteners and sweetness enhancers (S&SEs). These additives can enhance the palatability of food without the associated energy or glycemic impact [1,4,5,6,7]. Nevertheless, there is an ongoing debate regarding their potential effects on appetite regulation and energy metabolism [2,8,9,10,11,12,13,14].
The actuality of this debate is highlighted by the most recent recommendation by the World Health Organization [WHO) [15]. Based on a systematic review the WHO advises against using NCS for weight management, citing a lack of long-term benefits in relation to reducing body fat and suggesting potentially increased risks of non-communicable diseases associated with NCS [15,[16]. In contrast, an expert panel’s consensus statements from 2020 concluded that NCS do not promote weight loss, do not negatively impact glucose regulation, and should be considered as a strategy to reduce sugar intake [17]. The discrepancy between these recommendations likely stems from a difference in how the available evidence is weighted. The WHO recommendation seems give more weight to observational studies compared with randomized controlled trials (RCTs), while the expert panel’s consensus statements give higher weight to RCTs than observational studies [16,17]. Since observational studies are prone to confounding and reverse causality, the WHO recommendation is conditional [16]. However, the contrast between these 2 recommendations clearly underlines the different results from RCTs and observational studies within this research field.
S&SEs have been proposed to potentially impair appetite regulation by stimulating sweet taste receptors beyond the perception of sweetness, similar to caloric sweeteners [8,9,11,12,14] and/or by disturbing the gut microbiome [10,13]. Mainly NCS have been the target of the sweet taste receptor theory [8,9,11,12,14]. If NCS can activate sweet taste receptors beyond the sensory taste of sweetness, they might temporarily stimulate carbohydrate oxidation, thus resembling the effect of carbohydrates [18]. However, as NCS will normally cause a reduced content of carbohydrates, especially when consumed as single drinks, the above may potentially create a situation with lower blood glucose levels. This could theoretically increase hunger [19,20,21]. Furthermore, NCS have been proposed to stimulate preference for sweet foods and thereby sweet cravings, which acutely and over time might change eating behaviors [8,9,22]. Looking solely at long-term effects, repeated activation of cephalic-phase responses by NCS without the associated energy load has been proposed to impair appetite regulation by disrupting the hormonal and neurobehavioral pathways regulating appetite [8,9,222]. Furthermore, a perhaps unfavorable change in the gut microbiota over time due to consumption of S&SEs might impair appetite by inducing e.g. insulin resistance [10,12,13]. Lastly, for the NCS that are able to reach the blood brain barrier it has been hypothesized that an accumulation of NCS might be able to induce hippocampal damage, potentially promoting weight gain [8]. Evidence to support these hypotheses are mainly found in animal and in vitro studies, while data from human RCTs are either scarce or do not overall support these theories [8,9,10,12,13,23].
Looking at the evidence from human RCTs, some inconsistencies in ratings of appetite sensations [e.g. for hunger) after consumption of NCS exist [11]. However, when evaluating energy intake, NCS seem to reduce energy intake both acutely and over time compared to sugar [24,25]. Furthermore, NCS seem to have similar effects as water on energy intake acutely. However, results for studies of longer term are somewhat inconsistent [24,25]. Considering sweet preference, a systematic review from 2018 found that greater exposure to sweetened stimuli tended to lead to lower preference for sweetness in short-term studies [<1 month), however limited effects were found in studies of longer term [4-6 months) [26].
The aim of this sub-study was to investigate the effects of a mixture of acesulfame potassium and cyclamate (Ace-K/Cyc) on appetite sensations and energy intake compared to water. This was done before intervention (baseline), after a 2-month weight loss (WL) period, and after a 4-month weight loss maintenance (WLM) period including or excluding S&SEs in the diet.
2. Materials and Methods
2.1. Study Design and Participants
The sub-study was conducted from September 2020 to March 2022 (coinciding with the COVID-19 pandemic) at the Department of Nutrition, Exercise, and Sports, University of Copenhagen, Denmark. Participants were recruited from a 1-year RCT as part of the European Horizon 2020 project SWEET (Sweeteners and sweetness enhancers: Impact on health, obesity, safety and sustainability) (http://www.sweetproject.eu) [27]. The RCT aimed to determine if prolonged consumption of S&SEs could lead to better 1-year WLM and improved obesity-related risk and safety markers compared to when excluding S&SEs, both while consuming a healthy diet [27]. The main study, including the sub-study, was registered at www.clinicaltrials.gov (NCT04226911), approved by the National Research Ethics Committees (ref. H-19040679, approved 21-Oct-1019), and adhered to the Declaration of Helsinki. Informed consent forms were signed before any study-related activities.
The main study design has previously been published [27] as have the main results [28]. Both adults and families with overweight/obesity were recruited, but as only adults participated in the present sub-study, information about inclusion criteria for children will not be presented here. Inclusion criteria for adults were 18-60 years, body mass index (BMI)≥25.0 kg/m2, and regular consumption of sugar-containing products. Exclusion criteria included chronic diseases or medications that could affect study outcomes (e.g. diabetes) [27]. The main study consisted of 4 clinical investigation days (CIDs) scheduled at baseline before WL (CID1, month 0), after WL (month 2), during WLM (month 6), and after WLM (month 12) (Figure 1). During the WL period, adult participants followed a low-energy diet (LED) aiming to reduce body weight by at least 5%. The LED included powdered shakes, soups, smoothies, and bars from the Cambridge Weight Plan (Northants, United Kingdom), allowing up to 4 products per day, providing 3347-4186 kJ/day [27]. After the WL period, participants followed a healthy diet including the recommendation to reduce sugar to <10E%. The strategy for the 2 intervention groups was either to include or exclude foods and drinks containing S&SEs, defined as the S&SEs or Sugar group respectively [27]. Randomization was performed in a 1:1 ratio using blocks of 4 stratified by sex (female/male), age, and BMI, with a randomization list created by an independent person [27]. Participants were randomized after inclusion but allocation was revealed to participants only after the completion of the WL period [27]. The participants did not receive reimbursement for their participation in this sub-study.
The sub-study aimed to include 48 Danish participants from the main study with an equal representation of sex and participants from each intervention group. It consisted of 3 additional test days: Test day 1 (baseline): planned 7-10 days before month 0 (CID1); Test day 2: planned 7-10 days after month 2 (CID2); Test day 3: planned 7 days before or after month 6 (CID3) (Figure 1). Test day 1 examined the acute effects of a standardized breakfast and a test drink with Ace-K/Cyc or water. On test day 2, the same investigation was conducted after participants had lost ≥5% of their body weight. Test day 3 explored the impact of a 4-month weight loss maintenance period of regular consumption of S&SEs compared to no consumption of S&SEs as part of a healthy diet on the acute response to the breakfast and test drinks. Participants were blinded to the test drinks in the sub-study, while the investigators were not.
Prior to all test days, participants were told to fast ≥10 hours, avoid high-intensity physical activity, coffee, and smoking for 12 hours. They were permitted to consume 0.5 L water during the fasting period. Each test day lasted approximately 6 hours (8:00–14:00). On each test day, participants arrived at 8:00 o´clock. Fasting body weight was measured, and for a subgroup of participants (n=15), a catheter was inserted into the elbow joint for blood sampling. After a 15-minute bed-rest, fasting substrate oxidation and energy expenditure were assessed by a ventilated hood system, appetite sensations and well-being recorded, and blood samples taken. A standardized breakfast was served at 0 minutes, and measurements repeated until 120 minutes. Subsequently, the test drink was served, and measurements continued until 250 minutes, followed by an ad libitum test meal at 265 minutes. A planned toilet break was allowed at 105 minutes (Figure 1). Data from the ventilated hood system and blood samples will be published separately.
Appetite sensations and wellbeing were assessed a total of 10 times per test day (Figure 1). Furthermore, palatability of the breakfast and test drinks were assessed just after consumption of the meal/drinks (Figure 1). Appetite sensations, wellbeing and palatability were measured using 100 mm electronic visual analogue scales (eVAS) [29]. The eVAS was set-up on a tablet using the program Evascale© version 1 (2017, Copenhagen, Denmark) [30]. The eVAS has previously been validated against the pen-and-paper method [31]. The questions appeared in a random order during each measurement to ensure participants’ attention to and consideration of each question. Participants were instructed to read each question carefully and respond based on their initial feeling. The questions for appetite sensations and wellbeing were: “How hungry do you feel?”, “How satisfied do you feel?”, “How full do you feel?”, “How much do you think you could eat?”, “Would you like to eat something sweet? “, and “Do you feel comfortable?”. The most negative and positive responses to the questions were anchored at each end of the 100 mm line, ranging from e.g. “I am not hungry at all” to “I have never been more hungry” or “I feel completely empty” to “I could not eat another bite” [29]. For palatability, participants were asked to assess looks, smell, taste, aftertaste, and general appearance of the breakfast/test drinks.
Total postprandial outcomes for appetite sensations and wellbeing were calculated via net incremental area over/under the curve (netAOC/AUC) using the trapezoidal rule. The netAOC/AUC was divided into 3 time periods, representing the effects of the breakfast, the test drinks, and the total time period (Figure 1). The time periods were: 0-100 minutes, 100-250 minutes, and 0-250 minutes. The 100-minute time point was used as the fasting measurement when calculating the 100-250 minute netAOC/AUC.
2.2. Test Meals
The standardized breakfast included Arla Cultura® (sour yogurt) with oat and cranberries and 250 g water (Table 1). Participants in the S&SEs group received a test drink with 5 g of Atwell®-0-calories® (equal to a sweetness intensity of 50 g sugar) and 400 g water. Atwell® contains a mixture of Ace-K and Cyc. Participants in the Sugar group received 405 g of pure tap water. Participants were instructed to consume the meal/drink over 10 minutes, meaning that the last bite/sip should be consumed in the 10th minute.
The ad libitum test meal consisted of gluten free pizza (Ristorante Pizza Mozzarella) from Dr. Oetker© (Dr. Oetker© Danmark A/S, Glostrup, Denmark), chosen for its uniformity and general acceptance (Table 1). Male participants were served 3 pizzas and females 2 pizzas on a tray with a scissor and 250 g of water. The scissor should encourage participants to actively choose and cut each new piece of pizza, rather than having pre-cut slices readily available. The participants were instructed to not leave behind the pizza crust, eat until pleasantly satiated, and drink all of the water. Talking was not allowed while consuming any of the test meals/drinks.
2.3. Statistical Analysis
Statistical analyses were performed in R version 4.2.1 (R Core Team, 2022, Vienna, Austria). Initial data cleaning involved visual inspection of individual curves, and no outliers (data outside ±3 SD). Appetite sensations and wellbeing were analyzed both as repeated measurements and netAOC/AUC via mixed linear ANCOVA models. Models for repeated measurements included interactions between meal, test day, and time and were adjusted for participant number and test day as random effects, and age, sex, smoking status, BMI at baseline, weight change from baseline, and fasting value (0 minutes) of the given outcome as fixed covariates. In case of a time-meal-test day interaction, time-meal interaction, or meal effect, time points and estimated mean differences were compared using emmeans (estimated marginal means) in R. Models for netAOC/AUC included interactions between meal, test day and period, and were adjusted for participant number and test day as random effects, and age, sex, smoking status, BMI at baseline, and weight change from baseline as fixed covariates. Ad libitum energy intake and palatability were also analysed using mixed linear ANCOVA models including interactions between meal and test day, and adjusted for participant number as random effect, and age, sex, and smoking status as fixed covariates. Additionally, the model for ad libitum energy intake included BMI at baseline and weight change from baseline as fixed covariates. When differences were found, Holm's method was used to adjust for multiple testing. Models including weight change from baseline were run without this covariate to ensure that any effect caused by the weight loss combined with Ace-K/Cyc was not masked. This did not change the results, thus only results including weight change from baseline as a covariate are shown. In addition to this, models for appetite sensations and wellbeing were rerun, including the palatability score taste as a fixed covariate, as the test drink with Ace-K/Cyc was found to be less tasty on all 3 test days compared to the test drink with water. Taste scores for the breakfast were included as a covariate for the 0-100 minute netAOC/AUC and for the time points 10 to 100 minutes when analyzing repeated measurements. Taste scores for the test drinks were included as a covariate for the 100-250 minute and 0-250 minute netAOC/AUC, as well as for the time points 130 to 250 minutes when analyzing repeated measurements. Model validation was checked by normal quantile and residual plots, and all models were deemed valid. Available-case analyses were chosen due to high dropout rates. Two participants were served the wrong test drink on test day 1, but received the correct test drink going forward. In the analyses, their data were evaluated based on the test drink they received on each specific test day. When calculating baseline characteristics (means±SD), these 2 participants were included in their original group. Figures show unadjusted means±standard error mean (SEM). Significance level was p<0.05.
3. Results
3.1. Study Flow
Thirty participants were recruited for the sub-study: 26 completed test day 1 (month 0), 22 completed test day 2 (month 2), and 16 completed test day 3 (month 6). Dropout occurred due to e.g. demanding study activities, discomfort in the ventilated hood, or personal reasons (Figure 2).
3.2. Baseline Characteristics
There were no differences in baseline characteristics between the S&SEs and Sugar group (Table 2) or between completers and dropouts (data not shown), all p>0.05.
3.3. Fasting Measurements
No differences were found between the groups in fasting ratings of fullness, satiety, desire to eat something sweet, or prospective consumption after adjusting for multiple testing (all p>0.05). However, the S&SEs group exhibited lower fasting hunger on test day 1 compared to the Sugar group (20.6±7.6 mm, p=0.03). No differences were observed on test day 2 and 3 (p>0.05) (Figure 4). For all 5 appetite sensations, no differences were found between the groups when comparing changes in fasting measurements between the 3 test days (p>0.05). No differences in fasting wellbeing was found on any test day or between test days (p>0.05).
3.4. Subjective Appetite Sensations
No time-meal-test day interaction, time-meal interaction, or meal effect was found for fullness and satiety after adjusting for multiple testing (all p>0.05). Furthermore, netAUC fullness and satiety did not differ between the 2 groups for any of the time periods (0-100 minutes, 100-250 minutes, 0-250 minutes) on any test day, or when comparing changes in netAUC between the 3 test days (all p>0.05) (data not shown). Rerunning analyses with taste as a covariate did not change the results (all p>0.05).
For hunger, no time-meal-test day interaction was found (p=0.12), however a time-meal interaction was found across the 3 test days (p<0.001) (Figure 3). Post hoc analyses showed that the S&SEs group felt less hungry compared to the Sugar group after consuming the test drink (time points: 130 minutes, 16.1±5.2 mm, p=0.03 and 160 minutes, 15.3±5.2 mm, p=0.03) after adjusting for multiple testing. For netAOC hunger no difference between groups was found for any of the time periods on any test day or between the 3 test days (p>0.05) (Figure 3). Rerunning analyses with taste as a covariate, no difference between the groups was found at both time point 130 minutes (p=0.06) and 160 minutes (p=0.08), after adjusting for multiple testing.
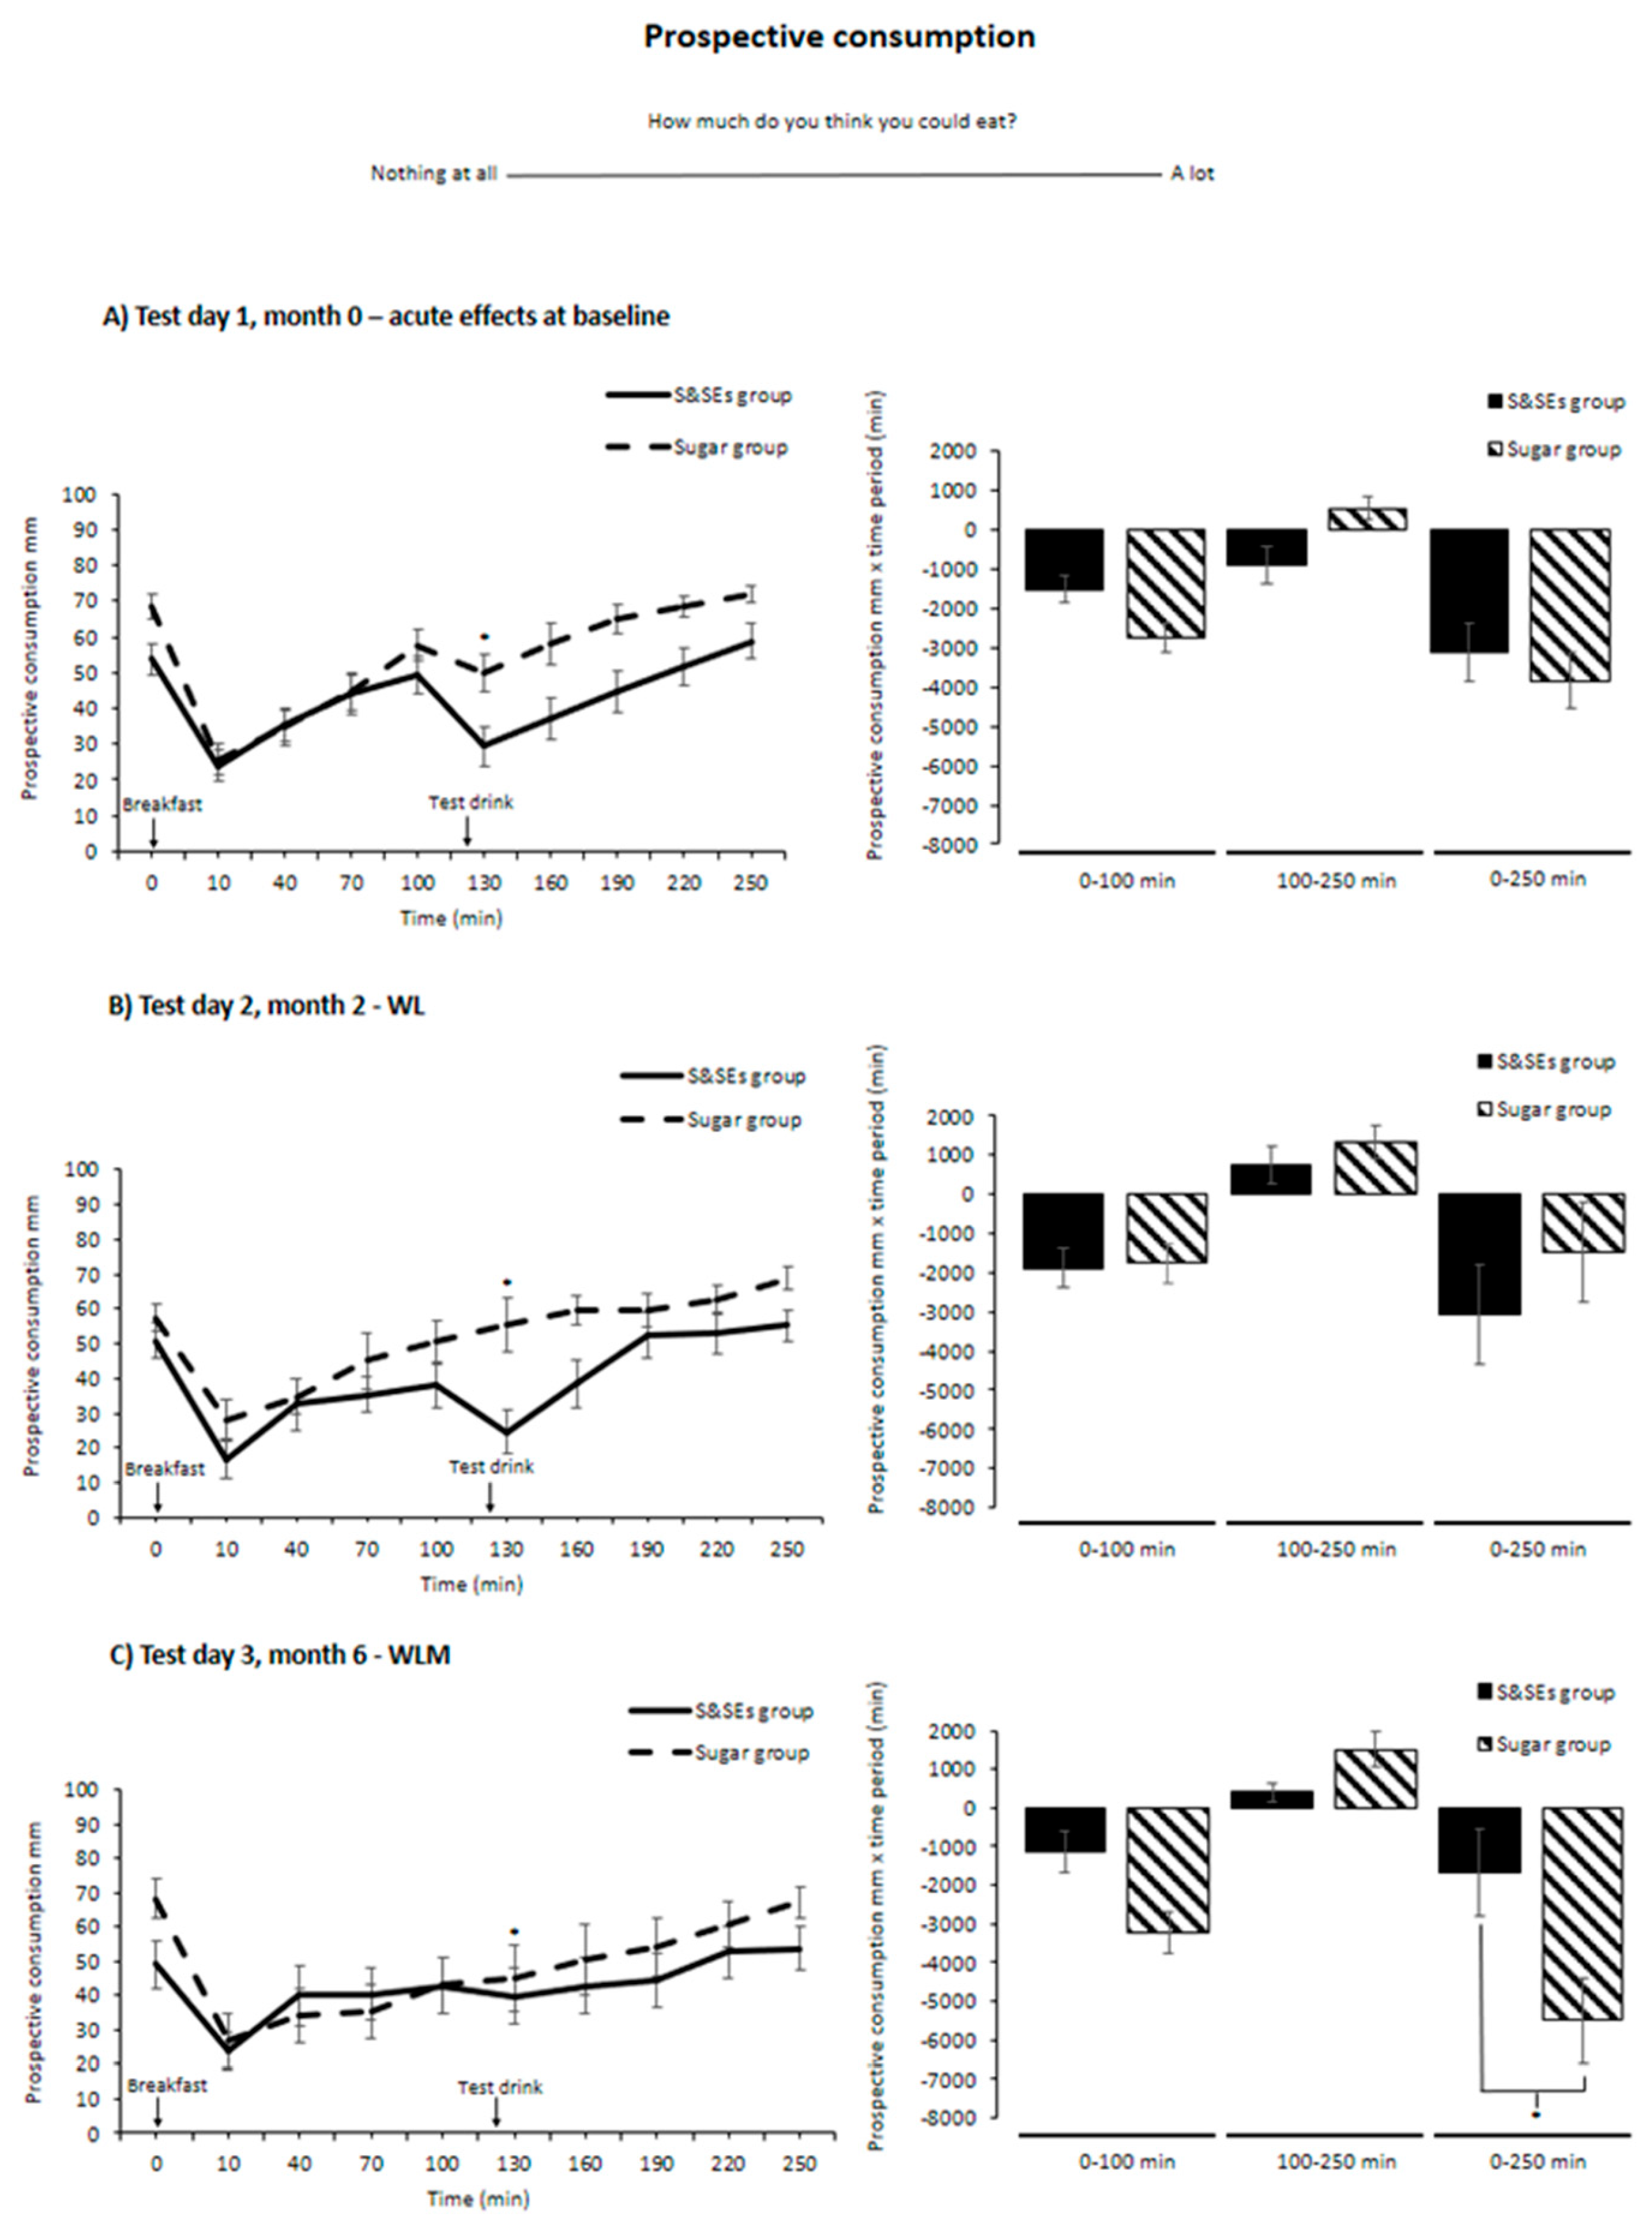
For prospective consumption, no time-meal-test day interaction was found (p=0.33), however a time-meal interaction was found across the 3 test days (p<0.001) (Figure 4). Post hoc analyses showed that the S&SEs group rated lower prospective consumption compared to the Sugar group right after consuming the test drink (time point: 130 minutes, 16.4±5.5 mm, p=0.03) after adjusting for multiple testing. Contrary to this, the S&SEs group showed a lower inhibition of prospective consumption for the 0-250 minute netAOC compared to the Sugar group on test day 3 (3505±1210 mm x 250 minutes, p=0.04) after adjusting for multiple testing. No other differences were found on any test day or when comparing changes between test days for netAOC (all p>0.05) (Figure 4). Rerunning analyses with taste as a covariate, no difference between the groups was found for the 0-250 minute netAOC (p=0.055), after adjusting for multiple testing.
Figure 4.
Prospective consumption shown as unadjusted means±SEM at different time points (left) and netAOC (right) for all 3 test days: A) Test day 1, month 0 – acute effects at baseline, Test day 2, month 2 – WL and C) Test day 3, month 6 – WLM. ANCOVA models were used to test for differences between groups, including participant number and test day as random effects, and age, sex, smoking status, BMI at baseline, and weight change from baseline as fixed covariates. Models for repeated measurements also included fasting prospective consumption as a fixed effect. To illustrate that netAOC provides information about how much prospective consumption is inhibited, the netAOC means have been reversed. Holm's method was used for multiple testing adjustments, and differences after adjustment are indicated with an asterisk (*, p<0.05). Rerunning analyses with taste as a covariate showed no difference in the 0-250 minute netAOC after adjusting for multiple testing (p=0.055). Abbreviations: BMI, body mass index; SEM, standard error mean; S&SEs, sweeteners and sweetness enhancers; netAOC, net incremental area over the curve; WL, weight loss; WLM, weight loss maintenance. .
For desire to eat something sweet, no time-meal-test day interaction was found (p=0.19), but a time-meal interaction was found across the 3 test days (p<0.001) (Figure 5). Post hoc analyses showed that the S&SEs group rated lower desire to eat something sweet compared to the Sugar group at all 5 time points after consumption of the test drink (time points: 130 minutes, 27.5±5.6 mm, p<0.001; 160 minutes, 25.7±5.6 mm, p=0.001; 190 minutes, 19.0±5.6 mm, p=0.005; 220 minutes, 20.0±5.6 mm, p=0.003; and 250 minutes, 20.8±5.6 mm, p=0.002) after adjusting for multiple testing (Figure 5). No differences were seen for netAOC (all p>0.05) after adjusting for multiple testing. Rerunning analyses with taste as a covariate found, in addition to the time points above, a reduced desire to eat something sweet across the 3 test days for the S&SEs group compared to the Sugar group just before serving the test drink (time point: 100 minutes, 14.8±5.5 mm, p=0.03).
3.4. Palatability Scores, Wellbeing and Ad Libitum Energy Intake
For the standardized breakfast, none of the 5 palatability measures differed between groups on any test day or when comparing changes between test days (all p>0.05) (data not shown).
For the 2 test drinks, look, smell, and aftertaste did not differ between groups on any test day or when comparing changes between test days (all p>0.05) (data not shown). For general appearance, the test drink with Ace-K/Cyc was found to be less appealing than the test drink with water on test day 1 (29.1±11.6 mm, p=0.045) after adjusting for multiple testing (Figure 6A). No differences were found when comparing changes between test days (all p>0.05). For taste, the test drink with Ace-K/Cyc was found to be less tasty on all 3 test days (test day 1: 37.5±11.8 mm, p=0.008; test day 2: 28.3±12.8 mm, p=0.03; test day 3: 39.1±14.5 mm, p=0.02) (Figure 6B) after adjusting for multiple testing. No differences were found when comparing changes between test days (all p>0.05). Furthermore, there were no differences in wellbeing for any of the performed analyses (all p>0.05) after adjusting for multiple testing.
Ad libitum energy intake did not differ between groups on any test day (Figure 6C) or when comparing changes between test days (all p>0.05).
4. Discussion
4.1. Summary of Findings
The S&SEs group rated lower hunger, prospective consumption, and desire to eat something sweet at different time points across the 3 test days after the test drink with Ace-K/Cyc compared to the Sugar group consuming water. The S&SEs group rated lower prospective consumption for the 0-250 minute netAOC on test day 3 compared to the Sugar group. Ratings of fullness, satiety and ad libitum energy intake did not differ between groups or test days. Palatability did differ between groups with the test drink containing Ace-K/Cyc perceived as less appealing and tasteful compared to the test drink with water. When including taste as a covariate, the differences between groups for hunger and the 0-250 minute netAOC prospective consumption disappeared. Four months consumption of the diets did not change the response to a standardized breakfast, the acute response to a test drink, or ad libitum energy intake, thus indicating lasting effects without adaptations over time.
4.2. Appetite Sensations—Fullness, Satiety, Prospective Consumption, and Hunger
The findings of no effects of Ace-K/Cyc on fullness, satiety, and hunger (after adjusting for taste), and decreased effects on prospective consumption compared to water contradicts older research and prevailing myths which demonstrated a phenomenon defined as rebound hunger [11,32]. Rebound hunger was demonstrated in an acute study by Rogers et al. [32]. Here, the consumption of drinks containing aspartame or saccharine initially led to suppressed appetite ratings for hunger, prospective consumption, desire to eat, and increased feelings of fullness. However, within an hour, these ratings increased above the baseline level compared to water (rebound hunger). Notably, only the aspartame drink showed significant effects compared to water and only for hunger and desire to eat. The study also included a test drink with Ace-K. Here Ace-K did not exhibit initial appetite suppression but followed the pattern of increases above baseline after consumption compared to water; however, these changes were not statistically significant. No differences in energy intake were observed 1 hour after consuming the NCS drinks compared to water [32]. These appetite-increasing effects of aspartame on hunger compared to water have not been demonstrated in many subsequent acute pre-load studies [33]. Most of these pre-load studies simply show effects on hunger similar to water [33], a finding also supported by more recent acute studies including isoenergetic conditions evaluating a range of NCS on appetite ratings [34,35,36,37]. Thus, these results align with the findings of the current study.
Longer-term studies evaluating these subjective appetite sensations comparing NCS to either an isoenergetic or a non-isoenergetic comparator, show generally similar ratings of subjective appetite sensations between the NCS and the given comparator [35, [38,39,40,41]. This supports the finding of the current study, namely that 4-month regular consumption of S&SEs in the diet did not affect the response to a standardized breakfast compared to no consumption of S&SEs in the diet.
4.2.1. Hunger
When analyzing the data with the originally planned model, the current study showed a reduced hunger up to 40 minutes after the Ace-K/Cyc test drink compared to water across the 3 test days. Reanalyzing the results with taste as a covariate suggested that palatability differences between the test drinks account for these findings. However, since the taste disparity is mainly due to sweetness, including taste as a covariate may obscure any potential sensory impact of sweetness on hunger. The same argument can also be used for prospective consumption, where the difference between groups on test day 3 for the 0-250 minute netAOC prospective consumption disappeared after including taste as a covariate. Thus, it is difficult to determine whether different palatability of the test drinks or the sweet taste itself caused the originally seen differences between the groups. This clearly demonstrates challenges that are hard to overcome when testing NCS versus water on appetite.
4.2.2. Prospective Consumption
Looking specifically at the repeated measurements analyses for prospective consumption, the current study's results directly contrast with those of the aforementioned study by Rogers et al. [32]. Thus, the current study found a significant reduction in prospective consumption 10 minutes after the Ace-K/Cyc drink whereas Rogers et al. [32] found no significant reduction for any of the test drinks. An explanation for the difference between these 2 studies might be differences in dose of NCS and the fact that the current study included a mixture of Ace-K/Cyc and not pure Ace-K, aspartame, or saccharine.
Comparing the results of the current study to non-isoenergetic studies on NCS drinks versus sugar-rich drinks must be done with caution, as the energy disparity between interventions can be a confounding factor. Baring that in mind, a recently published acute study by Almiron-Roig et al. [42] showed that a test drink containing sucralose/Ace-K resulted in a temporal profile with higher ratings of prospective consumption compared to sucrose when consumed 7 minutes prior to a standardized breakfast. However, this did not translate into a variation in 24-hour energy intake. While the contrast between these 2 groups could be explained by the energy disparity between the test drinks, other blends of NCS did not exhibit any variation in prospective consumption compared to sucrose. Thus, the results of the study by Almiron-Roig et al. [42] indirectly contrast the results of the current study. However, NCS blend and design differences might explain these contrasting results.
Aligning with the results of our study is a 10-week ad libitum study by Sørensen et al. [40]. After 10 weeks, a diet containing foods and drinks with a mix of NCS (54% aspartame, 23% Cyc, 22% Ace-K, and 1% saccharin) resulted in higher levels of fullness and lower prospective consumption at different time points after lunch and dinner compared to a diet with sugar. This was despite a lower ad libitum energy intake at the lunch and dinner in the NCS group.
4.2.3. Desire to Eat Something Sweet
The current study's findings of reduced desire to eat something sweet could be attributed to the term sensory-specific satiety, where exposure to e.g. sweetness leads to a decrease in the perceived pleasantness and preference for foods/drinks sharing the same attribute [26]. That NCS can stimulate sensory-specific satiety is in agreement with previous acute studies comparing NCS to water [35,43].
In a paper by Rogers et al. [43], 3 acute studies were conducted. In the first study, the effects of a drink containing sucralose versus water were evaluated on parameters such as the desire to consume and the pleasantness of taste. These parameters were assessed shortly (within 1 minute) before and after consuming the 2 test drinks. The 2nd study had a similar design; however, it expanded the evaluation to include another round of assessments 2 hours after consuming the test drinks. In the 3rd study, participants consumed sugar- or NCS-sweetened (aspartame) coca cola, or still or carbonated water shortly before and during ad libitum consumption of sweet and non-sweet foods. Together, the results of these 3 acute studies showed that drinks with NCS acutely decreased desire for and intake of sweet foods, but not total ad libitum energy intake [43]. In addition, an acute and longer-term study by Fantino et al. [35] partly supports these results. In the acute part of the study, intake of sweet foods in a laboratory setting was lowered when consuming an NCS lemonade (a mix of Ace-K, aspartame, and sucralose) compared to water for female participants, while no difference was found for male participants. In the longer-term part of the study, consuming NCS lemonade for 5 weeks did not affect energy intake, micronutrient intake, or the selection of sweet foods compared to water [35]. In line with this, a study by Appleton et al. [44] found no difference between groups on ratings of pleasantness of sweet foods and intake of sweet foods when being exposed to a breakfast sweetened with sucralose compared to a non-sweet, isoenergetic breakfast for 3 weeks. This was recently confirmed by the large RCT “Sweet Tooth” including 180 healthy volunteers [45]. Here, sweet taste preference was not affected by high, medium or low exposure to sweet-tasting foods for 6 months. The fact that NCS compared to water do not increase preference for sweet foods is further supported by a longer-term study by Popkin et al. [46]. They found that consumption of NCS in the diet for 6 months compared to water led to a reduction in energy intake from sugars and desserts [46].
In total, despite the different study designs all the above studies and our own findings do not support the notion that NCS will increase preference for sweet foods acutely or in the longer term.
4.4. Energy Intake
The present study found that the acute effects of Ace-K/Cyc on ad libitum energy intake were comparable with water both at baseline and after a period with regular consumption of S&SEs. This is in line with the acute findings in the aforementioned systematic review by Rogers et al. [24]. Due to the design of the current study, it is difficult to compare it to longer-term studies assessing energy intake in relation to NCS and/or LCS. However, the results do not indicate an effect on the ad libitum test meal after exposure to S&SEs for 4 months compared to no consumption of S&SEs in the diet.
4.5. Strengths and Limitations
This study excels in its distinctive capacity to evaluate Ace-K/Cyc's acute effects on appetite both before and after regular consumption of S&SEs in the diet, as well 2as its ability to investigate the impact of regular consumption of S&SEs on responses to a standardized breakfast and an ad libitum test meal. This was achieved by using water as the control, incorporating a standardized breakfast and an ad libitum test meal, conducting tests before and after 4 months of including or excluding S&SEs in the diet, and dividing the 4-hour netAUC/AOC into 3 distinct time periods to differentiate between the effects of the standardized breakfast and the test drinks. However, a limitation of the study is that it has a low statistical power. Power was calculated based on the primary outcome of the sub-study, which was fat oxidation (Andersen et al., unpublished data). To achieve a power of 80% with a significance level of 0.05 for all the included appetite sensations and the ad libitum test meal, up to 108 participants per group would be required, depending on the specific outcome and effect size [29,47]. In addition to the low power of the study, the palatability differences observed between the test drinks present challenges when interpreting the results. Lastly, to determine whether the reduced desire to eat something sweet observed in the S&SEs group translates into decreased consumption of sweet foods, future studies could incorporate an ad libitum test meal with a buffet-style approach. Using a buffet-style approach, one would be able to measure the effect of the test drink on e.g. sweet food choices [48].
5. Conclusions
A drink containing Ace-K/Cyc decreased postprandial feelings of prospective consumption and desire to eat something sweet in the acute phase (i.e. up to 2 hours after consumption) compared to water. This effect persisted after a 2-month WL period and a 4-month WLM period with S&SEs in the diet, indicating lasting effects without adaptations. In addition to this, Ace-K/Cyc had similar effects on ad libitum energy intake as water. Furthermore, regular consumption of S&SEs in the diet did neither change the response to a standardized breakfast, nor the ad libitum energy intake in a test meal compared to no consumption of S&SEs in the diet.
Author Contributions
Conceptualization, S.S.H.A., A.R., and L.K.; investigation, S.S.H.A. and L.K.; formal analysis, S.S.H.A; visualization, S.S.H.A.; writing original draft, S.S.H.A.; Review and editing, S.S.H.A., A.R., L.K., J.C.G.H. J.A.H. The authors have reviewed and edited the output and take full responsibility for the content of this publication.
Funding
EU Horizon 2020 grant #774293.
Institutional Review Board Statement
The study was conducted in accordance with the Declaration of Helsinki and approved by the National Research Ethics Committees (ref. H-19040679, approved 21-Oct-1019).
Informed Consent Statement
Informed written consent was obtained from all subjects involved in the study.
Data Availability Statement
Data is available on request.
Acknowledgments
The authors would like to thank kitchen staff Charlotte Kostecki, Kira Hamann and Karina Rossen for preparing the test foods; Lector Bo Magnussen and Professor Christian Ritz for statistical advice.
Conflicts of Interest
A.R. has received honoraria from the International Sweeteners Association. J.C.G.H. and J.H. have received project funds from the American Beverage Association. The funders had no role in the design of the study; in the collection, analyses, or interpretation of data; in the writing of the manuscript; or in the decision to publish the results.
References
- Chattopadhyay, S.; Raychaudhuri, U.; Chakraborty, R. Artificial sweeteners - A review. Journal of Food Science and Technology 2014, 51(4), 611–621. [Google Scholar] [CrossRef]
- Magnuson, B. A.; Carakostas, M. C.; Moore, N. H.; Poulos, S. P.; Renwick, A. G. Biological fate of low-calorie sweeteners. Nutrition Reviews 2016, 74(11), 670–689. [Google Scholar] [CrossRef]
- Grembecka, M. Sugar alcohols-their role in the modern world of sweeteners: a review. EUROPEAN FOOD RESEARCH AND TECHNOLOGY 2015, 241(1), 1–14. [Google Scholar] [CrossRef]
- Rice, T., Zannini, E., K. Arendt, E., & Coffey, A. A review of polyols–biotechnological production, food applications, regulation, labeling and health effects. Critical Reviews in Food Science and Nutrition 2020, 60(12), 2034–2051. [CrossRef] [PubMed]
- Livesey, G. Health potential of polyols as sugar replacers, with emphasis on low glycaemic properties. Nutrition Research Reviews 2003, 16(2), 163–191. [Google Scholar] [CrossRef] [PubMed]
- Martí, N.; Funes, L. L.; Saura, D.; Micol, V. An update on alternative sweeteners. International Sugar Journal 2008, 110(1315), 425–429. [Google Scholar]
- Msomi, N. Z.; Erukainure, O. L.; Islam, M. S. Suitability of sugar alcohols as antidiabetic supplements: A review. Journal of Food and Drug Analysis 2021, 29(1), 1–14. [Google Scholar] [CrossRef] [PubMed]
- Burke, M. V.; Small, D. M. Physiological mechanisms by which non-nutritive sweeteners may impact body weight and metabolism. Physiol Behav. 2015, 30(7), 1289–1303. [Google Scholar] [CrossRef]
- Mattes, R. D.; Popkin, B. M. Nonnutritive sweetener consumption in humans: Effects on appetite and food intake and their putative mechanisms. American Journal of Clinical Nutrition 2009, 89(1), 1–14. [Google Scholar] [CrossRef]
- Nettleton, J. E.; Reimer, R. A.; Shearer, J. Reshaping the gut microbiota: Impact of low calorie sweeteners and the link to insulin resistance? Physiology and Behavior 2016, 164, 488–493. [Google Scholar] [CrossRef]
- O’Connor, D.; Pang, M.; Castelnuovo, G.; Finlayson, G.; Blaak, E.; Gibbons, C.; Navas-Carretero, S.; Almiron-Roig, E.; Harrold, J.; Raben, A.; Martinez, J. A. A rational review on the effects of sweeteners and sweetness enhancers on appetite, food reward and metabolic/adiposity outcomes in adults. Food & Function 2021, 12(2), 442–465. [Google Scholar] [CrossRef]
- Pang, M. D.; Goossens, G. H.; Blaak, E. E. The Impact of Artificial Sweeteners on Body Weight Control and Glucose Homeostasis. Frontiers in Nutrition 2021, 7, 1–19. [Google Scholar] [CrossRef]
- Payne, A. N.; Chassard, C.; Lacroix, C. Gut microbial adaptation to dietary consumption of fructose, artificial sweeteners and sugar alcohols: implications for host-microbe interactions contributing to obesity. OBESITY REVIEWS 2012, 13(9), 799–809. [Google Scholar] [CrossRef]
- Pearlman, M.; Obert, J.; Casey, L. The Association Between Artificial Sweeteners and Obesity. Current Gastroenterology Reports 2017, 19(12), 1–8. [Google Scholar] [CrossRef] [PubMed]
- World Health Organization (WHO). Health effects of the use of non-sugar sweeteners: a systematic review and meta-analysis. In World Health Organization; 2022; Available online: https://www.who.int/publications/i/item/9789240046429.
- Use of non-sugar sweeteners: WHO guideline; Licence: CC BY-NC-SA 3.0 IGO; World Health Organization: Geneva, 2023.
- Ashwell, M.; Gibson, S.; Bellisle, F.; Buttriss, J.; Drewnowski, A.; Fantino, M.; Gallagher, A. M.; de Graaf, K.; Goscinny, S.; Hardman, C. A.; Laviada-Molina, H.; López-García, R.; Magnuson, B.; Mellor, D.; Rogers, P. J.; Rowland, I.; Russell, W.; Sievenpiper, J. L.; la Vecchia, C. Expert consensus on low-calorie sweeteners: facts, research gaps and suggested actions. Nutrition Research Reviews 2020, 33(1), 145–154. [Google Scholar] [CrossRef] [PubMed]
- Andersen, S. S. H.; Zhu, R.; Kjølbæk, L.; Raben, A. Effect of Non- and Low-Caloric Sweeteners on Substrate Oxidation, Energy Expenditure, and Catecholamines in Humans—A Systematic Review. Nutrients 2023, 15(12), 2711. [Google Scholar] [CrossRef] [PubMed]
- Jordan, S. D.; Könner, A. C.; Brüning, J. C. Sensing the fuels: Glucose and lipid signaling in the CNS controlling energy homeostasis. Cellular and Molecular Life Sciences 2010, 67, 3255–3273. [Google Scholar] [CrossRef]
- Levin, B. E. Metabolic sensing neurons and the control of energy homeostasis. Physiology and Behavior 2006, 89, 486–489. [Google Scholar] [CrossRef]
- Ludwig, D. S. The Glycemic Index. JAMA 2002, 287(18), 2414. [Google Scholar] [CrossRef]
- Ludwig, D. S. Artificially Sweetened Beverages Cause for Concern. JAMA-JOURNAL OF THE AMERICAN MEDICAL ASSOCIATION 2009, 302(22), 2477–2478. [Google Scholar] [CrossRef]
- Rogers, P. J. The role of low-calorie sweeteners in the prevention and management of overweight and obesity: Evidence v. conjecture. Proceedings of the Nutrition Society 2018, 77(3), 230–238. [Google Scholar] [CrossRef] [PubMed]
- Rogers, P. J.; Hogenkamp, P. S.; De Graaf, C.; Higgs, S.; Lluch, A.; Ness, A. R.; Penfold, C.; Perry, R.; Putz, P.; Yeomans, M. R.; Mela, D. J. Does low-energy sweetener consumption affect energy intake and body weight? A systematic review, including meta-analyses, of the evidence from human and animal studies. International Journal of Obesity 2016, 40(3), 381–394. [Google Scholar] [CrossRef]
- Rogers, P. J.; Appleton, K. M. The effects of low-calorie sweeteners on energy intake and body weight: a systematic review and meta-analyses of sustained intervention studies. International Journal of Obesity 2021, 45(3), 464–478. [Google Scholar] [CrossRef]
- Appleton, K. M.; Tuorila, H.; Bertenshaw, E.; De Graaf, C.; Mela, D. Sweet taste exposure and the subsequent acceptance and preference for sweet taste in the diet: Systematic review of the published literature. American Journal of Clinical Nutrition 2018, 107(3), 405–419. [Google Scholar] [CrossRef]
- Kjølbæk, L.; Manios, Y.; Blaak, E. E.; Martínez, J. A.; Feskens, E. J. M.; Finlayson, G.; Andersen, S. S. H.; Reppas, K.; Navas-Carretero, S.; Adam, T. C.; Hodgkins, C. E.; Del Álamo, M.; Lam, T.; Moshoyiannis, H.; Halford, J. C. G.; Harrold, J. A.; Raben, A. Protocol for a multicentre, parallel, randomised, controlled trial on the effect of sweeteners and sweetness enhancers on health, obesity and safety in overweight adults and children: the SWEET project. BMJ Open 2022, 12(10). [Google Scholar] [CrossRef]
- Pang, MD; Kjølbæk, L; Bastings, JJAJ; Andersen, SSH; Umanets, A; Sost, MM; Navas-Carretero, S; Reppas, K; Finlayson, G; Hodgkins, CE; Del Álamo, M; Lam, T; Moshoyiannis, H; Feskens, EJM; Adam, TCM; Goossens, GH; Halford, JCG; Harrold, JA; Manios, Y; Martinez, JA; Blaak, EE; Raben, A. Effect of sweeteners and sweetness enhancers on weight management and gut microbiota composition in individuals with overweight or obesity: the SWEET study. Nat Metab. 2025, 7(10), 2083–2098. [Google Scholar] [CrossRef] [PubMed]
- Flint, A.; Raben, A.; Blundell, J.; Astrup, A. Reproducibility, power and validity of visual analogue scales in assessment of appetite sensations in single test meal studies. International Journal of Obesity 2000, 24, 38–48. [Google Scholar] [CrossRef] [PubMed]
- Laugesen, J. L. Evascale© (Build: February 28, 2018). Jakob@sensory.dk. 2017. [Google Scholar]
- Klingenberg, L.; Nyby, S.; Kristensen, M. B.; Raben, A. Visual analogue scales to assess appetite sensation- good agreement between 100 mm pen and paper vs tablet-based scores. Obesity Facts 2015, 8, 101. [Google Scholar]
- Rogers, P. J.; Carlyle, J. A.; Hill, A. J.; Blundell, J. E. Uncoupling sweet taste and calories: comparison of the effects of glucose and three intense sweeteners on hunger and food intake. Physiology & Behavior 1988, 43(5), 547–552. [Google Scholar] [CrossRef]
- Bellisle, F.; Drewnowski, A. Intense sweeteners, energy intake and the control of body weight. European Journal of Clinical Nutrition 2007, 61(6), 691–700. [Google Scholar] [CrossRef]
- Chern, C.; Tan, S.-Y. Energy Expenditure, Carbohydrate Oxidation and Appetitive Responses to Sucrose or Sucralose in Humans: A Pilot Study. Nutrients 2019, 11(8), 1–11. [Google Scholar] [CrossRef] [PubMed]
- Fantino, M.; Fantino, A.; Matray, M.; Mistretta, F. Beverages containing low energy sweeteners do not differ from water in their effects on appetite, energy intake and food choices in healthy, non-obese French adults. Appetite 2018, 125, 557–565. [Google Scholar] [CrossRef]
- Ford, H. E.; Peters, V.; Martin, N. M.; Sleeth, M. L.; Ghatei, M. A.; Frost, G. S.; Bloom, S. R. Effects of oral ingestion of sucralose on gut hormone response and appetite in healthy normal-weight subjects. European Journal of Clinical Nutrition 2011, 65(4), 508–513. [Google Scholar] [CrossRef]
- Pearson, R. C.; Green, E. S.; Olenick, A. A.; Jenkins, N. T. Comparison of aspartame- and sugar-sweetened soft drinks on postprandial metabolism. In Nutrition and Health; 2021; pp. 1–14. [Google Scholar] [CrossRef]
- Higgins, K. A.; Considine, R. V.; Mattes, R. D. Aspartame consumption for 12 weeks does not affect glycemia, appetite, or body weight of healthy, lean adults in a randomized controlled trial. Journal of Nutrition 2018, 148(4), 650–657. [Google Scholar] [CrossRef] [PubMed]
- Higgins, K. A.; Mattes, R. D. A randomized controlled trial contrasting the effects of 4 low-calorie sweeteners and sucrose on body weight in adults with overweight or obesity. American Journal of Clinical Nutrition 2019, 109(5), 1288–1301. [Google Scholar] [CrossRef] [PubMed]
- Sørensen, L. B.; Vasilaras, T. H.; Astrup, A.; Raben, A. Sucrose compared with artificial sweeteners: A clinical intervention study of effects on energy intake, appetite, and energy expenditure after 10 wk of supplementation in overweight subjects. American Journal of Clinical Nutrition 2014, 100(1), 36–45. [Google Scholar] [CrossRef]
- Van Wymelbeke, V.; Béridot-Thérond, M. E.; de La Guéronnière, V.; Fantino, M. Influence of repeated consumption of beverages containing sucrose or intense sweeteners on food intake. European Journal of Clinical Nutrition 2004, 58(1), 154–161. [Google Scholar] [CrossRef]
- Almiron-Roig, E.; Navas-Carretero, S.; Castelnuovo, G.; Kjølbæk, L.; Romo-Hualde, A.; Normand, M.; Maloney, N.; Hardman, C. A.; Hodgkins, C. E.; Moshoyiannis, H.; Finlayson, G.; Scott, C.; Raats, M. M.; Harrold, J. A.; Raben, A.; Halford, J. C. G.; Martínez, J. A. Impact of acute consumption of beverages containing plant-based or alternative sweetener blends on postprandial appetite, food intake, metabolism, and gastro-intestinal symptoms: Results of the SWEET beverages trial. Appetite 2023, 184. [Google Scholar] [CrossRef]
- Rogers, P. J.; Ferriday, D.; Irani, B.; Hei Hoi, J. K.; England, C. Y.; Bajwa, K. K.; Gough, T. Sweet satiation: Acute effects of consumption of sweet drinks on appetite for and intake of sweet and non-sweet foods. Appetite 2020, 149, 104631. [Google Scholar] [CrossRef]
- Appleton, K. M.; Rajska, J.; Warwick, S. M.; Rogers, P. J. No effects of sweet taste exposure at breakfast for 3 weeks on pleasantness, desire for, sweetness or intake of other sweet foods: a randomised controlled trial. British Journal of Nutrition;Physiological 2022, 127(9), 1428–1438. [Google Scholar] [CrossRef] [PubMed]
- Čad, EM; Mars, M; Pretorius, L; van der Kruijssen, M; Tang, CS; de Jong, HB; Balvers, M; Appleton, KM; de Graaf, K. The Sweet Tooth Trial: A Parallel Randomized Controlled Trial Investigating the Effects of A 6-Month Low, Regular, or High Dietary Sweet Taste Exposure on Sweet Taste Liking, and Various Outcomes Related to Food Intake and Weight Status. Am J Clin Nutr. Epub. 2026, 123(1), 101073. [Google Scholar] [CrossRef]
- Popkin, B. M.; Wang, X.; Piernas, C.; Tate, D. F. Does diet-beverage intake affect dietary consumption patterns? Results from the Choose Healthy Options Consciously Everyday (CHOICE) randomized clinical trial1-3. American Journal of Clinical Nutrition 2013, 97(3), 604–611. [Google Scholar]
- Gregersen, N. T.; Flint, A.; Bitz, C.; Blundell, J. E.; Raben, A.; Astrup, A. Reproducibility and power of ad libitum energy intake assessed by repeated single meals. The American Journal of Clinical Nutrition 2008, 87(5), 1277–1281. [Google Scholar] [CrossRef] [PubMed]
- Blundell, J.; De Graaf, C.; Hulshof, T.; Jebb, S.; Livingstone, B.; Lluch, A.; Mela, D.; Salah, S.; Schuring, E.; Van Der Knaap, H.; Westerterp, M. Appetite control: Methodological aspects of the evaluation of foods. Obesity Reviews 2010, 11(3), 251–270. [Google Scholar] [CrossRef] [PubMed]
Figure 1.
Study design of relevant parts of the main study and procedures in the sub-study. Abbreviations: CID, clinical investigation day; VAS, visual analogue scales.
Figure 1.
Study design of relevant parts of the main study and procedures in the sub-study. Abbreviations: CID, clinical investigation day; VAS, visual analogue scales.
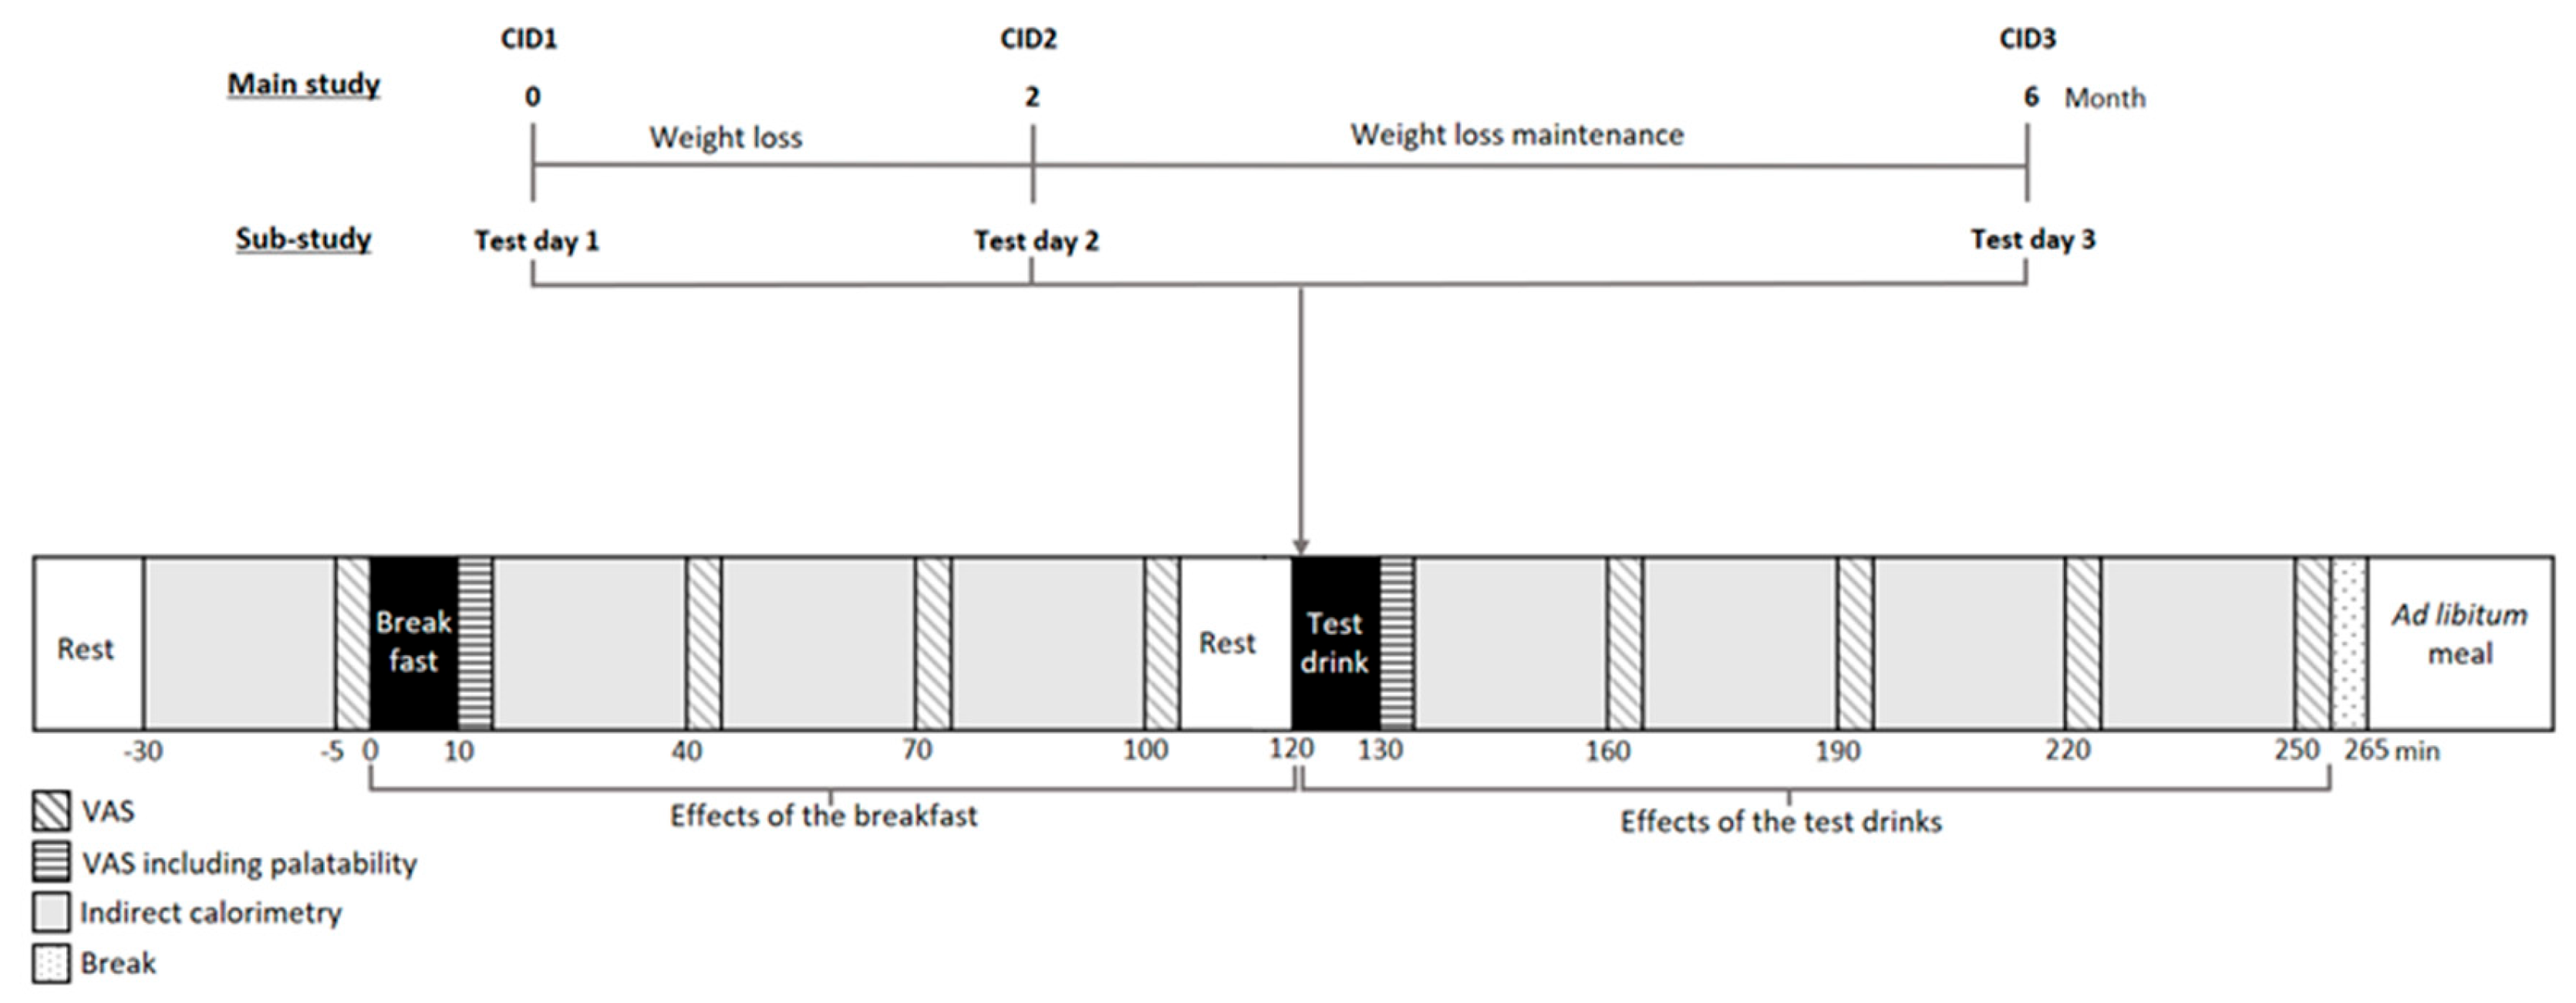
Figure 2.
Flow-chart of participants throughout the sub-study. Abbreviations: S&SEs, sweeteners and sweetness enhancers.
Figure 2.
Flow-chart of participants throughout the sub-study. Abbreviations: S&SEs, sweeteners and sweetness enhancers.
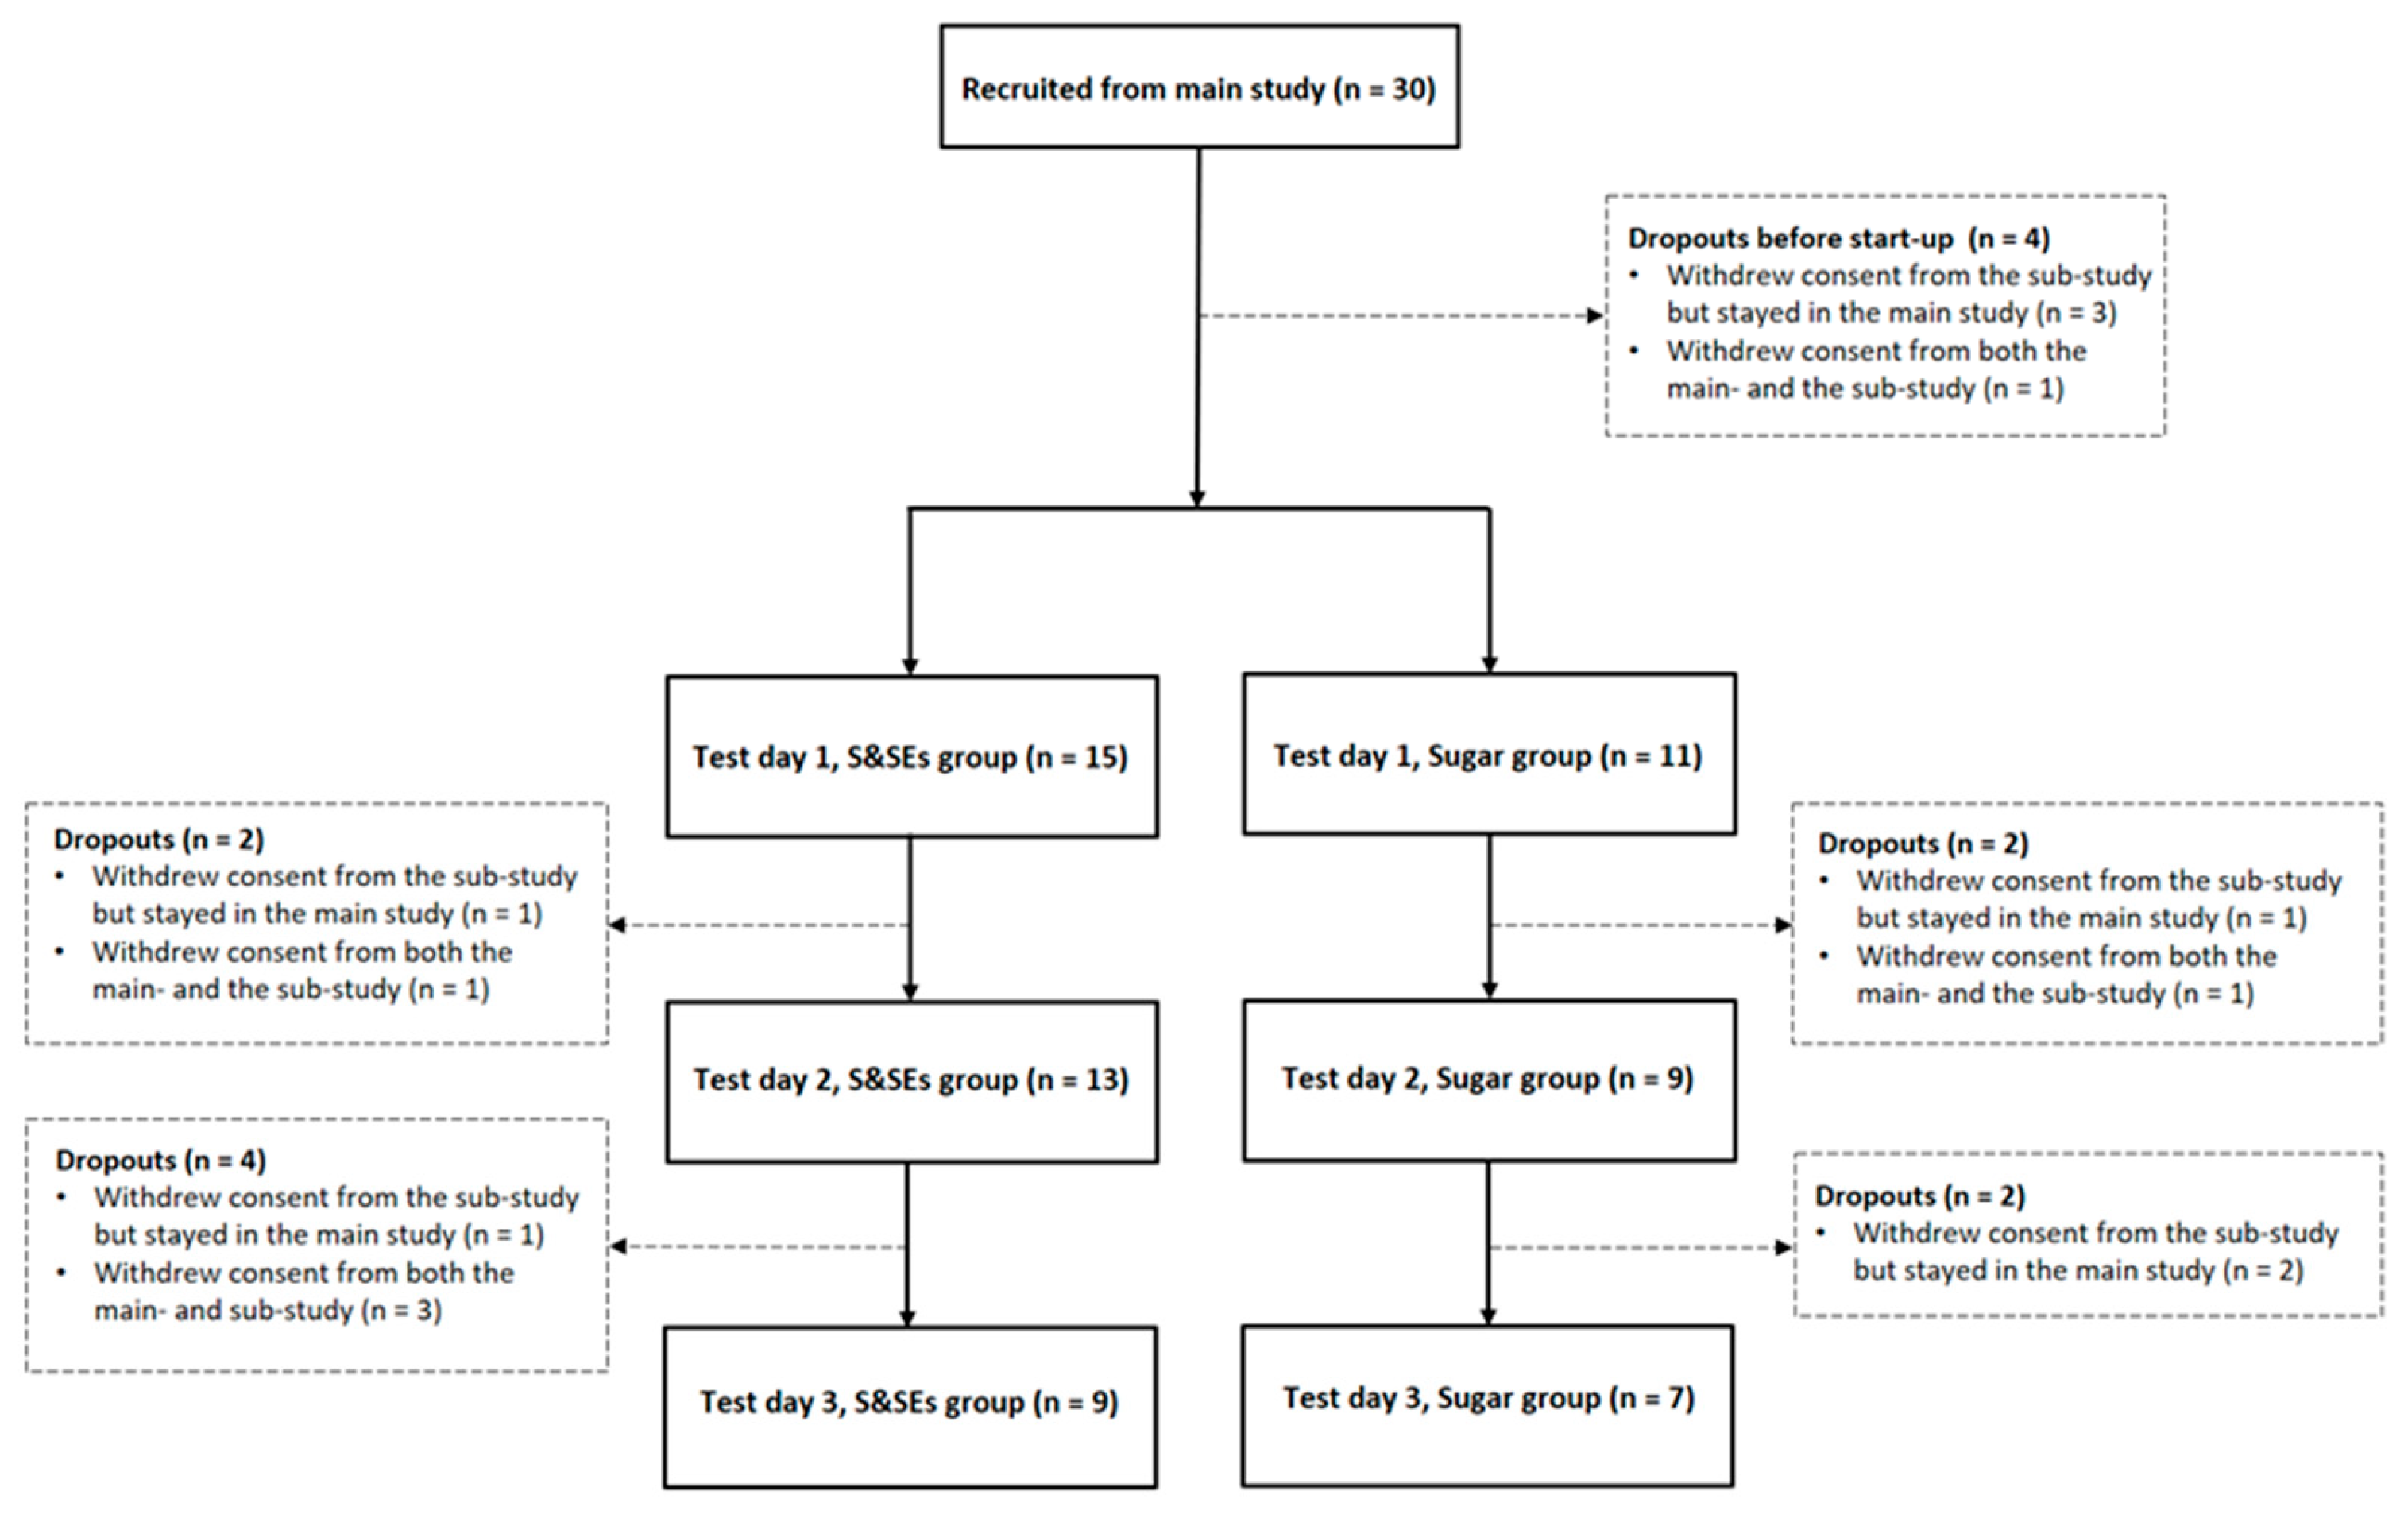
Figure 3.
Hunger as unadjusted means±SEM at different time points (left) and netAOC (right) for all 3 test days: A) Test day 1, month 0 – acute effects at baseline, B) Test day 2, month 2 – WL and C) Test day 3, month 6 – WLM. ANCOVA models were used to test for differences between groups. All models included participant number and test day as random effects, and age, sex, smoking status, BMI at baseline, and weight change from baseline as fixed covariates. Models for repeated measurements also included fasting hunger as a fixed effect. To illustrate that netAOC provides information about how much hunger is inhibited, the netAOC means have been reversed. Holm's method was used for multiple testing adjustments, and differences after adjustment are indicated with an asterisk (*, p<0.05). Rerunning analyses with taste as a covariate showed no difference at time point 130 and 160 minutes after adjusting for multiple testing (p>0.05). Abbreviations: BMI, body mass index; SEM, standard error mean; S&SEs, sweeteners and sweetness enhancers; WL, weight loss; WLM, weight loss maintenance. .
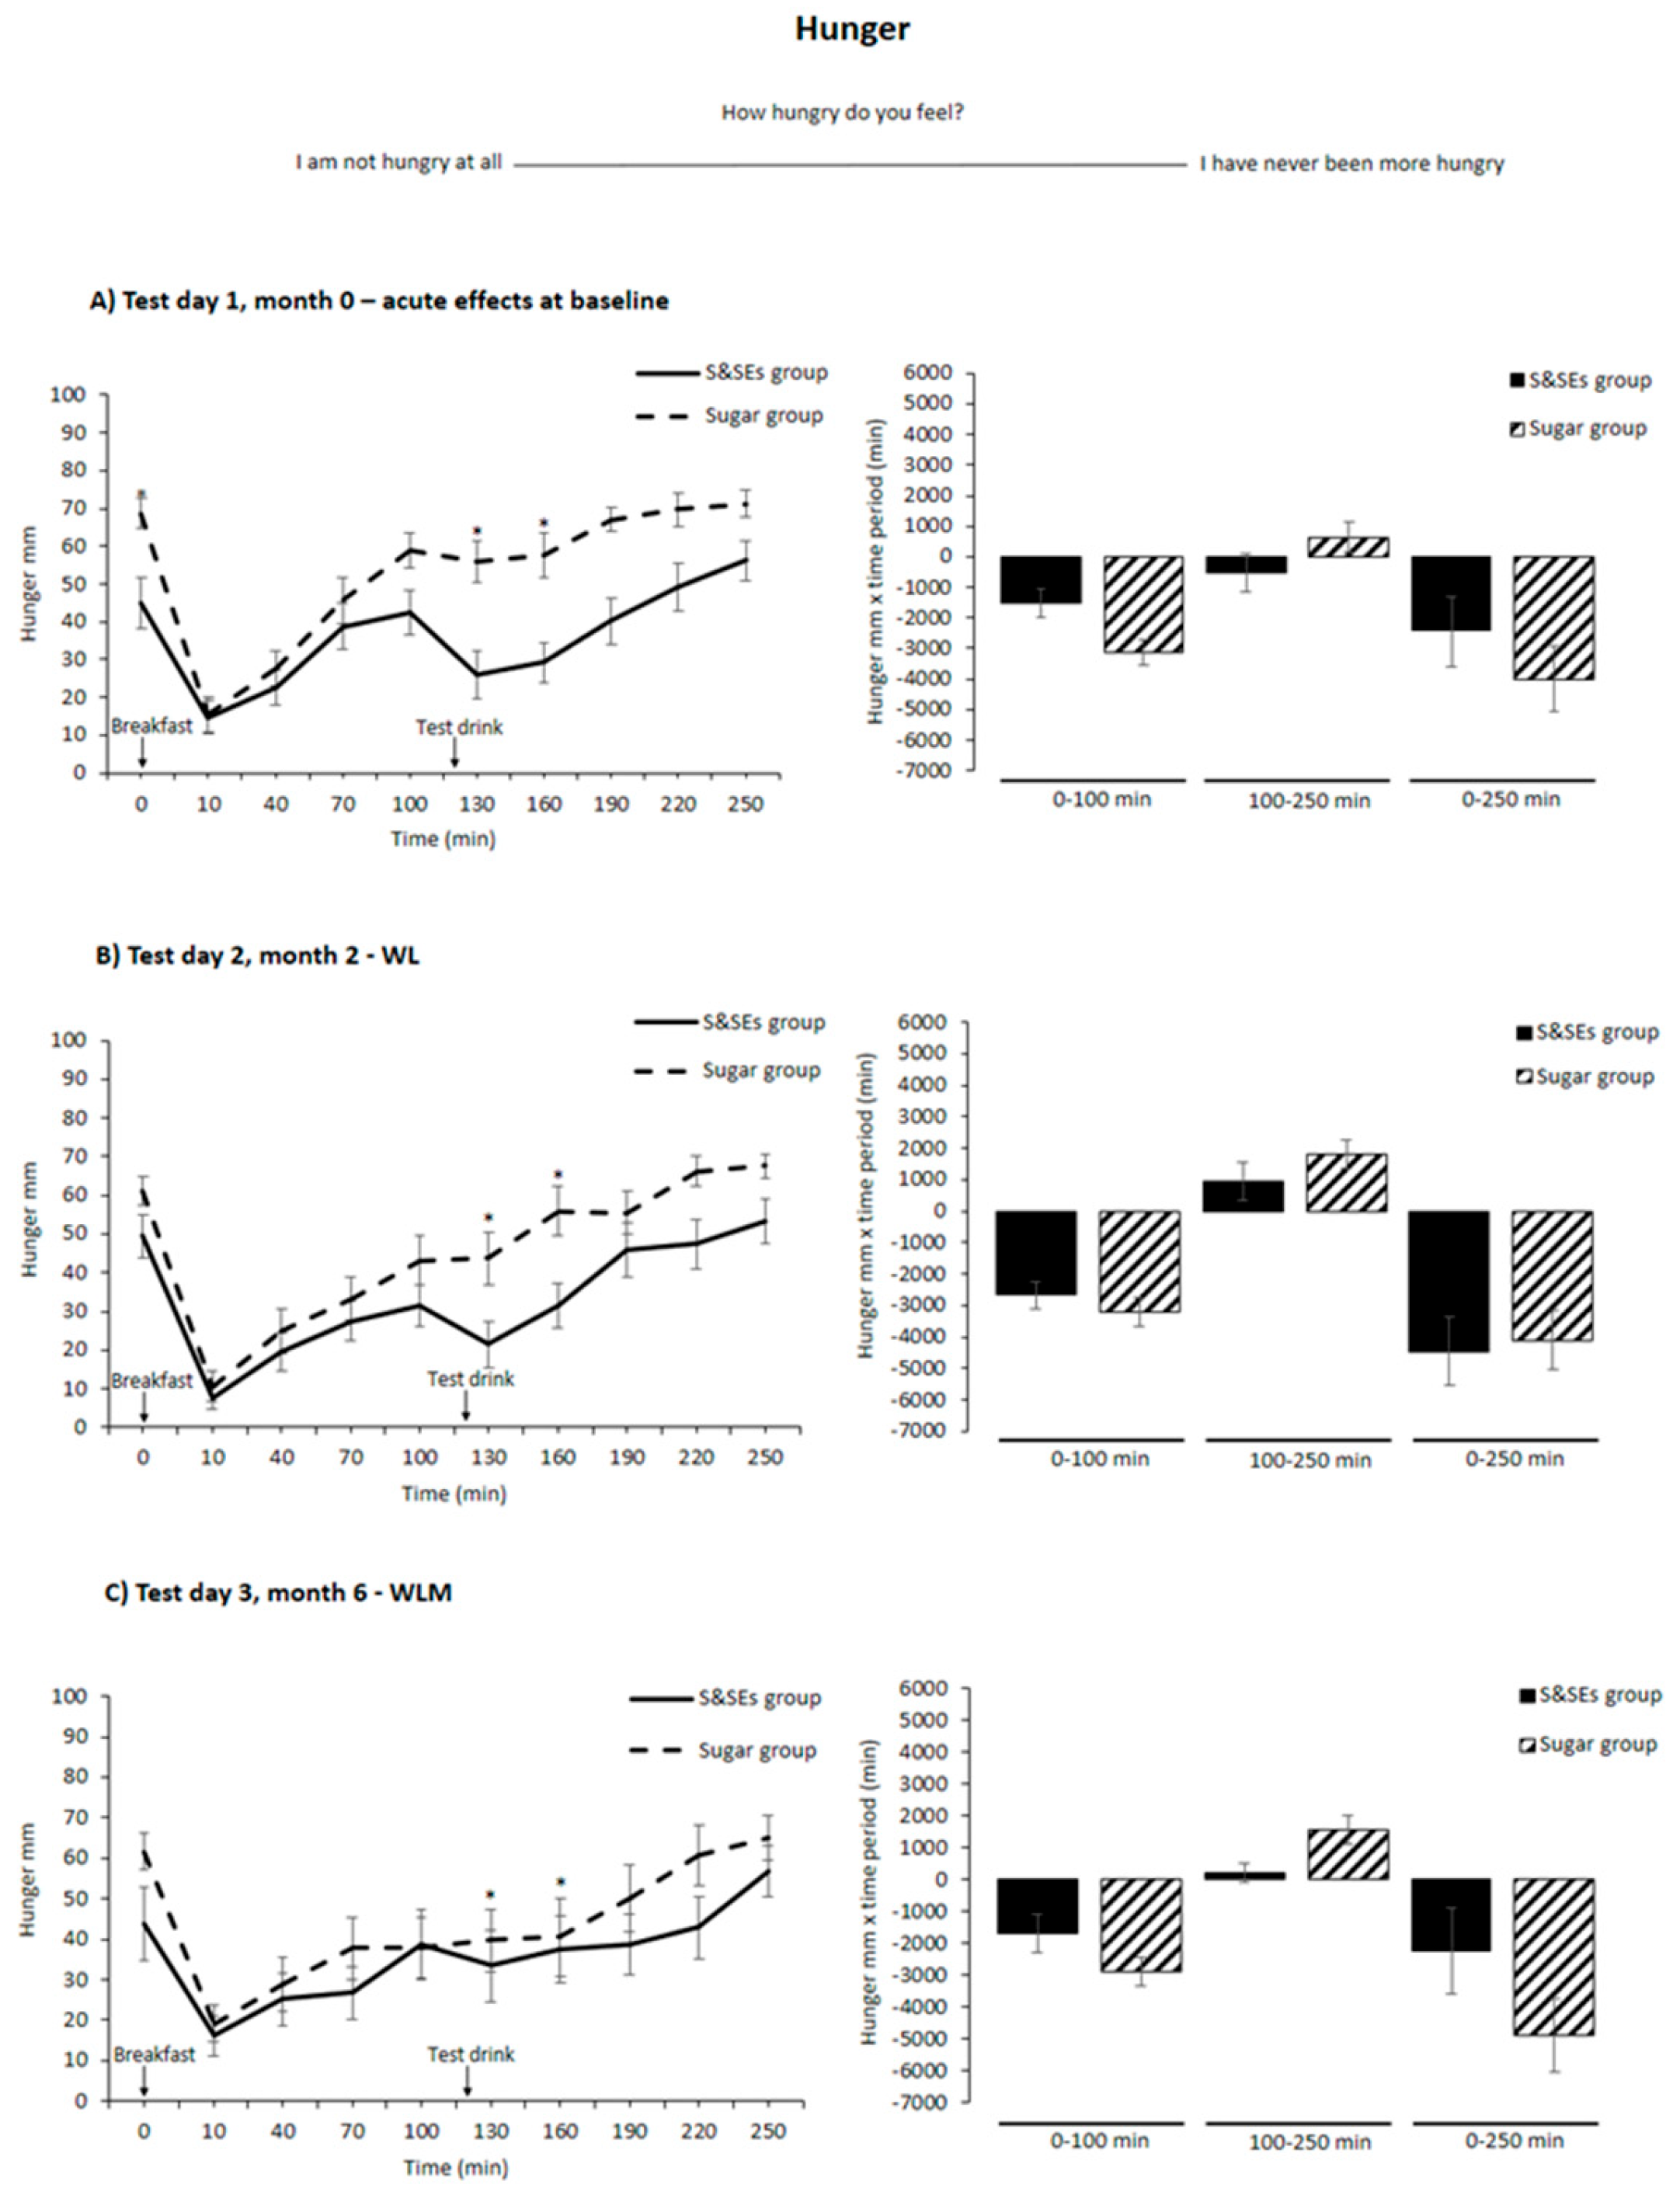
Figure 5.
Desire to eat something sweet shown as unadjusted means±SEM at different time points (left) and netAOC (right) for all 3 test days: A) Test day 1, month 0 – acute effects at baseline, Test day 2, month 2 – WL and C) Test day 3, month 6 – WLM. ANCOVA models were used to test for differences between groups, included participant number and test day as random effects, and age, sex, smoking status, BMI at baseline, and weight change from baseline as fixed effects. Models for repeated measurements also included fasting desire to eat something sweet as a fixed effect. To illustrate that netAOC provides information about how much desire to eat something sweet is inhibited, the netAOC means have been reversed. Holm's method was used for multiple testing adjustments, and differences after adjustment are indicated with an asterisk (*, p<0.05; **, p<0.01; ***, p<0.001). Rerunning analyses with taste as a covariate did not change the results but found, in addition, a reduced desire to eat something sweet across the 3 test days for the S&SEs group compared to the Sugar group at time point 100 minutes (p=0.03). Abbreviations: BMI, body mass index; SEM, standard error mean; S&SEs, sweeteners and sweetness enhancers; WL, weight loss; WLM, weight loss maintenance. .
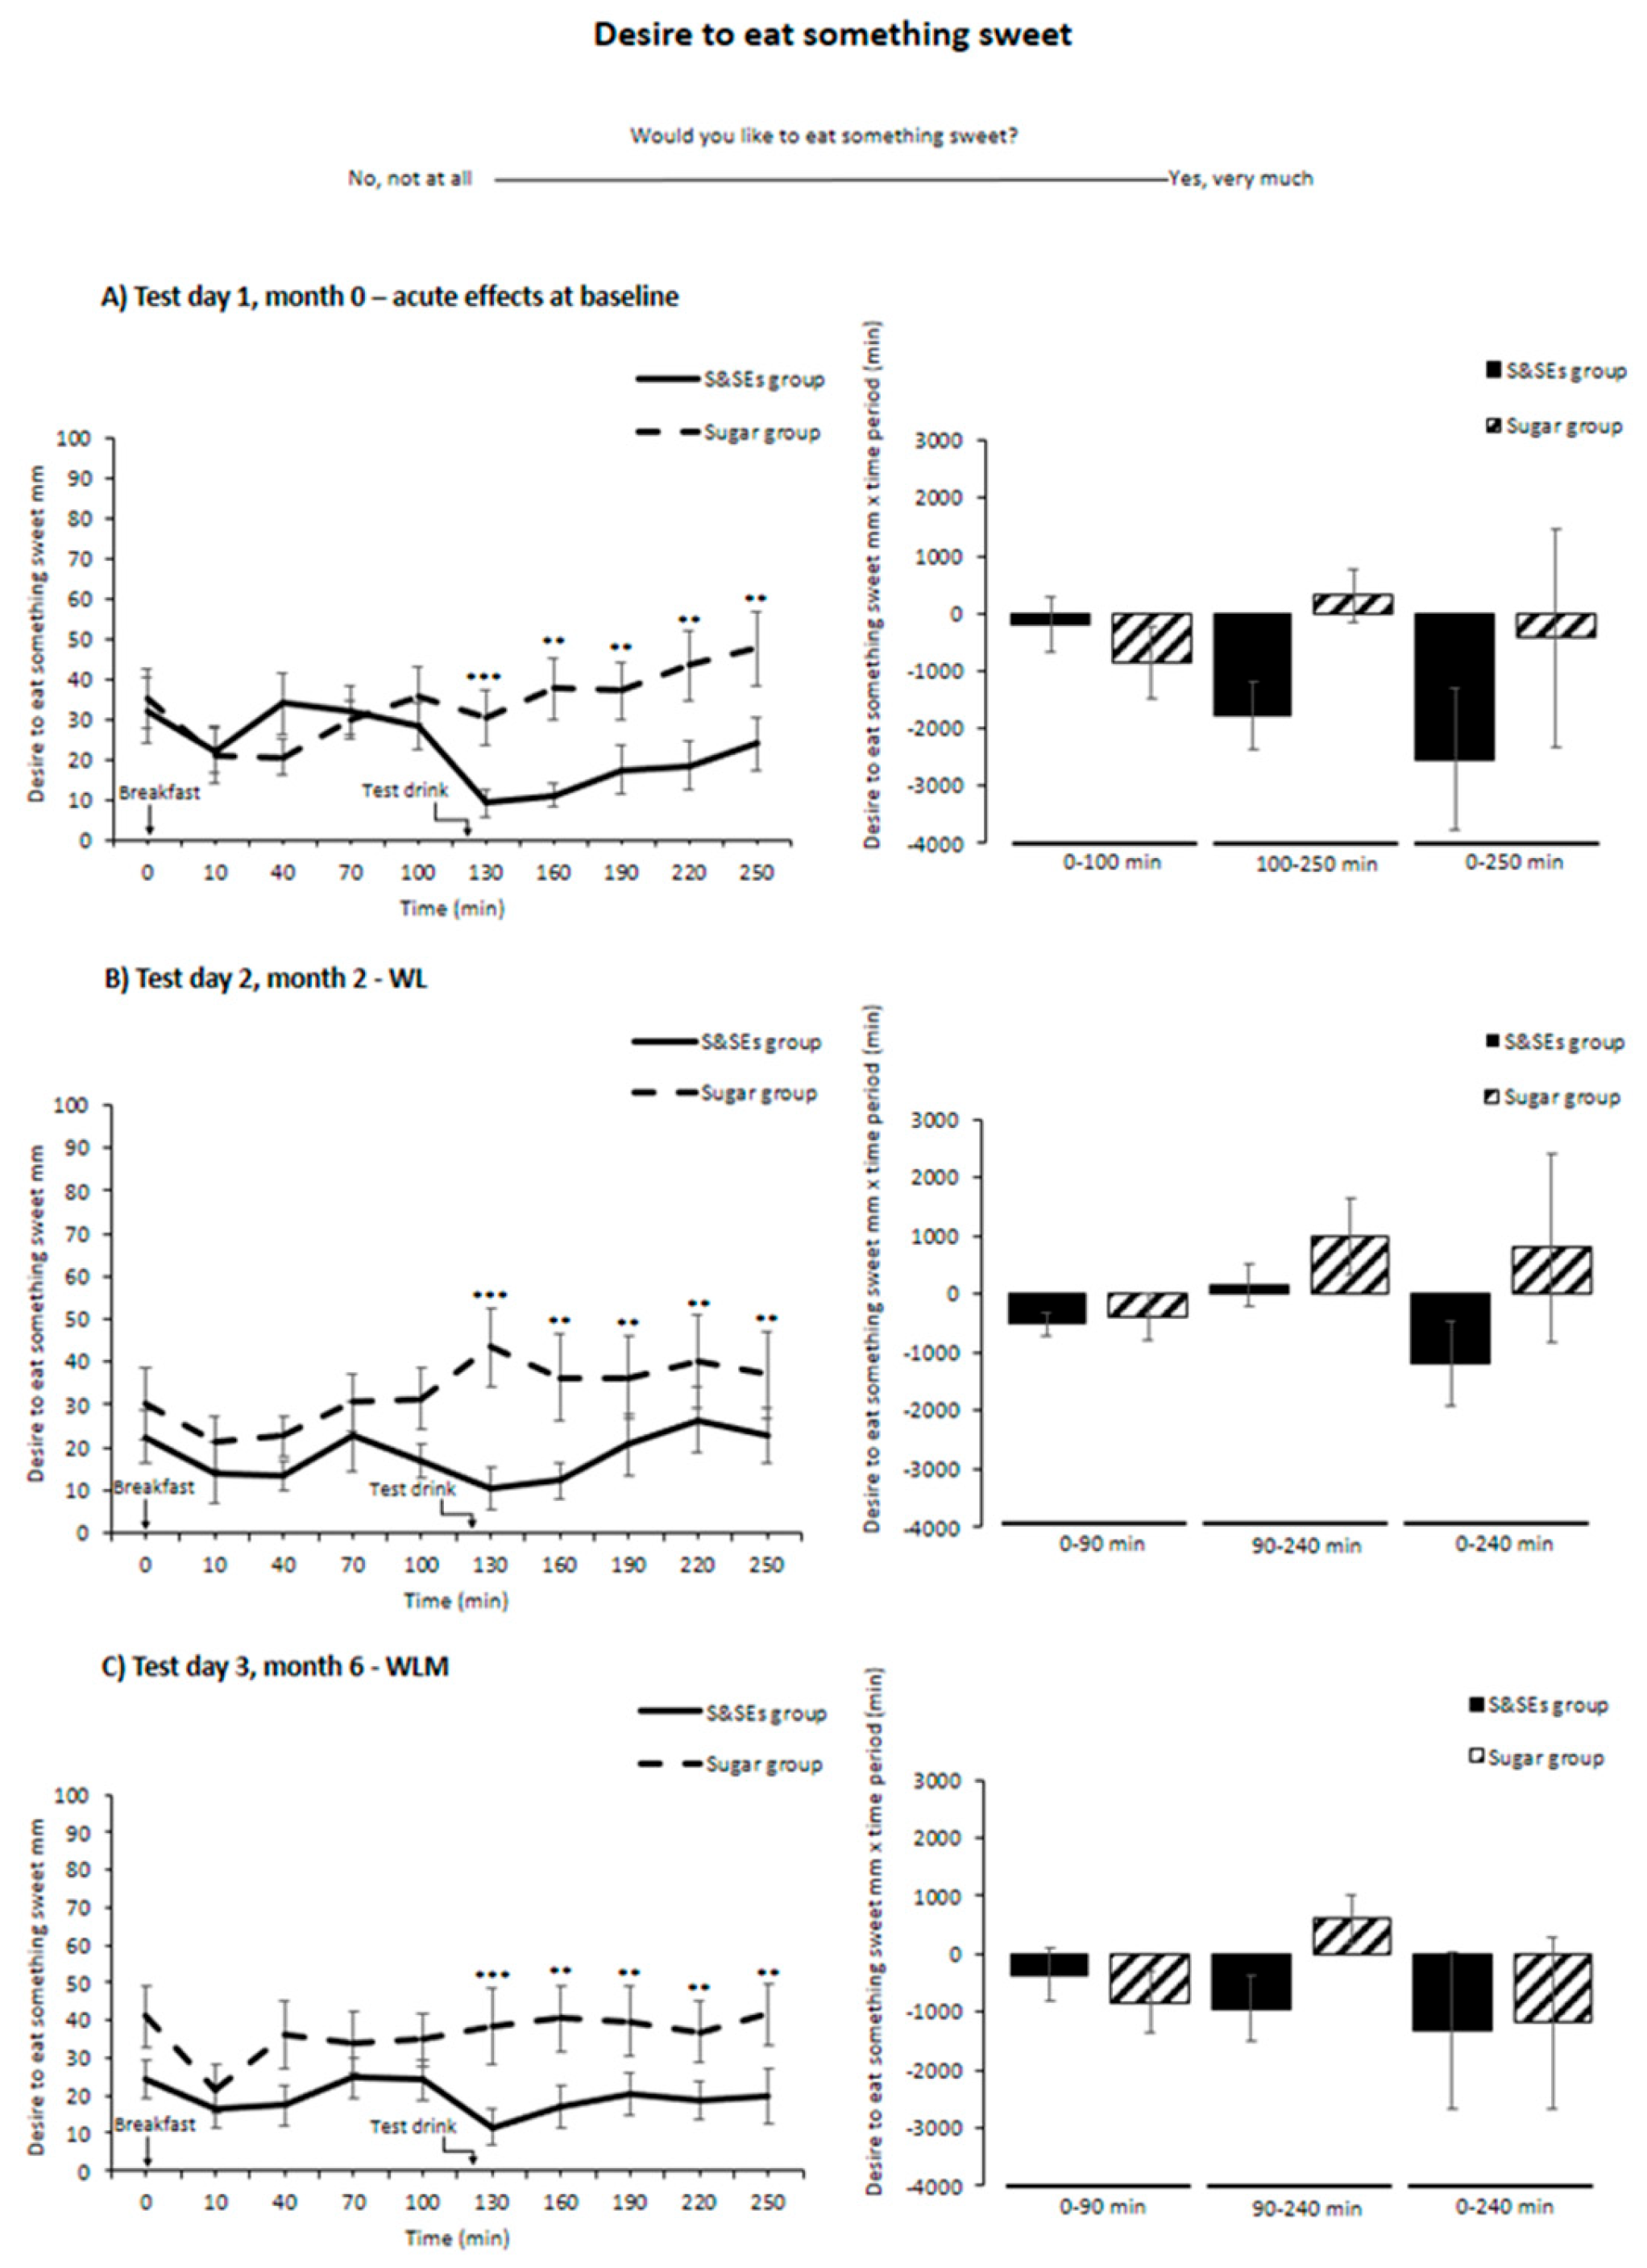
Figure 6.
Palatability measures and ad libitum energy intake shown as unadjusted means±SEM for all 3 test days: A) General appearance – test drinks, B) Taste – test drinks, C) Ad libitum energy intake – pizza meal. For the ad libitum test meal data from 1 participant was excluded on test day 2, due to an error in the kitchen laboratory. ANCOVA models were used to test for differences between groups, all included participant number as random effect, and age, sex and smoking status as fixed effects. Additionally, the model for ad libitum energy intake included body mass index at baseline and weight change from baseline as fixed effects. Holm's method was used for multiple testing adjustments and differences after adjustment are indicated with an asterisk (*, p<0.05, **, p<0.01). Abbreviations: SEM, standard error mean; S&SEs, sweeteners and sweetness enhancers; WL, weight loss; WLM, weight loss maintenance. .
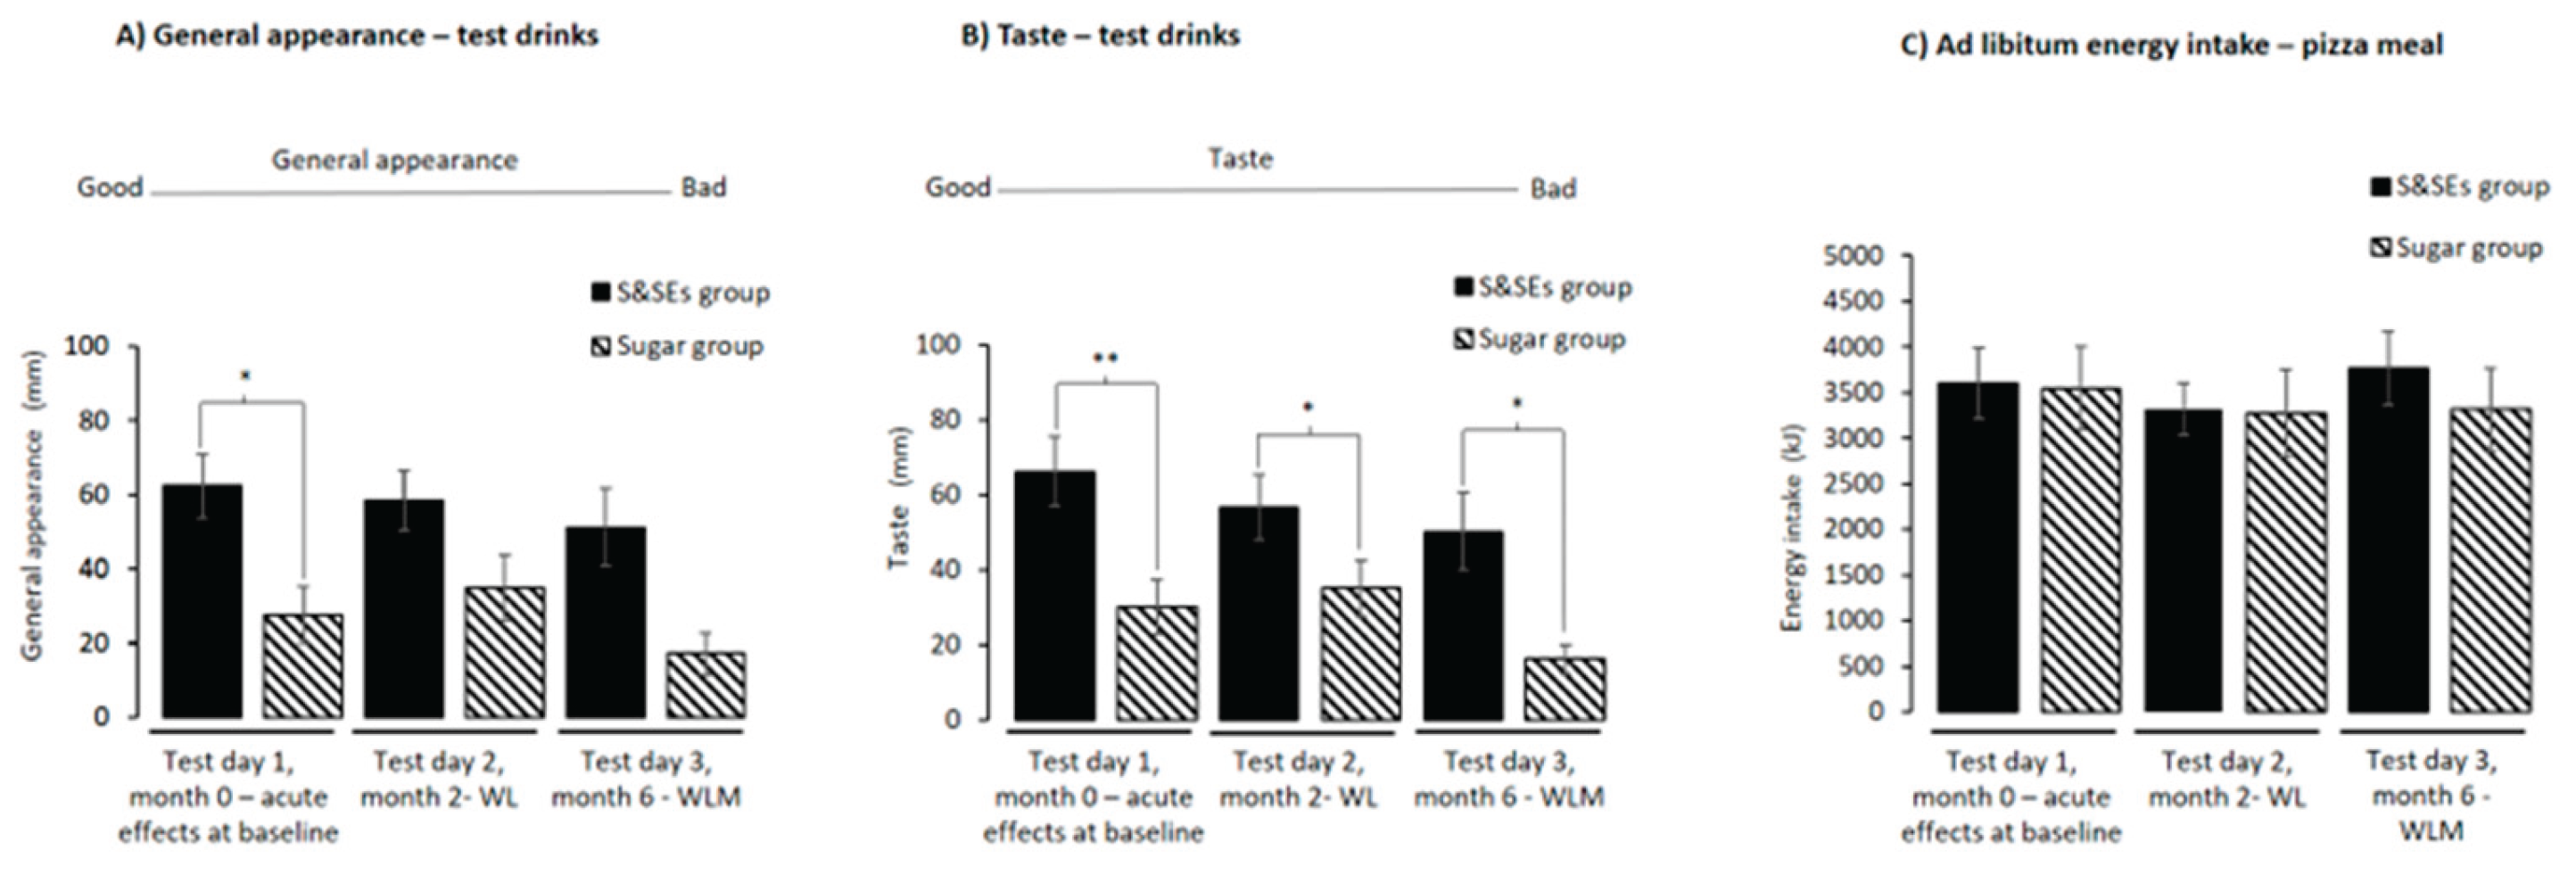

Table 1.
Nutritional composition of the standardized breakfast and test drinks.
| Standardized breakfast | Test drinks | Ad libitum meal | |||
| Served to | All participants | S&SEs group |
Sugar group | All participants Males Females |
|
| Product | Arla Cultura® with oat and cranberries1 | Atwell®0-calories® with Ace-K/Cyc | - | Ristorante Pizza Mozzarella | Ristorante Pizza Mozzarella |
| Amount (g) | 340 | 5 | 1110 | 740 | |
| Energy (kJ) | 1476 | 10,665 | 7,110 | ||
|
Fat (g) - Saturated fat (g) |
8.8 3.7 |
0 0 |
117.0 54.0 |
78.0 36.0 |
|
|
Carbohydrates (g) - Sugar (g) |
40.8 24.8 |
0 0 |
246.0 22.8 |
164.0 15.2 |
|
| Fiber (g) | 13.6 | 0 | 13.8 | 9.2 | |
| Protein (g) | 18.0 | 0 | 117.0 | 78.0 | |
| Salt (g) | 0.34 | 0 | 10.8 | 7.2 | |
| Water (g) | 250 | 400 | 405 | 250 | 250 |
1Nutritional content of products (Arla Cultura® with oat and cranberries, Ristorante Pizza Mozzarella, and Atwell®) as written on the packaging.
Table 2.
Baseline characteristics at month 0 (test day 1).
| S&SEs group (n = 15) |
Sugar group (n = 11) |
Total (n = 26) |
P-value | ||
|---|---|---|---|---|---|
|
Sex Female (n (%)) Male (n (%)) |
11 (73) 4 (27) |
8 (73) 3 (27) |
19 (73) 7 (27) |
0.97 |
|
| Age (y) | 48 ± 11 | 52 ± 8 | 49 ± 10 | 0.27 | |
| Height (cm) | 172.3 ± 7.3 | 167.4 ± 8.0 | 170.2 ± 7.9 | 0.12 | |
| Weight (kg) | 97.6 ± 14.1 | 89.7 ± 11.4 | 94.2 ± 13.4 | 0.13 | |
| BMI (kg/m2) | 33.0 ± 5.0 | 32.0 ± 3.4 | 32.6 ± 4.3 | 0.56 | |
|
Smoking status Non-smoker (n (%)) Occasional smoker (n (%)) Daily smoker (n (%)) |
12 (80) 1 (7) 2 (13) |
9 (82) 1 (9) 1 (9) |
21 (81) 2 (8) 3 (11) |
0.93 |
Age, height, and smoking status measured at screening in the main study. Fasting body weight measured on test day 1 in the sub-study. Numerical data shown as means±SD. T-tests were used to test for differences between intervention groups for all numerical outcomes, while categorical data were tested via logistic regression. No differences in baseline characteristics were found (all p>0.05). Abbreviations: BMI, body mass index; SD, standard deviation; S&SEs, sweeteners and sweetness enhancers; y, year.
Disclaimer/Publisher’s Note: The statements, opinions and data contained in all publications are solely those of the individual author(s) and contributor(s) and not of MDPI and/or the editor(s). MDPI and/or the editor(s) disclaim responsibility for any injury to people or property resulting from any ideas, methods, instructions or products referred to in the content. |
© 2026 by the authors. Licensee MDPI, Basel, Switzerland. This article is an open access article distributed under the terms and conditions of the Creative Commons Attribution (CC BY) license (http://creativecommons.org/licenses/by/4.0/).
Copyright: This open access article is published under a Creative Commons CC BY 4.0 license, which permit the free download, distribution, and reuse, provided that the author and preprint are cited in any reuse.


