
Submitted:
29 October 2025
Posted:
29 October 2025
You are already at the latest version
Abstract
(1) This study investigates the global health issue of excessive sugar intake by examining how sweet-liker status (SLS) relates to acceptability of sugar-sweetened beverages (SSB), alongside other demographic factors. (2) Two sample sets were tested by 142 consumers: sucrose solutions and carbonated beverages. Each consumer was categorised into a SLS cluster using a recently standardised method. (3) Significant differences across SLS clusters were observed for age, sweetness perception, ethnicity, chronic disease status, and weekly full-sugar soft drink consumption. All SLS clusters found the 6% sucrose solution enjoyable. For the carbonated beverages’ acceptability, “high-sweet likers” responded similarly to children, high soft-drink consumers, and First Nations People, while the opposite was true for “low-sweet likers”. Most consumers enjoyed the 50% reduced-sugar beverage (5.9% sugar) and the full-sugar soft drink (11.5% sugar) equally. Acceptability declined notably below 5.9% sugar beverage sample. (4) This suggests policies around SSB reformulation could be more ambitious than they currently are. These findings also support the future use of SLS by health professionals to inform personalised nutrition care. This research highlights how the field of sensory science can inform strategies to lower sugar content in beverages without compromising consumer acceptability.
Keywords:
sweet-liker status
; soft drink
; health policy
; sugar-sweetened beverages
; hedonic
; public health nutrition
1. Introduction
Sweetness is widely recognised as a crucial element of flavour perception and the way food tastes. Taste is undeniably the primary driver of food choice and acts as the “gatekeeper” of food intake [1]. This is supported by consumer surveys that report food choices are made primarily based on flavour, with healthfulness or cost considerations typically ranking lower [2]. Hence, variations in taste perception among individuals may influence dietary behaviours, nutritional status, body composition, and ultimately, the risk of chronic diseases [3]. Since Pangborn’s pioneering work in 1970, individuals’ acceptability for sweet foods, also known as “sweet-liker status” (SLS) has been studied extensively [4]. Sensory scientists in laboratory settings have commonly identified four different sweet-liker phenotypes, visually outlined in the paper by Iatridi et al. (2019) and recently coined high sweet-likers (HSL), medium sweet-likers (MSL), low sweet-likers (LSL), and unclassified (UN) by Kavaliauskaite et al. (2023). These different phenotypes have come to reject the long-standing notion of universality of sweet liking and the belief that everyone enjoys sweetness [5,6].
Various phenotyping methods have been used over the years to determine SLS [6,7,8,9]. This means extreme caution must be taken when comparing SLS groups across different studies, and highlights the potential usefulness of a standardised procedure, which Kavaliauskaite et al. (2023) recently proposed. Moving forward, broad adoption by researchers of this new standardised method using correlation matrices would support data comparison across different studies, streamline the SLS clustering process, and potentially allow for SLS to be utilised more robustly as a tool for public health or other applications.
SLS phenotypes are shown to have relationships with dietary intake, as outlined in a 2019 systematic review [9]. Sweet-likers are found to have a higher daily intake of total and refined sugars, consume more energy from sugar-sweetened beverages (SSB) and less fibre [10,11,12]. However, not all studies support this relationship, as some have concluded dietary habits and intake do not differ between different SLS groups [13,14]. Therefore, it is clear there is controversy around whether dietary associations with SLS exist. There have also been numerous investigations seeking to clarify the link between perceived sweetness intensity and dietary intake, and there is divergence on the nature of this relationship. Evidence shows that while 60% of studies reported relationships between SLS and dietary intake, only 20% found a significant association between perceived sweetness intensity and dietary intake, viz. as perception of sweetness increases, energy and carbohydrate intake decreases [9]. While there may be scientific explanations for these results, certainty is not possible, as marked methodological differences are contributing to the inconsistencies observed across research outcomes [15].
Unsurprisingly, there is also controversy around associations between SLS and health outcomes. Some investigations show no differences in BMI between sweet-likers and sweet-dislikers [11,12,14,16,17,18]. On the contrary, the findings of a 2024 review found a higher BMI is associated with an increased liking for sweet tastes [19]. There is little research into other health conditions, with only a handful of studies exploring the link between sweet preferences and Type 2 Diabetes Mellitus (T2DM) [20,21], highlighting the relationship between SLS and health outcomes largely remains unknown.
Our recent study found age and ethnicity to be significantly different between beverage acceptability clusters [22], which raises the question of whether this may be due to underlying differences in SLS phenotype. Although some research has previously explored links between SLS and ethnicity, the findings in this area remain conflicting, as is common in much of the literature on this topic [10,11]. Furthermore, research has yet to investigate potential similarities between Indigenous Aboriginal and Torres Strait Islander populations and the broader Australian population, which is why this study intentionally includes representation from both groups. Additionally, some studies suggest that sweetness acceptability may evolve and change across the lifespan [11,23,24,25]. This makes it particularly important for this dataset to encompass both adult and child populations.
Despite the volume of research on SLS, the concept of SLS has not been lifted out of the world of research and used in relation to healthy choices. This not only creates a large gap between research and practice, but it is also counterintuitive to the global pursuit of improved health, as it is well-known excessive sugar intake is recognised as a public health challenge worldwide for adults and children alike [26,27]. There is growing awareness about the health risks of free sugars, particularly in the form of SSBs (World Health Organisation, 2015), and the impact of excessive SSB intake on the development of chronic diseases such as T2DM and obesity is well-documented [28,29,30]. SLS could be a useful tool to help understand choice in SSB consumption. Therefore, using a beverage model, this study aims to explore SLS and how it relates to acceptability of SSBs, as well as other factors such as health status, sweetness perception, age, and ethnicity. By gathering this data related to SLS, the results of this study can offer insights for public health initiatives and perhaps guide the development of strategies aimed at reducing excessive sugar consumption.
2. Materials and Methods
This study is part of an over-arching project aiming to develop a novel ‘Bush Food-based’ carbonated beverage to support First Nations business development and to potentially address public health concerns related to sugar intake among First Nations populations in Australia. A consumer sensory trial was conducted to explore acceptability of the prototype beverage. The full methodological details for this consumer sensory trial are as described by Cartwright et al. (2025) [22] and provided in short below.
2.1. Participants
A convenience sample of 142 adult and child participants were recruited from November 2022 to April 2023 via verbal and email advertisement. Consumer recruitment primarily occurred by opportunistically incorporating the sensory trial into relevant pre-planned events at the university and around Brisbane. Eligibility criteria for the study included: i) ability to provide written informed consent; ii) no allergies to the trial products; iii) age over 4, and iv) able to speak and understand English. Participants were allowed to be from the same family and were treated as independent measures. For participants aged under 18 years, both the child and their parent/guardian had to provide consent. Most participants were residents of the Brisbane metropolitan area. All participants received a small gift as a token of appreciation for taking part in this sensory trial.
Ethical approval for the involvement of human subjects in this study was granted by The UQ Human Research Ethics Committee, Reference number 2022/HE001341, dtd 10/24/2022.
2.2. Samples
2.2.1. Sweet-Liker Status Solutions
The sugar (sucrose) concentrations for SLS testing were prepared according to the literature [7]: five solutions ranging in sugar content (3%, 6%, 12%, 24%, and 36% sugar) and one water solution as a control (0% sugar).
2.2.2. Carbonated Beverage Samples
Five fruity-flavoured carbonated beverages were sampled (albeit different flavour profiles in terms of aroma), the full composition of which is detailed in Cartwright et al. (2025). The sample with 11.5% sugar is representative of a “regular sugar” Australian commercialised soft drink (Bundaberg Guava Sparkling Drink, Woolworths). The sample with 0% sugar is an Australian commercialised “no sugar” carbonated beverage (Mt Franklin Lightly Sparkling Water Mango, Woolworths), intentionally chosen due to its absence of non-nutritive sweeteners. The three low sugar prototype beverage samples are as follows: a 5.9% sugar beverage which is 50% less sugar than a regular soft drink, a 2.9% sugar beverage which is 25% of the sugar content of a regular soft drink, and 1.5% sugar beverage sample which is one-eighth of the sugar content of a regular soft drink. These low sugar beverage samples incorporate Australian Bush Food ingredients, namely the Kakadu plum (Puree, Traditional Homeland Enterprises) and Davidson plum (Freeze-dried powder, Rainforest Heart), soda water (Woolworths Soda water, home brand), and sugar (CSR White sugar, Woolworths). It should be noted that the use of non-nutritive sweeteners was deliberately excluded, as their inclusion would introduce a separate and complex topic that cannot be adequately addressed within the scope of this study.
2.3. Sample Preparation and Testing Environment
Eight tasting sessions were conducted over eight days across a five-month period at two Brisbane locations: an office-like environment and purpose-built sensory booths, both controlled at 22°C with daylight-equivalent lighting. Samples, prepared fresh each morning to preserve carbonation, were served cold (4°C) in 30 mL paper cups with 3-digit blinding codes, alongside a spittoon and filtered water. A 10-second break between samples allowed participants to rinse their mouths to refresh their palate.
2.4. Data Collection
All data for this double-blinded hedonic sensory trial was collected via iPad using RedJade sensory software hosted through The University of Queensland (RedJade®, Redwood Shores, CA, USA) and functioned as a complete block randomised presentation design. Adults and older children completed the test independently, while younger children were assisted by a parent or researcher as needed. The questionnaire was presented in four parts: demographic information [31], habitual beverage intake [32], carbonated beverage acceptability testing [33,34], and SLS testing. Collecting the participants’ age, weekly soft drink consumption, gender, and ethnicity allowed the authors to characterise participants accordingly. SLS testing involved measuring sweet taste intensity and liking of the six SLS solutions, following a similar methodological approach to that described by Kavaliauskaite et al. (2023).
Data for sweet taste liking was collected using the 11-point labelled affective magnitude (LAM) scale [33,34], while data for sweetness intensity was collected using an 11-point generalised labelled magnitude scale (gLMS) [35]. The sample size and testing protocols were developed according to the ASTM Standard Guide for Preferred Methods for Acceptance of Products [36] and the ISO standard on General Guidance for Conducting Hedonic Tests with Consumers in a Controlled Area [37].
2.5. Data Analysis
The data was exported from RedJade into an excel spreadsheet, then imported into XLSTAT (version 2018.6.54124, Addinsoft SARL, Paris, France) where all statistical analyses were performed. Data was screened for implausible results, and spurious inputs that were unanimously deemed by the research team to be incorrectly entered were managed by replacement with the mean of the population within the same demographic.
Correlation matrices with a correlation factor of >0.6 were used to identify SLS groups, following the standardised method recently proposed by Kavaliauskaite et al. (2023). This involved assessing each consumer's adherence to predetermined, validated scores for what constitutes a HSL, MSL, and LSL. Consumers were grouped into the cluster they had a >0.6 correlation with. If the consumer had no correlation value above 0.6, it was categorised in the UN group. If the consumer had a >0.6 correlation with more than one SLS cluster, they were grouped into the cluster they were more closely aligned with. For the SLS solutions, participant acceptability and perceived sweetness intensity scores for each sucrose concentration were compared between SLS clusters, using one-way ANOVA with p<0.05 and Fisher (LSD) post-hoc analysis with a 95% Confidence Interval (CI) to identify significant differences. For the acceptability of beverage samples with varying sugar content, participants were split according to different characteristics, with one-way ANOVA (p<0.05) and Tukey (HSD) tests (95% CI) used to determine any statistically significant differences.
Descriptive statistics were then used to identify demographic trends within each SLS cluster, with one-way ANOVA (p<0.1) and Fisher (LSD) post-hoc tests (CI 90%) used to identify significant differences. The median and mean for each variable were calculated, and the mean was used to report. Factors such as gender, First Nations status, and chronic disease status were all binary data, allowing these categorical variables to be treated as nominal (i.e. non-First Nations = 0, First Nations = 1, no chronic disease = 0, chronic disease = 1, female = 0, male = 1). This enabled these variables to be analysed using non-parametric tests with the rest of the dataset. It also allowed assessment of relationships with numerical data without making assumptions about the distribution of these variables. This analysis procedure was completed with and without the child cohort to evaluate whether the children’s responses heavily impacted the interpretation of the data.
Finally, principal component analysis (PCA) was carried out to summarise and visually represent relationships between demographic variables and SLS clusters.
3. Results
3.1. Consumer Demographics
In total, 142 complete participant datasets were obtained for analysis. A diverse representation was observed across age groups, ethnicities, genders, and chronic disease statuses among the study participants, as shown in Table 1.
3.2. Acceptance and Perceived Sweetness Intensity of Sweet-Liker Status Clusters
Correlation matrices revealed four groups among the 142 participants related to SLS. According to each groups acceptability score across the sucrose solutions (see Figure 1A), these groups were classified as high sweet-liker (HSL), medium sweet-liker (MSL), low sweet-liker (LSL) and unclassified (UN) [7]. Interestingly, as shown in Figure 1A and supported by Appendix A, water has the same acceptability as the 3% sugar solution in all SLS groups aside from the MSL. The HSL and LSL have significantly different acceptability scores for all sucrose samples aside from the 6% solution – which the two opposing groups both enjoyed equally, appearing to be this crossover point in acceptance. The UN group has the least variation in acceptability between samples, consistently rating around the “neither like nor dislike” region of the LAM scale.
Figure 1B depicts the LSL group to have highest perceived sweetness intensity from the 3% sugar concentration upwards, while the HSL group has the lowest perception of sweetness at 0% and one of the highest perceptions of sweetness at 36% sugar. Meanwhile, the intensity of each sucrose solution is always significantly lower for the HSL group compared to the LSL group, aside from the 12% sugar concentration where there is no significant difference (see Appendix B). Therefore, although HSL and LSL both perceive the sweetness of this 12% sugar solution the same (Figure 1B), the HSLs enjoy it, and the LSLs do not (Figure 1A). Similarly to acceptability, it is the UN group that demonstrates the least variation in sweetness perception among samples, having the highest sweetness perception of the 0% sugar solution and the lowest sweetness perception of the 36% sugar solution.
Figure 1 clearly shows that sweetness acceptability trends for SLS groups are vastly different to sweetness intensity trends. As shown in Figure 1B, all SLS groups agree that as the sugar concentration increases the perceived sweetness intensity increases. All SLS groups rate the 0% sugar solution between “extremely weak” and “moderately weak”, and all rate the 36% sugar solution between “extremely strong” to “moderately strong”. Conversely, as shown in Figure 1A, this pattern is not followed for sugar solution acceptability scores. That is, as the sugar concentration increases, this is not coupled with an increase in acceptability for all SLS groups. Instead, very different patterns emerge for each SLS group. Appendix A and Appendix B show that the difference between the SLS groups for both acceptability and intensity become more significant as the sugar concentration rises, with the only exception to this trend being the acceptability at 6% sugar. Appendix A and Appendix B also outline specific differences that exist between each SLS group at each sugar concentration.
3.3. Sweet-Liker Status Clusters’ Sensory Acceptability of Carbonated Beverages Compared to Other Demographic Groups
It is important to briefly outline the distinct differences in overall consumer acceptability of the five carbonated beverage samples which has been reported previously [22]. As shown by Cartwright et al. (2025), three samples received mean scores that were around the “neither like nor dislike” region of the scale (0%, 1.5%, and 2.9% sugar beverages). The beverage with 5.9% sugar received a mean score in the “like slightly” to “like moderately” range [22]. However, it was the full sugar beverage sample (11.5% sugar) that was the most favoured by consumers with a significantly higher mean score compared to the other samples, rated in the “like moderately” to “like very much” range on the LAM scale [22]. Figure 2 illustrates the consumer acceptability of the five beverage samples split according to SLS, as well as age, ethnicity, and soft drink consumption. Despite the use of nationally-accepted cut-off values for categorising the continuous data (i.e. age and soft drink consumption), these results should be interpreted with caution. When analysed for gender (not pictured), similar trends in overall acceptability of the carbonated beverages were observed with no significant differences between males and females, thereby demonstrating balanced acceptability across genders.
The aforementioned pattern of overall consumer acceptability for the five beverages generally remained consistent even when the population was split in these different ways. Another notable trend across all demographic groups is that the groups that had the highest acceptability of the full sugar soft drink (11.5% sugar); the HSLs, high soft drink consumers, children, and First Nations People, always had a significant decrease in acceptability for the 50% reduced sugar soft drink (5.9% sugar). Dissimilarly, the group that had the lower acceptability of the full sugar soft drink; the MSLs, LSLs, low soft drink consumers, adults, and non-First Nations People, enjoyed the 50% reduced sugar soft drink equally to the full sugar soft drink (i.e. no significant difference). Furthermore, for all demographic splits, the group that has the higher acceptability for the full sugar soft drink (11.5% sugar) had the lowest acceptability for the low/no sugar beverage varieties (5.9%, 2.9%, 1.5% and 0% sugar) compared to their counterpart(s), albeit not always statistically significant. That is, participants who were <18 years old, First Nations ethnicity, HSLs, and high soft drink consumers had the highest acceptability for the full sugar soft drink and the lowest acceptability for the low/no sugar soft drinks. Contrarily, consumers who were adults, non-First Nations, LSLs, and low soft drink consumers had a lower acceptability for the full sugar soft drink and a higher acceptability for the low/no sugar soft drinks compared to their counterpart(s).
Figure 2A included three out of the four SLS groups – the UN group (n = 24) was excluded as it did not offer any additional relevant information. Figure 2A shows MSL and LSL groups (i.e. 70% of total consumers) did not differ significantly in acceptance for the 11.5% and 5.9% sugar beverage – all falling within the “like moderately” to “like extremely” range. The HSL and MSL were not significantly different in acceptability scores for the 0%, 1.5% and 2.9% sugar beverage – all falling within the “dislike moderately” to “neither like nor dislike” region of the LAM scale. The mean acceptability scores of the MSL group were always situated between the HSL and LSLs scores.
Figure 2B shows the participants split into high versus low soft drink consumers using the Australian Cancer Council classification of ≥ 1L per week to be considered high consumption [38]. While the plot visually indicates some trends, with the consumers with higher soft drink consumption generally giving higher acceptability scores for sweeter samples and the consumers with low weekly soft drink consumption generally giving higher scores for less sweet samples, these differences were not statistically significant by ANOVA. In fact, across all beverage samples there was no significant difference in acceptability between the consumers with low soft drink consumption and those with higher weekly soft drink consumption. The enjoyment level of the 11.5% full sugar soft drink for both high and low soft drink consumers is equal to the enjoyment level of the 5.9% reduced sugar beverage for low soft drink consumers (i.e. 86% of total consumers).
Variations in acceptability when the population is split according to First Nations versus non-First Nations consumers is shown in Figure 2C. On average, First Nations People rated the three lowest sugar beverage varieties (0%, 1.5% and 2.9% sugar) in the ‘dislike’ region of the scale, while non-First Nations consumers rated these in the ‘like’ region of the scale. While the acceptance of the 1.5% and 2.9% sugar beverage samples differed significantly between the two groups, surprisingly, the 0% sugar beverage showed no difference between groups. First Nations consumers found the 5.9% sugar soft drink sample as acceptable as the non-First Nations group acceptability levels for the lower/no sugar soft drink samples (0%, 1.5% and 2.9% sugar). Meanwhile, the non-First Nations consumers (i.e. 78% of total consumers), significantly favour the 11.5% and 5.9% sugar beverage samples equally over the other samples.
Finally, Figure 2D compares adult with child consumers. Consumers were grouped as child or adult according to their age: a person is legally considered an adult at 18 years of age [31,39]. The results highlight that children dislike the three lowest/no sugar beverages (0%, 1.5% and 2.9%) equally, while adults found the 0%, 1.5% and 2.5% sugar beverages as acceptable as the children’s acceptability scores for the 5.9% sugar beverage. Despite this graph following a similar overall trend for acceptability as the others in Figure 2, the only significant difference found in acceptance between the two groups for a specific beverage sample is seen for the 1.5% sugar variety; where adults significantly enjoy this more than children. Similarly to the non-First Nations consumers, low soft drink consumers, and LSLs, the adults (i.e. 78% of total consumers) enjoy the 50% reduced sugar soft drink (5.9% sugar) the same as they enjoy the full sugar soft drink (11.5% sugar). Contrarily, the child consumer group have a significant decline in acceptability between the 11.5% and 5.9% sugar beverage samples.
3.4. Sweet-Liker Status and Relationship with Demographics, Food Behaviour, and Health Status
Descriptive statistics were used to identify demographic characteristics of each SLS group, as shown in Table 2. Distinctive variations in SLS clusters were observed across five factors: age, perceived sweetness intensity, ethnicity, chronic disease status, and weekly full sugar soft drink consumption.
As shown in Table 2, the two instances where a significant difference was observed by ANOVA are for age and perceived sweetness intensity. “Sweet-likers” (HSL) were found to be the youngest age group, with an average age of 22 years (10 were children <18 years and 9 were adults), while the LSL were the oldest group, with an average age of 39 years. This correlates with the child versus adult plot in Figure 2D – where significant differences were observed between different age groups. The LSLs had, on average, significantly higher perception of sweetness which also aligns with the perceived sweetness intensity line graph in Figure 1B showing significant differences between groups at each sugar concentration.
Fisher LSD revealed significant differences between SLS groups for First Nations status, chronic disease status, and weekly soft drink consumption. The “unclassified” (UN) group was found to have a significantly higher number of people who reported to have chronic disease compared to the MSL group with the lowest amount of chronic disease. However, caution should be taken when interpreting this finding because the dataset in this preliminary trial was not balanced for presence of chronic disease, resulting in small consumer numbers. Table 2 also shows the HSL group had a mean weekly soft drink consumption of 1 L, whereas the LSL group had a significantly lower consumption of 0.39 L/week. Finally, the UN group has a significantly higher proportion of First Nations People compared to the LSL group which has the lowest number of First Nations participants (15:9 and 65:14 non-First Nations:First Nations, respectively). Furthermore, the First Nations population had approximately double the proportion of “sweet-likers” (HSL) and “unclassified” (UN) consumers compared to the non-First Nations population (16% versus 10%, and 28% versus 14%, respectively), and a lower proportion of the population being “sweet-dislikers” (LSL) compared to the non-First Nations population (44% versus 59%). However, it must be noted that 50% of the Indigenous population that were categorised as a “sweet-liker” were also children, while only 17% of the non-First Nations “sweet-liker” population were children.
To assess how the presence or absence of children may influence outcomes in the analysis, Table 2 was recreated using data exclusively from adult participants. The table summarising the demographic information for each of these clusters is shown in Appendix C. Similar, although less-pronounced, trends emerge in most instances, with only two factors (perceived sweetness intensity and weekly soft drink consumption) having significant differences between the adult SLS clusters (rather than five factors indicated by Table 2). While the adult dataset still shows that the LSL have significantly higher perceived sweetness intensity, interestingly, it is the UN group with the lowest soft drink consumption (rather than the LSL), and the MSL group with the highest consumption (rather than the HSL).
Finally, gender, adult BMI, and weekly water consumption did not significantly differ across SLS groups (neither by ANOVA nor post-hoc analysis). Despite this, there was a trend observed with average weekly water consumption being the lowest for the HSL group (6.3 L per week), and higher for the other three SLS groups (over 7 L per week).
PCA was used to visually represent how the SLS clusters interact with beverage acceptability, demographics, beverage consumption behaviour, sensory perception of sweetness intensity, and markers of health status. Almost 100% of variation was explained within the first three principal components. The PCA biplots depicting PC1 versus PC2 and PC1 versus PC3 are given in Figure 3 and Figure 4, respectively. The variation between SLS clusters across PC1 was largely driven by age, while chronic disease status explains variation in the data across PC2, and adult BMI aligning with PC3.
As shown in Figure 3 and 4, sweet-likers (HSLs) are more likely to be of First Nations ethnicity, have a higher adult BMI, have a chronic disease, have a higher soft drink consumption, and be more likely to enjoy the 11.5% full sugar soft drink (supported by Figure 2 and Table 2, albeit not always significant). On the contrary, the sweet-dislikers (LSLs) were more likely to enjoy low/no sugar beverages, had a higher perception to sweet foods, were more likely to be female, had a higher water consumption, and were older (supported by Figure 2 and Table 2, albeit not always significant). As indicated by the asterisks in Figure 3 and 4, the beverages with 11.5% sugar (the highest sugar soft drink), 0% and 1.5% sugar (the lowest sugar soft drinks) were the most polarising for different SLS groups in terms of acceptability. Meanwhile, the enjoyment of the 2.9% and 5.9% sugar drinks were not significantly different by ANOVA, indicating consumer enjoyment of these drinks is consistent, regardless of their SLS classification.
Interestingly, the unclassified (UN) group; the consumers whose sweet liking is seemingly not influenced by sugar concentration of the beverage, appears to echo some trends observed in the HSL group. That is, participants in this UN group are similarly more likely to be First Nations, have a chronic disease, and have a higher BMI. Meanwhile, MSL consumers loosely mirrored some correlations found in the LSL group, namely having a higher perception to sweetness intensity, potentially a preference for the lower sugar beverages, and a higher weekly water consumption. While not all of these correlations are statistically significant from this preliminary study, these PCAs demonstrate potential relationships may emerge.
4. Discussion
4.1. Main Findings
The project aimed to explore how SLS is connected to demographic information, consumer behaviours, health outcomes, and soft drink acceptability. Key findings included: a) a sweet-liker and a sweet-disliker both agree on the increasing intensity of sugar solutions with increasing sugar content; however, one “likes” it and one “dislikes” it; b) variations in SLS clusters were observed across five factors – age, perceived sweetness intensity, ethnicity, chronic disease status, and weekly full sugar soft drink consumption; and c) there may be an acceptability threshold around ~6% sugar concentration for fruity SSBs due to the decline in beverage acceptability observed when sugar content falls below 5.9%, the high level of agreement on enjoyment for the 6% sucrose solution, and the majority of consumers having an equal acceptability for the full sugar beverage (11.5% sugar) and 50% reduced sugar beverage (5.9% sugar). The implications of this paper are separated into 1) how the results can inform further research, exploration, and understanding of physiological mechanisms that influence SLS, and 2) how SLS could be considered in the health space to address the T2DM and obesity epidemic.
4.2. Examining the Basis of Sweet-Liker Status
The overall findings, as summarised in the PCA, are generally in agreement with Cartwright et al. (2025) [22]. That is, the “full sugar soft drink liker” has similar characteristics as the HSL (younger, lower perceived sweetness intensity, more likely to be First Nations, higher soft drink consumption, etc.), and the “full sugar soft drink disliker” has similar characteristics to the LSL (older, higher perceived sweetness intensity, less likely to be First Nations, lower soft drink consumption, etc.). However, the SLS clusters in the current paper are based on the sweetness range of 0 – 36% in a simple aqueous sucrose standard solution, yet the beverage acceptability clusters in the other paper are based on the sweetness range of 0 – 12% in a flavoured beverage matrix. This suggests sweet liking and disliking may be enhanced when tasting in a full-flavoured beverage matrix (compared to a model solution) due to cross-modal perception [40]. For instance, the fruity undertone to all five beverage samples may heighten sweetness perception, and thus enjoyment [41]. This means caution should be taken when discussing this 6% acceptability threshold outside of the scope of fruity SSBs. Previous literature has also suggested a darker red beverage colour is interpreted as being sweeter and more enjoyable, which may explain why the 11.5% beverage was enjoyed the most [40].
Our paper found the LSL group perceived the sweetness to be significantly higher compared to the HSL group. Additionally, the HSL group demonstrated a significantly greater consumption of full-sugar soft drinks and found these drinks significantly more acceptable than the LSL group. Previous research has supported these findings through the notion that taste is a plastic system – it can be modified according to exposure [13,42]. It is possible that high consumption of full sugar soft drinks might shift the taste threshold for sweetness to a higher level, which may alter perception of intensity and acceptability. Indeed, it has been shown that increasing soft drink consumption for one month resulted in a reduction in sucrose intensity scores, as well as a reduced liking for the same sweet concentration after the soft drink intervention – meaning that liking for sweetness shifted towards higher sugar concentrations [13]. The opposite is also true – LSLs may avoid sweet foods in their diet, resulting in a higher sensitivity towards sweet taste [43]. This shows that the environment-induced alteration – being continuous soft drink exposure, could determine an explicit acceptability change – greater liking for sweet, and consequently a dietary behaviour change – higher sugar intake. Even as little as eight days of sweet orangeade exposure has been found to increase preference for orangeade in children [44]. This highlights a potential reason the LSLs had a higher perception of sweetness may be due to this phenomenon of external factors influencing the body’s internal physiology.
Our findings highlight SLS and SSB consumption are related, yet not perfectly aligned. Because HSLs desire higher levels of sugar content, it makes sense that they are generally found to have a higher dietary sugar intake, or to have higher consumption of sweet beverages. This is supported by previous literature also finding sweet-likers have a higher intake of SSBs [12], and a separate paper demonstrating increased liking for sweet items by extreme sweet-likers [45]. Moreover, another study clearly suggested that phenotypic differences in liking for sweet taste do predict wider liking for sweetness in the diet, but as these effects are relatively small, it implies that other factors also influence real-life food choice beyond simple taste hedonics [46]. As shown in our paper, five factors (age, perceived sweetness intensity, ethnicity, chronic disease status, and weekly full sugar soft drink consumption) were found to be significantly different between SLS clusters, highlighting these may also be contributing to the differing acceptability trends. While sensory responses to taste are an important contributor to food choice, many other lifestyle factors have been shown to drive beverage consumption behaviours in a complex interplay of genetic, physiological, and metabolic variables alongside demographic, economic and sociocultural variables [11,47]. However, SLS does have an important role, which is supported by the current study revealing HSLs to have a higher soft drink consumption than LSLs. Future research should extend on the findings from this preliminary study by developing a regression model on a balanced dataset with a larger sample size to predict soft drink consumption and health outcomes by considering SLS in conjunction with all of these other factors.
The results from our study also show there is a highly significant difference between SLS groups for age – children are more likely to enjoy sweet tastes and full sugar (11.5%) soft drinks than older adults. This strengthens previous research which has produced similar findings and offered plausible explanations for this such as changes in food environment, children being less sensitive to sweetness, and physiological requirement to support rapid growth [24,48]. While it is clear preference and acceptability for sweetness declines with age, what has not been explored is what point in the life course SLS is set for an individual [25,49]. Future research into this would have valuable implications as it could then allow refining of childhood interventions geared towards healthy eating if an individual’s SLS at a certain age is predictive of future soft drink intake. Similarly, there should also be future research exploring other ways to decrease acceptability thresholds for sweetness.
4.3. Individual Level: The Future of Sweet-Liker Status
Our study suggests that SLS does influence acceptability for fruity SSBs. For the SLS solutions, as the sugar concentration increases, the disparity between different SLS clusters’ acceptance becomes stronger and more extreme. The exception to this is for the 6% sucrose solution, which is the point where all groups agree on their level of enjoyment. This perhaps suggests a broader acceptability threshold around this sugar level. This finding translates quite neatly to the acceptability of the SSB samples as, visually, this study found the 5.9% sugar beverage to lie at a cliff-edge above the lower sugar beverages’ markedly lower acceptability. The HSLs are the first to notice a difference and enjoy it slightly less than the 11.5% sugar beverage. A previous study on orange-flavoured cordial has found a descending rejection threshold of 4.7% sugar and 2.8% sugar for sweet-likers and sweet-dislikers, respectively, again supporting the idea that HSLs have a more sensitive rejection threshold [14,50].
Outside of the HSLs, the rest of the population enjoy both the full sugar and 50% reduced sugar beverage the same (11.5% and 5.9% sugar beverage samples). Previous literature has supported this finding that 50% reduction in sugar content has negligible influences on consumer acceptability [51], while other research has noted a more conservative 28% reduction does not influence SSB enjoyment [52]. Therefore, the results of this preliminary paper support what is being found in other studies – consumers can still enjoy SSB with a much lower sugar content. Acknowledging our results are not truly generalisable to the Australian public as there is an over-representation of First Nations People and women in our dataset [53], if they were extrapolated, it suggests majority of Australians would find this change totally acceptable.
An important implication of these findings is the potential for SLS to inform practice in nutrition and health-related fields. This is particularly relevant given the growing prevalence and ongoing shift toward personalised and precision nutrition [54]. In the future, there may be a small testing kit that could be administered by a health professional or patient where it shows a participants’ SLS and perception of sweetness. This could allow further individualisation of dietetics consults and further reinforce the highly tailored approach required for success in creating healthier dietary habits and behaviours at an individual level [55]. Delivery of nutritional education programs to consider sweet liking acceptability may also assist the individual in making informed choices about their diets and give them more autonomy over their health. For individuals that are classified as a sweet liker, interventions such as use of artificial sweeteners, low sugar sensitisation activities, or use of the miracle berry, which is shown to make food taste sweet [56], could be implemented. Of course, further research is first required to address the ongoing debate about whether enjoyment of sweetness genuinely influences dietary habits [57]. However, the application of a recently standardised and validated cluster classification method [7], as demonstrated in the current study, represents an important initial step.
4.4. Policy Level: The Future of Sugar Reduction in Beverages
Noting a larger cohort should be analysed in the future to confirm these observations before being used to inform public health policy, results from the current study do draw attention to the question of why regulations and policies do not centre all sugar reduction strategies around this ‘medium’ sugar level. It is acknowledged that while this may not solve all problems, it will create a stepping stone in the direction of improved health. Modelling shows that a 40% reduction in sugar content of SSBs would reduce overweight/obesity in around 1.5 million adults in the United Kingdom, which in turn would prevent up to 309 000 cases of obesity-related T2DM [58].
Importantly, our study highlights the value of an incremental reduction in sugar content of SSBs. The health ramifications of excessive sugar consumption are gaining public attention which is creating a policy window for meaningful change [59]. However, there is a continued unwillingness from policymakers to take risks or move too far away from institutionalised policies [59]. Australia has food industry initiatives focused on providing information to consumers about the sugar content of foods, as well as reformulating products to reduce sugar content [60]. Ideas such as mandatory declaration of added sugar content could prompt product reformulation of foods high in added sugars, however, these ideas have been scrutinised because it may lead to unnecessary consumer confusion [60]. Also important to note is that taste is the ultimate factor driving SSB consumption – indicating perhaps more effort and resources should be directed towards this [1,2]. There have been two noteworthy, concerted efforts in Australia over the past decade targeted at product reformulation to lower sugar content of beverages.
The Australian Beverages Council (ABC) initiated a “Sugar Reduction Pledge” which involved Australia’s leading SSB companies aiming to reduce sugar by 20% across beverage portfolios from 2015 – 2025 [61]. Between 2015 and 2022, the sugar in these Australian soft drinks decreased by 18%, and ABC updated their target to a 25% reduction [61]. While this may be considered positive progress – more could be done as 18% is not even half of the United Kingdom’s 46% sugar reduction in just five years with a sugary drinks tax [62]. There has been no official further update on this initiative since 2022 [61]. Interestingly, one year after the last update, increases in sugar content were noted on Australian beverages from manufacturers that had made this pledge – making their beverages up to 60% higher than their 2020 reformulations [63]. Underscoring all of this is the fact that industry-designed policies are often weak, contain loopholes, and often are not adhered to, which only delays genuine progress in this space [62]. Moreover, the voluntary nature of these industry-led policies also creates discrepancy in the market which limits any positive impact as reformulation is not happening across the board [62,63].
Given these limitations to the Pledge, one may turn to Government initiatives for reformulation. In 2021, an Australian Government initiative called the “Partnership Reformulation Program” had nine targets to reduce sugar consumption, with one aiming to reduce SSB sugar content in beverages with >10g/100g sugar by 10% before 2025 [64]. At the two-year mark, under one-third of all products involved in the program had recorded a decrease in sugar content [65]. Specifically for SSB, at program inception in 2021 there was 41% exceeding the threshold sugar content (10g/100g), and over 80% had still not met their relative reduction target in 2023 [65].
The specific barriers the industry is facing in being able to implement and sustain these changes are unclear, as our study alongside other literature suggests these reductions in sugar content by up to 25% should have a negligible influence on product acceptability by most consumers [50,51,52]. While consumer decision-making is driven by taste, industry decision-making is driven by economics. Perhaps introduction of the sugar tax, as recently endorsed by the Australian Medical Association due to known success in other countries such as the United Kingdom and Mexico, will be the push these industries need to reformulate their SSBs [66]. State policies as such should be enforced, and government and non-government initiatives should be more aggressive with sugar reduction targets.
4.5. Strengths and Limitations
A potential limitation of the current study is that participants were classified into SLS groups using only one set of measurements. Frameworks such as allesthesia (e.g. hunger enhancing pleasantness and satiation reducing it) and interoception (e.g. desire for sweet foods when emotional or stressed) highlight the between-day and within-day variability in sugar taste and perception [19]. This was not controlled for nor analysed in the current study as data on hunger and recent food consumption was not collected. This indicates perhaps a ‘gold standard’ approach would be to take several different measures to get an average for each consumer, which may lead to more accurate results. However, there is a trade-off between efficiency and effectiveness, and if SLS is something to be implemented in practice, time-efficiency will be an important consideration. Perhaps future research should explore accuracy and reliability of innovative quicker cross-sectional ways to measure SLS.
Likewise, while BMI was used in this study, the authors acknowledge it is not truly indicative of health status. Future work should explore barriers and enablers to normalising other quick, more accurate measures of health status that move beyond BMI. This may allow future research to generate more meaningful relationships between SLS and health outcomes, as results of our preliminary study (with a dataset not balanced for health outcome measures such as BMI and chronic disease status) are unable to draw substantive conclusions.
The authors also acknowledge that while the results of this study allude to the potential of an acceptability threshold at around 6% sugar, this cannot be said for certain as the methodological procedure for identifying acceptability and rejection thresholds was not formally undertaken [50]. It is important to note that consumers were not screened for soft drink consumption in the current study due to resourcing and time constraints with recruitment. This may have contributed to unbalanced consumer numbers amongst SLS groups. The authors recommend future work that builds off this research should do so, as it will allow for stronger insights to be drawn specifically around SLS and high soft drink consumers (i.e. those likely to be most affected by adjustments in sugar content of SSBs).
A key strength of this paper lies in its multidisciplinary approach, blending insights from dietitians, food scientists, and sensory scientists to offer a novel perspective on SLS and sugar reduction. This integration allows for both a comprehensive sensory analysis and a broader interpretation of the findings in relation to nutrition practice – two disciplines that rarely intersect in this context. As such, this work represents an original contribution to the literature and highlights the value of continued cross-disciplinary collaboration between these fields to better understand and address complex nutrition-related challenges.
5. Conclusions
In conclusion, this study explored SLS and its associations with demographics, consumer behaviour, and health outcomes, building on previous findings [22]. Interestingly, for the same sucrose solutions and the same group of people, all were able to consistently gauge increasing sweetness intensity, yet report vastly different responses for acceptability. This advocates for the importance of SLS and suggests it is a worthwhile concept to investigate because there are real differences between these groups, which may predispose different dietary habits, and thus, health outcomes. Additionally, our study highlights most people’s enjoyment levels do not differ for a full sugar (11.5%) and 50% less sugar (5.9%) fruity SSB, which may also have important public health implications. There could be value in future sugar reduction policies working with the beverage industry to set more ambitious targets, as this study has found negligible differences in acceptability even when decreasing sugar content by 50%. Therefore, these findings could inform future research on the physiological mechanisms behind SLS and support the use of SLS in dietetics and public health interventions to address obesity and T2DM, particularly in guiding efforts to reduce sugar intake in beverages while maintaining consumer acceptability.
Author Contributions
Conceptualization, J.C, H.S. and O.W.; methodology, J.C., H.S. and O.W.; formal analysis, J.C.; resources, Y.S. and H.S; data curation, J.C., M.N., O.W. and Y.S.; writing—original draft preparation, J.C. and H.S.; writing—review and editing, O.W., M.N. and Y.S.; supervision, Y.S., M.N, O.W. and H.S.; funding acquisition, Y.S. All authors have read and agreed to the published version of the manuscript.
Funding
This research was funded by the Australian Research Council Industrial Transformation Training Centre for Uniquely Australian Foods, grant number IC180100045. We also acknowledge the University of Queensland and the Australian Government Research Training Program Scholarship which have facilitated this research.
Institutional Review Board Statement
The study was conducted in accordance with the Declaration of Helsinki, and approved by the Ethics Committee of The University of Queensland (protocol code 2022/HE001341, dtd 10/24/2022).
Informed Consent Statement
Informed consent was obtained from all subjects involved in the study.
Data Availability Statement
The raw data supporting the conclusions of this article will be made available by the authors on request.
Acknowledgments
The authors acknowledge the Traditional Owners of the lands on which the Kakadu plum and Davidson plum were harvested and respect the knowledge and experience that the Traditional Owners hold regarding the care, harvest, and use of these plants. Finally, the authors would like to acknowledge the team at Uniquely Australian Foods, in particular Emma Hassall, for their technical assistance.
Conflicts of Interest
The authors declare no conflicts of interest.
Abbreviations
The following abbreviations are used in this manuscript:
| SLS | Sweet liker status |
| SSB | Sugar-sweetened beverage |
| T2DM | Type 2 Diabetes Mellitus |
| BMI | Body mass index |
| LSL | Low-sweet liker |
| MSL | Medium-sweet liker |
| HSL | High-sweet liker |
| UN | Unclassified |
| LAM | Labelled affective magnitude |
| gLMS | Generalized labelled magnitude scale |
| CI | Confidence interval |
| PCA | Principal component analysis |
Appendix A

Table A1.
Average acceptability for each sucrose solution by different SLS clusters using one-way ANOVA (p<0.05) and Fisher (LSD).
Table A1.
Average acceptability for each sucrose solution by different SLS clusters using one-way ANOVA (p<0.05) and Fisher (LSD).
| Sucrose Concentration (%) | HSL | MSL | LSL | UN | F statistic |
|---|---|---|---|---|---|
| 0 | 44.8 (B) | 58.8 (AB) | 61.3 (A) | 59.7 (A) | 2.9* |
| 3 | 40.5 (B) | 43.7 (B) | 59.4 (A) | 58.9 (A) | 6.8*** |
| 6 | 56.5 (AB) | 52.1 (AB) | 58.5 (A) | 46.8 (B) | 2.3 NSD |
| 12 | 63.1 (A) | 63.6 (A) | 42.0 (B) | 48.9 (B) | 8.2*** |
| 24 | 70.1 (A) | 44.9 (B) | 24.0 (C) | 48.4 (B) | 30.7*** |
| 36 | 66.7 (A) | 29.4 (B) | 19.6 (B) | 57.6 (A) | 46.5*** |
Significant F statistic by ANOVA indicated by: ***: p<0.001, **: p<0.01, *: p<0.05, NSD: p>0.05; different letters (ABC) within a row indicate a significant difference by Fisher (LSD) with CI 95%; HSL = high sweet-liker, MSL = medium sweet-liker, LSL = low sweet-liker, UN = unclassified, SLS = sweet-liker status, NSD = no significant difference, CI = confidence interval.
Appendix B
Table B1.
Average perceived intensity for each sucrose solution by different SLS clusters using one-way ANOVA (p<0.05) and Fisher LSD.
Table B1.
Average perceived intensity for each sucrose solution by different SLS clusters using one-way ANOVA (p<0.05) and Fisher LSD.
| Sucrose Concentration (%) | HSL | MSL | LSL | UN | F statistic |
|---|---|---|---|---|---|
| 0 | 16.6 (B) | 23.4 (AB) | 24.2 (AB) | 30.5 (A) | 1.4 NSD |
| 3 | 27.5 (B) | 30.3 (B) | 40.5 (A) | 34.9 (AB) | 3.2* |
| 6 | 40.8 (B) | 45.1 (AB) | 53.6 (A) | 50.8 (AB) | 2.9* |
| 12 | 65.9 (AB) | 59.5 (B) | 72.6 (A) | 56.1 (B) | 7.6*** |
| 24 | 76.1 (B) | 72.7 (B) | 84.7 (A) | 68.4 (B) | 8.3*** |
| 36 | 82.5 (A) | 84.9 (A) | 89.5 (A) | 72.9 (B) | 8.9*** |
Significant F statistic by ANOVA indicated by: ***: p<0.001, **: p<0.01, *: p<0.05, NSD: p>0.05; different letters (ABC) within a row indicate a significant difference by Fisher (LSD) with CI 95%; HSL = high sweet-liker, MSL = medium sweet-liker, LSL = low sweet-liker, UN = unclassified, SLS = sweet-liker status, NSD = no significant difference, CI = confidence interval.
Appendix C
Table C1.
Physical and behavioural demographics for each SLS cluster using ANOVA (p<0.1) with Fisher (LSD) post-hoc analysis for adult participants.
Table C1.
Physical and behavioural demographics for each SLS cluster using ANOVA (p<0.1) with Fisher (LSD) post-hoc analysis for adult participants.
| HSL | MSL | LSL | UN | F statistic | |
|---|---|---|---|---|---|
| Number of consumers | 9 | 14 | 73 | 15 | N/A |
| Age (years old) | 34.2 (A) | 37.8 (A) | 41.26 (A) | 37.267 (A) | 1.08 NSD |
| Gender (% female) | 55.6% (A) | 57.1% (A) | 74% (A) | 66.7% (A) | 0.85 NSD |
| Chronic disease status (%) | 11.1% (A) | 0% (A) | 5.5% (A) | 13.3% (A) | 0.87 NSD |
| Mean weekly soft drink consumption (L) | 0.688 (AB) | 0.759 (A) | 0.329 (AB) | 0.083 (B) | 1.57 NSD |
| Mean weekly water consumption (L) | 4.951 (A) | 6.5 (A) | 7.187 (A) | 7.083 (A) | 0.46 NSD |
| First Nations status (%) | 11.1% (A) | 7.1% (A) | 15.1% (A) | 20% (A) | 0.35 NSD |
| Perceived sweetness intensity | 47.056 (C) | 55.190 (B) | 60.63 (A) | 51.6 (B) | 6.98*** |
| BMI | 26.357 (A) | 24.346 (A) | 25.550 (A) | 25.673 (A) | 0.42 NSD |
Significant F statistic by ANOVA indicated by ***: p<0.001, **: p< 0.01, *: p<0.1, and NSD: p>0.1; different letters (ABC) within a row indicate a significant difference by Fisher (LSD) with 90% CI. HSL = high sweet-liker, MSL = medium sweet-liker, LSL = low sweet-liker, UN = unclassified, BMI = body mass index, NSD = no significant difference
References
- Feeney, E.; O'Brien, S.; Scannell, A.; Markey, A.; Gibney, E.R. Genetic variation in taste perception: does it have a role in healthy eating? Proc Nutr Soc. 2011, 70, 135–143. [Google Scholar] [CrossRef]
- Glanz, K.; Basil, M.; Maibach, E.; Goldberg, J.; Snyder, D.A.N. Why Americans Eat What They Do: Taste, Nutrition, Cost, Convenience, and Weight Control Concerns as Influences on Food Consumption. J Am Diet Assoc. 1998, 98, 1118–1126. [Google Scholar] [CrossRef]
- Garcia-Bailo, B.; Toguri, C.; Eny, K.M.; El-Sohemy, A. Genetic Variation in Taste and Its Influence on Food Selection. OMICS 2009, 13, 69–80. [Google Scholar] [CrossRef]
- Pangborn, R.M. Individual variation in affective responses to taste stimuli. Psychonomic science 1970, 21, 125–126. [Google Scholar] [CrossRef]
- Berridge, K.C.; Ho, C.-Y.; Richard, J.M.; DiFeliceantonio, A.G. The tempted brain eats: Pleasure and desire circuits in obesity and eating disorders. Brain Res. 2010, 1350, 43–64. [Google Scholar] [CrossRef] [PubMed]
- Iatridi, V.; Hayes, J.E.; Yeomans, M.R. Reconsidering the classification of sweet taste liker phenotypes: A methodological review. Food quality and preference 2019, 72, 56–76. [Google Scholar] [CrossRef]
- Kavaliauskaite, G.; Thibodeau, M.; Ford, R.; Yang, Q. Using correlation matrices to standardise sweet liking status classification. Food quality and preference 2023, 104, 104759. [Google Scholar] [CrossRef]
- Yang, Q.; Kraft, M.; Shen, Y.; MacFie, H.; Ford, R. Sweet Liking Status and PROP Taster Status impact emotional response to sweetened beverage. Food quality and preference 2019, 75, 133–44. [Google Scholar] [CrossRef]
- Tan, S.Y.; Tucker, R.M. Sweet taste as a predictor of dietary intake: A systematic review. Nutrients 2019, 11, 94. [Google Scholar] [CrossRef]
- Holt, S.H.A.; Cobiac, L.; Beaumont-Smith, N.E.; Easton, K.; Best, D.J. Dietary habits and the perception and liking of sweetness among Australian and Malaysian students: A cross-cultural study. Food quality and preference 2000, 11, 299–312. [Google Scholar] [CrossRef]
- Garneau, N.L.; Nuessle, T.M.; Mendelsberg, B.J.; Shepard, S.; Tucker, R.M. Sweet liker status in children and adults: Consequences for beverage intake in adults. Food Qual Prefer. 2018, 65, 175–80. [Google Scholar] [CrossRef]
- Turner-McGrievy, G.; Tate, D.F.; Moore, D.; Popkin, B. Taking the Bitter with the Sweet: Relationship of Supertasting and Sweet Preference with Metabolic Syndrome and Dietary Intake. Journal of Food Science 2013, 78, S336–S42. [Google Scholar] [CrossRef]
- Sartor, F.; Donaldson, L.F.; Markland, D.A.; Loveday, H.; Jackson, M.J.; Kubis, H.-P. Taste perception and implicit attitude toward sweet related to body mass index and soft drink supplementation. Appetite 2011, 57, 237–246. [Google Scholar] [CrossRef]
- Methven, L.; Xiao, C.; Cai, M.; Prescott, J. Rejection thresholds (RjT) of sweet likers and dislikers. Food quality and preference 2016, 52, 74–80. [Google Scholar] [CrossRef]
- Iatridi, V.; Hayes, J.E.; Yeomans, M.R. Quantifying sweet taste liker phenotypes: Time for some consistency in the classification criteria. Nutrients 2019, 11, 129. [Google Scholar] [CrossRef]
- Asao, K.; Miller, J.; Arcori, L.; Lumeng, J.C.; Han-Markey, T.; Herman, W.H. Patterns of sweet taste liking: A pilot study. Nutrients 2015, 7, 7298–7311. [Google Scholar] [CrossRef] [PubMed]
- Drewnowski, A.; Henderson, S.A.; Shore, A.B.; Barratt-Fornell, A. Nontasters, Tasters, and Supertasters of 6- n-Propylthiouracil (PROP) and Hedonic Response to Sweet. Physiol Behav. 1997, 62, 649–655. [Google Scholar] [CrossRef]
- Yeomans, M.R.; Tepper, B.J.; Rietzschel, J.; Prescott, J. Human hedonic responses to sweetness: Role of taste genetics and anatomy. Physiol Behav. 2007, 91, 264–273. [Google Scholar] [CrossRef] [PubMed]
- Armitage, R.M.; Iatridi, V.; Sladekova, M.; Yeomans, M.R. Comparing body composition between the sweet-liking phenotypes: experimental data, systematic review and individual participant data meta-analysis. Int J Obes (Lond). 2024, 48, 764–777. [Google Scholar] [CrossRef]
- Pugnaloni, S.; Alia, S.; Mancini, M.; Santoro, V.; Di Paolo, A.; Rabini, R.A.; et al. A study on the relationship between type 2 diabetes and taste function in patients with good glycemic control. Nutrients 2020, 12, 1112. [Google Scholar] [CrossRef]
- Yu, J.H.; Shin, M.-S.; Lee, J.R.; Choi, J.H.; Koh, E.H.; Lee, W.J.; et al. Decreased sucrose preference in patients with type 2 diabetes mellitus. Diabetes Res Clin Pract. 2014, 104, 214–219. [Google Scholar] [CrossRef]
- Cartwright, J.; Smyth, H.E.; Netzel, M.E.; Sultanbawa, Y.F.; Wright, O.R.L. A Hedonic Sensory Trial: Exploring the Relationship Between Sweet-Liker Status, Demographics, and Health Measures on Acceptability in a Beverage System. Journal of sensory studies 2025, 40, n/a. [Google Scholar] [CrossRef]
- Mennella, J.A.; Bobowski, N.K.; Reed, D.R. The development of sweet taste: From biology to hedonics. Rev Endocr Metab Disord. 2016, 17, 171–178. [Google Scholar] [CrossRef]
- Coldwell, S.E.; Oswald, T.K.; Reed, D.R. A marker of growth differs between adolescents with high vs. low sugar preference. Physiol Behav. 2009, 96, 574–580. [Google Scholar] [CrossRef]
- Desor, J.A.; Beauchamp, G.K. Longitudinal changes in sweet preferences in humans. Physiol Behav. 1987, 39, 639–641. [Google Scholar] [CrossRef] [PubMed]
- World Health Organization. Guideline: Sugars intake for adults and children (ISBN 978-92-4-154902-8). 2015. [Available from: https://www.who.int/publications/i/item/9789241549028.
- World Health Organization. Taking Action on Childhood Obesity 2018. [Available from: https://iris.who.int/bitstream/handle/10665/274792/WHO-NMH-PND-ECHO-18.1-eng.pdf?sequence=1.
- Hu, F.B. Resolved: there is sufficient scientific evidence that decreasing sugar-sweetened beverage consumption will reduce the prevalence of obesity and obesity-related diseases. Obes Rev. 2013, 14, 606–619. [Google Scholar] [CrossRef] [PubMed]
- Khan, T.A.; Sievenpiper, J.L. Controversies about sugars: results from systematic reviews and meta-analyses on obesity, cardiometabolic disease and diabetes. Eur J Nutr. 2016, 55 (Suppl 2), 25–43. [Google Scholar] [CrossRef]
- Malik, V.S.; Hu, F.B. The role of sugar-sweetened beverages in the global epidemics of obesity and chronic diseases. Nat Rev Endocrinol. 2022, 18, 205–218. [Google Scholar] [CrossRef] [PubMed]
- Australian Bureau of Statistics. Welcome to the Australian Bureau of Statistics 2024. [Available from: https://www.abs.gov.au/.
- Hedrick, V.E.; Savla, J.; Comber, D.L..; Flack, K.D.; Estabrooks, P.A.; Nsiah-Kumi, P.A.; et al. Development of a Brief Questionnaire to Assess Habitual Beverage Intake (BEVQ-15): Sugar-Sweetened Beverages and Total Beverage Energy Intake. J Acad Nutr Diet. 2012, 112, 840–849. [Google Scholar] [CrossRef]
- Lawless, H.T.; Heymann, H. Sensory Evaluation of Food; Springer New York: New York, NY, 2010. [Google Scholar]
- Schutz, H.G.; Cardello, A.V. A LABELED AFFECTIVE MAGNITUDE (LAM) SCALE FOR ASSESSING FOOD LIKING/DISLIKING. Journal of sensory studies. 2001, 16, 117–159. [Google Scholar] [CrossRef]
- Bartoshuk, L.M.; Duffy, V.B.; Fast, K.; Green, B.G.; Prutkin, J.; Snyder, D.J. Labeled scales (e.g., category, Likert, VAS) and invalid across-group comparisons: what we have learned from genetic variation in taste. Food quality and preference 2003, 14, 125–138. [Google Scholar] [CrossRef]
- ASTM International. Standard Guide for Preferred Methods for Acceptance of Product; p. 2018.
- BS EN ISO 11136:2017+A1:2020; Sensory analysis. Methodology. General guidance for conducting hedonic tests with consumers in a controlled area. British Standards Institute, 2020.
- Gascoyne, C.; Scully, M.; Wakefield, M.; Morley, B. Sugary drink consumption in Australian secondary school students; Centre for Behavioural Research in Cancer, Cancer Council: Melbourne, Australia, 2019. [Google Scholar]
- UNICEF Australia. United Nations Convention on the Rights of the Child New South Wales (AU): UNICEF. 2025. [cited 2025 Apr 2]. Available from: https://www.unicef.org.au/united-nations-convention-on-the-rights-of-the-child?srsltid=AfmBOooDaS3ugM0zs4-ij0kngnsdKeNQbd7iqRNRk0URd3TNJyq6OqJL.
- Slocombe, B.G.; Carmichael, D.A.; Simner, J. Cross-modal tactile–taste interactions in food evaluations. Neuropsychologia 2016, 88, 58–64. [Google Scholar] [CrossRef]
- Xiao, Z.; Hu, Y.; Niu, Y.; Zhang, J.; Yang, B. Five representative esters and aldehydes from fruits can enhance sweet perception. Food science & technology 2024, 194, 115804. [Google Scholar]
- Heath, T.P.; Melichar, J.K.; Nutt, D.J.; Donaldson, L.F. Human Taste Thresholds Are Modulated by Serotonin and Noradrenaline. J Neurosci. 2006, 26, 12664–12671. [Google Scholar] [CrossRef]
- Appleton, K.M. Liking for Sweet Taste, Sweet Food Intakes, and Sugar Intakes. Nutrients. 2024, 16, 3672. [Google Scholar] [CrossRef]
- Liem, D.G.; de Graaf, C. Sweet and sour preferences in young children and adults: role of repeated exposure. Physiol Behav. 2004, 83, 421–429. [Google Scholar] [CrossRef]
- Kim, J.-Y.; Prescott, J.; Kim, K.-O. Patterns of sweet liking in sucrose solutions and beverages. Food quality and preference 2014, 36, 96–103. [Google Scholar] [CrossRef]
- Armitage, R.M.; Iatridi, V.; Thanh Vi, C.; Yeomans, M.R. Phenotypic differences in taste hedonics: The effects of sweet liking. Food quality and preference 2023, 107, 104845. [Google Scholar] [CrossRef]
- Drewnowski, A. Taste preferences and food intake. Annu Rev Nutr. 1997, 17, 237–253. [Google Scholar] [CrossRef]
- Pellegrino, R.; Sorokowska, A.; Marczak, M.; Niemczyk, A.; Butovskaya, M.; Huanca, T.; et al. Mapping sweetness preference across the lifespan for culturally different societies. Journal of environmental psychology 2018, 58, 72–6. [Google Scholar] [CrossRef]
- De Graaf, C.; Zandstra, E.H. Sweetness Intensity and Pleasantness in Children, Adolescents, and Adults. Physiol Behav. 1999, 67, 513–520. [Google Scholar] [CrossRef]
- Peng, M.; Ginieis, R.; Abeywickrema, S.; McCormack, J.; Prescott, J. Rejection thresholds for sweetness reduction in a model drink predict dietary sugar intake. Food quality and preference 2023, 110, 104965. [Google Scholar] [CrossRef]
- Torrico, D.D.; Tam, J.; Fuentes, S.; Gonzalez Viejo, C.; Dunshea, F.R. Consumer rejection threshold, acceptability rates, physicochemical properties, and shelf-life of strawberry-flavored yogurts with reductions of sugar. J Sci Food Agric. 2020, 100, 3024–3035. [Google Scholar] [CrossRef]
- Pineli, L.d.L.d.O.; Aguiar LAd Fiusa, A.; Botelho, R.B.d.A.; Zandonadi, R.P.; Melo, L. Sensory impact of lowering sugar content in orange nectars to design healthier, low-sugar industrialized beverages. Appetite 2016, 96, 239–44. [Google Scholar] [CrossRef]
- Australian Bureau of Statistics. Population: Census 2021. [Available from: https://www.abs.gov.au/statistics/people/population/population-census/latest-release.
- Robertson, S.; Clarke, E.D.; Gómez-Martín, M.; Cross, V.; Collins, C.E.; Stanford, J. Do Precision and Personalised Nutrition Interventions Improve Risk Factors in Adults with Prediabetes or Metabolic Syndrome? A Systematic Review of Randomised Controlled Trials. Nutrients 2024, 16, 1479. [Google Scholar] [CrossRef]
- Jinnette, R.; Narita, A.; Manning, B.; McNaughton, S.A.; Mathers, J.C.; Livingstone, K.M. Does Personalized Nutrition Advice Improve Dietary Intake in Healthy Adults? A Systematic Review of Randomized Controlled Trials. Advances in nutrition (Bethesda, Md). 2021, 12, 657–669. [Google Scholar] [PubMed]
- Choi, S.E.; Garza, J. Consumer likings of different miracle fruit products on different sour foods. Foods 2021, 10, 406. [Google Scholar] [CrossRef]
- Čad, E.M.; van der Kruijssen, M.; Tang, C.S.; Pretorius, L.; de Jong, H.B.T.; Mars, M.; et al. Three independent measures of sweet taste liking have weak and inconsistent associations with sugar and sweet food intake - insights from the sweet tooth study. Food quality and preference 2025, 130, 105536. [Google Scholar] [CrossRef]
- Ma, Y.; He, F.J.P.; Yin, Y.B.; Hashem, K.M.M.; MacGregor, G.A.P. Gradual reduction of sugar in soft drinks without substitution as a strategy to reduce overweight, obesity, and type 2 diabetes: a modelling study. Lancet Diabetes Endocrinol. 2016, 4, 105–114. [Google Scholar] [CrossRef] [PubMed]
- Russell, C.; Baker, P.; Grimes, C.; Lawrence, M.A. What are the benefits and risks of nutrition policy actions to reduce added sugar consumption? An Australian case study. Public Health Nutr. 2022, 25, 2025–2042. [Google Scholar] [CrossRef] [PubMed]
- Food Regulation. Policy context relating to sugars in Australia and New Zealand: Australian Government; 2017 [updated 4 Jan 2024. Available from: https://www.foodregulation.gov.au/resources/publications/policy-context-relating-sugars-australia-and-new-zealand.
- Australian Beverages. Sugar Reduction Pledge 2024. [Available from: https://www.australianbeverages.org/initiatives-advocacy-information/sugar-reduction-pledge/.
- Breadon, P.; Geraghty, J. Sickly sweet: It’s time for a sugary drinks tax: Grattan Institute; 2024. [Available from: https://grattan.edu.au/wp-content/uploads/2024/05/Sickly-Sweet-Grattan-Institute-Report-May-2024.pdf.
- Jeffrey, D. Increasing sugar in Fanta sparks call for new tax on soft drinks 2024. [Available from: https://www.9news.com.au/national/fanta-increased-sugar-calls-tax-ama/554c7ba1-ca75-4084-9741-0a3f42424d7b.
- Department of Health and Aged Care. Partnership Reformulation Program: Australian Government; 2024. [Available from: https://www.health.gov.au/our-work/healthy-food-partnership/partnership-reformulation-program.
- Australian Bureau of Statistics. Healthy Food Partnership Reformulation Program: Wave 2, two-year progress 2024. [Available from: https://www.abs.gov.au/articles/healthy-food-partnership-reformulation-program-wave-2-two-year-progress.
- Australian Medical Association. AMA welcomes sweet push on sugar tax reform 2024. [Available from: https://www.ama.com.au/media/ama-welcomes-sweet-push-sugar-tax-reform.
Figure 1.
Sugar (sucrose) solution acceptance (A; top) and perceived sweetness intensity (B; bottom) categorised by cluster using correlation matrices (correlation factor >0.6), where green = high sweet-likers (HSL) (n = 19), blue = medium sweet-likers (MSL) (n = 20), pink = low sweet-likers (LSL) (n = 79), grey = unclassified (UN) (n = 24). Asterisks (*) indicate significant differences between clusters at each sucrose concentration using one-way ANOVA according to the following signification codes: 0 < *** < 0.001 < ** < 0.01 < * < 0.05 < nsd (no significant difference).
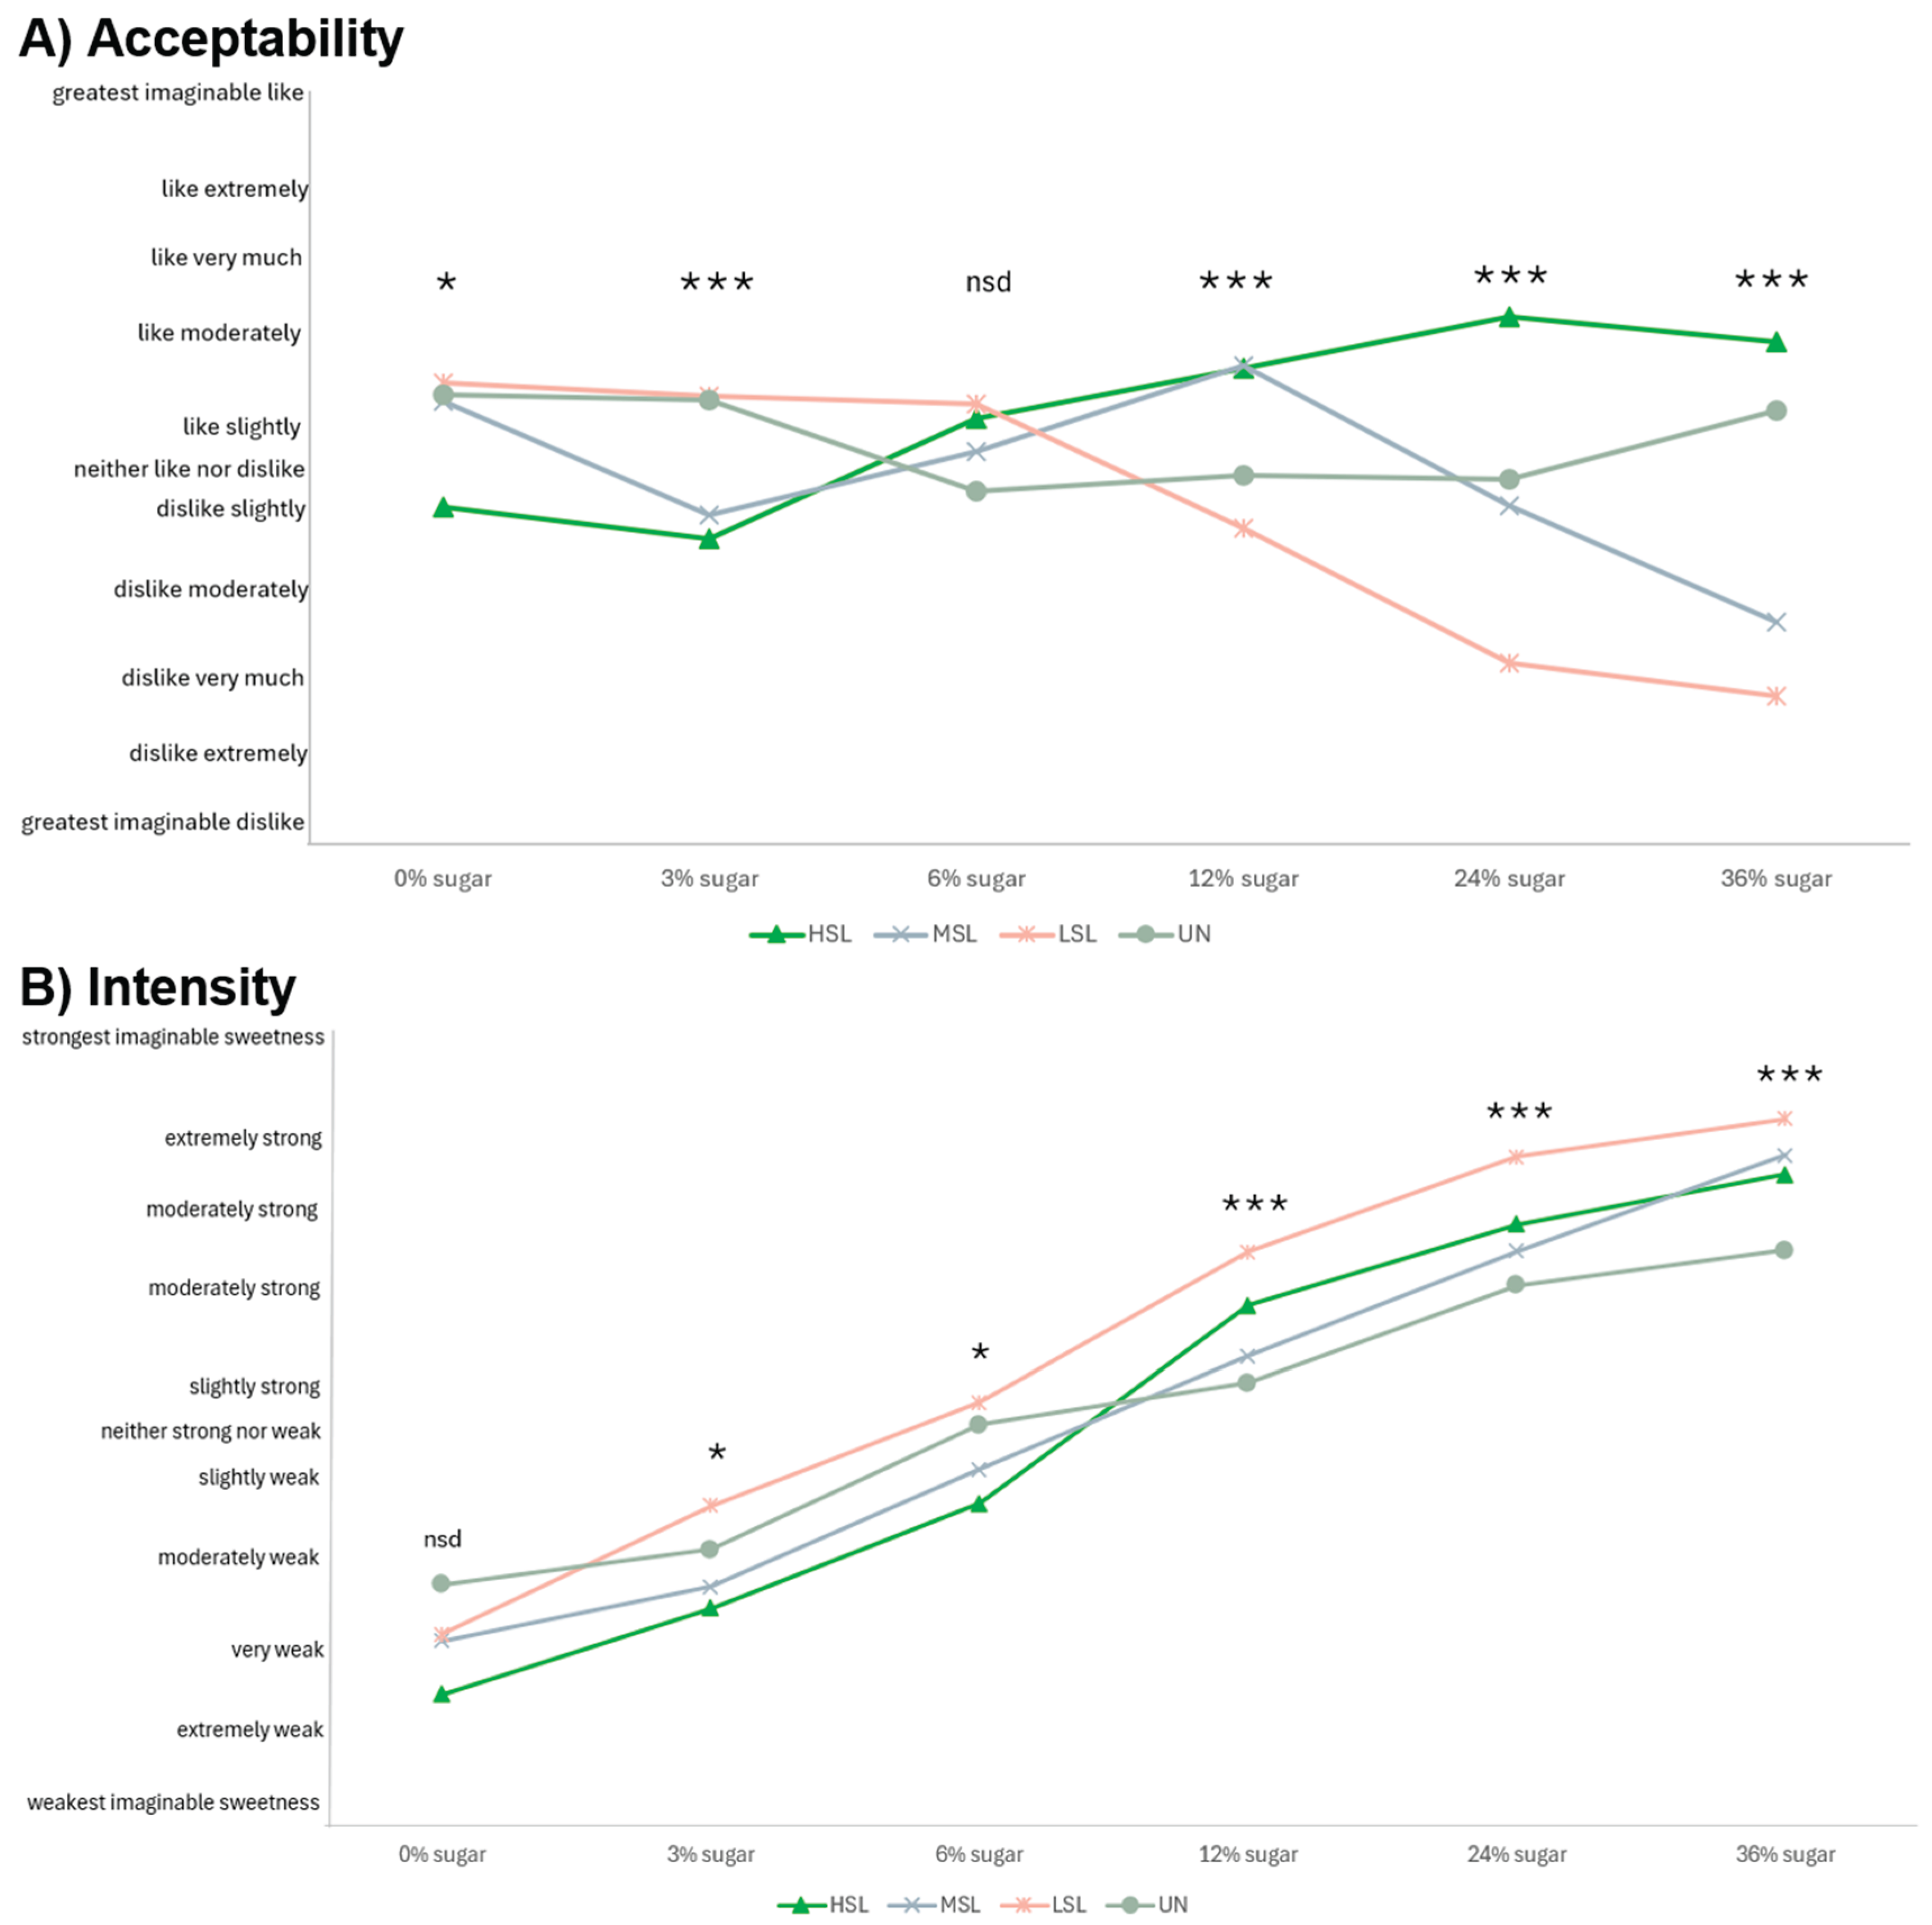
Figure 2.
Mean consumer acceptability scores of carbonated beverages with sugar (sucrose) contents ranging from 0% – 11.5%. A (top left): consumers are split according to sweet-liker status where HSL= high sweet-liker (n = 19), MSL = medium sweet-liker (n = 20), LSL = low sweet-liker (n = 79), B (top right): consumers are split according to having high (n = 20) versus low soft drink consumption (n = 122), C (bottom left): consumers are split according to identifying as First Nations (n=32) versus non-First Nations ethnicity (n=110), and D (bottom right): consumers are split according to child (n=31) versus adult (n=111). Different lowercase letters (abc) indicate significant differences between groups and samples using one-way ANOVA p<0.05 and Tukey (HSD) post-hoc tests with 95% CI.
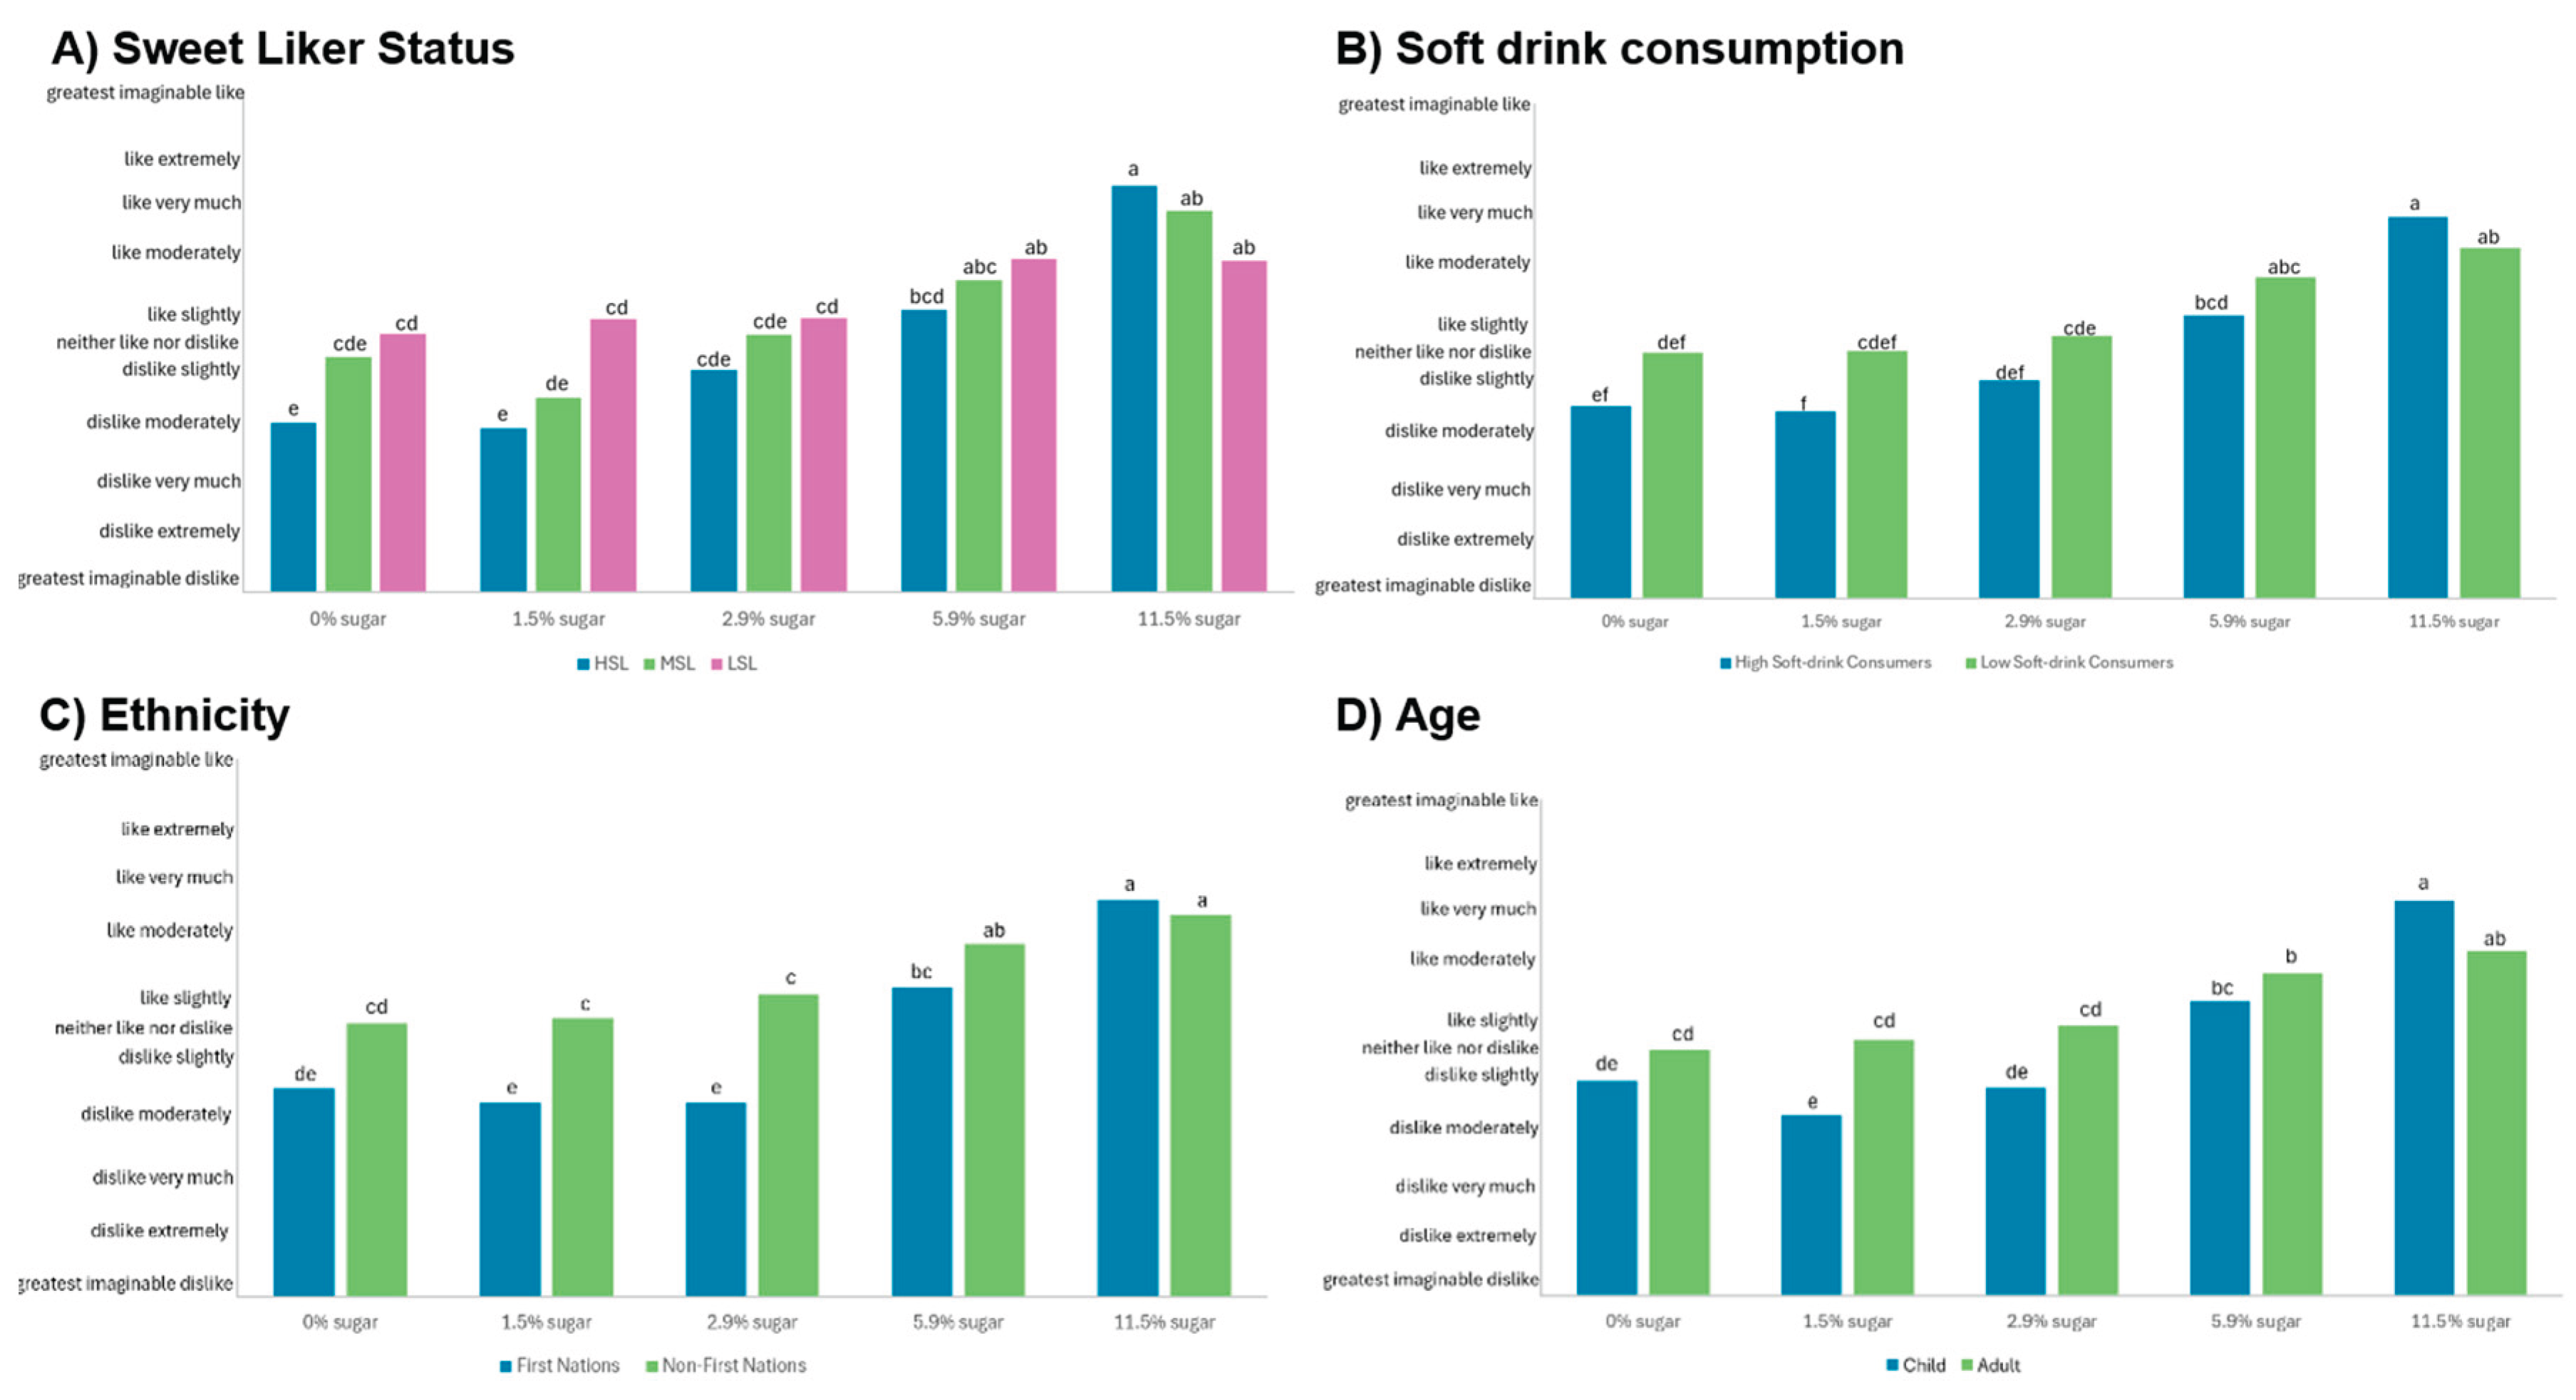
Figure 3.
PCA biplot (PC1 versus PC2) depicting the four SLS clusters acceptability scores together with mean SLS group demographic, consumption behaviour data, and health status. HSL = high sweet-liker, MSL = medium sweet-liker, LSL = low sweet-liker, UN = unclassified, BMI = body mass index, nsd = no significant difference. Asterisks (*) indicate significant differences between clusters for each variable using one-way ANOVA according to the following signification codes: 0 < *** < 0.001 < ** < 0.01 < * < 0.1 < nsd. For the categorical variables, a larger vector should be interpreted as follows: a) First Nations status – more likely to be First Nations, b) Chronic disease – more likely to have a chronic disease, c) Gender – more likely to be male.
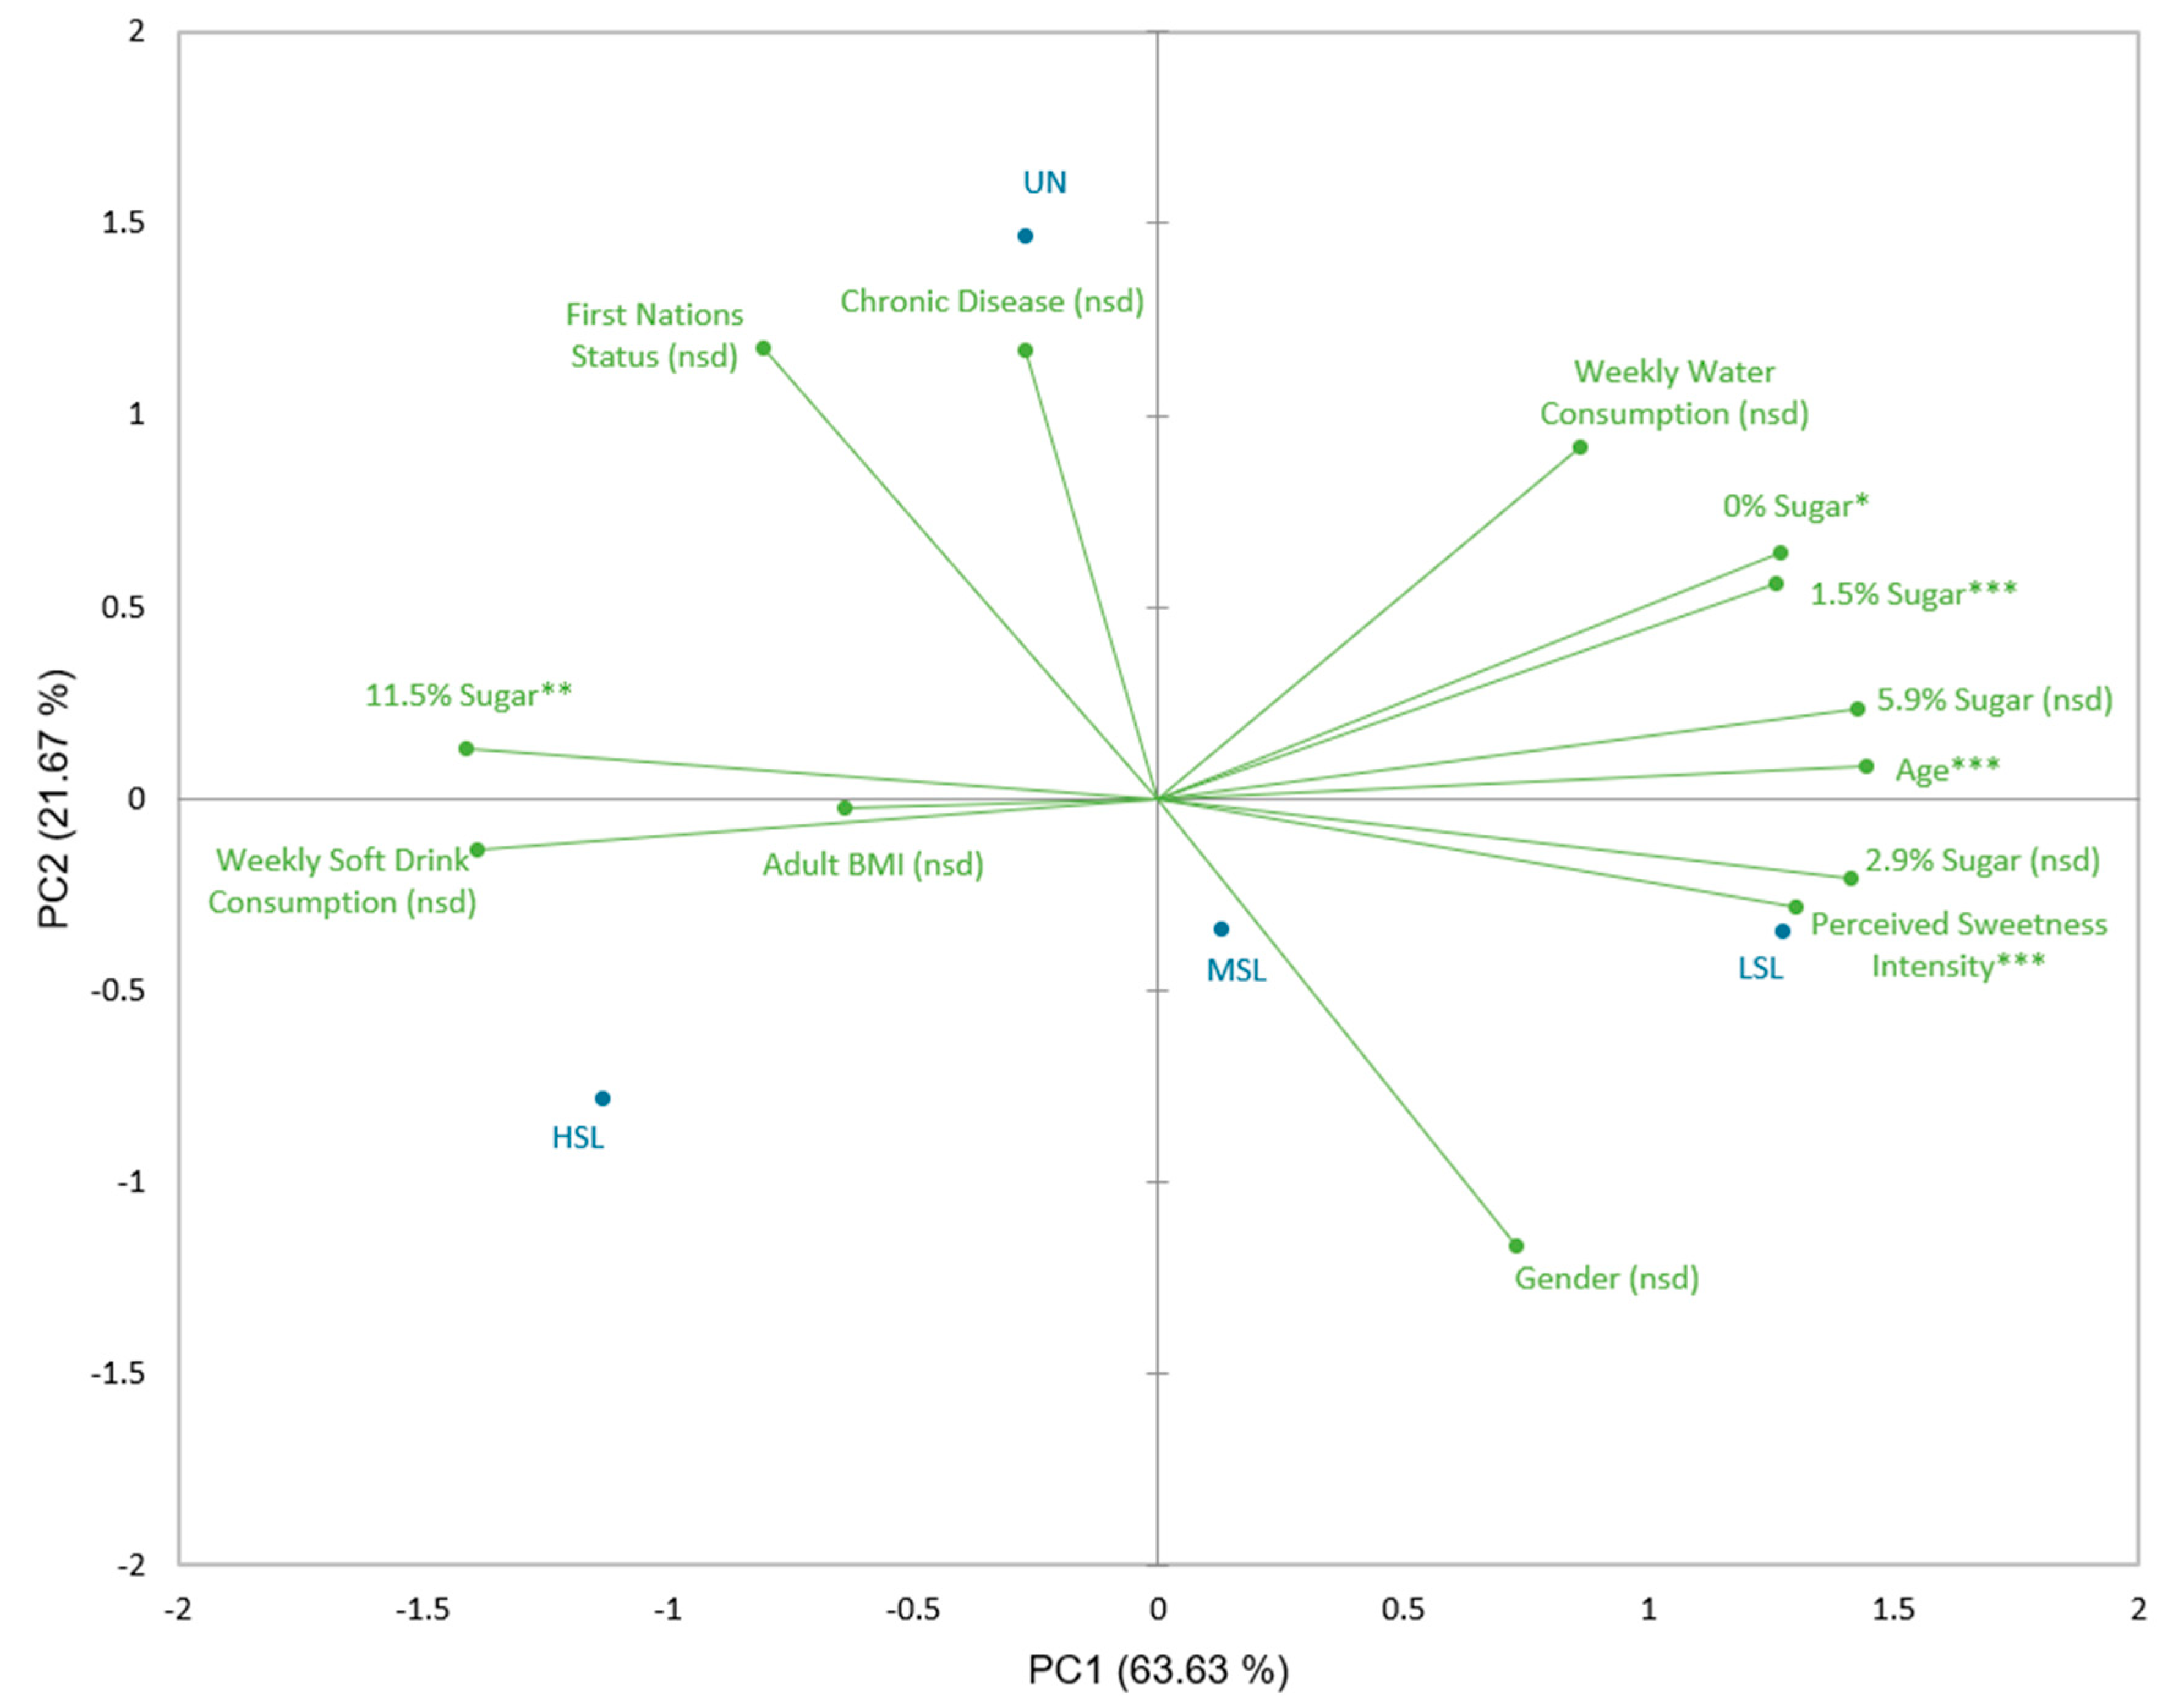
Figure 4.
PCA biplot (PC1 versus PC3) depicting the four SLS clusters acceptability scores together with mean SLS group demographic, consumption behaviour data, and health status. HSL = high sweet-liker, MSL = medium sweet-liker, LSL = low sweet-liker, UN = unclassified, BMI = body mass index, nsd = no significant difference. Asterisks (*) indicate significant differences between clusters for each variable using one-way ANOVA according to the following signification codes: 0 < *** < 0.001 < ** < 0.01 < * < 0.1 < nsd. For the categorical variables, a larger vector should be interpreted as follows: a) First Nations status – more likely to be First Nations, b) Chronic disease – more likely to have a chronic disease, c) Gender – more likely to be male.
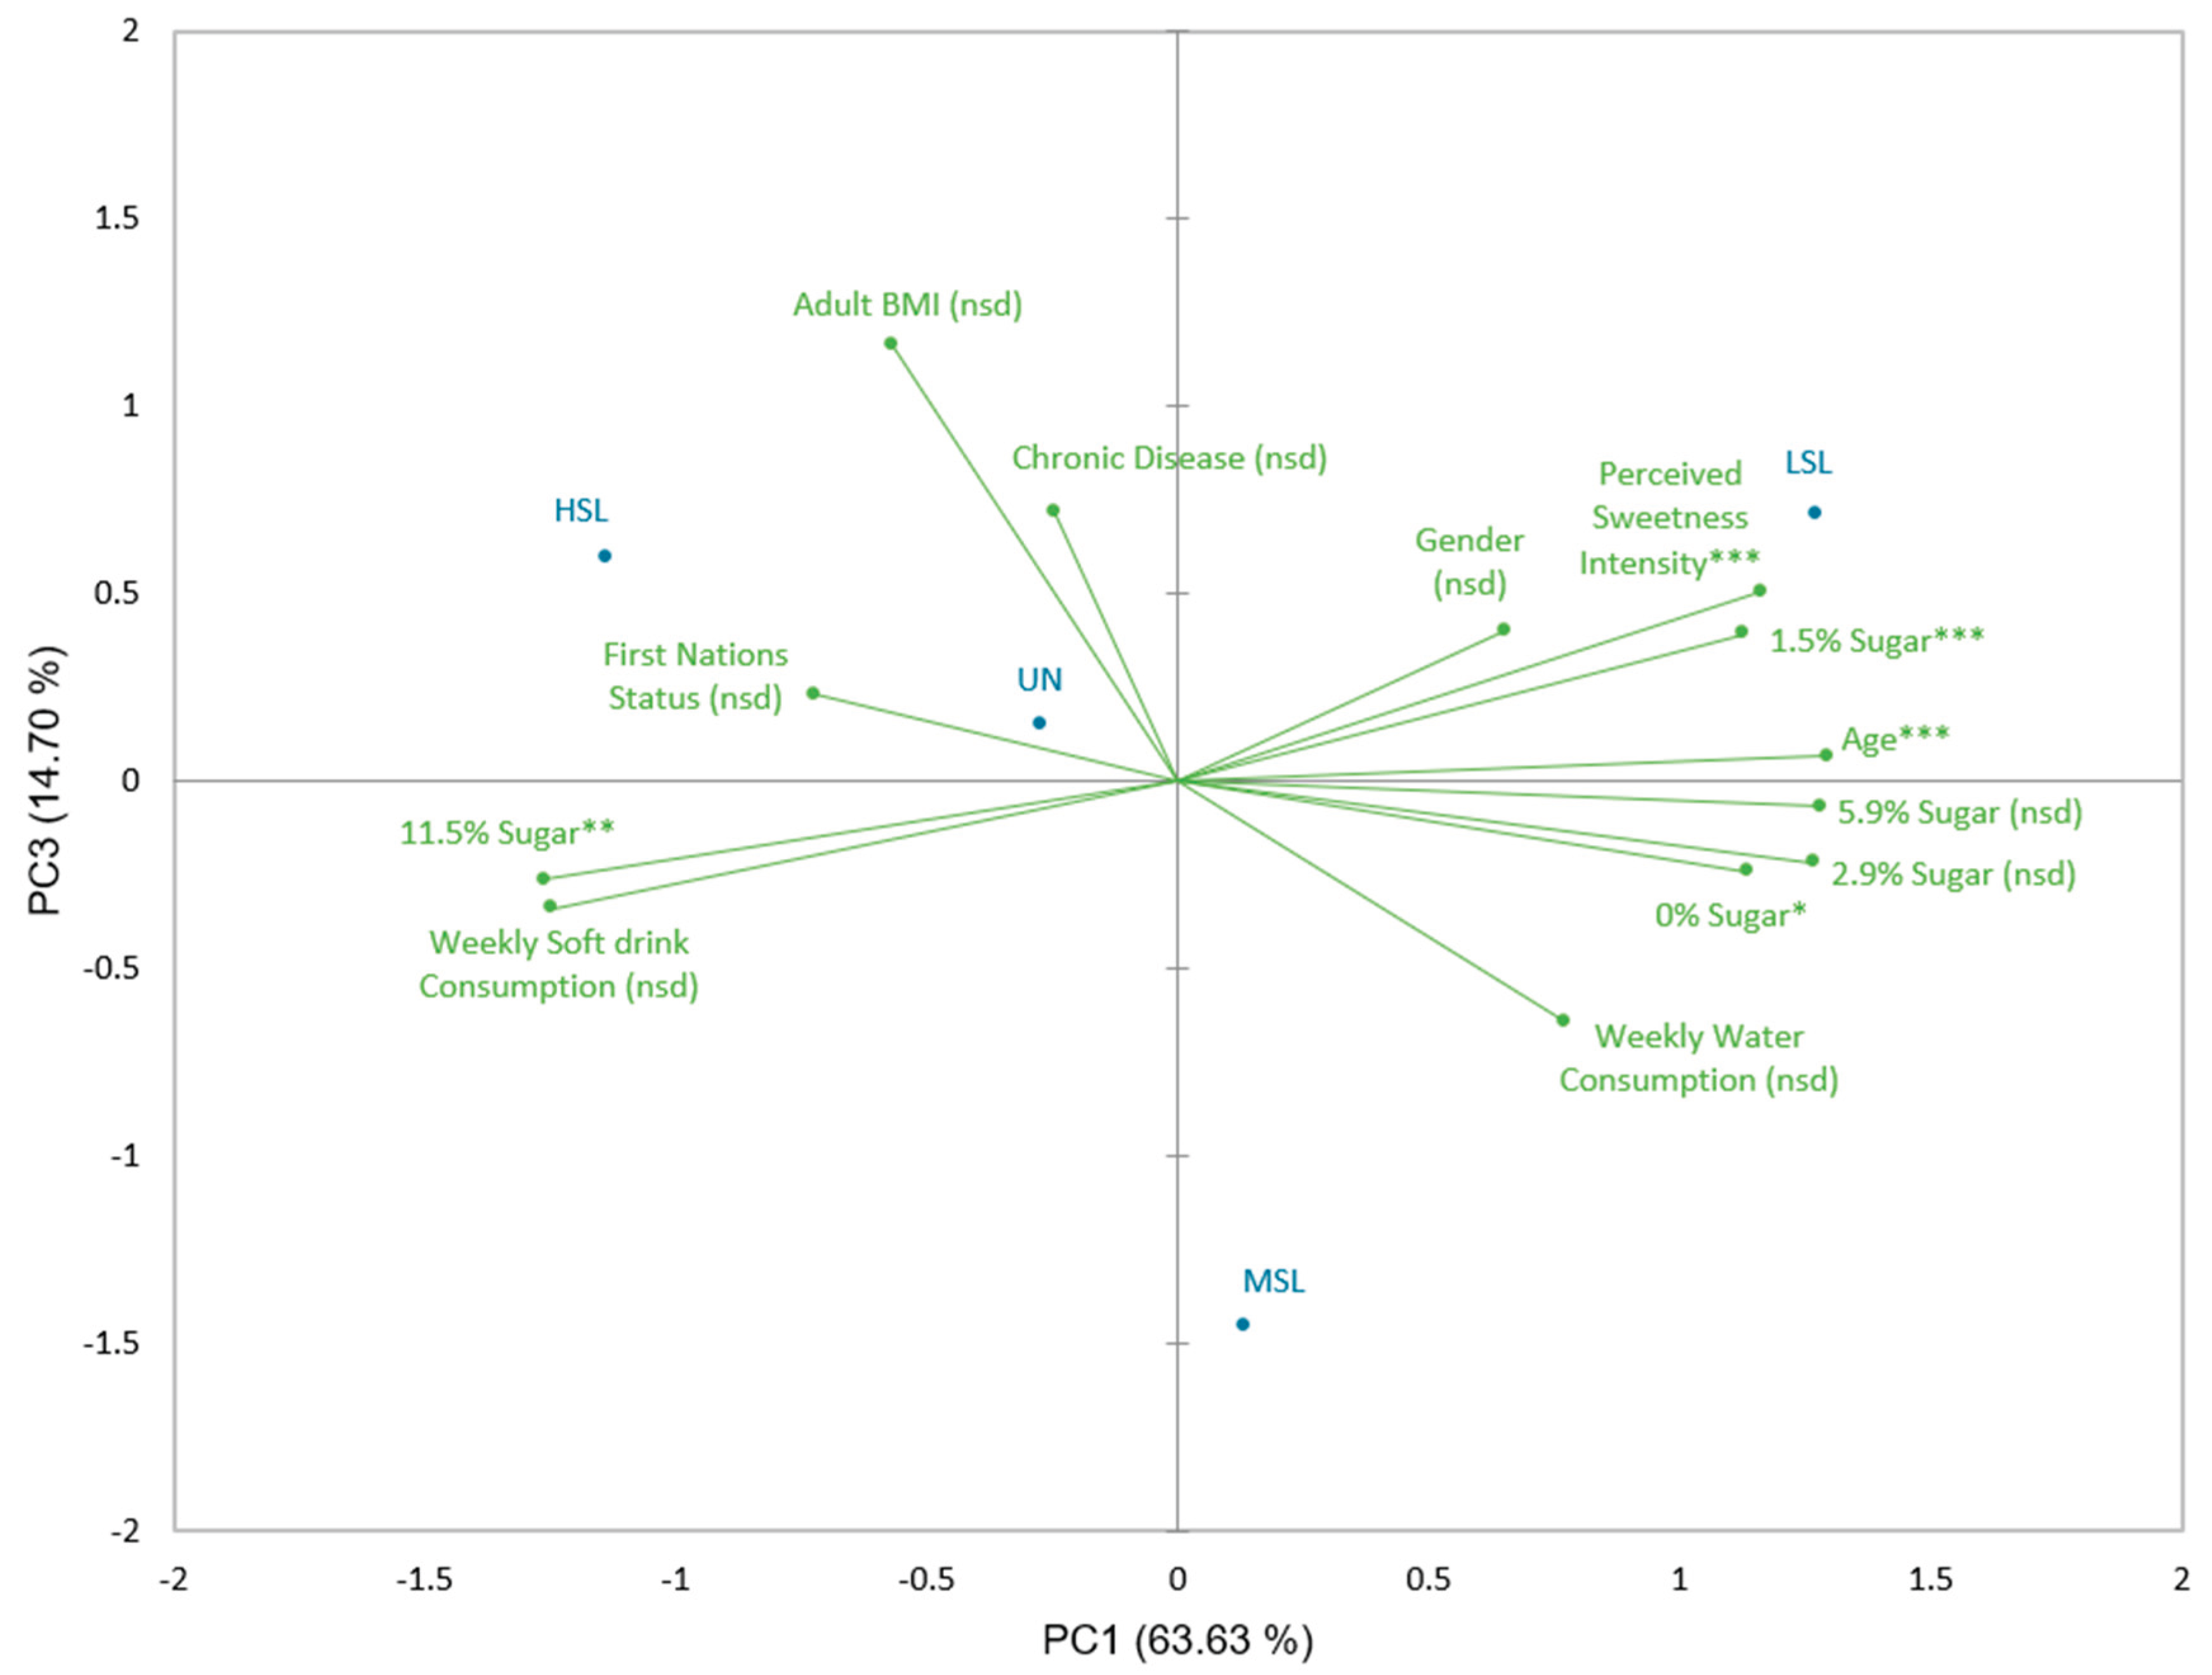
Table 1.
Key consumer demographic information.
| Number of participants | % | |
|---|---|---|
| Total participants | 142 | N/A |
| Adults | 111 | 78 |
| Children | 31 | 22 |
| First Nations | 32 | 23 |
| Non-First Nations | 110 | 77 |
| Male | 45 | 32 |
| Female | 96 | 68 |
| Non-binary/other | 1 | 0.7 |
| Chronic disease | 8 | 5.6 |
| No chronic disease | 134 | 94 |
Table 2.
Physical and behavioural demographics for each SLS cluster using ANOVA (p<0.1) with Fisher (LSD) post-hoc analysis.
Table 2.
Physical and behavioural demographics for each SLS cluster using ANOVA (p<0.1) with Fisher (LSD) post-hoc analysis.
| HSL | MSL | LSL | UN | F statistic | |
|---|---|---|---|---|---|
| Number of consumers | 19 | 20 | 79 | 24 | N/A |
| Number of children | 10 | 6 | 6 | 9 | N/A |
| Age (years old) | 21.8 (C) | 30.3 (B) | 39.3 (A) | 28.8 (BC) | 8.67*** |
| Gender (% female) | 65% (A) | 67% (A) | 72.2% (A) | 58.3% (A) | 0.58 NSD |
| Chronic disease status (%) | 5.3% (AB) | 0% (B) | 5.1% (AB) | 12.5% (A) | 1.12 NSD |
| Mean weekly soft drink consumption (L) | 1.0 (A) | 0.82 (AB) | 0.39 (B) | 0.77 (AB) | 1.41 NSD |
| Mean weekly water consumption (L) | 6.3 (A) | 7.3 (A) | 7.1 (A) | 7.4 (A) | 0.14 NSD |
| First Nations status (%) | 26.3% (AB) | 20% (AB) | 17.7% (B) | 37.5% (A) | 1.46 NSD |
| Perceived sweetness intensity | 51.6 (B) | 52.6 (B) | 60.8 (A) | 52.3 (B) | 7.36*** |
| Adult BMI | 26.4 (A) | 24.4 (A) | 25.6 (A) | 25.7 (A) | 0.42 NSD |
Significant F statistic by ANOVA indicated by ***: p<0.001, **: p< 0.01, *: p<0.1, and NSD: p>0.1; different letters (ABC) within a row indicate a significant difference by Fisher (LSD) with 90% CI. HSL = high sweet-liker, MSL = medium sweet-liker, LSL = low sweet-liker, UN = unclassified, BMI = body mass index, NSD = no significant difference.
Disclaimer/Publisher’s Note: The statements, opinions and data contained in all publications are solely those of the individual author(s) and contributor(s) and not of MDPI and/or the editor(s). MDPI and/or the editor(s) disclaim responsibility for any injury to people or property resulting from any ideas, methods, instructions or products referred to in the content. |
© 2025 by the authors. Licensee MDPI, Basel, Switzerland. This article is an open access article distributed under the terms and conditions of the Creative Commons Attribution (CC BY) license (http://creativecommons.org/licenses/by/4.0/).
Copyright: This open access article is published under a Creative Commons CC BY 4.0 license, which permit the free download, distribution, and reuse, provided that the author and preprint are cited in any reuse.


