
Submitted:
09 April 2025
Posted:
10 April 2025
You are already at the latest version
Abstract
Excessive consumption of sugar-sweetened beverages (SSBs) is linked to various health risks, including obesity, type 2 diabetes, and cardiovascular diseases. University students are particularly vulnerable due to lifestyle factors and high consumption patterns. This cross-sectional survey examined SSB consumption patterns, sugar intake, and awareness of health risks among Kuwait University students. Statistical analyses, including chi-square tests and logistic regression models, were conducted using SPSS. Findings revealed a high prevalence of SSB consumption, with significant associations between intake levels and demographic characteristics. Regular soda was the most consumed SSB, with 42% of students drinking it 5–6 times per week and 32% consuming it daily. The median daily sugar intake from soda alone was 38 g, approaching or exceeding recommended limits. Overall, 34% of students were classified as high-sugar consumers. Males had a higher total sugar intake, while females consumed SSBs more frequently. Greater health awareness was associated with lower sugar consumption, such as obesity (OR=0.142, 95% CI=0.046–0.435, p<0.001), whereas students who were aware of the sugar content in SSBs and who preferred unsweetened fruit juices had significantly lower sugar intake from SSBs (OR=0.653, 95% CI=0.435–0.980, p=0.040; OR=0.447, 95% CI=0.295, 0.675; p<0.001, respectively). The findings underscore the urgent need for targeted interventions- such as educational campaigns and policy measures - to reduce SSB consumption and promote healthier dietary habits among young adults in Kuwait.
Keywords:
Sugar-sweetened beverages
; Sugar content
; University students
; Awareness
; Disease risks
; Kuwait
1. Introduction
The increasing prevalence of obesity and non-communicable diseases (NCDs) poses a significant public health challenge worldwide, particularly in Kuwait. A major contributor to these conditions is the excessive consumption of sugar-sweetened beverages (SSBs), which include drinks sweetened with added sugars such as white or brown sugar, high-fructose corn syrup, dextrose, and others. These beverages include sodas, sports drinks, energy drinks, and sweetened iced teas. According to the Centers for Disease Control and Prevention, SSBs are a primary source of added sugars in the diet, providing empty calories that contribute to poor dietary quality and increased risk of health issues [1]. Research highlights a strong association between high SSB consumption and adverse health outcomes, such as obesity, type 2 diabetes, cardiovascular diseases, and tooth decay [2,3,4]. Unlike solid foods, liquid calories from SSBs are less satiating and are often not compensated for by reduced intake at subsequent meals, leading to an overall increase in daily caloric intake [5]. Additionally, sugar consumption has been linked to addictive behaviors, further exacerbating the overconsumption of SSBs [6].
Kuwait has one of the highest obesity rates globally, with approximately 80% of adults are classified as overweight or obese, and 23% diagnosed with type 2 diabetes [7,8]. Among adolescents, nearly 50% are overweight or obese [9], underscoring the urgency of addressing dietary habits, including SSB consumption. Reports indicate that 99% of the Kuwaiti population consumes at least one cup of carbonated beverages daily, often exceeding recommended sugar intake limits [10,11]. Despite extensive global research on SSB consumption, limited studies have quantified sugar intake from these beverages in Kuwait, particularly among university students.
University students are a key demographic for dietary interventions, as they establish lifelong eating habits during this stage of life. Understanding their SSB consumption patterns and awareness levels is crucial for designing targeted strategies to reduce intake and encourage healthier choices. This study aims to assess the prevalence and patterns of SSB consumption among Kuwait university students, quantify their daily sugar intake from these beverages, and evaluate their awareness of the associated health risks. By identifying demographic and behavioral factors influencing SSB consumption, the findings of the study can inform public health strategies to mitigate the rising burden of diet-related diseases in Kuwait.
2. Materials and Methods
2.1. Study Design and Population
This cross-sectional study was conducted at Kuwait University, targeting students aged 18 years and above. Data collection occurred between May and July 2022. Ethical approval for the study was obtained from the Ethical Review Committee at the College of Life Sciences, Kuwait University, under the code KU-CLS-22-04-17. Informed consent was obtained from all participants before survey administration. A total of 411 students from various colleges within Kuwait University participated in the study. The inclusion criteria were undergraduate and graduate students aged 18–35 years. Participants outside this age range or those who failed to complete at least 50% of the survey were excluded. The sample size was calculated as, n= z² pq /d², where Z= (1.96)², p=0.5, q=1-p = 0.5, d=(0.05)2 [12], resulting in a minimum required sample size of 385 participants.
2.2. Survey Instrument
Data were collected using a structured, self-administered online survey developed in English and translated into Arabic. The survey was pre-tested among a small group of students (n = 10) to ensure clarity and cultural appropriateness. Revisions were made based on feedback before the final administration. Participants voluntarily completed an online self-administered survey via Google Forms. The survey instrument, adopted from the School of Public Health at Harvard University [13] and the Department of Health Behavior at Roswell Park Cancer Institute [14], underwent necessary modifications to suit Kuwait's diverse student population. The survey included four sections: (1) demographic and anthropometric data (age, gender, height, weight, academic major, and monthly allowance); (2) frequency and types of SSB consumption; (3) awareness of SSB-related health risks (e.g., obesity, diabetes, cardiovascular diseases, and tooth decay); and (4) beverage preferences (natural unsweetened vs. sugar-sweetened fruit juices). Sugar intake from SSBs was estimated by asking participants to report their typical serving sizes and frequency of consumption for four beverage categories: regular soda, energy drinks, sports drinks, and sweetened iced tea. Sugar content per serving was determined based on nutrition labels of commonly available brands in Kuwait. Total daily sugar intake was calculated by multiplying the reported serving size and frequency of consumption by the sugar content.
2.3. Variables and Categorization
The primary exposure variables were frequency of SSB consumption and daily sugar intake, categorized as low (below the median) or high (above the median) based on Z-scores. The outcome variables included awareness of SSB-related health risks and preferences for unsweetened natural fruit juices. Demographic covariates included age (18–25 years and 26–35 years), gender, academic major (health sciences vs. non-health sciences), and monthly allowance (<50 KD, 50–100 KD, 101–200 KD, and >200 KD). BMI was calculated using self-reported height and weight and categorized as normal (≤25 kg/m²) or overweight/obese (>25 kg/m²).
2.4. Statistical Analysis
Data were analyzed using SPSS (version 28). Descriptive statistics (means, medians, frequencies, and percentages) were calculated for all variables. Chi-square tests assessed associations between SSB consumption frequency and demographic variables, as well as awareness of health risks. Logistic regression models estimated the odds ratios (ORs) for high sugar intake in relation to demographic and behavioral factors. Statistical significance was set at P< 0.05.
3. Results
3.1. Demographic and Anthropometric Characteristics
Out of the 411 participants, 81% were females and 19% were males. Approximately 76% of participants were aged between 18 and 25 years, with the remaining 24% in the 26–35 age group. The mean BMI of participants was 25.44 ± 6.88, classifying them as overweight on average. Males exhibited a higher mean BMI (28.73 ± 10.66) compared to females (24.63 ± 5.31). Most participants (61%) were enrolled in non-health science disciplines, while the remainder (39%) were in health-related fields. Monthly allowance distribution revealed that 48% of students received 101–200 KD (Table 1).
3.2. Frequency of SSB Consumption
Regular soda was the most frequently consumed SSB, with 72% of participants consuming it at least once per week. Energy drinks, sports drinks, and sweetened iced tea were less frequently consumed, with 28%, 11%, and 33% of participants consuming them weekly, respectively. Among those consuming regular soda, 32% reported drinking it daily or more (Table 2).
3.3. Associations between Frequency of SSB Consumption and the Sociodemographic Factors
Significant associations were observed between the frequency of SSB consumption and variables such as gender, age, and major field of study (Figure 1). Female students demonstrated higher SSB consumption compared to male students (χ2 = 2.35, p < 0.001). Students aged 18-25 consumed more SSBs than those in older age groups (χ2 = 4.01, p < 0.045). Additionally, students perusing non-health-related sciences reported greater SSB consumption than their peers in health-related sciences (χ2 = 2.35, p < 0.001), with a strong relationship noted between field of study and SSB consumption frequency (Cramer's V = 0.21). In contrast, no significant associations were observed between SSB consumption frequency and BMI (χ2 = 2.35, p = 0.26) or monthly allowance (χ2 = 2.35, p = 0.56).
3.4. Behavior Towards SSB Consumption and Awareness of Health Risks
Most students demonstrated a high level of awareness regarding the health risks associated with frequent SSB consumption (Figure 2). Specifically, 95.4% recognized the link between frequent SSB intake and an increased risk of obesity, while 93.7% acknowledged its role in the development of type 2 diabetes. Awareness was also notable for connections between SSB consumption and other health conditions, including heart disease (85.4%), kidney diseases (85.2%), and non-alcoholic liver disease (75.4%). Nearly all students (93.9%) understood the contribution of SSBs to tooth decay. However, fewer students demonstrated awareness of the sugar content in SSBs, with only 59% of students correctly identifying the sugar content in soft drinks.
3.5. Sugar Intake from SSBs
Because of eliminating some questionnaires with incomplete information on SSB portion size, the sugar intake was calculated for only 387 participants. The median daily sugar intake from regular soda was 38 g (IQR: 14–56 g), followed by energy drinks (11 g), sports drinks (10 g), and sweetened iced tea (5 g). Using Z-score statistics, participants were categorized into high and low sugar intake. Forty-one percent (n=160) participants were in the high intake category, while 58.4% (n=226) were in the low intake category (Table 3).
3.6. Associations Between Sugar Intake from SSBs and Gender, Age, BMI, Major Area of Study, Allowance Money, Awareness of Disease Risk, and Behavior Towards Sugary Drinks
The Chi-square test of independence revealed a significant association between grams of sugar intake from SSBs and the gender of students (χ2 = 14.25, p < 0.001), age (χ2 = 4.01, p < 0.04), and field of study (χ2 = 16.64, p < 0.000). Male students aged 18-25 years and students in non-health-related sciences had higher sugar consumption from SSBs. In contrast, no significant associations were found between the amount of sugar intake and students' monthly allowance money (χ2 = 2.05, p = 0.56) or BMI (χ2 = 1.48, p = 0.23) (Table 4A).
Significant associations were also identified between sugar intake and students' awareness of health risks. Students unaware of the link between SSB consumption and obesity risk consumed more sugar than those who were aware (χ² = 15.25, p < 0.000). A similar trend was observed regarding awareness of type 2 diabetes risk (χ² = 2.10, p < 0.02) and tooth decay risk (χ² = 4.25, p < 0.03). However, no significant associations were found with awareness of the risks of heart disease (χ² = 2.06, p = 0.15), kidney disease (χ² = 1.74, p = 0.19), or non-alcoholic fatty liver disease (χ² = 0.20, p = 0.65).
Furthermore, there was a significant association between sugar intake and students' awareness of the sugar content in soft drinks (χ² = 4.25, p < 0.048). Additionally, sugar intake was significantly associated with students' beverage preferences, with those favoring sweetened fruit juices consuming more sugar than those preferring unsweetened natural fruit juices (χ² = 14.88, p < 0.001) (Table 4B).
3.7. Regression Analysis of Sugar Intake from SSBs with Independent Variables and the Awareness of Disease Risk and Behavior Towards SSBs
Univariate logistic regression analysis revealed that students who were aware of the link between sugar consumption and obesity were approximately 86% less likely to consume high amounts of sugar from SSBs compared to those who lacked such awareness (OR=0.142, 95% CI=0.046, 0.435; p < 0.001). However, awareness of other health risks, including type 2 diabetes, heart disease, kidney disease, non-alcoholic fatty liver disease, and tooth decay, did not show significant associations with sugar intake. Students who correctly identified the sugar content of SSBs were about 35% less likely to consume excessive sugar from these beverages (p = 0.040). Likewise, those who preferred unsweetened fruit juices had a 55% lower likelihood of high sugar consumption from SSBs compared to those who preferred sweetened options (OR=0.447, 95% CI= 0.295, 0.675; p<0.001) (Table 5).
When adjusting for age, gender, and academic major in multinomial logistic regression, the association between obesity risk awareness and reduced sugar intake remained significant, though slightly weaker; students with such awareness were still about 83% less likely to consume high levels of sugar from SSBs (aOR = 0.167, 95% CI = 0.052, 0.563; p= 0.003). Awareness of sugar content remained influential, with knowledgeable students being 35% less likely to have high sugar intake (aOR= 0.653; 0.435, 0.890; p=0.040). Students who preferred unsweetened juices continued to show a 50% reduction in the likelihood of high sugar intake, even after adjusting for demographic factors. (aOR=0.498, 95%CI=0.323, 0.767; p=0.002). (Table 6).
4. Discussion
This study assessed SSB consumption among Kuwait University students, estimated their daily sugar intake from these beverages, and evaluated their awareness of the associated health risks. It also explored the relationship between sugar intake from SSBs and various factors, including BMI (or weight status), monthly allowance, academic major, health awareness, and SSB consumption behavior.
The findings reveal distinct consumption patterns, with regular soda emerging as the most frequently consumed SSB. Specifically, 42% of students reported drinking soda 5–6 times per week, while 32% consumed it daily or more than seven times weekly. In contrast, energy drinks, sports drinks, and sweetened iced teas were consumed less frequently, with 21%, 9%, and 13% of students, respectively, reporting intake of seven or more times per week. These results align with previous research identifying soda as a major source of added sugars among university students and other populations worldwide [15,16,17,18,19,20,21]. For instance, Malik et al. [21] reported daily SSB intake among 54% of adolescents across 53 countries, and similar prevalence has been documented in the Middle East and U.S. settings [18,22,23]. This high consumption rate reflects a broader global pattern and underscores the need for targeted strategies to reduce SSB intake during this formative life stage.
This study revealed that participants’ median daily sugar intake from regular soda was 38 g [IQR:14.04, 56.29], with 87% reporting regular consumption. This level exceeds the American Heart Association’s recommended daily limit for added sugar, which is 24 g for adult women and 36 g for men [24] and constitutes a substantial portion of the 50 g total daily limit recommended by the Dietary Guidelines for Americans 2020–2025 [25]. As such, little room remains for added sugars from other dietary sources like snacks and coffee beverages. These findings echo local estimates from The Medical City and SAMA Medical Services in Kuwait, which also reported high soda-related sugar intake [26]. However, unlike those surveys, this study observed lower sugar contributions from energy drinks (11.49 g), sports drinks (9.59 g), and iced tea (5.37 g), possibly due to differing consumption frequencies.
Interestingly, the relatively low energy drink consumption in this study may be influenced by the predominantly female sample, as male students are typically more frequent energy drink users [27,28]. These beverages are often marketed for their performance-enhancing effects and are popular among youth for staying alert during academic and social activities [29]. However, energy drinks often contain excessive caffeine and sugar, as well as additives such as taurine and ginseng, which can pose health risks including heart palpitations, insomnia, and digestive issues [30,31,32,33,34,35]. Public health messaging must therefore balance awareness of these risks with education on healthier alternatives.
Similarly, while sports drinks are designed to replenish electrolytes after physical exertion, their high sugar content raises health concerns [36]. In this study, sports drinks contributed approximately 13 g of sugar daily among high consumers. Prior research links overconsumption to obesity, metabolic disease, and oral health issues [35,37,38,39], suggesting these beverages should be consumed only during intense physical activity or under medical supervision [40].
Although black and green teas offer documented health benefits, these are often lost in commercial sweetened iced teas, which contain high levels of added sugars, artificial flavourings, and colourings [41,42,43]. Misconceptions about the healthfulness of iced teas may lead consumers to view them as better alternatives to soda, when in fact their sugar content is comparable. In the U.S., up to 80% of tea consumed in 2023 was sweetened iced tea [43], and similar patterns are seen in Kuwait, where such beverages often contain 19–26 g of added sugar per serving. In the current study, 33% of students reported weekly iced tea consumption, highlighting a need to correct public perception.
Sugar intake from SSBs in this study exceeded that reported in similar studies elsewhere. For example, research on college females at Saint John’s university, Minnesota, USA showed average added sugar intakes of 10–15 g per day [44], while studies in Ankara and China reported daily sugar intakes from SSBs ranging from 11.3 to 13.4 g [45,46]. This discrepancy underscores the elevated sugar burden among students in Kuwait.
Research on U.S. adults further contextualizes the issue: approximately 30% exceed the recommended limit of 10% of daily calories from added sugar, with average intakes of 68 g (17 teaspoons) per day [47,48]. These figures align with this study’s findings and emphasize the broader public health implications of high added sugar consumption.
A key finding in the current study was that students who preferred unsweetened natural fruit juices were 55% less likely to consume high levels of sugar from SSBs. This suggests that promoting healthier beverage preferences may be an effective strategy to reduce total sugar intake. The beverage industry has also responded to growing health concerns by implementing strategies such as direct sugar reduction, multi-sensory integration, and the use of sweeteners and enhancers [49]. These innovations could support broader interventions to shift consumption patterns among youth.
Gender and age also played important roles. While female students reported higher frequency of SSB intake, male students consumed greater overall quantities, suggesting larger portion sizes among males. This may reflect greater concern about body image among females, who might choose smaller portions despite frequent consumption, a hypothesis supported by previous research [50,51]. Age-related differences were also evident, with students aged 26–35 reporting significantly lower sugar intake than their younger peers, potentially reflecting growing health awareness with age.
Although some previous studies have identified a positive association between SSB consumption and obesity [14], no significant link was found in the current study. The mean BMI of participants was in the overweight range (25.44 ± 6.88), with females averaging a normal BMI (24.63 ± 5.31) and males averaging 28.73 ± 10.66, classifying them as overweight. The lack of an association may be due to self-reporting bias, metabolic variability, or unmeasured confounders.
The study revealed high levels of awareness about the health risks of SSBs: 95% of students acknowledged the risk of obesity, 94% recognized the link to type 2 diabetes and tooth decay, and more than 85% identified associations with heart, kidney, and liver diseases. Knowledge of sugar content was also associated with reduced sugar intake, echoing findings from earlier studies [14,20,52,53,54].
However, although awareness was inversely associated with SSB intake, the direction of causality remains unclear. While greater awareness may influence consumption behaviour, it is also possible that health-conscious individuals are more likely to seek out such information. Moreover, awareness alone may not always lead to behavioural change, especially when convenience, taste, affordability, or social norms come into play. For example, students may continue to consume SSBs despite knowing the risks if healthier alternatives are unavailable or less appealing. The cross-sectional nature of this study limits causal inference, and future longitudinal or intervention-based studies are needed to clarify whether awareness truly drives behaviour change or is a marker of other underlying influences.
The study also found that students from non-health disciplines had significantly higher SSB consumption and sugar intake than those in health-related majors. This finding is consistent with previous research showing lower SSB intake among students in healthcare fields, likely due to their greater exposure to nutrition education [13,16]. The pattern underscores the importance of incorporating basic nutritional awareness into curricula across all academic disciplines, not just health sciences.
These findings highlight the critical role of early education and awareness in shaping dietary behaviours. Educational campaigns targeting university students, particularly those outside health-related fields, could help reduce sugar consumption and mitigate risks of obesity, type 2 diabetes, and other non-communicable diseases. Integrating nutrition education into school curricula and promoting access to healthier beverage options are essential steps toward improving dietary habits in this key population.
4.1. Strengths and Limitations
This study is the first to examine SSB consumption and related awareness among university students in Kuwait, providing a valuable contribution to the public health literature in this population. By quantifying sugar intake from SSBs rather than relying solely on frequency measures, the study offers a more detailed and nuanced understanding of consumption patterns. Additionally, it evaluates students' awareness of the health risks associated with SSB intake, addressing a critical gap in existing research. The inclusion of students from various colleges within Kuwait University enhances the diversity of the sample, thereby improving the generalizability of the findings to the wider student population. Despite these strengths, certain limitations must be acknowledged. The cross-sectional design restricts the ability to infer causality between awareness and SSB consumption. Longitudinal or intervention-based studies would be better suited to explore the temporal sequence and causal relationships between knowledge and behavior. Moreover, reliance on self-reported data may introduce social desirability and recall bias, potentially leading to underestimation or overestimation of SSB intake. Additionally, while the study focused on university students, expanding future research to encompass other demographic groups, including younger adolescents and older adults, would provide a more comprehensive understanding of SSB consumption across age and socioeconomic strata. Such broader insight would support the development of more targeted and inclusive public health strategies.
4.2. Implications for Public Health and Future Research Prospects:
There is a clear and urgent need for educational campaigns that raise awareness about the sugar content of SSBs and their associated health risks. Integrating these campaigns into university programs offers a strategic opportunity to reach young adults, a demographic critical for establishing lifelong dietary habits. Promoting healthier beverage alternatives, particularly natural and unsweetened options, could contribute meaningfully to reducing SSB intake in this population. Future research should prioritize the development and evaluation of intervention strategies specifically tailored to university settings. Particular attention should be given to students in non-health disciplines, who were shown to have higher levels of sugar intake. In addition, further investigations should explore the broader contextual and psychosocial factors contributing to high SSB consumption among young adults. These may include social influences, cultural norms, marketing exposure, taste preferences, and availability of healthier alternatives. Understanding these factors will be essential for designing multifaceted interventions that are both effective and sustainable.
5. Conclusions
This study highlights the high levels of sugar intake from SSBs among university students in Kuwait and underscores the pivotal role of health awareness in shaping dietary choices. The findings lay the groundwork for future research and targeted interventions aimed at reducing SSB consumption and promoting healthier eating behaviors among young adults. Enhancing awareness of the health risks associated with SSBs can serve as a catalyst for behavioral change and inform the design of public health initiatives. Addressing existing knowledge gaps and examining the underlying factors that influence SSB consumption will be crucial for the development of effective public health strategies. In face of Kuwait’s rising obesity prevalence, targeted efforts to curb SSB intake should form a central pillar of national strategies to combat diet-related non-communicable diseases.
Supplementary Materials
The following supporting information can be downloaded at the website of this paper posted on Preprints.org, Table S1 provides supporting data about the sugar content of the SSBs available in Kuwaiti market.
Author Contributions
H.M. and J.S: Conceptualization, Methodology; H.M.: Investigation, Analyses, Original draft; T.A.Z and J.S: Supervision, Project administration; T.A.Z and D.U.Z.Alk: Revising analysis, Results interpretation, Reviewing and Editing; H.A: Visualization. All authors have read and agreed to publish the manuscript in ‘Nutrients’.
Funding
This research was not funded by any institution.
Institutional Review Board Statement
Ethical approval was granted by the ‘Ethics Review Committee’ of the College of Life Sciences of Kuwait University.
Informed Consent Statement
The survey participants signed a consent form before filling in the questionnaire.
Data Availability Statement
The original data is presented in the article. The supplementary data is provided in Table S1. Further inquiries may be directed to the corresponding author.
Conflicts of Interest
The authors declare no conflicts of interest.
References
- Centers for Disease Control and Prevention. Get the Facts: Sugar-Sweetened Beverages and Consumption; CDC: Atlanta, GA, USA, 2021. Available online: https://www.cdc.gov/nutrition/data-statistics/sugar-sweetened-beverages-intake.html (accessed on February 20, 2022).
- Calcaterra, V.; Cena, H.; Magenes, V.C.; Vincenti, A.; Comola, G.; Beretta, A.; Di Napoli, I.; Zuccotti, G. Sugar-Sweetened Beverages and Metabolic Risk in Children and Adolescents with Obesity: A Narrative Review. Nutrients 2023, 15, 702. [CrossRef]
- Malik, V. S., & Hu, F. B. . The role of sugar-sweetened beverages in the global epidemics of obesity and chronic diseases. Nature Reviews Endocrinology. 2022, 18(4), 205–218. [CrossRef]
- Vartanian, L. R., Schwartz, M. B., & Brownell, K. D. . Effects of soft drink consumption on nutrition and health: A systematic review and meta-analysis. American Journal of Public Health. 2007, 97(4), 667–675. [CrossRef]
- DiMeglio, D.P.; Mattes, R.D. Liquid versus Solid Carbohydrate: Effects on Food Intake and Body Weight. Int. J. Obes. 2000, 24, 794–800. [CrossRef]
- DiNicolantonio, J. J., O'Keefe, J. H., & Wilson, W. L. . Sugar addiction: Is it real? A narrative review. British Journal of Sports Medicine. 2018, 52(14), 910–913. [CrossRef]
- Weiderpass, E., Botteri, E., Longenecker, J. C., Alkandari, A., Al-Wotayan, R., Al Duwairi, Q., & Tuomilehto, J. The prevalence of overweight and obesity in an adult Kuwaiti population in 2014. Frontiers in Endocrinology. 2019, 10, 449. [CrossRef]
- Alkandari, A.; Al Arouj, M.; Elkum, N.; Sharma, P.; Devarajan, S.; Abu-Farha, M.; Al-Mulla, F.; Tuomilehto, J.; Bennakhi, A. Adult Diabetes and Prediabetes Prevalence in Kuwait: Data from the Cross-Sectional Kuwait Diabetes Epidemiology Program. J. Clin. Med. 2020, 9, 3420. [CrossRef]
- Al-Haifi, A.R.; Al-Awadhi, B.A.; Al-Dashti, Y.A.; Aljazzaf, B.H.; Allafi, A.R.; Al-Mannai, M.A.; Al-Hazzaa, H.M. Prevalence of Overweight and Obesity among Kuwaiti Adolescents and the Perception of Body Weight by Parents or Friends. PLoS One 2022, 17, e0262101. [CrossRef]
- Al-Nesf, Y.; Kamel, M.; El-Shazly, M.K.; Makboul, G.M.; Sadek, A.A.; El-Sayed, A.M.; El-Fararji, A. Kuwait STEPS 2006. Kuwait Ministry of Health, GCC, WHO 2006.
- Alhareky, M.; Goodson, J.M.; Tavares, M.; Hartman, M.-L. Beverage Consumption and Obesity in Kuwaiti School Children. Front. Endocrinol. 2024, 14, 1174299. [CrossRef]
- Daniel, W.W.; Cross, C.L. Biostatistics: A Foundation for Analysis in the Health Sciences, 10th ed.; Wiley: Hoboken, NJ, USA. 2019. Available online: https://view.publitas.com/uicneuro/neus444biostats/page/1.
- Nurses’ Health Study. 2019. Retrieved February 20, 2022, from https://nurseshealthstudy.org/sites/default/files/questionnaires/2019%20long.pdf.
- Rivard, C., Smith, D., McCann, S., & Hyland, A. Taxing sugar-sweetened beverages: A survey of knowledge, attitudes, and behaviors. Public Health Nutrition. 2012, 15(8), 1355-1361. [CrossRef]
- West, D. S., Bursac, Z., Quimby, D., Prewitt, T. E., Spatz, T., Nash, C., Mays, G., & Eddings, K. Self-reported sugar-sweetened beverage intake among college students. Obesity (Silver Spring, Md.). 2006, 14(10), 1825–1831. [CrossRef]
- Hoffman, E. Sugar-sweetened beverage intake among college students: A social-ecological model (Unpublished thesis dissertation). 2013, Ohio State University, USA.
- Bipasha, M.S.; Raisa, T.S.; Goon, S. Sugar-Sweetened Beverages Consumption among University Students of Bangladesh. Int. J. Public Health Sci. 2017, 6, 157–163. [CrossRef]
- Otaibi, H. H. A., & Kamel, S. M. Health-risk behaviors associated with sugar-sweetened beverage consumption among Saudi young adults. Biomedical Research. 2017, 28 (19), 8484-8491. https://www.alliedacademies.org/articles/healthrisk-behaviors-associated-with-sugarsweetened-beverage-consumption-among-saudi-young-adults-8644.html.
- Otaibi, H. H. Sugar-sweetened beverage consumption behavior and knowledge among university students in Saudi Arabia. Journal of Economics and Business Management. 2017, 5(4), 173–176. [CrossRef]
- Harguth, A. An assessment of knowledge, behavior, and consumption patterns surrounding sugar-sweetened beverages among young adults. 2020, (Unpublished thesis dissertation). Minnesota State University, USA.
- Malik, V. S., Pan, A., Willett, W. C., & Hu, F. B. Sugar-sweetened beverages and weight gain in children and adults: A systematic review and meta-analysis. The American Journal of Clinical Nutrition 2013, 98(4), 1084–1102. [CrossRef]
- Lara-Castor, L., Micha, R., Cudhea, F., Miller, V., Shi, P., Zhang, J., Sharib, J. R., Erndt-Marino, J. E., Cash, S. B., Barquera, S., & Mozaffarian, D. Intake of sugar-sweetened beverages among children and adolescents in 185 countries between 1990 and 2018: Population-based study. BMJ, 2024, 386, e079234. [CrossRef]
- Rosinger, A., Herrick, K., Gahche, J., & Park, S. Sugar-sweetened beverage consumption among U.S. youth, 2011-2014. NCHS Data Brief (271), 2017, 1–8.
- American Heart Association. Sugar 101. Retrieved December 16, 2023, from https://www.heart.org/en/healthy-living/healthy-eating/eat-smart/sugar/sugar-101.
- U.S. Department of Health and Human Services & U.S. Department of Agriculture. 2020–2025 Dietary Guidelines for Americans (9th ed.). 2020, Retrieved December 17, 2023, from https://www.dietaryguidelines.gov/sites/default/files/2020-12/Dietary_Guidelines_for_Americans_2020-2025.
- Arab Times Kuwait. Eating Habits Make Kuwaitis Prone to Very High Sugar Intake. April 21, 2016.
- Alsunni, A.A. Energy Drink Consumption: Beneficial and Adverse Health Effects. Int. J. Health Sci. 2015, 9, 468. [CrossRef]
- Asaad, Y.A. Energy Drinks Consumption in Erbil City: A Population-Based Study. Zanco J. Med. Sci. 2017, 21, 1680–1687. [CrossRef]
- Ghozayel, M., Ghaddar, A., Farhat, G., Nasreddine, L., Kara, J., & Jomaa, L. Energy drinks consumption and perceptions among university students in Beirut, Lebanon: A mixed methods approach. PLOS ONE, 2020, 15(4), e0232199. [CrossRef]
- Malinauskas, B. M., Aeby, V. G., Overton, R. F., Carpenter-Aeby, T., & Barber-Heidal, K. A survey of energy drink consumption patterns among college students. Nutrition Journal, 2007. 6, 35. [CrossRef]
- Trapp, G. S., Allen, K. L., O'Sullivan, T., Robinson, M., Jacoby, P., & Oddy, W. H. Energy drink consumption among young Australian adults: Associations with alcohol and illicit drug use. Drug and Alcohol Dependence, 2014, 134, 30–37. [CrossRef]
- Azagba, S., Langille, D., & Asbridge, M. An emerging adolescent health risk: Caffeinated energy drink consumption patterns among high school students. Preventive Medicine, 2014, 62, 54–59. [CrossRef]
- Alsunni, A.A.; Badar, A. Energy Drinks Consumption Pattern, Perceived Benefits, and Associated Adverse Effects amongst Students at University of Dammam, Saudi Arabia. J. Ayub Med. Coll. Abbottabad, 2011, 23, 3–9.
- Itany, M., Diab, B., Rachidi, S., Awada, S., Al Hajje, A., Bawab, W., et al. Consumption of energy drinks among Lebanese youth: A pilot study on the prevalence and side effects. International Journal of High Risk Behaviors and Addiction, 2014, 3(3), e18857. [CrossRef]
- Jacob, S., Tambawel, J., Trooshi, F. M., & Alkhoury, Y. Consumption pattern of nutritional health drinks and energy drinks among university students in Ajman, UAE. Gulf Medical Journal, 2013, 2(1), 22–26.
- Muñoz-Urtubia, N., Vega-Muñoz, A., Estrada-Muñoz, C., Salazar-Sepúlveda, G., Contreras-Barraza, N., & Castillo, D. Healthy behavior and sports drinks: A systematic review. Nutrients, 2023, 15, 2915. [CrossRef]
- Malik, V. S., Popkin, B. M., Bray, G. A., Després, J. P., Willett, W. C., & Hu, F. B. Sugar-sweetened beverages and risk of metabolic syndrome and type 2 diabetes: A meta-analysis. Diabetes Care, 2010, 33, 2477–2483.
- Malik, V. S. Sugar-sweetened beverages and cardiometabolic health. Current Opinion in Cardiology, 2017, 32, 572–579.
- Beck, A.L.; Martinez, S.; Patel, A.I.; Fernandez, A. Trends in Sugar-Sweetened Beverage Consumption among California Children. Public Health Nutr. 2020, 23, 2864–2869.
- Muñoz, V. C., Rovira, M. U., Ibáñez, V. V., Domínguez, J. M. M., Blanco, G. R., Rovira, M. U., & Toran, P. Consumption of soft, sports, and energy drinks in adolescents: The BEENIS study. Anales de Pediatría, 2020, 93, 242–250.
- Khan, N., & Mukhtar, H. Tea and health: Studies in humans. Current Pharmaceutical Design, 2013, 19 (34), 6141–6147. [CrossRef]
- Gordon, B. The health benefits of tea. Eat Right. The Academy of Nutrition and Dietetics. 2022. Retrieved December 2024 from https://www.eatright.org.
- Tea Association of the U.S.A., Inc. (n.d.). Retrieved from https://worldteadirectory.com/item/tea-association-u-s-a-inc/ Accessed –.
- Stangl, S. F. Food addiction and added sugar consumption in college-aged females. Celebrating Scholarship & Creativity Day, 2015. 47. Retrieved from https://digitalcommons.csbsju.edu/elce_cscday/47.
- Meriç, Ç., Yabanci, N., & Yılmaz, H. Evaluation of added sugar and sugar-sweetened beverage consumption by university students. Kesmas National Public Health, 2021, 16, 9–15. [CrossRef]
- Li, D., Yu, D., & Zhao, L. Trend of sugar-sweetened beverage consumption and intake of added sugar in China's nine provinces among adults. Journal of Hygiene Research, 2014, 43(1), 70–72.
- Lee, S. H., Zhao, L., Park, S., Moore, L. V., Hamner, H. C., Galuska, D. A., & Blanck, H. M. High added sugars intake among US adults: Characteristics, eating occasions, and top sources, 2015–2018. Nutrients, 2023, 15(2), 265. [CrossRef]
- Johnson, R. K., Appel, L. J., Brands, M., Howard, B. V., Lefevre, M., Lustig, R. H., Sacks, F., Steffen, L. M., Wylie-Rosett, J., & American Heart Association Nutrition Committee of the Council on Nutrition, Physical Activity, and Metabolism and the Council on Epidemiology and Prevention. Dietary sugars intake and cardiovascular health: A scientific statement from the American Heart Association. Circulation, 2009, 120(11), 1011–1020. [CrossRef]
- Chen, L.; Wu, W.; Zhang, N.; Bak, K.H.; Zhang, Y.; Fu, Y. Sugar Reduction in Beverages: Current Trends and New Perspectives from Sensory and Health Viewpoints. Food Res. Int. 2022, 162, 112076. [CrossRef]
- Alkazemi, D.; Zafar, T.A.; Ebrahim, M.; Kubow, S. Distorted Weight Perception Correlates with Disordered Eating Attitudes in Kuwaiti College Women. Int. J. Eat. Disord. 2018, 51, 449–458. [CrossRef]
- Göbel, P.; & Dogan, H. Evaluation of eating attitudes, nutritional status, and anthropometric measurements of women who exercise: The case of Karabük. Black Sea Journal of Health Science, 2023, 6(2), 224–232. [CrossRef]
- Park, S.; Lee, S. H.; Merlo, C.; & Blanck, H. M. Associations between knowledge of health risks and sugar-sweetened beverage intake among US adolescents. Nutrients, 2023, 15(10), 2408. [CrossRef]
- Miller, C.; Dono, J.; Scully, M.; Morley, B.; & Ettridge, K. Adolescents' knowledge and beliefs regarding health risks of soda and diet soda consumption. Public Health Nutrition, 2022, 25(11), 3044–3053. [CrossRef]
- Park, S., Onufrak, S.; Sherry, B.; & Blanck, H. M. The relationship between health-related knowledge and sugar-sweetened beverage intake among US adults. Journal of the Academy of Nutrition and Dietetics, 2014, 114(7), 1059–1066. [CrossRef]
Figure 1.
Frequency of the SSB intake among gender, age, BMI, major field of study, and allowance money.
Figure 1.
Frequency of the SSB intake among gender, age, BMI, major field of study, and allowance money.
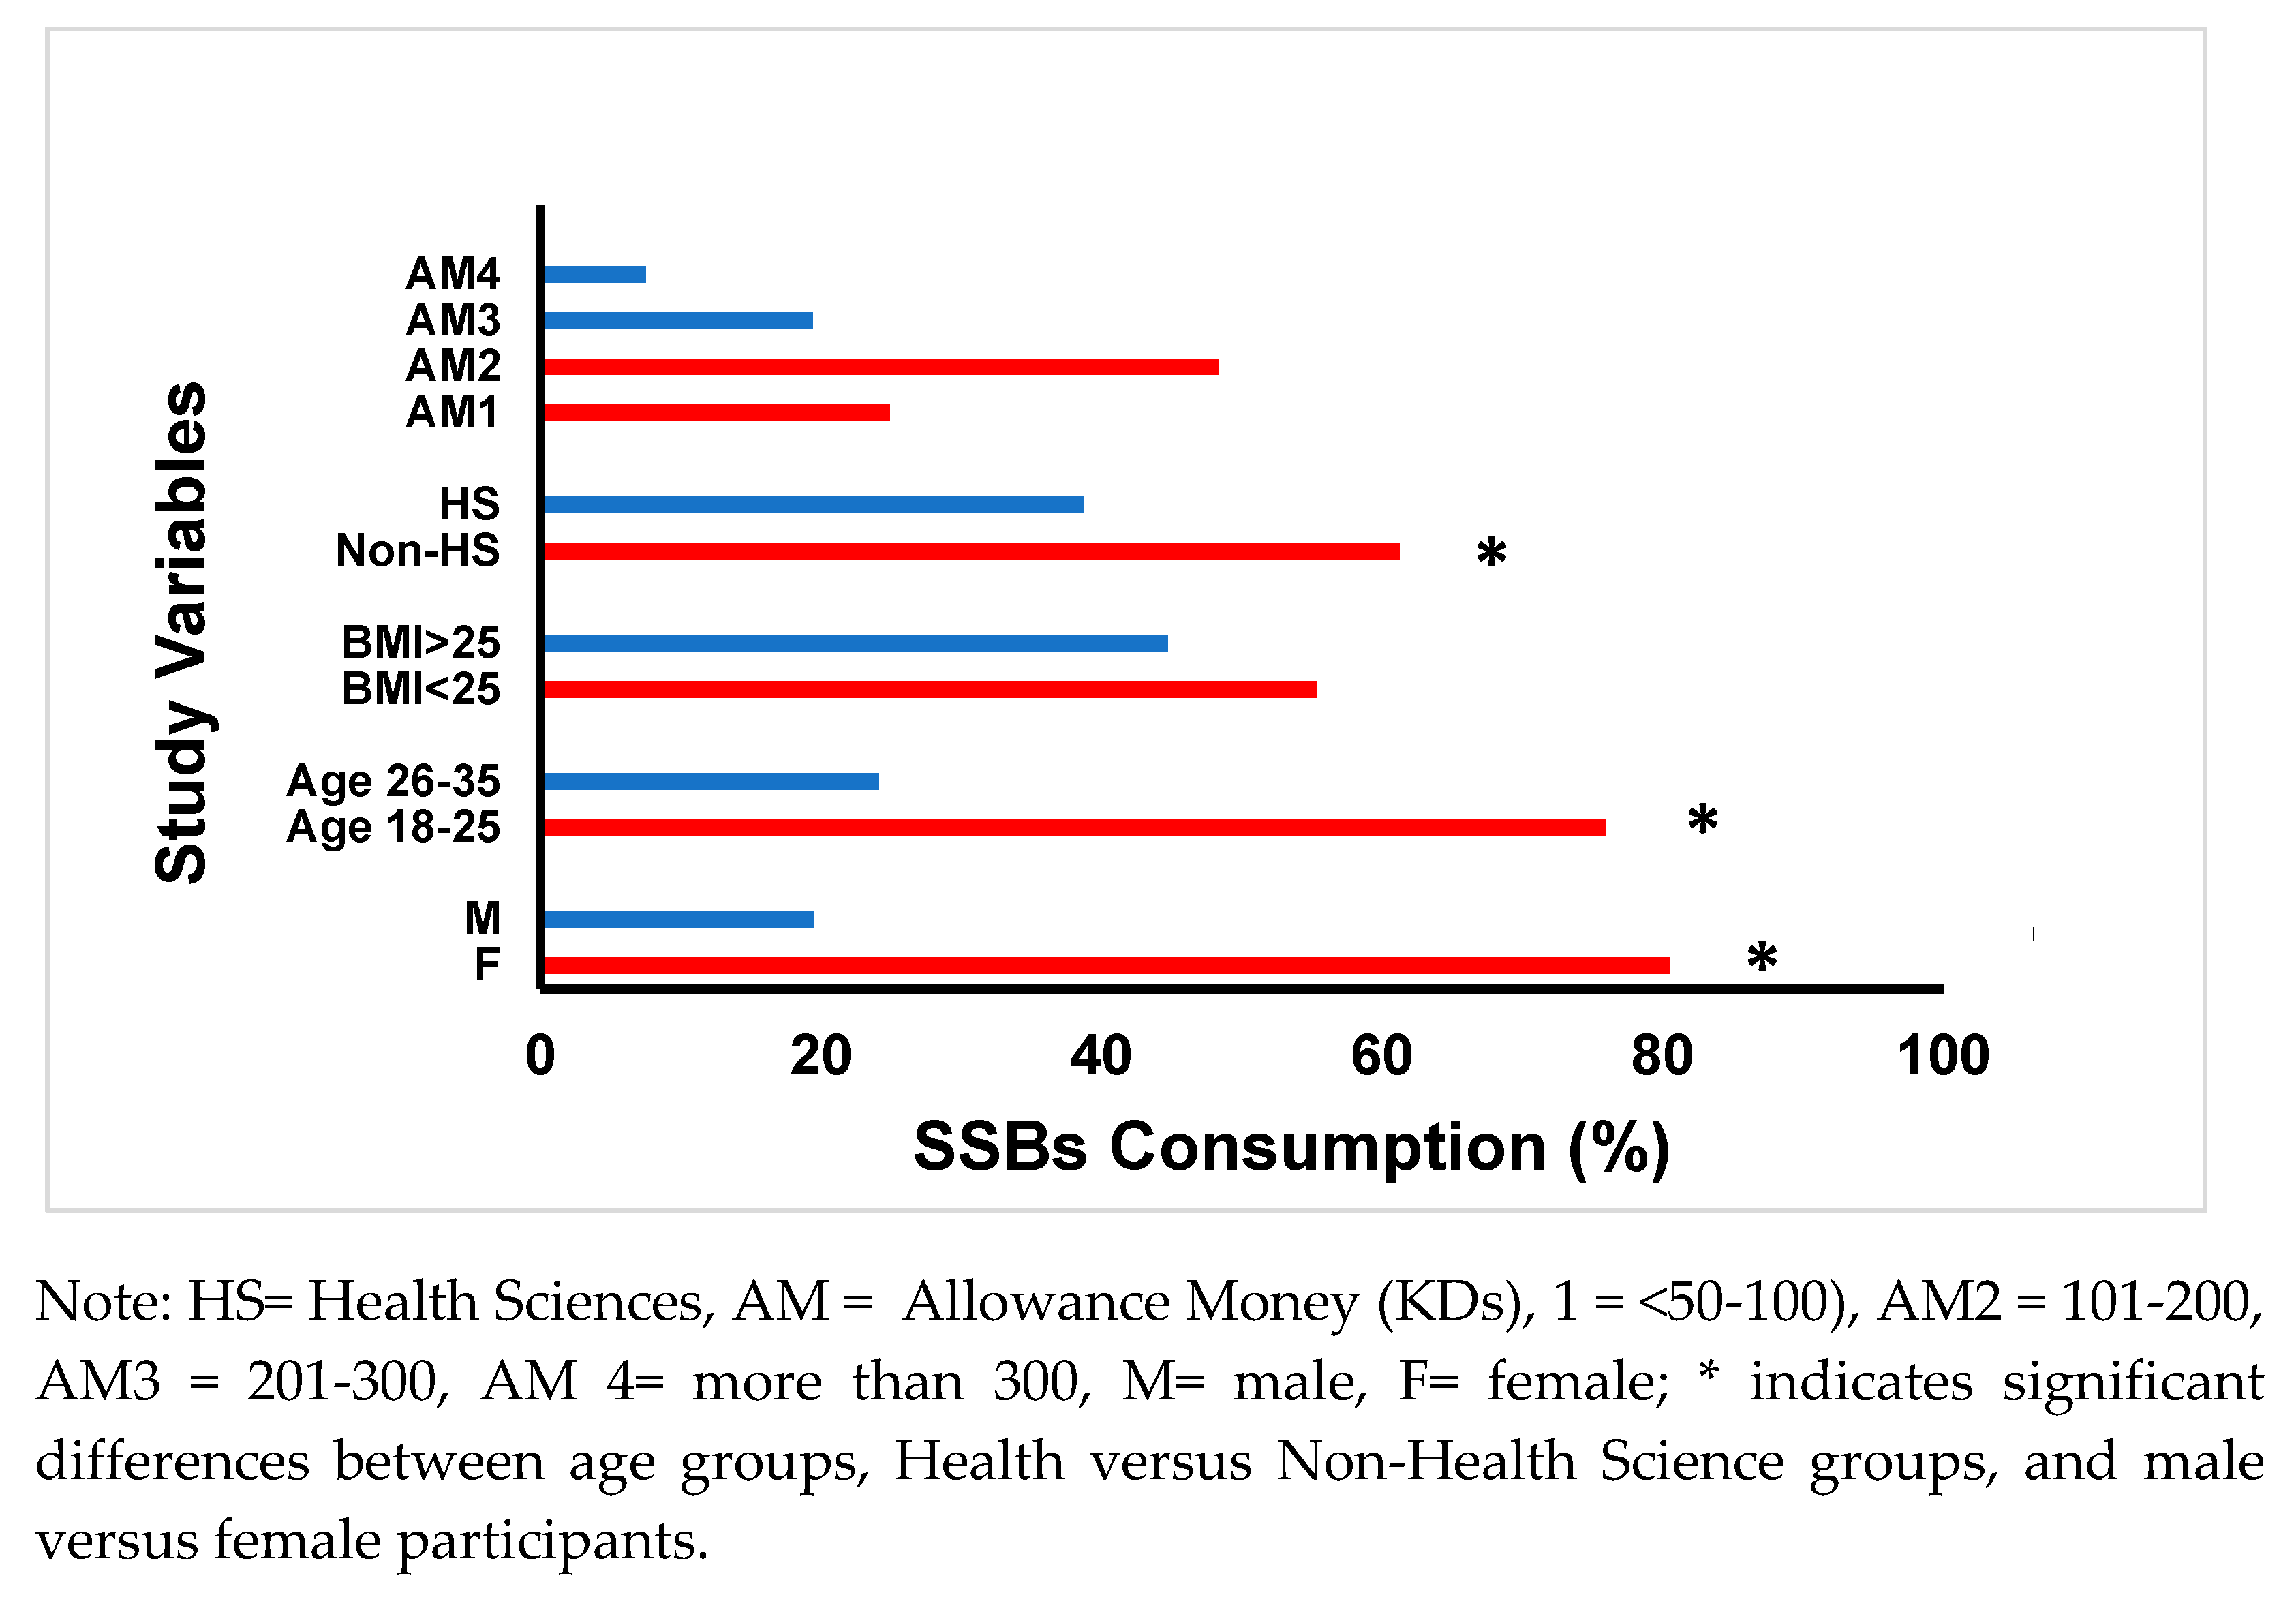
Figure 2.
Students’ Awareness of SSBs sugar content and the related disease risks.
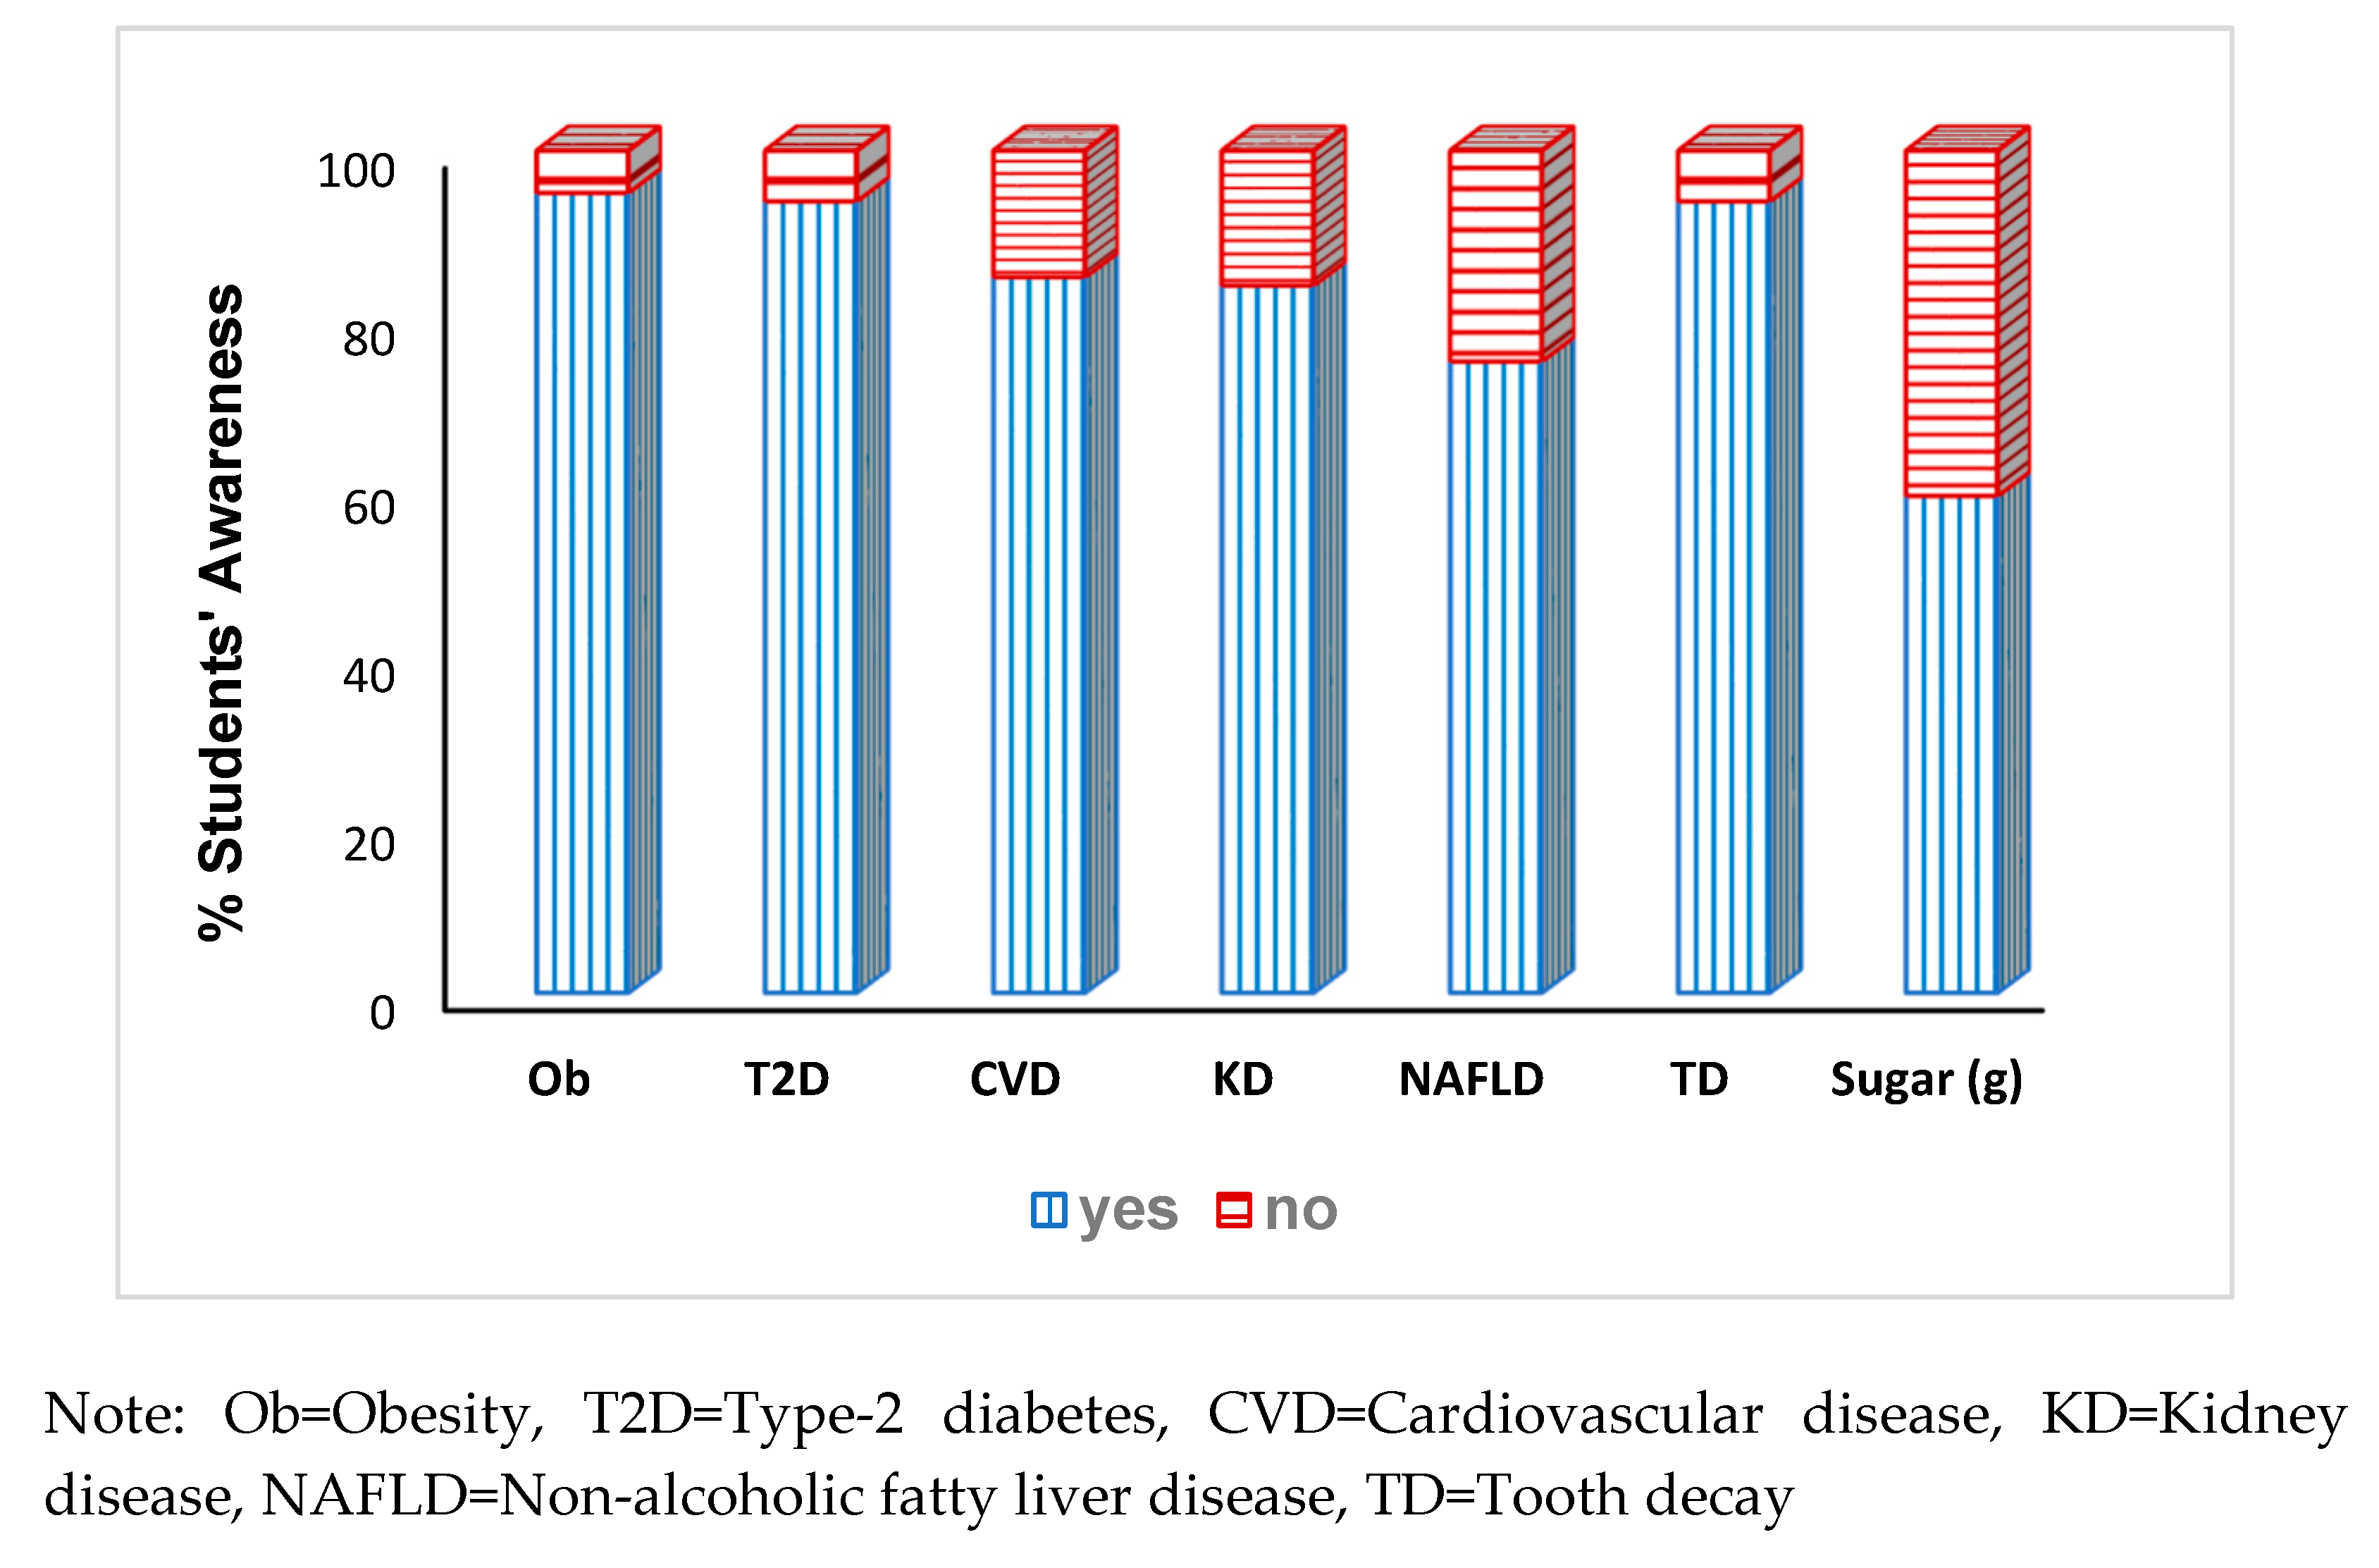

Table 1.
Demographic characteristics of the study participants.
|
Variables |
Female n=331 (81%) |
Male n=80 (19%) |
Total n=411 (100%) |
|---|---|---|---|
|
Age n (%) 18-25 26-35 |
262 (79.2) 69 (20.8) |
50 (62.5) 30 (37.5) |
312 (75.9) 99 (24.1) |
|
Anthropometrics mean ± SD Height a, cm Weight,b kg BMI,c kg/m2 |
158.75 ± 8.42 62.13 ± 14.99 24.63 ± 5.31 |
174.34 ± 6.67 87.02 ± 30.69 28.73 ± 10.66 |
161.80 ± 10.19 66.99 ± 21.45 25.44 ± 6.88 |
|
Study Major, n (%) Health Sciences Non-Health Sciences |
147 (44.4) 184 (55.6) |
12 (15.0) 68 (85.0) |
159 (38.7) 252 (61.3) |
|
Allowance money, d n (%) < 50-100 KD 101-200 KD 201-300 KD 301 KD and more |
82 (25.2) 167 (51.2) 54 (16.6) 23 (7.1) |
18 (23.7) 27 (35.5) 24 (31.6) 7 (9.2) |
100 (24.9) 194 (48.3) 78 (19.4) 30 (7.5) |
|
BMI e (kg/m2 ) n (%) ≤ 25 >25 |
194 (59.0) 135 (41.0) |
32 (40.0) 48 (60.0) |
226 (55.3) 183 (44.7) |
Missing date: a n=2, b n=1, c n=2, d n=9, and e n=2.
Table 2.
SSB consumption frequency by SSB type.
| SSBs | ≤1/month n (%) |
≤1/week n (%) |
2-4 /week n (%) |
5-6 /week n (%) |
≥7/week n (%) | Total n (%) | Total n (%) |
||
|---|---|---|---|---|---|---|---|---|---|
| Non-Consumers* |
Consumers** |
||||||||
| Regular Sodaa | 115 (28) | 102 (35) | 66 (23) | 29 (10) | 92 (32) | 289 (71.5) | 404 (98.3) | ||
| Energy Drinksb | 291 (72) | 67 (58) | 20 (17) | 5 (4) | 23 (21) | 115 (28.3) | 406 (98.8) | ||
| Sports Drinksc | 359 (89) | 26 (60) | 9 (21) | 4 (10) | 4 (9) | 43 (10.7) | 402 (97.8) | ||
| Sweetened Iced Tea d | 273 (67) | 83 (61) | 26 (19) | 9 (7) | 17 (13) | 135 (33.1) | 408 (99.3) | ||
*Non-consumers are the participants who may consume SSBs once or less in a month. The percentage is calculated based on the total sample of the specific SSB. ** SSB consumers = n (%) calculated based on the total sample minus the non-consumers of the specific SSB. Missing data for each SSB: a n=7, b n=5, c n=9, d n=3.
Table 3.
Daily sugar consumed (g) from SSB type and Z- scores of low sugar intake versus high sugar intake (n=387).
Table 3.
Daily sugar consumed (g) from SSB type and Z- scores of low sugar intake versus high sugar intake (n=387).
| Daily Sugar Consumed (g) by SSB Type | ||
| SSB (n, %) | Median |
IQR [25%, 75%] |
| Regular Soda (337, 87) | 38.10 | [14.04, 56.29] |
| Energy Drinks (164, 42.4) | 11.49 | [4.66, 15.47] |
| Sports Drinks (66, 16.9) | 9.59 | [4.26, 13.66] |
| Sweet Iced Tea (192, 49.7) | 5.37 | [3.71, 6.46] |
| Daily Total Sugar Intake (Z-Scores) | ||
| High intake (n=160, 41.6%) | 0.70 | [0.38, 1.36] |
| Low intake (n=226, 58.4%) | -0.58 | [-0.87, -0.32] |
| Z-Score from all SSBs (n=387, 100%) | -0.24 | [-0.68, 0.48] |
Table 4.
Associations of Sugar Intake from SSBs with Demographic Variables, Awareness of Sugar Content, Disease Risk, and Preference for Natural Juices. (A): Associations of sugar intake from SSBs with demographic variables. (B): Associations of Sugar Intake from the SSBs with Disease Risk Variables
| (A) | |||
| Variables | Low intake | High intake | χ2, P, Cramer’s V |
| Gender, n (%) |
14.25, <0.001, 0.19 |
||
| Females | 218 (68.3) | 101 (31.7) | |
| Males | 30 (44.1) | 38 (55.9) | |
|
Age (years), n (%) 18-25 26-35 |
183 (61.0) 65 (74.7) |
117 (39.0) 22 (25.3) |
4.01, <0.04, 0.04 |
|
BMI (kg/m2), n (%) ≤ 25 >25 |
143(66.8) 104 (60.8) |
71(33.2) 69 (39.2) |
1.48, 0.23, 0.06 |
|
Study Major, n (%) Health Sciences Non-Health Sciences |
114 (77.6) 134 (55.8) |
33 (22.4) 106 (44.2) |
16.64, <0.001,0.21 |
|
AM a, KD b, n (%) < 50-100 101-200 200-300 301 and above |
62 (70.5) 115(63.2) 39 (59.1) 13 (72.2) |
26 (29.5) 67 (36.8) 27 (40.9) 5 (27.8) |
2.05, 0.56, 0.07 |
| (B) | |||
| Variables | Low Intake | High Intake | χ2, P, Cramer’s V |
|
Obesity, n (%) Yes No |
238 (63.5) 5 (41.7) |
137 (36.5) 7 (58.3) |
15.27, <0.001, 0.184 |
|
Type 2 Diabetea, n (%) Yes No |
234 (62.9) 6 (40.0) |
138 (37.1) 9 (60.0) |
2.10, 0.020, 0.124 |
|
CardiovasculaDiseases n (%) Yes No |
211 (62.2) 28 (58.3) |
128 (37.8) 20 (41.7) |
2.06, 0.563, 0.033 |
|
Kidney Diseases n (%) Yes No |
211 (63.0) 31 (59.6) |
124 (37.0) 21 (40.4) |
1.74, 0.532, 0.050 |
|
NAFLD c, n (%) Yes No |
185 (62.2) 54 (60.7) |
113 (37.9) 35 (39.3) |
0.20, 0.532, 0.018 |
|
Tooth Decay, n (%) Yes No |
235 (63.2) 5 (33.3) |
137 (36.8) 10 (66.7) |
4.25, 0.03, 0.134 |
|
Aware of Sugar Content of SSBs, n (%) Yes No |
157 (68.3) 90 (57.3) |
73 (31.7) 67 (42.7) |
4.25, 0.048, 0.039 |
|
Preference for Unsweetened Juices, n (%) Yes No |
167 (69.0) 73 (50.3) |
75 (31.0) 72 (49.7) |
14.88, <0.001, 0.192 |
aAllowance Money, bKuwaiti Dinar, cNon Alcoholic Fatty Liver Disease.
Table 5.
Univariate logistic regression analysis with the binary dependent variable: low versus high sugar consumption from SSBs.
Table 5.
Univariate logistic regression analysis with the binary dependent variable: low versus high sugar consumption from SSBs.
| Dependent Variable, High sugar from SSBs =1 |
B | S.E. | Wald | df | Sig. | Exp (B) | 95% CL Lower Upper |
Nagelkerke R Square |
|---|---|---|---|---|---|---|---|---|
| Can frequent intake of SSBs increase the risk of obesity? | -1.95 | .57 | 11.65 | 1 | <.001 | .142 | 0.046 0.435 |
.144 |
| Can frequent intake of SSBs increase the risk of T2DM? | .39 | .55 | .49 | 1 | .486 | 1.470 | 0.497 4.351 |
. 022 |
| Can frequent intake of SSBs increase the risk of CVD? | -.05 | .35 | .02 | 1 | .883 | .949 | 0.477 1.892 |
.012 |
| Can frequent intake of SSBs increase the risk of KD? | -.19 | .36 | .26 | 1 | .608 | .830 | 0.408 1.691 |
.001 |
| Can frequent intake of SSBs increase the risk of NAFLD? | .27 | .29 | .85 | 1 | .357 | 1.304 | 0.741 2.293 |
.007 |
| Can frequent intake of SSBs increase the risk of TD? | -.54 | .47 | 1.34 | 1 | .247 | .580 | 0.231 1.458 |
.013 |
| Do you know how much sugar is in SSBs? | -.43 | .21 | 4.23 | 1 | .040 | .653 | 0.435 0.980 |
.106 |
| Do you prefer sweetened fruit juices? | -.81 | .22 | 14.63 | 1 | <.001 | .447 | 0.295 0.675 |
.143 |
Awareness of disease risks, awareness of sugar content of SSBs, and the preference for sweetened fruit juices are dichotomous questions with options of ‘No, Yes’, No = Reference. T2DM = Type 2 Diabetes Mellitus, CVD = Cardiovascular Diseases, KD = Kidney Disease, NAFLD = Non-Alcoholic Fatty Liver Disease, TD = Tooth Decay.
Table 6.
Multinomial logistic regression analysis with the binary dependent variable: low versus high sugar consumption from SSBs.
Table 6.
Multinomial logistic regression analysis with the binary dependent variable: low versus high sugar consumption from SSBs.
| Dependent Variable: High sugar from SSBs =1 |
B | S.E. | Wald | df | Sig. | Exp (B) | 95% CL Lower Upper |
Nagelkerke R Square |
|---|---|---|---|---|---|---|---|---|
| Can frequent intake of SSBs increase of risk of obesity? | -1.79 | .59 | 9.06 | 1 | .003 | .167 | 0.052 0.536 |
.144 |
| Age =1 | -.78 | .27 | 8.07 | 1 | .005 | .460 | 0.269 0.786 |
|
| Gender =1 | .87 | .28 | 9.95 | 1 | .002 | 2.378 | 1.388 4.074 |
|
| Non-health Sciences = 1 | .77 | .236 | 10.71 | 1 | .001 | 2.165 | 1.363 3.439 |
|
| Do you know how much sugar is in SSBs? | -.43 | .21 | 4.23 | 1 | .040 | .653 | 0.435 0.980 |
.106 |
| Age =1 | -.79 | .27 | 8.49 | 1 | .004 | .455 | 0.268 0.733 |
|
| Gender =1 | .88 | .27 | 10.59 | 1 | .001 | 2.412 | 1.420 4.098 |
|
| Non-health Sciences =1 | .83 | .23 | 12.63 | 1 | <.001 | 2.293 | 1.451 3.624 |
|
| Your preference for fruit juices? | -.69 | .22 | 10.02 | 1 | .002 | .498 | 0.323 0.767 |
.118 |
| Age =1 | -.74 | .27 | 7.25 | 1 | .007 | .478 | 0.279 0.818 |
|
| Gender =1 | .89 | .28 | 10.65 | 1 | .001 | 2.456 | 1.432 4.212 |
|
| Non-health Sciences =1 | .74 | .24 | 9.62 | 1 | .002 | 2.087 | 1.311 3.322 |
Awareness of disease risks, awareness of sugar content of SSBs, and the preference for sweetened fruit juices are dichotomous questions with options of ‘No, Yes’, No = Reference. Age: 18-25 =0, 26-35 =1; Gender: Female = 0, Male = 1; Study major: Health Sciences =0, Non-Health Sciences = 1.
Disclaimer/Publisher’s Note: The statements, opinions and data contained in all publications are solely those of the individual author(s) and contributor(s) and not of MDPI and/or the editor(s). MDPI and/or the editor(s) disclaim responsibility for any injury to people or property resulting from any ideas, methods, instructions or products referred to in the content. |
© 2025 by the authors. Licensee MDPI, Basel, Switzerland. This article is an open access article distributed under the terms and conditions of the Creative Commons Attribution (CC BY) license (http://creativecommons.org/licenses/by/4.0/).
Copyright: This open access article is published under a Creative Commons CC BY 4.0 license, which permit the free download, distribution, and reuse, provided that the author and preprint are cited in any reuse.


