Submitted:
29 January 2026
Posted:
30 January 2026
You are already at the latest version
Abstract
In this study, we aimed to investigate the molecular mechanisms underlying the differences between white or purple Platycodon grandiflorus, through integrated metabolomic and transcriptomic analyses. The results reveal that we identified 3 differential metabolites. A specific delphinidin-based anthocyanin with the molecular formula C₆₃H₇₃O₃₇ accumulates significantly higher in purple flowers, which is markedly increased by 1504.16-fold compared with white flowers. In contrast, white flowers predominantly accumulate a flavone-type compound (C₂₇H₁₇NO₄) and obetyolin (C₂₀H₂₈O₈ ), and the contents of these two compounds are decreased by 2.04-fold and 1.70-fold, respectively. The contents of compounds C₆₃H₇₃O₃₇ and C₂₇H₁₇NO₄ show extremely significant variation (P < 0.01), while lobetyolin C₂₀H₂₈O₈ exhibited significant differences (P < 0.05). A total of 1970 DEGs were identified between white or purple Platycodon grandiflorus. Comparative transcriptomic analysis reveals differential expression of genes and transcriptional regulators involved in flower color formation between white and purple Platycodon grandiflorus flowers. The DEGs showing differential expression between white and purple flowers include PgCYP75A6, PgF3GT1, PgAN3, PgCYP98A2, PgBGLU18 and PgCYP73A12. The expression pattern of the transcription factors PgMYB4, PgbHLH2, PgWRKY44, PgARPC1A, and PgHARBI1 also showed differences that aligned with the flower color. In summary, the study provided a theoretical foundation for the genetic improvement and breeding of Platycodon grandiflorus varieties. In summary, this study the in-depth exploration of key genes regulating floral color and lays a solid foundation for the subsequent breeding of Platycodon grandiflorus varieties.
Keywords:
Platycodon grandiflorus
; white flower
; purple flower
; metabolomics
; transcriptomics
; molecular mechanism
1. Introduction
Most flowering plants have evolved diverse floral traits that serve as signals to attract animal pollinators [1]. Floral pigmentation is principally governed by flavonoids and carotenoids [2,3,4]. Flavonoids, including anthocyanins, flavonols, flavones, and their derivatives, play a pivotal role in plant coloration mechanisms. Mutations in the genes for biosynthesis of flavonoid pigments were mainly scored as defects in flower coloration or seed pigmentation [5,6,7]. Anthocyanins are the primary pigments responsible for floral coloration, there are three major aglycones: pelargonicin, cyanidin, delphinidin [8]. Anthocyanins biosynthesis is controlled by structural genes. Flavonoid-3', 5'-hydroxylase (F3'5'H) promotes the synthesis of trihydroxy delphinidin type anthocyanins leading to purple/blue flowers [9]. The F3′5′H expression ratio was significantly elevated in purple/blue grape berries compared to green berrie3 [10]. F3GT1 catalyzes the addition of UDP-xylose to cyanidin 3-O-glucoside, yielding cyanidin 3-O-xylosyl-(1→2)-galactoside [11]. The HmDFR2 was upregulated and exhibits a positive correlation with the accumulation trend of total anthocyanins in Hydrangea macrophylla [12]. What‘s more, Transcription factors (TFs) play a crucial role in regulating flavonoid biosynthesis. Among these, R2R3-MYB, basic Helix-Loop-Helix (bHLH), and WD40 proteins are common key regulators in anthocyanin and proanthocyanidin biosynthesis [13].
Platycodon grandifloras (P.grandiflorus) (Campanulaceae) is a perennial herb in-digenous to Northeast Asia [14]. P.grandiflorus is valued for its efficacy in dispersing lung qi, eliminating phlegm, and discharging pus, primarily used to treat exogenous cough, sore throat, dysentery, and lumbago. As a multipurpose species, it holds medicinal, edible, and ornamental value [15,16]. The predominant varieties of P. grandiflorus display floral pigmentation in shades of blue, purple, and white [12]. Research on P. grandiflorus has predomi-nantly centered on its chemical constituents [17], pharmacological activities [18,19], and cultivation methods [20], whereas studies employing metabolomic and tran-scriptomic approaches remain relatively limited. Research on P.grandiflorus floral coloration has revealed that purple/blue color morphs predominantly accumulate delphinidin-derived anthocyanins [4]. Qi et al. identified 11 candidate genes involved in the anthocyanin biosynthesis pathway [21]. Therefore, this study employed transcriptomic and metabolomic approaches to dissect the mechanisms underlying floral color divergence between purple-flowered and white-flowered Platycodon grandiflorus, which provides a theoretical foundation for the genetic improvement and breeding of Platycodon grandiflorus varieties.
2. Materials and Methods
2.1. Plant Materials
The materials were the flowers of three-year-old purple-flowered (purple flowers—PFs) and white-flowered (white flowers—WFs) Platycodon grandiflorus. Sampling was conducted at the experimental area of the Northern Medicinal Plant Resource Nursery in Jilin City, Jilin Province, China (E 126°04′34.39″, N 44°04′13.63″, altitude 302.74 m). WF and PF of P.grandiflorum plants under artificial standardized cultivation, all of which were healthy mature individuals with uniform growth and free from diseases and insect pests. And the PFs and WFs were randomly collected during the peak flowering stage (July 2022). All samples were immediately snap-frozen in liquid nitrogen and then stored at -80 °C for metabolome and transcriptome analyses; the analyses were performed with three biological replicates per group.
2.2. Differential Metabolites Extraction and Analysis
2.2.1. Sample Preparation
Flowers of Platycodon grandiflorus were ground and sieved through an 80-mesh screen. Exactly 100 mg of the resulting powder was weighed and added 5 ml of methanol to a stoppered triangular flask. The mixture underwent ultrasonic shaking (100 Hz, 1 h) twice. The extract was allowed to clarify overnight at room temperature, with any solvent loss due to evaporation compensated for via methanol replenishment. Prior to analysis, the supernatant was filtered through a 0.22 μm nylon filter with three technical replicates and one quality control (QC) included for every sample injection.
2.2.2. UHPLC Conditions
The extraction solution was analyzed using a Thermo Scientific™ Dionex™ Vanquish™ 3000 UHPLC system equipped with a Hypersil GOLD™ aQC18 column (2.1×100 mm, 1.9μm) maintained at 35°C. Binary mobile phases have consisted of (A) 1% formic acid and (B) acetonitrile, delivered at a flow rate of 300μL/min. A linear gradient elution was employed as follows: 2% B (initial), ramped to 98% B over 25 min and held at 98% B for an additional 10 min (total runtime: 35 min). The column was washed for 1 minute and then equilibrated until the 40-minute mark.
2.2.3. Mass Spectrometry Detection Conditions
The extraction solution was analyzed using a Thermo Scientific Orbitrap Fusion Lumos Tribrid mass spectrometer equipped with a heated H-ESI ion source. A 1μL aliquot of the processed sample was injected, and the profiling involved a full scan (300-1500 m/z) at 60,000 resolution, followed by Top-10 data-dependent MS/MS at 15,000 resolution under negative ionization mode. Key MS/MS parameters were set as follows: RF lens, 50%; AGC target, 400,000; maximum injection time, 50 ms; intensity threshold range, 5.0×10⁴ to 1.0×10²⁰; mass tolerance, ±10 ppm; isolation window, 1.4 m/z; stepped collision energies, 20%, 40%, and 60%; and dynamic exclusion duration, 6 seconds. The ionization conditions were optimized, and the equipment operated at a final spray voltage of -2.7 kV, with heater and capillary temperatures set at 320℃ each. Sheath and sweep gas were configured at 40 and 5 Arb, respectively.
2.2.4. Metabolomics Data Analysis
Metabolomics data were analyzed using Thermo Xcalibur Qual Browser software. Component structures were identified by cross-referencing them with established databases, including MassBank, the National Institute of Standards and Technology (NIST), and PubChem databases. Semi - quantitative analysis was conducted via the peak area normalization method to qualitatively characterize the anthocyanin and saponin profiles in the petals of WF and PF of P.grandiflorus, as well as to comparatively evaluate the variations in their relative contents. Both principal component analysis (PCA) and differential metabolites screening were performed on the Metware Cloud Platform. Differential metabolites were identified using the thresholds of fold change≥1.5 and P < 0.05. All data preprocessing (including scaling, and PCA computation) was completed using the platform's built-in modules. The significance of differential metabolites between purple and white flowers was evaluated using a paired-sample t-test in SPSS version 27.
2.3. Transcriptome Analysis
Total RNA was extracted from all samples using the RNAprep Pure Plant Kit (Tiangen, Beijing, China). RNA concentration and purity was measured using NanoDrop 2000(Thermo Fisher Scientific, Wilmington, DE). RNA integrity was assessed using the RNA Nano 6000 Assay Kit of the Agilent Bioanalyzer 2100 system (Agilent Technologies, CA, USA). Sequencing libraries were generated using NEBNext UltraTM RNA Library Prep Kit for Illumina (Yeasen Biotechnology (Shanghal) Co, td.) following manufacturer’s recommendations. The resultant sequencing libraries were sequenced on the Illumina NovaSeq 6000 platform. The raw reads were further processed with a bioinformatic pipeline tool, BMKCloud(www.biocloud.net) online platform. Bioinformatics analyses included quality control of raw reads, and functional annotation of unigenes against the following databases: Nr,Pfam, KOG/COG, Swiss-Prot, KO, and GO. Subsequent analyses encompassed quantification of gene expression levels, differential expression analysis.
Differential expression analysis was performed using DESeq2, with the screening criteria for differentially expressed genes (DEGs) set FDR<0.01 and ∣log2FC∣≥1. Furthermore, GO and KEGG pathway enrichment analysis was performed on the DEGs to screen significantly enriched terms. First find the relevant genes in the flavonoid biosynthesis biosynthesis. And we focused on the phenylpropane pathway, flavonoid synthesis pathway and anthocyanin synthesis pathway,because these three pathways are the key mechanisms responsible for the flower color differences in P.grandiflorum. We screened the DEGs involved in these three pathways, and based on the selected reference genome sequence, string Tie software was used to assemble the Mapped Reads and then compare them with the original genome annotation information to search for transcription regions that were not already annotated. Sequences with an encoded peptide chain that was too short (less than 50 amino acid residues) or contained only a single exon were filtered out to discover new transcripts and genes. DIAMOND software performed sequence alignment between the newly discovered genes and the NR, Swiss-Prot, COG, KOG, and KEGG databases to obtain results such as the KEGG Orthology of the new genes. InterProScan used the databases integrated with InterPro to analyze the GO Orthology results of the new genes. After the amino acid sequences of the new genes were predicted, HMMER software was used to align them with the Pfam database to obtain the annotation information pertaining to the new genes.
2.4. RT-qPCR Validation of DEGs Expression Levels
Three samples for PFs and WFs were used for qPCR. A total of 6 genes were screened out in this experiment, three genes that are the key DEGs for floral color. The 18s rRNA was used as an internal reference gene for gene expression correction, and the sequences of primers are listed in (Table A1). The whole RT-qPCR process was performed using an RNA Extraction Kit (Biokeystone Technologies Co., Ltd., Chengdu, China), reverse transcriptase, and an SYBR green fluorescent dye kit (Aidlab Biotechnologies Co., Ltd., Beijing, China). Relative gene expression levels were calculated automatically using qPCR soft 3.2 software. And differential gene expression analyses were performed. The significance of gene expression was evaluated using a paired-sample t-test.
3. Results
3.1. Analysis of Metabolic Differences in Fowers Between PFs and WFs
3.1.1. PCA Clusters Two Platycodon Flower Groups Distinctly
The PCA results showed that the two samples were distinctly clustered into two separate groups (Figure 1). The first two principal components (PC1 and PC2) accounted for 70.58% and 11.30% of the total variance, respectively, with a cumulative contribution rate of 81.88%.
3.1.2. Identification of Differential Metabolites in PFs and WFs
Based on the screening criteria for differential metabolites, we identified three most significantly different metabolites. In the PF samples, a compound containing the molecular ion [M+H]⁺ at m/z 1421.39 with a retention time (RT) of 6.83 seconds was observed (Figure 2a). This metabolite, designated as metabolite A, was identified as a delphinidin aglycone anthocyanin with the molecular formula C₆₃H₇₃O₃₇. The relative increase of the delphinidin aglycone anthocyanin in PF petals reached 1504.16-fold compared with WF samples. Its structure consists of two caffeic acid units linked sequentially via glucose molecules at the 7 position of delphinidin, or, more, specifically, delphinidin 3-O-[6-O-(α-rhamnopyranosyl)-β-glucopyranoside]-7-O-[6-O-(4-O-(6-O-(4-O-(β-glucopyranosyl)-trans-caffeoyl)-β-glucopyranosyl)-trans-caffeoyl)-β glucopyranoside](Figure A1a)(Tadao Kondo, et al., 2021; Natsu Tanikawa, et al., 2022). Two differential metabolites, designated B and C, were identified in the WF samples. The relative increase of the Metabolite B in WF petals reached 36.91-fold compared with PF samples. Metabolite B exhibited a molecular ion [M+H]⁺ at m/z 420.19 with a retention time (RT) of 6.06 seconds (Figure 2b). Its molecular formula was determined to be C₂₇H₁₇NO₄. According to PubChem (release 2021.10.14), this compound was annotated as follows: 6-Carboxy-4′-[2-(2-quinolinyl)ethenyl]flavone (Figure A1b). The relative increase of the Metabolite C in WF petals reached 15.13-fold compared with PF samples. Metabolite C showed an [M+H]⁺ ion at m/z 441.18 with an RT range of 5.61 seconds (Figure 2c). It was identified as lobetyolin by Wang et al. (2017) and assigned the molecular formula C₂₀H₂₈O₈. PubChem describes its structure as follows: (2R,3R,4S,5S,6R)-2-[(4E,12E)-1,7-dihydroxytetradeca-4,12-dien-8,10-diyn-6-yl]oxy-6-(hydroxymethyl)oxane-3,4,5-triol (Figure 3C) (PubChem release, 2011.11.16) (Figure A1c).
Our analysis revealed the delphinidin aglycone anthocyanin and flavone-type compound accumulation exhibited the most substantial variation (P<0.01, two-tailed test) between purple and white flower variants based on normalized abundance (NL) values, while lobetyolin showed significant quantitative differences (P < 0.05) (Figure 3).

Table 1.
The differential metabolites between PFs and WFs (P<0.05).
| Index | Fold_Change | Log2FC | Regulation |
|---|---|---|---|
| A | 1504.16 | 10.55 | up |
| B | 2.04 | 1.03 | down |
| C | 1.70 | 0.77 | down |
3.2. Transcriptome Analysis of PFs and WFs
3.2.1. Sequencing and Quality Analysis
In this study, we obtained 40.46Gb of clean data, with each sample yielding an average of 5.88 Gb (Table 2). Moreover, the Q30 value was more than 93.98%, and the error rates for all reads were below 0.05%. This indicates the sequencing results are of good quality.
DEGs were analyzed using the DESeq2 R package, with the screening criteria of false discovery rate (FDR) < 0.01 and |log₂(fold change)| ≥ 2. The DEGs, which emerged due to P.grandiflorus germplasms with different flower colors, were described by volcano plots (Figure 4). The comparison of WFs vs. PFs resulted in 1970 DEGs, including 1031 upregulated and 939 downregulated genes (Table A1). The results indicated that these DEGs might play a key role in the expression of P.grandiflorus with different flower colors (Table 3).
3.2.2. GO Analysis of DEGs
In the GO database, 1388 DGEs were annotated and classified into three major categories: biological process, cellular component, and molecular function. Metabolic process (45.02%), membrane (33.29%), and catalytic activity (53.10%) accounted for the highest proportions among the categories. The top three significantly enriched terms in the biological process category were microtubule-based process, methylation, and cell wall organization (Figure A3a and b).
3.2.3. KEGG Analysis of DEGs
A total of 402 DEGs were annotated in the KEGG database, and the findings pointed out that these DEGs were predominantly enriched in “nitrogen metabolism”,”arginine biosynthesis”, ”flavonoid biosynthesis”and “phenylpropanoid biosynthesis”. Additionally, 286 upregulated DEGs were identified in PFs, among whitch the pathways including “nitrogen metabolism”, “arginine biosynthesis”,”alanine, aspartate and glutamate metabolism”, “flavonoid biosynthesis”,”plant-pathogen interaction”, and”phenylpropanoid biosynthesis” showed significant enrichment (Figure 5a,b). The results demonstrated that the biosynthesis of phenylpropanoids and flavonoids may represent the main pathways responsible for floral color variations.
3.2.4. Key DEGs Regulating the Floral Color Formation
A total of 12 key DEGs associated with flower color in P.grandiflorum were identified (Table 4). Among the upregulated DEGs, PgCYP75A6, PgF3GT1and PgAN3 exhibited the most significantly upregulation compared to WFs, which were annotated to flavonoid 3',5'-hydroxylase 2, anthocya-nidin 3-O-glucosyltransferase and naringenin 3-dioxygenase respectively. PgRT was annotated to delphinidin 3-O-glucoside rhamnosyltransferase pathway. Compared to WFs, the genes PgCYP98A2 (5-O-(4-coumaroyl)-D-quinate 3′-monooxygenase) and PgCYP73A12 (trans-cinnamate 4-monooxygenase) were down-regulated in PFs. Both genes were annotated to the biosynthesis pathways of stilbenoids, dia-rylheptanoids, and gingerols. Notably, PgHMA5 and PgVPS35B were specifically expressed in PFs, with no ex-pression detected in WFs, which were annotated to probable copper-transporting ATPase HMA5 and vacuolar protein sorting-associated protein 35 pathways.
3.2.5. Key DEGs Regulating Transcription Factors Involved in Floral Color Formation
We performed 4 and 1 upregulated DEGs regulating anthocyanin biosynthesis TFs in PFs and WFs, respectively (Table 5). PgMYB4 was annotated as transcription factor C2 repressor motif protein. PgWRKY44 was annotated to WRKY transcription factor 44. Moreover, PgbHLH2 (bHLH family member) and PgARPC1A (Anaphase-promoting complex subunit 4 WD40 domain) were upregulated in PFs. In contrast, the PgHARBI1 was up-regulated in WFs samples and annotated as encoding a Myb/SANT-like DNA-binding domain.
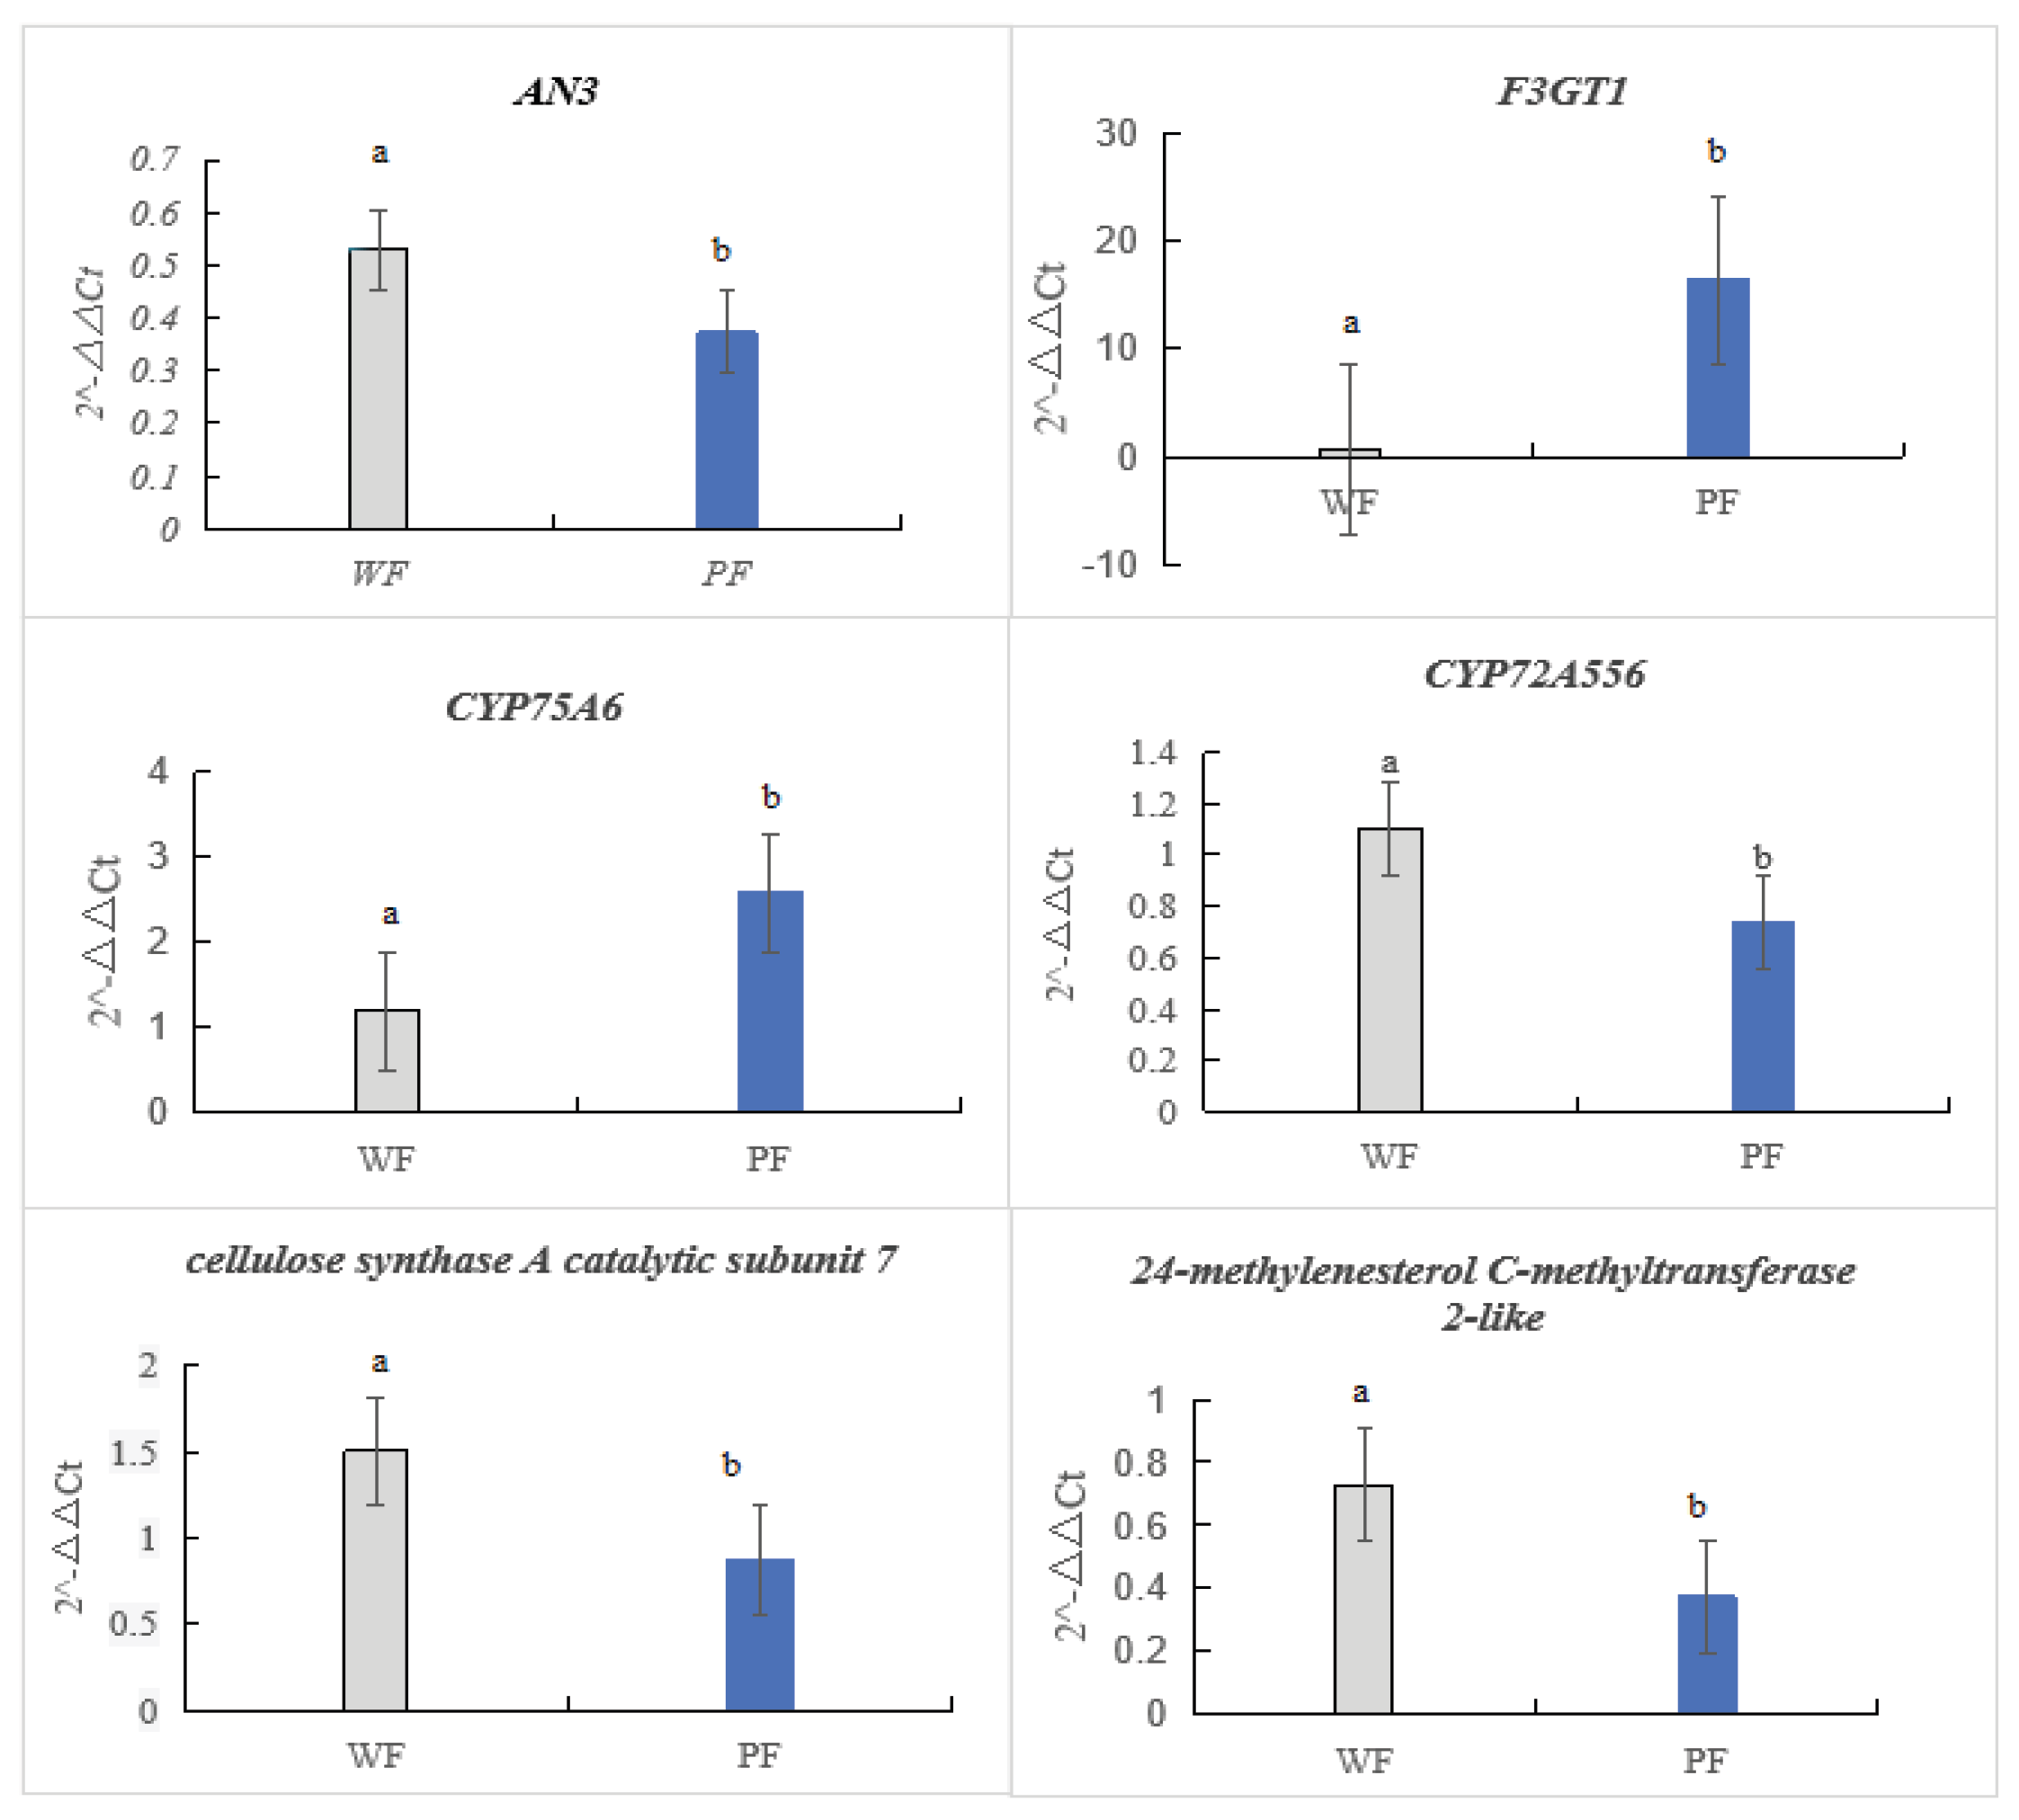
3.2.6. Validation of Transcriptome Sequencing via RT-qPCR
The relative expression levels of the six target genes are shown in Figure 10. We observed differences in the biosynthesis genes between PFs and WFs, and the expression levels of F3GT1, AN3, and CYP75A6 were significantly higher in PFs than in WFs (Figure This result is consistent with the transcriptome data, confirming the reliability of our sequencing analysis.
Figure 6.
Verification of relative expression levels of transcriptome sequencing.
4. Discussion
Transcriptome and metabolome analyses are widely employed to investigate the mechanisms underlying plant phenotypic traits. In this study, a specific delphinidin aglycone anthocyanin predominantly accumulates in purple flowers, while white flowers predominantly accumulate a flavone-type compound and lobetyolin. Lou et al. found that methylated delphinidin-type anthocyanins caused the violet-blue or purple coloration in petals [22]. And the delphinidin aglycone anthocyanin and flavone-type compound accumulation exhibited the most substantial variation between purple and white flower, while lobetyolin showed significant quantitative differences. Transcriptome analysis indicated that More genes were upregulated than downregulated in the PF samples. The most highly upregulated genes were annotated to the phenylpropanoid biosynthesis metabolism pathway and enriched in the flavonoid biosynthesis pathway in purple flowers. As previously established, anthocyanin synthesis is initiated by phenylalanineand proceeds involving the synthesis of flavones, flavonols, phlobaphene pigments, anthocyanins, and proanthocyanidins [23,24]
4.1. Elucidation of the Molecular Mechanism Underlying PFs Color Formation in P.grandiflorus
From the results of DEGSs analysis, the differentiation between purple and white flowers in P. grandiflorus is driven by the differential expression of key genes within the flavonoid-anthocyanin biosynthesis pathway. We identified 9 significantly upregulated DEGs in PFs. PgCYP75A6 was annotated F3′5′H. PgF3GT1 was identified as an anthocyanin synthesis promotor [25]. PgAN3 was functionally annotated to the flavanone 3-dioxygenase (F3′H). PgDFR catalyzed dihydroflavonol to synthesize basic skeletons of flavonoids and anthocyanins [26]. PgRT is the key regulated factor of delphinidin modification encoding delphinidin 3-O-glucoside, which involves in purple fruit pigmentation of Capsicum annuum [27]. PgHMA5 and PgVPS35B were only expressed in PFs, which were copper-transporting and vacuolar protein sorting-associated proteins respectively. Low-content Cu2+ can promote the synthesis of anthocyanins [28]. In addition, delphinidin is stored in the vacuole for cellular pigmentation [29]. Above all, PgHMA5 may function to Cu²⁺ transport promoting the delphinidin biosynthesis. And PgVPS35B regulate delphinidin accumulation in vacuolar. They exert a synergistic effect leads to purple pigmentation in PFs.
The TFs include both positive and negative regulatory functions in anthocyanin synthesis [30]. Stushnoff et al. identified 27 differentially expressed genes found between purple and white regions of Solanum tuberosum including one single-domain TF belonging to MYB family [31]. The expression of anthocyanin biosynthesis genes is regulated by MYB-bHLH-WD40 (MBW), and the R2R3-MYB is the main factor [32]. The accumulation of anthocyanin is orchestrated by the spatiotemporal expression patterns of R2R3-MYB and bHLH transcription factors [33]. SmWRKY44 interacted with SmMYB1, its expression was positively correlated with anthocyanin accumulation in both eggplant fruit peels and leaves [34]. In PFs, PgWRKY44, PgbHLH2 and PgARPC1A may synergistically enhance the formation of the MBW complex, a process that may directly promotes anthocyanin biosynthesis and accumulation. Notably, the up-regulated R2R3-MYB combined C2 TF in purple flowers, the MYBC2 negatively regulated the genes that have an inhibitory effect on anthocyanin biosynthesis, as a result that the petals are purple [35]. The PgMYB4 as a MYB transcription factor C2 repressor motif protein in purple flowers. It may have a similar function causing purple floral colors.
4.2. Elucidation of the Molecular Mechanism Underlying WFs Color Formation in P.grandiflorus
White petals lack anthocyanins due to the inhibition of anthocyanins biosynthesis pathway [36]. Floral colors of Erica species shift from pink or red to white and yellow is associated with losses of single pathway gene expression, the expression of a transcription factor, or function mutations in pathway genes [37]. We found that PgBGLU18, PgCYP98A2, and PgCYP73A12 were all downregulated in PFs. BGLU18 is a regulator influencing the expression levels of anthocyanin structural gene [38] Its downregulation may inhibit delphinidin biosynthesis in WFs. Both PgCYP98A2 and PgCYP73A12 were annotated to stilbenoid, diarylheptanoid and gingerol biosynthesis, which are distinct branches of flavonoid pathway. Ma et al. demonstrated that the upregulation of genes in this pathway contributed to lobetyolin synthesis [39]. We speculate that the upregulation of PgCYP73A12 and PgCYP72A219 promotes the synthesis and accumulation of the flavone and lobetyolin in WFs. In WFs, PgHARBI1 was annotated the negative MYB-type transcription factor encoding a MYB/SANT-like DNA-binding domain, which competitively bind to bHLH partners. This interaction disrupts the formation of the MBW transcriptional complex reducing anthocyanin biosynthesis [26].
4.3. Practical Applications of Floral Color Mechanisms in P.grandiflorus Breeding
The integrated metabolomic and transcriptomic findings provide actionable insights for real-world applications of P.grandiflorus For ornamental breeding, targeted overexpression of PgCYP75A6, PgF3GT1, and PgAN3—key genes driving delphinidin-based anthocyanin accumulation—could efficiently produce stable, vivid purple-flowering varieties with high ornamental value. Conversely, enhancing the expression of PgCYP73A12 and PgBGLU18, which are associated with flavone and lobetyolin synthesis, may optimize the selection of pure white-flowering germplasms. In medicinal and food industries, the distinct metabolite profiles enable precision breeding: purple flowers rich in anthocyanins (with potent antioxidant activity) can be tailored for functional food and cosmetic development. Furthermore, the identified key genes and differential metabolites act as reliable molecular markers, accelerating germplasm screening and shortening breeding cycles from years to months. These applications not only enhance the economic value of P. grandiflorus in horticulture, medicine, and food sectors but also promote the sustainable utilization of its germplasm resources.
5. Conclusions
We assessed metabolomes and transcriptomes to compared DEGs in P.grandiflorus with WF and PF. In this study, we identified 3 differential metabolites. In addition, PgCYP98A2, PgBGLU18, PgCYP73A12, PgAN3, PgDFR, PgCYP75A6, PgUGT29, Pg3MAT, PgF3GT1, PgRT, PgHMA5 and PgVPS35B were identiffed as candidate genes contributing to the color diversity of P.grandiflorus color. And the expression pattern of the transcription factors PgMYB4, PgbHLH2, PgWRKY44, PgARPC1A, and PgHARBI1 also showed differences that aligned with the flower color. These results broaden the knowledge of the metabolic and transcriptomic changes in P. grandiflorus caused by color changes, also provide partial data support for subsequent related research and promoting the multi-value development of P. grandiflorus resources.
Funding
This research was funded by the Science and Technology Foundation of Jilin Province (No. 20240305013YY).
References
- Van der Kooi, C.J.; Vallejo-Marín, M.; Leonhardt, S. D. Mutualisms and (a) symmetry in plant-pollinator interactions. Current Biology 2021, 31, R91–R99. [Google Scholar] [CrossRef]
- Zhao, D; Tao, J; Han, C; et al. Flower color diversity was revealed by differential expression of flavonoid biosynthesis-related genes and flavonoid accumulation in herbaceous peony (Paeonia lactiflora Pall). Mol Biol Rep. 2012, 39, 11263–11275. [Google Scholar] [CrossRef]
- Zheng, XD; Pan, XX; Meng, XM; et al. Research progress in the determination of carotenoids in Lycium chinense by HPLC. China Fruit Vegetable 2013, 2013.10.013, 1027–1030. [Google Scholar]
- Tanaka, Y; Sasaki, N; Ohmiya, A. Biosynthesis of plant pigments: anthocyanins, betalains and carotenoids. Plant J. 2008, 54, 733–749. [Google Scholar] [CrossRef] [PubMed]
- Dong, N.Q.; Lin, H.X. Contribution of phenylpropanoid metabolism to plant development and plant–environment interactions. J. Integr. Plant Biol. 2021, 63, 180–209. [Google Scholar] [CrossRef] [PubMed]
- Shen, N.; Wang, T.; Gan, Q.; Liu, S.; Wang, L.; Jin, B. Plant flavonoids: classification, distribution, biosynthesis, and antioxidant activity. Food Chem. 2022, 383, 132531. [Google Scholar] [CrossRef]
- Erich, G. The evolution of flavonoids and their genes. In The Science of Flavonoids; Springer Science + Business Media, Inc: New York, 2006. [Google Scholar]
- da Silva, F.L.; Escribano-Bailón, M.T.; Pérez Alonso, J.J.; Rivas-Gonzalo, J.C.; Santos-Buelga, C. Anthocyanin pigment in strawberry. Lebensmittel-Wissenschaft und-Technologie 2007, 40, 374–382. [Google Scholar] [CrossRef]
- Rausher, MD. Evolutionary transitions in floral color. International Journal of Plant Sciences 2008, 169, 7–21. [Google Scholar] [CrossRef]
- Li, Q; He, F; Zhu, B Q; Liu, B; Sun, R Z; Duan, C Q; Reeves, M J; Wang, J. Comparison of distinct transcriptional expression patterns of flavonoid biosynthesis in Cabernet Sauvignon grapes from east and west China. Plant Physiology and Biochemistry 2014, 84, 45–56. [Google Scholar] [CrossRef] [PubMed]
- Mirco, M. Richard V. E, David S, Janine C Paul M. D, Anna S, Ross G.A, Roger P. H, Andrew C. A. Identification and characterization of F3GT1 and F3GGT1, two glycosyltransferases responsible for anthocyanin biosynthesis in red-fleshed kiwifruit (Actinidia chinensis). Plant J 2011, 65, 106–118. [Google Scholar]
- QI, H. Studies on the function and molecular mechanism of anthocyanin in the bluing capability of Hydrangea macrophylla sepals. Chinese Academy of Agricultural Sciences Thesis. Beijing, 2022. [Google Scholar]
- Koes, R; Verweij, W; Quattrocchio, F. Flavonoids: a colorful model for the regulation and evolution of biochemical pathways. TRENDS in Plant Science 2005, 10, 236~242. [Google Scholar] [CrossRef]
- Zhang, L.; Wang, Y.; Yang, D.; Zhang, C.; Zhang, N.; Li, M.; Liu, Y. Platycodon grandiflorus-An ethnopharmacological, phytochemical and pharmacological review. J. Ethnopharmacol. 2015, 164, 147–161. [Google Scholar] [CrossRef]
- Flora of China. Editorial Committee of Flora of China; Science Press: Beijing, 1983.
- Commonly Used Chinese Medicinal Materials; Science Press: Beijing, 1995.
- Ahn, K.S.; Noh, E.J.; Zhao, H.L.; Jung, S.H.; Kang, S.S.; Kim , Y.S. Inhibition of inducible nitric oxide synthase and cyclooxygenaseⅡ by Platycodon grandiflorum saponins via suppression of nuclear factor-κB activation in RAW 264. 7 cells. Life Sciences 2005, 76, 2315–2328. [Google Scholar]
- Lee, K J; You, H J; Park, S J; Kim, Y S; Chung, Y C; Jeong, T C; Jeong, H G. Hepatoprotective effects of Platycodon grandiflorum on acetaminophen-induced liver damage in mice. Cancer Letters 2001, 174, 73–81. [Google Scholar] [CrossRef] [PubMed]
- Kyung J.L, Jae H.C, Hyung G. K, Eun H. Han, Yong P. H, Young C. L, Young C. C, Hye G. J. Protective effect of saponins derived from the roots of Platycodon grandiflorum against carbon tetrachloride induced hepatotoxicity in mice. Food and Chemical Toxicology 2008, 46, 1778–1785. [CrossRef] [PubMed]
- Zhang, H. Y; Hu, X. L; Li, H. J.; Dan, Z. Cultivation Techniques of Platycodon grandiflorus for Suitable Climate, High Quality, and High Yield. Shaanxi Agricultural Sciences 2011, (2), 255–257. [Google Scholar]
- Qi, S. Y; Yan, Y. Z; Jin, Z.; Wu, S. Q. Study on Differential Gene Expression during the Development of White and Purple Flowers of Platycodon grandifloras. Crops 2024, 06, 54–65. [Google Scholar]
- Lou, Q; Wang, L; Liu, H; et al. Anthocyanin profiles in flowers of grape hyacinth. Molecules 2017, 22, 688. [Google Scholar] [CrossRef]
- Winkel-Shirley, B. Flavonoid biosynthesis. A colorful model for genetics, biochemistry, cell biology, and biotechnology. Plant Physiology 2001, 126, 485–493. [Google Scholar] [CrossRef]
- Nakatsuka, T; Sasaki, N; Nishihara, M. Transcriptional regulators of flavonoid biosynthesis and their application to flower color modification in Japanese gentians. Plant Biotechnology 2014, 31, 389–399. [Google Scholar] [CrossRef]
- Xin, Y. K; Ke Yu, Z; Mei, Y. T; Xue, R. Y; Wen, Q. W. bHLH291 Regulates Anthocyanin Accumulation in Kiwifruit Under Bagging Treatment. Horti-culturae 2025, 11, 666. [Google Scholar]
- Yan, H. L; Pei, X. N; Zhang, H; Li, X; Zhang, X.X; Zha, M. H; Chiang, V.L.; Sederoff, R.R.; Zhao, X. Y. MYB-Mediated regulation of anthocyanin biosynthesis. International journal of molecular sciences 2021, 22, 3103. [Google Scholar] [CrossRef] [PubMed]
- Gao, J. H; Dou, Y. W; Wang, X. T; Zhang, D. L; Wei, M; Li, Y. Transcriptome analysis reveals the mechanism for blue-light–induced biosynthesis of delphinidin derivatives in harvested purple pepper fruit. Frontiers in Plant Science 2023, 1289120. [Google Scholar] [CrossRef]
- Luo, J; Chen, L. Q; Li, T. J; Ou, Z; Qu, Y. Analysis on effects of metal ions on the petal color of three species in Meconopsis based on transcriptome. Journal of Plant Resources and Environment 2023, 32, 16–27. [Google Scholar]
- Sun, Y; Hong, L; Huang, J R. Arabidopsis TT19 functions as a carrier to transport anthocyanin from the cytosol to tonoplasts. Molecular Plant. 2011, 5, 387–400. [Google Scholar] [CrossRef]
- Liu, G. L. Study on the color mechanism of Iris sanguinea Donn ex Horn. with different flower colors regulated by IsMYBL1 and IsMYBL2; Northeast Forestry University, 2024. [Google Scholar]
- Stushnoff, C.; Ducreux, L. J.; Hancock, R. D.; Hedley, P. E.; Holm, D. G.; McDougall, G. J. Flavonoid profiling and transcriptome analysis reveals new gene-metabolite correlations in tubers of Solanum tuberosum L. J. Exp. Bot. 2010, 61, 1225–1238. [Google Scholar] [CrossRef]
- Lloyd, A; Brockman, A; Aguirre, L; Campbell, A; Bean, A; Cantero, A; Gonzalez, A. Advances in the MYB-bHLH-WD repeat (MBW) pigment regulatory model: addition of a WRKY factor and Co-option of an anthocyanin MYB for Betalain Regulation. Plant Cell Physiology 2017, 58, 1431–1441. [Google Scholar] [CrossRef] [PubMed]
- Wang, L. H; Tang, W; Hu, Y. W; Zhang, Y. B; Sun, J. Q; Guo, X. H; et al. A MYB/bHLH complex regulates tissue-specific anthocyanin biosynthesis in the inner pericarp of red-centered kiwifruit Actinidia chinensis cv. Hongyang. The Plant journal: for cell and molecular biology 2019, 99, 359–378. [Google Scholar] [CrossRef] [PubMed]
- He, Y.J; Wang, Z. W; Ge, H. Y; Liu, Y; Chen, H. Weighted gene co-expression network analysis identifies genes related to anthocyanin biosynthesis and functional verification of hub gene SmWRKY44. Plant Science 2021, 309, 110935. [Google Scholar] [CrossRef]
- Jie, Yang. Transcriptional regulation mechanism of anthocyanin biosynthesis in oriental hybrid lily; Beijing Forestry University: Beijing, 2022. [Google Scholar]
- Lu, M. Y. Discovery and functional validation of the key gene PgF3', 5'H in the biosynthetic pathway of Platycodon grandiflorus blue flower. Master’s Thesis, Anhui University of Chinese Medicine, 2023. [Google Scholar]
- Le Maitre, N.C.; Pirie, M.D.; Bellstedt, D.U. Floral Color, Anthocyanin Synthesis Gene Expression and Control in Cape Erica Species. Frontiers in Plant Science 2019, 11, 1565. [Google Scholar] [CrossRef]
- Liu, H. F; Chen, F. B. Candidate genes in red pigment biosynthesis of a red-fleshed radish cultivar (Raphanus sativus L.) as revealed by transcriptome analysis. Biochemical Systematics and Ecology 2019, 86, 103933. [Google Scholar] [CrossRef]
- Ma, Y. T; Ma, L; Xu, L; Wei, R. N; Chen, G. P; Dang, J. H; Chen, Z; Ma, S. Y; Li, S. Research on the Mechanism of Growth of Codonopsis pilosula (Franch.) Nannf. Root Responding to Phenolic Stress Induced by Benzoic Acid. Inter-national Journal of Molecular Sciences 2024, 25, 11007. [Google Scholar] [CrossRef] [PubMed]
Figure 1.
PCA score plot of PFs and WFs.
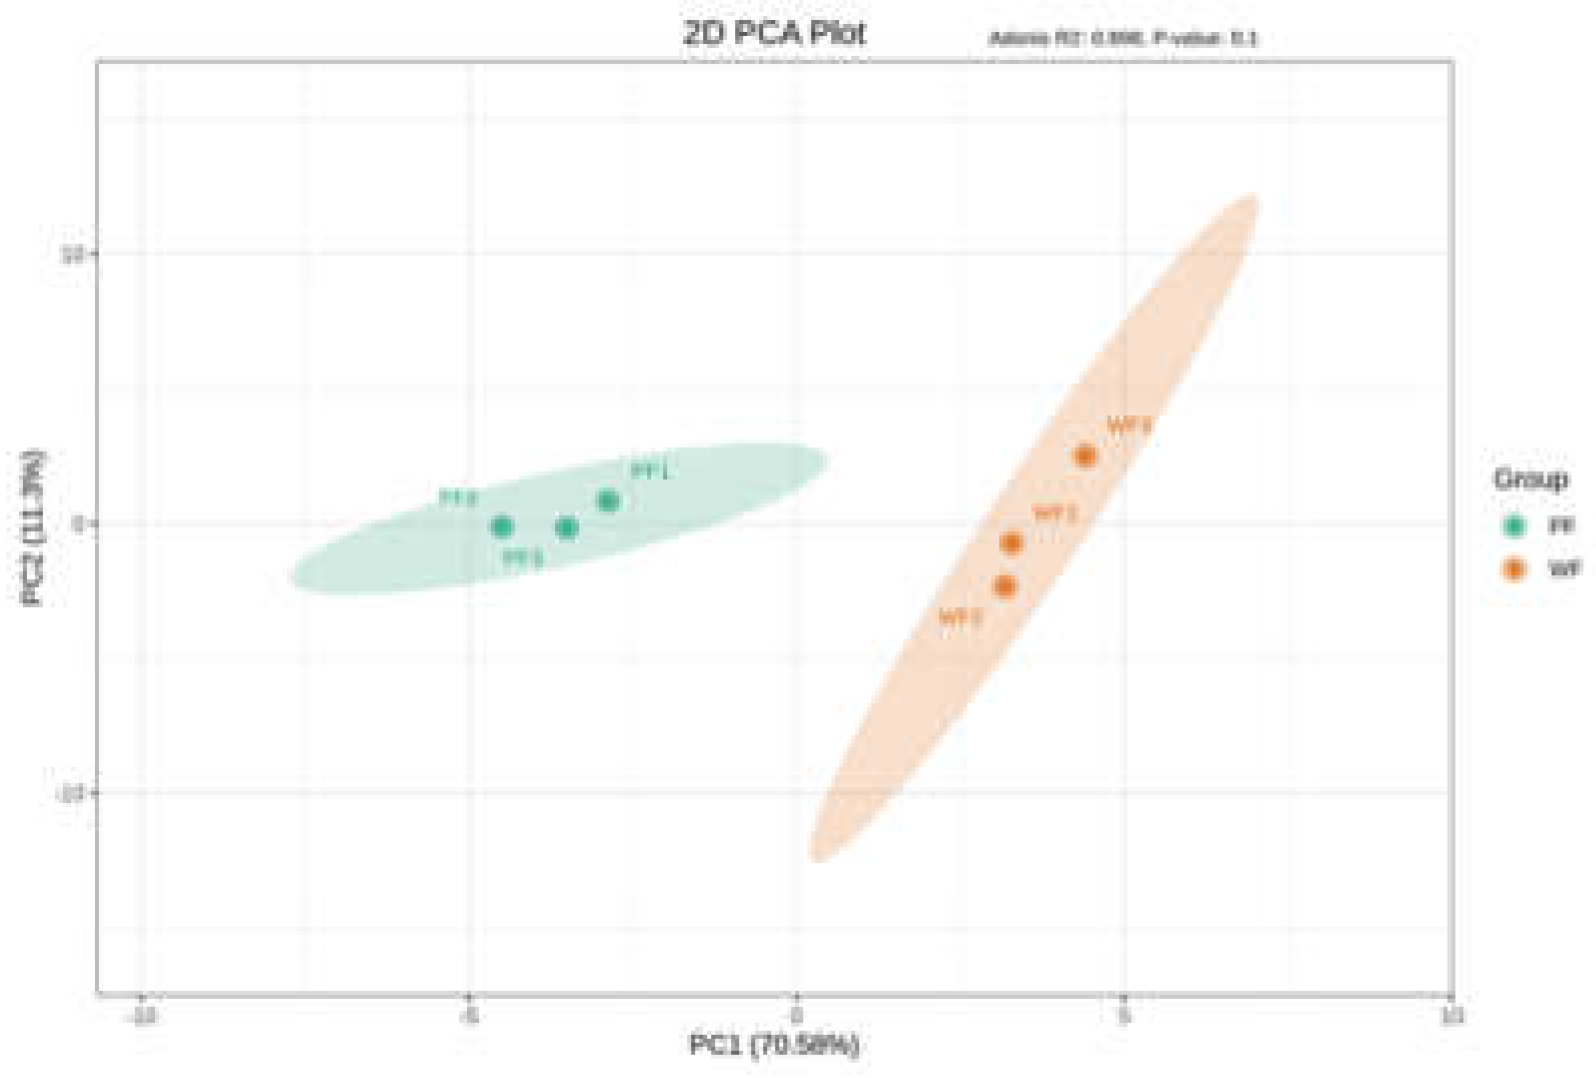
Figure 2.
TIC of three differential metabolites-A,B,and C-via UHPLC MSn.
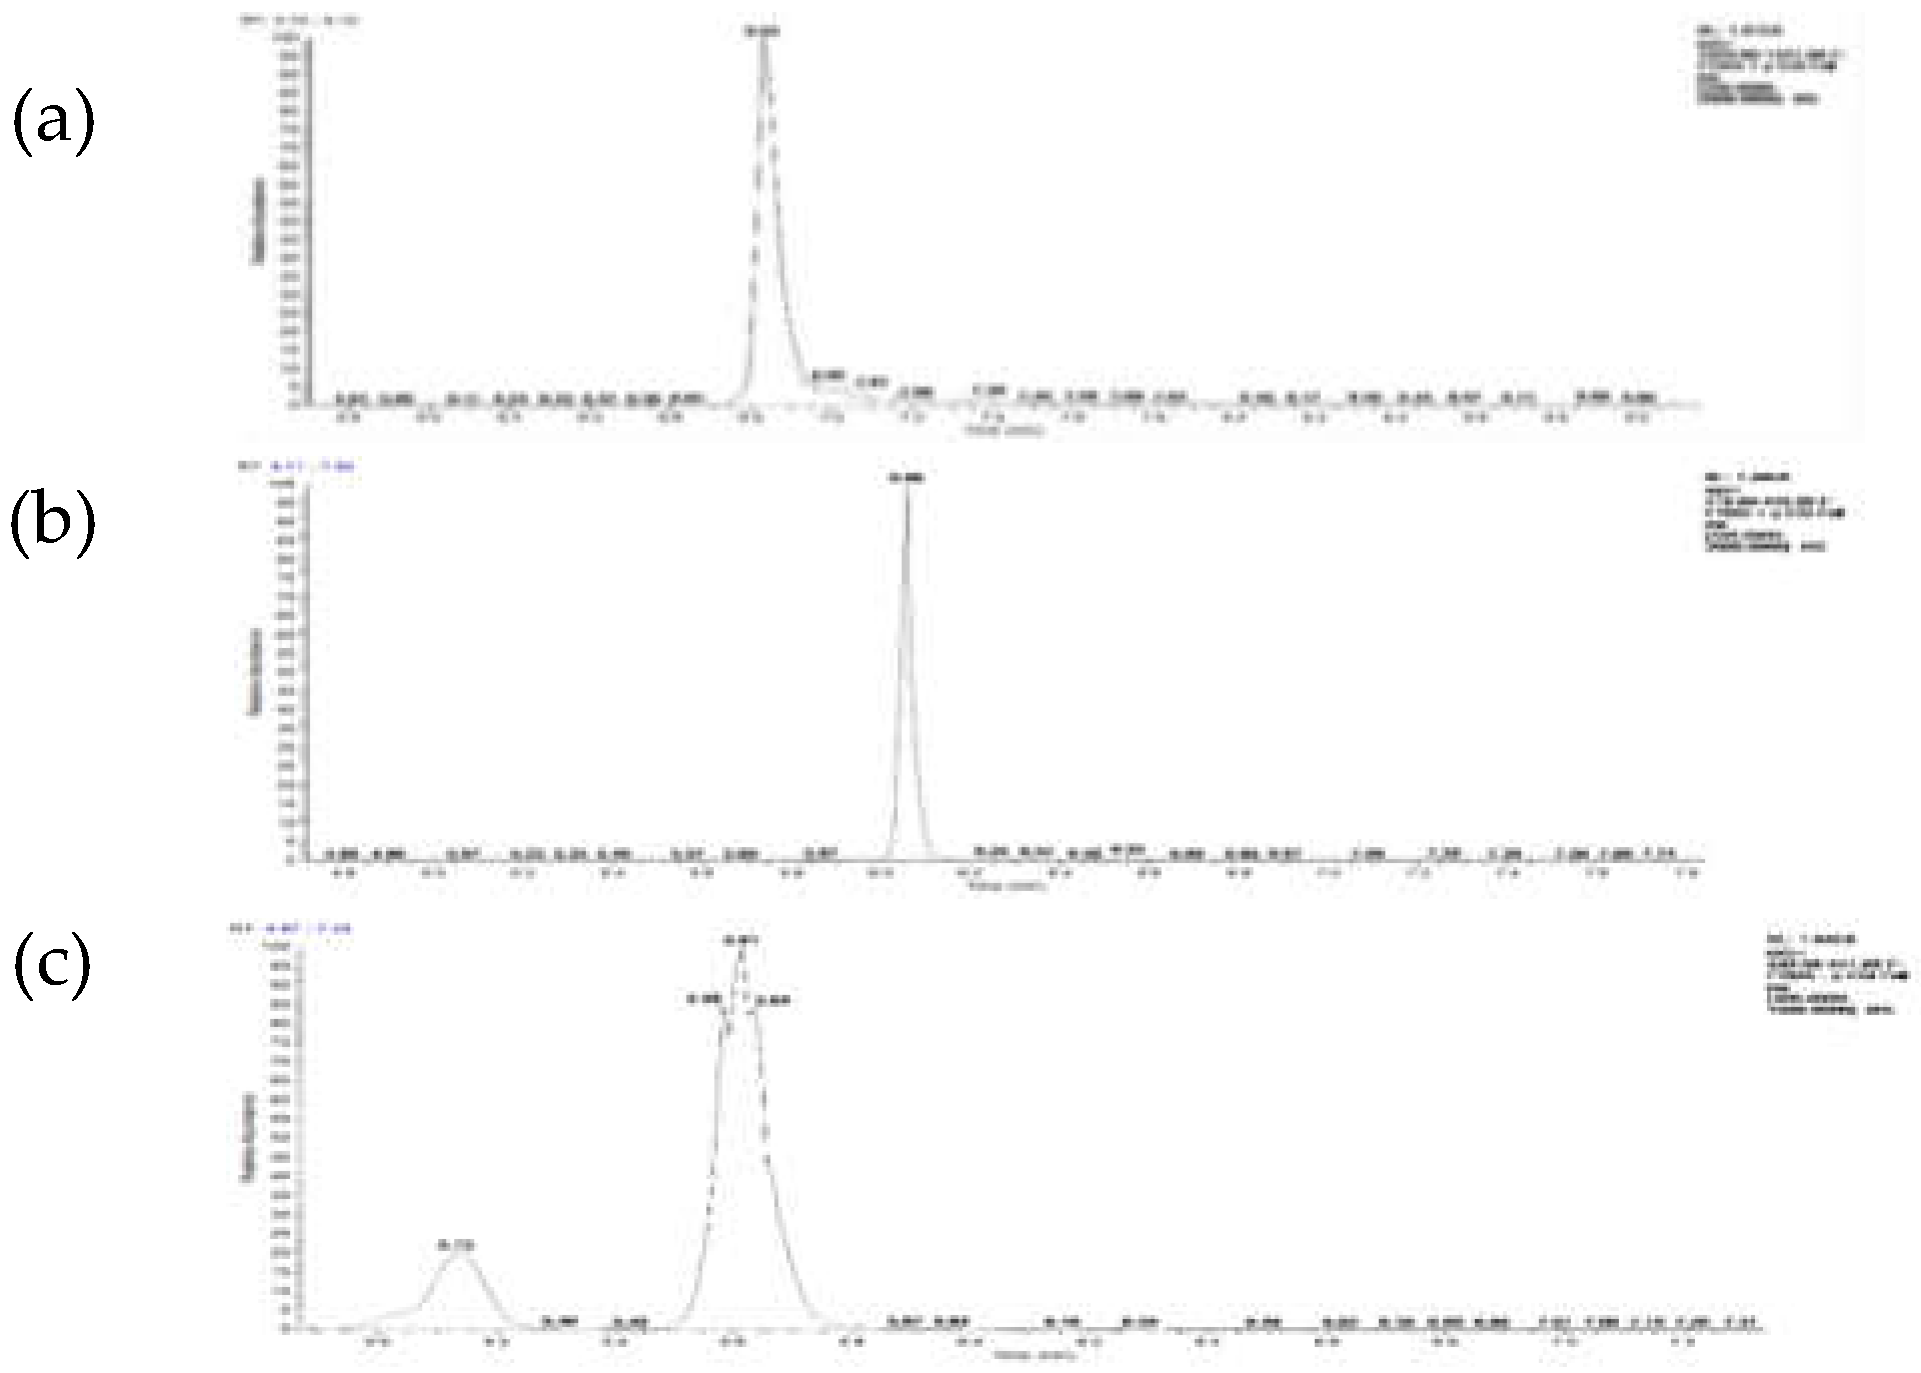
Figure 3.
The content of three differential metabolites between PFs and WFs. Uppercase letters indicate highly significant differences (p < 0.01), and lowercase letters indicate significant differences (p < 0.05) among groups,the same below.
Figure 3.
The content of three differential metabolites between PFs and WFs. Uppercase letters indicate highly significant differences (p < 0.01), and lowercase letters indicate significant differences (p < 0.05) among groups,the same below.
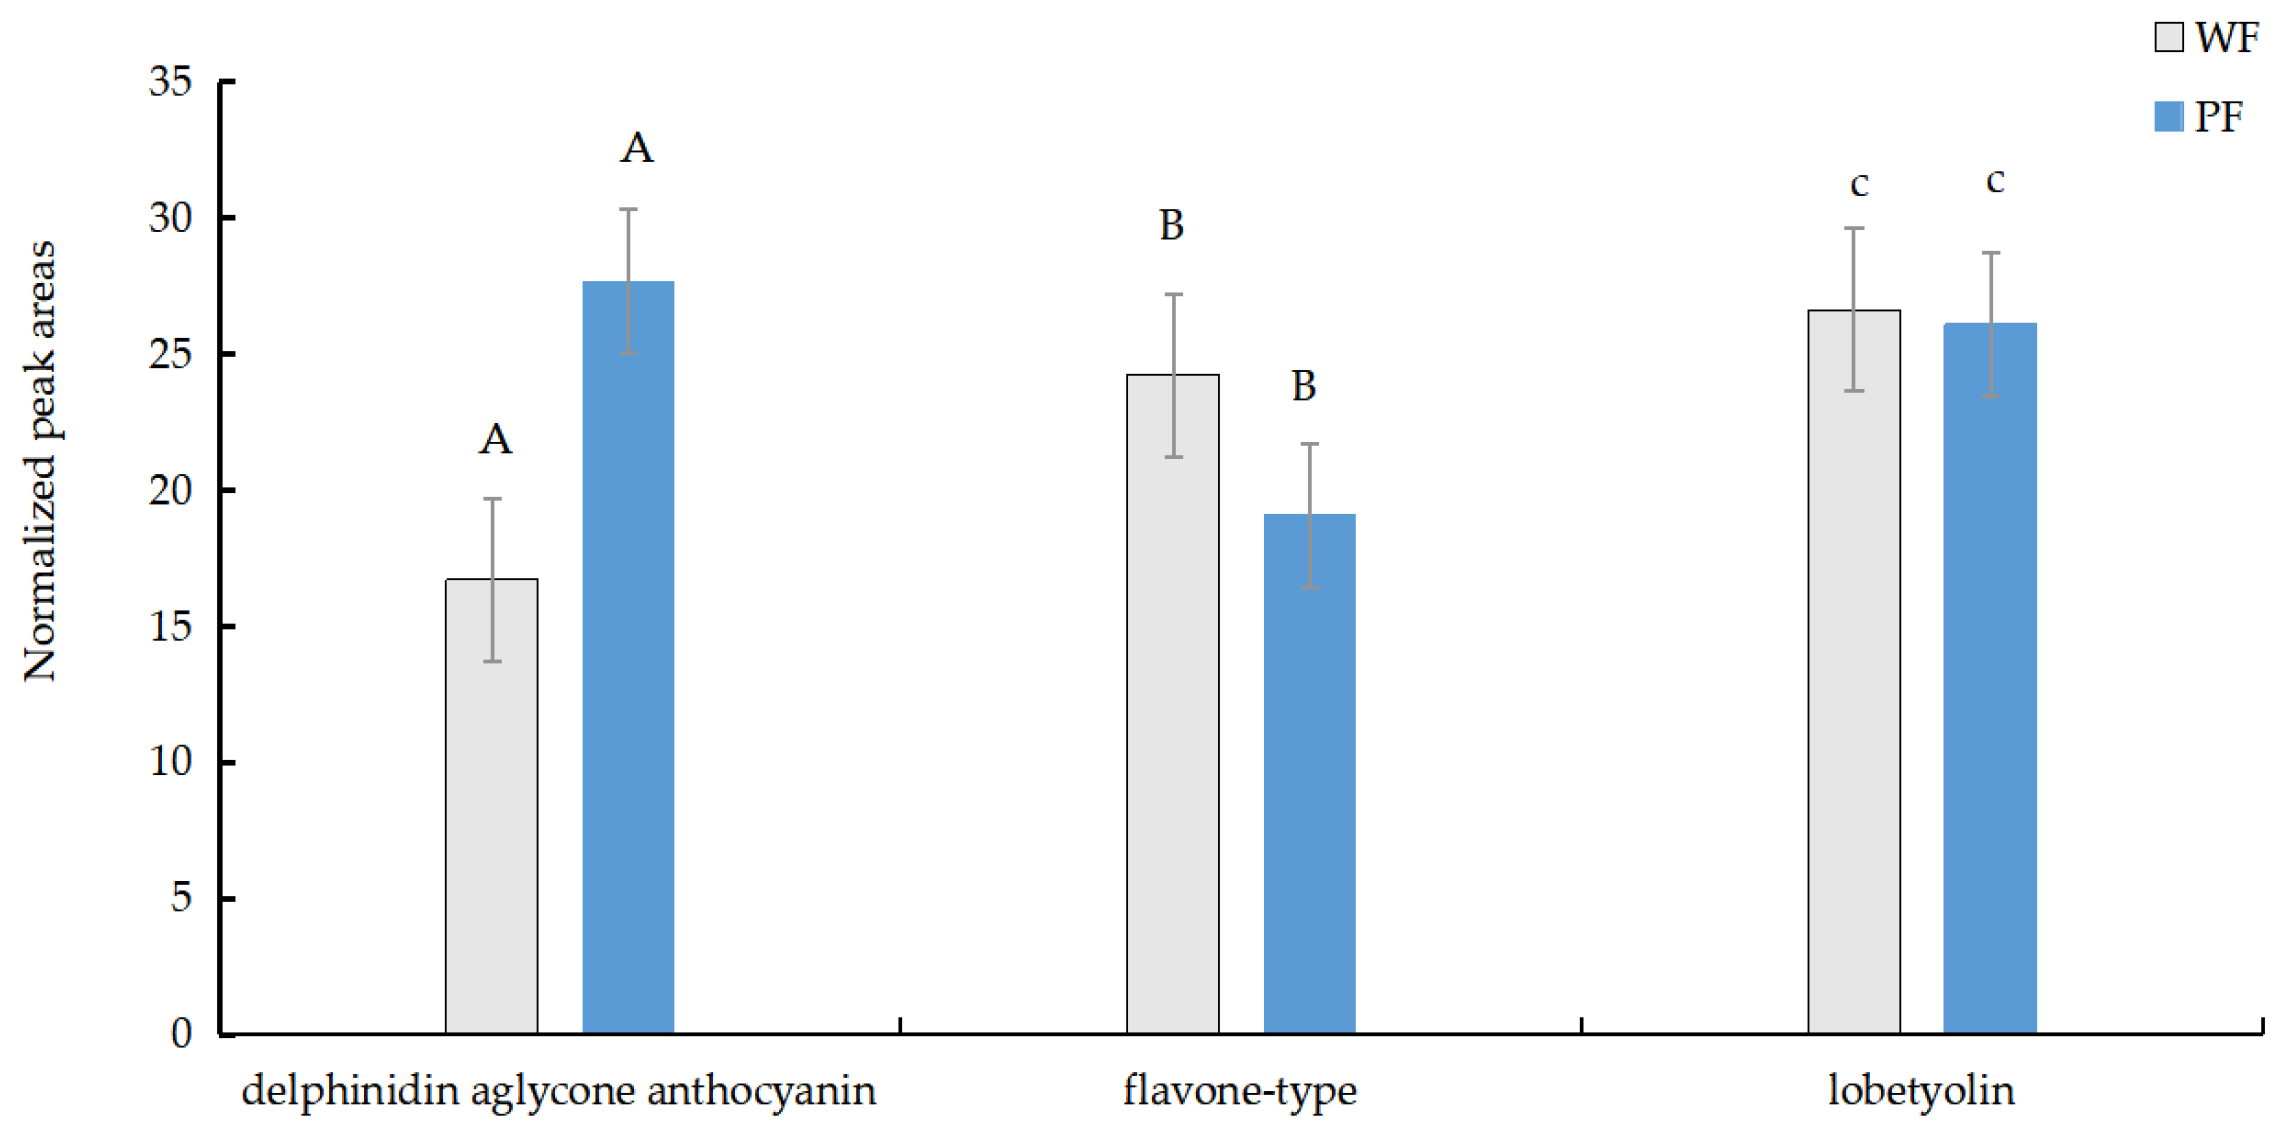
Figure 4.
Volcano plots of differentially expressed genes among WFs vs. PFs.
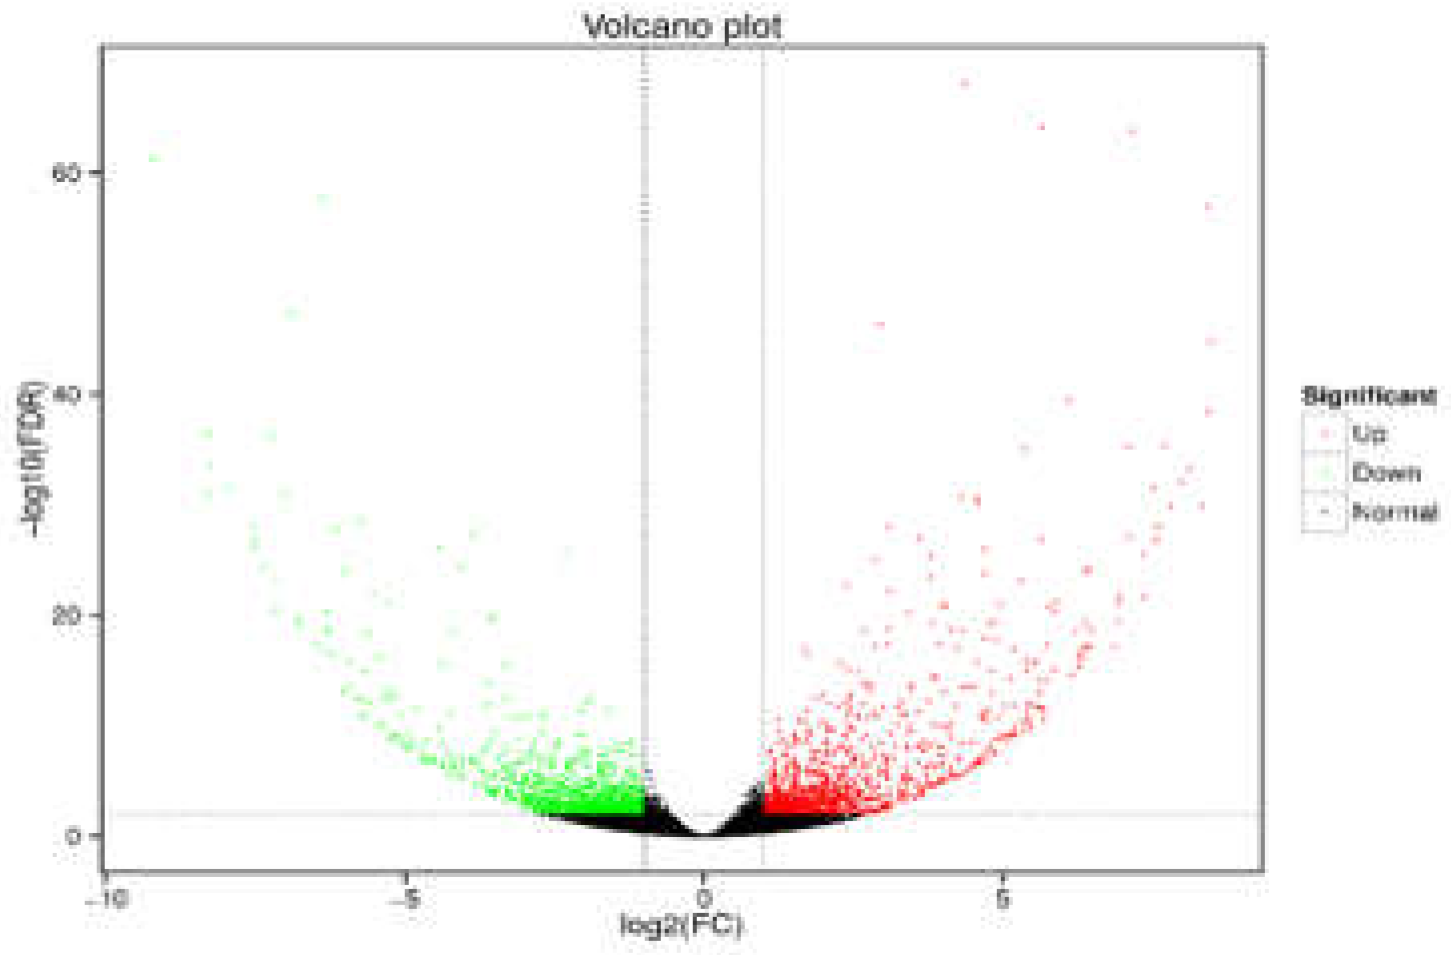
Figure 5.
KEGG analysis results of differentially expressed genes (A) classification analysis column chart; (B) enrichment analysis scatter diagram).
Figure 5.
KEGG analysis results of differentially expressed genes (A) classification analysis column chart; (B) enrichment analysis scatter diagram).
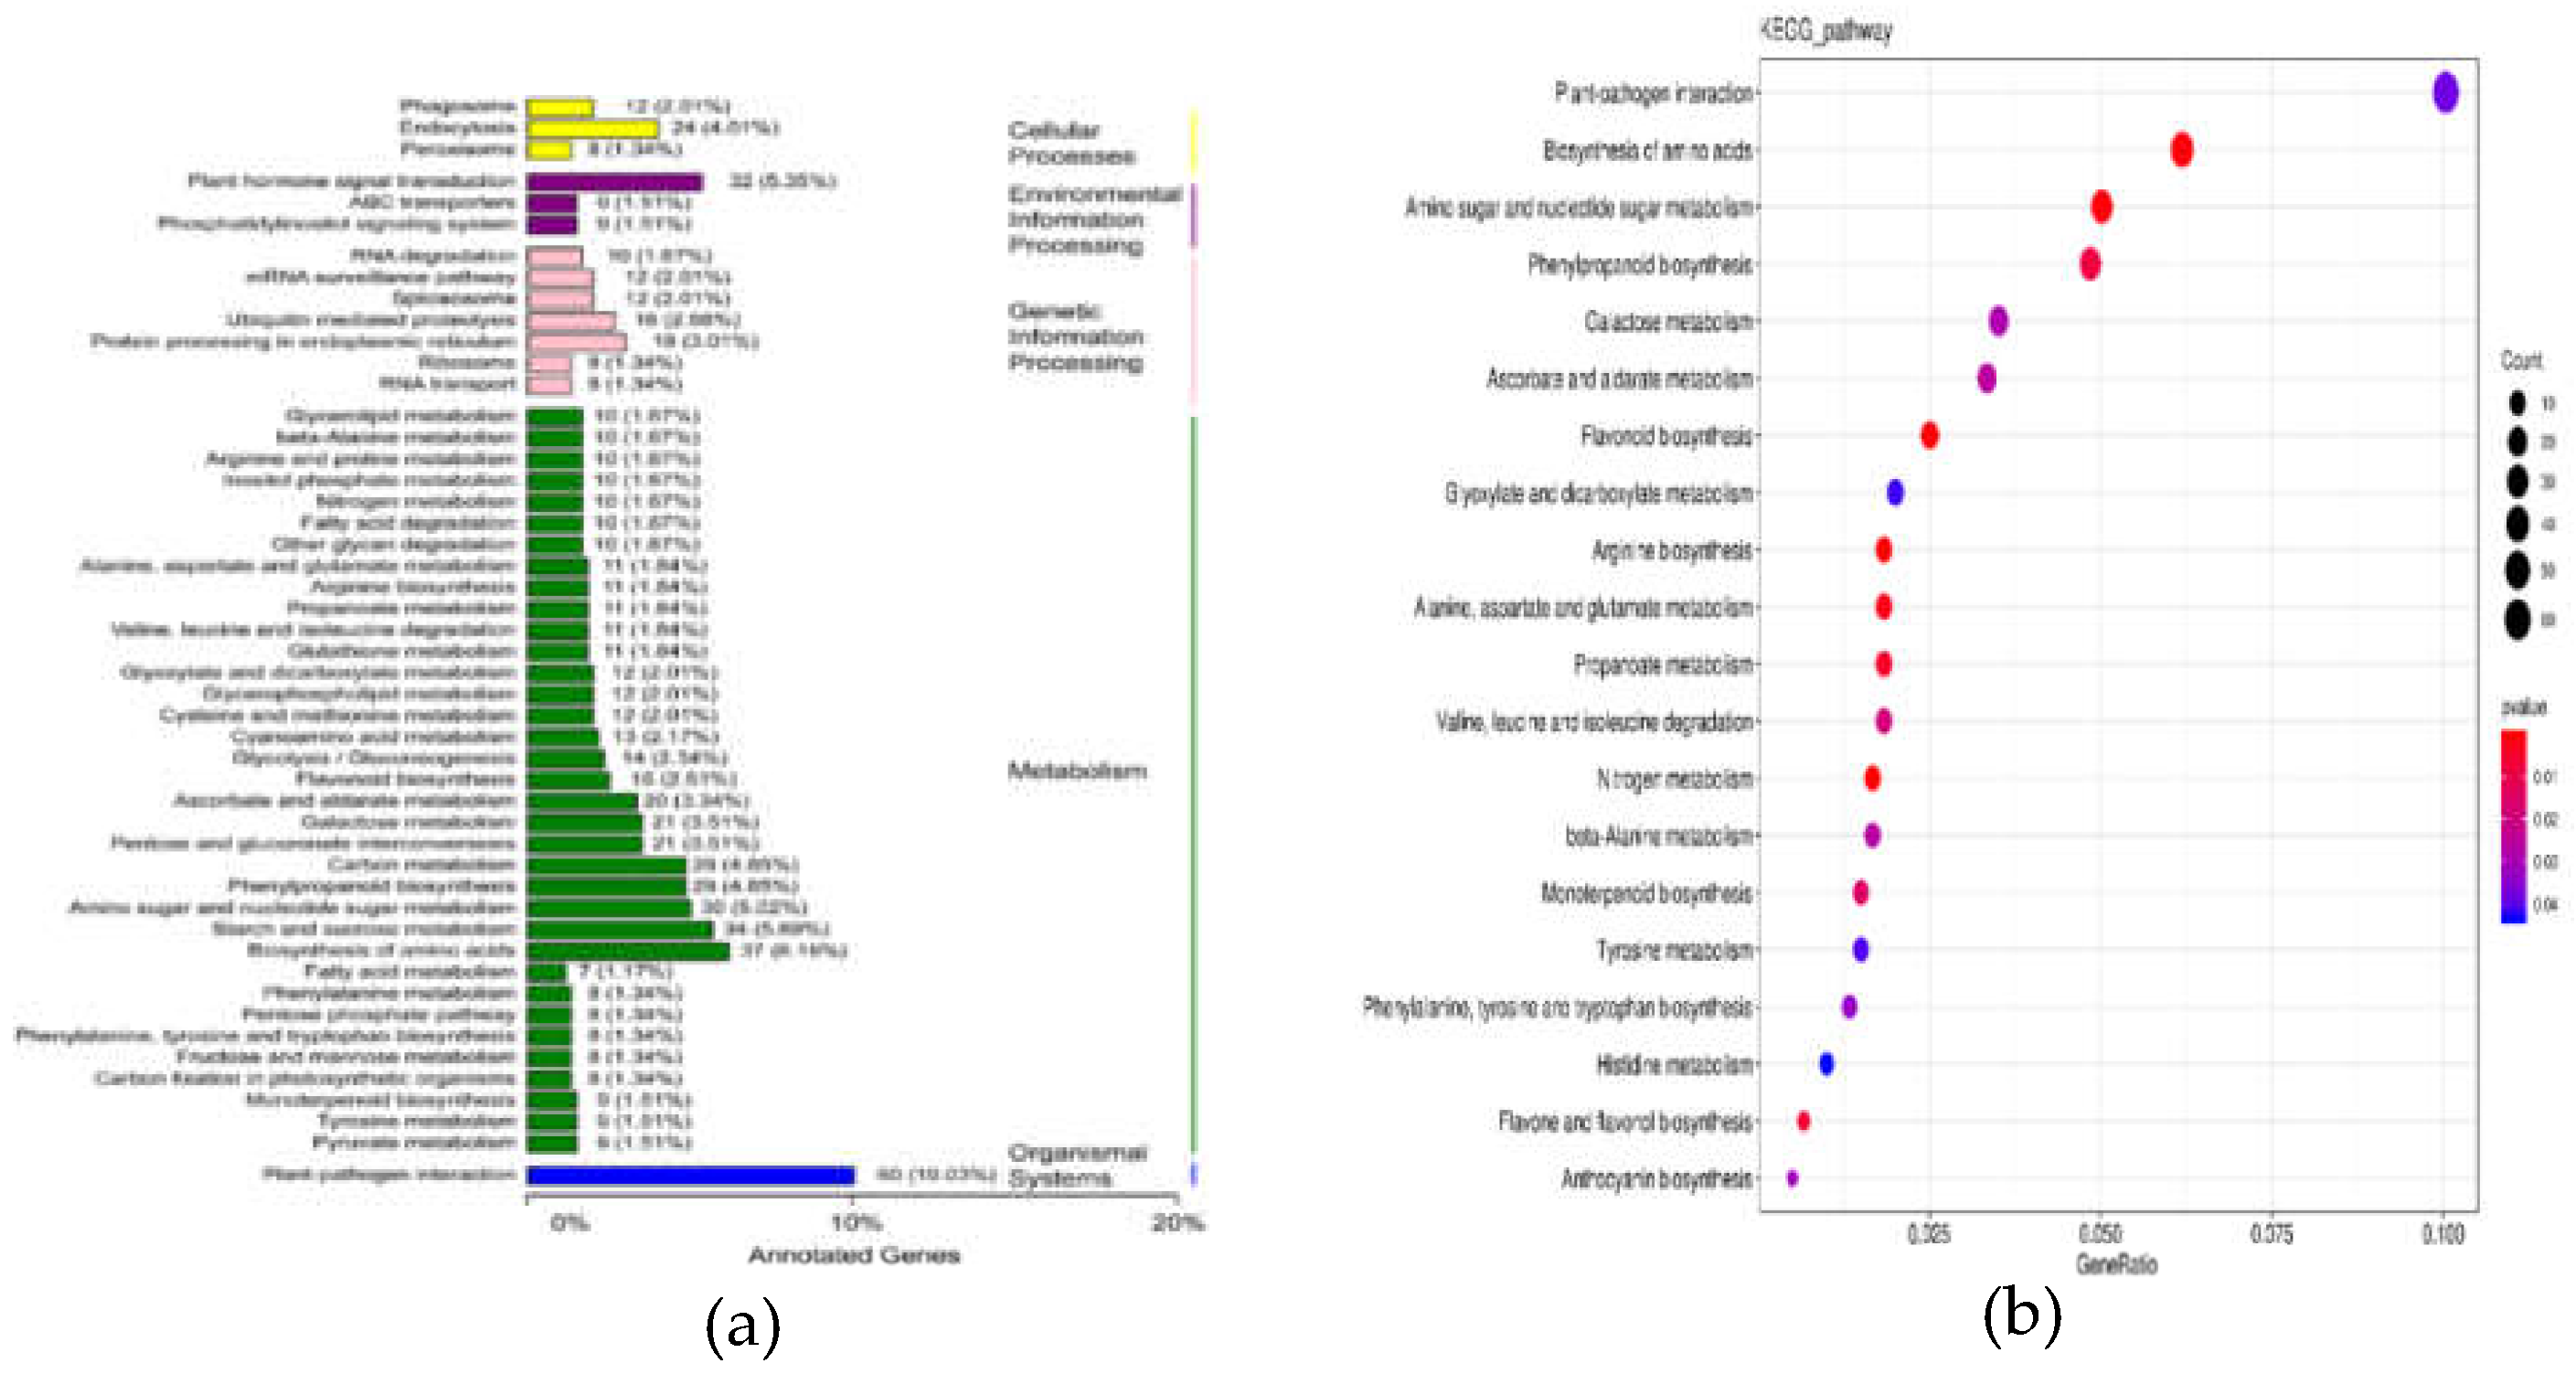
Table 2.
Transcrip tome seqencing data.
| Sample | Total | Clean reads number | Error rate (%) |
Mapped ratio (%) |
Q20 base percentage(%) | Q30 base percentage(%) |
|---|---|---|---|---|---|---|
| WFs-1 | 48,343,934 | 24,171,967 | <0.05 | 93.28% | 97.95 | 94.21 |
| WFs-2 | 42,370,336 | 21,185,168 | <0.05 | 92.55% | 97.94 | 94.21 |
| WFs-3 | 39,492,676 | 19,746,338 | <0.05 | 93.87% | 98.09 | 94.57 |
| PFs-1 | 55,798,134 | 27,899,067 | <0.05 | 92.59% | 97.83 | 93.98 |
| PFs-2 | 43,820,534 | 27,899,067 | <0.05 | 93.01% | 97.9 | 94.16 |
| PFs-3 | 43,820,534 | 21,655,204 | <0.05 | 93.30% | 97.99 | 94.35 |
Table 3.
Statistical table concerning the annotation of differentially expressed genes.
| DEG Set | Total | COG | GO | KEGG | KOG | NR | Pfam | Swiss-Prot | eggNOG |
|---|---|---|---|---|---|---|---|---|---|
| WFs vs. PFs | 1655 | 604 | 1388 | 1197 | 926 | 1632 | 1334 | 1224 | 1433 |
Table 4.
The key DEGs regulating the floral color formation.
| Gene Name | log₂FC | FDR | Regulation | Function Annotation |
|---|---|---|---|---|
| CYP98A2 | -2.41 | 4.33E-06 | down | 5-O-(4-coumaroyl)-D-quinate 3'-monooxygenase |
| BGLU18 | -2.03 | 4.49E-09 | down | Beta-glucosidase 18 |
| CYP73A12 | -2.53 | 0.000734427 | down | Trans-cinnamate 4-monooxygenase |
| AN3 | 6.15 | 1.99E-28 | up | naringenin,2-oxoglutarate 3-dioxygenase |
| DFR | 5.75 | 3.78E-29 | up | dihydroflavonol 4-reductase |
| CYP75A6 | 6.03 | 1.17E-13 | up | flavonoid-3',5'-hydroxylase |
| UGT29 | 2.44 | 6.75E-09 | up | UDP-glucosyltransferase 29-like |
| 3MAT | 2.02 | 0.001172479 | up | anthocyanin 3-O-glucoside-6''-O-malonyltransferase |
| F3GT1 | 6.32 | 1.51E-19 | up | anthocyanidin 3-O-glucosyltransferase |
| RT | 4.43 | 1.68E-10 | up | delphinidin 3-O-glucoside |
| HMA5 | 8.22 | 2.91E-34 | up | copper-transporting ATPase HMA5 |
| VPS35B | 4.89 | 1.15426E-08 | up | Vacuolar protein sorting-associated protein 35B |
Table 5.
The key DEGs regulating Transcription Factors Involved in Floral Color Formation.
| Group | Gene Name | log₂FC | FDR | Regulation | Function Annotation | |
|---|---|---|---|---|---|---|
| PFs | MYB4 | 4.71 | 1.23E-07 | up | Myb transcription factor C2 repressor motif protein | |
| bHLH2 | 2.02 | 0.0067 | up | bHLH-MYC and R2R3-MYB transcription factors N-terminal | ||
| WRKY44 | 4.23 | 9.04E-12 | up | WRKY transcription factor 44 | ||
| ARPC1A | 3.13 | 2.78E-07 | up | Anaphase-promoting complex subunit 4 WD40 domain | ||
| WFs | HARBI1 | 4.12 | 1.03E-09 | up | Myb/SANT-like DNA-binding domain | |
Disclaimer/Publisher’s Note: The statements, opinions and data contained in all publications are solely those of the individual author(s) and contributor(s) and not of MDPI and/or the editor(s). MDPI and/or the editor(s) disclaim responsibility for any injury to people or property resulting from any ideas, methods, instructions or products referred to in the content. |
© 2026 by the authors. Licensee MDPI, Basel, Switzerland. This article is an open access article distributed under the terms and conditions of the Creative Commons Attribution (CC BY) license (http://creativecommons.org/licenses/by/4.0/).
Copyright: This open access article is published under a Creative Commons CC BY 4.0 license, which permit the free download, distribution, and reuse, provided that the author and preprint are cited in any reuse.


