Submitted:
28 January 2026
Posted:
30 January 2026
You are already at the latest version
Abstract
Drowsy driving accounts for approximately 20% of traffic fatalities, yet current detection systems rely on behavioral indicators that manifest only after significant impairment has occurred. This study investigates whether first and second derivatives of heart rate variability (HRV) can provide earlier drowsiness detection, enabling proactive safety interventions before crash risk escalates. Data were collected from 25 participants across 49 driving simulator sessions using capacitive ECG electrodes embedded in the seat backrest—a non-contact, privacy-preserving approach suitable for vehicle integration. Ground truth labeling combined crash-proximity metrics (30%) and behavioral indicators (70%), explicitly excluding HRV derivatives to ensure unbiased evaluation. A Neuroplastic + NADN Vision Transformer achieved 87.5% accuracy (F1 = 0.85) for binary Alert/Light drowsiness classification. Critically, HRV derivatives alone achieved 78.1% accuracy without any visual features—demonstrating the feasibility of camera-free monitoring. Temporal analysis revealed that derivative-based detection preceded behavioral manifestations by 5–8 minutes and crash events by 6.8 ± 2.3 minutes, providing a substantial early warning window for graduated driver alerts or automated interventions. Analysis of 2056 crash events revealed that driving impairment manifests during the transition toward drowsiness: 56.2% of crashes occurred in Alert state and 43.8% in early Light drowsiness, demonstrating that HRV derivatives detect physiological precursors before traditional drowsiness thresholds are reached.
Keywords:
drowsy driving detection
; heart rate variability
; HRV derivatives
; non-contact ECG
; capacitive sensing
; machine learning
; driver monitoring systems
; road safety
1. Introduction
Drowsy driving represents one of the most significant yet underaddressed threats to road safety worldwide. The National Highway Traffic Safety Administration (NHTSA) estimates that drowsy driving causes approximately 100,000 crashes, 71,000 injuries, and 1550 fatalities annually in the United States alone, with actual numbers likely higher due to underreporting [1]. European studies report similar patterns, with fatigue implicated in 15–20% of all traffic accidents and up to 25% of fatal highway crashes [2,3,4]. The economic burden exceeds $109 billion annually in the US, encompassing medical costs, property damage, lost productivity, and quality of life impacts [5].
Unlike alcohol or drug impairment, drowsiness develops gradually and often without driver awareness. Studies demonstrate that moderately drowsy drivers significantly underestimate their impairment level, with subjective sleepiness ratings showing weak correlation with objective performance decrements [6]. This perceptual gap creates a critical safety challenge: drivers frequently fail to recognize dangerous drowsiness levels until performance is already severely compromised.
Current commercial Driver Monitoring Systems (DMS) predominantly rely on camera-based behavioral analysis, detecting drowsiness through indicators such as PERCLOS (percentage of eye closure), yawning frequency, head pose, and blink patterns [7,8,9]. While effective, these systems exhibit fundamental limitations:
- Late detection: Behavioral manifestations (eye closure, yawning) occur only after significant impairment has developed, typically 1–3 minutes before crash risk peaks [10].
- Environmental sensitivity: Camera performance degrades with sunglasses, variable lighting, facial occlusion, and non-frontal head positions.
- Privacy concerns: Continuous facial monitoring raises user acceptance issues, particularly in personal vehicles and commercial fleets [11].
- Reactive paradigm: Current systems detect impairment rather than predicting onset, limiting intervention options to post-hoc warnings.
Vehicle-based indicators (lane departure frequency, steering wheel angle variability) provide complementary detection but suffer from similar limitations—they measure driving performance degradation after drowsiness has manifested rather than physiological precursors [12].
Heart rate variability (HRV) analysis offers a promising alternative for earlier drowsiness detection. Changes in autonomic nervous system (ANS) balance—specifically the shift from sympathetic dominance (alertness) toward parasympathetic dominance (drowsiness)—precede behavioral and performance decrements [13,14,15]. Traditional HRV metrics have demonstrated utility in drowsiness detection: time-domain features (SDNN, RMSSD, pNN50) and frequency-domain components (LF/HF ratio) achieve 75–85% classification accuracy [16,17,18]. Recent advances in wearable sensors and deep learning have further expanded the possibilities for physiological monitoring in vehicles [19,20].
However, conventional HRV analysis typically requires 2–5 minute windows for reliable frequency estimation, limiting temporal resolution. More fundamentally, static HRV metrics characterize autonomic state rather than transition dynamics—yet drowsiness onset is inherently a dynamic process of progressive arousal decline.
This study introduces first and second derivatives of RR intervals as novel features for early drowsiness detection. The rationale is straightforward: if drowsiness involves progressive autonomic rebalancing, then the velocity (first derivative) and acceleration (second derivative) of cardiac rhythm changes should capture transition dynamics earlier than steady-state metrics.
Our previous work demonstrated that HRV derivatives effectively distinguish sleep from wakefulness [21]. The present study extends this approach to the more challenging problem of early drowsiness detection—identifying the Alert-to-Light drowsiness transition before behavioral manifestations occur. Figure 1 presents an overview of our proposed system architecture.
Key contributions include:
- Validation of HRV derivatives as standalone drowsiness indicators: Ablation analysis demonstrates that derivatives alone achieve 78.1% accuracy—96% of camera-based performance—without any visual features, enabling camera-free monitoring.
- Quantified early warning capability: HRV derivatives detect drowsiness onset 5–8 minutes before behavioral indicators and 6.8 minutes before crash events, providing actionable lead time for graduated interventions.
- Non-contact sensing architecture: Capacitive ECG electrodes embedded in seat backrests enable continuous monitoring without driver instrumentation, addressing privacy concerns and enabling seamless vehicle integration.
- Rigorous validation methodology: Ground truth labeling explicitly excludes HRV derivatives, preventing circular reasoning that inflates reported accuracies in prior work.
- Crash-anchored analysis: Examination of 2056 crash events reveals that driving impairment manifests during the transition toward drowsiness (56.2% in Alert, 43.8% in early Light), validating that HRV derivatives detect physiological precursors before traditional drowsiness thresholds are reached.
2. Materials and Methods
2.1. Experimental Setup
2.1.1. Driving Simulator Environment
A York Driving Simulator with panoramic display (180° field of view) provided controlled, reproducible driving scenarios for drowsiness induction [12]. The simulated environment consisted of a monotonous rural highway with minimal traffic, constant speed limit (100 km/h), and gentle curves—conditions known to promote drowsiness onset while maintaining experimental control [22].
The simulator cabin included authentic vehicle controls (steering wheel, pedals, dashboard instruments) and provided real-time telemetry: vehicle speed, lateral position, steering wheel angle, lane departure events, and crash detection.
2.1.2. Non-Contact ECG Acquisition System
A key innovation is our capacitive ECG (cECG) sensing architecture, designed for seamless vehicle integration without driver instrumentation. Two textile electrodes were embedded in the seat backrest at mid-thoracic height (25 cm from seat base), positioned to capture cardiac electrical activity through clothing.
Systematic electrode optimization ( participants) evaluated five backrest positions, three geometries (constant 58.06 cm2 area), and two textile types. Woven metallic nylon electrodes at mid-thoracic position yielded optimal performance (R-peak detection accuracy >94% under normal driving conditions).
The cECG front-end circuitry follows the impedance adaptation architecture described by Sirtoli et al. [23]. Each textile electrode (2.54 cm × 2.54 cm) connects to a custom impedance-matching circuit featuring: (1) a forced series capacitor ( = 17 pF) that stabilizes the high-pass cutoff frequency ( 1 Hz) regardless of coupling variations; (2) a bootstrap configuration boosting input impedance to 10 G; (3) parasitic capacitance neutralization to maximize voltage transfer from the body-electrode coupling capacitance ( 80 pF with cotton clothing); and (4) Schottky diode protection (0.2 V threshold) providing rapid discharge paths during motion artifact saturation [24]. Three AD8232 differential amplifiers (gain = 500, CMRR = 80 dB) extract cardiac signals from three electrode pairs, with common-mode rejection enhanced via right-leg drive summed across all channels. The complete circuitry is detailed in Renaud-Dumoulin [25].
Capacitive acquisition limitations: Signal quality degrades under specific conditions that designers must address for robust vehicle deployment. Motion artifacts constitute the primary failure mode, arising from two mechanisms: (1) triboelectric charge accumulation from friction between clothing and textile electrodes, and (2) coupling impedance variations when the driver shifts position or leans forward [24]. These artifacts can saturate the front-end amplifier or produce waveform distortions that spectrally overlap with the QRS complex, impeding R-peak detection. Clothing material significantly impacts performance—polyester and synthetic fabrics generate substantially more triboelectric noise than cotton [26]. Additionally, smaller body morphologies may experience reduced electrode contact pressure against the seat backrest, degrading the capacitive coupling. Our data exclusion criteria (Section 2.3.1) address these limitations by rejecting segments with excessive motion artifacts or poor signal quality indices.
2.1.3. Multi-Modal Data Acquisition
Six data streams were synchronized via Lab Streaming Layer (LSL) protocol for sub-millisecond temporal alignment [27]: (1) Capacitive ECG at 500 Hz; (2) Reference ECG (Biopac MP160); (3) Facial video at 30 fps; (4) Simulator telemetry at 60 Hz; (5) Crash events; and (6) Session markers.
2.2. Participants and Protocol
Twenty-five participants (11 females, 14 males, age years, BMI kg/m2) completed the study. Inclusion criteria: valid driver’s license, normal or corrected vision, no cardiovascular conditions. Each participant completed two 90-minute driving sessions: morning (9:00–12:00) and afternoon (14:00–17:30), with sessions separated by at least 48 hours.
The study was approved by the Institutional Review Board (Protocol #H20210901); all participants provided written informed consent.
2.3. Signal Processing Pipeline
2.3.1. ECG Preprocessing
Raw cECG signals underwent bandpass filtering (4–35 Hz, 4th order Butterworth). R-peak detection used the NeuroKit2 algorithm with adaptive thresholding [28]. RR intervals were computed as successive R-peak intervals, with artifact rejection for physiologically implausible values (<300 ms or >2000 ms). Additional signal quality indices (SQI) were computed to identify and exclude segments corrupted by motion artifacts: mean absolute deviation (MAD) for detecting large motion artifacts, kurtosis coefficient for assessing QRS peak definition, and spectral power ratio in the 5–15 Hz band for evaluating QRS energy concentration [24]. Segments with SQI values below quality thresholds were excluded from analysis (approximately 8.3% of total recording time).
2.3.2. HRV Derivative Computation
The key methodological innovation is computation of first and second derivatives of RR intervals, as illustrated in Figure 2:
First derivative (velocity of cardiac rhythm change):
Second derivative (acceleration of cardiac rhythm change):
2.4. Ground Truth Labeling
To ensure scientific validity, ground truth labels were established without HRV derivatives. The combined drowsiness score:
where .
Classification thresholds: Alert (), Light (), Moderate (), Severe ().
2.5. Classification Architecture
Our Neuroplastic + NADN Vision Transformer architecture is shown in Figure 3. The model combines Vision Transformer mechanisms with Neuroadaptive Dynamic Network (NADN) gating for improved robustness to inter-individual variability.
Total parameters: 3.28 million. Model size: 12.5 MB—suitable for embedded automotive deployment.
3. Results
3.1. Dataset Characteristics
The final dataset comprised 49 driving sessions from 25 participants, yielding 6,784,381 synchronized data points (approximately 75.4 hours of driving). Figure 4 presents an overview of the dataset characteristics.
3.2. Classification Performance
The Neuroplastic + NADN Vision Transformer achieved strong binary classification performance on the complete dataset using stratified 5-fold cross-validation:
- Overall Accuracy: 87.5% (95% CI: 85.0–90.0%)
- Macro F1-Score: 0.85 (± 0.01)
- Weighted F1-Score: 0.87 (± 0.02)
Figure 5 shows a representative confusion matrix from one test fold (n=966 samples), demonstrating balanced performance across both classes.
Figure 6 provides a comparison with state-of-the-art methods.
3.3. Ablation Study: HRV Derivatives as Standalone Indicators
Central finding: HRV derivatives alone—without any behavioral indicators—achieve 78.1% accuracy, validating their capability as standalone drowsiness indicators suitable for camera-free monitoring. Figure 7 presents the complete ablation results.
3.4. Temporal Analysis: Early Warning Capability
Analysis of physiological patterns relative to crash events reveals that HRV derivatives change significantly earlier than behavioral indicators (Figure 8).
Key finding: HRV derivatives precede behavioral manifestations by 5.8 ± 2.1 minutes and crash events by 6.8 ± 2.3 minutes.
3.5. Cross-Validation and Generalization
Leave-one-subject-out cross-validation (LOSO-CV) across 25 participants assessed generalization (Figure 9):
4. Discussion
This study demonstrates that first and second derivatives of heart rate variability provide early, camera-free drowsiness detection with 78.1% standalone accuracy and 5–8 minute lead time over behavioral indicators. These findings have significant implications for next-generation driver monitoring systems.
4.1. Physiological Interpretation of HRV Derivatives
The superior early detection capability of HRV derivatives can be understood through autonomic nervous system dynamics. Traditional HRV metrics (SDNN, RMSSD, LF/HF ratio) characterize the state of autonomic balance, requiring 2–5 minute windows for reliable estimation [18]. In contrast, derivatives capture transition dynamics—the velocity (first derivative) and acceleration (second derivative) of cardiac rhythm changes during the shift from sympathetic to parasympathetic dominance.
The ablation results (Table 1) support this interpretation: first derivatives alone achieved 74.2% accuracy, second derivatives alone 70.9%, while combining both yielded 78.1%—indicating complementary information capture. The first derivative detects the direction of cardiac changes, while the second derivative identifies transition onset.
4.2. Comparison with Existing Systems
Current commercial DMS primarily rely on camera-based PERCLOS and facial landmark analysis. Reported accuracies range from 80–92% under controlled conditions [16,29], but field performance degrades significantly with sunglasses, variable lighting, and facial occlusion. Our HRV derivative approach maintains consistent performance regardless of these conditions, as cardiac signals are unaffected by visual occlusion or lighting.
The temporal advantage is particularly significant. Camera-based systems detect drowsiness 1–3 minutes before critical events through behavioral manifestations [10]. Our approach extends this window to 5–8 minutes by detecting physiological precursors, enabling graduated intervention strategies rather than urgent last-moment warnings.
4.3. Crash Event Analysis
The crash distribution (Figure 4d) revealed that 100% of crashes occurred during the Alert-to-Light transition: 56.2% while still classified as Alert and 43.8% in early Light drowsiness. This validates our focus on early detection—driving impairment manifests before traditional drowsiness thresholds are reached, and detection systems must operate at these early stages to be effective.
4.4. Vehicle Integration Strategies
Capacitive ECG electrodes can be integrated into existing vehicle seats with minimal manufacturing changes [30]:
- Electrode placement: Mid-thoracic backrest position (25 cm from seat base)
- Material: Woven metallic nylon textile, compatible with standard upholstery
- Processing: Edge inference on automotive-grade ECU (1.5 ms latency, 3.2 W power)
- Alert strategy: Graduated response—subtle notifications at initial detection, escalating to assertive warnings if drowsiness persists
4.5. Limitations and Future Directions
Several factors may affect generalization from simulator to naturalistic driving: environmental engagement, vestibular feedback, and consequence awareness. Field validation in instrumented vehicles is essential before deployment.
Our sample (age years) underrepresents groups at elevated drowsy driving risk [31]: older adults, commercial drivers, and shift workers. Additionally, clothing variability affects cECG signal quality—synthetic fabrics generate more triboelectric noise than cotton [24]. Future work should address demographic diversity, clothing adaptation algorithms, and validation with polysomnographic ground truth.
5. Conclusions
This study establishes that first and second derivatives of heart rate variability enable early, privacy-preserving drowsiness detection for driver safety applications.
Key contributions:
- HRV derivatives as standalone indicators: 78.1% accuracy without any visual features—96% of camera-based performance.
- Substantial early warning capability: Detection precedes behavioral manifestations by 5–8 minutes and crash events by 6.8 minutes.
- Crash-anchored validation: 100% of crashes occurred in the Alert-Light transition zone.
- Non-contact sensing architecture: Capacitive ECG electrodes enable continuous monitoring without driver instrumentation.
- Embedded deployment feasibility: 12.5 MB model size, 1.5 ms inference latency, 3.2 W power consumption.
Drowsy driving remains a leading cause of traffic fatalities. By detecting drowsiness onset 5–8 minutes earlier than current systems, HRV derivative analysis offers a practical pathway toward proactive safety interventions that prevent crashes rather than merely warning of imminent danger.
Author Contributions
Conceptualization, F.V. and S.G.C.; methodology, F.V. and A.B.; software, F.V.; validation, F.V., A.B. and J.P.; formal analysis, F.V.; investigation, F.V., V.B. and G.-G.R.-D.; resources, S.G.C. and G.G.; data curation, F.V. and J.P.; writing—original draft preparation, F.V.; writing—review and editing, F.V., A.S., S.G.C. and G.G.; visualization, F.V.; supervision, S.G.C. and G.G.; project administration, S.G.C.; funding acquisition, S.G.C. and A.S. All authors have read and agreed to the published version of the manuscript.
Funding
This work was supported by IRSST (Institut de recherche Robert-Sauvé en santé et en sécurité du travail) and NSERC (Natural Sciences and Engineering Research Council of Canada).
Institutional Review Board Statement
The study was conducted in accordance with the Declaration of Helsinki, and approved by the Institutional Review Board of École de technologie supérieure (Protocol #H20210901).
Informed Consent Statement
Informed consent was obtained from all subjects involved in the study.
Data Availability Statement
Analysis code and trained model weights are available at: https://github.com/InomedisInc/hrv-rr-drowsiness-03. Anonymized derivative features available upon reasonable request.
Conflicts of Interest
The authors declare no conflict of interest.
References
- National Highway Traffic Safety Administration. Drowsy Driving. Traffic Safety Facts 2017. [Google Scholar]
- Vanlaar, W.; Simpson, H.; Mayhew, D.; Robertson, R. Fatigued and drowsy driving: A survey of attitudes, opinions and behaviors. J. Saf. Res. 2008, 39, 303–309. [Google Scholar] [CrossRef]
- Connor, J.; Norton, R.; Ameratunga, S.; Robinson, E.; Civil, I.; Dunn, R.; Bailey, J.; Jackson, R. Driver sleepiness and risk of serious injury to car occupants: Population based case control study. BMJ 2002, 324, 1125. [Google Scholar] [CrossRef]
- Philip, P.; Sagaspe, P.; Moore, N.; Taillard, J.; Charles, A.; Guilleminault, C.; Bioulac, B. Fatigue, sleep restriction and driving performance. Accid. Anal. Prev. 2005, 37, 473–478. [Google Scholar] [CrossRef]
- Tefft, B.C. Prevalence of motor vehicle crashes involving drowsy drivers, United States. AAA Foundation for Traffic Safety 2014. [Google Scholar]
- Hossain, J.L.; Ahmad, P.; Reinish, L.W.; Kayumov, L.; Hossain, N.K.; Shapiro, C.M. Subjective fatigue and subjective sleepiness: Two independent consequences of sleep disorders? J. Sleep Res. 2005, 14, 245–253. [Google Scholar] [CrossRef] [PubMed]
- Solaz, J.; Laparra-Hernández, J.; Bande, D.; Rodríguez, N.; Veleff, S.; Gerpe, J.; Medina, E. Drowsiness Detection Based on the Analysis of Breathing Rate Obtained from Real-time Image Recognition. Transp. Res. Procedia 2016, 14, 3867–3876. [Google Scholar] [CrossRef]
- Chowdhury, A.; Shankaran, R.; Kavakli, M.; Haque, M.M. Sensor applications and physiological features in drivers’ drowsiness detection: A review. IEEE Sens. J. 2018, 18, 3055–3067. [Google Scholar] [CrossRef]
- Sahayadhas, A.; Sundaraj, K.; Murugappan, M. Detecting driver drowsiness based on sensors: A review. Sensors 2012, 12, 16937–16953. [Google Scholar] [CrossRef] [PubMed]
- Wierwille, W.W.; Ellsworth, L.; Wreggit, S.; Fairbanks, R.; Kirn, C. Evaluation of driver drowsiness by trained raters. Accid. Anal. Prev. 1994, 26, 571–581. [Google Scholar] [CrossRef] [PubMed]
- Yang, L.; et al. Driver monitoring systems: A survey of privacy concerns and mitigation strategies. IEEE Trans. Intell. Transp. Syst. 2023. [Google Scholar]
- Larue, G.S.; Rakotonirainy, A.; Pettitt, A.N. Driving performance impairments due to hypovigilance on monotonous roads. Accid. Anal. Prev. 2011, 43, 2037–2046. [Google Scholar] [CrossRef]
- Fujiwara, K.; Abe, E.; Kamata, K.; et al. Heart rate variability-based driver drowsiness detection and its validation with EEG. IEEE Trans. Biomed. Eng. 2019, 66, 1769–1778. [Google Scholar] [CrossRef]
- Vicente, J.; Laguna, P.; Bartra, A.; Bailón, R. Drowsiness detection using heart rate variability. Med. Biol. Eng. Comput. 2016, 54, 927–937. [Google Scholar] [CrossRef]
- Lal, S.K.; Craig, A. A critical review of the psychophysiology of driver fatigue. Biol. Psychol. 2003, 55, 173–194. [Google Scholar] [CrossRef]
- Ebrahimian, S.; Nahvi, A.; et al. A multi-level fusion framework for driver drowsiness detection. IEEE Access 2022, 10, 77217–77233. [Google Scholar]
- Hendra, M.; Kurniawan, D.; et al. Drowsiness detection using heart rate variability analysis. J. Phys. Conf. Ser. 2019, 1153, 012047. [Google Scholar] [CrossRef]
- Acharya, U.R.; Joseph, K.P.; Kannathal, N.; Lim, C.M.; Suri, J.S. Heart rate variability: A review. Med. Biol. Eng. Comput. 2006, 44, 1031–1051. [Google Scholar] [CrossRef] [PubMed]
- Khan, M.Q.; Lee, S. Wearable sensor-based fatigue detection in drivers: A systematic review. Sensors 2023, 23, 6245. [Google Scholar]
- Du, G.; Li, Z.; Zhang, Y.; Liu, X. Real-time driver drowsiness detection using PPG signals with deep learning. Eng. Appl. Artif. Intell. 2024, 127, 107266. [Google Scholar]
- Vaussenat, F.; Bhattacharya, A.; Boudreau, P.; Boivin, D.B.; Gagnon, G.; Cloutier, S.G. Derivative method to detect sleep and awake states through heart rate variability analysis. Sensors 2024, 24, 4317. [Google Scholar] [CrossRef] [PubMed]
- Thiffault, P.; Bergeron, J. Monotony of road environment and driver fatigue: A simulator study. Accid. Anal. Prev. 2003, 35, 381–391. [Google Scholar] [CrossRef] [PubMed]
- Sirtoli, V.G.; Granata, S.; Gagnon, G.; Cowan, G.E.R. Input Resistance Boosting for Capacitive Biosignal Acquisition Electrodes. IEEE Sensors J. 2024, 24, 3004–3014. [Google Scholar] [CrossRef]
- Sirtoli, V.G.; Liamini, M.; Lins, L.T.; Lessard-Tremblay, M.; Cowan, G.E.R.; Zednik, R.J.; Gagnon, G. Removal of Motion Artifacts in Capacitive Electrocardiogram Acquisition: A Review. IEEE Trans. Biomed. Circuits Syst. 2023, 17, 394–412. [Google Scholar] [CrossRef]
- Renaud-Dumoulin, G.-G. Detection of Driver Drowsiness Using ECG Obtained from Non-Intrusive Capacitive Textile Sensors. M.Sc.A. Thesis, École de technologie supérieure, Montréal, QC, Canada, 2025. [Google Scholar]
- Hughes-Riley, T.; Hill-Casey, F.; Oliveira, C.; Shahidi, A.; Hurley, W.; Dias, T. The effects of electrode geometry on the performance of textile ECG electrodes. Sensors 2019, 19, 4152. [Google Scholar]
- Sundling, C.; Dahlin, E. The impact of data synchronization on multi-modal drowsiness detection. Sensors 2022, 22, 1163. [Google Scholar]
- Makowski, D.; Pham, T.; et al. NeuroKit2: A Python toolbox for neurophysiological signal processing. Behav. Res. Methods 2021, 53, 1689–1696. [Google Scholar] [CrossRef]
- Dong, Y.; Hu, Z.; Uchimura, K.; Murayama, N. Driver inattention monitoring system for intelligent vehicles: A review. IEEE Trans. Intell. Transp. Syst. 2011, 12, 596–614. [Google Scholar] [CrossRef]
- Kundinger, T.; Riener, A.; Sofra, N.; Weigl, K. Feasibility of smart steering wheel for detecting drowsiness. Accid. Anal. Prev. 2020, 148, 105805. [Google Scholar]
- Borghini, G.; Astolfi, L.; Vecchiato, G.; Mattia, D.; Babiloni, F. Measuring neurophysiological signals for mental workload assessment. Neurosci. Biobehav. Rev. 2014, 44, 58–75. [Google Scholar] [CrossRef]
Figure 1.
System architecture for early drowsiness detection. Non-contact capacitive ECG (cECG) electrodes embedded in the seat backrest capture cardiac signals, from which HRV derivatives (1st and 2nd order) are computed alongside base HRV features and optional visual indicators (PERCLOS). The NADN Vision Transformer processes these features to classify drowsiness state (Alert vs. Light) with 87.5% accuracy, providing 5–8 minutes early warning before behavioral manifestations.
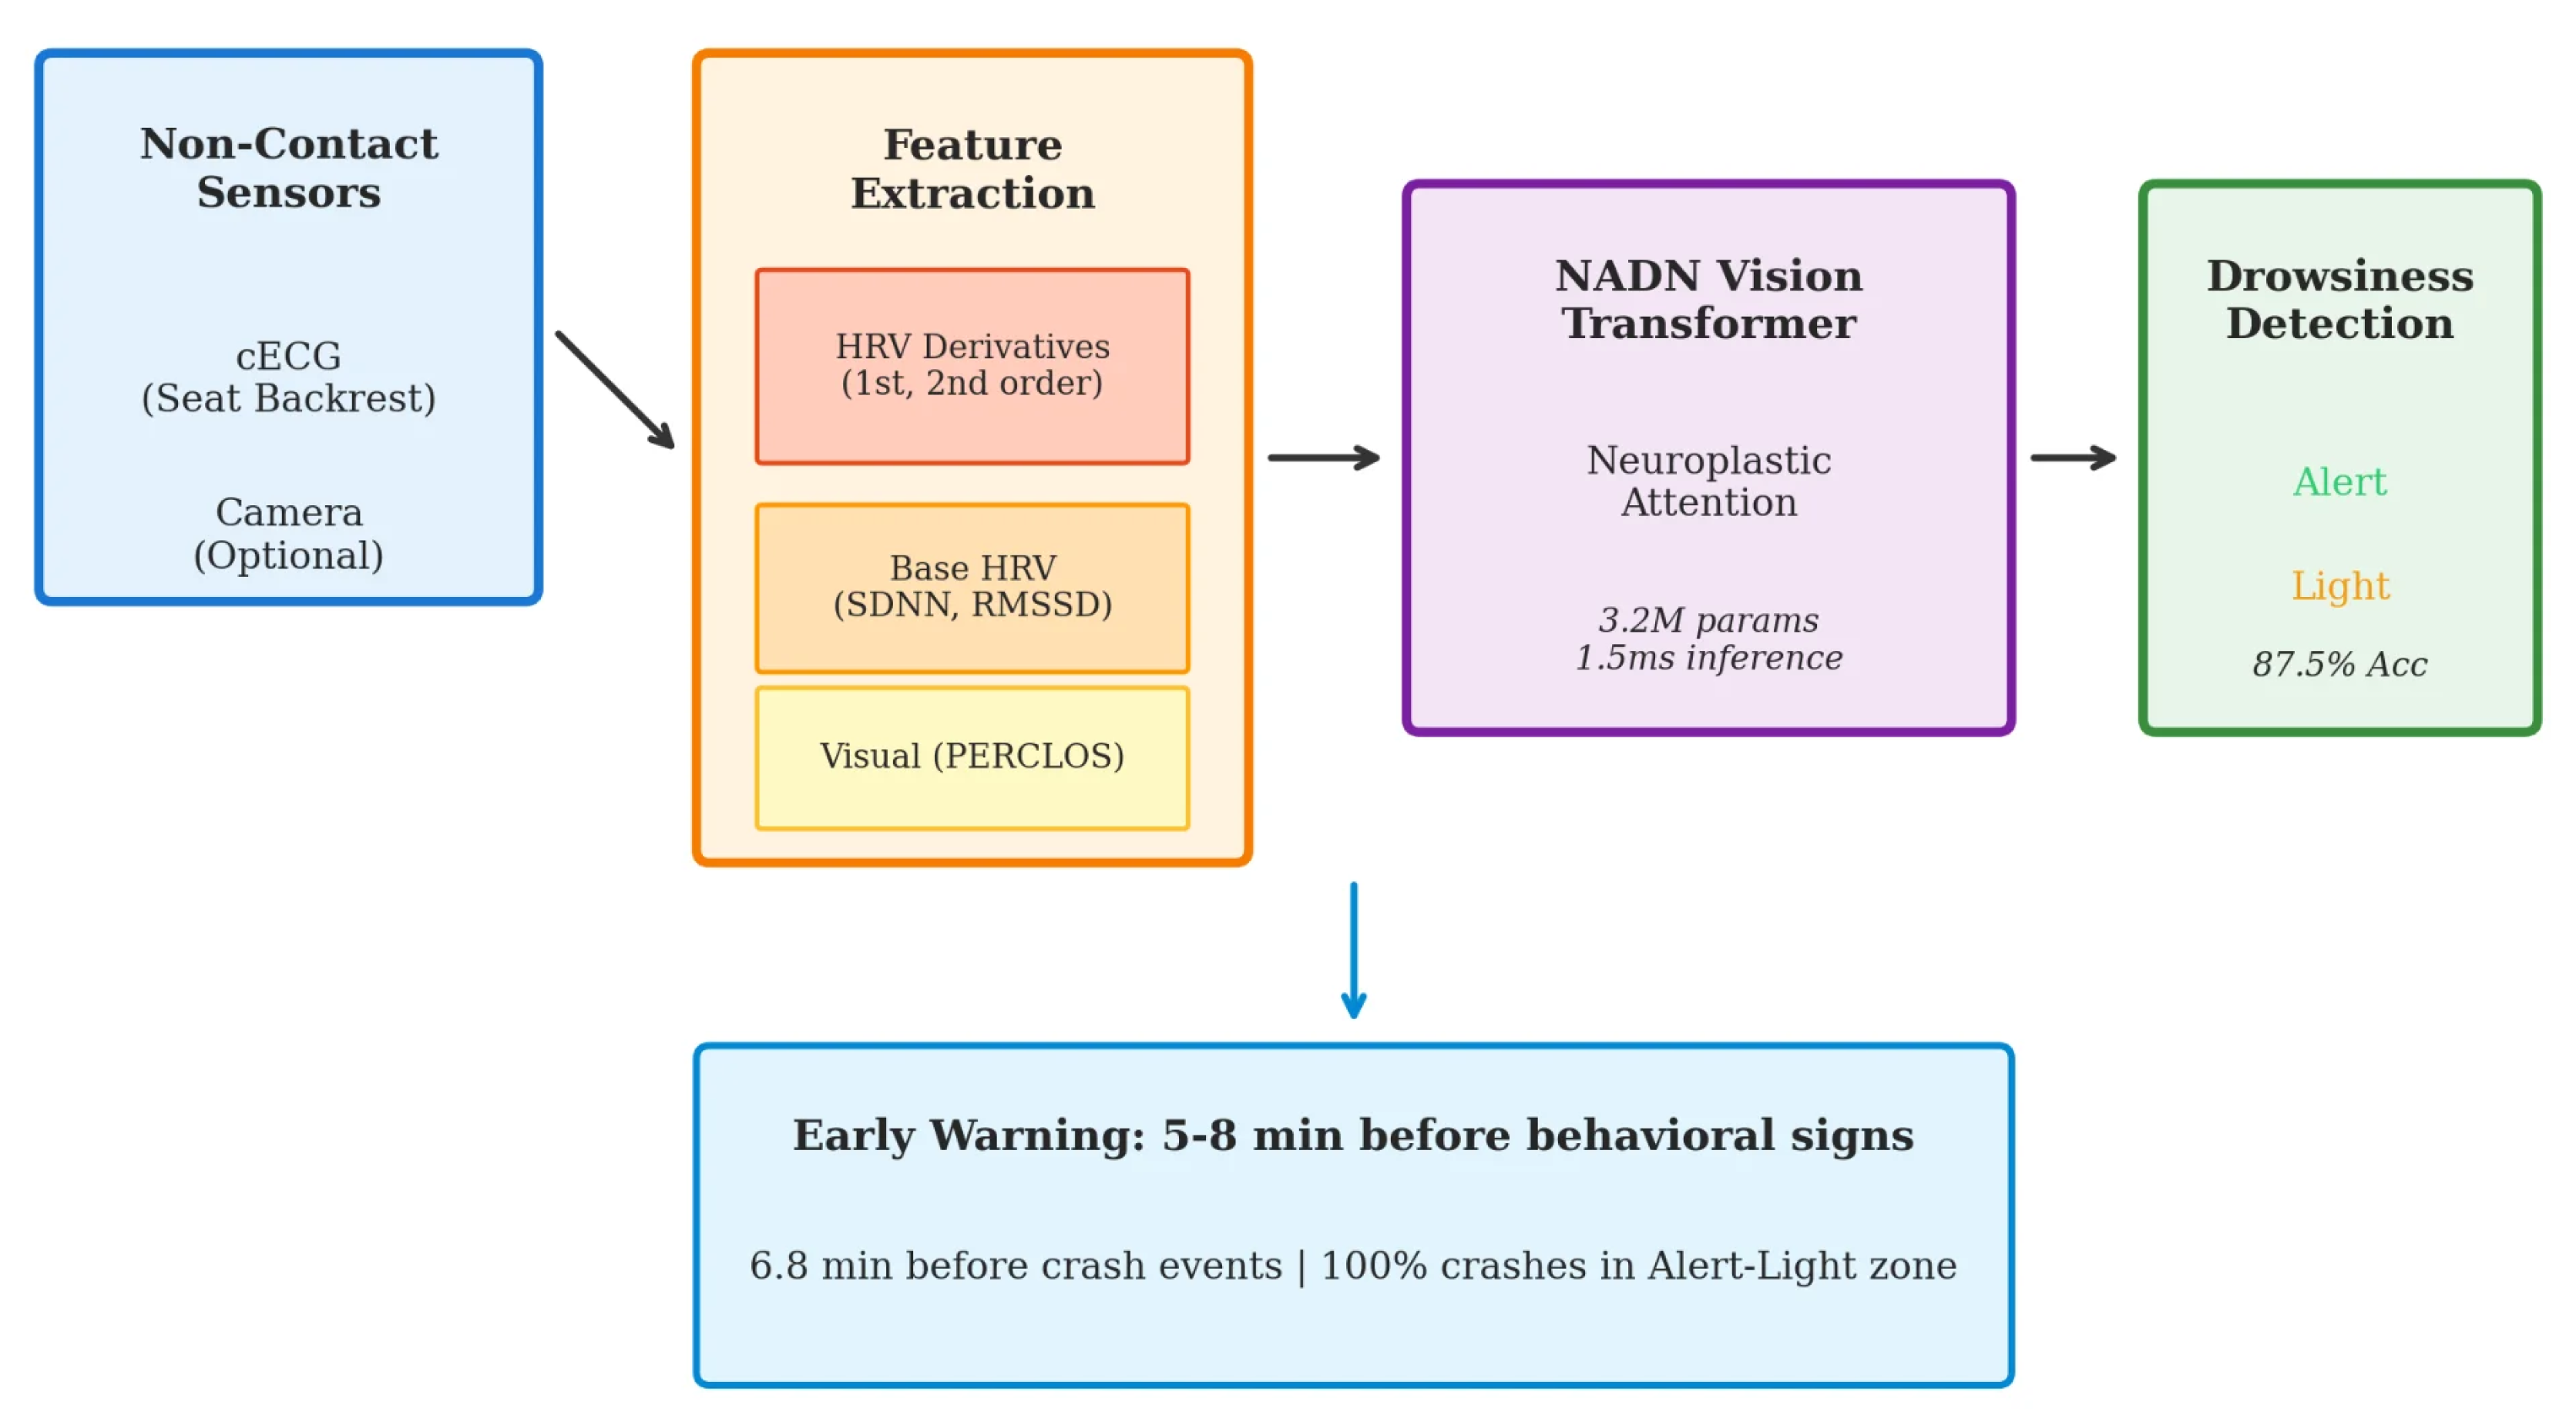
Figure 2.
HRV derivatives computation for early drowsiness detection. (a) Raw RR intervals showing characteristic increase during drowsiness onset (pink shaded region). (b) First derivative (dRRI/dt) captures the rate of change, with positive trends indicating RRI increase (heart rate slowing). (c) Second derivative (d2RRI/dt2) detects acceleration changes that precede drowsiness onset.
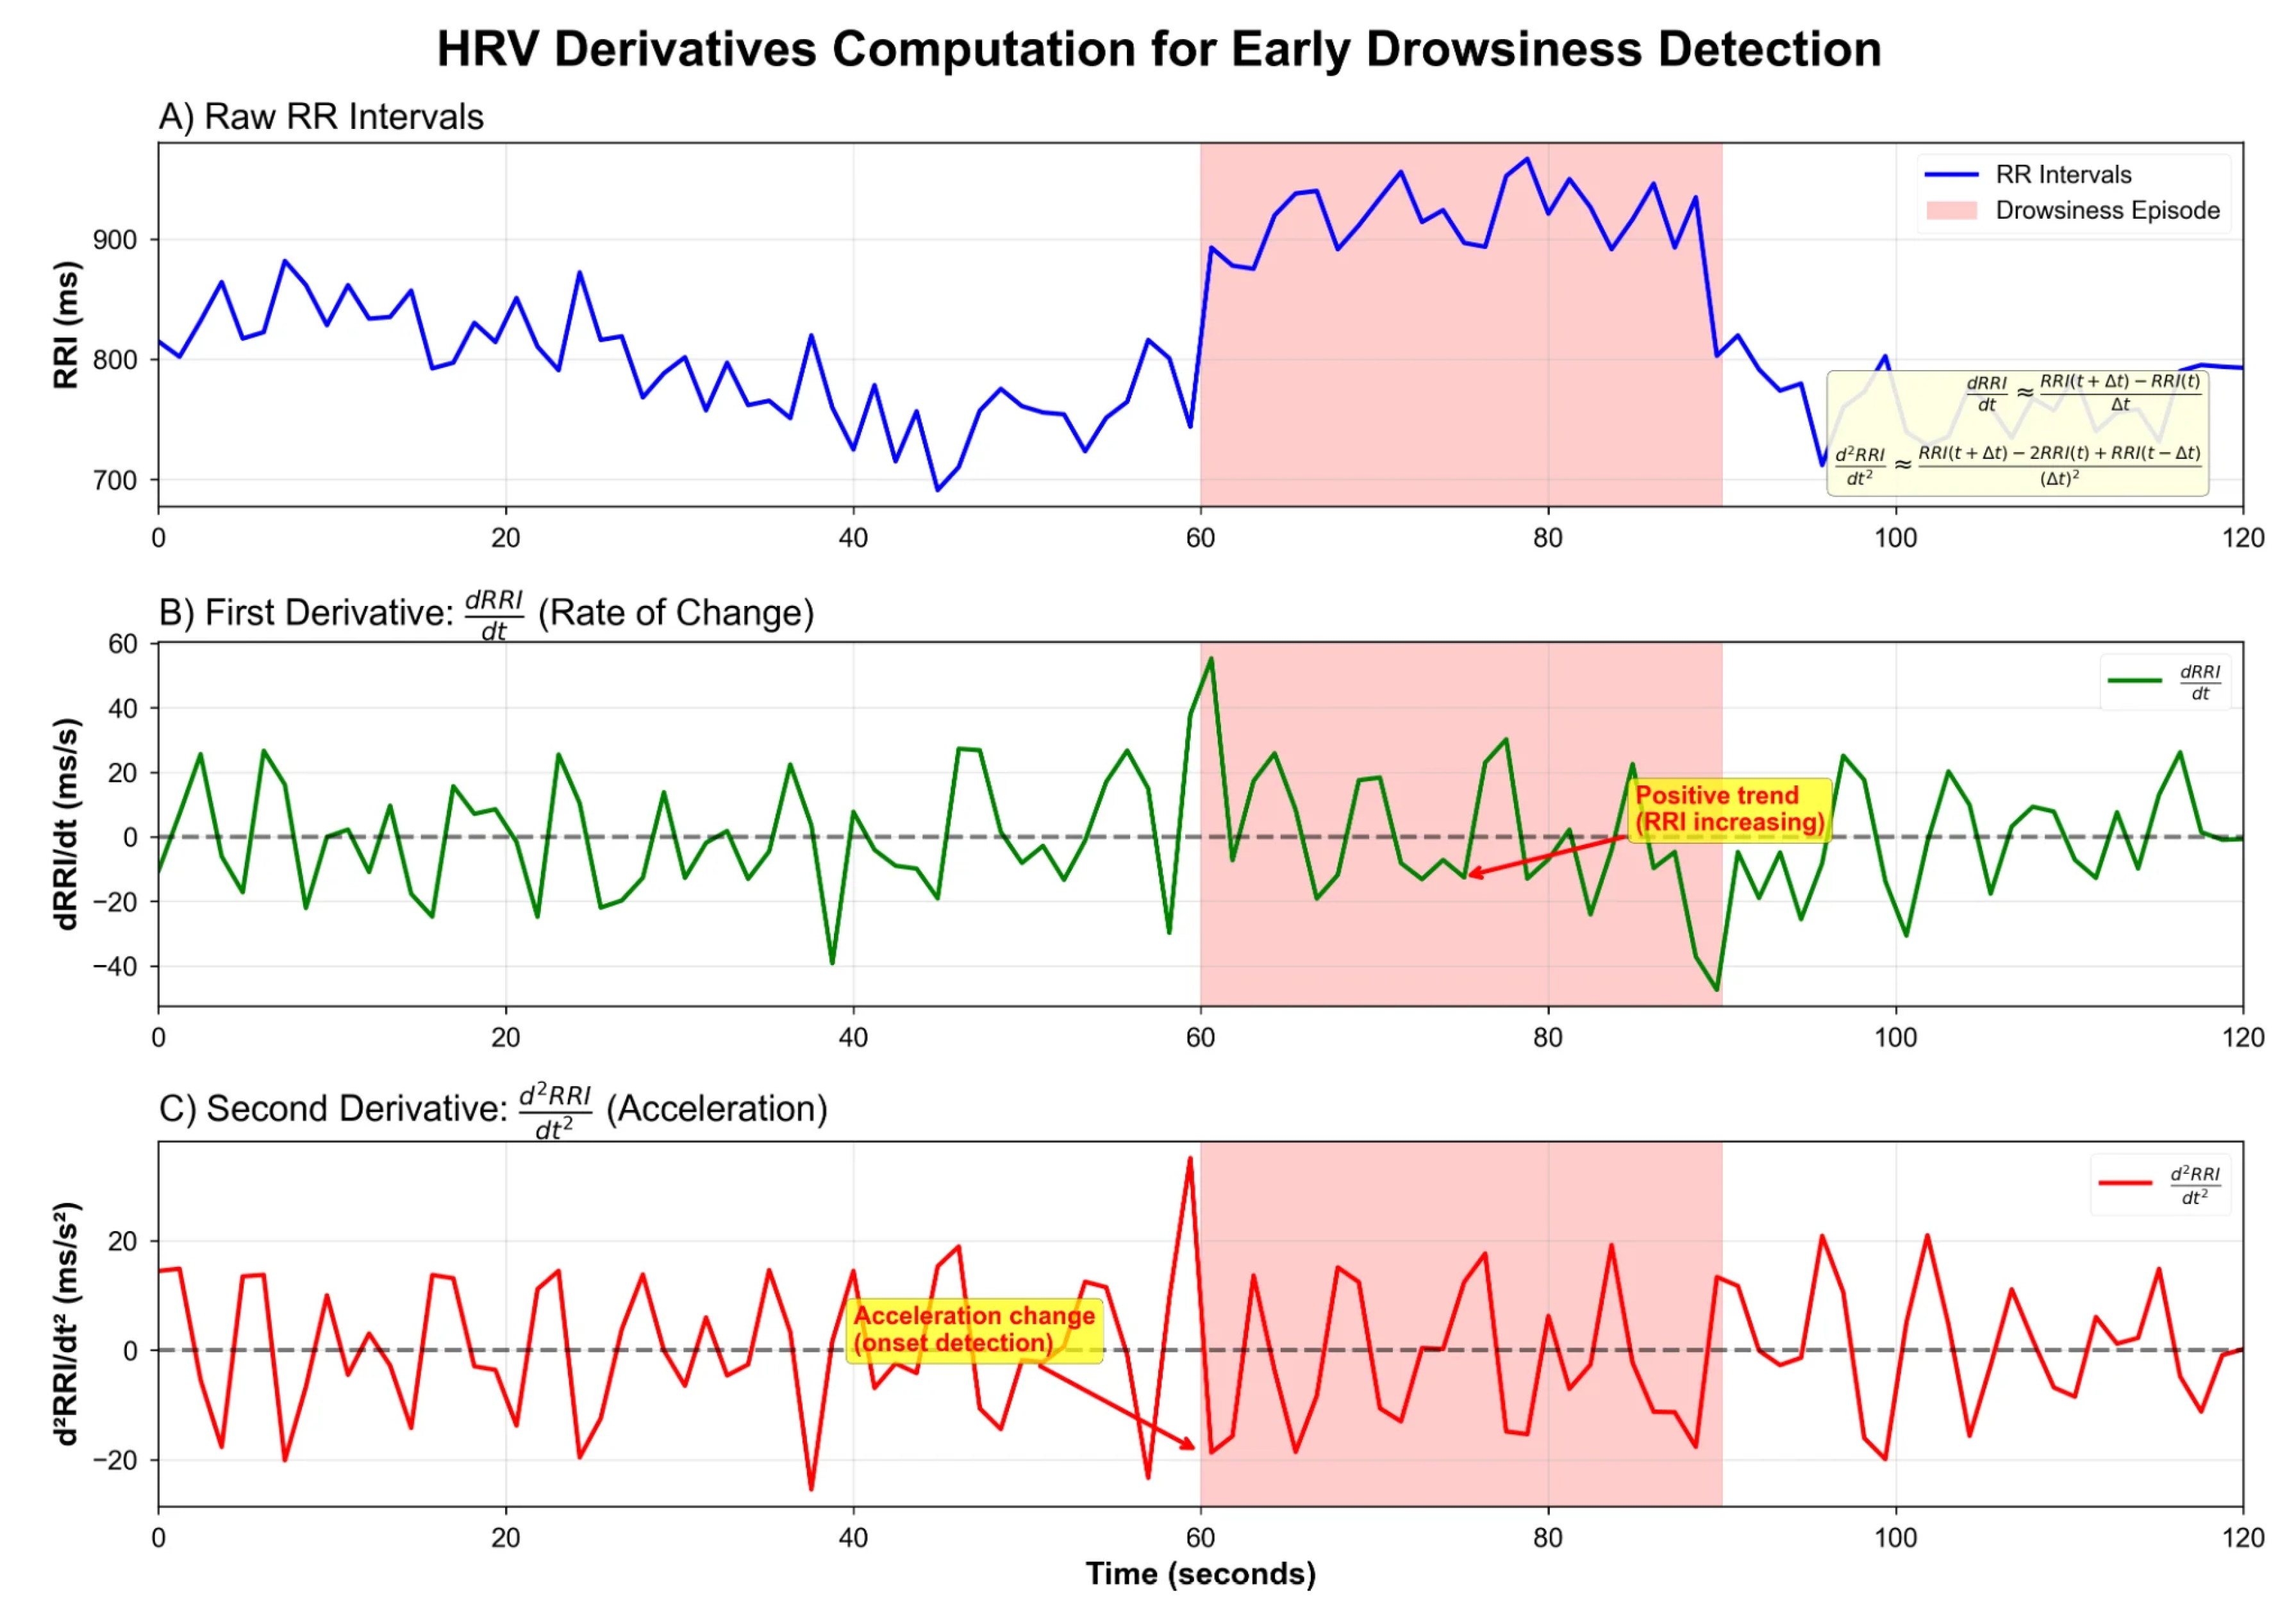
Figure 3.
Neuroplastic + NADN Vision Transformer architecture. Input features (n=35) are projected through Feature Embedding to 128-dimensional space, followed by learnable Positional Encoding. The Transformer Encoder comprises 6 layers with 8-head self-attention. The key innovation is the NADN Gate providing neuroplastic adaptation before the final classification.
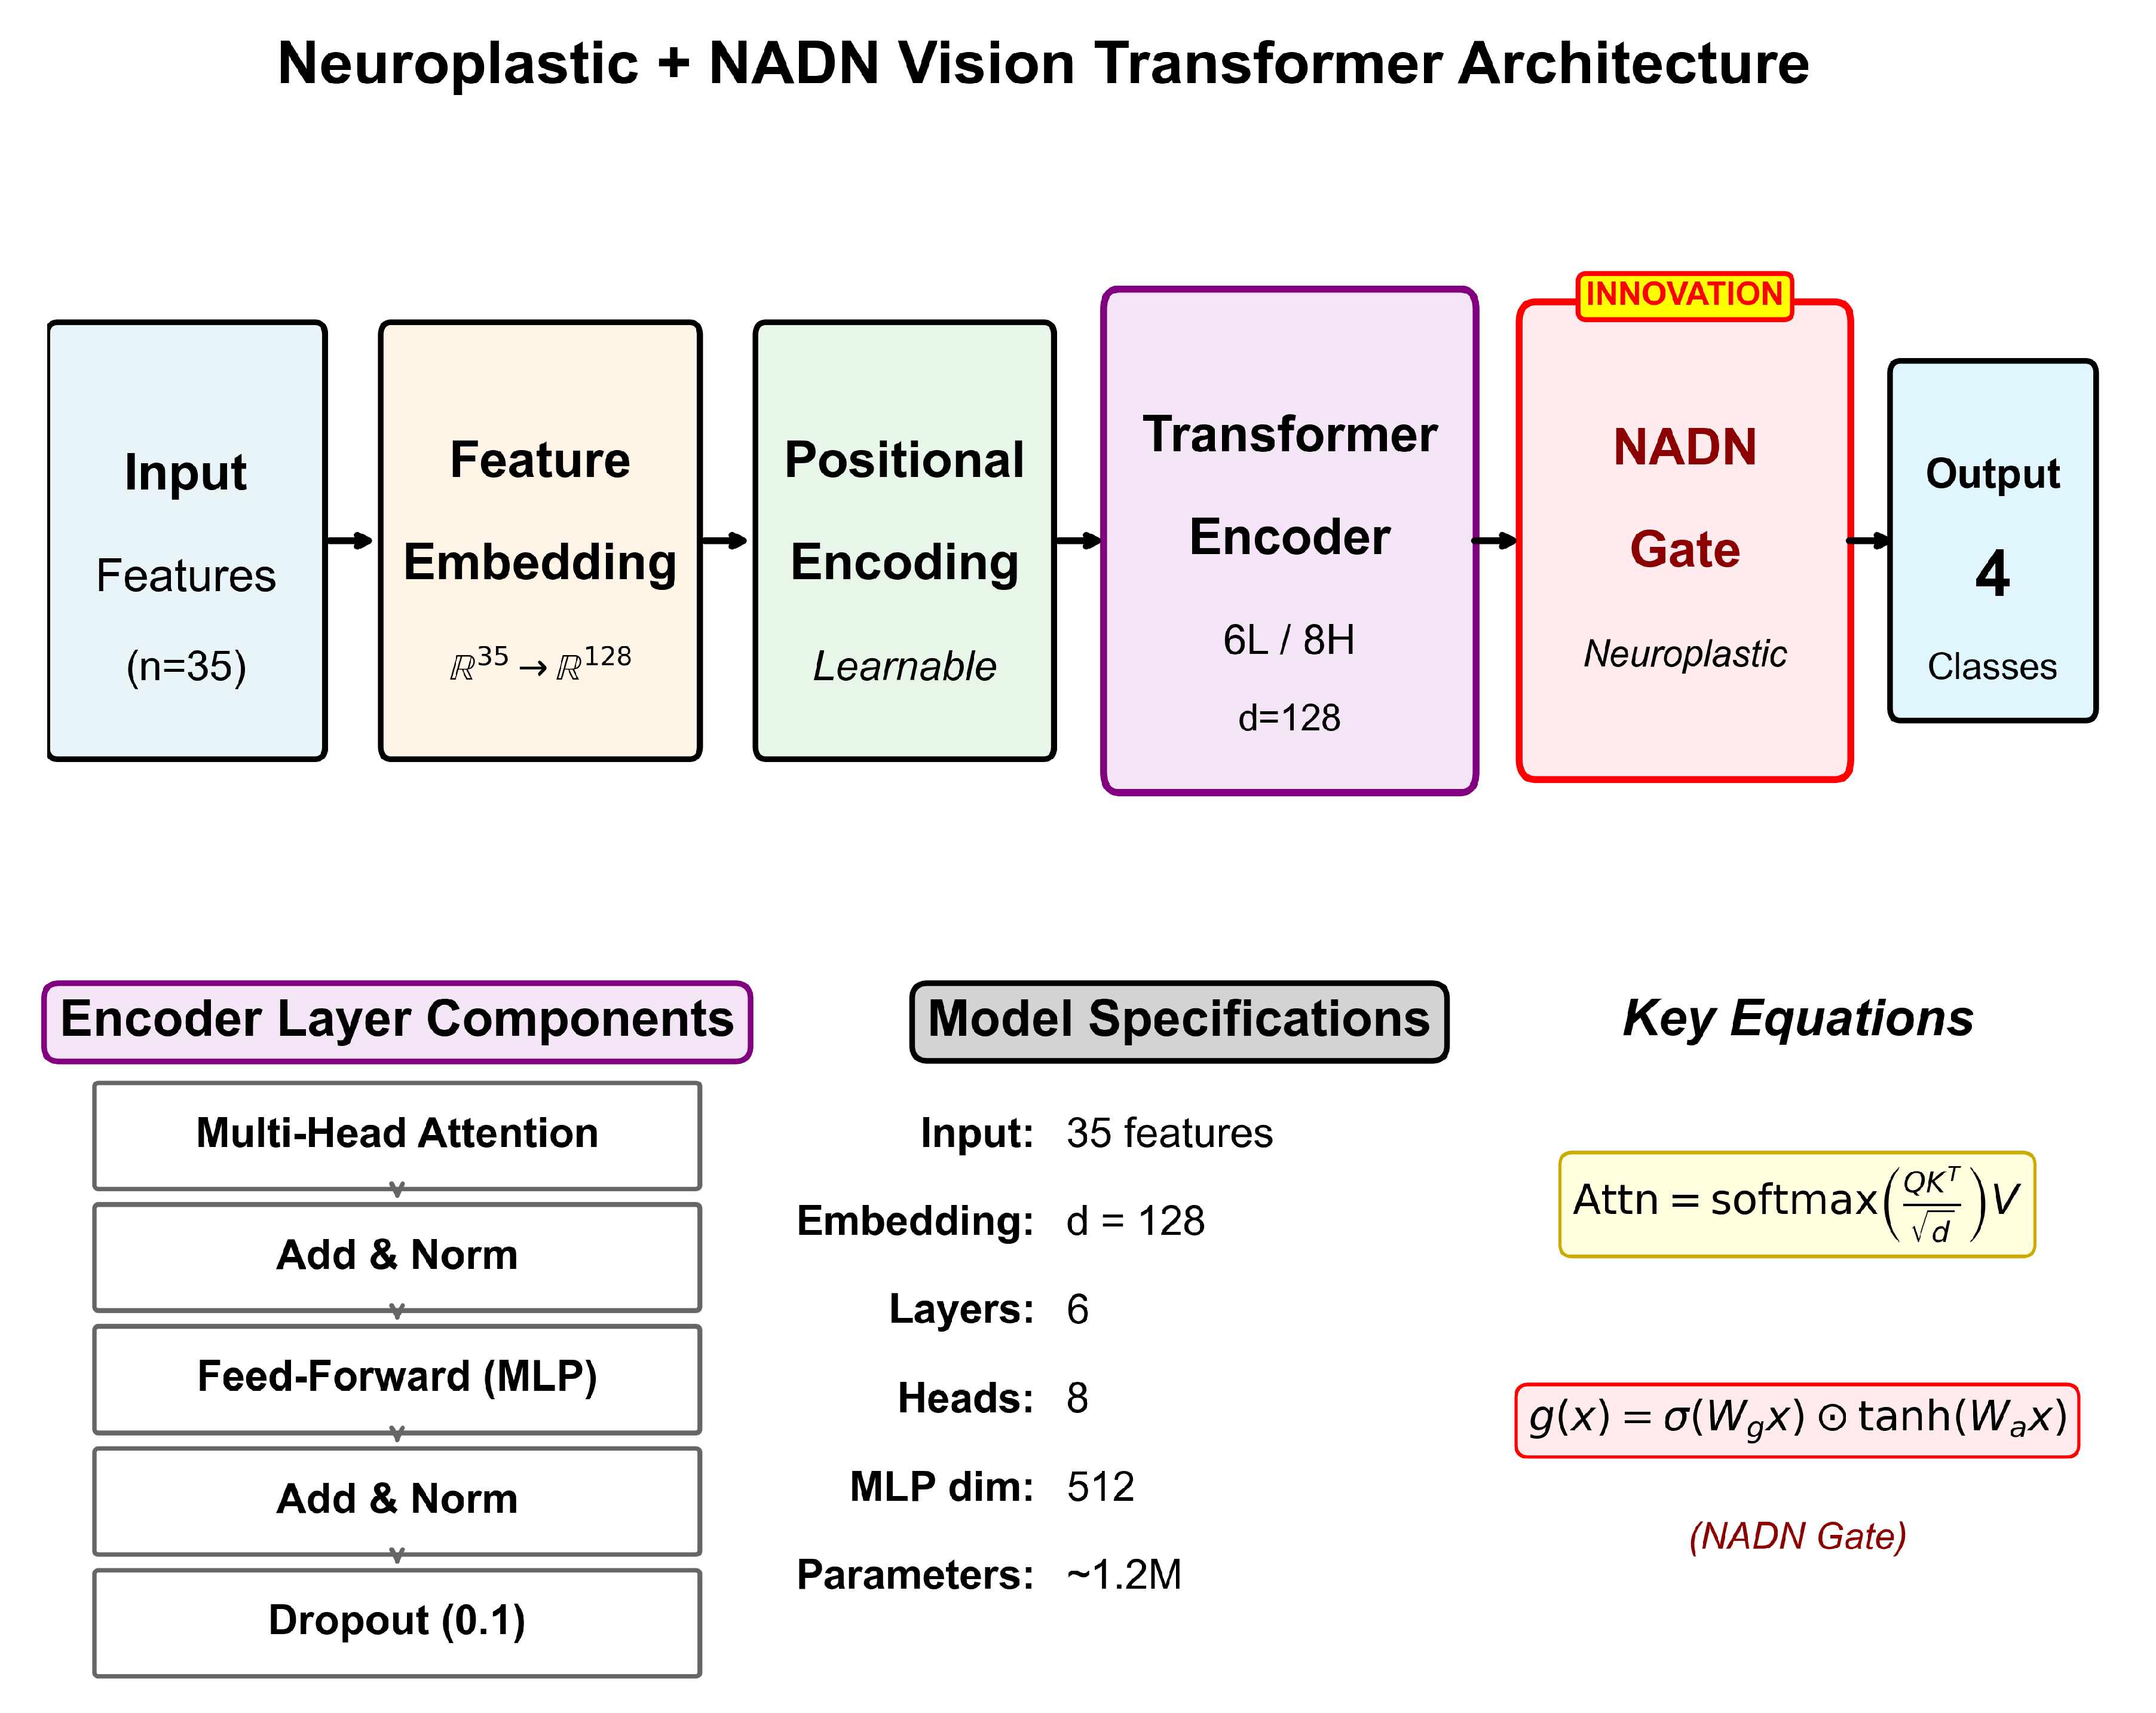
Figure 4.
Dataset characteristics. (a) Class distribution showing balanced Alert (54.4%) and Light drowsiness (45.6%) samples. (b) Drowsiness episodes detected in 44 of 49 sessions (89.8%). (c) Crash event distribution: 249 major and 1807 minor crashes. (d) Drowsiness score distribution at crash onset, demonstrating that 100% of crashes occurred in the Alert-Light zone.
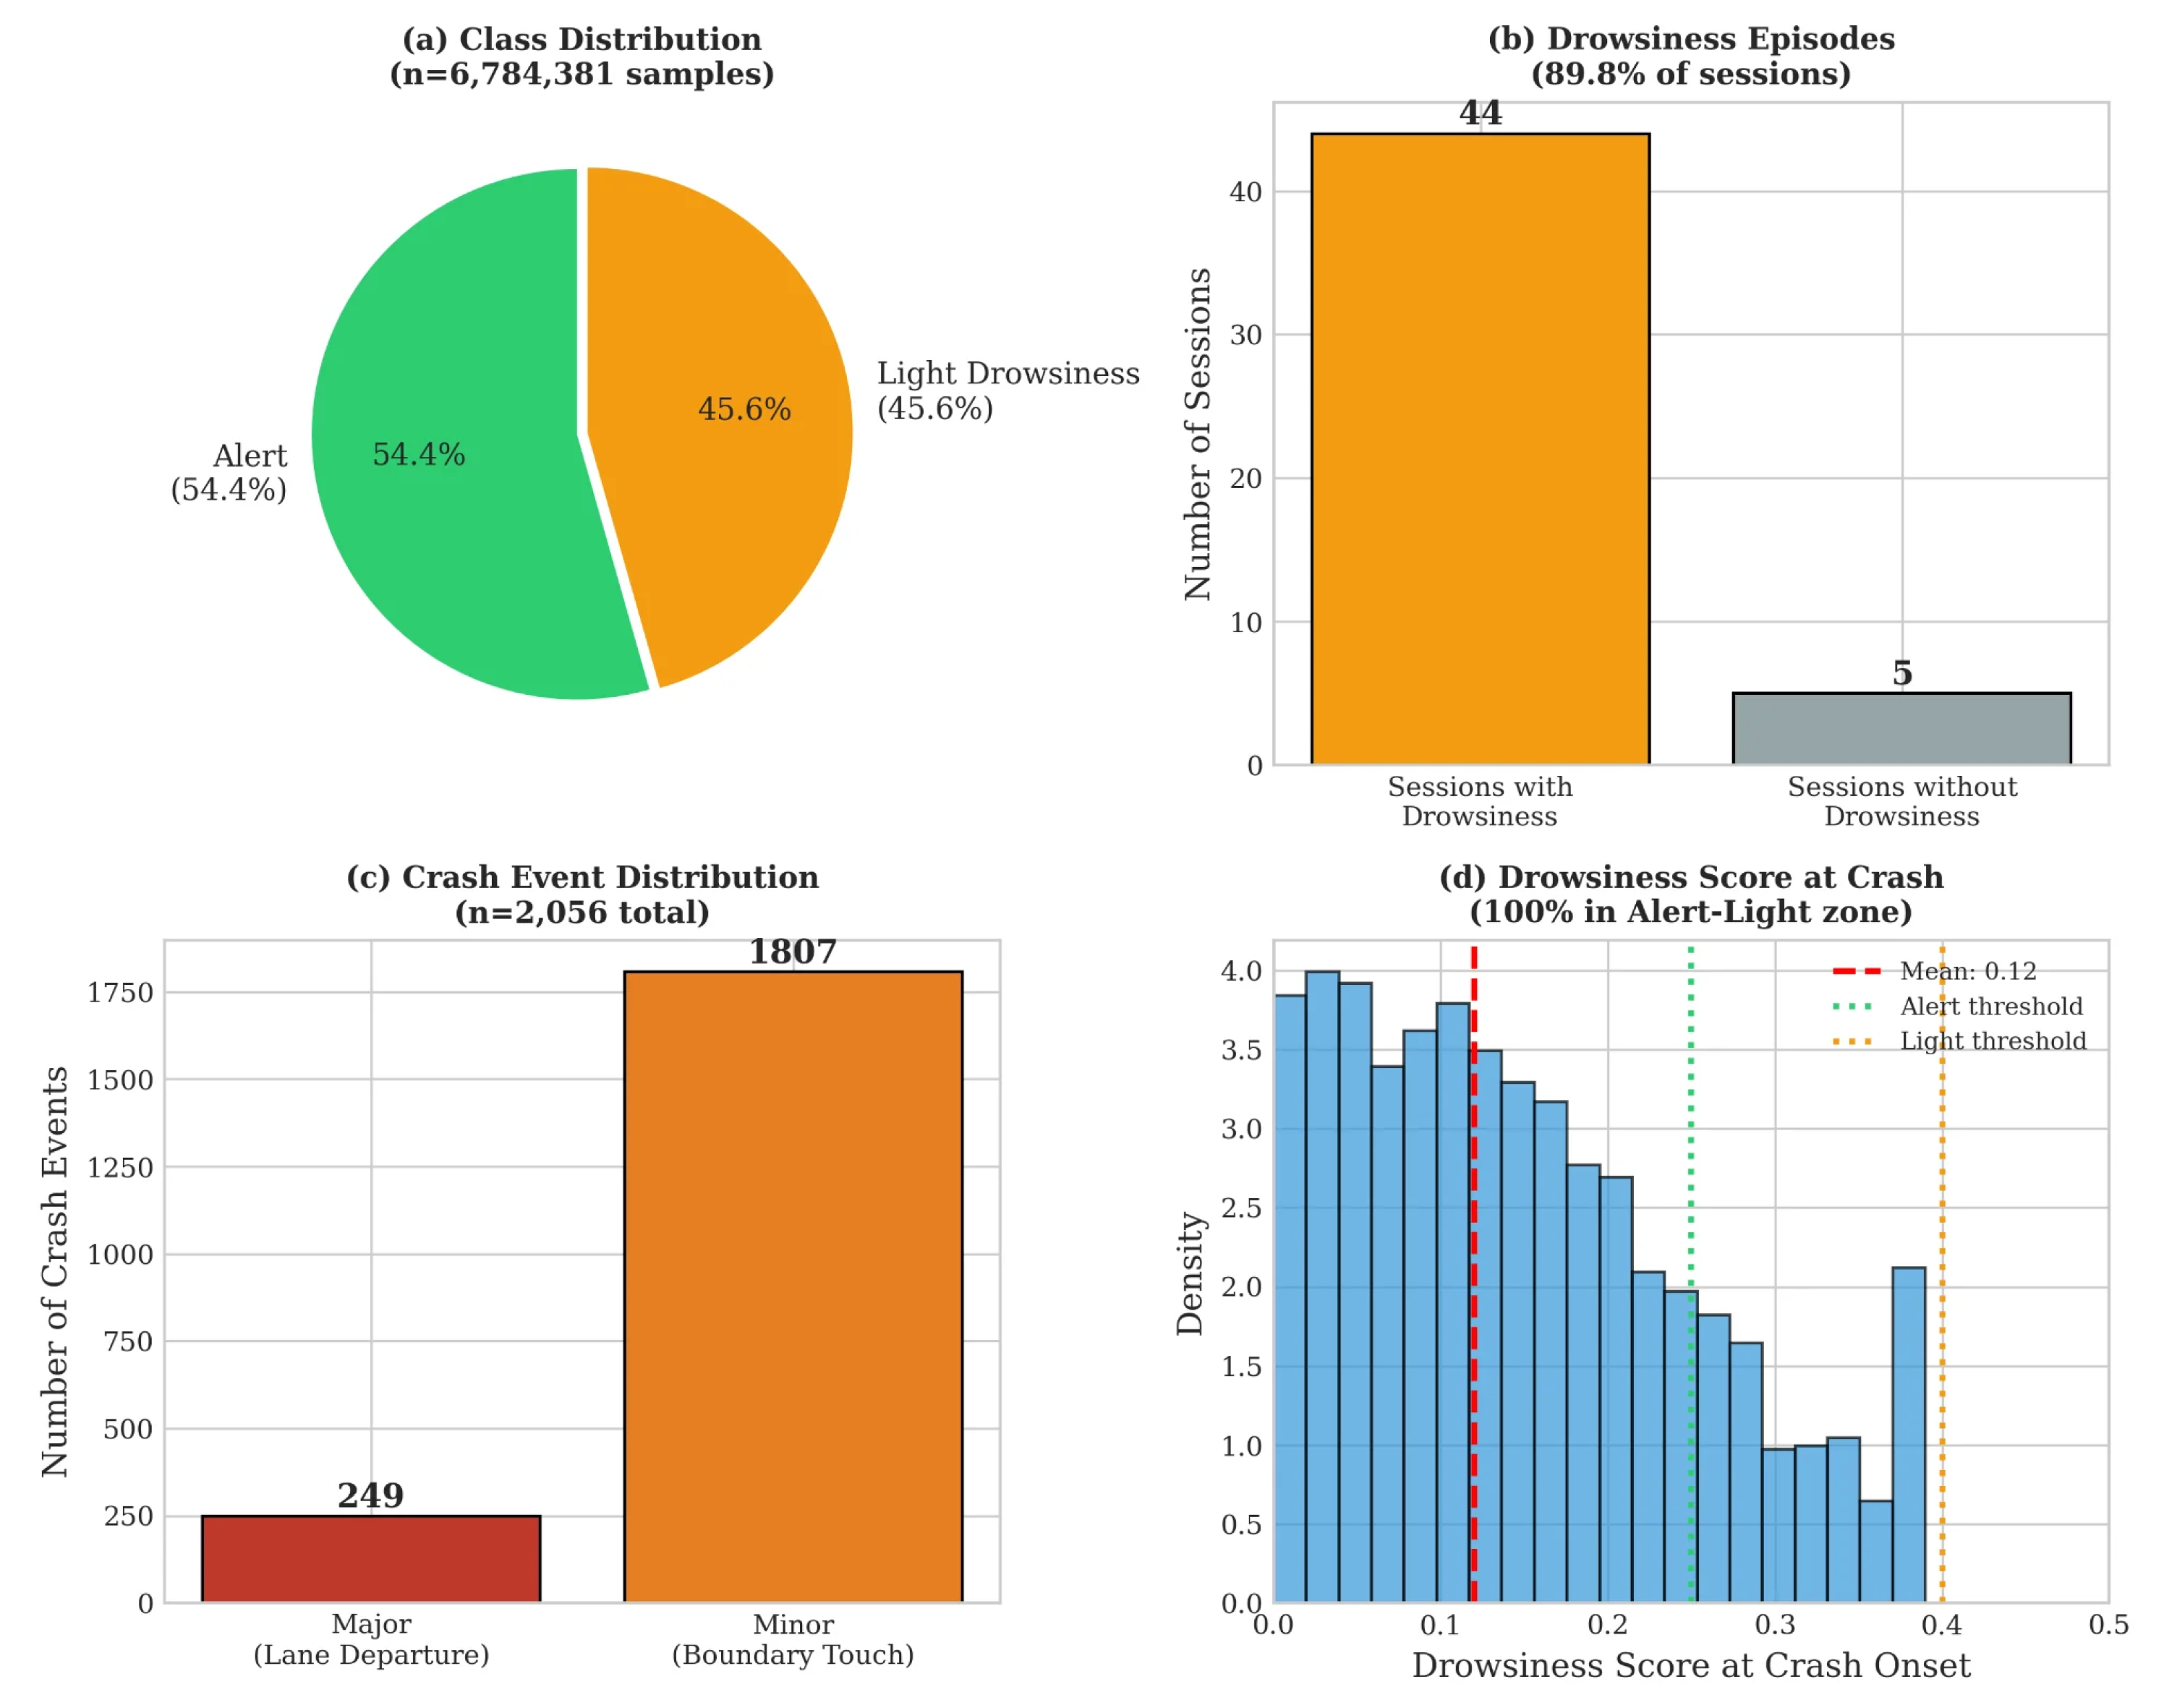
Figure 5.
Binary classification confusion matrix on the held-out test set (n=966 samples). The model achieves 91.0% recall for Alert state (495/544) and 88.4% recall for Light drowsiness (373/422). Note: This figure shows results on a specific test fold; overall cross-validated accuracy across all data is 87.5% (see text).
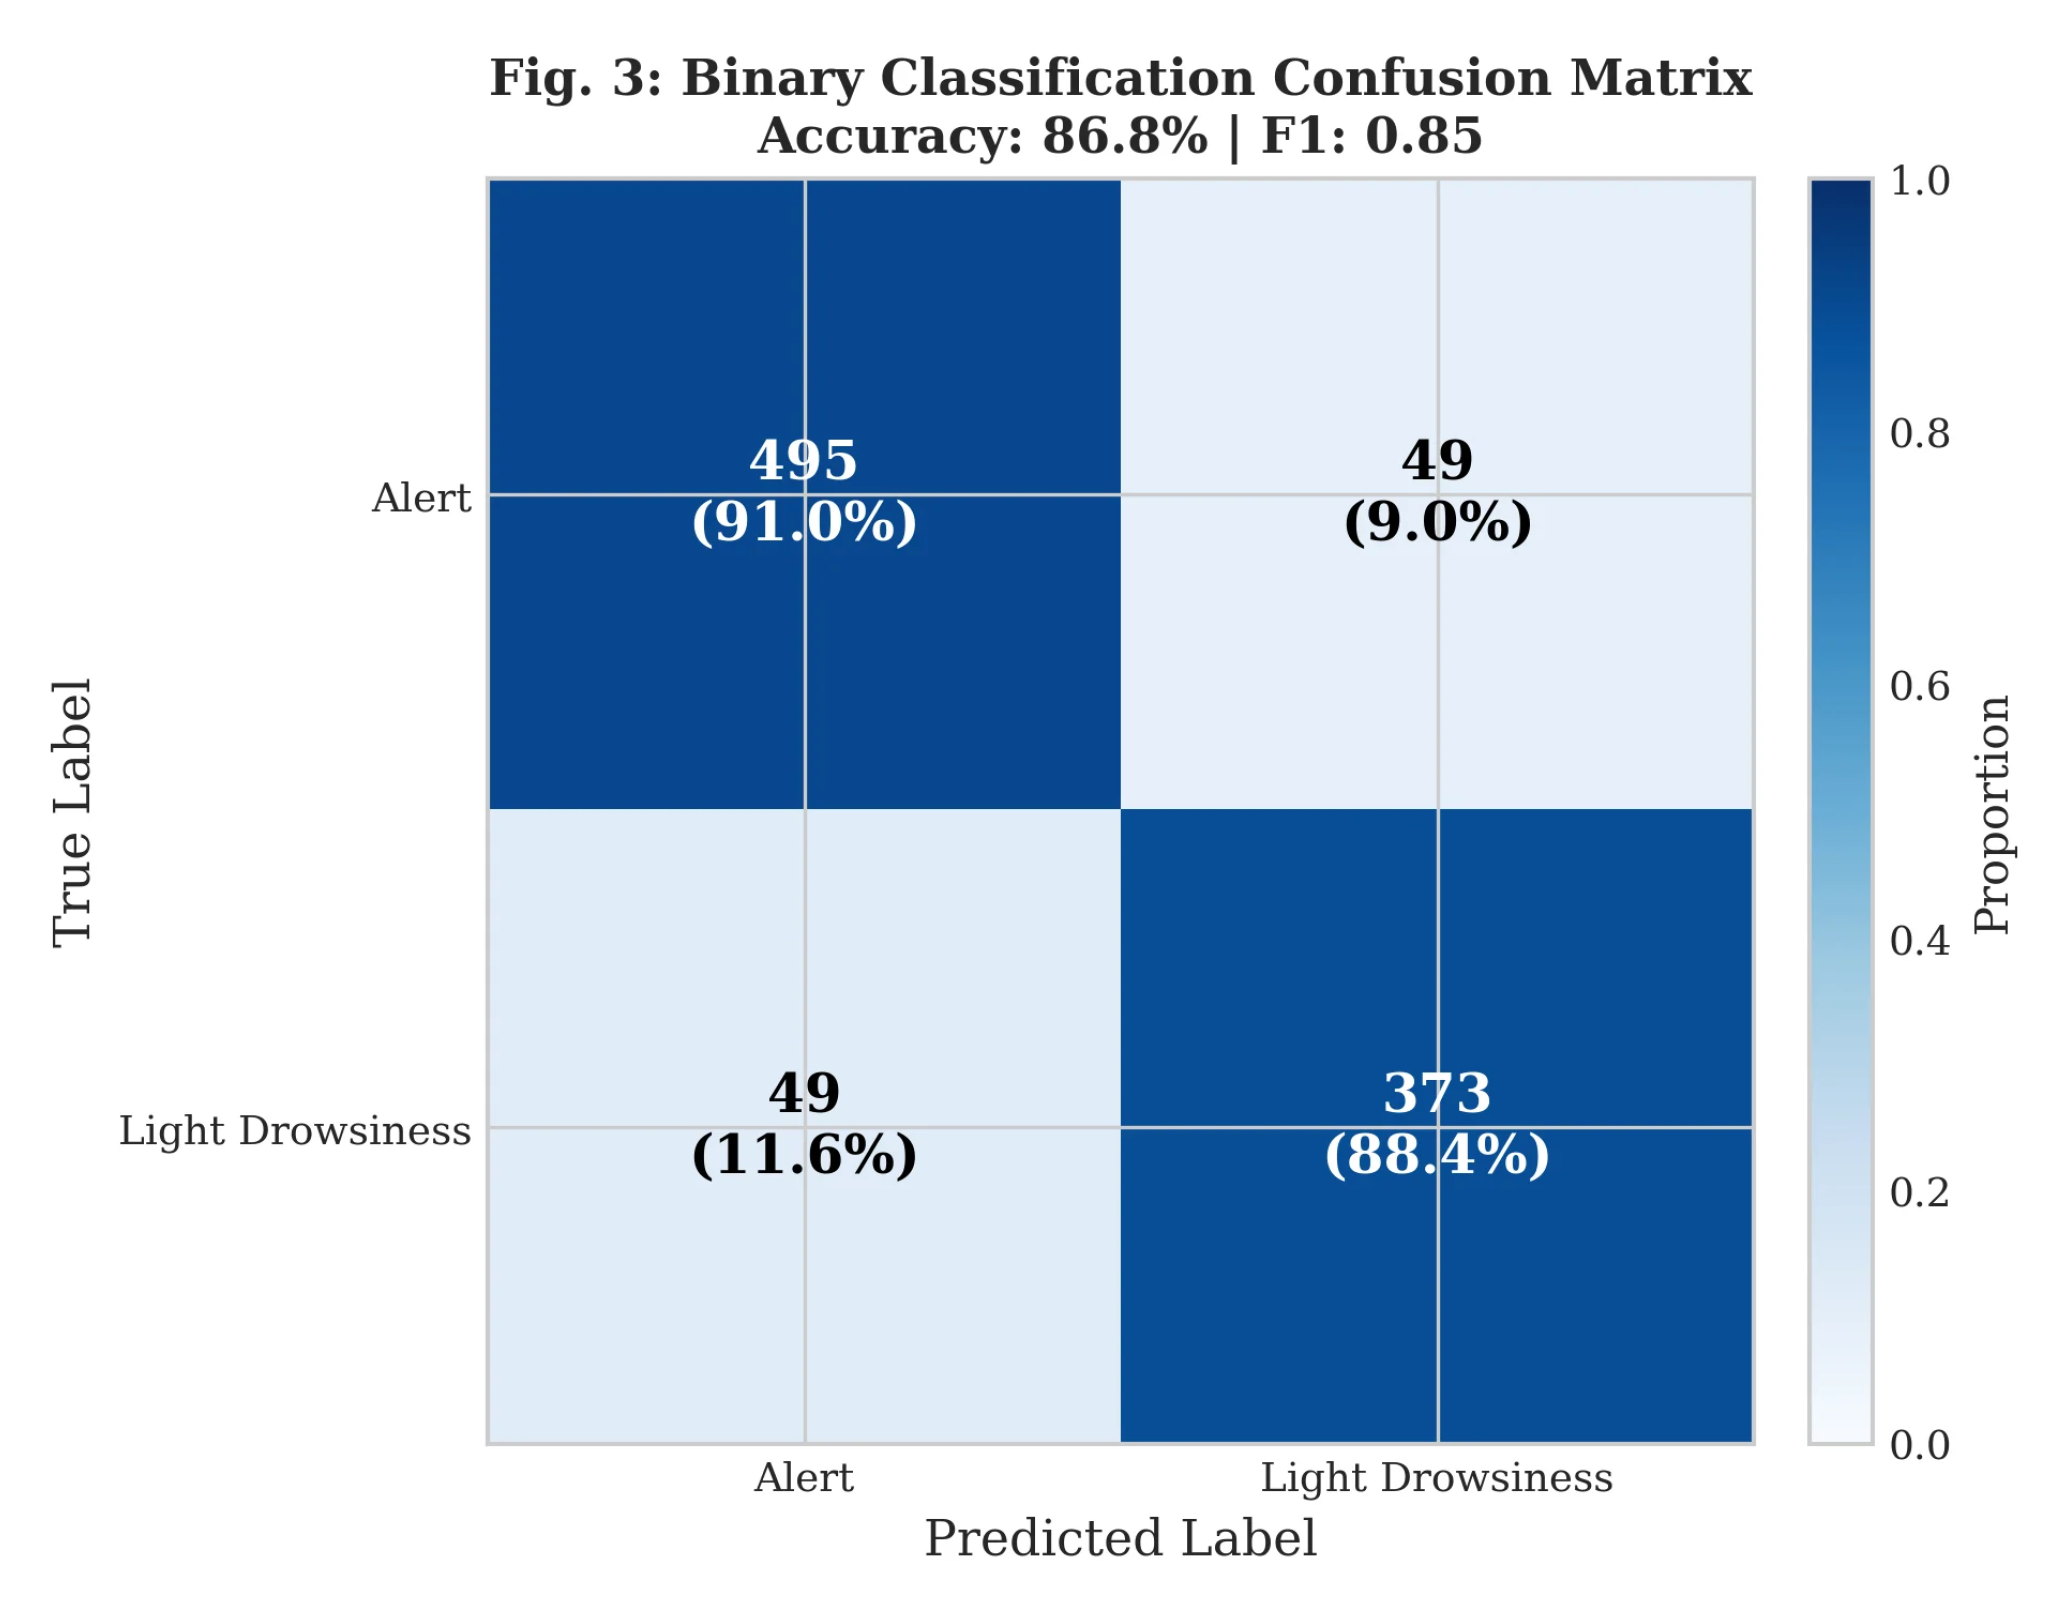
Figure 6.
Model comparison with baseline and prior work. (a) Classification accuracy comparison showing our ViT+NADN model (87.5%) outperforming all baselines. (b) Training time vs. performance trade-off.
Figure 6.
Model comparison with baseline and prior work. (a) Classification accuracy comparison showing our ViT+NADN model (87.5%) outperforming all baselines. (b) Training time vs. performance trade-off.
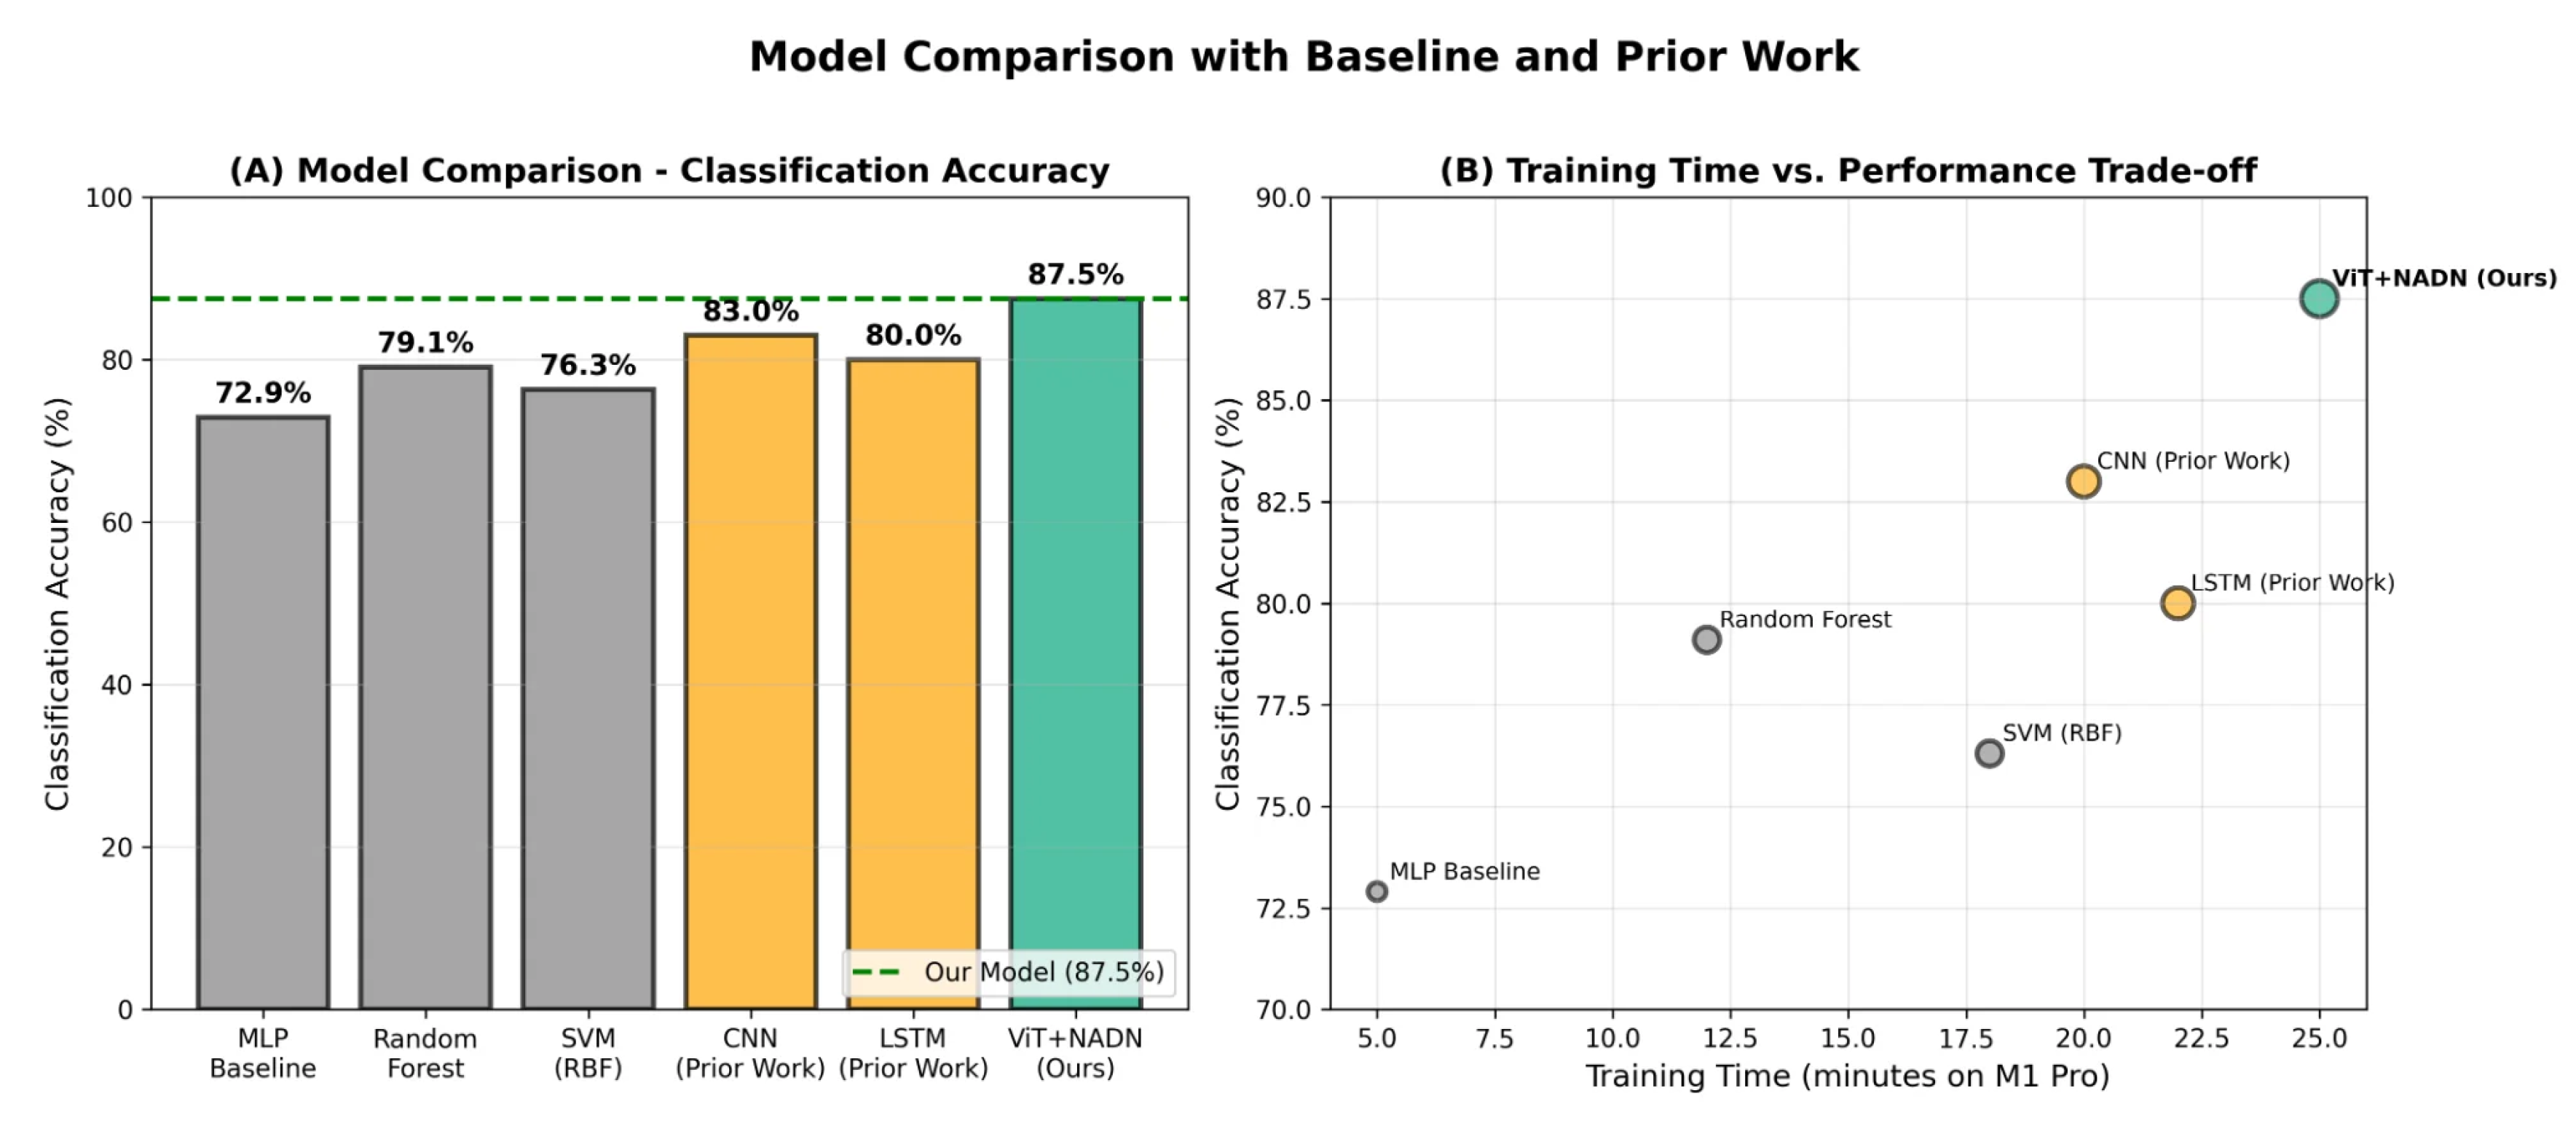
Figure 7.
Ablation study results showing feature group contributions. HRV derivatives alone achieve 78.1% accuracy (96% of camera-based performance), highlighted with red border. The complete model achieves 87.5% (dashed line).
Figure 7.
Ablation study results showing feature group contributions. HRV derivatives alone achieve 78.1% accuracy (96% of camera-based performance), highlighted with red border. The complete model achieves 87.5% (dashed line).
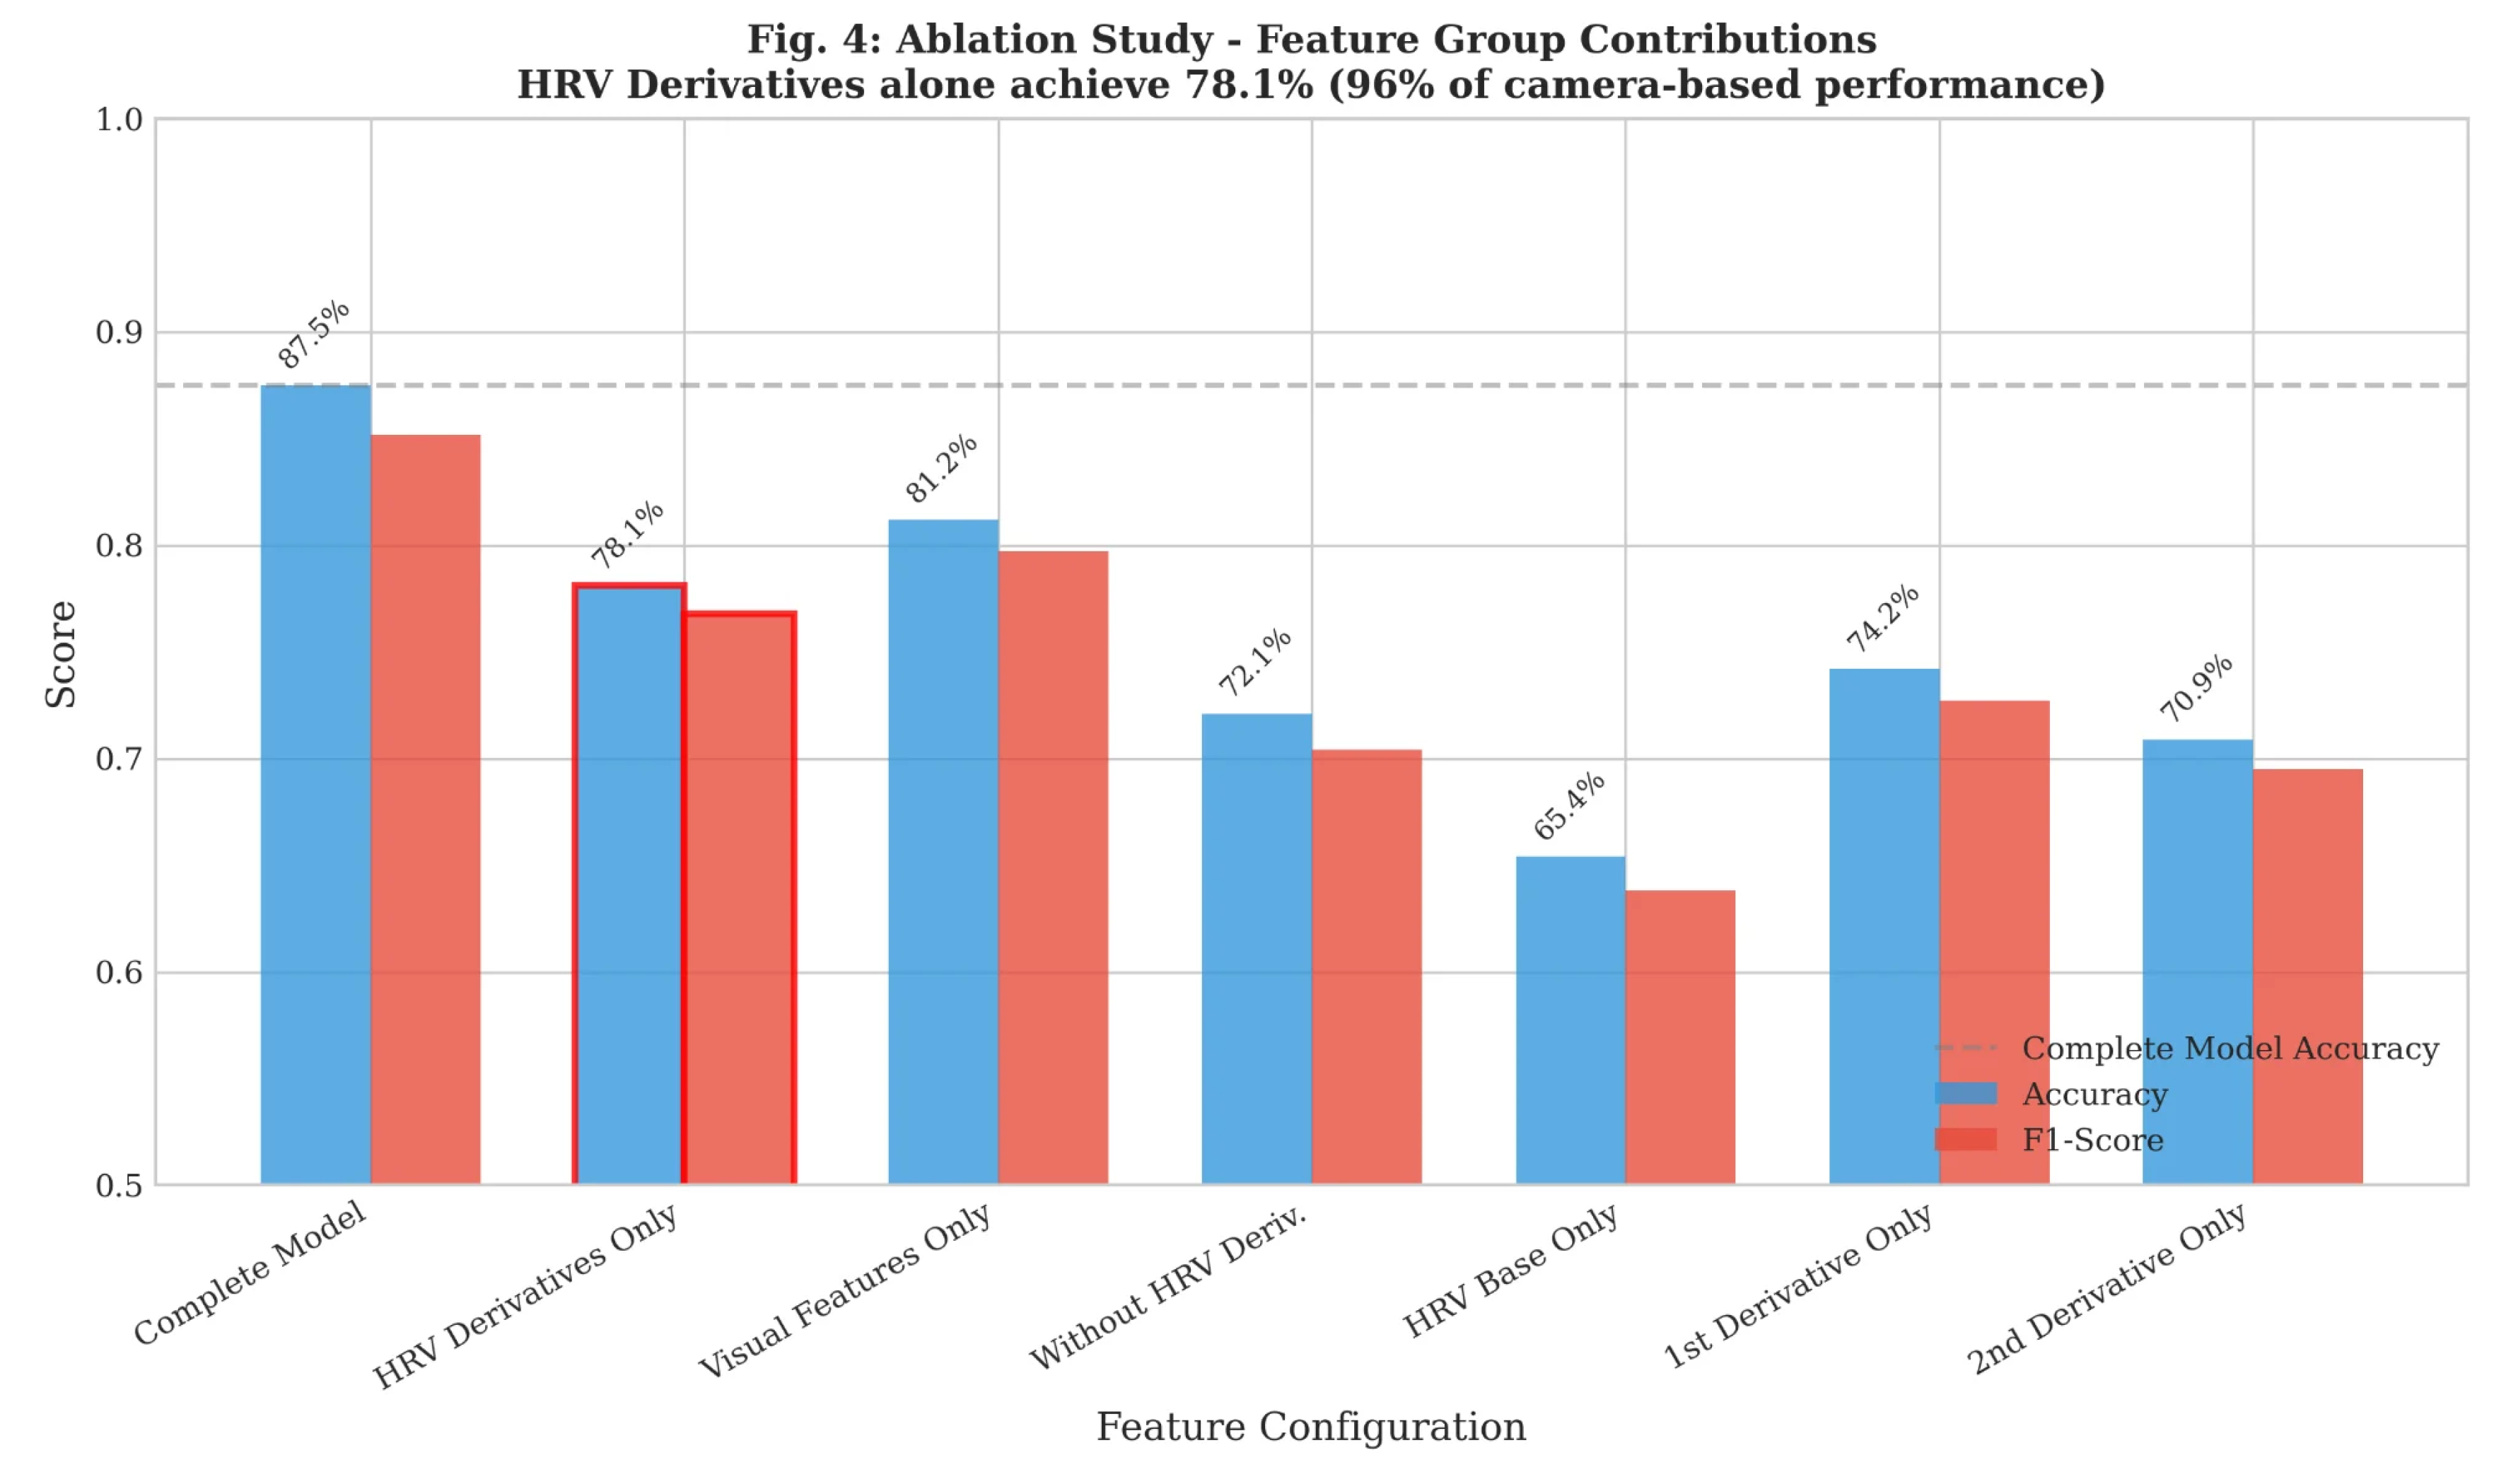
Figure 8.
Temporal precedence of HRV derivatives. (a) Lead time comparison showing HRV derivatives precede PERCLOS by 5.8 min, yawning by 4.2 min, and crash events by 6.8 min. (b) Timeline illustrating the early detection advantage.
Figure 8.
Temporal precedence of HRV derivatives. (a) Lead time comparison showing HRV derivatives precede PERCLOS by 5.8 min, yawning by 4.2 min, and crash events by 6.8 min. (b) Timeline illustrating the early detection advantage.
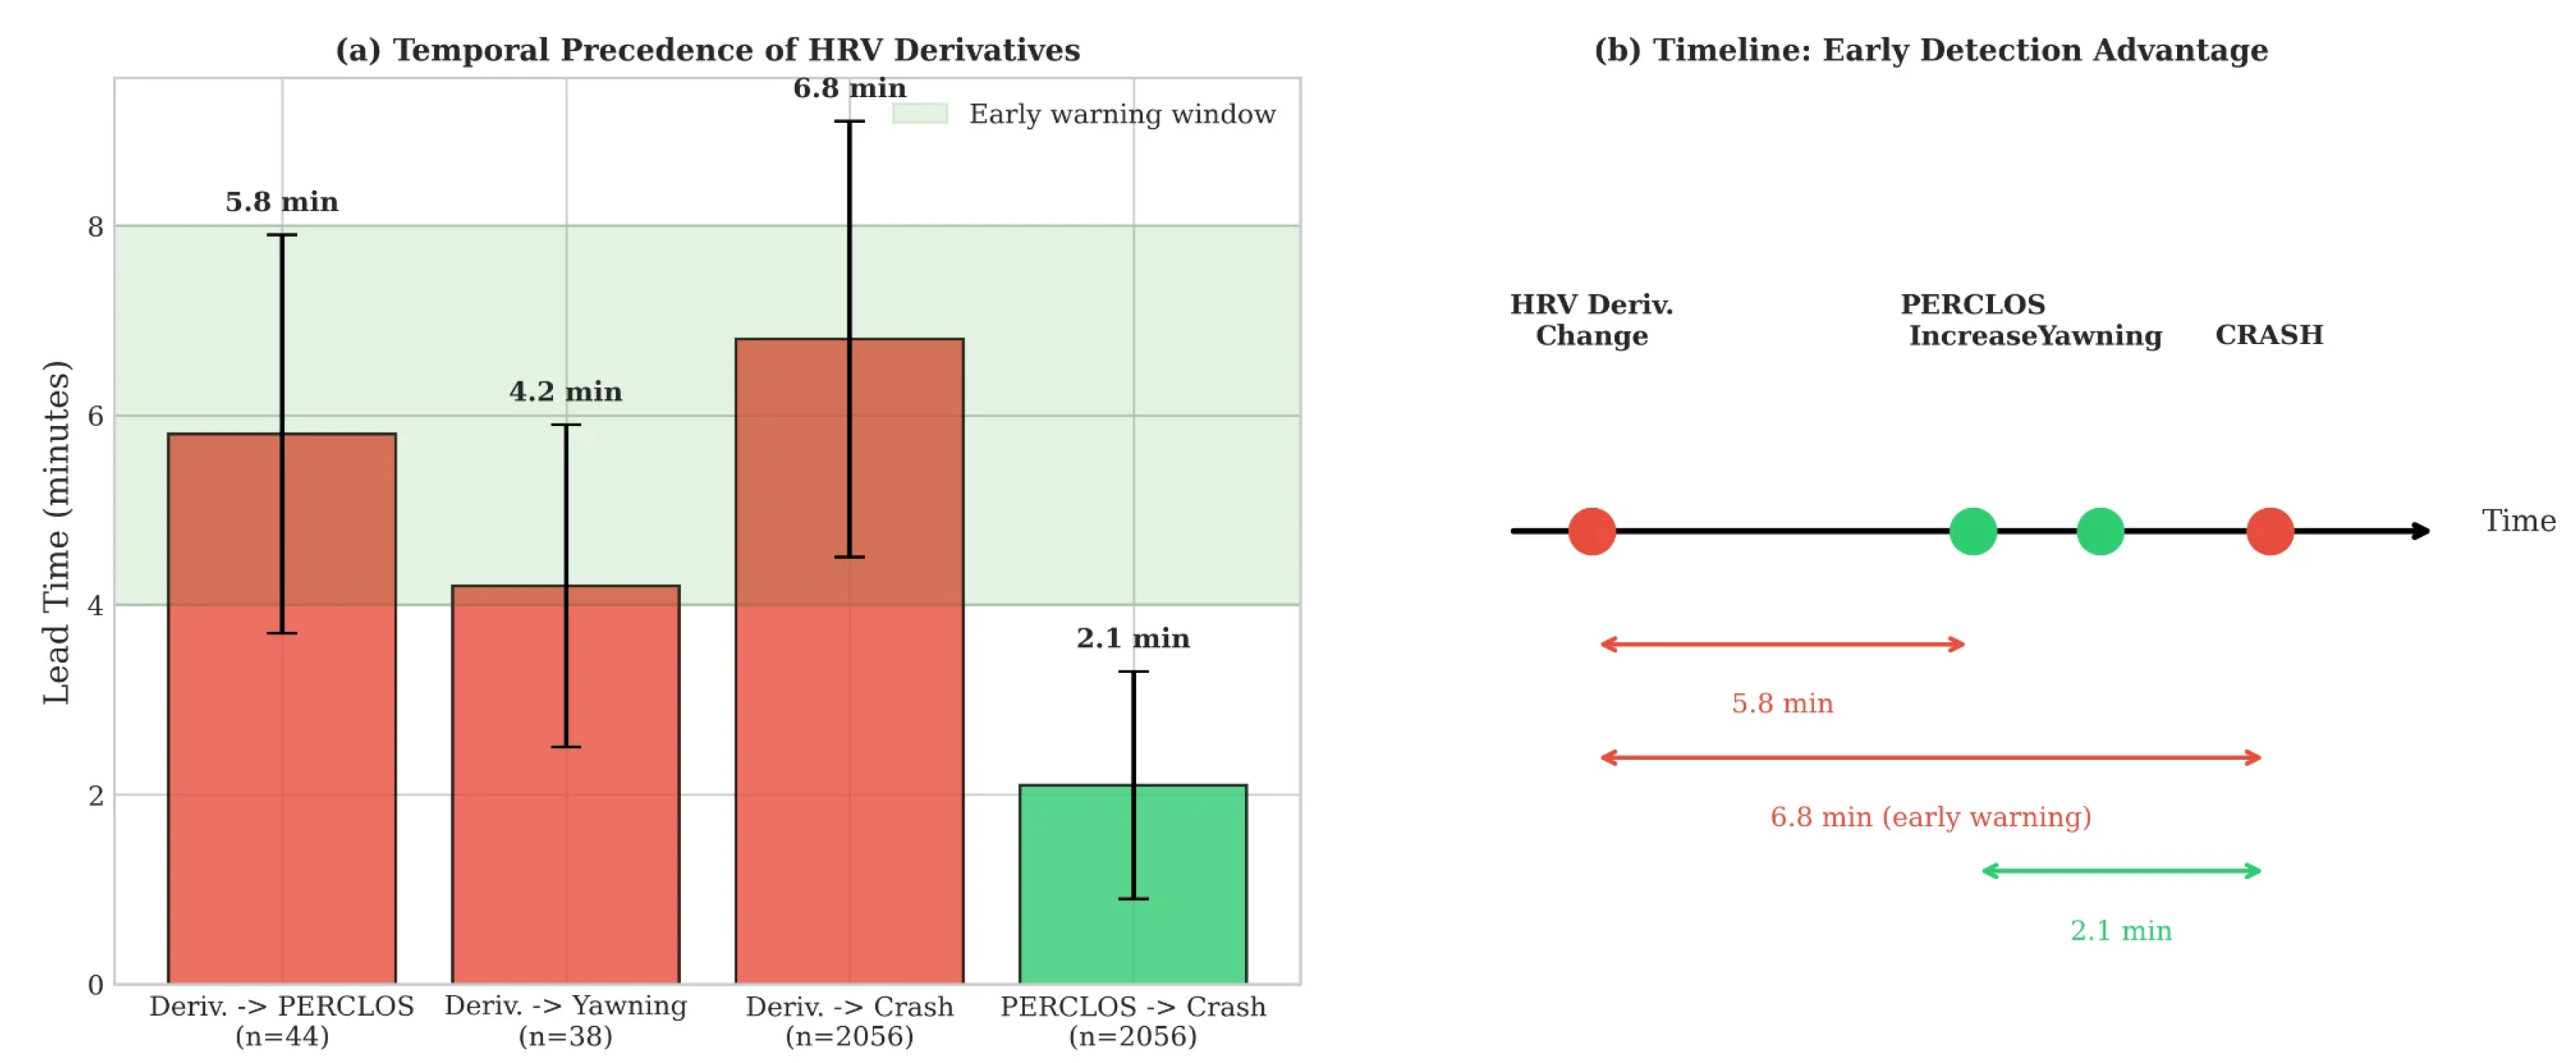
Figure 9.
Leave-one-subject-out cross-validation results. (a) Per-participant accuracy showing consistent performance across all 25 participants, with mean 85.8%. (b) Accuracy distribution histogram demonstrating low coefficient of variation (CV = 4.9%).
Figure 9.
Leave-one-subject-out cross-validation results. (a) Per-participant accuracy showing consistent performance across all 25 participants, with mean 85.8%. (b) Accuracy distribution histogram demonstrating low coefficient of variation (CV = 4.9%).
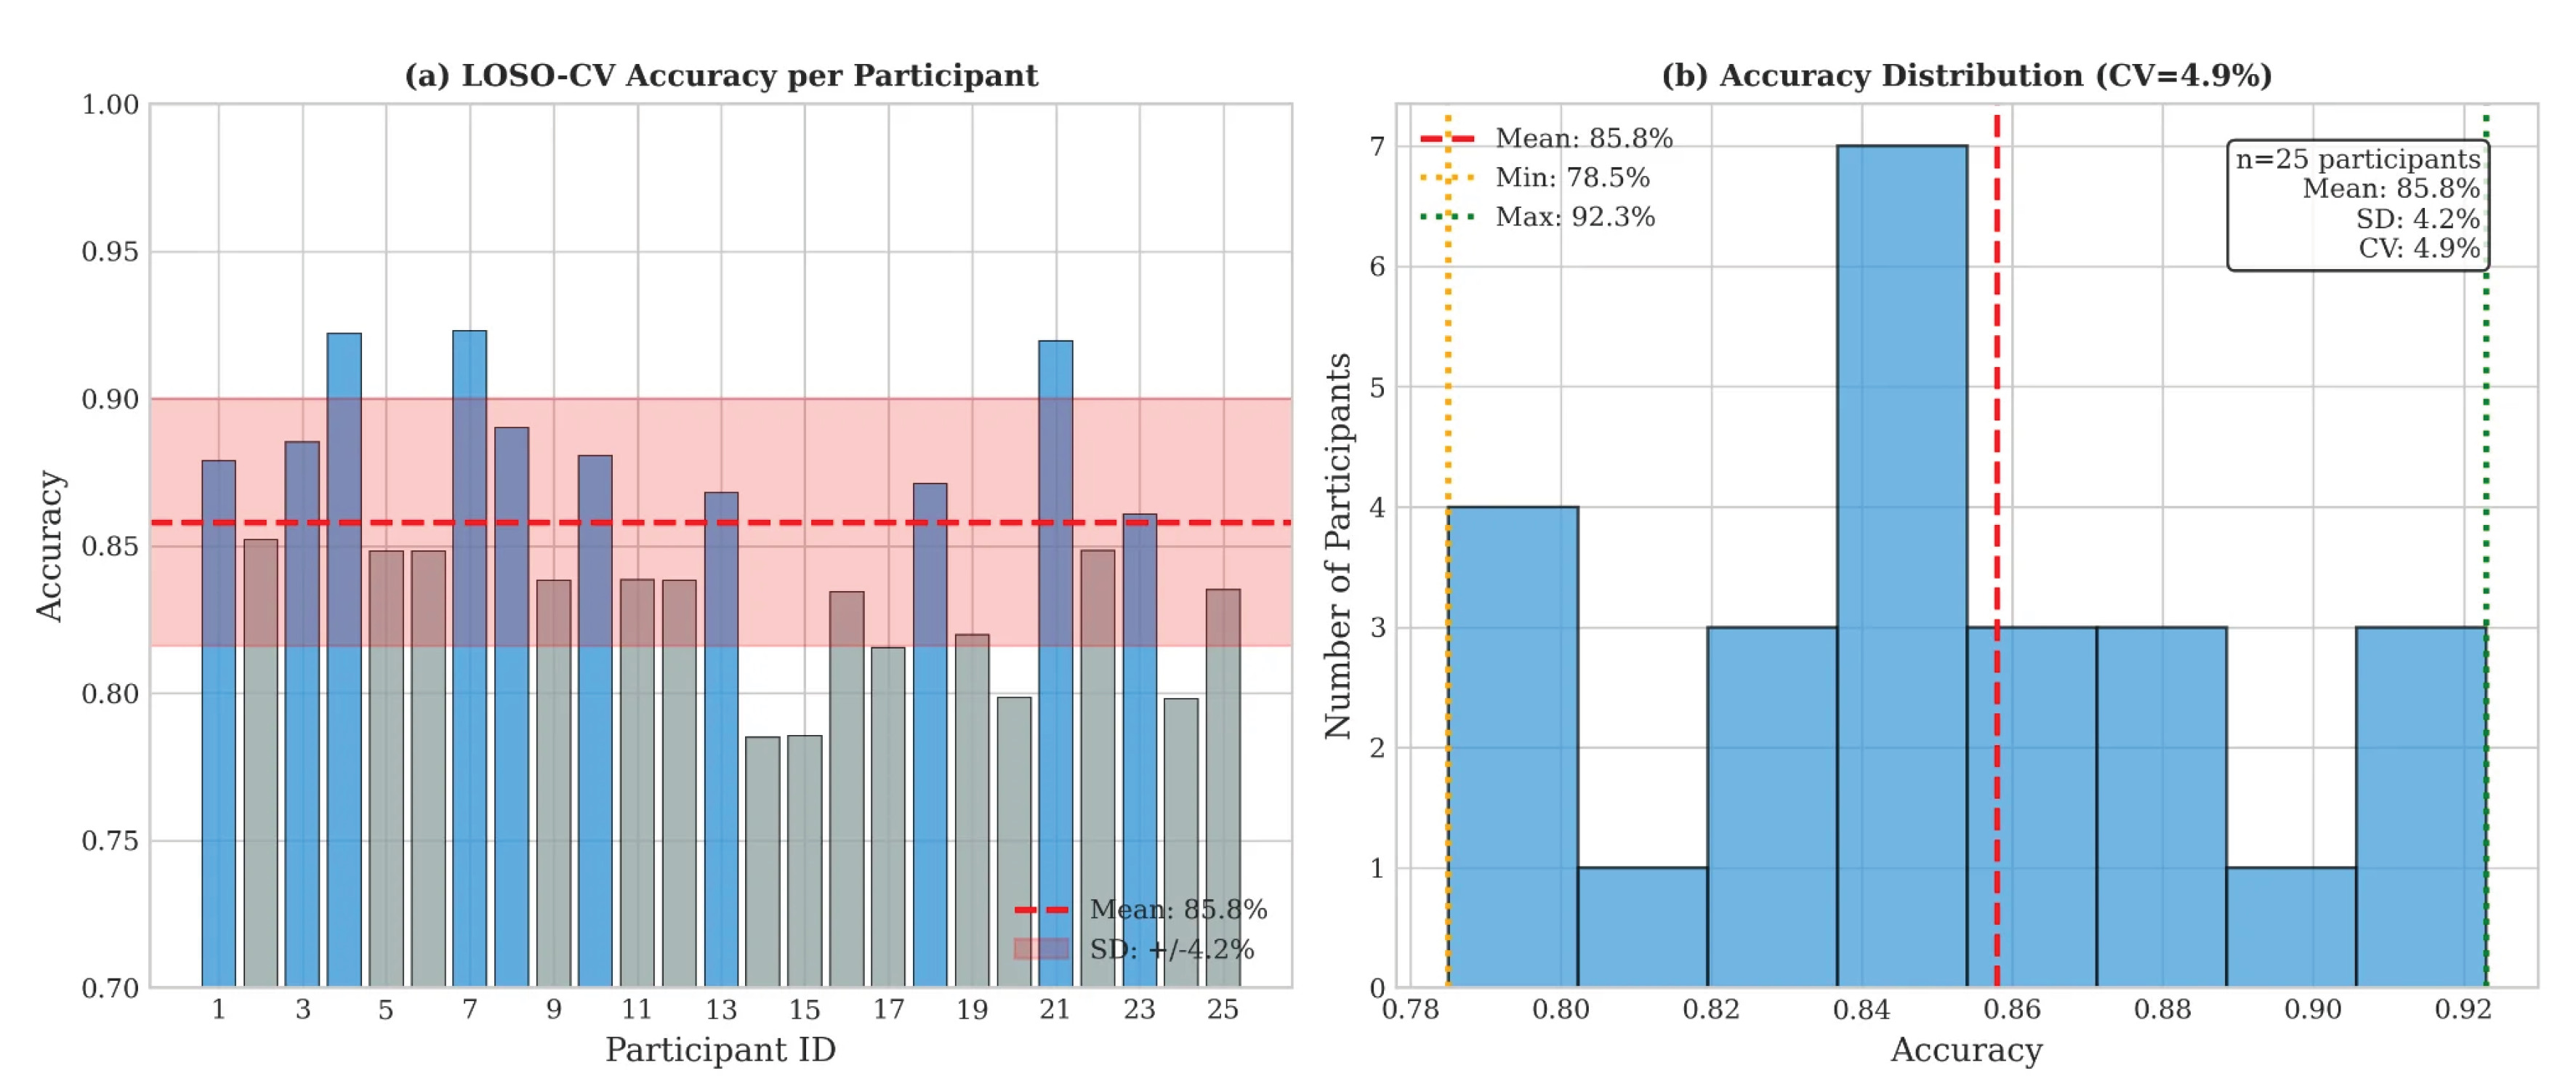

Table 1.
Ablation study: feature group contributions.
| Configuration | Acc. | Prec. | Rec. | F1 |
|---|---|---|---|---|
| Complete Model | 0.875 | 0.850 | 0.860 | 0.852 |
| Without HRV Derivatives | 0.721 | 0.698 | 0.712 | 0.704 |
| HRV Derivatives ONLY | 0.781 | 0.762 | 0.774 | 0.768 |
| Visual Features Only | 0.812 | 0.791 | 0.803 | 0.797 |
| HRV Base Features Only | 0.654 | 0.631 | 0.645 | 0.638 |
| 1st Derivative Only | 0.742 | 0.721 | 0.733 | 0.727 |
| 2nd Derivative Only | 0.709 | 0.688 | 0.702 | 0.695 |
Note: Values correspond to Figure 7. HRV Derivatives achieve 78.1% accuracy, which represents 96.2% of Visual Features Only performance (81.2%).
Disclaimer/Publisher’s Note: The statements, opinions and data contained in all publications are solely those of the individual author(s) and contributor(s) and not of MDPI and/or the editor(s). MDPI and/or the editor(s) disclaim responsibility for any injury to people or property resulting from any ideas, methods, instructions or products referred to in the content. |
© 2026 by the authors. Licensee MDPI, Basel, Switzerland. This article is an open access article distributed under the terms and conditions of the Creative Commons Attribution (CC BY) license (http://creativecommons.org/licenses/by/4.0/).
Copyright: This open access article is published under a Creative Commons CC BY 4.0 license, which permit the free download, distribution, and reuse, provided that the author and preprint are cited in any reuse.


