Submitted:
09 June 2025
Posted:
10 June 2025
You are already at the latest version
Abstract
Fatigue and distracted driving are among the leading causes of traffic accidents, highlighting the importance of developing efficient and non-intrusive driver monitoring systems. Traditional camera-based methods are often limited by lighting variations, occlusions, and privacy concerns. In contrast, millimeter-wave radar offers a non-contact, privacy-preserving, and environment-robust solution, providing a forward-looking alternative. This study introduces a novel deep learning model, RTSFN (Radar-based Temporal-Spatial Fusion Network), which simultaneously analyzes the temporal motion changes and spatial posture features of the driver. RTSFN incorporates a cross-gated fusion mechanism that dynamically integrates multi-modal information, enhancing feature complementarity and stabilizing behavior recognition. Additionally, the system integrates a proprietary radar signal processing pipeline, with its physiological signal module having adaptive target selection capabilities. It dynamically selects the optimal sensing area based on the driver’s position and signal quality to enhance the capture of micro-movements. This module not only estimates physiological indicators such as heart rate and respiration but also significantly improves the overall accuracy and reliability of driver state assessment. Experimental results show that RTSFN achieves over 94% accuracy in detecting high-risk driving behaviors and can run in real-time on edge devices such as the NVIDIA Jetson Orin Nano, demonstrating its strong potential for deployment in intelligent transportation and in-vehicle safety systems.
Keywords:
millimeter-wave radar
; driver behavior recognition
; RTSFN
; physiological signal estimation
; edge computing
1. Introduction
Safe and focused driving is fundamental to preventing traffic accidents and safeguarding the well-being of drivers, passengers, and other road users. However, driver fatigue and distraction have been widely recognized as major contributing factors to road traffic accidents, particularly in contexts such as long-distance transportation, commercial driving, and ride-sharing services. According to the Global Status Report on Road Safety 2023 published by the World Health Organization (WHO) [1], approximately 69% of global traffic fatalities involve individuals aged 18 to 59—the most economically active segment of the population. Furthermore, 18% of driver deaths are associated with commuting or work-related driving, underscoring the heightened risks of fatigue, especially in long-haul or professional driving scenarios. Distracted driving has also emerged as an increasingly critical concern, exacerbated by the widespread use of mobile devices. Studies have shown that drivers who use mobile phones while driving are significantly more likely to be involved in traffic collisions compared to those who do not. Such behaviors impair visual attention, cognitive processing, and reaction time, thereby posing substantial threats to road safety. As a result, the accurate and efficient detection of driver fatigue and distraction has become an urgent need in intelligent transportation systems, autonomous vehicles, and fleet management applications.
Existing methods for detecting driver fatigue and distraction can be broadly categorized into four main approaches: vehicle operation data analysis, physiological signal monitoring, facial landmark detection, and behavior analysis.
Vehicle operation data analysis methods infer driver state by analyzing abnormal vehicle behaviors, such as abrupt steering, lane deviations, or sudden acceleration, using data collected from the vehicle’s onboard diagnostics (OBD) system [2,3]. These methods typically employ statistical models or machine learning algorithms to identify deviations from standard driving patterns. While these methods are easy to deploy and cost-efficient, they are highly susceptible to external interferences, including weather conditions, road types, and driver habits, which may result in false alarms or missed detections.
Physiological signal monitoring methods aim to directly evaluate the driver’s internal mental state by measuring signals such as heart rate variability (HRV) [4,5], brainwave activity (EEG) [6,7], and skin conductance level (EDA) [8]. These signals respectively reflect autonomic nervous system activity, cortical arousal, and sympathetic nervous system responses. For example, HRV represents the balance of the autonomic nervous system, where fatigue typically causes an increase in sympathetic activity and a decrease in parasympathetic activity, resulting in reduced HRV. EEG indicates decreased alertness during fatigue through elevated and wave power. EDA reflects sympathetic arousal, where fatigue or distraction is often associated with lower frequency and amplitude of skin conductance responses (SCR) and a decrease in the skin conductance level (SCL). Although these methods offer high detection accuracy, their reliance on wearable or contact-based sensors may negatively affect user comfort and acceptance, and limit scalability in real-world driving environments.
Facial landmark detection methods capture video data of the driver’s face using in-cabin cameras to extract visual cues such as eyelid closure percentage (PERCLOS), gaze direction, and facial expressions [9,10]. These indicators are commonly used as proxies for drowsiness and distraction. Similarly, behavior-based approaches extend this analysis by observing the driver’s gross motor behaviors, including head nodding, posture shifts, and hand movements, through video analysis or motion sensors installed inside the cabin [11]. While these methods are non-invasive and intuitive, they suffer from high sensitivity to lighting variations, facial occlusions (e.g., masks, sunglasses), and privacy concerns, particularly in shared mobility scenarios. These limitations hinder their wide-scale deployment and raise significant ethical and data protection issues.
In recent years, millimeter-wave (mmWave) radar has attracted increasing attention as a promising non-contact sensing technology for driver monitoring. It offers several advantages, including strong robustness to environmental conditions, the ability to penetrate obstructions, and enhanced privacy protection. Numerous studies have explored the use of mmWave radar to detect physiological signals such as respiration and heart rate, as well as gross driver behaviors such as posture and motion. Compared to conventional approaches that focus solely on either behavior or physiology, mmWave radar has the potential to simultaneously capture both behavioral patterns and physiological states, enabling more comprehensive driver state monitoring. However, challenges remain in achieving fine-grained driver state assessment, particularly in complex in-vehicle environments where various interferences and dynamic driver postures can affect detection accuracy and reliability.
Therefore, this paper proposes a novel approach that utilizes millimeter-wave (mmWave) radar to detect driver fatigue and distraction by analyzing subtle body and posture dynamics. The main contributions of this study are summarized as follows:
- A robust and non-contact driver monitoring framework is developed based on mmWave radar, featuring strong resistance to interference and enhanced privacy protection. Unlike conventional methods that focus solely on either behavioral or physiological data, the proposed system integrates both types of information through parallel processing pipelines, enabling more comprehensive driver state perception.
- A deep learning architecture named Radar-based Temporal-Spatio Fusion Network (RTSFN) is proposed, which effectively fuses temporal and spatial features extracted from radar signals to identify risky driving behaviors.
- The system is designed with a balance between detection accuracy and computational efficiency, allowing real-time inference on edge devices and supporting practical deployment in in-vehicle environments.
2. FMCW Radar Principles and Hardware Setup
2.1. Overview of FMCW Millimeter-Wave Radar Technology
Frequency-Modulated Continuous Wave (FMCW) radar transmits a chirp signal—a continuous wave whose frequency increases or decreases linearly over time. When this signal encounters a target, part of it is reflected back to the radar receiver. The system generates this chirp signal via a signal generator, amplifies it, and transmits it through the transmitting antenna. The reflected signal is captured by the receiving antenna, amplified, and mixed with a local copy of the transmitted signal in a process called dechirping, which produces an intermediate frequency (IF) signal. This IF signal encodes information about the target’s distance and velocity. After digitization, digital signal processing techniques such as the Fast Fourier Transform (FFT) are applied to extract key target parameters including range, velocity, and angle. Figure 1 presents a simplified block diagram of an FMCW radar system.
FMCW technology is particularly advantageous for real-time driver monitoring due to its high range and velocity resolution, low power consumption [12], and cost-effectiveness. Furthermore, its continuous-wave nature enables real-time measurements and robustness against multipath fading, making it suitable for tracking moving targets in dynamic in-vehicle environments.
Based on the frequency and phase characteristics of the received signals, the system can estimate both the range and velocity of targets. These are derived through well-established signal processing techniques as described below.
2.1.1. Range Estimation
The distance d of an object is estimated based on the beat frequency , which represents the difference in frequency between the transmitted and received signals. The relationship between the distance and the beat frequency is given by:
where c is the speed of light, B is the chirp bandwidth, and is the chirp duration. A higher beat frequency corresponds to a larger distance between the radar and the target.
2.1.2. Velocity Estimation
The velocity v of an object is estimated using the Doppler effect, which causes a frequency shift in the reflected signal as the object moves relative to the radar. To extract this frequency shift, a Doppler FFT is applied, and the velocity is inferred from the phase variation as follows:
where is the wavelength of the transmitted signal. A greater phase shift indicates a higher velocity of the target.
2.1.3. Angle Estimation
FMCW radar estimates the angle of arrival (AoA) of a target using multiple antennas. By measuring phase differences between the signals received at each antenna, the system determines the target’s angle. This is typically achieved through beamforming or MIMO (Multiple Input Multiple Output) techniques. The angle estimation can be expressed as:
where is the distance between antennas and R is the target’s range. In practice, more advanced signal processing methods are used to improve accuracy, especially in dynamic environments.
2.2. Radar Hardware Setup and Configuration
To enable robust and real-time driver monitoring, we selected the Texas Instruments AWR1642BOOST FMCW radar as our primary sensing device. Texas Instruments offers a variety of millimeter-wave radar sensors under the AWR and IWR series. The AWR series is specifically optimized for automotive and industrial applications, making it well-suited for driving-related scenarios such as fatigue and distraction detection. In contrast, the IWR series is geared toward broader applications, including industrial sensing, security, and IoT domains.
Given the automotive focus of this study, the AWR1642 device was chosen due to its high-frequency operation in the 77 GHz band, which provides improved range and Doppler resolution compared to lower-frequency alternatives. Additionally, the AWR1642 integrates a high-performance Digital Signal Processor (DSP), which supports efficient on-chip processing of radar signals. This is particularly advantageous for real-time applications, where fast and reliable computation is critical for handling large volumes of streaming data and executing complex signal processing algorithms with low latency.
The radar was configured via a dedicated configuration file that controls signal transmission, processing parameters, and data output format. Key radar settings used in our experiment are summarized in Table 1. These include chirp characteristics (starting frequency, bandwidth, duration), range and velocity resolution, frame rate, and detection thresholds. Data were collected through the UART interface using the TLV (Type-Length-Value) format, enabling structured communication between the radar and the host system.
3. System Overview
Numerous studies have indicated that drivers exhibit significant physiological changes prior to the onset of fatigue, such as increased heart rate and decreased respiratory rate [13]. These physiological variations often precede or accompany observable behavioral cues (e.g., head nodding or yawning), making them valuable indicators for drowsiness detection.
To incorporate both internal (physiological) and external (behavioral) indicators for accurate driver state evaluation, this study proposes a multimodal detection system based on FMCW millimeter-wave radar. As illustrated in Figure 2, radar signals are decoded into Range-Doppler, Range Profile, and Noise Profile features, followed by frame stacking and preprocessing. These data streams are input to the Radar-based Temporal-Spatio Fusion Network (RTSFN), which performs spatio-temporal feature fusion for behavioral classification. Concurrently, additional radar signals are used to estimate heart rate and respiration rate as inputs to the physiological signal analysis module.
By integrating behavioral classification with physiological signal estimation, the proposed system enables comprehensive evaluation of driver fatigue and distraction, offering early warning potential in real-world driving environments.
4. Human Motion Detection: RTSFN-based Driver Action Detection
4.1. Input Data of Radar Signals
Millimeter-wave radar signals typically provide three types of input data, each offering distinct information for analyzing target characteristics and driver behavior:
Range Profile: The Range Profile (Figure 3) represents the reflected signal power as a function of distance between the radar and the target. The x-axis denotes distance, and the y-axis represents the signal gain. Higher gain values indicate stronger reflections, which are helpful in analyzing static characteristics such as the driver’s torso shape and seating posture.
Noise Profile: The Noise Profile (Figure 4) measures the background noise intensity across the radar range bins. It helps distinguish meaningful reflections from environmental noise. In the presence of target motion, fluctuations in the noise profile become more pronounced, which can aid in detecting dynamic behaviors or sudden movements.
Range-Doppler Map: The Range-Doppler Map (Figure 5) captures both the distance and relative velocity of moving targets. The x-axis indicates range, the y-axis indicates Doppler velocity, and the color represents signal magnitude. By analyzing temporal sequences of these maps, motion patterns such as head movements or hand gestures can be tracked effectively.
4.2. Input Data Pre-Processing
Human behavior is often recognized through a series of temporally evolving motions. To capture these temporal dynamics, we adopt a frame stacking strategy in which consecutive radar frames are concatenated along the temporal axis to form a time-extended input tensor. Specifically, we define a temporal window , which represents the total number of radar frames required for one inference(Figure 6). To construct this window, frames are stacked from the internal buffer, ensuring that the model receives a sufficient temporal context within each input segment.The role and definition of the buffer length N in shaping the temporal input structure are further described in Section 4.3.
Prior to model inference, each radar frame sequence undergoes median filtering to suppress impulsive noise and min–max normalization to maintain consistent input scale. These preprocessing steps enhance the robustness and stability of the model in real-time operating conditions.
4.3. Radar-based Temporal-Spatio Fusion Network (RTSFN)
This study proposes a multi-modal deep learning framework (Figure 7) designed to effectively extract and integrate temporal and spatial features from millimeter-wave radar signals for driving behavior recognition and risk assessment. The architecture consists of three core components: a Temporal Modality encoder, a Spatial Modality encoder, and a Spatial-Temporal fusion module. A novel feature buffering mechanism is integrated to efficiently manage streaming radar data, balancing computational resource consumption with real-time inference requirements. The function of each module in Figure is summarized below:
- Temporal Encoder (Gated TCN): Captures long-range motion patterns from Range-Doppler sequences using time-distributed convolution and gated temporal modeling.
- Spatial Encoder (SE-CNN): Encodes static posture features from Range Profile and Noise Profile inputs via squeeze-and-excitation enhanced convolutional layers.
- Cross-Gated Fusion: Enhances the complementarity between temporal and spatial features using shared gating mechanisms and residual integration.
- Adapter Module: Applies residual transformation and dimensional compression to stabilize training and improve feature expressiveness.
- Multi-Task Output: Outputs results for two tasks — binary risk detection and multi-class classification of seven distinct driving behaviors.
4.3.1. Temporal Modality Encoder
The Temporal Modality encoder processes Range-Doppler spectrogram sequences of shape , where the first two dimensions correspond to spatial height and width, and the third denotes temporal length. The input tensor is permuted and reshaped to to prioritize the temporal dimension for frame-wise spatial feature extraction.
Spatial features are independently extracted for each frame via a TimeDistributed convolutional neural network composed of convolutional and pooling layers, effectively capturing localized Doppler and range information. These sequential features are then processed by a Gated Temporal Convolutional Network (Gated TCN)(Figure 8), which employs dilated causal convolutions combined with gating mechanisms to model both short- and long-range temporal dependencies while selectively filtering relevant temporal information. This results in a temporal feature vector .
4.3.2. Spatial Modality Encoder
The Spatial Modality encoder receives concatenated Range Profile and Noise Profile data with an input shape of , representing the number of range bins, signal channels, and temporal frames respectively. The input is permuted and reshaped to to align temporal frames for spatial convolution.
Hierarchical spatial features are extracted through multiple TimeDistributed 2D convolutional layers with progressive downsampling. A Squeeze-and-Excitation (SE) block recalibrates channel-wise feature responses to enhance salient spatial information. Global average pooling and flattening produce a spatial feature vector .
4.3.3. Feature Buffering Mechanism
To efficiently process streaming millimeter-wave radar data, an internal feature buffering mechanism is implemented within the encoders. Intermediate feature representations are accumulated for a fixed number of temporal frames N (e.g., 14 frames). Once the buffer reaches capacity, aggregated features are forwarded to the temporal modeling module. As new frames arrive (e.g., in chunks of two), the oldest buffered features are discarded to maintain a fixed sliding window size.
Here, denotes the total temporal window length required by the downstream temporal modeling module (such as the TCN) to capture sufficient temporal context for accurate behavior recognition. This buffering strategy significantly reduces memory consumption and redundant computations, while preserving temporal context even when , thus balancing recognition accuracy with computational efficiency.
4.3.4. Spatial-Temporal Fusion Module
The fusion module employs a cross-gated residual fusion strategy to integrate spatial and temporal features. Spatial feature vector and temporal feature vector are modulated via shared sigmoid gates that emphasize complementary information and suppress irrelevant signals. The gated features are combined through residual addition, yielding a fused feature vector .
The concatenated vector is then processed by an Adapter module—a lightweight residual block comprising bottleneck fully connected layers with ReLU activation and residual connections—to enhance feature representation and training stability:
The adapted features are subsequently fed into multi-task classification heads, performing binary driving risk prediction and multi-class classification of dangerous driving behaviors (7 classes).
4.4. Dataset Labeling
Figure 9 illustrates the data labeling strategy used in our system. To improve labeling stability and reduce misclassification caused by transient or noisy actions, we adopt a delayed labeling strategy during the annotation process. Specifically, a behavior is not labeled immediately upon its initial occurrence; instead, it must persist for at least 3 consecutive frames before the label is applied. Similarly, after the behavior ends, the label is extended for an additional 3 frames to ensure the action segment is fully captured. This approach helps filter out short or inconsistent movements that could otherwise lead to incorrect annotations.
During training data preparation, we employ a sliding window approach to group multiple consecutive frames as one input sample for the model. The label of each sample is determined by the annotation of the last frame within that window. This design allows the model to learn the temporal dynamics of human behavior while associating the input sequence with the current action status. Moreover, it introduces temporal smoothing to enhance labeling consistency.
4.5. Model Training
To simultaneously optimize the driving risk classification and behavior recognition tasks, we designed a multi-task learning framework that incorporates both uncertainty-based loss weighting and representation alignment.
During training, the model is supervised using three loss components:
- Task-Specific Losses: We compute cross-entropy losses for both classification heads:where y is the ground truth label and is the predicted probability.
- Uncertainty-Based Weighting: Inspired by the work of Kendall et al. [14], we introduce two learnable log-variance parameters and to adaptively balance the tasks. The uncertainty-weighted total task loss is:
- Cosine Alignment Loss (Optional): To encourage consistent feature representations across modalities (e.g., range and Doppler), we apply a cosine similarity penalty between the latent vectors and :
The total loss function is expressed as:
where is a hyperparameter that controls the alignment strength.
This strategy allows the model to automatically reweight the importance of each task based on their predictive uncertainty, while promoting cross-modal feature consistency. All parameters, including the uncertainty weights, are learned end-to-end through backpropagation.
5. Physiological Signals Monitoring: Heart and Respiration Signal Analysis
In this study, we extract physiological signals using complex I/Q data from the Azimuth Static Heatmap generated by FMCW millimeter-wave radar. This heatmap captures static beamformed reflections between antenna pairs without Doppler processing, providing stable and continuous complex phase information. Such phase continuity is essential for time-series phase tracking and forms the basis of micro-motion analysis. As a result, subtle vibrations caused by thoracic expansion during breathing or by heartbeat can be detected and analyzed from specific range-angle bins to estimate vital signs in a non-invasive manner.
5.1. Heart Rate Monitoring
To estimate heart rate from FMCW radar signals, we developed a multi-stage signal processing pipeline (Figure 10). This method extracts phase-based micro-motions from the static azimuth heatmap and estimates heart rate using data collected from the azimuth heatmap over a continuous 60-second period.
5.1.1. Construct Phase Matrix from TLV
Complex I/Q samples are parsed from the radar byte stream, representing beamformed reflections from virtual antenna pairs. The data is reshaped into a 3D tensor , where F is the number of frames, is the number of virtual antennas, and R denotes the number of range bins. This structure enables efficient temporal phase analysis for heartbeat detection.
5.1.2. Unwrap Phase and Select Optimal Range Bin
For each range bin, the temporal phase is unwrapped along the time axis to remove phase discontinuities. The temporal variance of the phase for each bin is calculated as:
where is the mean phase of the r-th bin. The range bin with the highest variance is selected for further processing:
5.1.3. Phase Signal Denoising and Template Matching
Low-frequency trends are removed from the phase signal by applying spline smoothing. The residual signal, obtained by subtracting the smoothed curve, contains the heartbeat-related micro-motions. A segment with low variance from the residual is chosen as the matched filter template . This template is convolved with the original residual signal to enhance heartbeat features:
where * denotes convolution. The convolution output is normalized using z-score standardization:
where and are the mean and standard deviation of , respectively.
5.1.4. Envelope Extraction and Bandpass Filtering
The analytic signal of the normalized output is computed via the Hilbert transform. The envelope is extracted to represent the heartbeat amplitude envelope. A fourth-order Butterworth bandpass filter is applied to isolate the physiological heart rate frequency band Hz:
where B and A are the filter coefficients, and filtfilt denotes zero-phase forward and reverse filtering.
5.1.5. Chirp Z-Transform Frequency Estimation
To estimate heart rate frequency with high resolution, the Chirp Z-Transform (CZT) is applied to perform a focused frequency search within the physiological heart rate band. This approach enables direct and accurate frequency estimation without requiring broad-spectrum analysis. Parabolic interpolation further improves frequency accuracy:
where , , and are the magnitudes of the frequency bins adjacent to the peak, and is the frequency resolution.
5.1.6. Heart Rate Calculation
Finally, the refined peak frequency is converted to beats per minute (BPM):
providing the estimated heart rate derived from radar phase micro-motions.
5.2. Respiration Rate Monitoring
To estimate respiration rate from FMCW radar signals, we developed a multi-stage signal processing pipeline (Figure 11). This method also extracts phase-based micro-motions from the static azimuth heatmap and estimates respiration rate using data collected from the azimuth heatmap over a continuous 60-second period.
5.2.1. Phase Matrix Construction from TLV:
The complex I/Q samples are parsed from the radar TLV (Type-Length-Value) byte stream. These samples correspond to the combined signals from virtual antenna pairs formed by transmit and receive antennas, resulting in virtual antennas. The extracted data is reshaped into a 3D tensor , where F is the number of frames and R is the number of range bins. This format enables temporal phase analysis for respiration detection.
5.2.2. Phase Unwrapping and Averaging:
For each virtual antenna and range bin, the phase is computed by unwrapping the angle of the complex I/Q samples along the time axis to avoid discontinuities. The phase is then averaged over the antenna dimension to produce a phase matrix of shape , representing the temporal phase variation at each range bin.
5.2.3. Low-Rank and Sparse Decomposition (RPCA):
To isolate respiration-related signals from noise and interference, the phase matrix undergoes Robust Principal Component Analysis (RPCA). The observed phase data D is decomposed into a low-rank component L capturing the dominant respiration patterns, and a sparse component S representing outliers and noise:
This decomposition enhances the signal quality for subsequent frequency analysis.
5.2.4. Sparse Spectrum Recovery via FISTA:
Each range bin’s low-rank temporal signal is processed with a sparse frequency recovery method using the Fast Iterative Shrinkage-Thresholding Algorithm (FISTA). A discrete Fourier basis matrix A is constructed, and the sparse spectrum is estimated by solving:
This promotes sparsity in the frequency domain, allowing robust identification of respiration-related frequency components.
5.2.5. Respiration Frequency Estimation and BPM Calculation:
The spectra from all range bins are averaged to obtain a mean frequency spectrum. Within the physiological respiration frequency band Hz, the peak frequency is detected:
where is the averaged spectral magnitude. The respiration rate in breaths per minute (BPM) is then computed as:
This final value represents the estimated respiration rate extracted from the radar phase data.
6. Results
6.1. Experimental Setup
To evaluate the performance of our proposed system, we implemented it using the Texas Instruments AWR1642BOOST millimeter-wave radar and deployed the model on the NVIDIA Jetson Orin Nano edge computing platform.
6.1.1. AWR1642BOOST Millimeter-Wave Radar
The AWR1642BOOST is a single-chip 77 GHz millimeter-wave radar sensor developed by Texas Instruments(Table 2). It operates based on Frequency-Modulated Continuous Wave (FMCW) radar technology, enabling high-accuracy motion and position tracking. This radar module integrates a digital signal processor (DSP) and hardware accelerators to facilitate efficient real-time signal processing.
6.1.2. NVIDIA Jetson Orin Nano
The NVIDIA Jetson Orin Nano is a high-performance edge AI computing platform tailored for real-time inference applications (Table 3). It offers sufficient computational resources to run deep learning models efficiently while maintaining low power consumption. The device supports CUDA and TensorRT acceleration, which optimizes the inference speed of our RTSFCN model.
6.2. Dataset
The dataset was collected in a stationary vehicle environment, where millimeter-wave radar sensors were strategically positioned at different angles to comprehensively capture the driver’s behavior. We recorded driving activities from four participants across three different vehicles to ensure diversity in driving postures and cabin layouts. In total, approximately 400 minutes of annotated data were accumulated for subsequent model training and analysis. The setup and sensor placement are illustrated in Figure 12, which shows the actual deployment of the radar devices within the vehicle.
6.3. Experimental Result
To evaluate the performance of the proposed driver monitoring system, we present the confusion matrices for both binary driving risk classification and multi-class behavior recognition, as shown in Figure 13 and Figure 14.
Figure 13 shows the confusion matrix for classifying driving behavior as either safe or dangerous. The system achieved a true positive rate of 0.89 for dangerous driving and 0.98 for safe driving. Most misclassifications occurred during the initial stages of risky behaviors, where the motion features are subtle and difficult to distinguish. For instance, early movements such as slight posture shifts or the initial phase of reaching for an object may be mistaken for normal behavior.
However, field testing has demonstrated that once the full motion is completed—such as a full backward turn or extended phone usage—the system reliably identifies the behavior as dangerous. This indicates strong practical robustness in detecting meaningful instances of unsafe driving.
Figure 14 displays the confusion matrix for the seven-class behavior detection task. Overall, the model shows high classification accuracy across all categories, with minimal confusion between behaviors. These results support the effectiveness of the proposed spatio-temporal fusion framework in recognizing diverse driving actions using mmWave radar signals.
To evaluate the accuracy of physiological signal estimation, we used a contact-based commercial device to acquire ground-truth heart rate data, which served as a reference for validating the radar-based estimation results. The respiration rate was assessed based on known breathing patterns during data collection sessions.
The estimation accuracy was computed using the following formula:
Based on this metric, the proposed system achieved an average accuracy of 92% for heart rate estimation and 95% for respiration rate estimation.
6.4. Comparisons with Other Methods
Table 4 summarizes the accuracy of driver behavior detection across various state-of-the-art methods utilizing different sensor technologies. The results show that our proposed FMCW radar-based multi-modal system achieves the best performance in most behavior recognition tasks, demonstrating strong detection capability and robustness.
Compared with Sen et al. [16], our method performs well in recognizing multiple behaviors. Notably, for the behaviors of nodding and fetching forward, our accuracy slightly surpasses that of Sen et al. In addition, our model achieves good accuracy in detecting other distracted driving behaviors, illustrating the robustness of our system in capturing various driver actions.
For critical fatigue indicators such as yawning, our method attains 98% accuracy, outperforming other vision-based methods. Similarly, for distracted driving behaviors including using phone, picking objects, and turning back, our method also demonstrates the highest accuracy, indicating the system’s capability to effectively detect subtle and complex driver movements.
Although vision-based methods such as those by Sengar et al. [17] and Guo et al. [19] perform reasonably well in some behavior detection tasks, their accuracy is often affected by lighting and occlusion. Event camera and depth camera methods (e.g., Shariff et al. [18] and Guo et al.) provide complementary advantages in some behaviors, but overall accuracy remains lower than ours.
Overall, this comparative analysis confirms the advantages of our FMCW radar-based driver behavior recognition system in terms of accuracy and robustness, and highlights its potential for practical deployment in advanced driver assistance systems (ADAS).
7. Discussion
The experimental results validate the effectiveness of the proposed RTSFN architecture in recognizing driver behaviors by fusing temporal and spatial features extracted from millimeter-wave radar signals. The Gated TCN module successfully captures long-term dependencies in motion sequences, while the SE-enhanced convolutional network strengthens the representation of static postural features. The modality fusion mechanism (Cross-Gate Fusion) further enhances the complementarity between spatial and temporal streams, enabling robust classification under varying driving conditions.
Compared to existing vision-based or wearable-sensor-based approaches, the proposed radar-based system offers significant advantages, particularly in terms of privacy preservation, robustness to lighting conditions, and non-intrusiveness. Behaviors such as nodding, turning around, or drinking—often prone to misclassification in camera-based systems due to occlusions or poor angles—can be more reliably detected using radar signals.
However, several limitations remain. First, the majority of the data was collected in a stationary vehicle under simulated conditions, without incorporating real-world variables such as vehicle motion or external environmental changes. Second, while the system achieved high accuracy on a limited set of participants, its generalizability to larger and more diverse populations has yet to be confirmed.
Future work will focus on expanding the dataset, increasing the diversity of participant profiles and testing in real driving scenarios. Additional research directions include enabling multi-person monitoring, improving robustness under dynamic vehicle motion, and integrating the system with advanced driver-assistance systems (ADAS) to facilitate real-world deployment.
8. Conclusions
This paper introduces a novel driver monitoring system that leverages millimeter-wave FMCW radar and a deep spatio-temporal fusion network to recognize high-risk driving behaviors in a fully non-contact and privacy-preserving manner. Unlike conventional approaches that rely solely on visual cues or physiological sensors, the proposed method combines multi-modal radar features and multi-task deep learning to simultaneously assess both behavioral and vital sign information.
The proposed system achieves high recognition accuracy while maintaining real-time performance on edge hardware, demonstrating its suitability for deployment in practical automotive environments. By operating independently of ambient light and without requiring driver cooperation or wearable devices, the system offers a scalable and unobtrusive solution for enhancing road safety.
Overall, this work contributes a unified sensing and inference framework that advances the capabilities of radar-based driver monitoring. It opens new directions for future in-vehicle intelligence, paving the way for seamless integration into next-generation driver assistance and autonomous driving platforms.
Author Contributions
Conceptualization, Shih-Pang Tseng and Jhing-Fa Wang; methodology, Shih-Pang Tseng and Wun-Yang Wu; software, Wun-Yang Wu and Dawei Tao; validation, Jhing-Fa Wang and Dawei Tao; resources, Dawei Tao; data curation, Dawei Tao; writing—original draft preparation, Wun-Yang Wu; writing—review and editing, Shih-Pang Tseng; visualization, Wun-Yang Wu; supervision, Jhing-Fa Wang; project administration, Shih-Pang Tseng. All authors have read and agreed to the published version of the manuscript
Funding
This research received no external funding.
Institutional Review Board Statement
Not applicable.
Informed Consent Statement
Not applicable.
Data Availability Statement
The data used in this study were collected by the research team using millimeter-wave radar systems to monitor driver fatigue and distraction. These datasets are proprietary and restricted due to privacy concerns, institutional policies, and the sensitive nature of the driver behavior and physiological data involved. As such, the raw data are not publicly available and are limited to internal use within the research team.
Acknowledgments
We would like to express our sincere gratitude to National Cheng Kung University (NCKU) for providing the research facilities, funding, and academic support that made this study possible. Special thanks are extended to the faculty and staff of the Department of Electrical Engineering at NCKU for their invaluable guidance, resources, and encouragement throughout the research process. We also appreciate the collaboration and assistance from our research team members and external partners who contributed to the data collection and model development for this project.
Conflicts of Interest
The authors declare no conflicts of interest.
References
- World Health Organization. 2023. Global Status Report on Road Safety 2023. Geneva: World Health Organization.
- Jeon, Y.; Kim, B.; Baek, Y. Ensemble CNN to Detect Drowsy Driving with In-Vehicle Sensor Data. Sensors, 21(8), 2372, 2021. [CrossRef]
- Ersal, T.; Fuller, H.J.A.; Tsimhoni, O.; Stein, J.L.; Fathy, H.K. Model-Based Analysis and Classification of Driver Distraction Under Secondary Tasks. IEEE Transactions on Intelligent Transportation Systems, 11(3), 692–701, 2010.
- Dong, Z.; Zhang, M.; Sun, J.; Cao, T.; Liu, R.; Wang, Q. A Fatigue Driving Detection Method Based on Frequency Modulated Continuous Wave Radar. IEEE International Conference on Consumer Electronics and Computer Engineering (ICCECE), 670–675, 2021.
- Freitas, A.; Almeida, R.; Gonçalves, H.; Conceição, G.; Freitas, A. Monitoring Fatigue and Drowsiness in Motor Vehicle Occupants Using Electrocardiogram and Heart Rate—A Systematic Review. Transportation Research Part F: Traffic Psychology and Behaviour, 103, 586–607, 2024.
- Luo, H.; Qiu, T.; Liu, C.; Huang, P. Research on Fatigue Driving Detection Using Forehead EEG Based on Adaptive Multi-Scale Entropy. Biomedical Signal Processing and Control, 51, 50–58, 2019.
- Ren, B.; Guan, W.; Zhou, Q.; Wang, Z. EEG-Based Driver Fatigue Monitoring Within a Human–Ship–Environment System: Implications for Ship Braking Safety. Sensors, 23(10), 4644, 2023.
- Jiao, Y.; Zhang, C.; Chen, X.; Fu, L.; Jiang, C.; Wen, C. Driver Fatigue Detection Using Measures of Heart Rate Variability and Electrodermal Activity. IEEE Transactions on Intelligent Transportation Systems, 25(6), 5510–5524, 2023.
- Lian, Z.; Xu, T.; Yuan, Z.; Li, J.; Thakor, N.; Wang, H. Driving Fatigue Detection Based on Hybrid Electroencephalography and Eye Tracking. IEEE Journal of Biomedical and Health Informatics, 2024.
- Zhu, T.; Zhang, C.; Wu, T.; Ouyang, Z.; Li, H.; Na, X.; Liang, J.; Li, W. Research on a Real-Time Driver Fatigue Detection Algorithm Based on Facial Video Sequences. Applied Sciences, 12(4), 2224, 2022.
- Kır, S.; Becerikli, Y. Behavior-based driver fatigue detection system with deep belief network. Neural Computing and Applications, 34(16), 14053–14065, 2022.
- Venon, A.; Dupuis, Y.; Vasseur, P.; Merriaux, P. Millimeter Wave FMCW RADARs for Perception, Recognition and Localization in Automotive Applications: A Survey. IEEE Transactions on Intelligent Vehicles, 7(3), 533–555, 2022. [CrossRef]
- Warwick, B.; Symons, N.; Chen, X.; Xiong, K. Detecting Driver Drowsiness Using Wireless Wearables. In Proceedings of the 2015 IEEE 12th International Conference on Mobile Ad Hoc and Sensor Systems (MASS), Dallas, TX, USA, 19–22 October 2015; pp. 585–588. [CrossRef]
- Kendall, A.; Gal, Y.; Cipolla, R. Multi-Task Learning Using Uncertainty to Weigh Losses for Scene Geometry and Semantics. In Proceedings of the 2018 IEEE/CVF Conference on Computer Vision and Pattern Recognition (CVPR), Salt Lake City, UT, USA, 18–22 June 2018; pp. 7482–7491. [CrossRef]
- Jung, J.; Lim, S.; Kim, B.K.; Lee, S. CNN-based driver monitoring using millimeter-wave radar sensor. IEEE Sensors Letters 2021, 5, 1–4. [CrossRef]
- Sen, A.; Mandal, A.; Karmakar, P.; Das, A.; Chakraborty, S. mmDrive: mmWave sensing for live monitoring and on-device inference of dangerous driving. In Proceedings of the 2023 IEEE International Conference on Pervasive Computing and Communications (PerCom), Orlando, FL, USA, 13–17 March 2023; pp. 2–11. IEEE. [CrossRef]
- Sengar, N.; Kumari, I.; Lee, J.; Har, D. PoseViNet: Distracted driver action recognition framework using multi-view pose estimation and vision transformer. arXiv 2023, arXiv:2312.14577. Available online: https://arxiv.org/abs/2312.14577.
- Shariff, W.; Kielty, P.; Lemley, J.; Corcoran, P. Spiking-DD: Neuromorphic event camera based driver distraction detection with spiking neural network. In Proceedings of the IET Conference Proceedings CP887, Stevenage, UK, August 2024; Volume 2024, No. 10, pp. 71–78. [CrossRef]
- Guo, Z.; Liu, Q.; Zhang, L.; Li, Z.; Li, G. L-TLA: A lightweight driver distraction detection method based on three-level attention mechanisms. IEEE Transactions on Reliability 2024, 73, 1731–1742. [CrossRef]
Figure 1.
FMCW radar system block diagram.
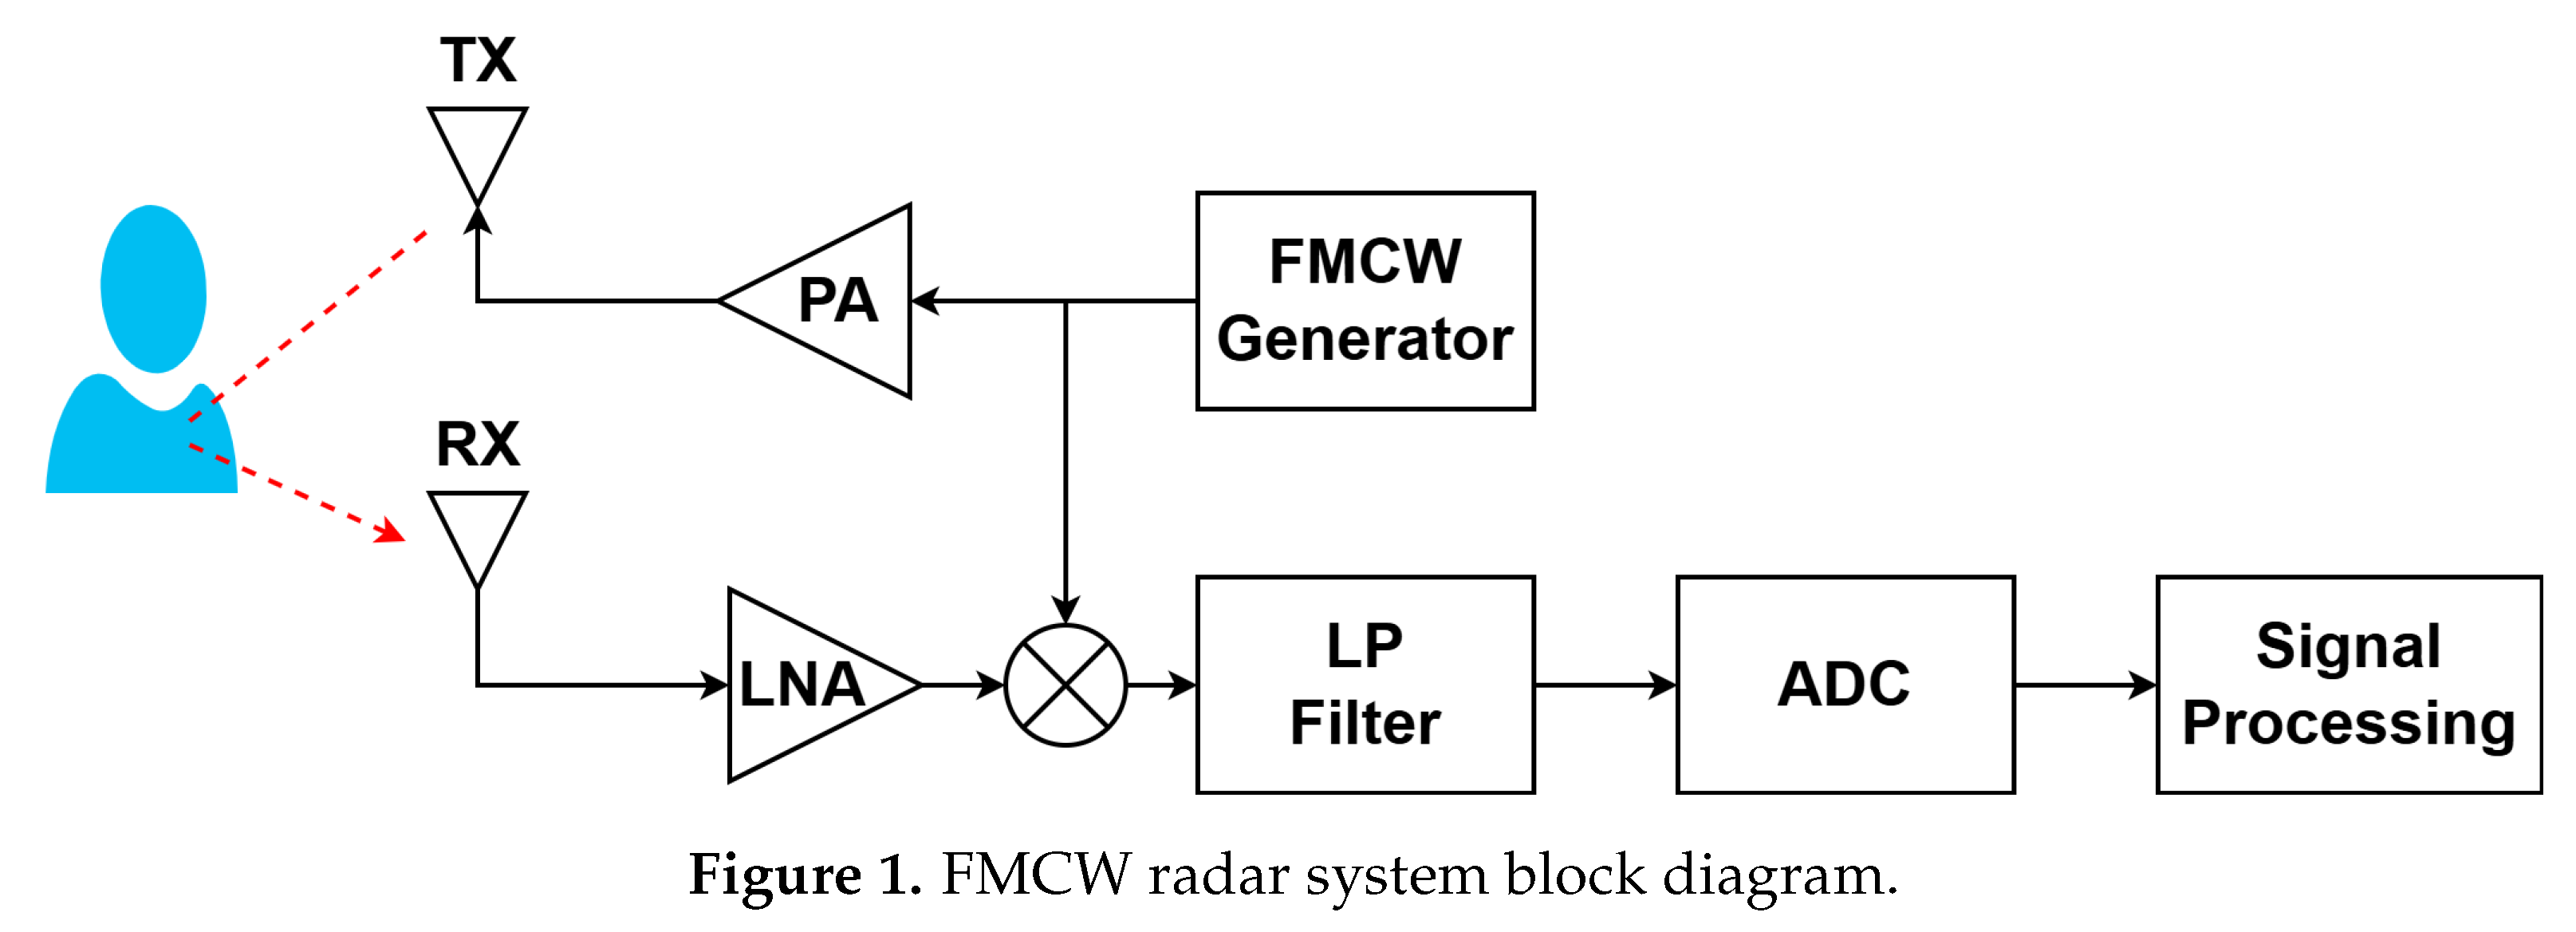
Figure 2.
Overview of multimodal driver monitoring and risk detection system.
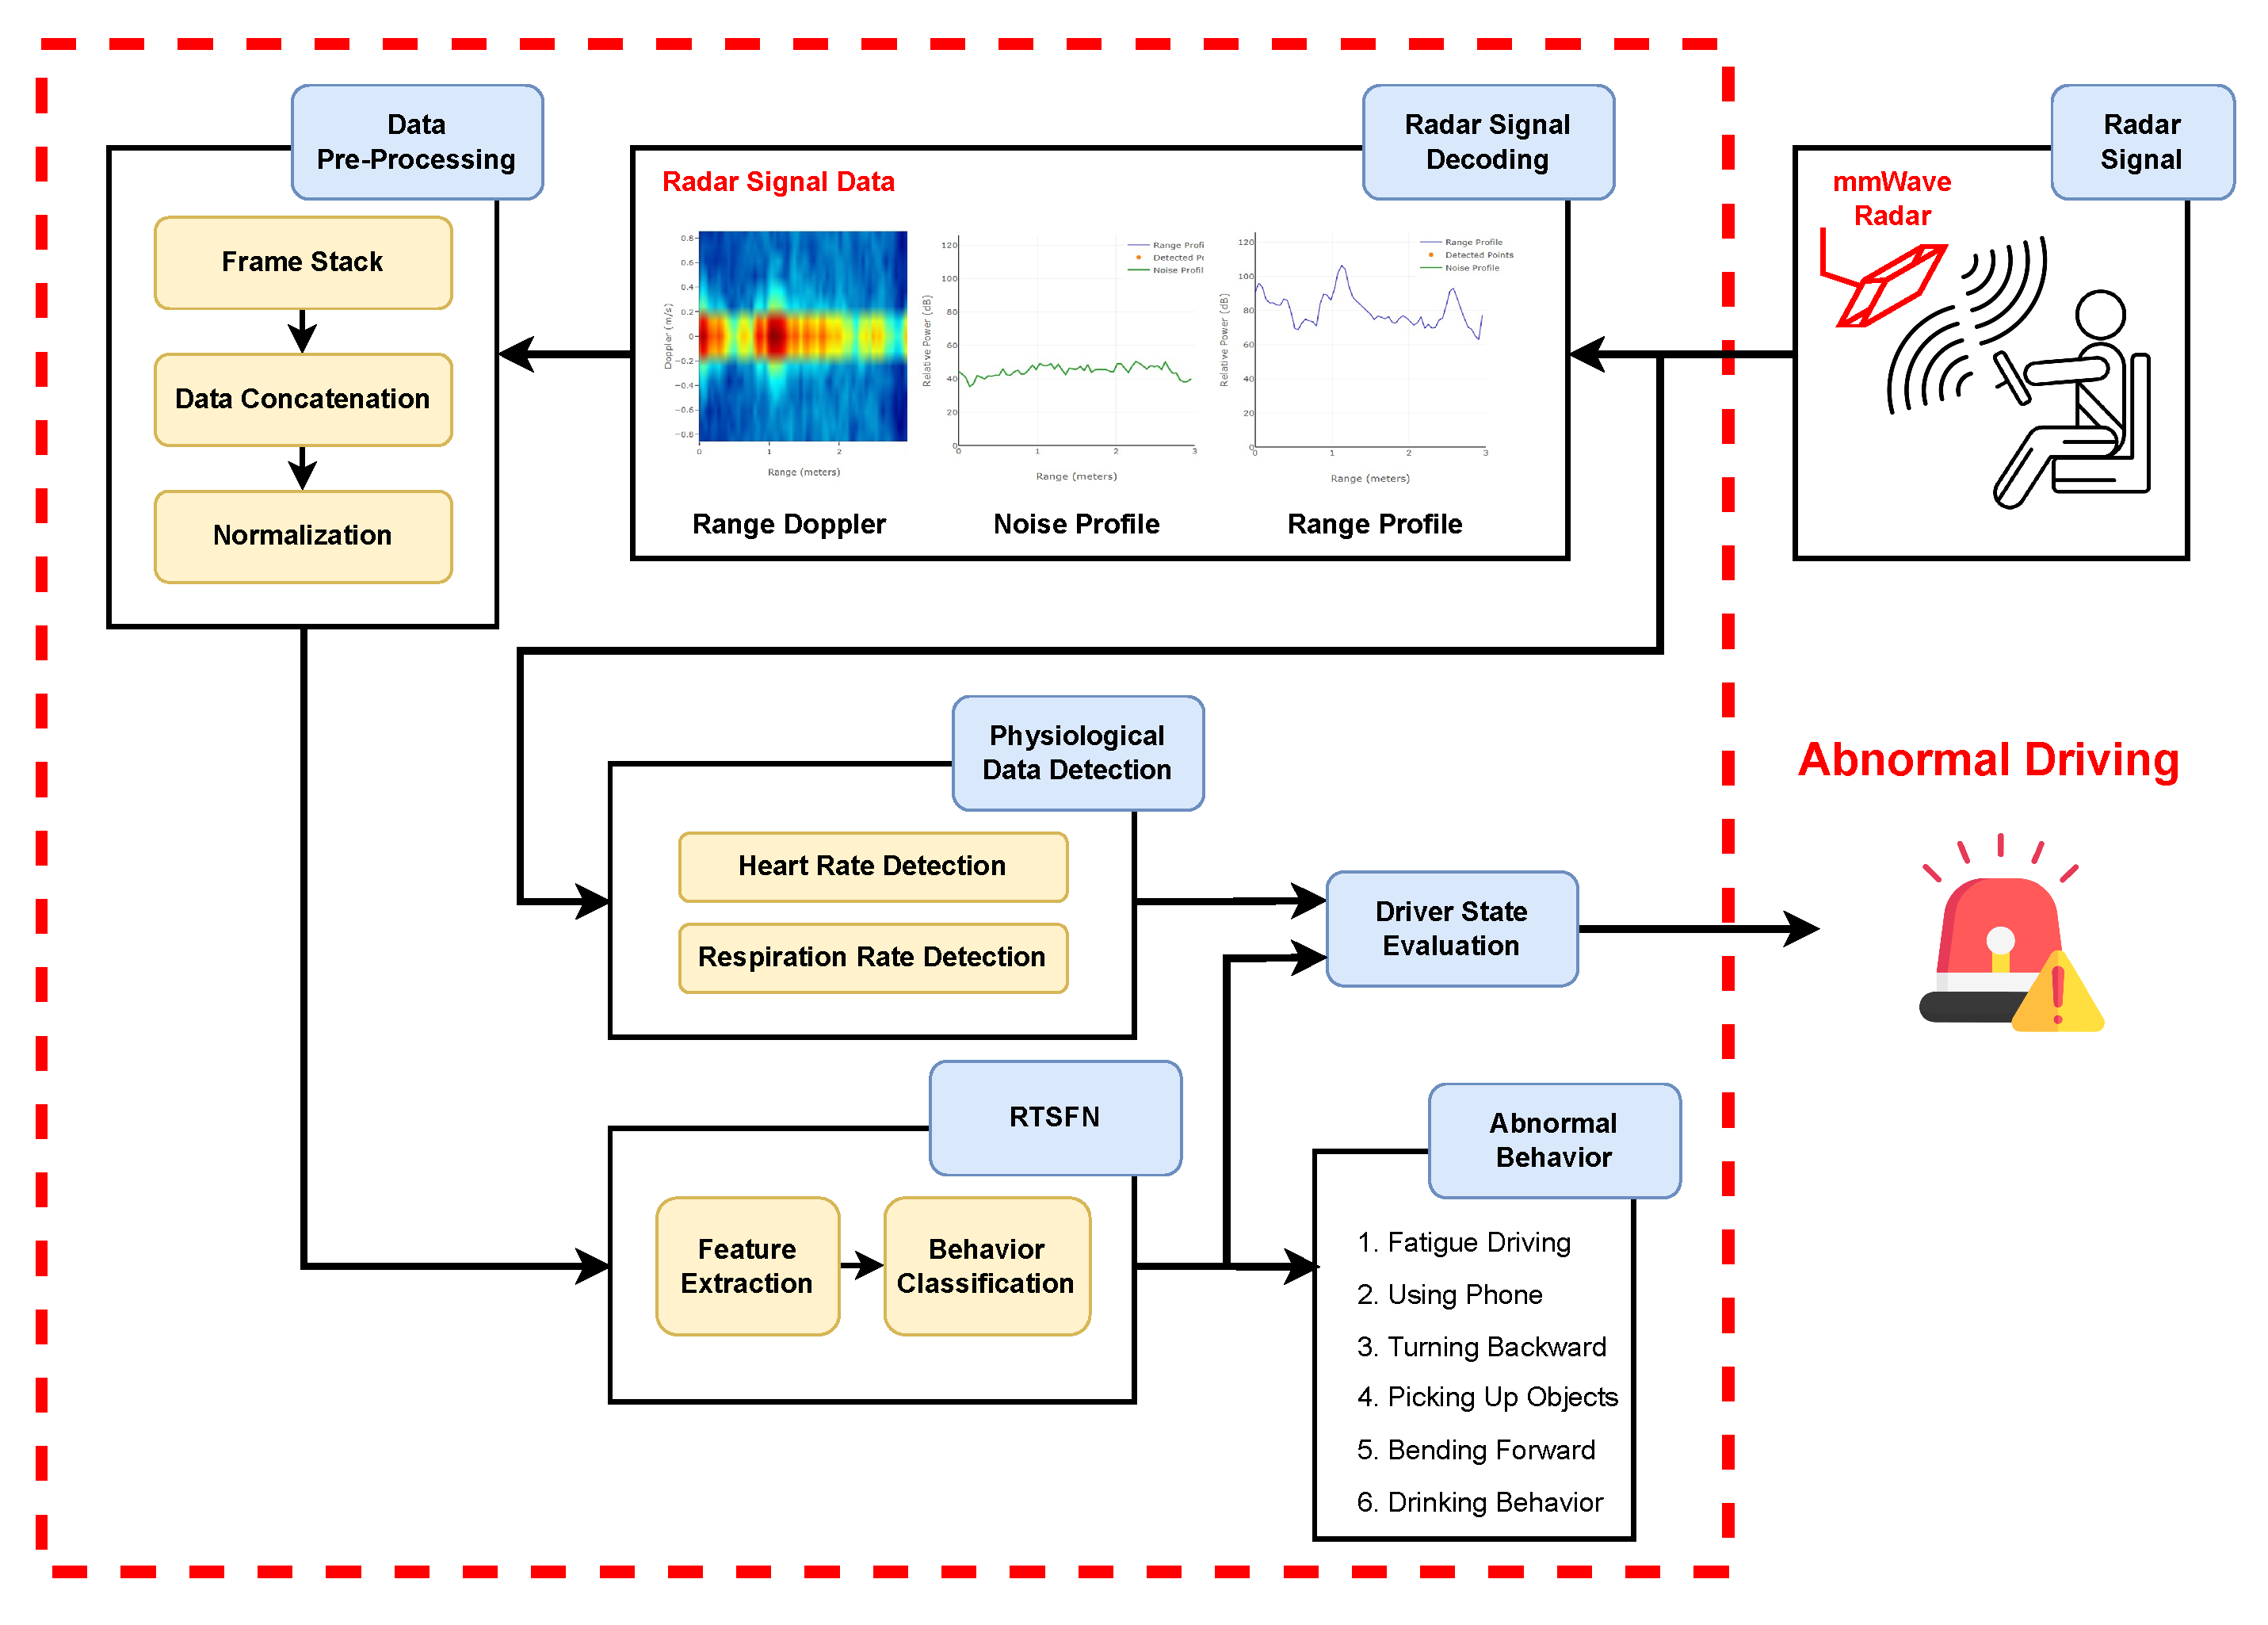
Figure 3.
Range Profile showing signal intensity across range bins. Useful for analyzing static features such as posture and seating.
Figure 3.
Range Profile showing signal intensity across range bins. Useful for analyzing static features such as posture and seating.
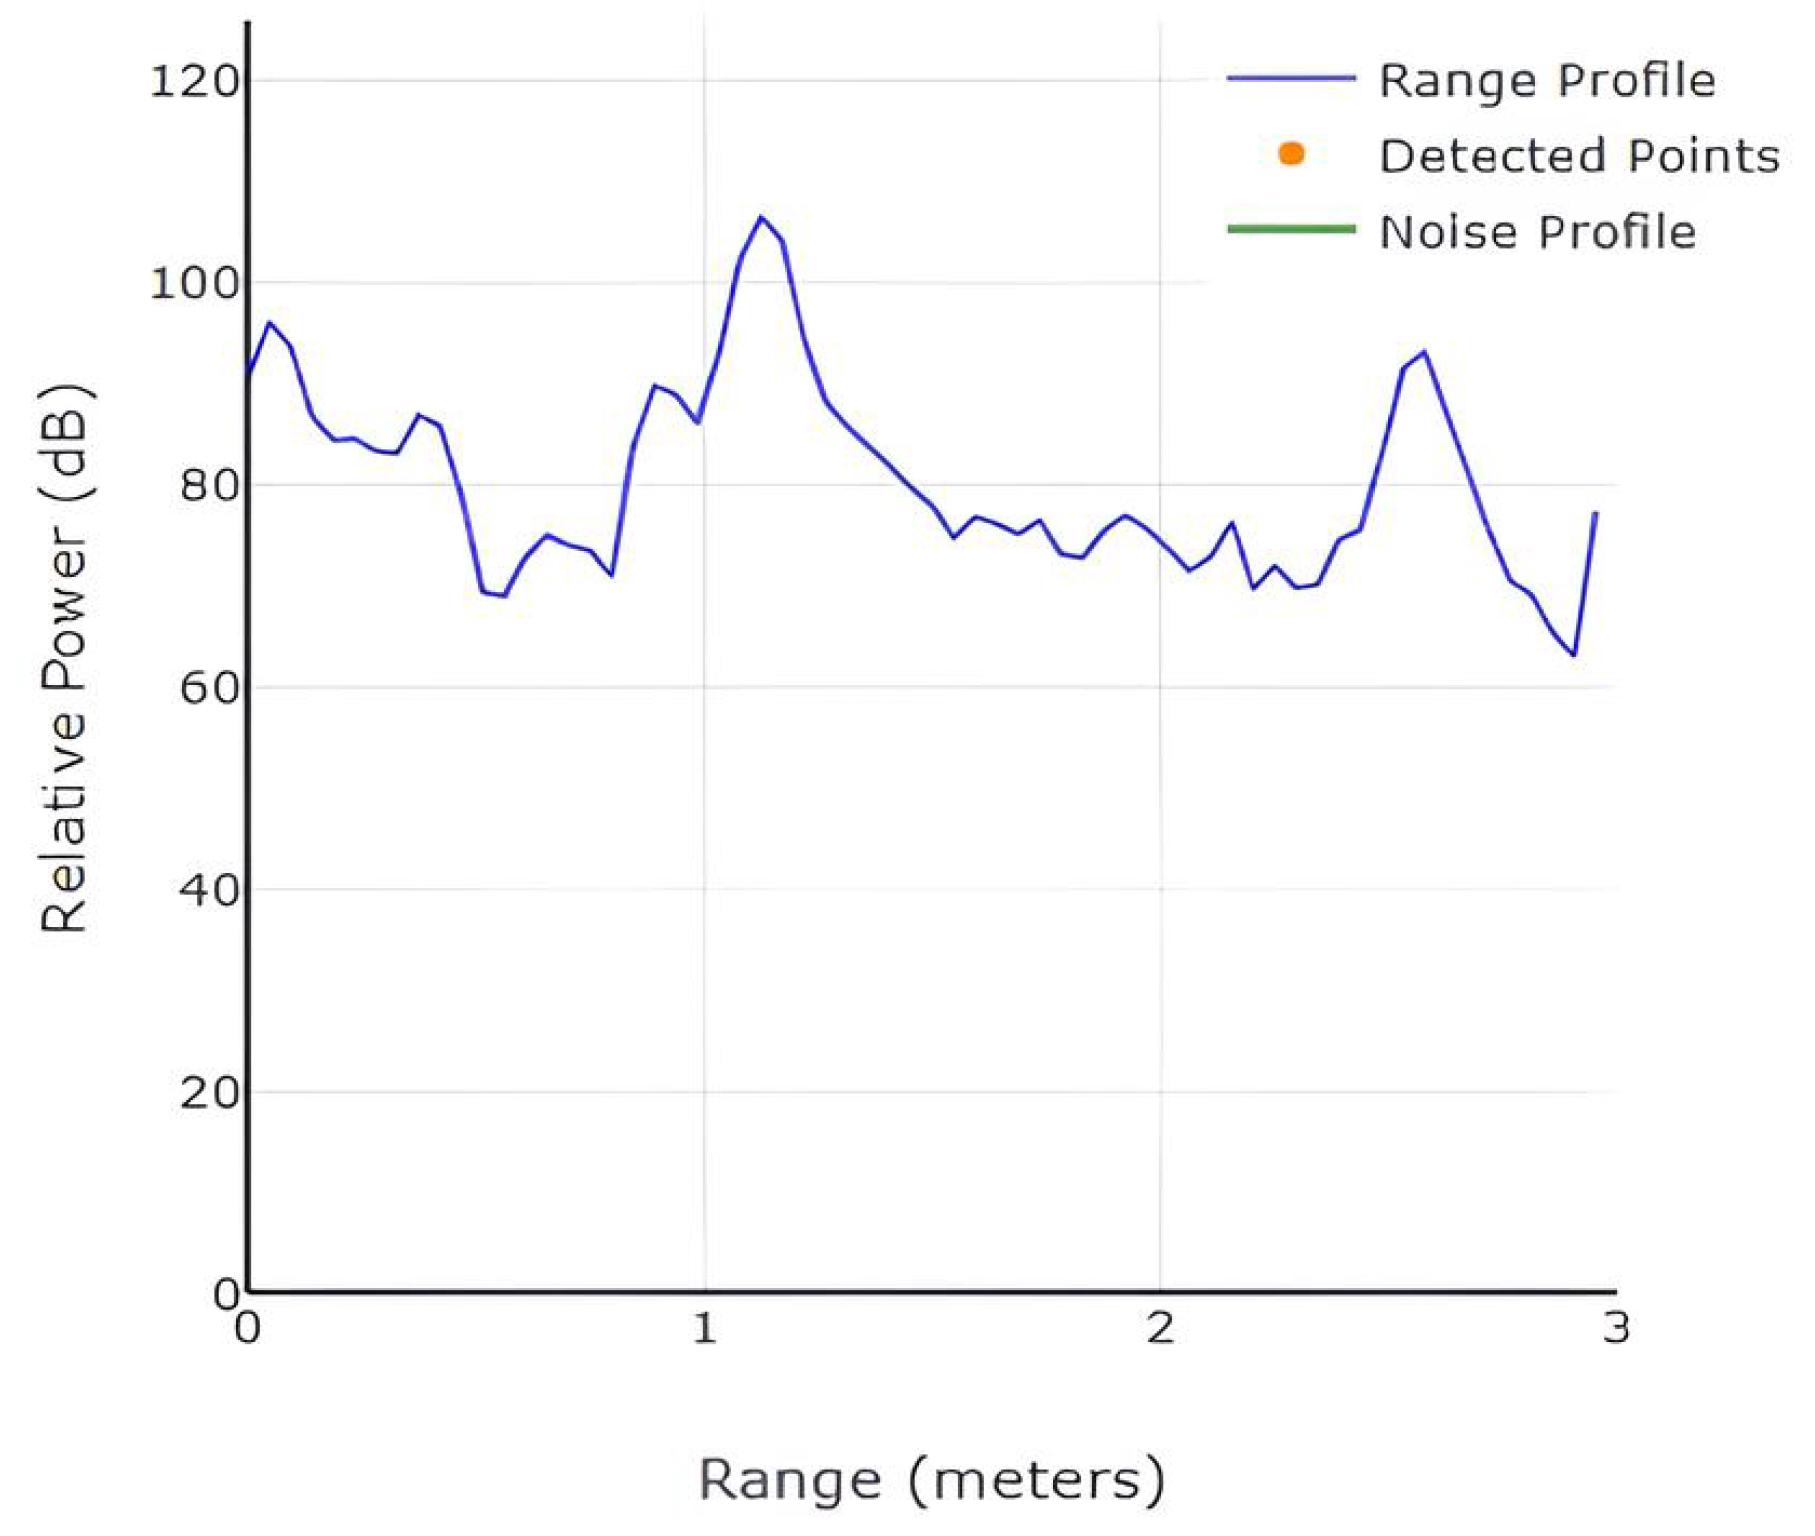
Figure 4.
Noise Profile illustrating environmental noise distribution. Motion-induced changes can reflect dynamic behaviors.
Figure 4.
Noise Profile illustrating environmental noise distribution. Motion-induced changes can reflect dynamic behaviors.
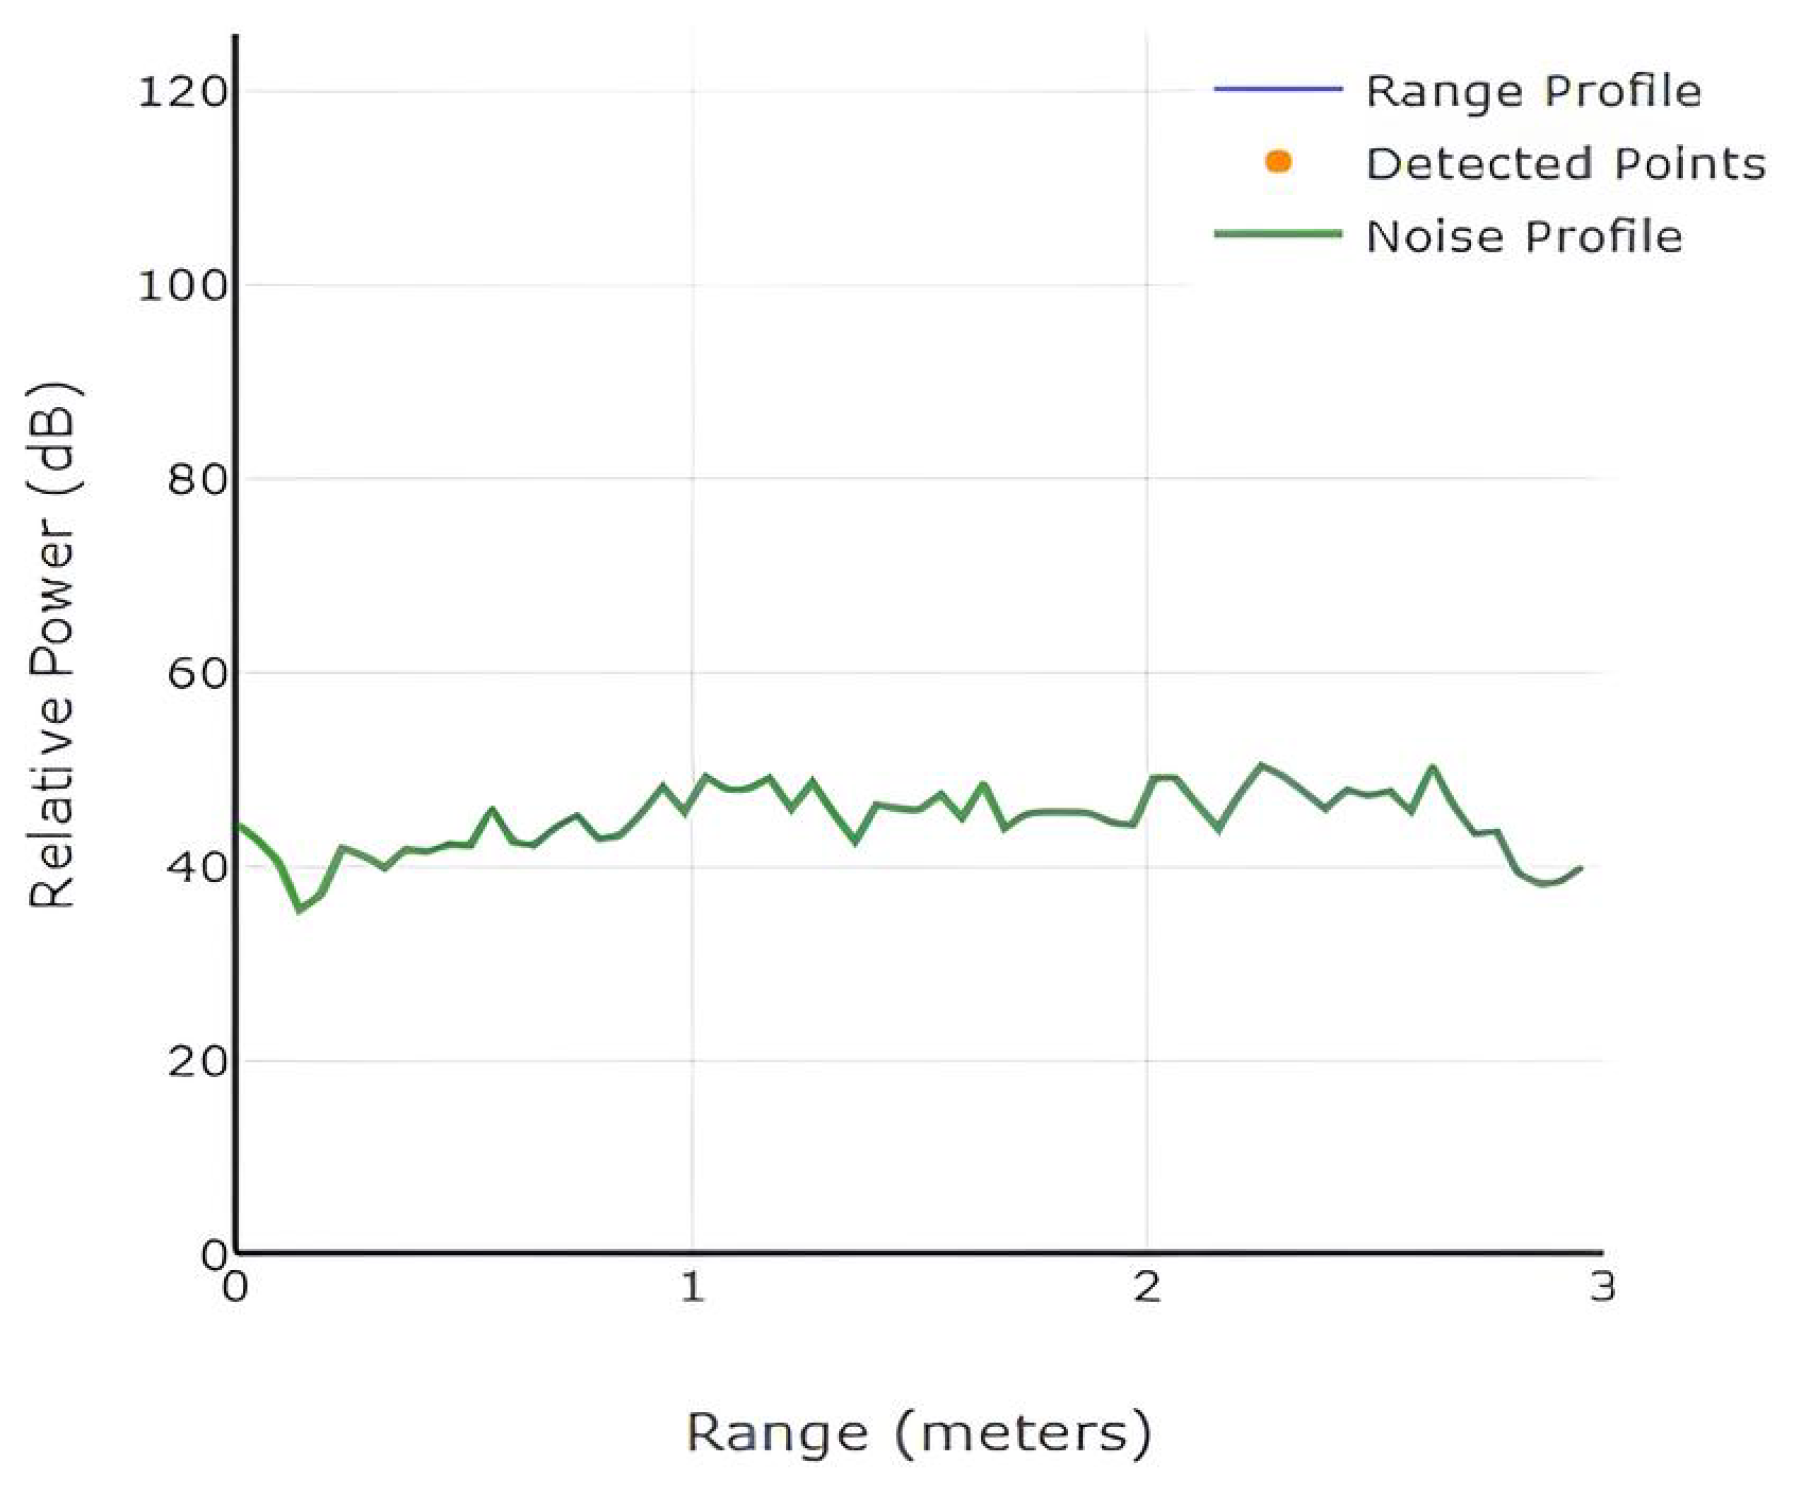
Figure 5.
Range-Doppler Map displaying distance and velocity components. Color encodes signal strength, enabling dynamic motion analysis.
Figure 5.
Range-Doppler Map displaying distance and velocity components. Color encodes signal strength, enabling dynamic motion analysis.
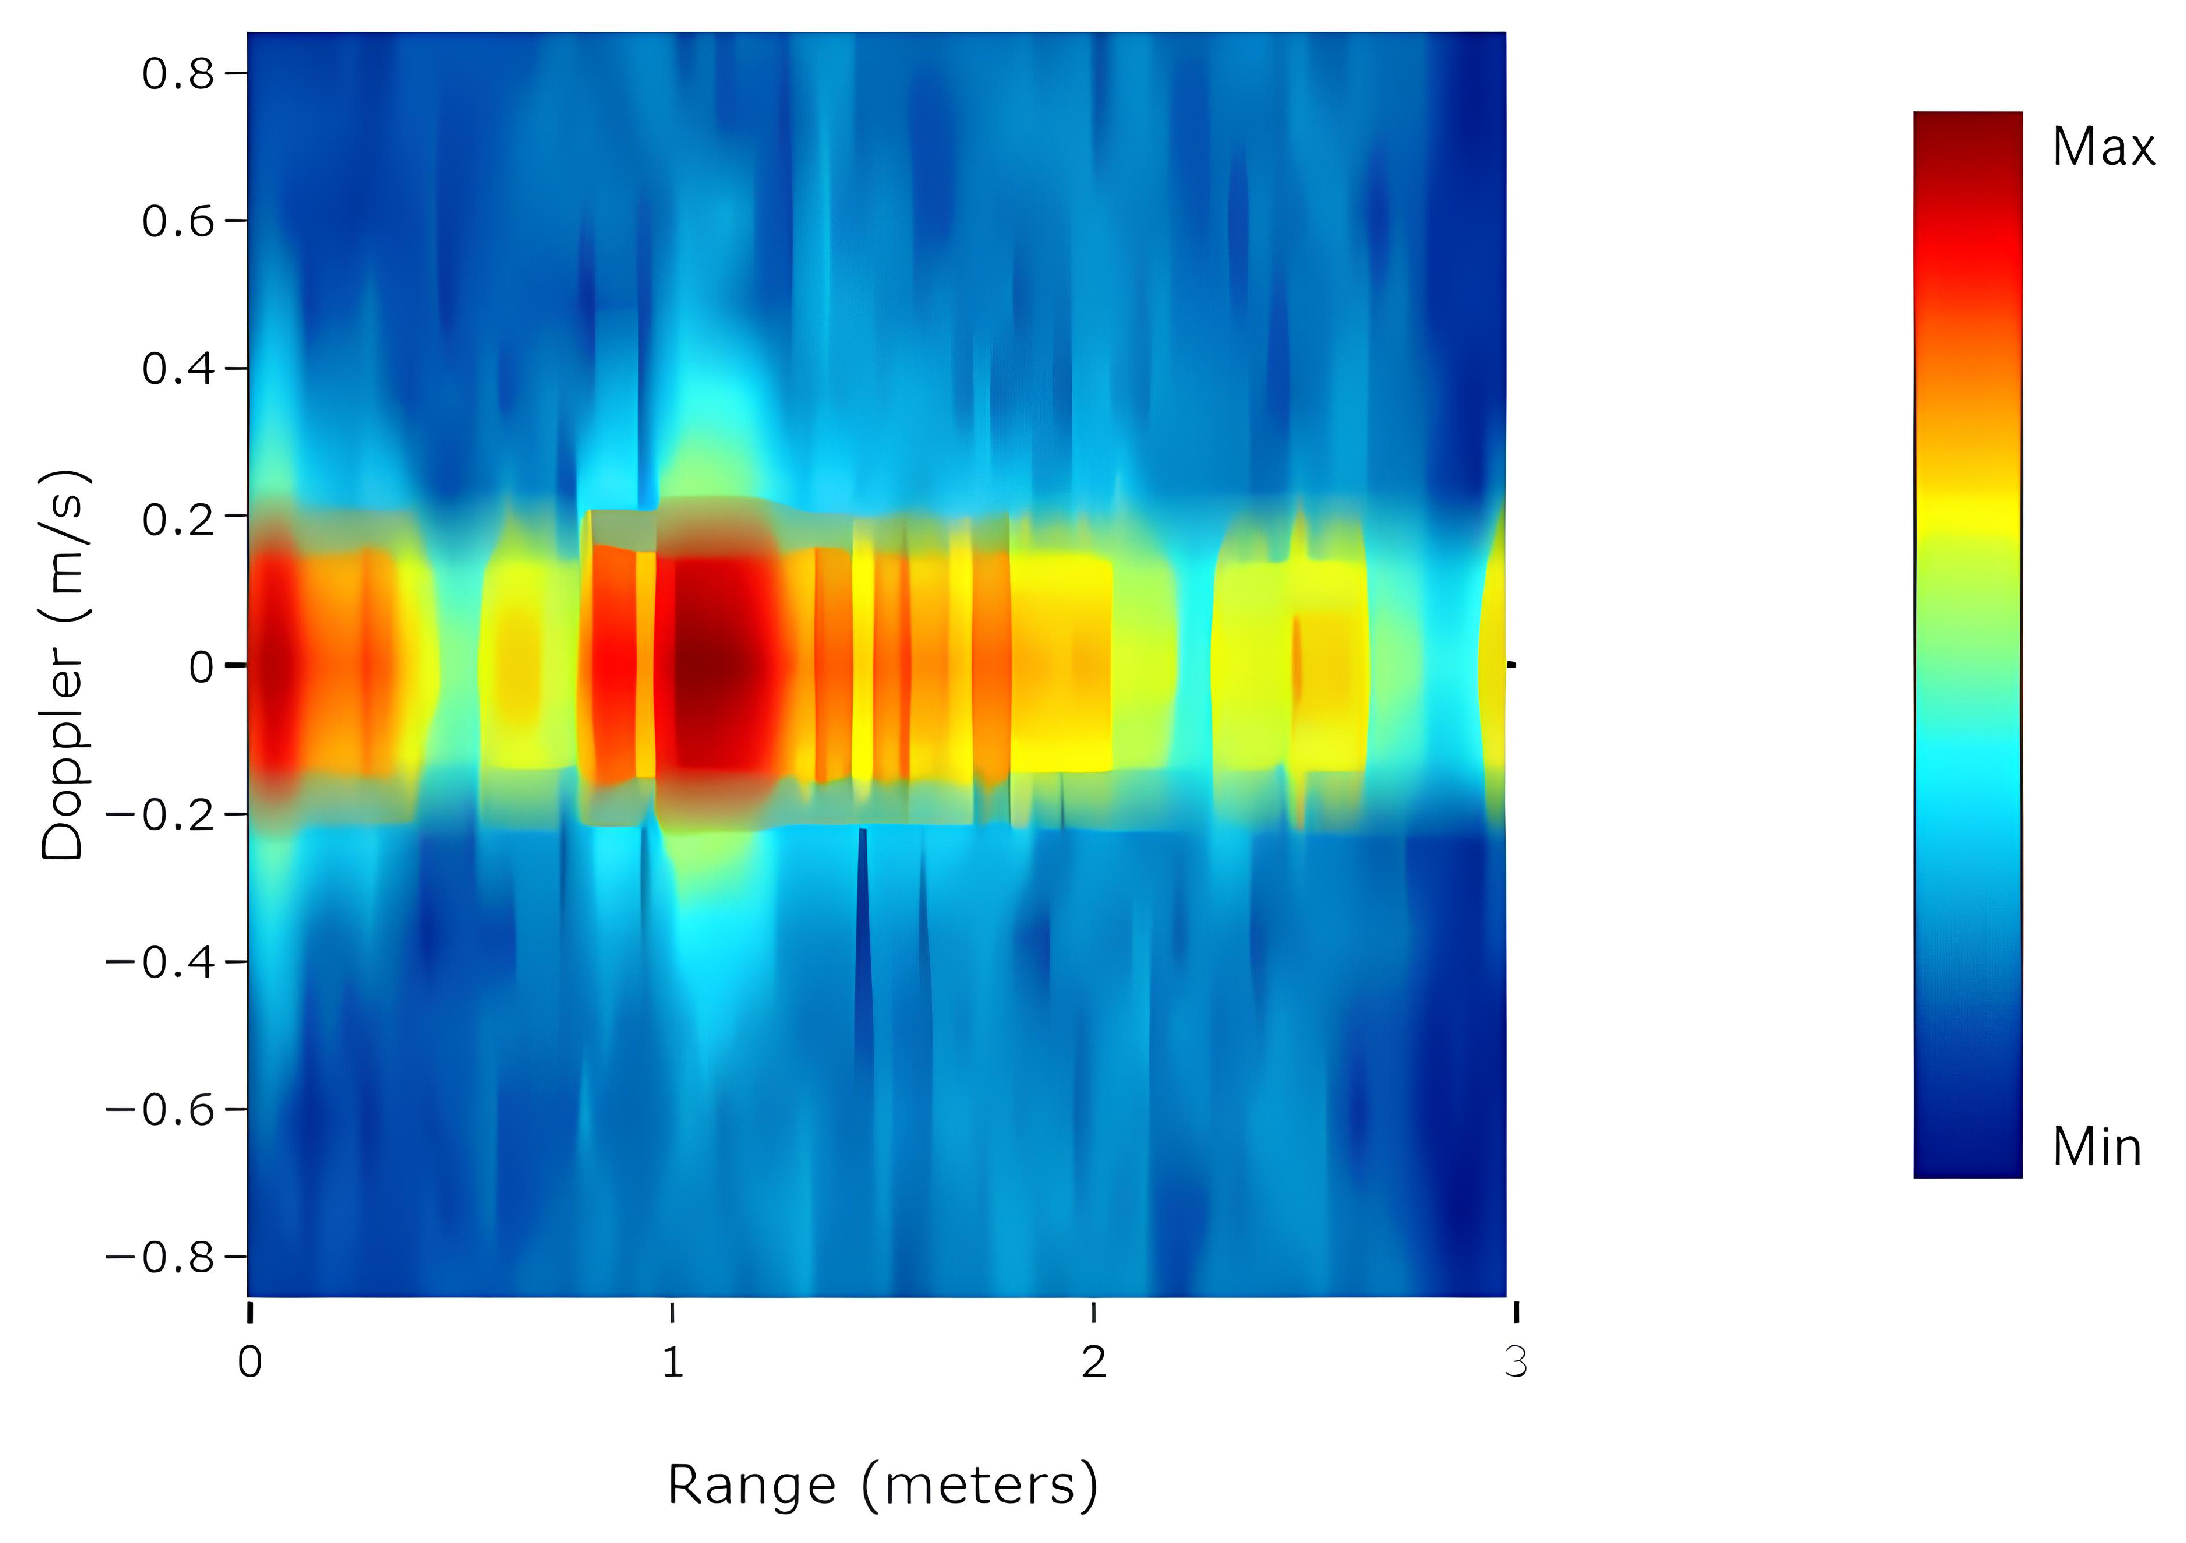
Figure 6.
Illustration of the sliding window mechanism during inference when when and .
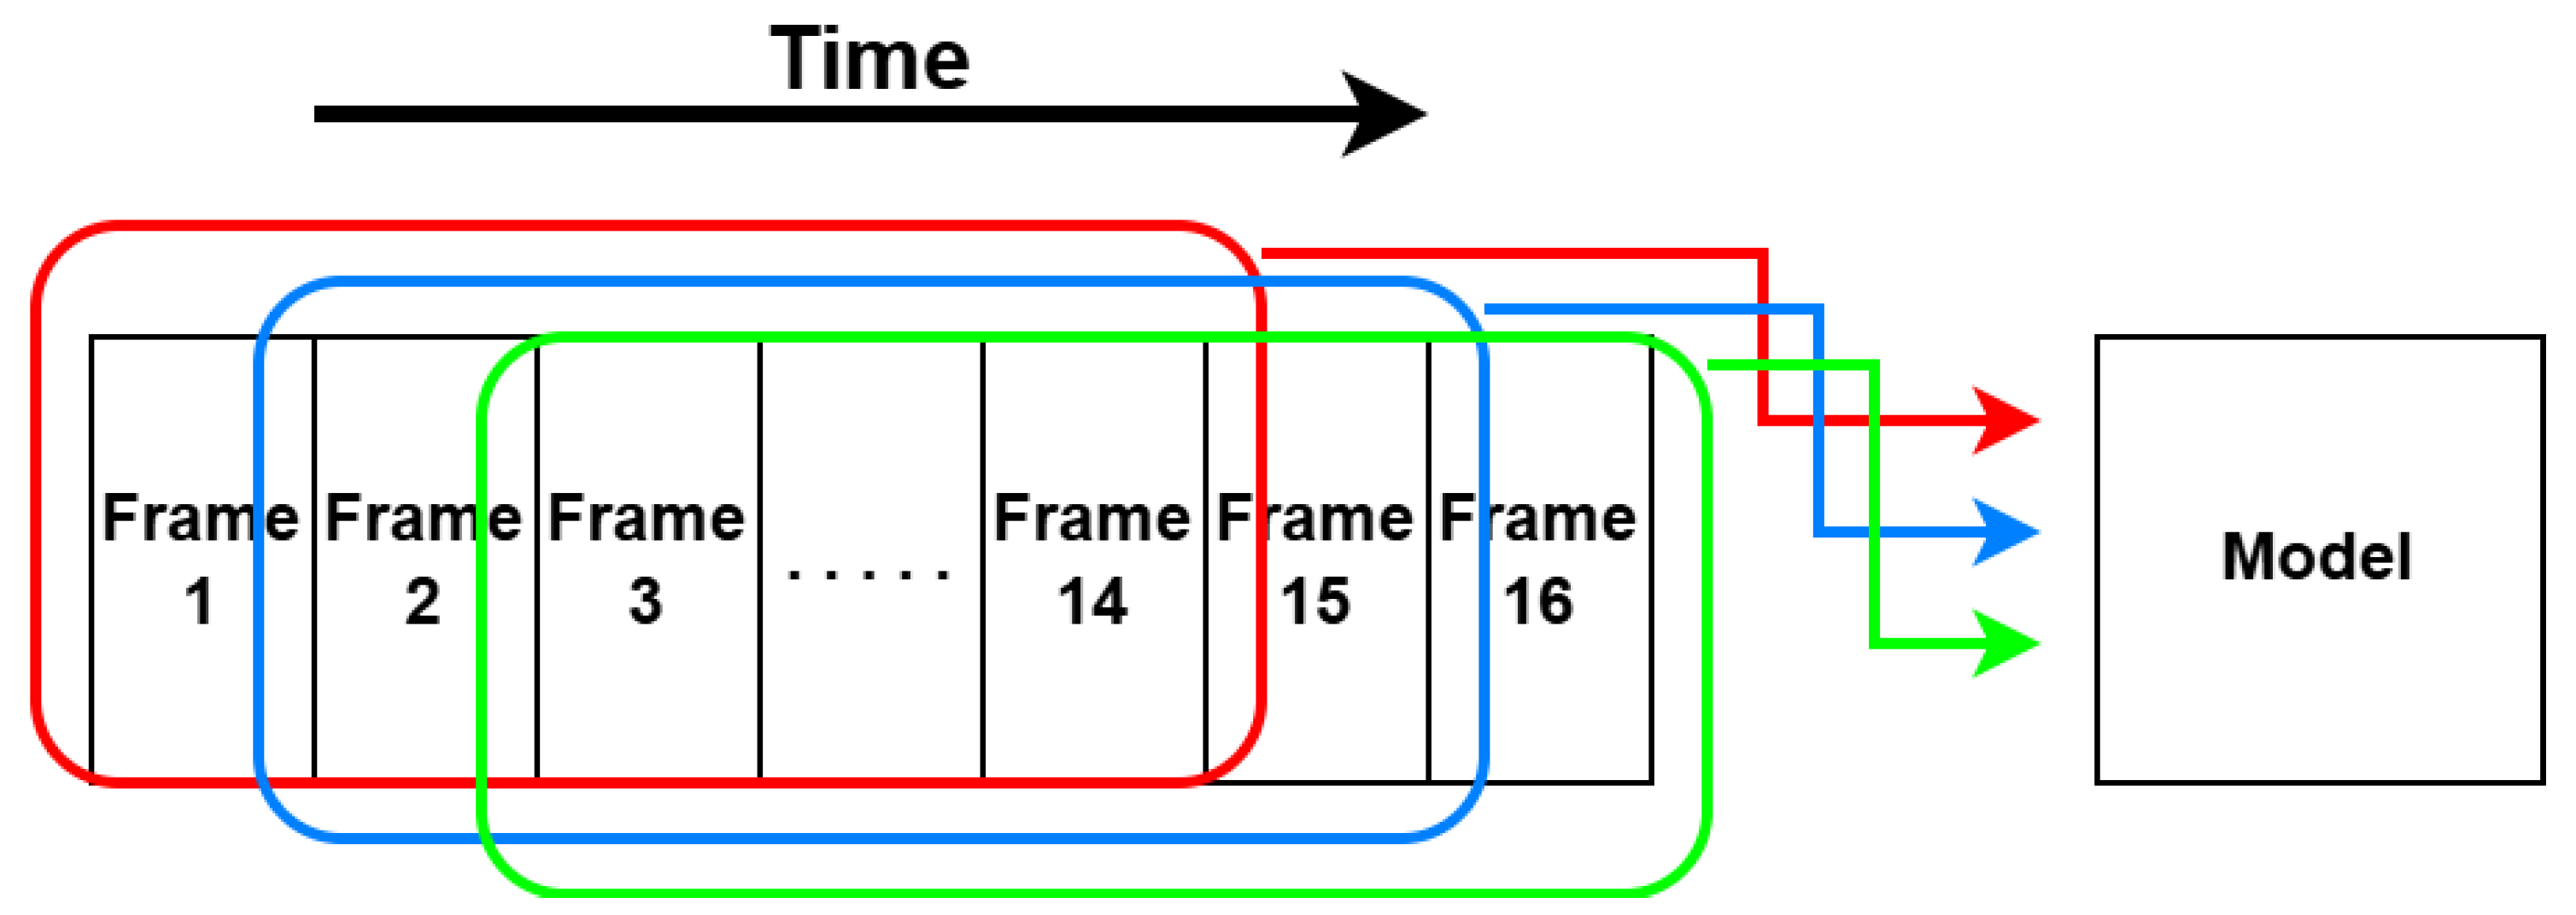
Figure 7.
Radar-based Temporal-Spatio Fusion Network.
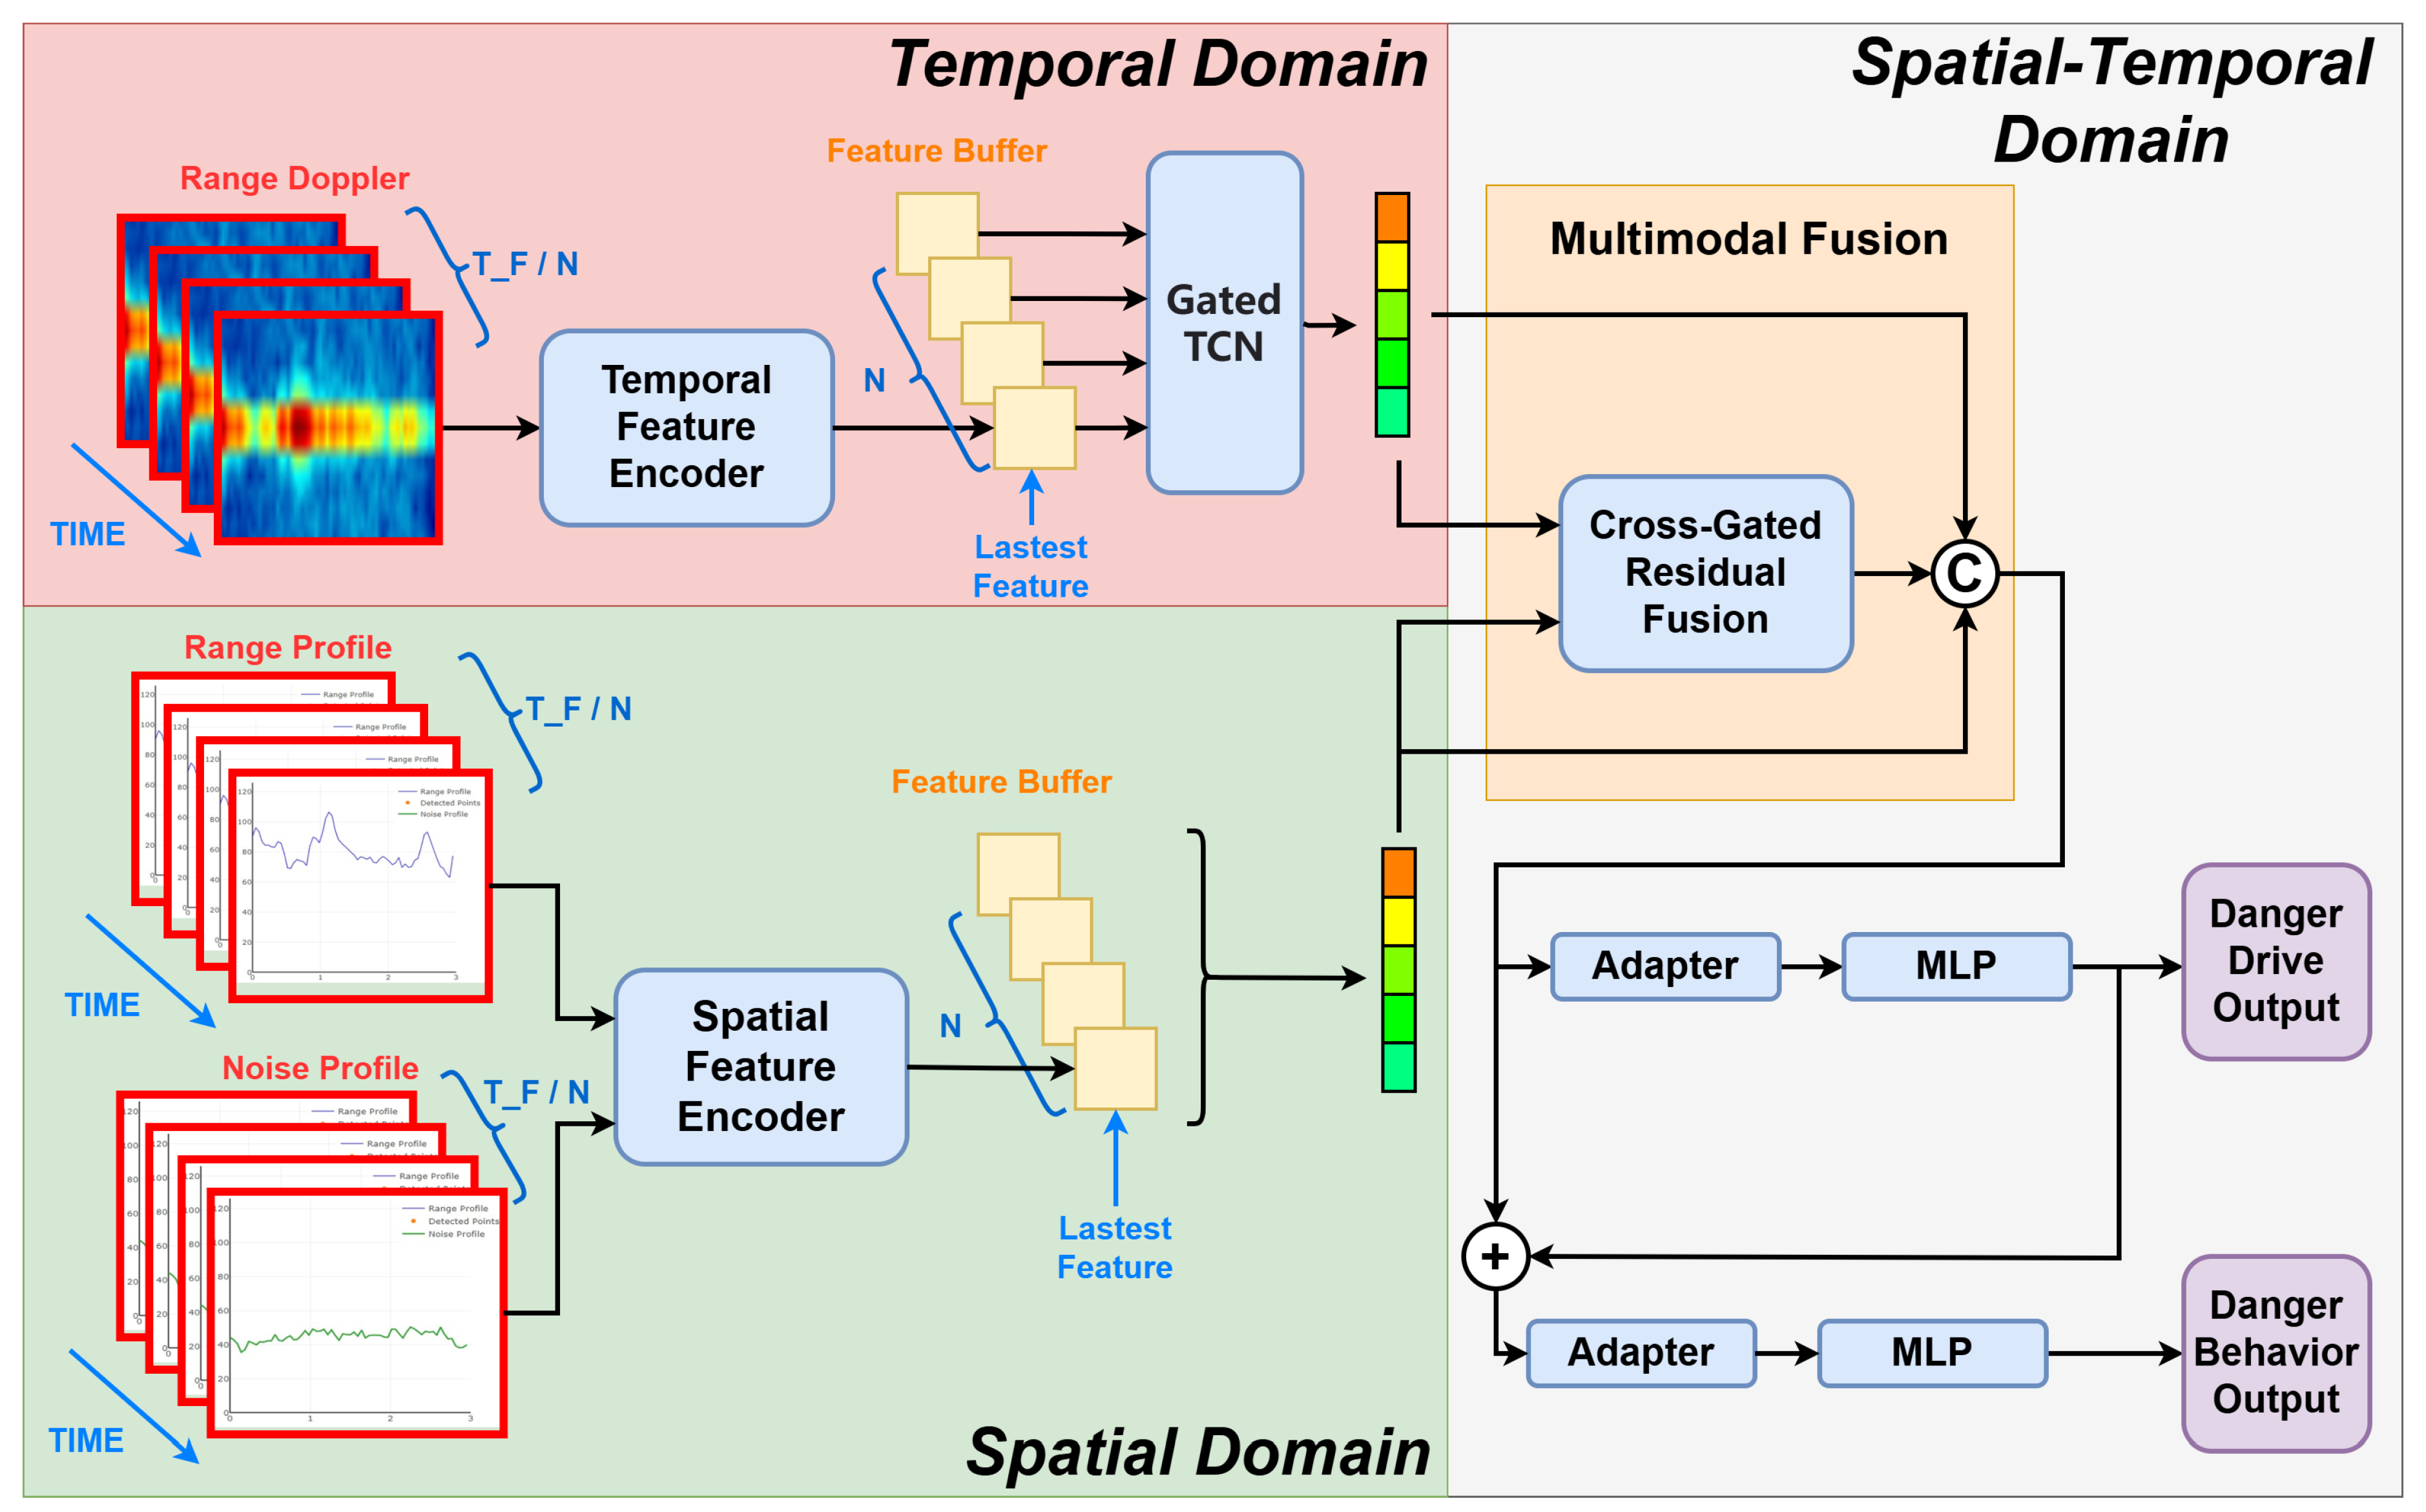
Figure 8.
Gated TCN.
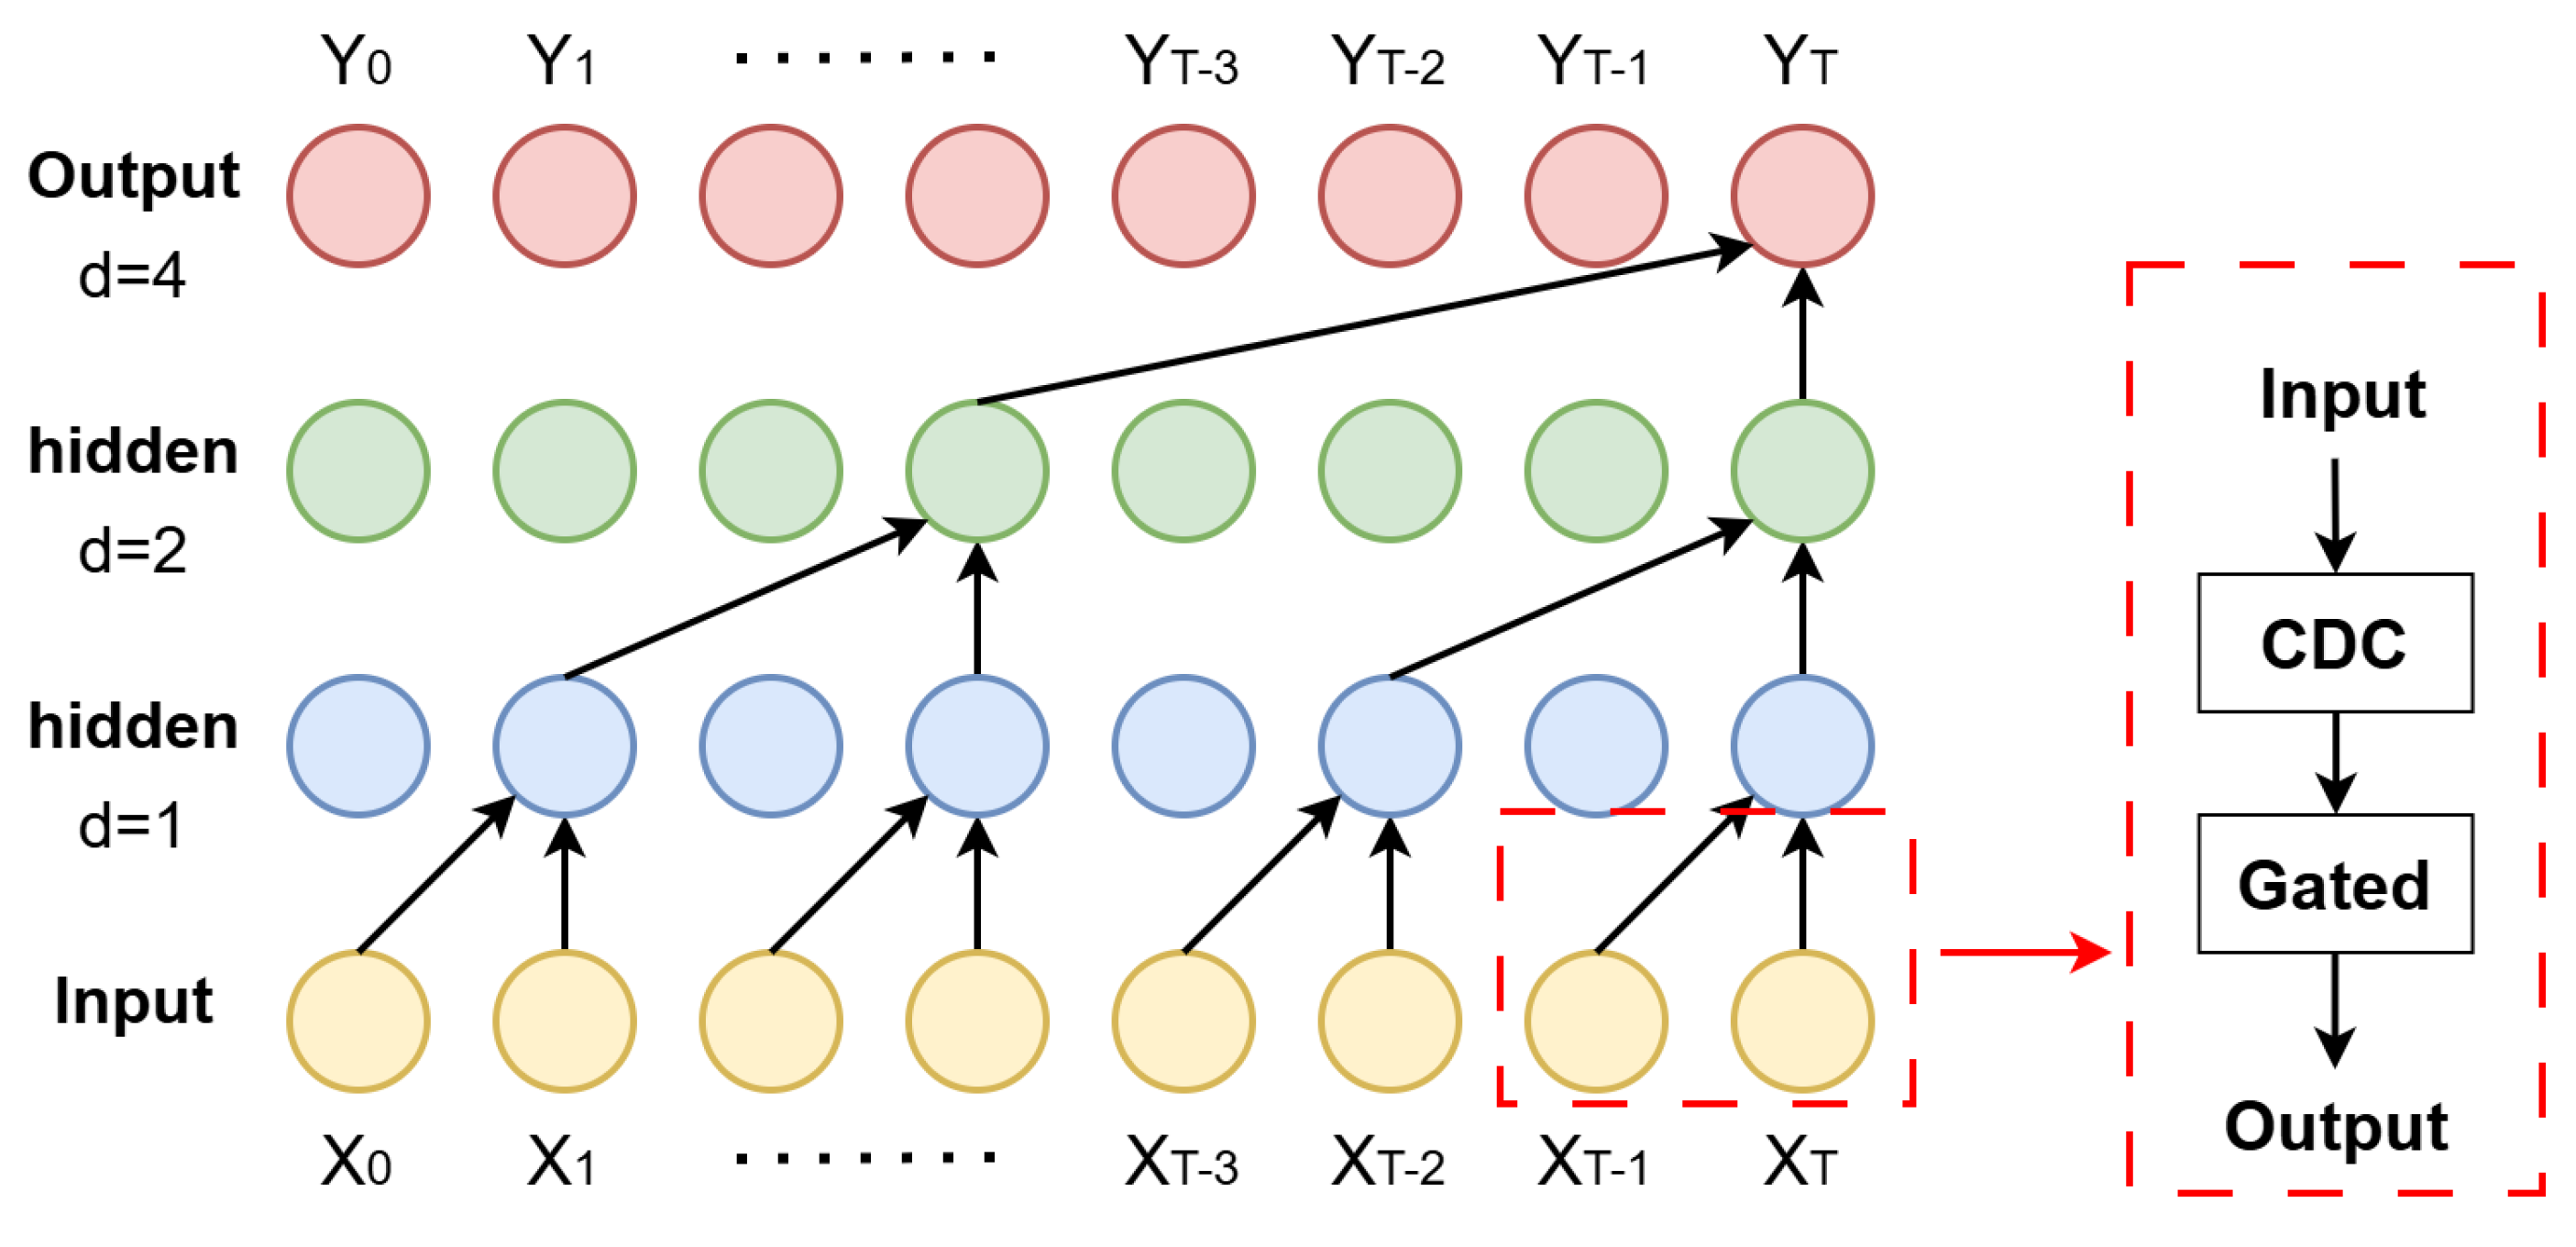
Figure 9.
Deployment of the radar devices within the vehicle.
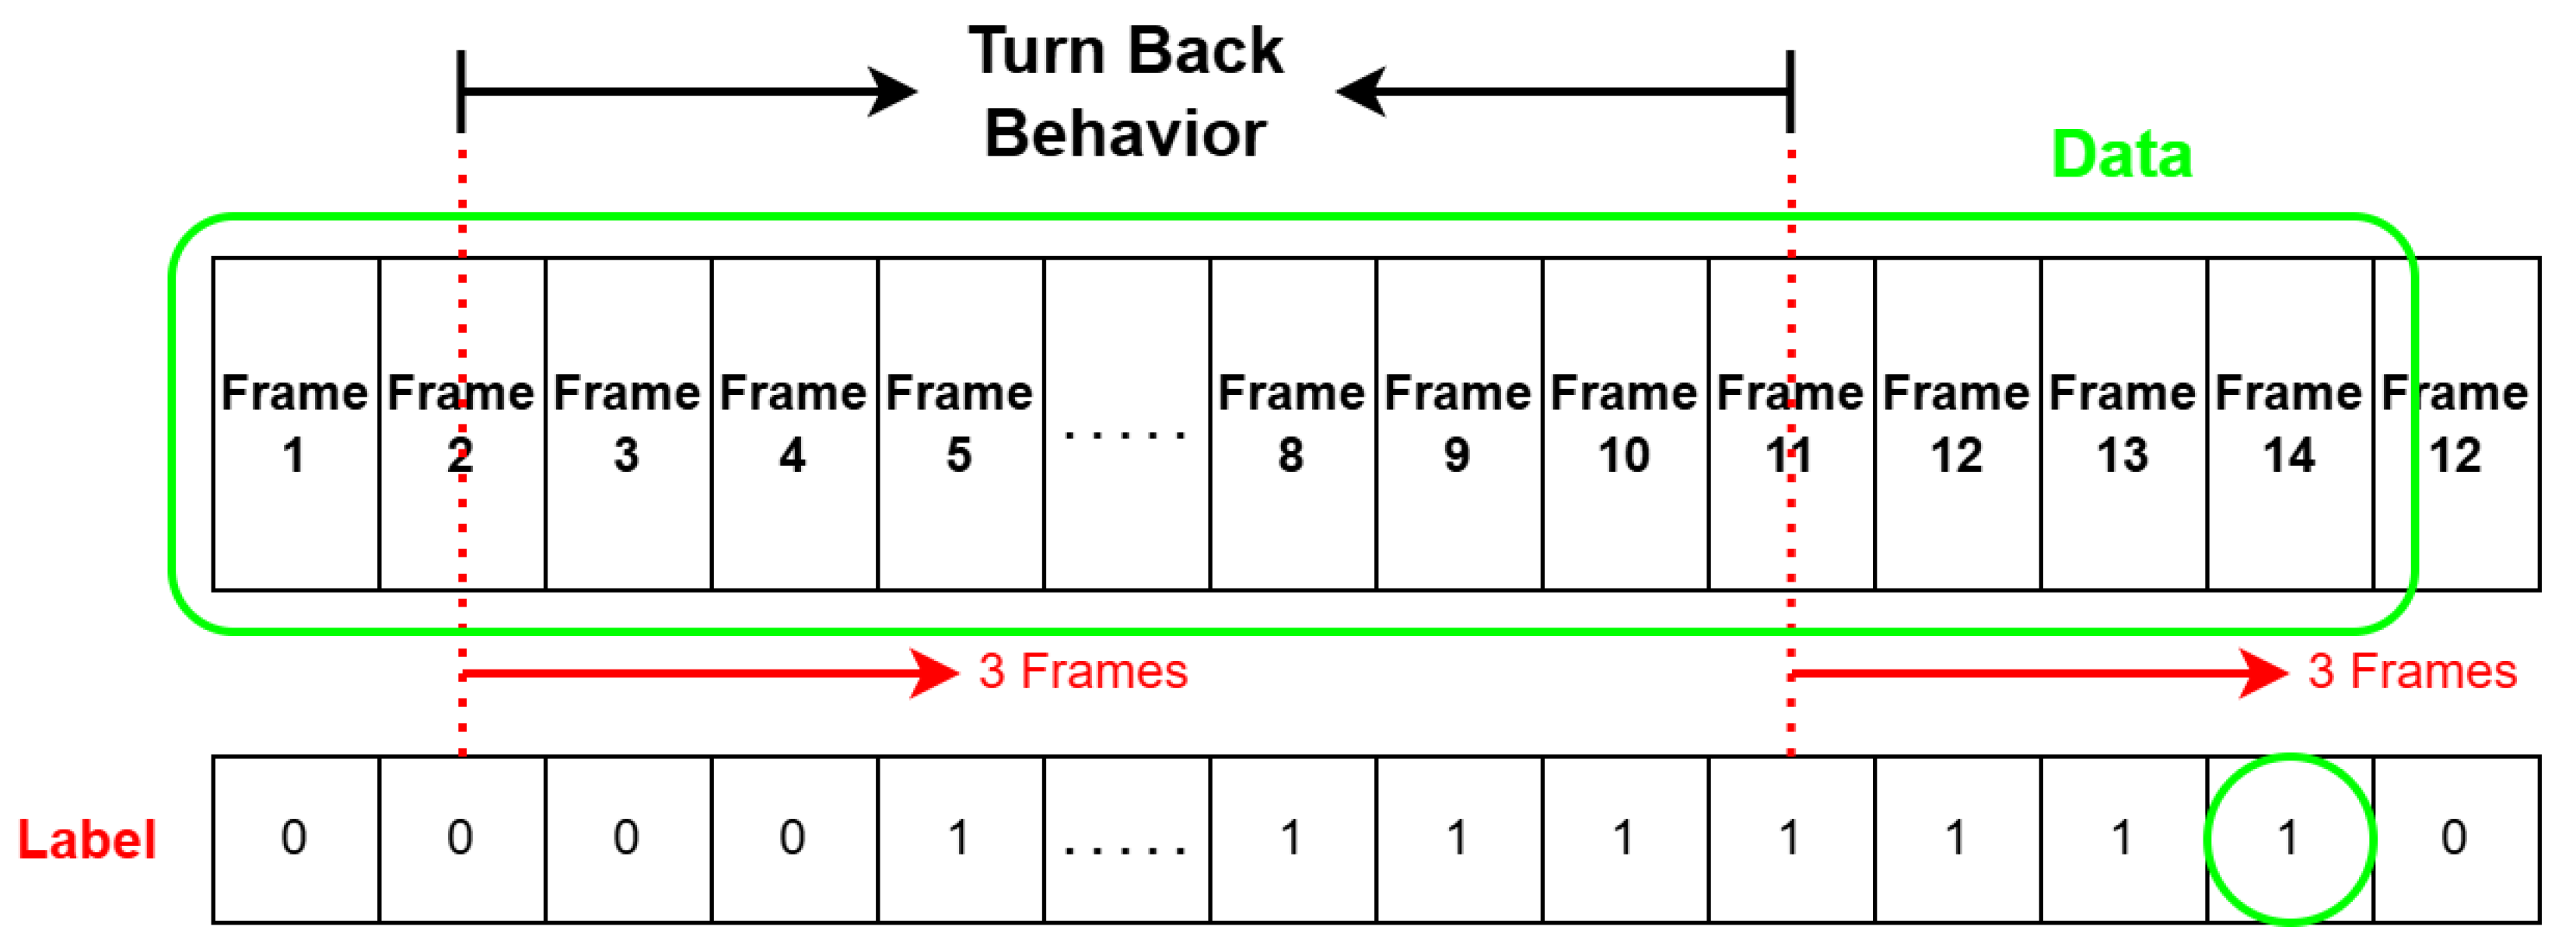
Figure 10.
Heartbeat Signal Processing Pipeline.
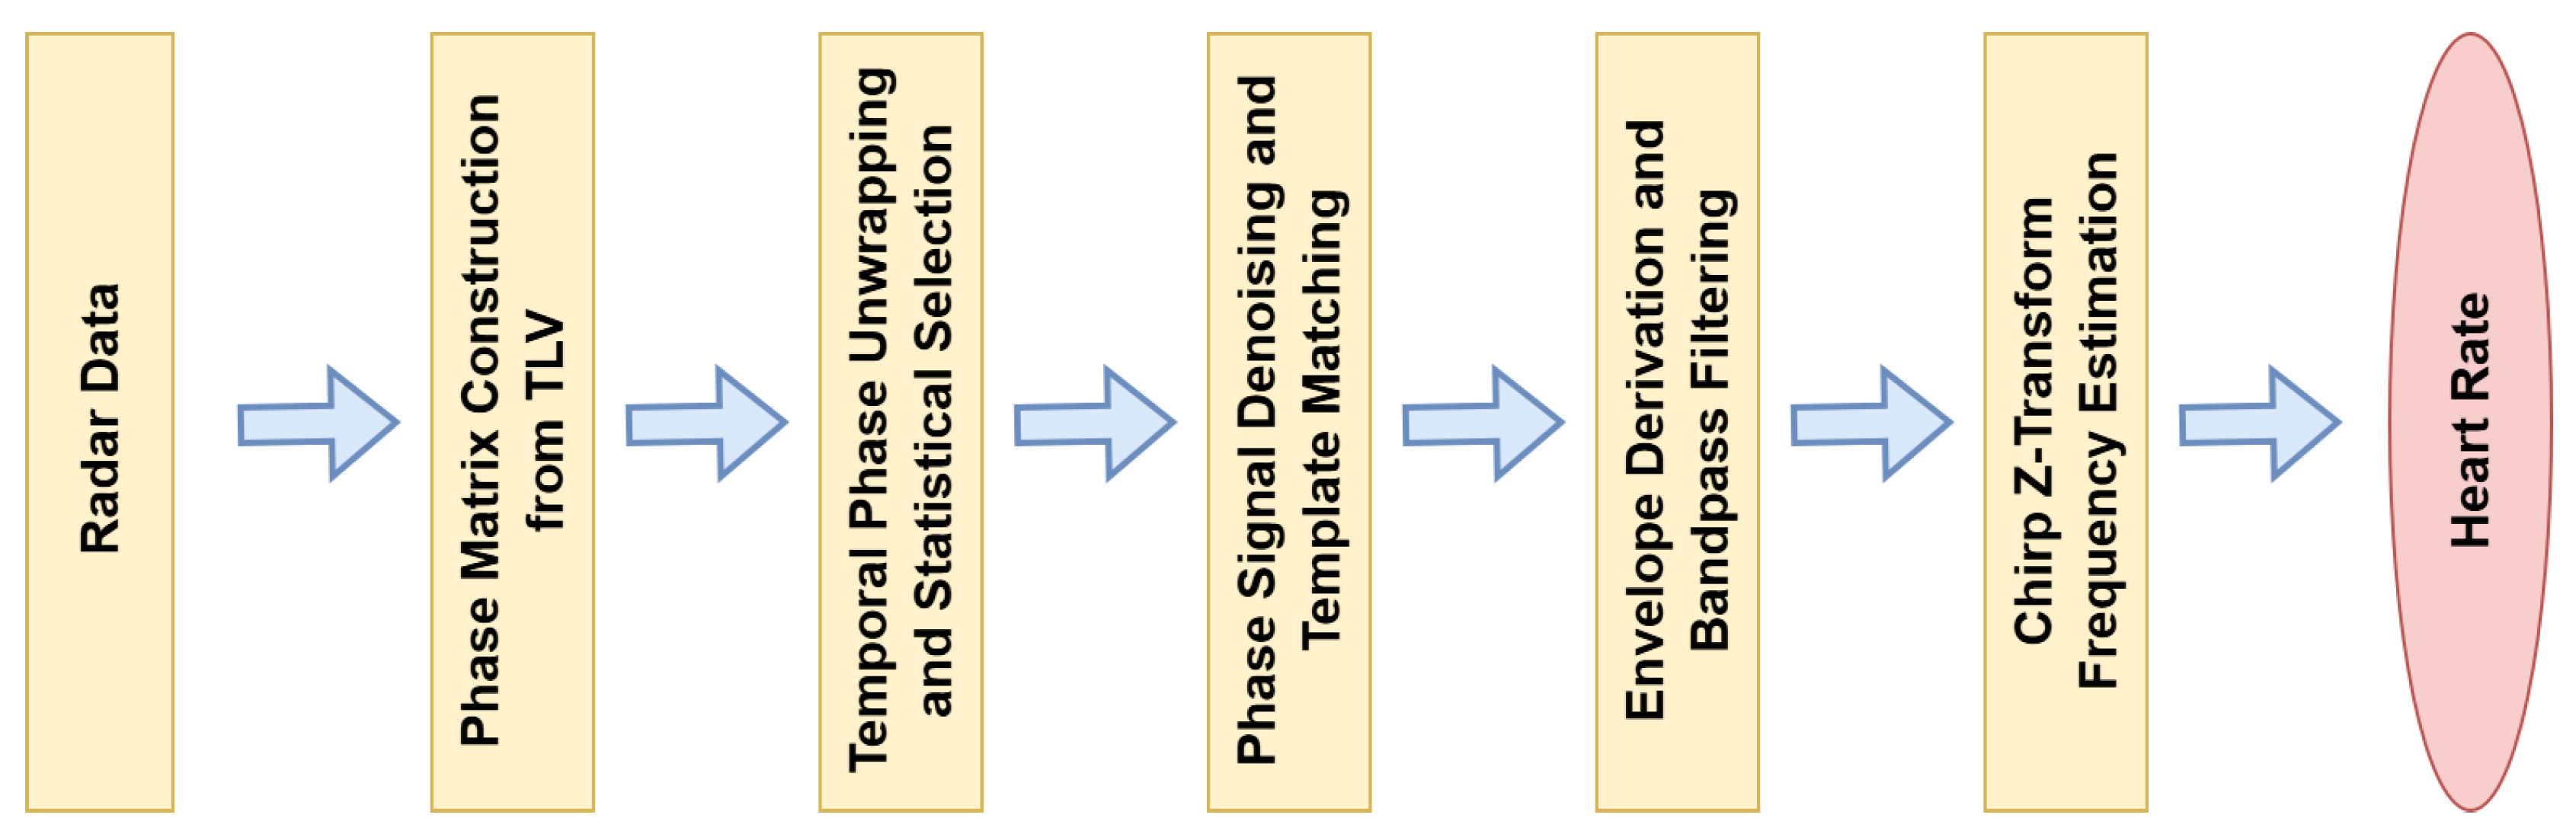
Figure 11.
Respiration Signal Processing Pipeline.
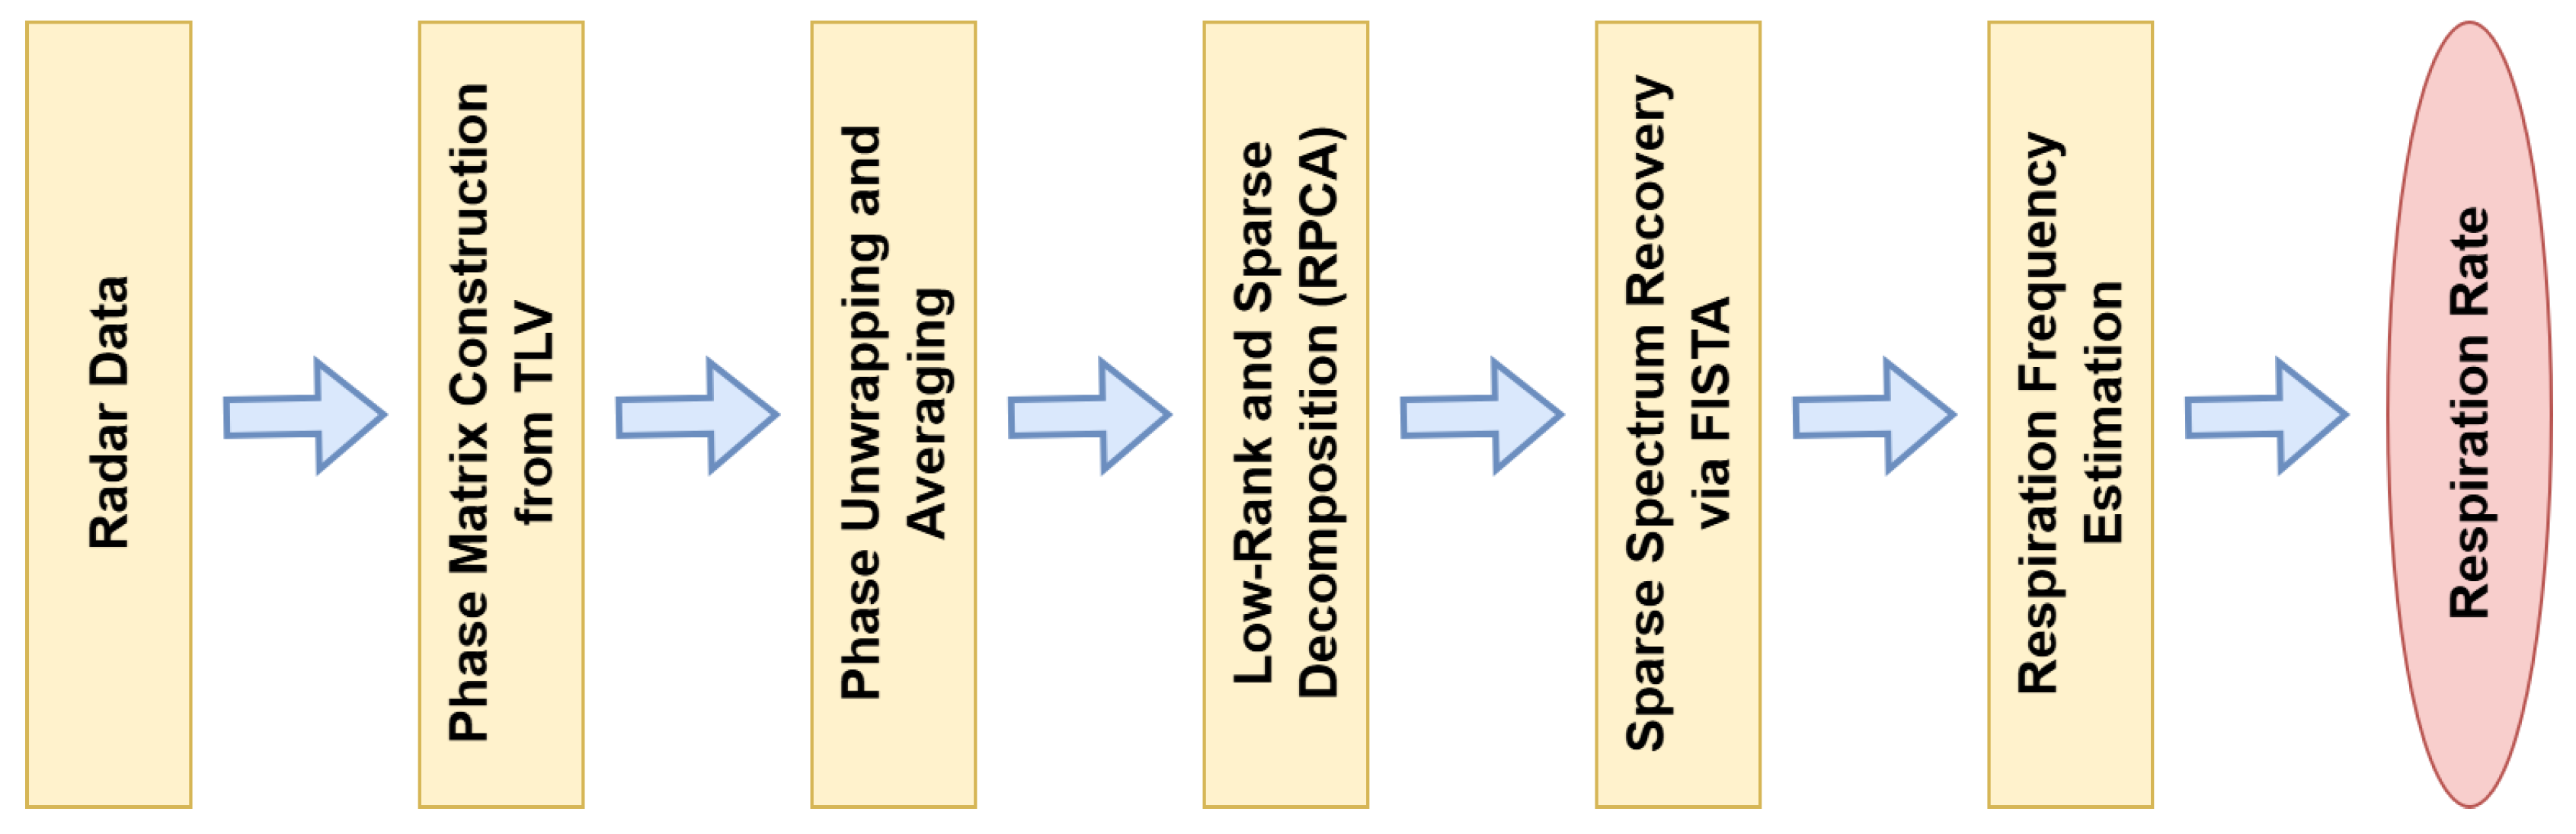
Figure 12.
Deployment of the radar devices within the vehicle.
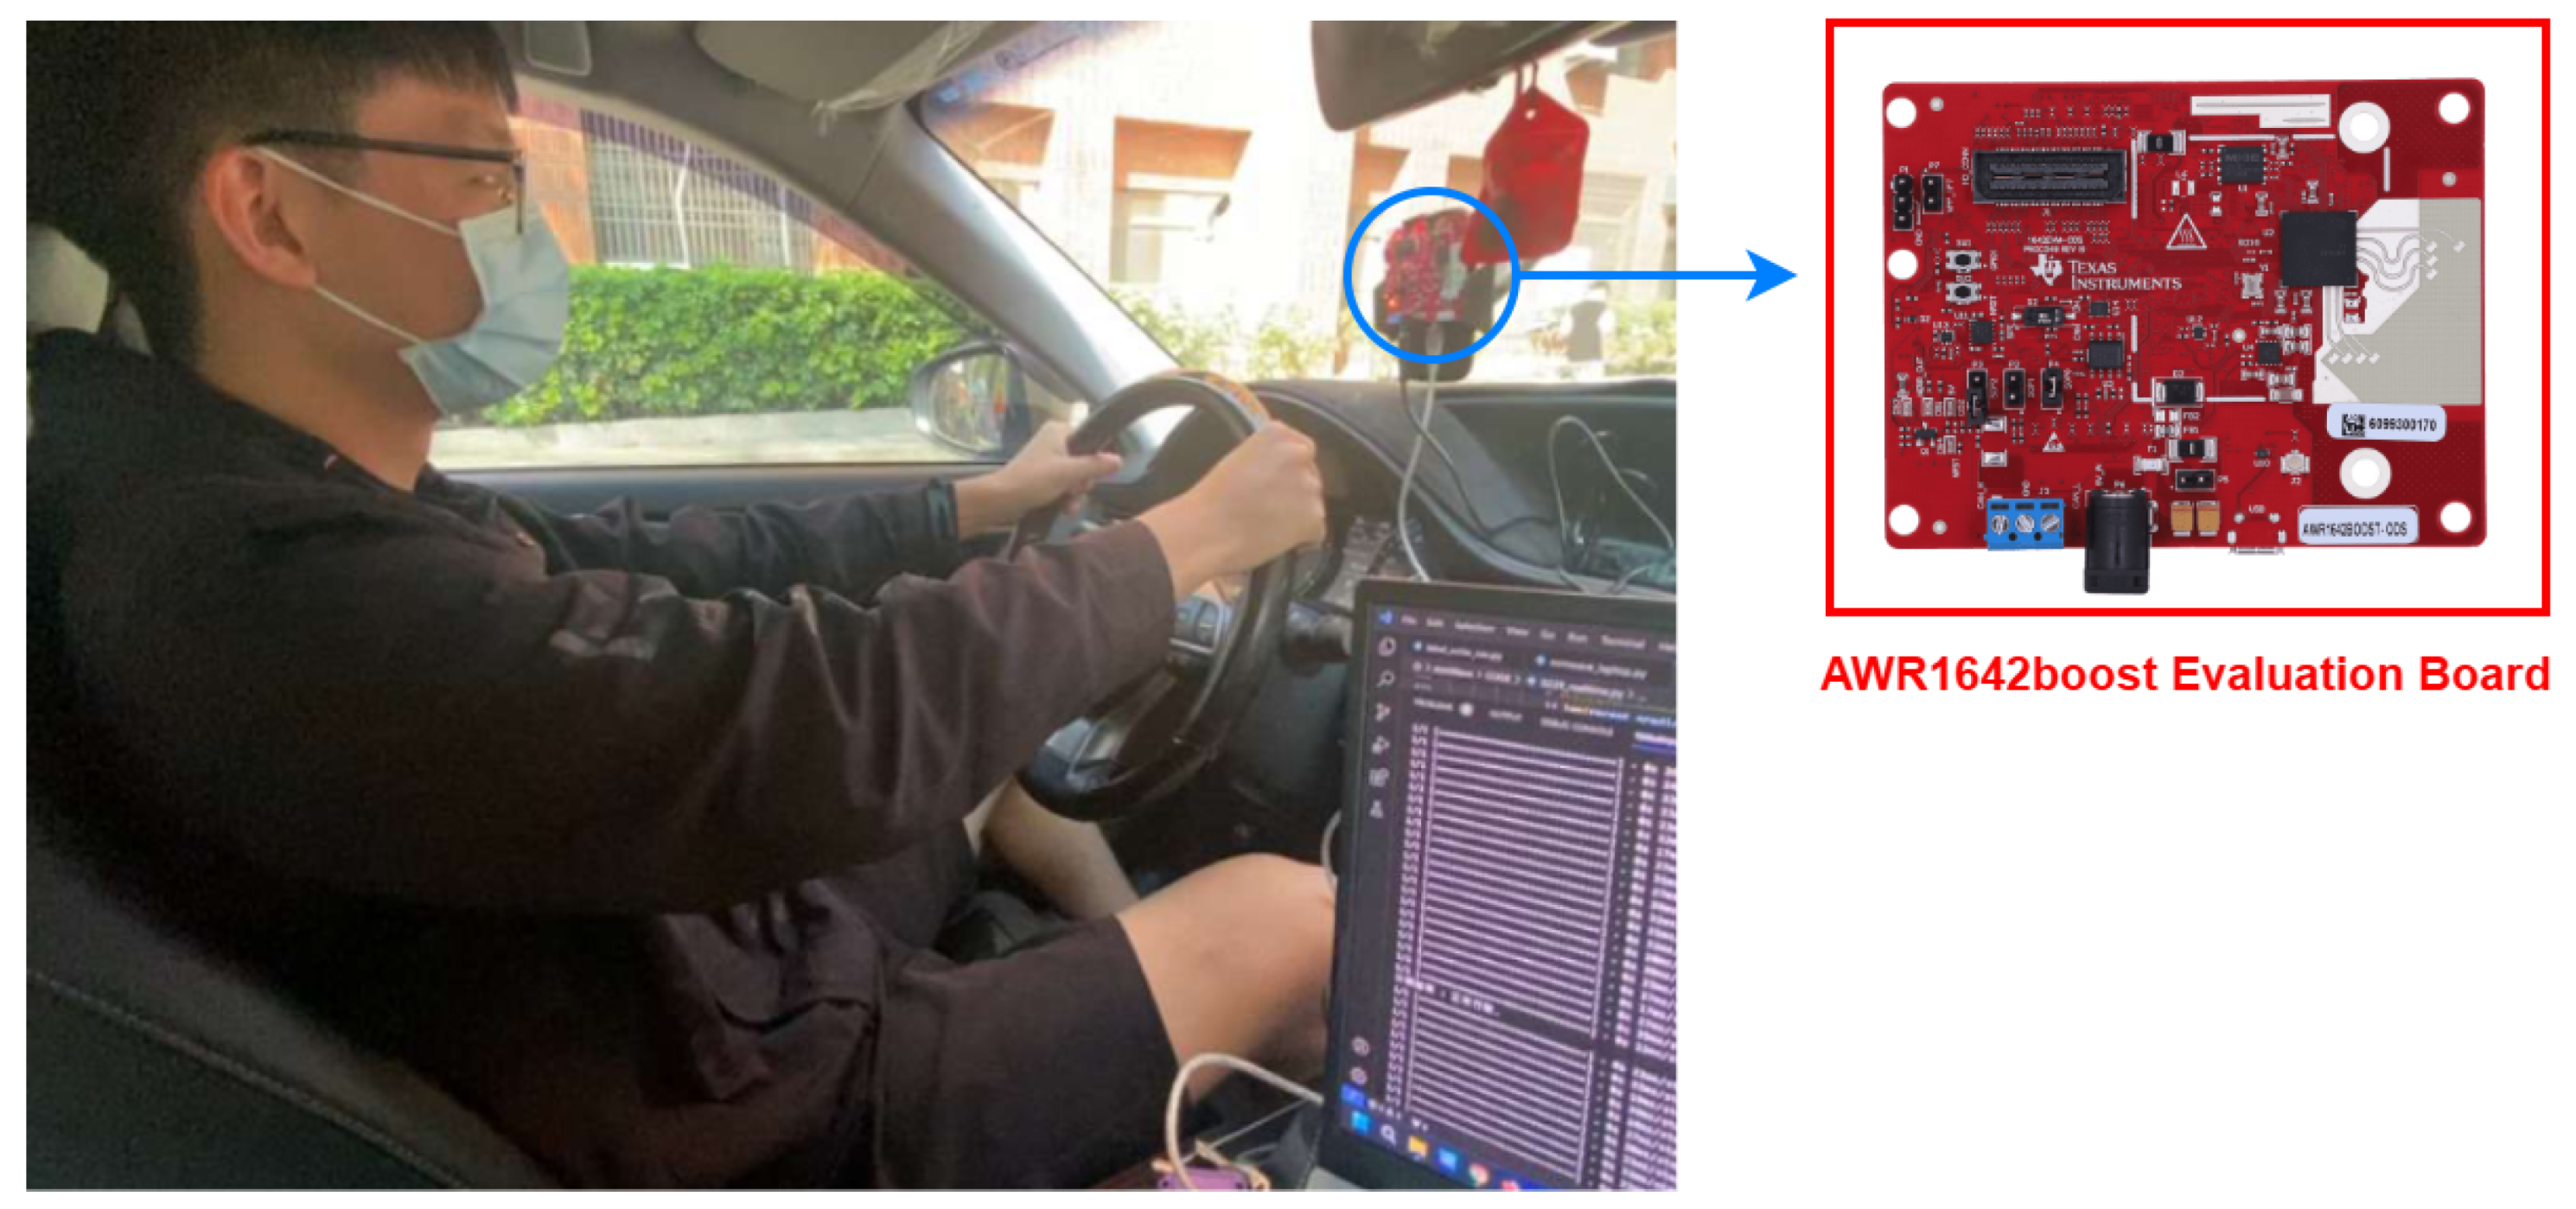
Figure 13.
Confusion matrix of safe and dangerous driving.
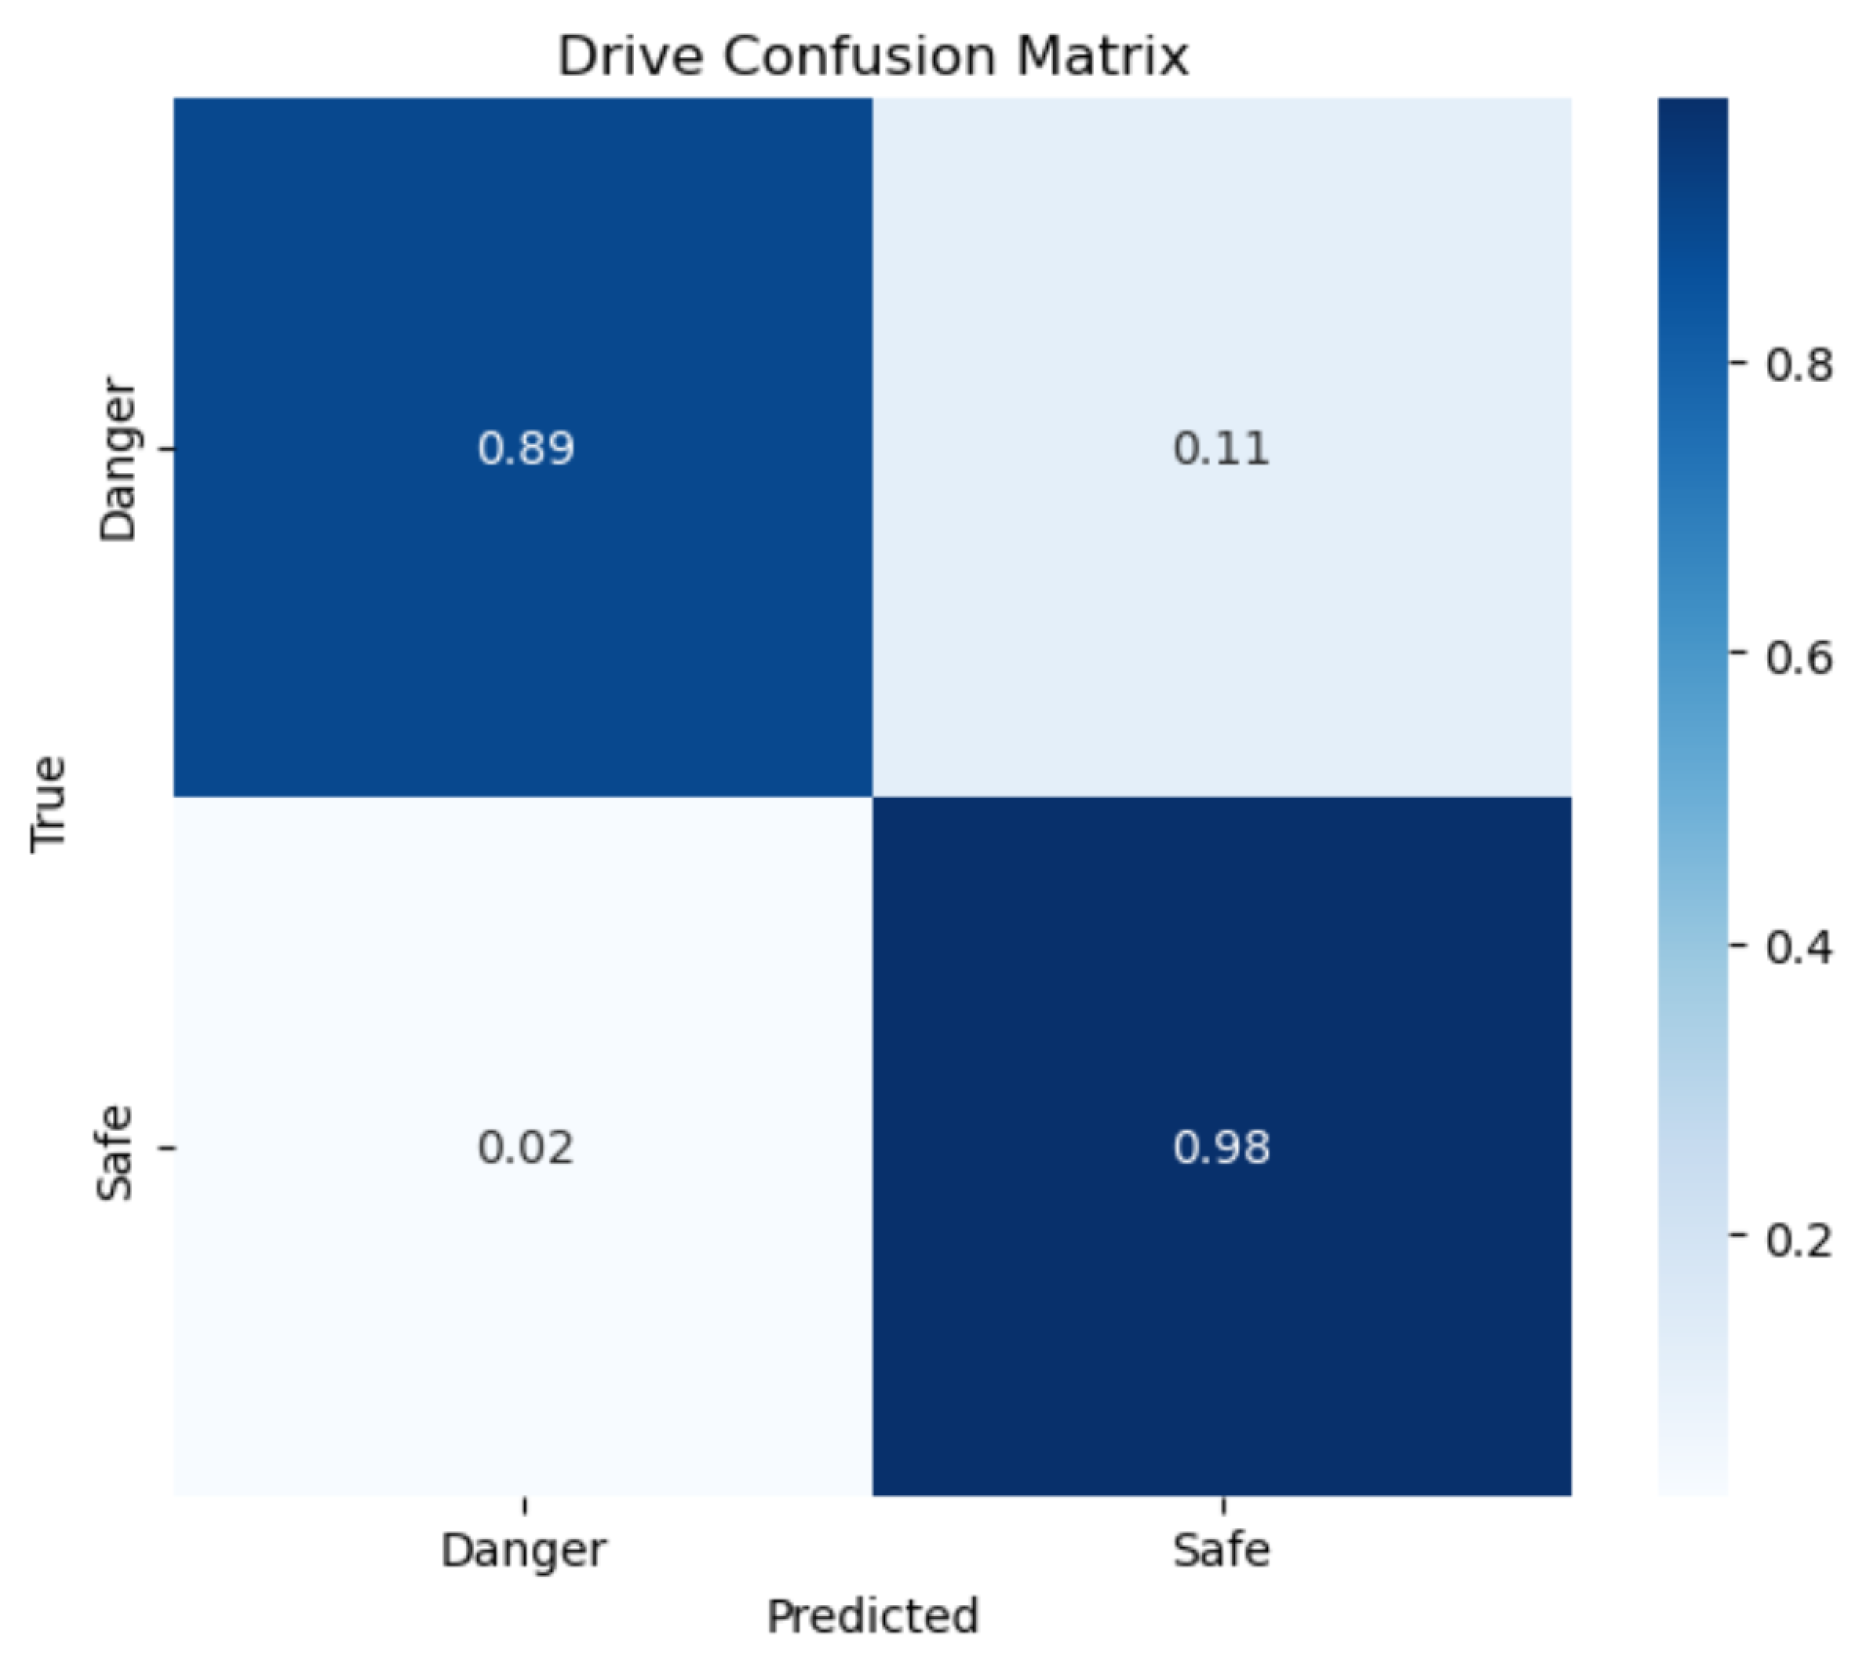
Figure 14.
Confusion matrix of behavior detection.
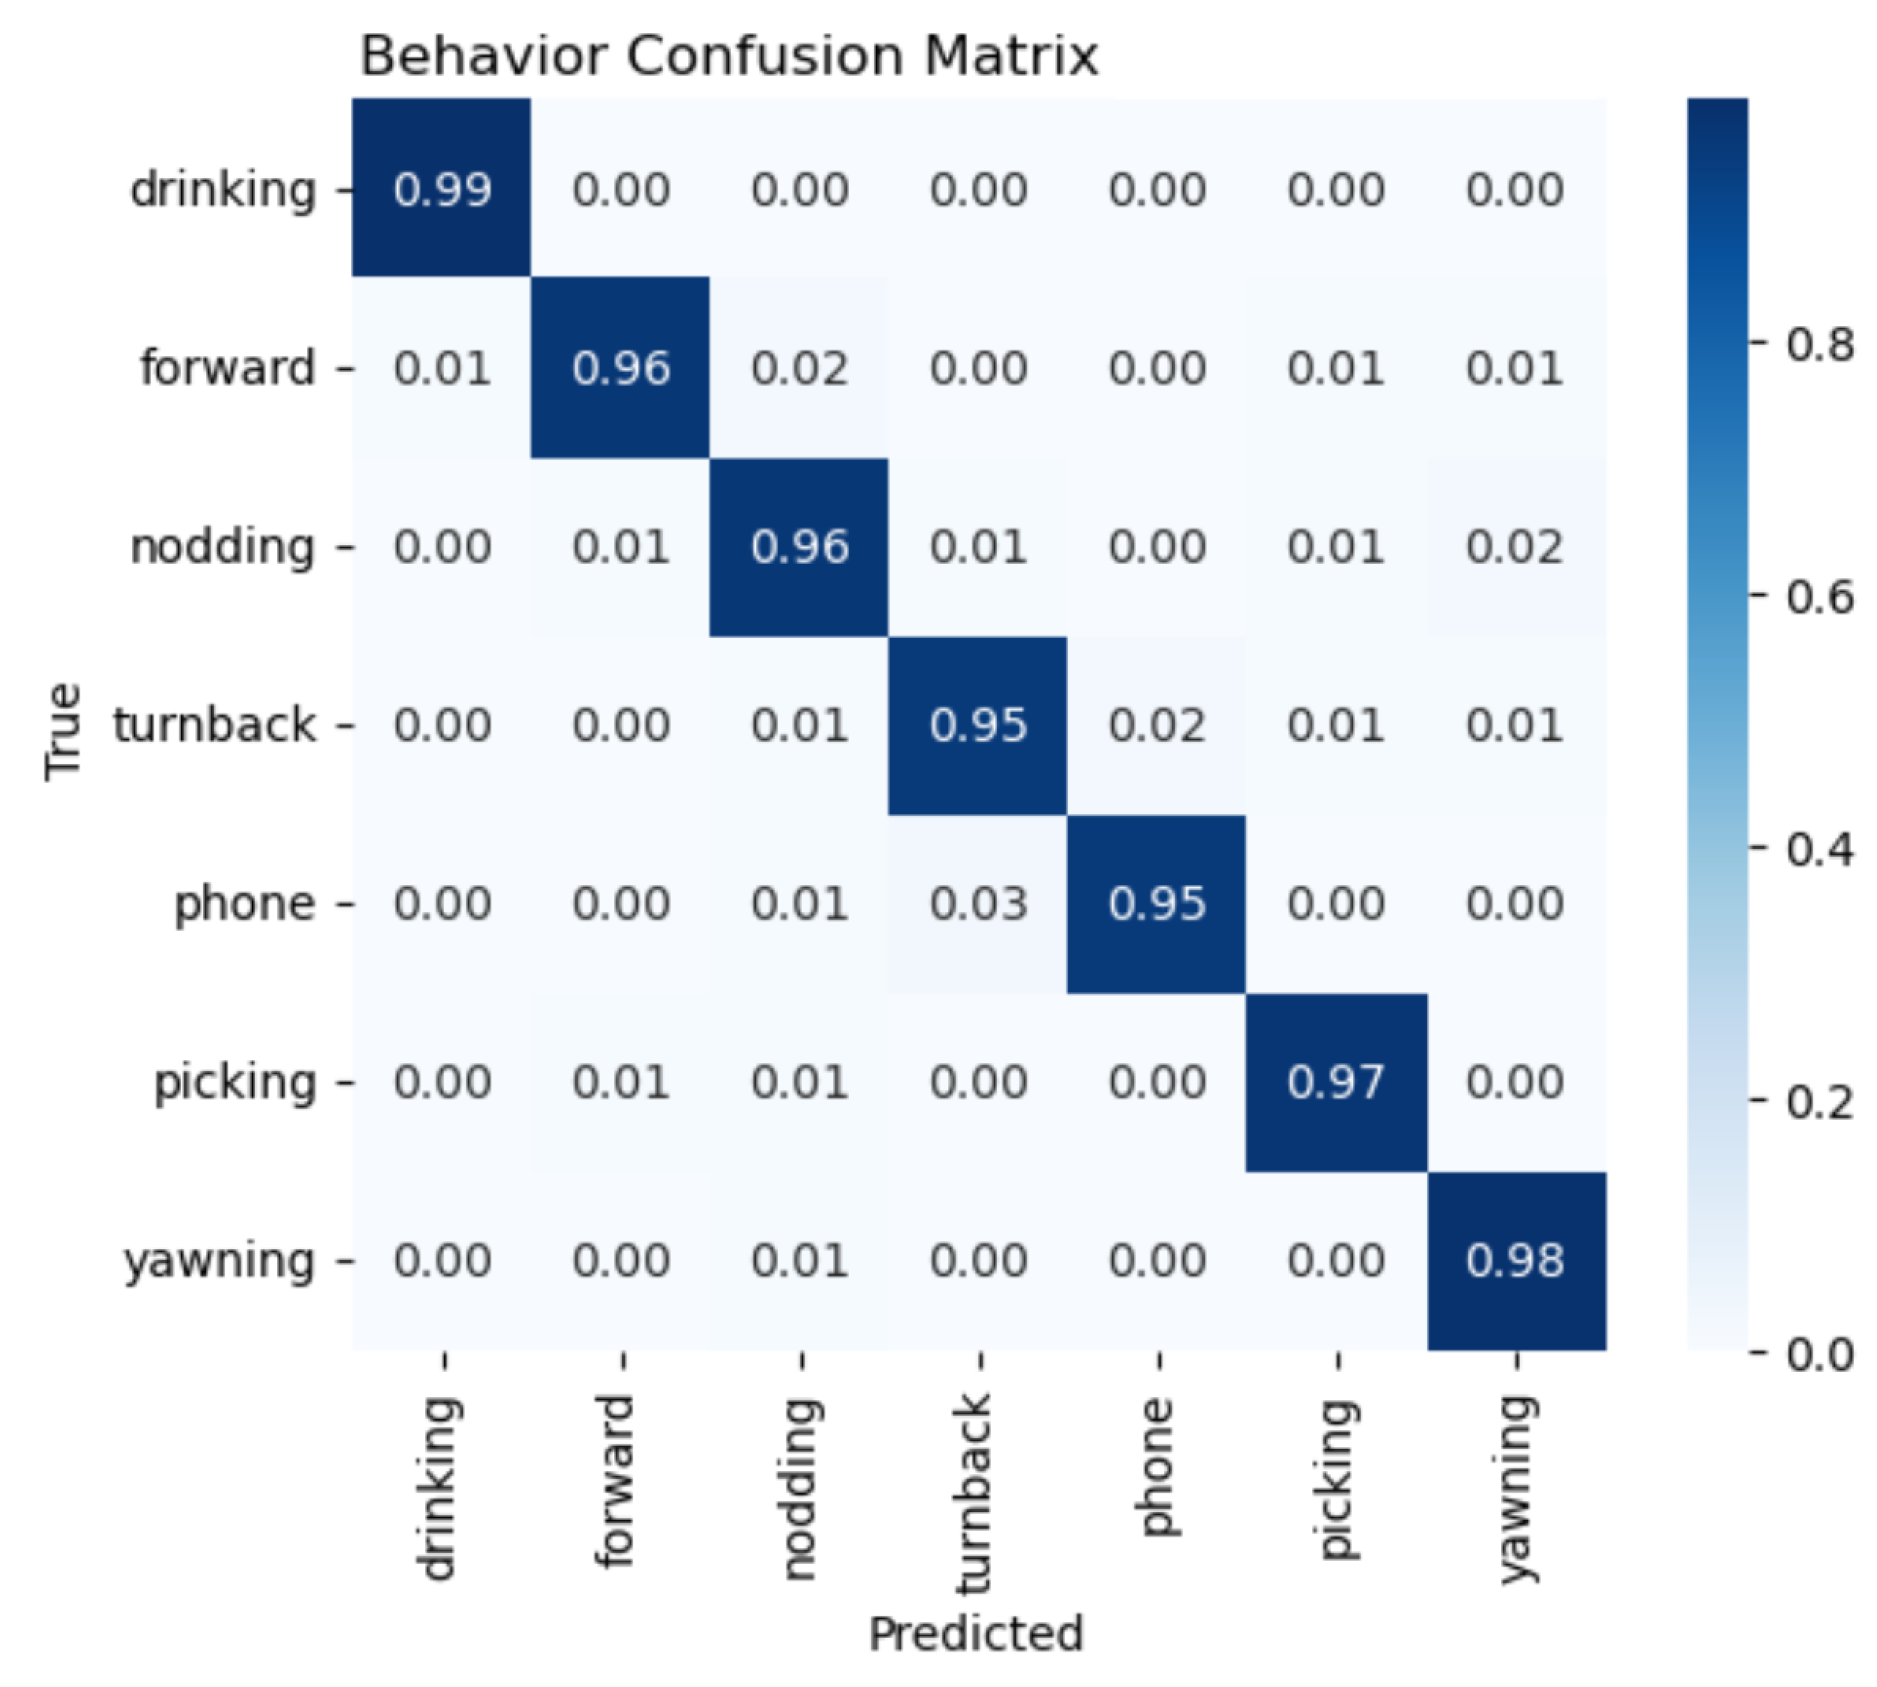

Table 1.
AWR1642BOOST Radar Configuration Parameters.
| Parameter | Value |
|---|---|
| Frequency | 77 GHz |
| Platform | xWR16xx |
| Scene Classifier | best_range_res |
| Azimuth Resolution | 15° |
| Range Resolution | 0.047 m |
| Maximum Unambiguous Range | 2.42 m |
| Maximum Radial Velocity | 1 m/s |
| Radial Velocity Resolution | 0.13 m/s |
| Frame Duration | 250 ms |
| RF Calibration Data | None |
| Range Detection Threshold | 15 dB |
| Doppler Detection Threshold | 15 dB |
| Range Peak Grouping | Enabled |
| Doppler Peak Grouping | Enabled |
| Static Clutter Removal | Disabled |
| Angle of Arrival FoV | Full FoV |
| Range FoV | Full FoV |
| Doppler FoV | Full FoV |
Table 2.
Specifications of AWR1642BOOST.
| Specification | AWR1642BOOST |
|---|---|
| Frequency Band | 77 GHz |
| Processing Unit | DSP + Hardware Accelerators |
| Interface | UART, SPI, I2C |
| Application | Radar Signal Processing |
Table 3.
Specifications of NVIDIA Jetson Orin Nano.
| Specification | Jetson Orin Nano |
|---|---|
| Processing Unit | 6-core ARM Cortex-A78AE CPU |
| AI Acceleration | 1024-core NVIDIA Ampere GPU + 32 Tensor Cores |
| Memory | 8GB LPDDR5 |
| Power Consumption | 7W – 15W |
| Interface | USB, PCIe, GPIO, I2C, SPI |
| Application | Edge AI Computing |
Table 4.
Accuracy of Driver Behavior Detection Across Different Sensors and Studies.
| Method | Sen et al. [16] | Jung et al. [15] | Sengar et al. [17] | Shariff et al. [18] | Guo et al. [19] | Our Method |
|---|---|---|---|---|---|---|
| Sensor Type | FMCW Radar | FMCW Radar | Multi-view Camera | Event Camera | Depth Camera | FMCW Radar |
| Nodding | 93% | 80% | - | - | - | 96% |
| Yawning | 96% | - | 86% | - | - | 98% |
| Using Phone | 97% | - | 89% | - | 90% | 95% |
| Picking Object | 97% | - | 85% | - | - | 97% |
| Turning Back | 97% | - | 92% | - | 86.67% | 95% |
| Drinking | 99% | - | 92% | - | 93.33% | 99% |
| Fetching Forward | 87% | - | 89% | - | 84.44% | 96% |
| Fatigue Driving | - | - | - | 94.4% | - | -% |
Disclaimer/Publisher’s Note: The statements, opinions and data contained in all publications are solely those of the individual author(s) and contributor(s) and not of MDPI and/or the editor(s). MDPI and/or the editor(s) disclaim responsibility for any injury to people or property resulting from any ideas, methods, instructions or products referred to in the content. |
© 2025 by the authors. Licensee MDPI, Basel, Switzerland. This article is an open access article distributed under the terms and conditions of the Creative Commons Attribution (CC BY) license (http://creativecommons.org/licenses/by/4.0/).
Copyright: This open access article is published under a Creative Commons CC BY 4.0 license, which permit the free download, distribution, and reuse, provided that the author and preprint are cited in any reuse.


