
Submitted:
29 January 2026
Posted:
29 January 2026
You are already at the latest version
Abstract
Topological optimization has established as an efficient tool for the design of structures with high complexity and rational use of material, especially in problems involving multiple constraints and conflicting objectives. This work presents a new multi-material topology optimization approach based on the ESO smoothing method (SESO), formulated as a multi-objective optimization problem in a MATLAB environment. The multi-objective formulation simultaneously considers the minimization of the maximum von Mises equivalent stress and the maximum displacement, fundamental criteria for structural engineering design. The proposed methodology also incorporates a reliability analysis using the First-Order Reliability Method (FORM). The uncertainties associated with the applied force, volume fraction, and elastic modulus are modelled using normal and lognormal probability distributions, with a target reliability index of β_target=3.0. The consistency of the reliability analysis was evaluated through Monte Carlo simulations, used to validate the reliability indices obtained by the FORM method. The approach was applied to two classic three-dimensional numerical examples, a bottom-loaded cantilever beam and center-loaded cantilever beam, considering two widely used commercial materials, steel and concrete. The results indicated better multi-material distribution in the design domain and increased structural robustness against unfavorable loading planes, elastic modulus, and volume constraints imposed by the FORM formulation. Furthermore, the minimum yield stress is calibrated to incorporate the uncertainties inherent in the design process, establishing the minimum value required to achieve the target reliability index β. Thus, this method highlights the integration of the SESO method with multi-material, multi-objective, and reliability-based optimization as a consistent and robust strategy with potential for future applications in structural engineering design.
Keywords:
multiobjective topological optimization
; multi-material topology optimization
; SESO method
; first-order reliability method
1. Introduction
The development of high-performance structural designs has become a necessity given current technological advancement. Structural engineering requires increasingly lightweight and efficient solutions capable of meeting more stringent functional and economic requirements. In this context, the pursuit of greater structural efficiency has driven the use of systematic design improvement methods.
Among these approaches, Topology Optimization (TO) stands out as a suitable technique for structural optimization, based on robust criteria and the efficient distribution of material in the design domain, enabling the creation of lighter structures with significant cost reductions, without compromising mechanical performance [1,2,3]. The increasing use of TO demonstrates its ability to integrate structural performance, material economy, and optimized geometries [4,5]. In this context, the overall stiffness of a structure is directly associated with its topology, that is, the way the material is distributed along the dominant stress transfer paths. When this distribution occurs efficiently, the system tends to exhibit greater stiffness and better overall performance, making the optimal configuration an important factor in meeting the current demands of structural engineering.
Furthermore, TO has been continuously improved, with recent advances highlighting the use of multiple materials in defining the desired structure. This extension, called Multi-Material Topology Optimization (MMTO), has become increasingly relevant, with several studies demonstrating its potential to produce more efficient and realistic solutions in engineering applications [6,7,8,9]. In parallel, contemporary structural designs often involve multiple objectives, such as reducing structural weight and limiting maximum displacement [10]. These objectives, however, are generally conflicting, since minimizing weight generally leads to greater displacements, making multi-objective approaches indispensable for defining optimal solutions.
This article proposes an extension of the Smoothing Evolutionary Structural Optimization (SESO) method for the context of MMTO, considering the simultaneous minimization of the maximum von Mises stress and the maximum displacement of the structure. However, reducing displacements generally requires a greater concentration of material in specific regions, which, while contributing to increased overall stiffness, can restrict the dominant stress transfer paths and intensify local stresses. Consequently, maximum stress and displacement do not vary independently, frequently exhibiting conflicting behaviours throughout the optimization process, which reinforces the need for a multi-objective approach to balance the evaluation of structural performance. Additionally, the proposed method incorporates a reliability analysis into the MMTO process, with a reliability index of 3.0, corresponding to a failure probability of 0.0013 [11].
In addition to proposing a calibration of the minimum yield strength of the material, whose consistency is verified through Monte Carlo simulations, enabling a robust statistical evaluation of the performance and structural safety of the solutions obtained.
2. Multi-Material Topology Optimization
Multimaterial topological optimization (MMTO) has been generating increasing interest from the scientific community, driven mainly by recent advances in multimaterial additive manufacturing. According to Bandyopadhyay et al. [12] and Han and Lee [13], this type of manufacturing enables the direct production of multi-material structures from computational models, in a point-by-point and layer-by-layer manner, significantly expanding the possibilities of structural design.
Among existing approaches to MMTO, the Level Set Method (LSM) stands out for its ability to implicitly represent complex geometries, naturally handle topological changes, and facilitate the incorporation of multiple materials. The classic LSM formulation was extended to MMTO problems by Wang and Wang [14], in which, for a total of m materials, multiple level set functions are used, and the evolution of the structure is described by a system of Hamilton–Jacobi equations. Subsequently, the LSM was extended to MMTO problems with stress constraints in Guo et al. [15] and Chu et al. [16]. A modified multimaterial description of the Multimaterial Level Set (MM-LS) method was presented by Wang et al. [17], in which each material phase is represented by a combination of different level set functions, thereby providing greater flexibility in modelling.
In the context of finite element-based approaches, a SIMP-type multimaterial interpolation model was proposed by Bendsøe and Sigmund [18], in which interpolation initially occurs between two non-zero material phases and then between the solid material and the void. Another strategy for MMTO was presented by Tavakoli and Mohseni [19], in which the multimaterial problem is decomposed into a sequence of binary topological optimization (0–1) subproblems. Along the same lines, the SIMP model was applied between adjacent materials, and a multimaterial extension of the BESO method was developed by Huang and Xie [20].
More recently, the work of Zheng et al. [21] and Simonetti et al. [22] employed mapping-based interpolation functions, using, respectively, the hyperbolic tangent and sigmoid functions. These approaches were proposed as alternatives to polynomial interpolations and the SIMP model, guaranteeing well-defined discrete solutions (0–1) for each material and eliminating intermediate regions. As a result, smoother and clearly delimited transitions are obtained between the different materials in the optimized topology, which contributes to the feasibility of the manufacturing process.
2.1. Multiobjective Formulation Topology Optimization Multi-Material
Currently, many engineering problems are formulated and treated as multi-objective optimization problems. This approach allows for obtaining solutions capable of simultaneously meeting different performance criteria, enabling the identification of more suitable alternatives for the challenges inherent in engineering systems. Recent studies, such as those by Azevêdo et al. [23], Zhang et al. [24] and Chen et al. [25], demonstrate the effectiveness of this methodology in the search for more balanced and efficient solutions.
This article uses the Weighted Sum (WS) method, which combines multiple objective functions into a single scalar function using weighting coefficients, allowing control over the trade-off between conflicting objectives. This approach is widely used in multi-objective optimization problems due to its simplicity of implementation, computational efficiency, and ease of integration with evolutionary and gradient-based methods. Furthermore, in this work, the proposed algorithm enables the automatic construction of the Pareto frontier from the systematic variation of weights, simultaneously generating the optimal topology corresponding to each set of weightings. This provides a comprehensive and consistent view of the trade-off solutions between the objectives considered.
MMTO has been applied in different engineering structures, as it allows achieving structural performance compatible with stringent mechanical requirements, while promoting cost reduction and efficient use of materials, contributing to the sustainability of the project. Among the available topological optimization techniques, the SESO method [26] has stood out for presenting consistent results, leading to the achievement of more rigid structures with lower material consumption. For this reason, SESO is adopted in the numerical examples of this work, in conjunction with the WS method for the treatment of the multi-objective problem, considering the minimization of the maximum von Mises stress () and the maximum displacement ().
where and are the weights for the functions corresponding to the von Mises stress and maximum displacement, respectively, represents the element density variable, if it represents solid elements and denotes empty elements, K, u and F are, respectively, the global stiffness matrix, the displacement vector and the force vector. V is the volume of the structure.
2.2. Weighted Sum Method
The multi-objective optimization method is characterized by several functions that describe an optimization problem. Thus, a common approach to deal with conflicting objective functions is to construct a single function that encompasses all the functions, from linear combinations between the objective functions, transforming them into a single scalar function. This method is known as the weighted sum method, Rao [27].
Thus, given two objective functions, and , a new objective function for optimization could be expressed as:
In general terms, the weighted sum method consists of:
where are the objective functions, are the assigned weights, representing the relative importance of each objective.
2.3. Pareto Frontier
Multiobjective optimization problems have been extensively investigated in the literature and are commonly analysed using the concept of the Pareto frontier. Introduced by Pareto in 1896, this approach seeks to identify a set of compromise solutions, rather than a single optimal point. A solution vector x belongs to the Pareto frontier if none of the objective functions can be improved without causing the deterioration of at least one of the other objectives (Pareto, 1896) [28].
In engineering applications, it is generally not possible to determine a single vector x capable of simultaneously minimizing all the objective functions involved. For this reason, the concept of Pareto optimality has become central to multi-objective optimization formulations, especially in structural optimization problems, as discussed by Simonetti et al. (2021) [29]. The Pareto frontier defines the set of globally efficient solutions that satisfy all the problem constraints. Figure 1 shows the Pareto frontier obtained from the parametric optimization of a truss structure with 19 bars, considering the structural weight and the maximum displacement as conflicting objectives [10].
By clearly outlining the trade-offs between conflicting objectives, the Pareto frontier provides relevant information for the decision-making process in engineering design. This approach has been widely adopted in recent multi-objective optimization studies, such as those by Xu [30], Yin [31] and Crescenti [32]. Thus, the multi-objective problems addressed in this work also resulted in their respective Pareto frontiers, as presented later in the numerical examples.
2.4. Pareto Dominance
The concept of Pareto dominance is fundamental in solving multi-objective optimization problems. In these problems, the goal is to simultaneously minimize or maximize a set of objective functions, which can be represented by:
subject to the decision vector The set X corresponds to the decision space in which and x represents the vector of design variables, z is the objective vector is such that:
defining the set of feasible solutions, where is the set of constraints and is the vector of associated limits.
A feasible solution x is considered Pareto optimal when there is no other solution capable of improving at least one objective function without simultaneously worsening some other. Equivalently, any attempt to improve one objective necessarily implies the deterioration of at least one of the others. Consider two objective vectors u and v; u is said to dominate v if for all i and for at least one index j.
Non-dominated solutions constitute the set of Pareto optimal solutions, which together form the Pareto frontier, representing the best compromises between conflicting objectives. Dominated solutions, in turn, are inferior to those belonging to the frontier and do not contribute to the decision-making process. Figure 2 shows the Pareto frontier for a minimization problem with two objectives, A and B, highlighting dominated and non-dominated solutions, as discussed by Coello et al. [33].
3. Reliability Analysis
Reliability analysis applied to structural optimization constitutes a fundamental approach for considering uncertainties in engineering design, aiming to reduce the probability of failure and, consequently, increase the safety levels of the optimized structure. Recent studies have demonstrated the efficiency of this approach [34,35,36]. Thus, the numerical examples presented in this work were subjected to a reliability analysis using the FORM method.
3.1. FORM Method
The method adopted to integrate reliability analysis into the TO process was the First-Order Reliability Method (FORM). This method is based on the first-order Taylor series expansion of the limit state function (performance function), which is iteratively linearized around the current design point. The process converges to the so-called Most Probable Point (MPP), the point of highest probability of failure on the limit-state surface, thus allowing an efficient estimate of the reliability index. The reliability index (β) is then defined as the minimum distance, , between the origin and the limit-state surface in the transformed space [37,38,39].
The random variables involved in the reliability process, if they do not have a normal distribution, undergo a transformation of the variable into an equivalent normal distribution, defined by the expressions [40]:
where and are, respectively, the standard deviation and the mean of the equivalent normal distribution; and represent, respectively, the cumulative distribution function (CDF) and the probability density function (PDF) of the non-normal random variable; Φ(⋅) is the cumulative distribution function of the standard normal distribution; ϕ(⋅) is the probability density function of the standard normal variable.
For the reliability analysis, the HLRF algorithm, developed by Hasofer and Lind [38] and later improved by Rachwitz and Fiessler [41], was implemented, in which a new design point in the reduced space is evaluated. This is an iterative procedure based on the Newton-Raphson method, as presented in Equation (7).
where X’ is the random variable transformed into a statistically independent standard normally distributed random variable, and ∇G represents the gradient vector of the limit state function.
Once the new design point, , is determined through iterations until convergence within the specified tolerance, the probability of failure is then obtained from the reliability index β:
Thus, the RBTO method was implemented considering the applied force (F), fractional volume (Volfrac), and elastic modulus (E) as random variables. For each variable, Normal (N) or Lognormal (LN) probability distributions were adopted, using their respective statistical parameters, such as mean (μ) and coefficient of variation (V), as presented in Table 1.
This work investigates structural reliability under two complementary approaches: (i) the reliability associated with the final deterministic topology optimization (DTO) obtained through the optimization process; and (ii) the reliability of the reliability-based topology, in which the maximum von Mises stress is modeled as a variable dependent on the topological evolution and the uncertainties inherent in the random variables considered. Thus, in order to verify if the maximum acting stress is compatible with the structure’s resistance capacity, the limit state function adopted in this article is defined by:
where represents the yield stress of the material and corresponds to the maximum equivalent von Mises stress, expressed as:
where is the maximum von Mises stress obtained through deterministic analysis, while corresponds to the maximum von Mises stress initially calculated deterministically in the first iteration and, in subsequent iterations, updated by reliability analysis using the FORM procedure. The quantities , , denote, respectively, the initial applied forces, fractional volume, and elastic modulus. In turn, F, V, and represent the random variables associated with the force, volume, and elastic modulus interpolation coefficient considered in the reliability analysis.
In approach (i), throughout the iterative process, the maximum von Mises stress is kept equal to that obtained in the deterministic model, since the objective of this step is to calibrate the minimum yield stress to be adopted, so that the deterministic structure reaches the target reliability index, = 3.0. In approach (ii), the maximum von Mises stress begins to evolve progressively throughout the iterations, allowing the capture of the stress redistribution effects resulting from the modifications in the structural topology, until the solution converges to a stable configuration compatible with the previously established target reliability index.
Since the problem presents a multi-material character, being a structure composed of steel and concrete materials, it should be noted that the concrete can present significant variations in resistance depending on its composition. Therefore, the minimum yield strength of the material was considered, with the objective of determining the minimum stress necessary for the material supplier to guarantee the reliability of the structure, considering a target reliability index of .
Finally, a lower tolerance of 0.1 was established in relation to the target value of the reliability index , while, as an upper limit, the condition was admitted, provided that it was associated with the minimum yield stress necessary for this value to be reached. The yield stress was controlled by means of a tolerance of 0.5 MPa, ensuring numerical consistency and stability to the iterative process. In order to verify whether the reliability index remains close to the reference value β=3.0 throughout the process of obtaining the final structure, a Monte Carlo simulation was conducted, allowing the statistical evaluation and validation of the structural response to the uncertainties considered.
3.2. Monte Carlo
Monte Carlo (MC) simulation stands out as one of the most widely used methods for reliability analysis in engineering, due to its conceptual simplicity and relative ease of implementation. The method is based on the generation of a large number of random samples, which numerically reproduce multiple virtual experiments. From these results, it is possible to statistically estimate the probability of failure of the system or component under study. The samples are generated according to the type of probability distribution specified for each random variable involved, respecting their respective statistical parameters, such as mean and standard deviation [37,39].
Random variables with lognormal probability distributions were modeled, and variable transformation was used to generate samples via Monte Carlo simulation. In this procedure, a lognormal random variable X, with mean μ and standard deviation σ, is used to define the variable . The variable Y follows a normal distribution with mean and standard deviation , defined by:
Next, after defining the samples according to the type of probability distribution, the probability of failure is then determined by the ratio between the number of simulations in which the limit state function is violated, g(x) ≤ 0, and the total number of simulations performed, as shown in Equation 13.
To verify and validate the results of the reliability analysis conducted using the proposed FORM methodology, the Monte Carlo method was applied to all numerical examples in this work, using the limit-state function defined in Equation 10. The objective was to compare the reliability levels obtained and ensure their conformity with the established target values.
4. Results
In the design of the analyzed structures, two materials were considered: steel and concrete, and their properties are presented in Table 2.
The material assignment was based on the principal stress criterion. The regions of the structure subjected to positive principal stresses, characterizing a state of tension, were assigned to steel, while the regions subjected to negative principal stresses, associated with a state of compression, were designated to concrete.
4.1. Bottom-Loaded Cantilever Beam
The first numerical example is a cantilever beam with a fixed support at the left end and a concentrated, vertical downward load of magnitude 100 kN applied to the lower edge of the free (right) end, as shown in Figure 3. The design domain was discretized into Nelx = 64 dm, Nely = 40 dm, and Nelz = 2 dm.
Figure 4 shows the optimal settings for the procedures: (a) deterministic (DTO), (b) with reliability analysis () and (c) with reliability analysis (considering the optimization parameters given by and .
Figure 5, Figure 6 and Figure 7 present graphical representations of the Pareto frontier, relating the objective functions maximum displacement and equivalent von Mises stress, as well as the optimal topologies associated with each point of the frontier, obtained, respectively, through the deterministic approach (DTO), reliability-based optimization (), and reliability-based optimization . It can be observed that the solutions obtained via FORM generally present a smaller structural volume when compared to the corresponding deterministic solutions.
Table 3, Table 4 and Table 5 present a summary of the objective function values and the weighting factors (von Mises equivalent stress) and (maximum displacement) used in the composition of the optimal solutions for the cantilever structure, obtained, respectively, by the deterministic (DTO), reliability-based (), and reliability-based approaches. In general, it is observed that the solutions obtained via DTO present lower von Mises stress and maximum displacement values when compared to the corresponding solutions obtained by FORM. While in the deterministic case the stresses remain practically constant around 14.580 MPa, with displacements varying between approximately 0.1234 mm and 0.1393 mm, the FORM model results in higher stresses, close to 17.785 MPa and 17.798 MPa, and maximum displacements between 0.1665 mm and 0.1934 mm, and 0.1776 mm to 0.1982 mm, considering () and , respectively.
This behavior was expected, since the RBTO approach explicitly incorporates the uncertainties associated with the problem, leading to more conservative solutions from the point of view of structural response. Conversely, as discussed earlier, solutions with reliability tend to have a smaller structural volume, highlighting a distinct trade-off between mechanical performance and reliability. Thus, from the strictly deterministic perspective of the objective function values (stress and displacement), the DTO model presents better structural performance. However, from the point of view of robustness and the consideration of uncertainties, models with reliability prove to be more suitable, offering structurally more efficient solutions in terms of volume, but with more conservative mechanical responses.
Figure 8 shows the variation of the maximum displacement () and the equivalent von Mises stress () as a function of the weight , associated with the displacement objective, for the cantilever in deterministic mode. It can be observed that, for reduced values of , the structure tends to exhibit smaller maximum displacements, but accompanied by relatively higher levels of von Mises stress. As increases, assigning greater importance to minimizing displacement in the optimization process, a gradual reduction in is observed, while assumes higher values. This behavior highlights a clear conflict between the structural objectives, since the reduction of displacement occurs at the cost of increased stresses, and vice versa, making it impossible to identify a value of that simultaneously minimizes both responses in the deterministic context.
Figure 9 presents the results obtained for the case with reliability, considering the maximum von Mises stress fixed and equal to that from the deterministic model, (). It is noted that the introduction of reliability analysis modifies the sensitivity of the structural responses in relation to the weight , but preserves the general tendency for conflict between displacement and stress. For smaller values of , solutions with lower predominate, associated with higher levels of (), while an increase in leads to a reduction in stresses, accompanied by an increase in the maximum displacement. This behavior indicates that, even under reliability constraints, the improvement of one structural criterion necessarily implies the deterioration of the other, reinforcing the multi-objective nature of the problem.
Figure 10 illustrates the variation of and considering the maximum von Mises stress updated iteratively through the FORM procedure, It can be observed that the evolution of the responses is more pronounced, reflecting the combined effects of the redistribution of stresses resulting from topological modifications and the probabilistic update of the maximum stress. Even so, the characteristic tendency of conflict between the objectives remains: lower values of lead to stiffer structures with smaller displacements, but subjected to higher stresses, while higher values of result in stress relief at the cost of greater displacements. The lack of a solution that simultaneously minimizes and unequivocally confirms the antagonism between the criteria and justifies the adoption of the Pareto frontier as an appropriate tool to identify compromise solutions in the context of reliable topological optimization.
This trend clearly characterizes a conflict between the objectives of maximum displacement and von Mises stress, since there is no value of capable of simultaneously minimizing both structural responses. Each point on the graph, therefore, represents a compromise solution, in which a reduction in displacement generally implies an increase in stress, or vice versa. Thus, the observed behavior confirms the multi-objective nature of the problem analyzed and justifies the use of the Pareto frontier as a suitable tool to identify optimal compromise solutions between the structural performance criteria considered.
Figure 11 and Figure 12 show the histograms obtained from the Monte Carlo simulation, implemented to validate the adopted limit state functions, as well as the target reliability index β = 3.0. It can be observed that the FORM method achieved adequate convergence, as the reliability index β estimated via Monte Carlo simulation, considering 100,000 samples and a , for the minimum displacement point, resulted in values of β = 3.17 and β = 3.14, for the optimization with reliability () and (), respectively, and the other points were above the target reliability.
4.2. Center-Loaded Cantilever Beam
The second optimized numerical example consists of a cantilever beam, modeled with a rigid support at one end and a free end at the opposite end. The domain was discretized with dimensions of , , and . A concentrated load of F=100 kN was applied, located in the central part at the free end, as shown in Figure 13. The optimization parameters were kept the same as in the previous example.
Figure 14 shows the optimal settings for the deterministic procedure (DTO), the procedure with reliability analysis () and with reliability analysis ().
Figure 15, Figure 16 and Figure 17 show the optimal configurations from the multi-objective MMTO with two materials (steel and concrete), considering () and () as conflicting objectives. Figure 15 shows the results of the deterministic analysis (DTO), in which the Pareto frontier exclusively reflects the redistribution of materials as a function of the relative prioritization between stiffness and strength. Figure 16 illustrates the optimal configurations obtained via Reliability-Based Topological Optimization (), and Figure 17 shows the Reliability-Based Topological Optimization (), which explicitly incorporates the uncertainties in the problem parameters.
In this case, the solutions are evaluated not only by their structural performance but also by their robustness. A shift in the Pareto frontier towards more conservative solutions is observed. This behavior represents the additional structural cost necessary to guarantee adequate levels of reliability. This comparison between the figures highlights the influence of reliability both in the objective function space and in the final topologies obtained.
Table 6 shows that varying the weights results in an efficient compromise between stress reduction and displacement control, with von Mises stress values ranging from 10.007 MPa to 10.109 MPa and displacements from 0.0931 mm to 0.1173 mm. The solutions exhibit good structural efficiency, but reflect an idealized scenario in which system uncertainties are not considered.
On the other hand, Table 7 shows a systematic increase in the values of the objective functions, with stresses between 12.2737 MPa and 12.4293 MPa and displacements between 0.1366 mm and 0.1733 mm, and Table 8 shows stresses between 12.2633 MPa and 12.4026 MPa and displacements between 0.1329 mm and 0.1689 mm. This behavior indicates more conservative solutions, a direct result of incorporating uncertainties and the requirement for adequate levels of structural reliability. A lower sensitivity of displacements to weight variations is also noted, suggesting a stabilization of the structural response under probabilistic criteria.
The graphs shown in Figure 18, Figure 19 and Figure 20 highlight the trade-off between displacement and von Mises stress as a function of weight . When this weight increases, prioritizing maximum displacement, a reduction or stabilization of the maximum displacement () is observed, while the von Mises stress tends to increase or lose efficiency, and vice versa. This opposing behavior between the structural responses indicates that the improvement of one criterion generally occurs at the expense of the degradation of the other. The non-monotonic oscillations reinforce that there is no solution that simultaneously minimizes both functions, characterizing a typical trade-off in multi-objective problems. Therefore, the results confirm that maximum displacement and von Mises stress are conflicting objectives for the problem analyzed.
Figure 21 and Figure 22 show the histograms obtained from the Monte Carlo simulation, implemented to validate the adopted limit state functions, as well as the target reliability index β = 3.0. It can be observed that the FORM method employed showed adequate convergence in terms of reliability, since the β index estimated through the Monte Carlo simulation, considering 100,000 samples and a , for the minimum displacement point, resulted in β = 3.19 and β = 3.05, for the optimization with reliability () and (), respectively, and the other points were above the target reliability.
6. Conclusions
The application of the SESO method to the topological optimization of multimaterial structures proved effective in obtaining efficient and stable structural configurations. The results obtained are consistent with well-established studies in the literature, such as Sigmund [42] and Belytschko et al. [43], but present a multimaterial approach, showing that the combination of different materials constitutes an effective strategy to improve the overall performance of the structure without compromising its mechanical integrity.
Three-dimensional multimaterial topological optimization, formulated as a multi-objective problem, proved suitable for exploring different design solutions from the same structural domain. Depending on the prioritized criterion, it was possible to obtain reductions of up to 2.1% in the maximum von Mises stress or 20.6% in the maximum displacements. The numerical examples of the bottom-loaded cantilever beam and center-loaded cantilever beam confirmed the consistency of the methodology, demonstrating its applicability.
The incorporation of reliability analysis using the FORM method into multi-material and multi-objective topological optimization produced satisfactory results, meeting the established reliability indices. Validation through Monte Carlo simulations showed maximum differences of less than 9.1%, corroborating the accuracy and robustness of the proposed approach.
Thus, two strategies for handling the maximum von Mises stress were analyzed. In the first, the stress is fixed from the deterministic solution and used in the calibration of the minimum yield stress associated with the target reliability index. This strategy reflects the typical design procedure, in which the deterministic analysis serves as the basis for defining the resistance parameters, resulting in yield strengths 30.6% and 30.3% higher than the applied stress for the bottom-loaded cantilever beam and center-loaded cantilever beam, respectively, with lower computational cost. In the second strategy, the maximum von Mises stress evolves simultaneously with the structural topology, leading to resistance values 42.8% and 51.8% higher than the applied stress for the bottom-loaded cantilever beam and center-loaded cantilever beam, respectively, resulting in structurally more conservative solutions.
Therefore, the calibration of the minimum yield strength allowed the establishment of design parameters compatible with the specified reliability index. For the bottom-loaded cantilever beam, values of were obtained from the deterministic model and when considering the evolution of the maximum equivalent von Mises stress in the reliability-based formulation. Similarly, for the center-loaded cantilever beam, the calibrated values were in the deterministic model and when the evolutionary reliability analysis was incorporated. These results highlight the direct influence of uncertainties on the definition of the resistance parameters and confirm the applicability of the proposed methodology to the design of optimized structures with controlled safety levels.
Author Contributions
M.M.d.S.: Conceptualization, software, validation, formal analysis, investigation, resources, data curation, writing—original draft preparation, and visualization. H.L.S.: Conceptualization, software, validation, formal analysis, investigation, resources, data curation, writing—review and editing, supervision, and project administration. F.A.d.N.: Conceptualization, methodology, investigation, resources, writing—review and editing, supervision, and project administration. M.S.R.F.: resources, writing—review and editing, supervision, and project administration. All authors have read and agreed to the published version of the manuscript.
Funding
This research was funded in part by the Coordination for the Improvement of Higher Education Personnel - Brazil (CAPES) - Finance Code 001, CNPq (National Council of Scientific and Technological Development) under Grant Number 316771/2023-6, FAPEMIG and Federal University of Ouro Preto (UFOP), the IFMG for their financial support of this research and the CEFET-MG for their financial support of this research.
Data Availability Statement
We encourage all authors of articles published in MDPI journals to share their research data. In this section, please provide details regarding where data supporting reported results can be found, including links to publicly archived datasets analyzed or generated during the study. Where no new data were created, or where data is unavailable due to privacy or ethical restrictions, a statement is still required. Suggested Data Availability Statements are available in section “MDPI Research Data Policies” at https://www.mdpi.com/ethics.
Conflicts of Interest
The authors declare no conflicts of interest. The funders had no role in the design of the study; in the collection, analyses, or interpretation of data; in the writing of the manuscript; or in the decision to publish the results.
References
- Silva, M.M.; Assis, F.N.; Simonetti, H.L.; Freitas, M.S.R. Multi-material topology optimization of 2D structures using the SESO and SIMP method with reliability. Ibero-Latin American Congress on Computational Methods in Engineering 2024. [Google Scholar]
- Zuo, W.; Saitou, K. Multi-material topology optimization using ordered SIMP. Structural and Multidisciplinary Optimization 2016. [Google Scholar] [CrossRef]
- Silva, M.M.; Assis, F.N.; Simonetti, H.L.; Freitas, M.S.R. Reliability-Based Multi-Material 3D Topology Optimization: A Comparative Study Between SIMP and SESO Methods. Ibero-Latin American Congress on Computational Methods in Engineering 2025. [Google Scholar]
- Yu, D.; Wu, Y.; Zhao, Z.; Zhu, Q. Topology optimization method of truss structures considering length constraints. Structures 2025, 77. [Google Scholar] [CrossRef]
- Cool, V.; Aage, N.; Sigmund, O. A practical review on promoting connectivity in topology optimization. Structural and Multidisciplinary Optimization 2025, 68, 73. [Google Scholar] [CrossRef]
- Özcakar, E.; Simsek, U.; Kiziltas, G. Ordered multi-material SIMP approach applied to 3D topology optimization. Infinite Science 2021. [Google Scholar] [CrossRef]
- Renz, R.; Niklas, F.; Albert, A. Multi-Material Topology Optimization Taking into Account the Position of Material Interfaces in 3D. Applied Sciences 2025, 15, 7612. [Google Scholar] [CrossRef]
- Kundu, R.D.; Xiaojia, S.Z. Sustainability-oriented multimaterial topology optimization: designing efficient structures incorporating environmental effects. Structural and Multidisciplinary Optimization 2025, 17. [Google Scholar] [CrossRef]
- Gao, X.; Li, L.; Chen, J.; Li, Y. Robust topology optimization of multi-material structures with overhang angle constraints using the material field series-expansion method. Structures 2024, 69. [Google Scholar] [CrossRef]
- Silva, M.M.; Assis, F.N.; Simonetti, H.L.; Freitas, M.S.R. Automated Approach For Multi-objective Optimization Of Steel Trusses Using Genetic Algorithms and Reliability. XLIV Ibero-Latin American Congress on Computational Methods in Engineering 2023. [Google Scholar]
- Galambos, T.V.; Ellingwood, B.; Macgregor, J.G.; Cornell, C.A. Probability based load criteria: assessment of current design practice. Journal of the Structural Division 1982, 108, 959–977. [Google Scholar] [CrossRef]
- Bandyopadhyay, A.; Heer, B. Additive manufacturing of multi-material structures. Mater. Sci. Eng. R. Rep. 2018, 129, 1–16. [Google Scholar] [CrossRef]
- Han, D.; Lee, H. Recent advances in multi-material additive manufacturing: Methods and applications. Curr. Opin. Chem. Eng. 2020, 28, 158–166. [Google Scholar] [CrossRef]
- Wang, M.Y.; Wang, X. color level sets: A multi-phase method for structural topology optimization with multiple materials. Comput. Methods Appl. Mech. Eng. 2004, 193, 469–496. [Google Scholar] [CrossRef]
- Guo, X.; Zhang, W.; Zhong, W. Stress-related topology optimization of continuum structures involving multi-phase materials. Comput. Methods Appl. Mech. Eng. 2014, 268, 632–655. [Google Scholar] [CrossRef]
- Chu, S.; Gao, L.; Xiao, M.; Luo, Z.; Li, H. Stress-based multi-material topology optimization of compliant mechanisms. Int. J. Numer. Methods Eng. 2018, 113, 1021–1044. [Google Scholar] [CrossRef]
- Wang, Y.; Luo, Z.; Kang, Z.; Zhang, N. A multi-material level set-based topology and shape optimization method. Comput. Methods Appl. Mech. Eng. 2015, 283, 1570–1586. [Google Scholar] [CrossRef]
- Bendsøe, M.P.; Sigmund, O. Material interpolation schemes in topology optimization. Arch. Appl. Mech. 1999, 69, 635–654. [Google Scholar] [CrossRef]
- Tavakoli, R.; Mohseni, S.M. Alternating active-phase algorithm for multimaterial topology optimization problems: A 115-line MATLAB implementation. Struct. Multidiscip. Optim. 2014, 49, 621–642. [Google Scholar] [CrossRef]
- Huang, X.; Xie, Y.M. Bi-directional evolutionary topology optimization of continuum structures with one or multiple materials. Comput. Mech. 2009, 43, 393–401. [Google Scholar] [CrossRef]
- Zheng, R.; Yi, B.; Peng, X.; Yoon, G.-H. An Efficient Code for the Multi-Material Topology Optimization of 2D/3D Continuum Structures Written in Matlab. Appl. Sci. 2024, 14, 657. [Google Scholar] [CrossRef]
- Simonetti, H.L.; Neves, F.d.A.d.; Almeida, V.S.; Silva, M.M.d.; Neto, L.d.O. Three-Dimensional Multi-Material Topology Optimization: Applying a New Mapping-Based Projection Function. Materials 2025, 18, 997. [Google Scholar] [CrossRef]
- Azevêdo, A.S.D.C.; Moscatelli, E.; Ribeiro, L.N.B.S.; Sá, L.F.N.D.; Silva, E.C.N.; Picelli, R. A multi-objective function for discrete topology optimization in labyrinth seal design problems. Advances in Engineering Software 2025, 204, 103. [Google Scholar] [CrossRef]
- Zhang, L.; Alizadeh, A.A.; Baghoolizadeh, M.; Salahshour, S.; Ali, E.; Escorcia-Gutierrez, J. Multi-objective optimization of vertical and horizontal solar shading in residential buildings to increase power output while reducing yearly electricity usage. Renewable and Sustainable Energy Reviews 2025, 215, 115578. [Google Scholar] [CrossRef]
- Chen, Y.; Xiao, Z.; Yang, Y.; Wang, H.; Wang, H.; Bi, Y. Multi-objective optimization for impact resistance of composite laminates with non-conventional ply orientations: An integrated finite element and machine learning framework. Thin-Walled Structures 2025, 113687. [Google Scholar] [CrossRef]
- Simonetti, H.L.; Almeida, V.S.; Oliveira, N.L. A smooth evolutionary structural optimization procedure applied to plane stress problem. Engineering Structures 2014. [Google Scholar] [CrossRef]
- Rao, S.S. Engineering Optimization.; Coral GablesCoral Gables; wiley: Florida, 2020. [Google Scholar]
- Pareto, V. Cours D’ Economie Politique. F. Rouge, 1896.
- Simonetti, H.L.; Assis, F.N.; Valerio, S.A. Multiobjective topology optimization with stress and strain energy criteria using the SESO method and a Multicriteria Tournament Decision. Structures 2021, 30. [Google Scholar] [CrossRef]
- Xu, Y.; Ma, Z.; Lin, W. Multi-objective topology optimization and mechanical performance of AMAH joints in spatial structures. Journal of Constructional Steel Research 2024, 226, 109294. [Google Scholar] [CrossRef]
- Yin, Q.; Guo, J.; Kan, Y.; Ma, J.; Deng, C. Multi-Objective Topology Optimization of Thin-Plate Structures Based on the Stiffener Size and Layout. Electronics 2024, 13, 4968. [Google Scholar] [CrossRef]
- Crescenti, F.; Kipouros, T.; Munk, D.J.; Savill, M.A. Generating minimal Pareto sets in multi-objective topology optimisation: an application to the wing box structural layout. Structural and Multidisciplinary Optimization 2021, 63, 1119–1134. [Google Scholar] [CrossRef]
- Coello, C.A.C.; Lamont, G.B.; Veldhuizen, D.A.V. Evolutionary algorithms for solving multi-objective problems. In Applications; Springer US: Boston, MA, 2007. [Google Scholar] [CrossRef]
- da Silva, G.A.; Beck, A.T.; Cardoso, E.L. Topology Optimization of continuum structures with stress constraints and uncertainties in loading. International Journal for Numerical Methods in Engineering 2017, 113. [Google Scholar] [CrossRef]
- Simonetti, H.L.; Almeida, V.S.; Neves, F.A.; Azar, S.Z.; Silva, M.M. BESO and SESO: Comparative Analysis of Spatial Structures Considering Self-Weight and Structural Reliability. Applied Sciences-Basel 2024, 14, 6465. [Google Scholar] [CrossRef]
- Simonetti, H.L.; Almeida, V.S.; Neves, F.A.; Del, D.A.V.; Oliveira, N.L. Reliability-Based Topology Optimization: An Extension of the SESO and SERA Methods for Three-Dimensional Structures. Applied Sciences 2022. [Google Scholar] [CrossRef]
- Melchers, R.E.; Beck, A.T. Structural Reliability Analysis and Prediction, 3rd ed.; Sons, John Wiley: Hoboken, 2018; p. 506. [Google Scholar] [CrossRef]
- Hasofer, A.M.; Lind, N.C. Exact and invariant second moment code format. Journal of the engineering mechanics division 1974, 100, 111–121. [Google Scholar] [CrossRef]
- Haldar, A.; Mahadevan, S. Probability, Reliability and Statistical Methods in Engineering Design; John Wiley & Sons: USA, 2000. [Google Scholar]
- Rosowsky, D.V. Structural Reliability; LLC, CRC Press: Boca Raton, 1999. [Google Scholar] [CrossRef]
- Rackwitz, R.; Fiessler, B. Structural reliability under random load sequences. Comput. Struct 1978, 484–494. [Google Scholar] [CrossRef]
- Sigmund, O. A 99 line topology optimization code written in Matlab. Structural and Multidisciplinary Optimization 2001, 21, 120–127. [Google Scholar] [CrossRef]
- Belytschko, T.; Xiao, S.P.; Parimi, C. Topology optimization with implicit functions and regularization. International Journal for Numerical Methods in Engineering 2003, 57, 1177–1196. [Google Scholar] [CrossRef]
Figure 1.
Pareto Frontier: 19-bar Truss (Silva et al. 2023).
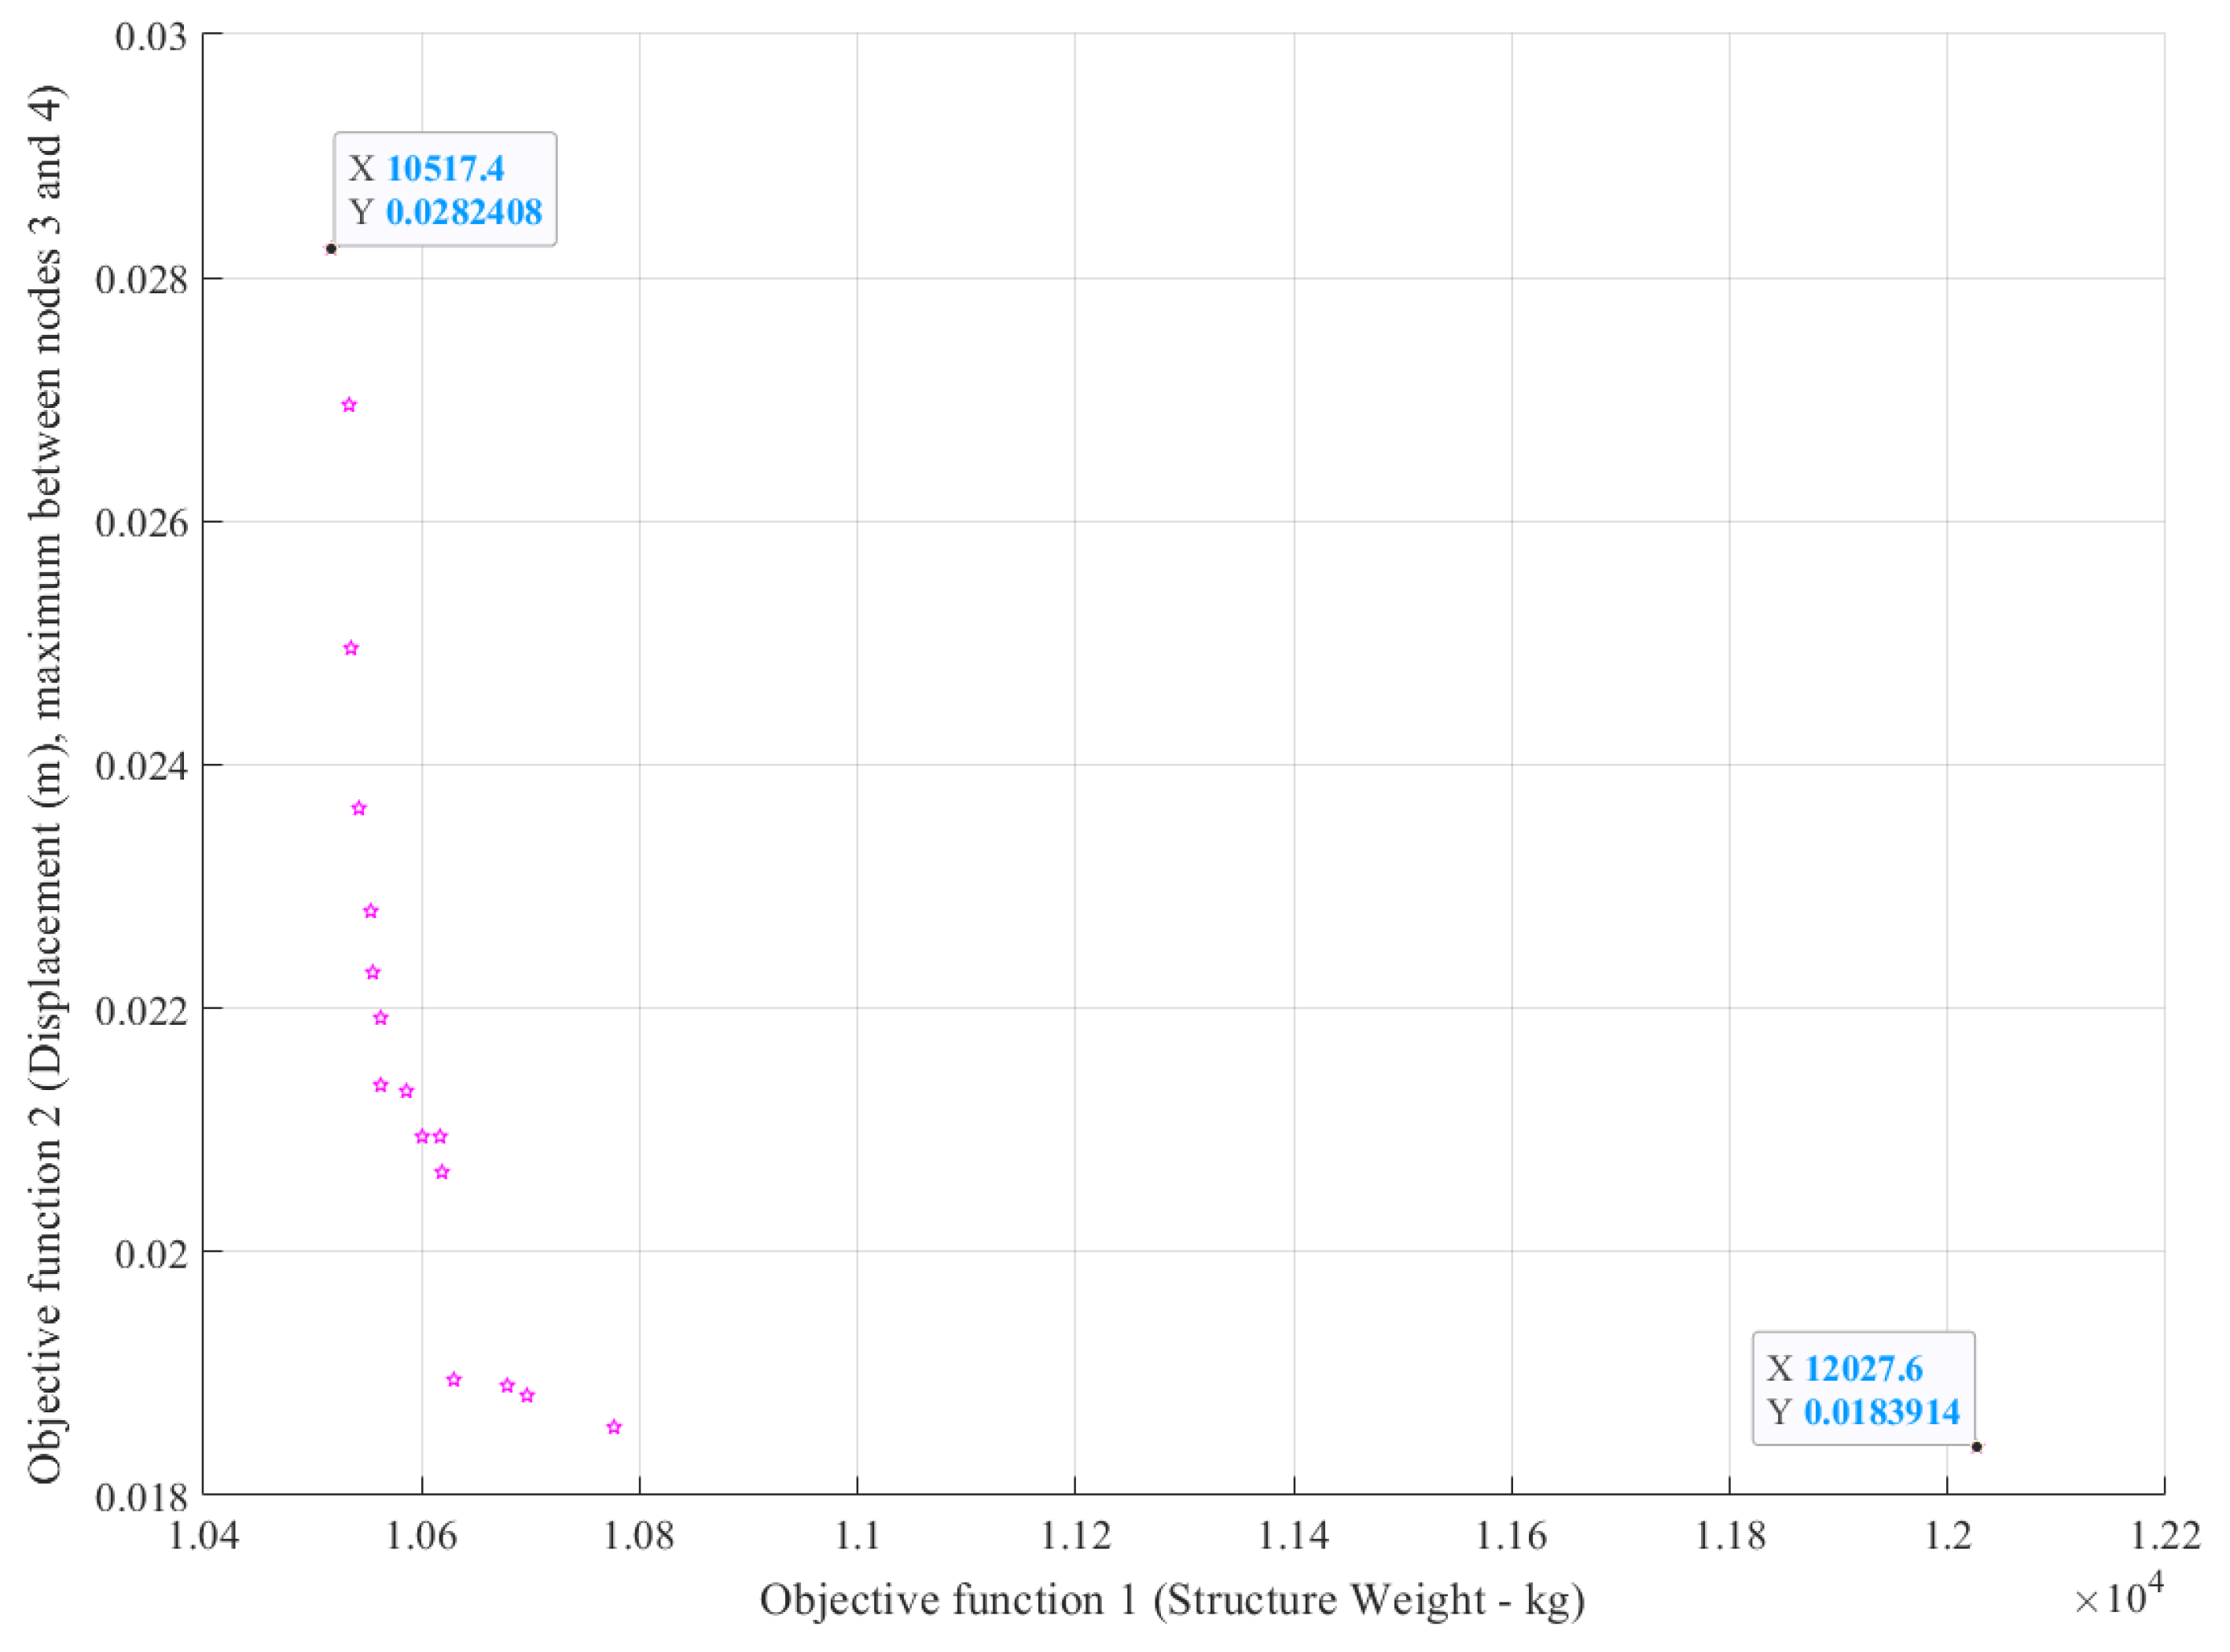
Figure 2.
Pareto Frontier: dominated and non-dominated solutions.
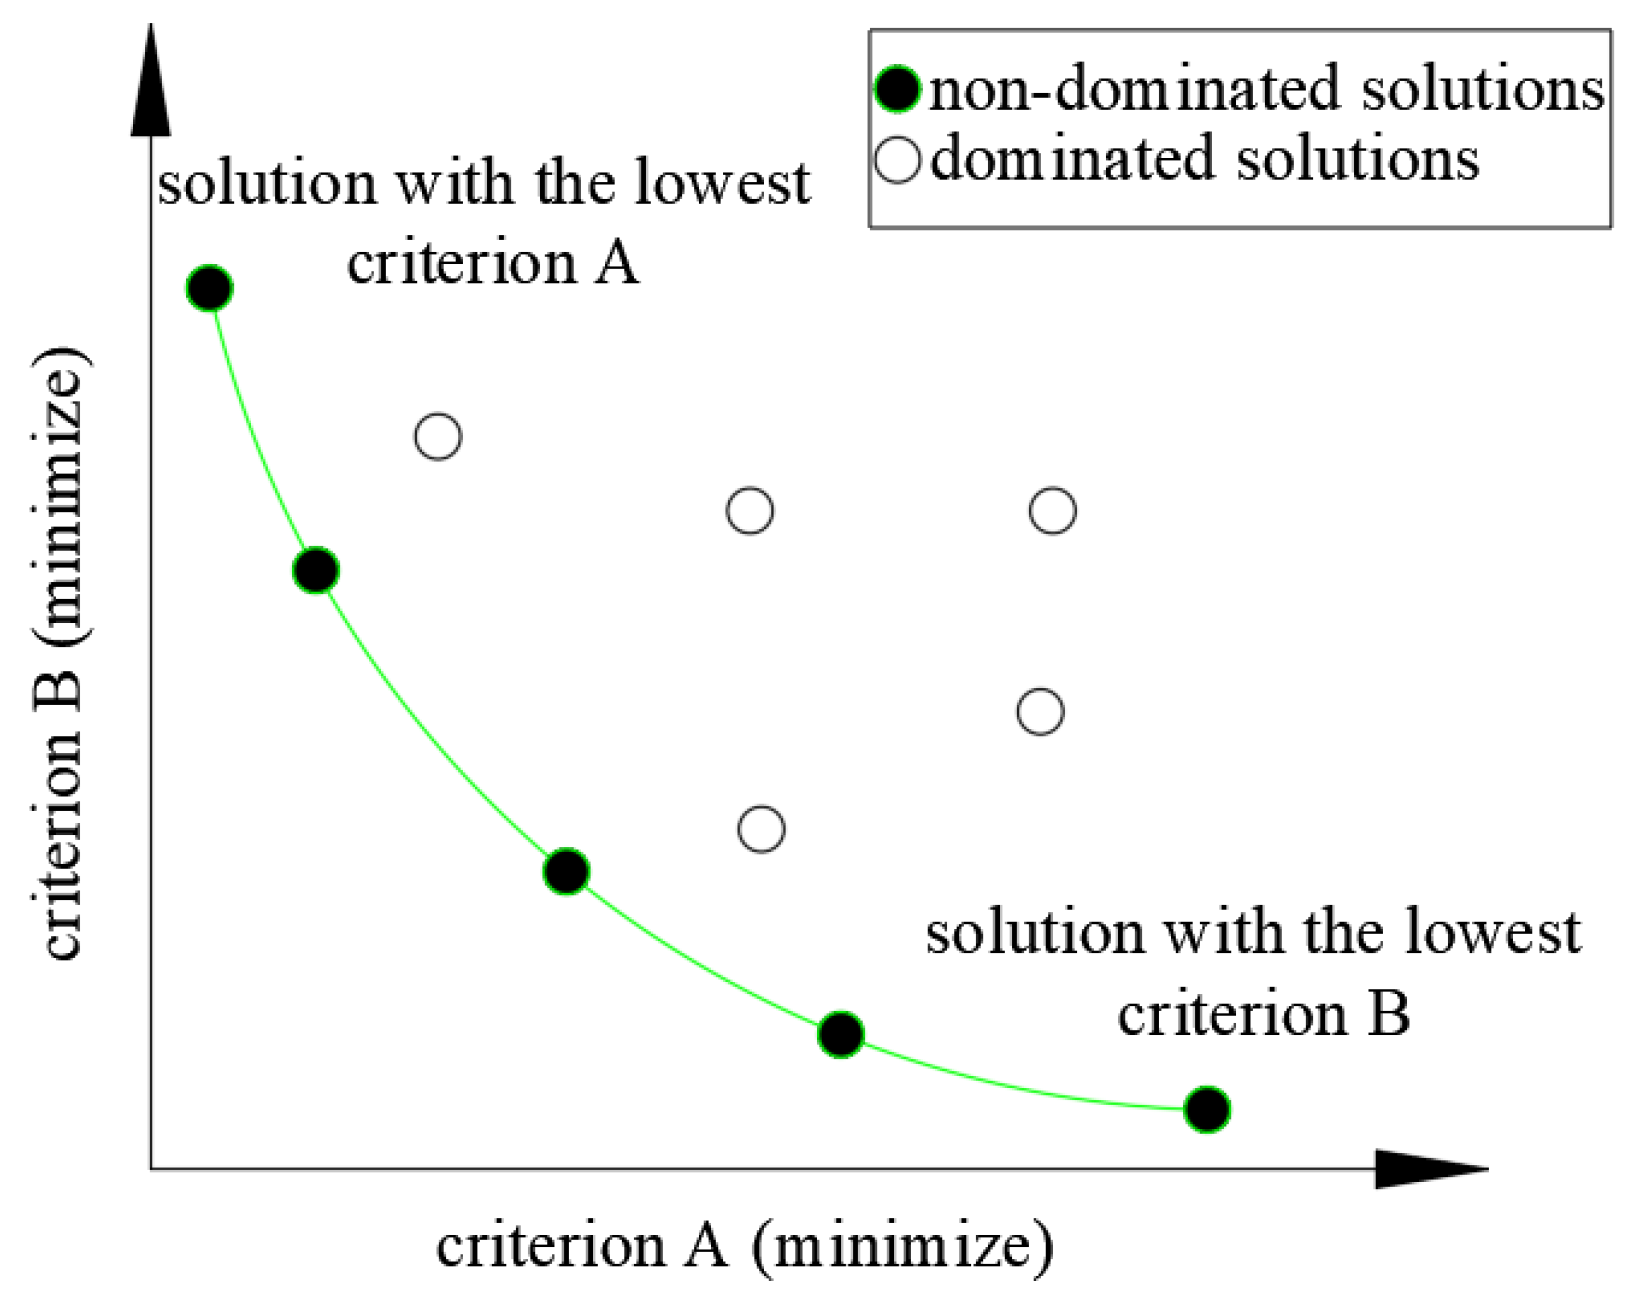
Figure 3.
Design domain and boundary conditions.
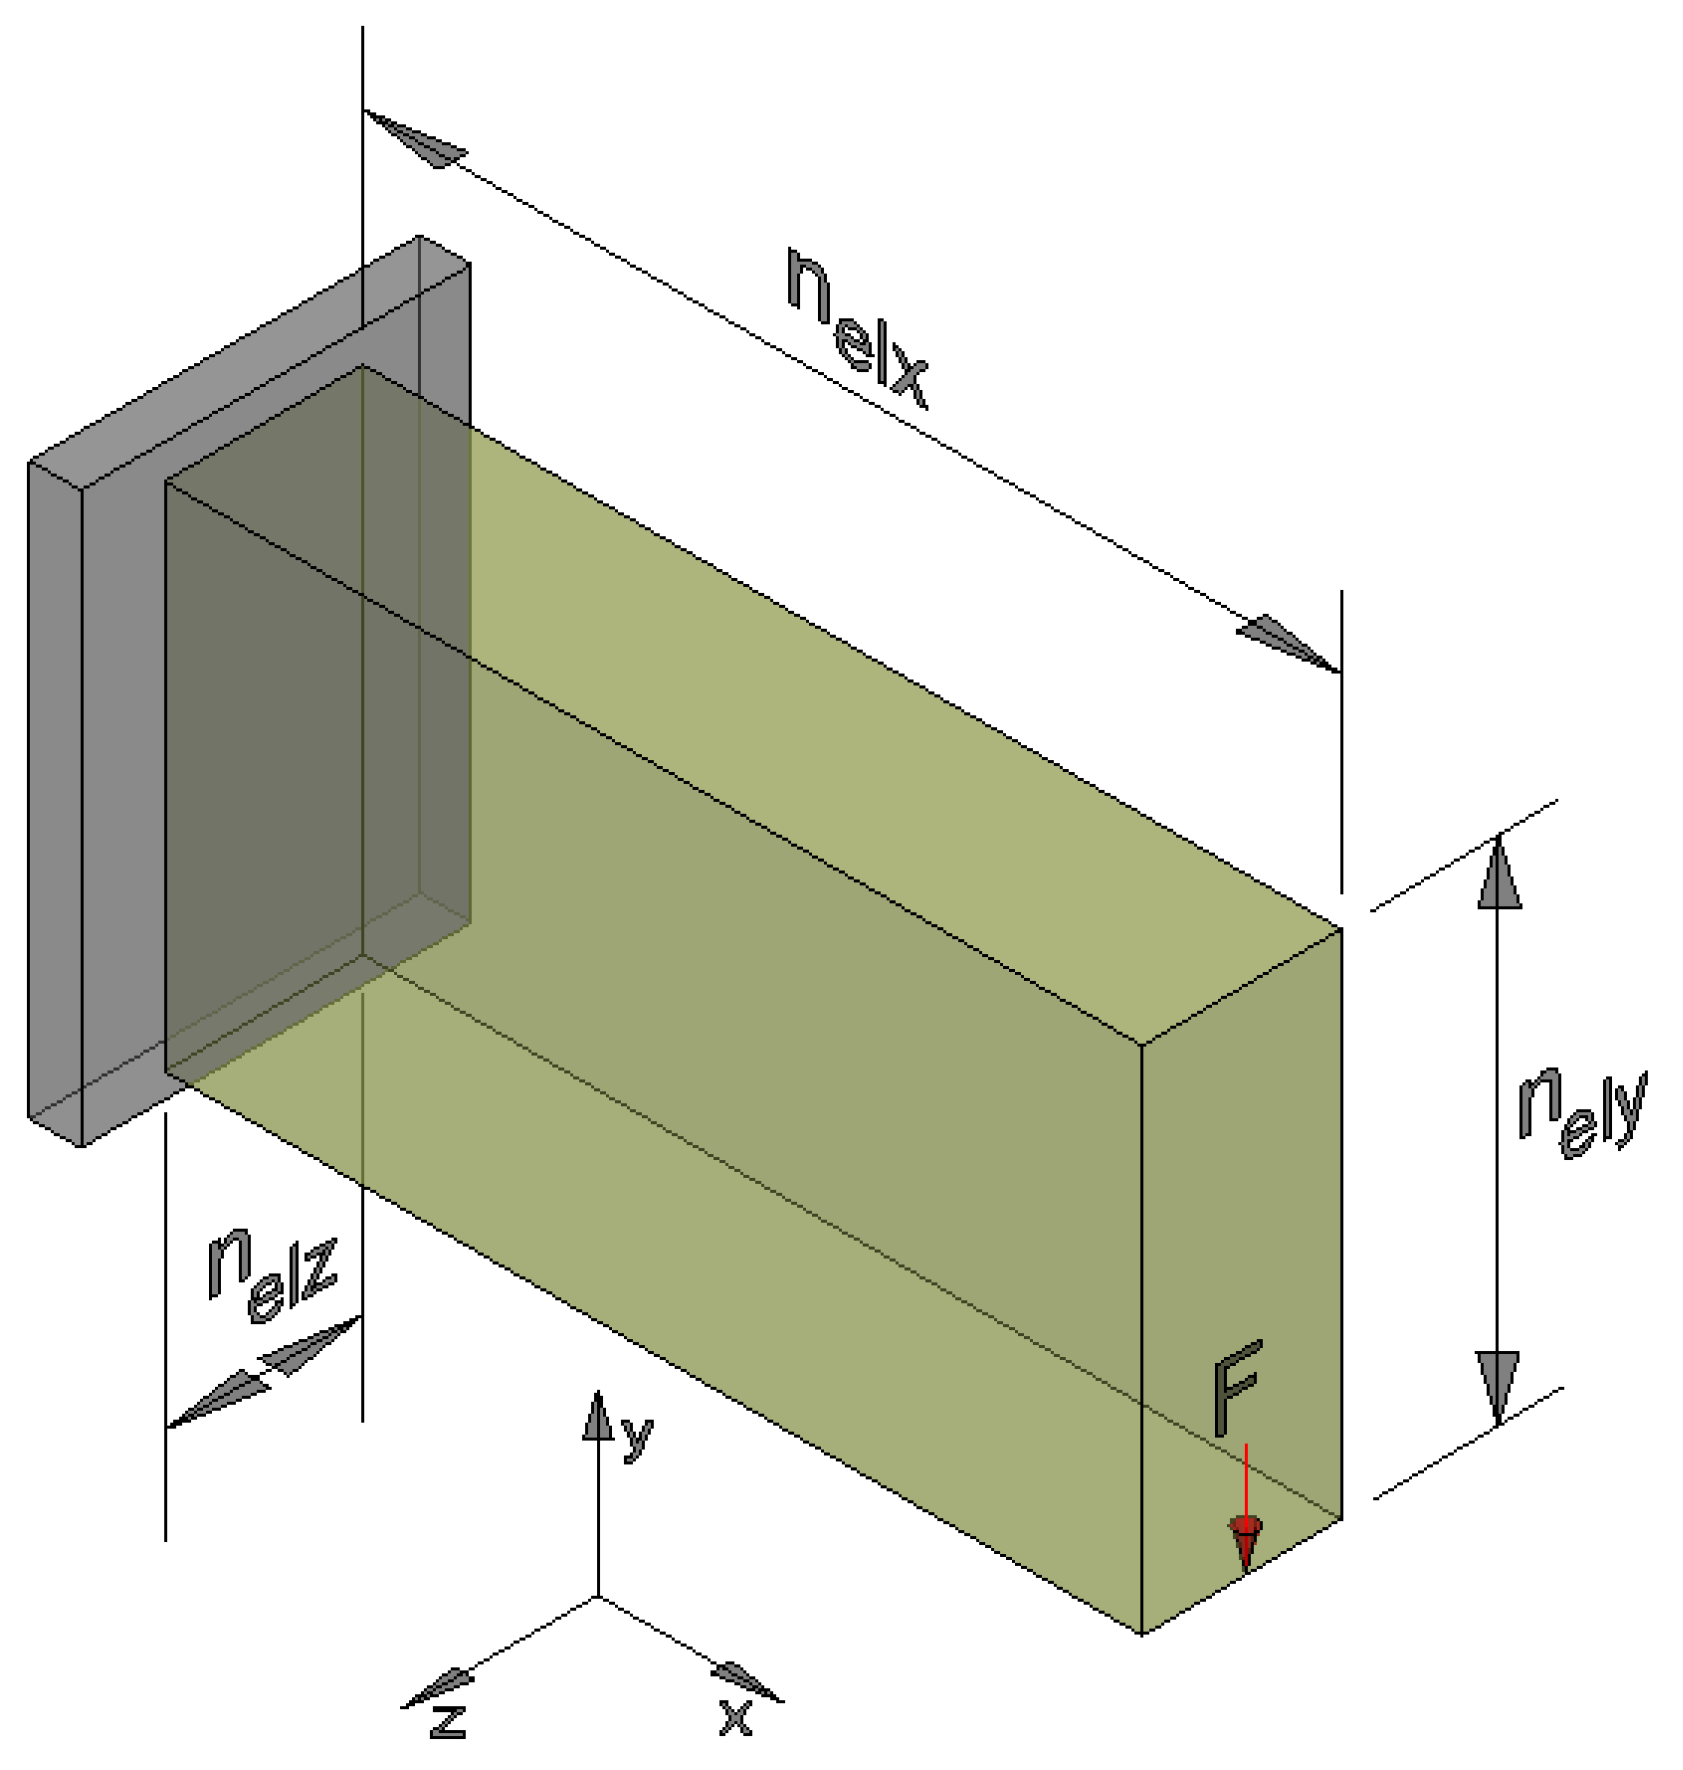
Figure 4.
Optimal configurations: (a) SESO-DTO (b) SESO-FORM () (c) SESO – FORM ().
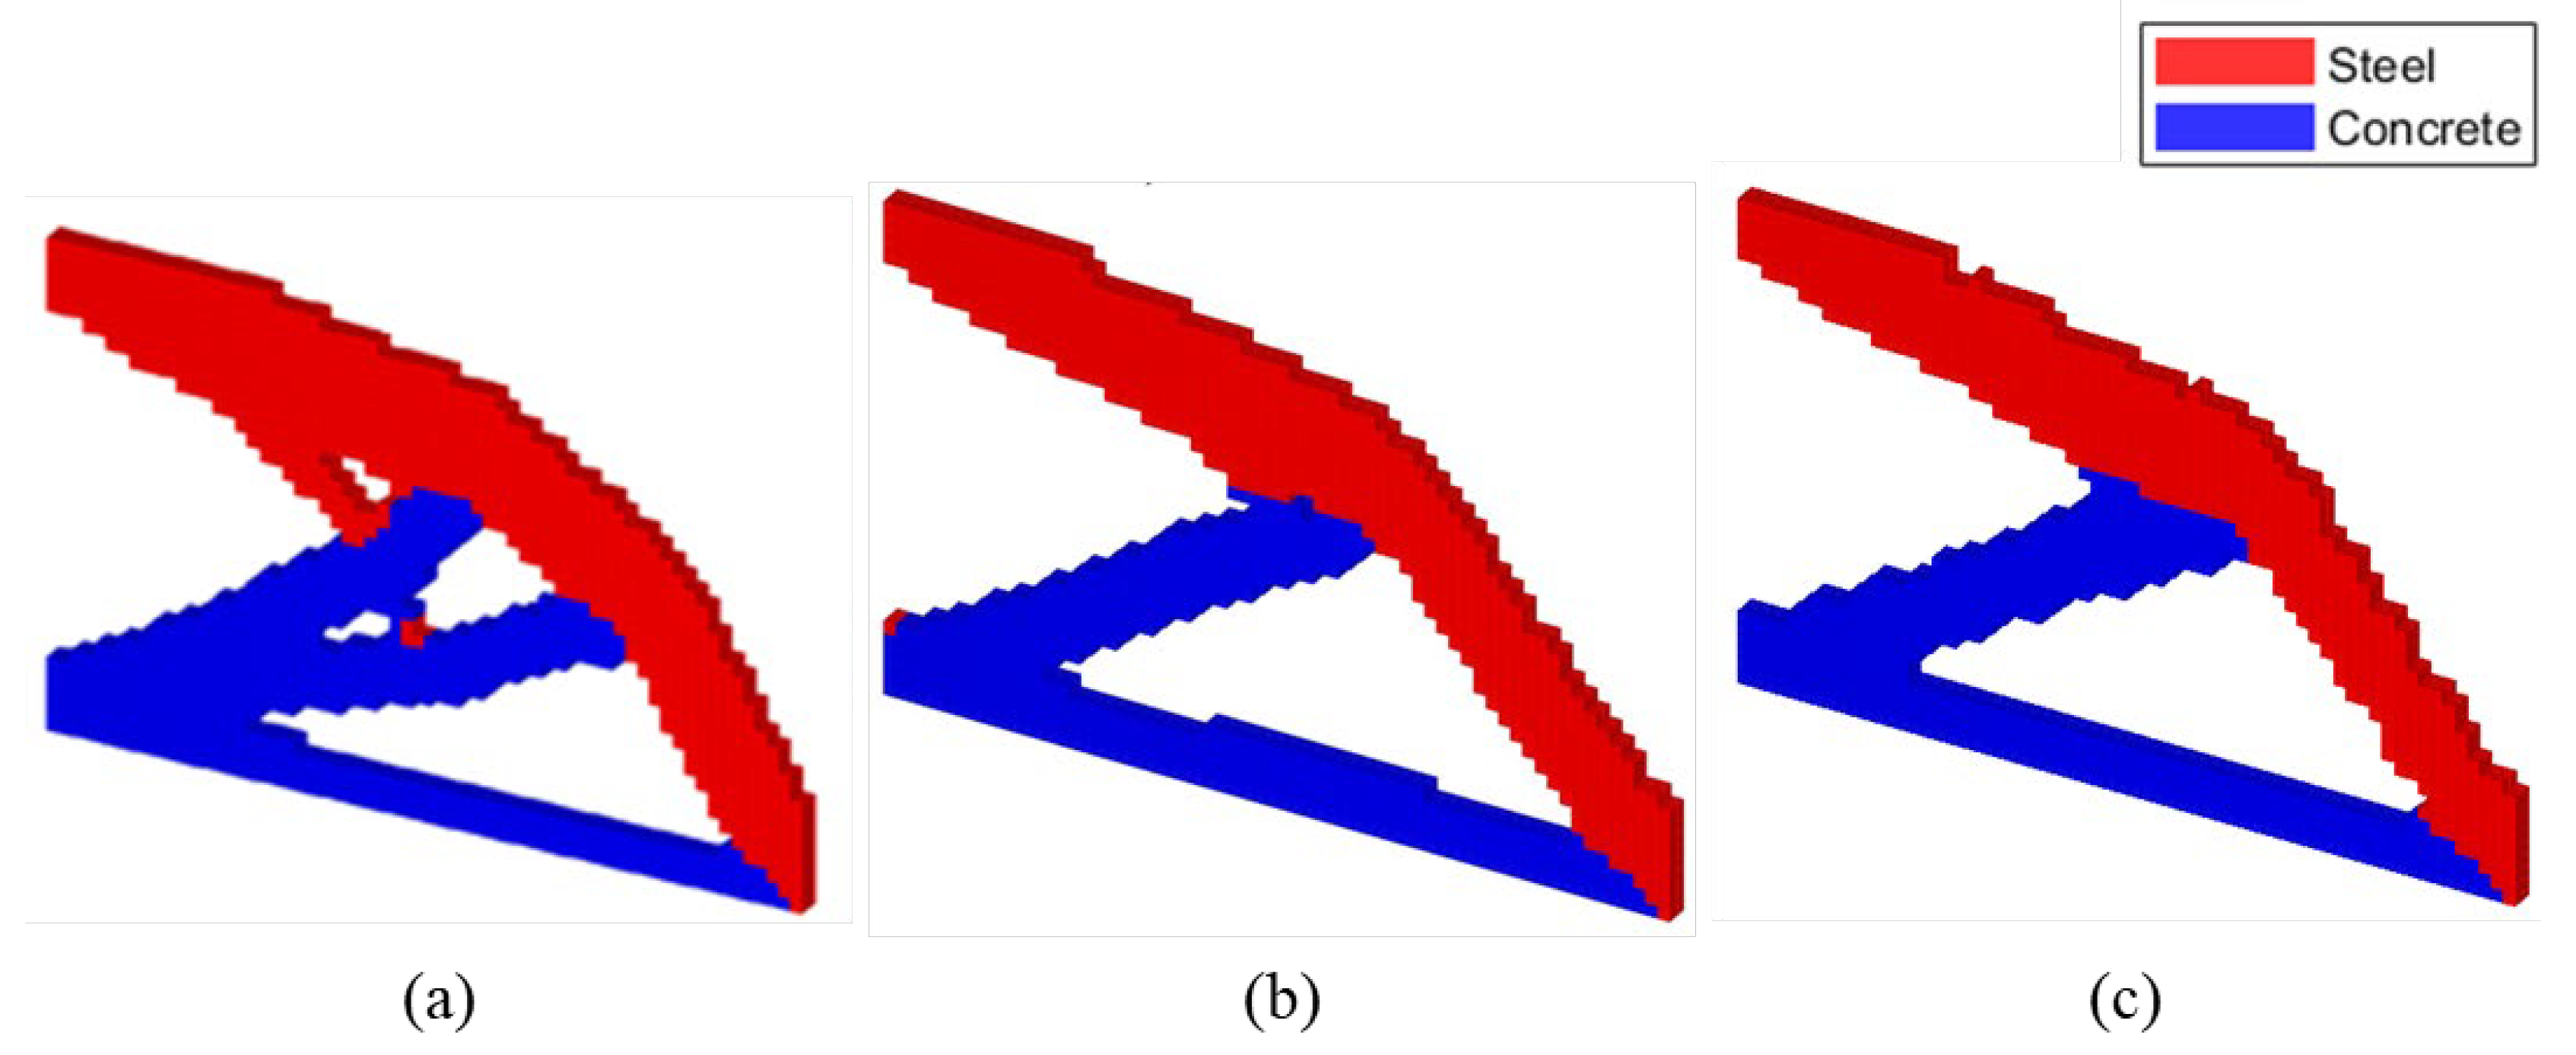
Figure 5.
Pareto Frontier: Optimal SESO-DTO.
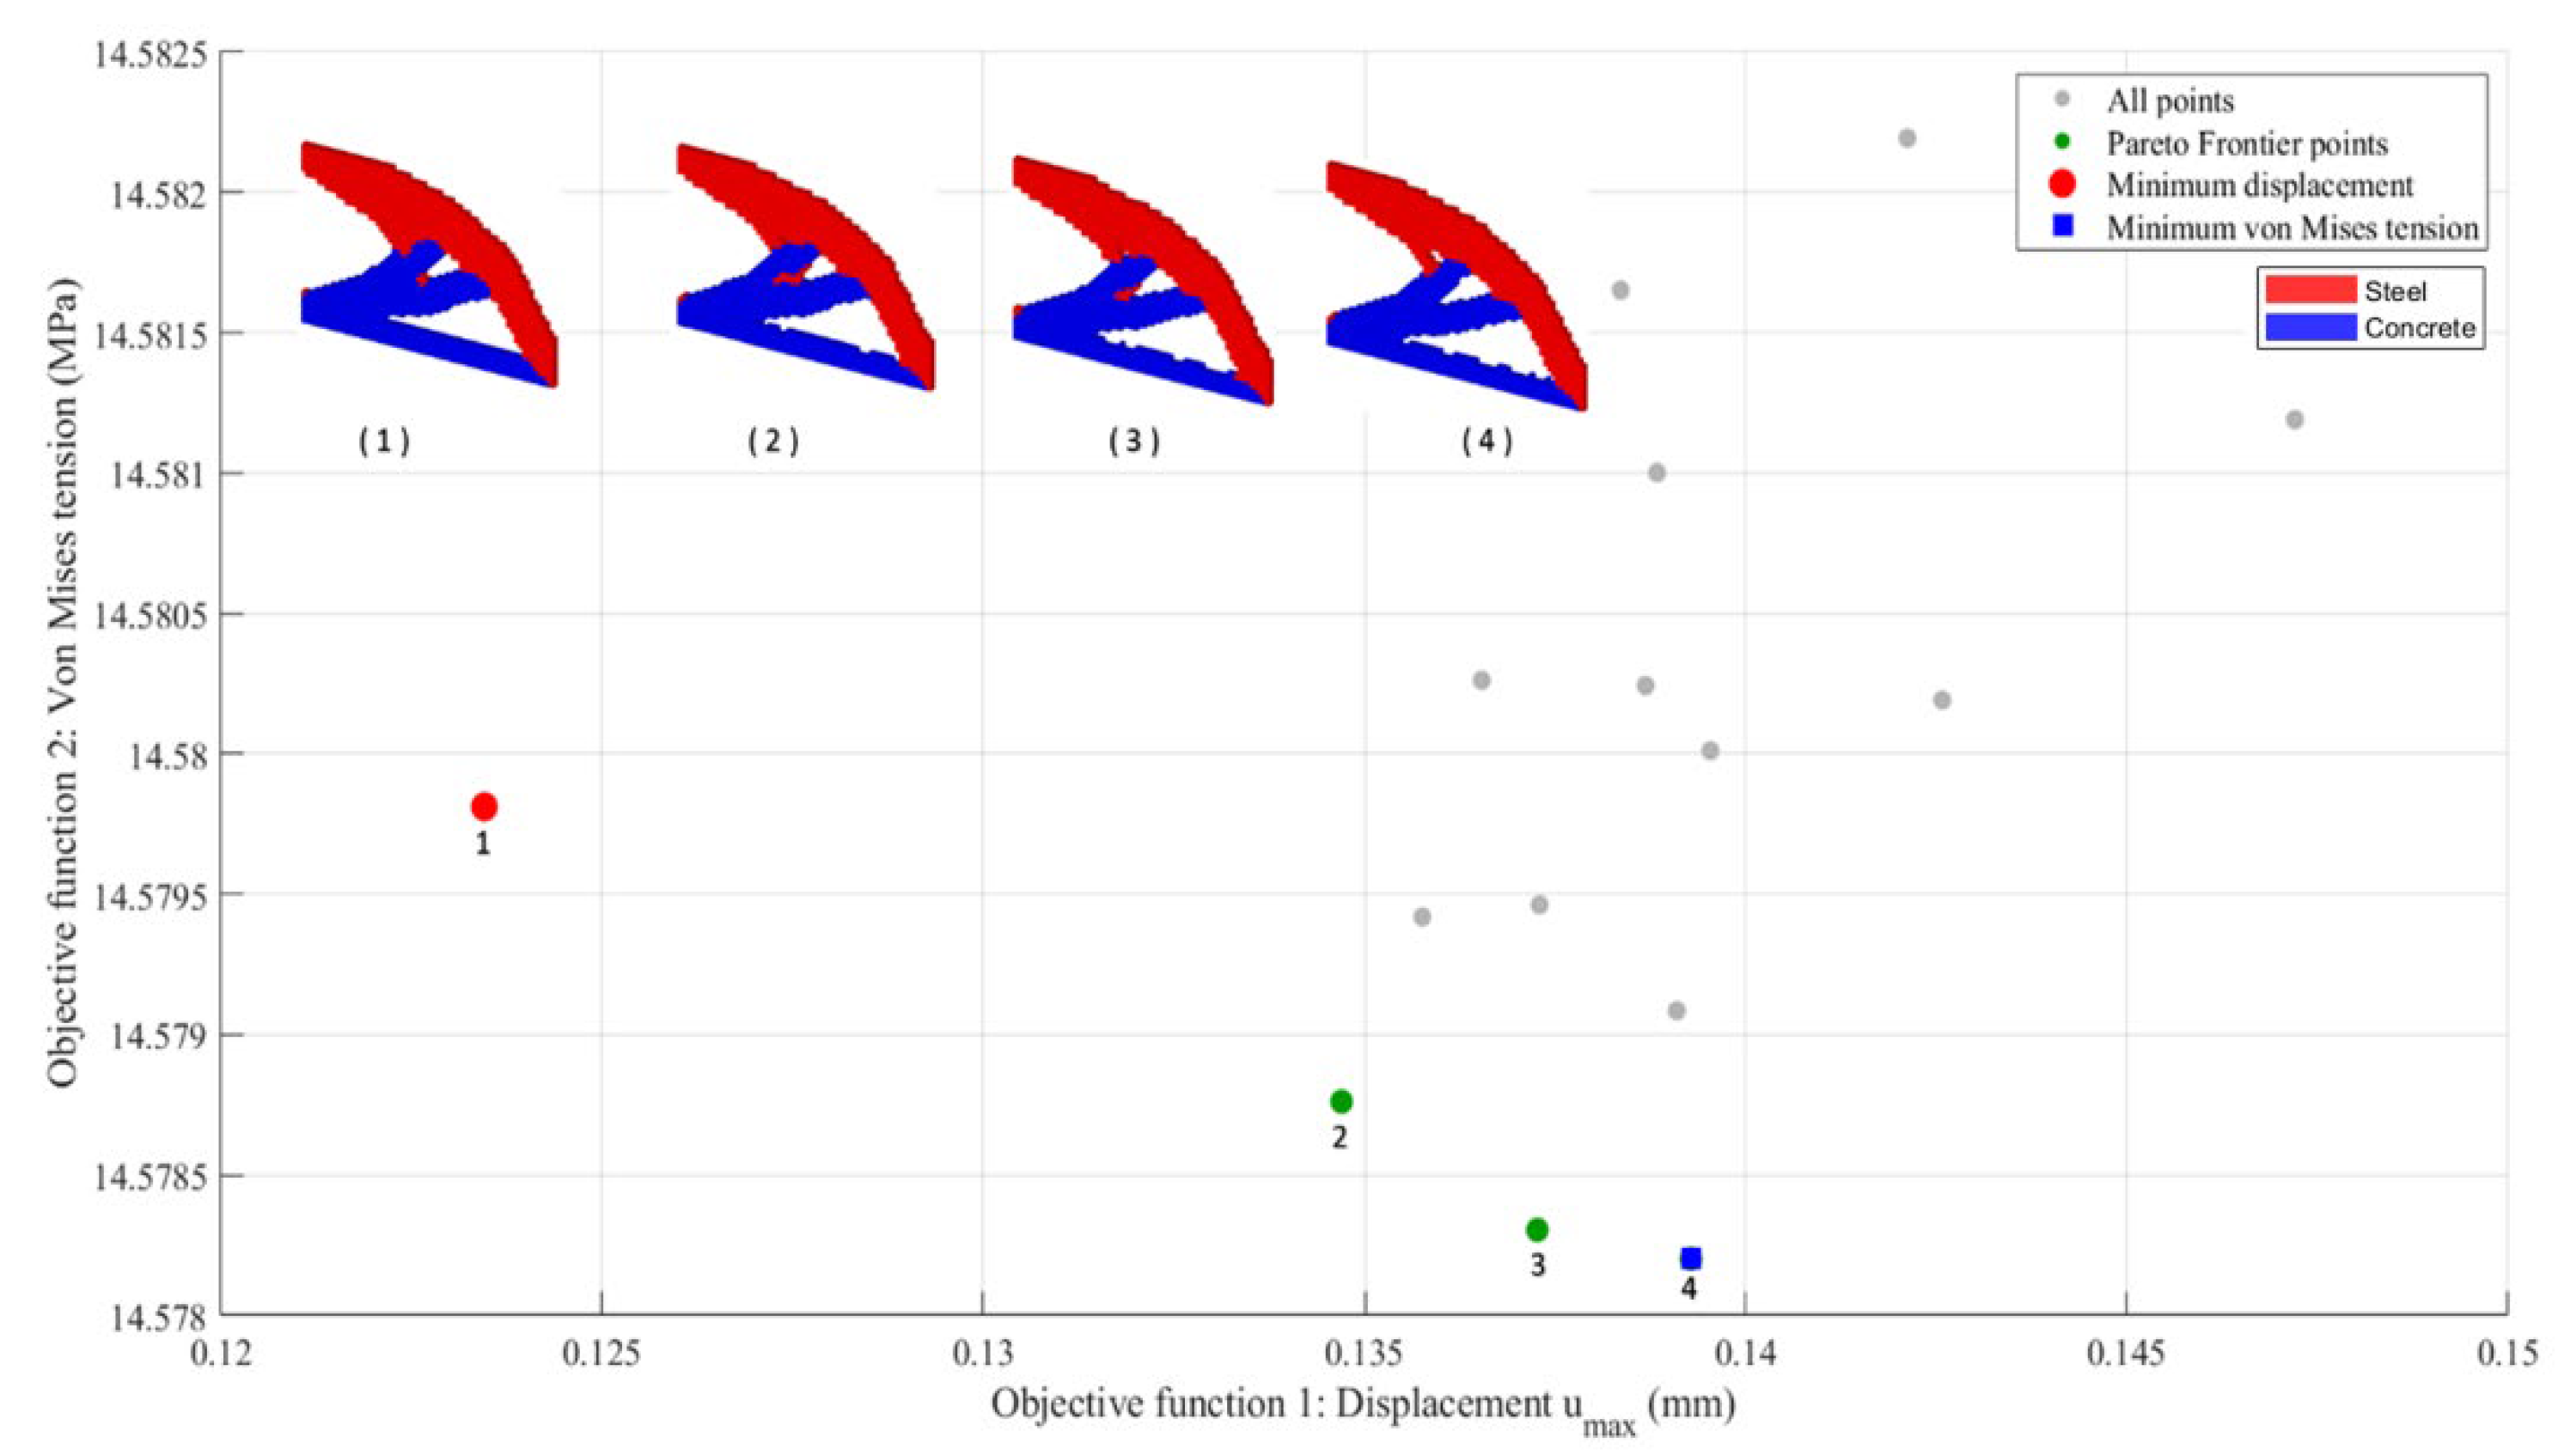
Figure 6.
Pareto Frontier: Optimal SESO-FORM ().
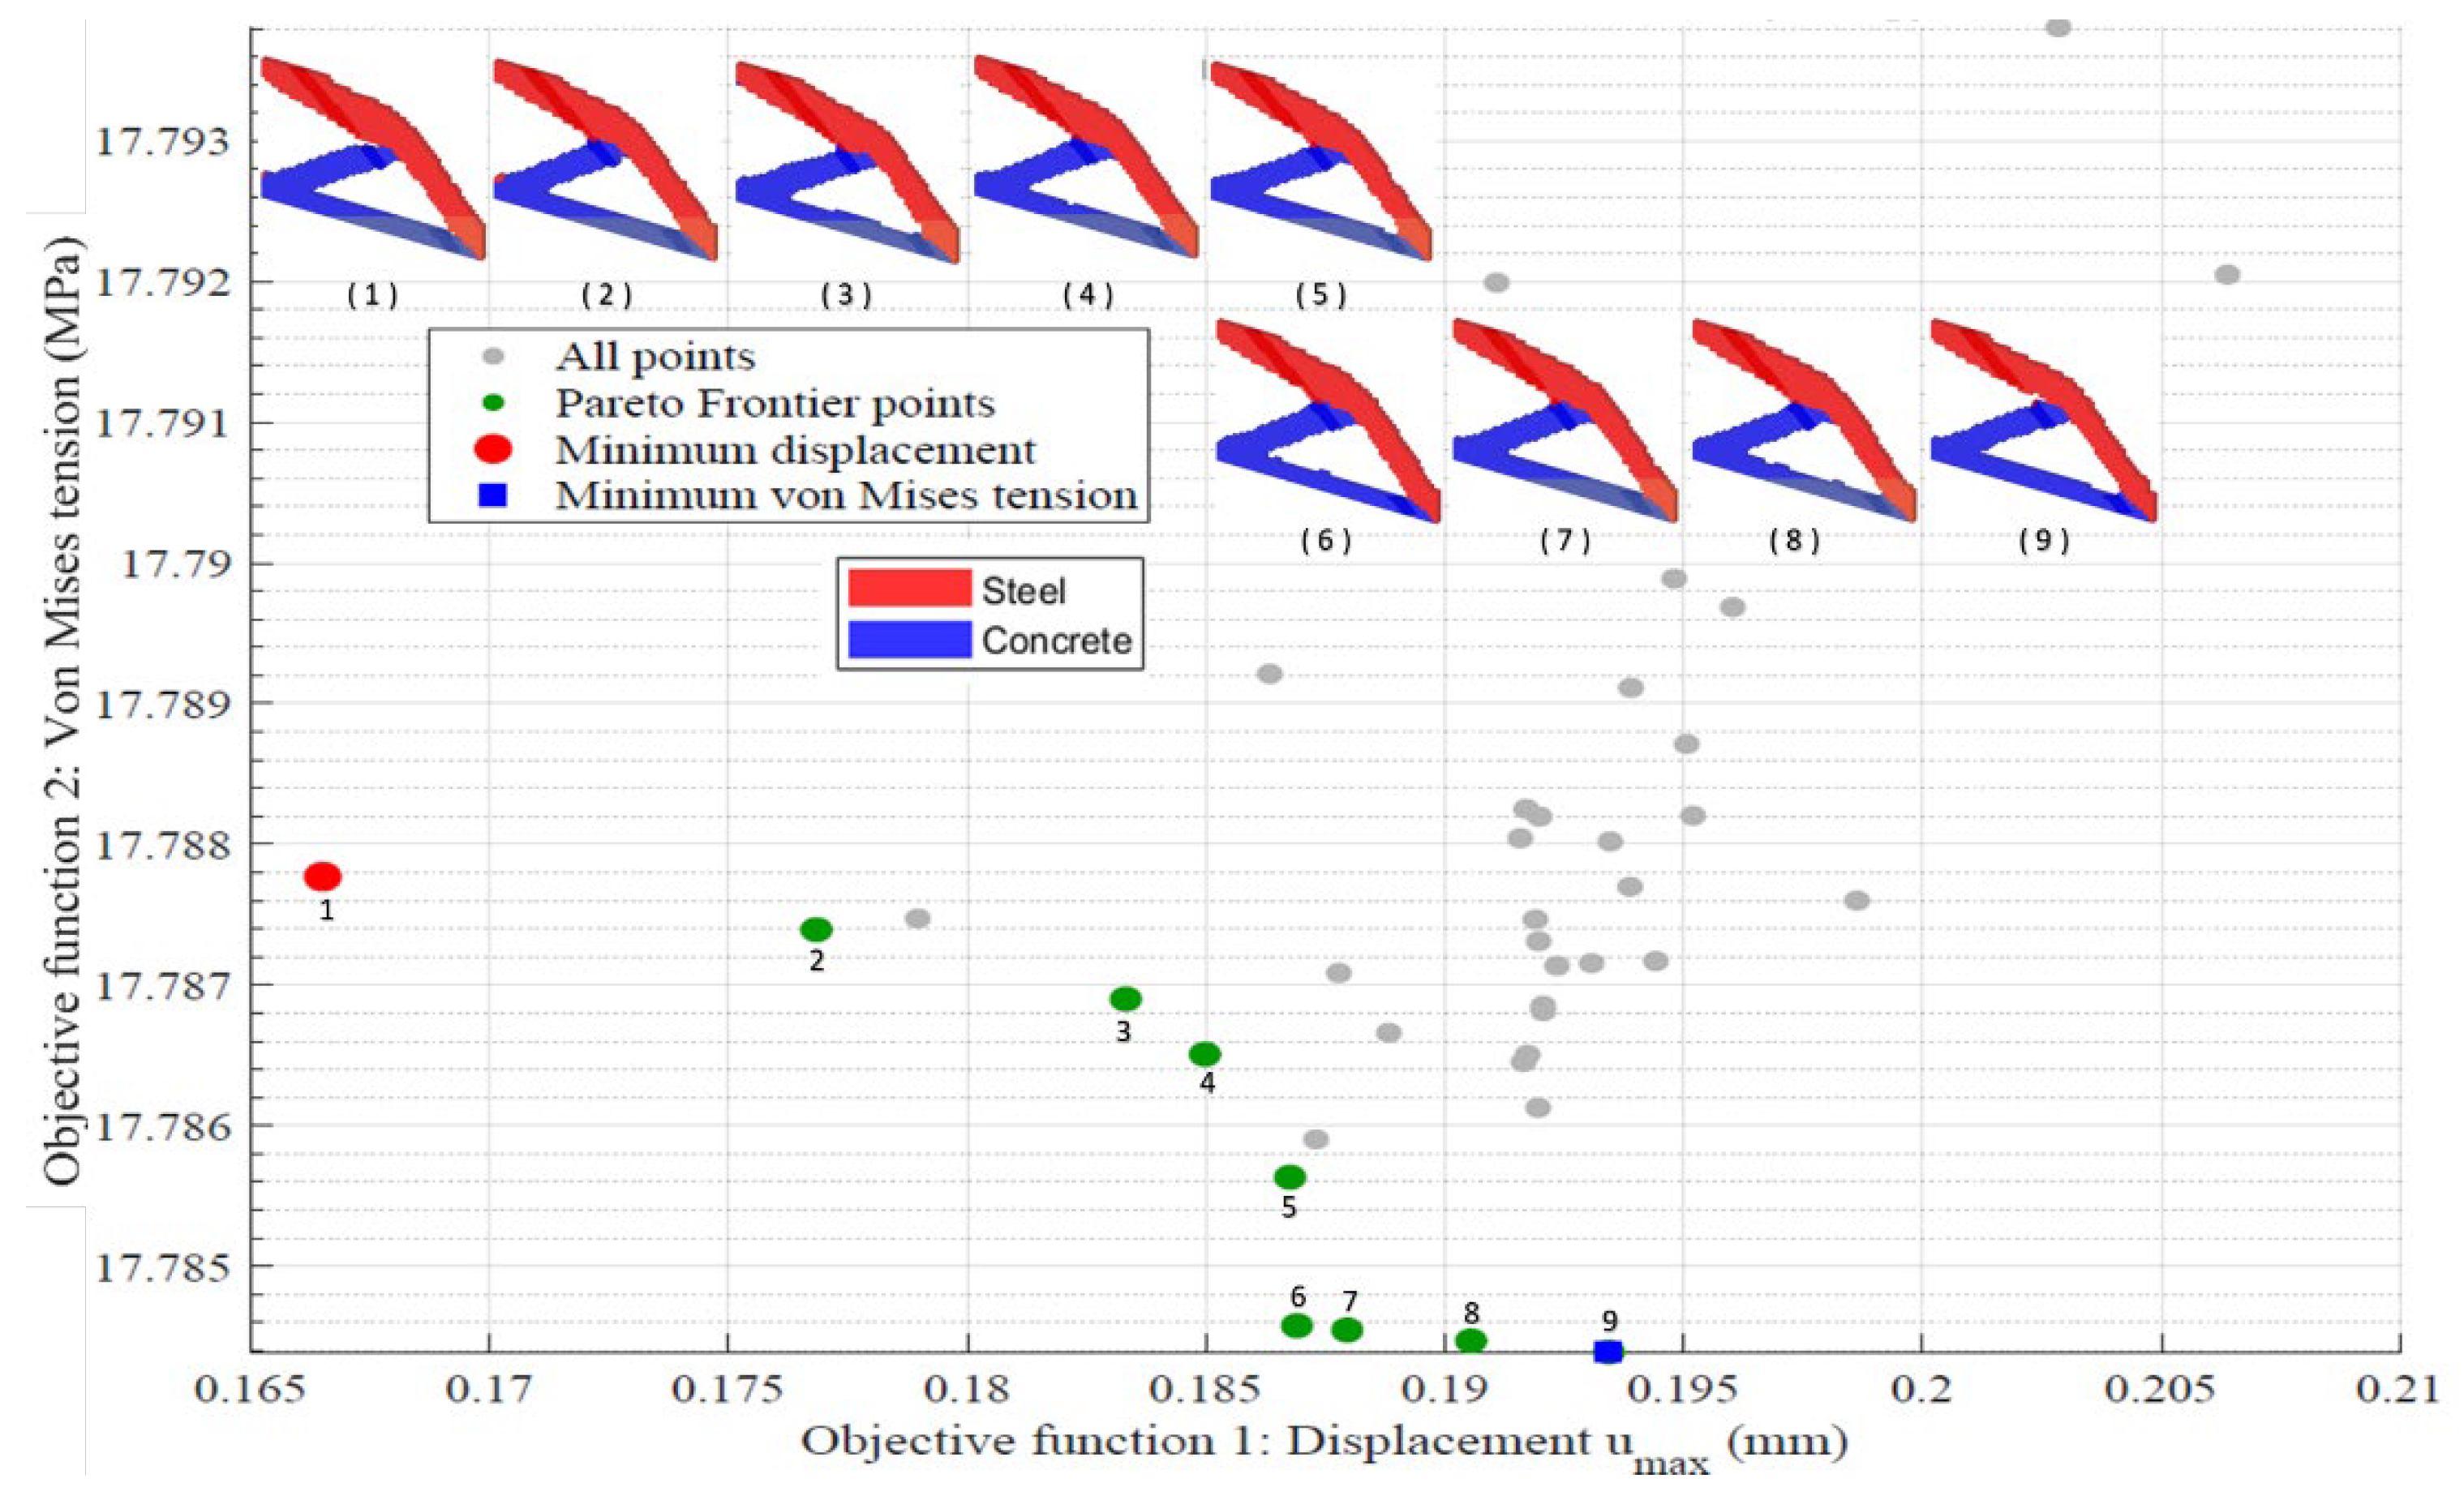
Figure 7.
Pareto Frontier: Optimal SESO-FORM ().
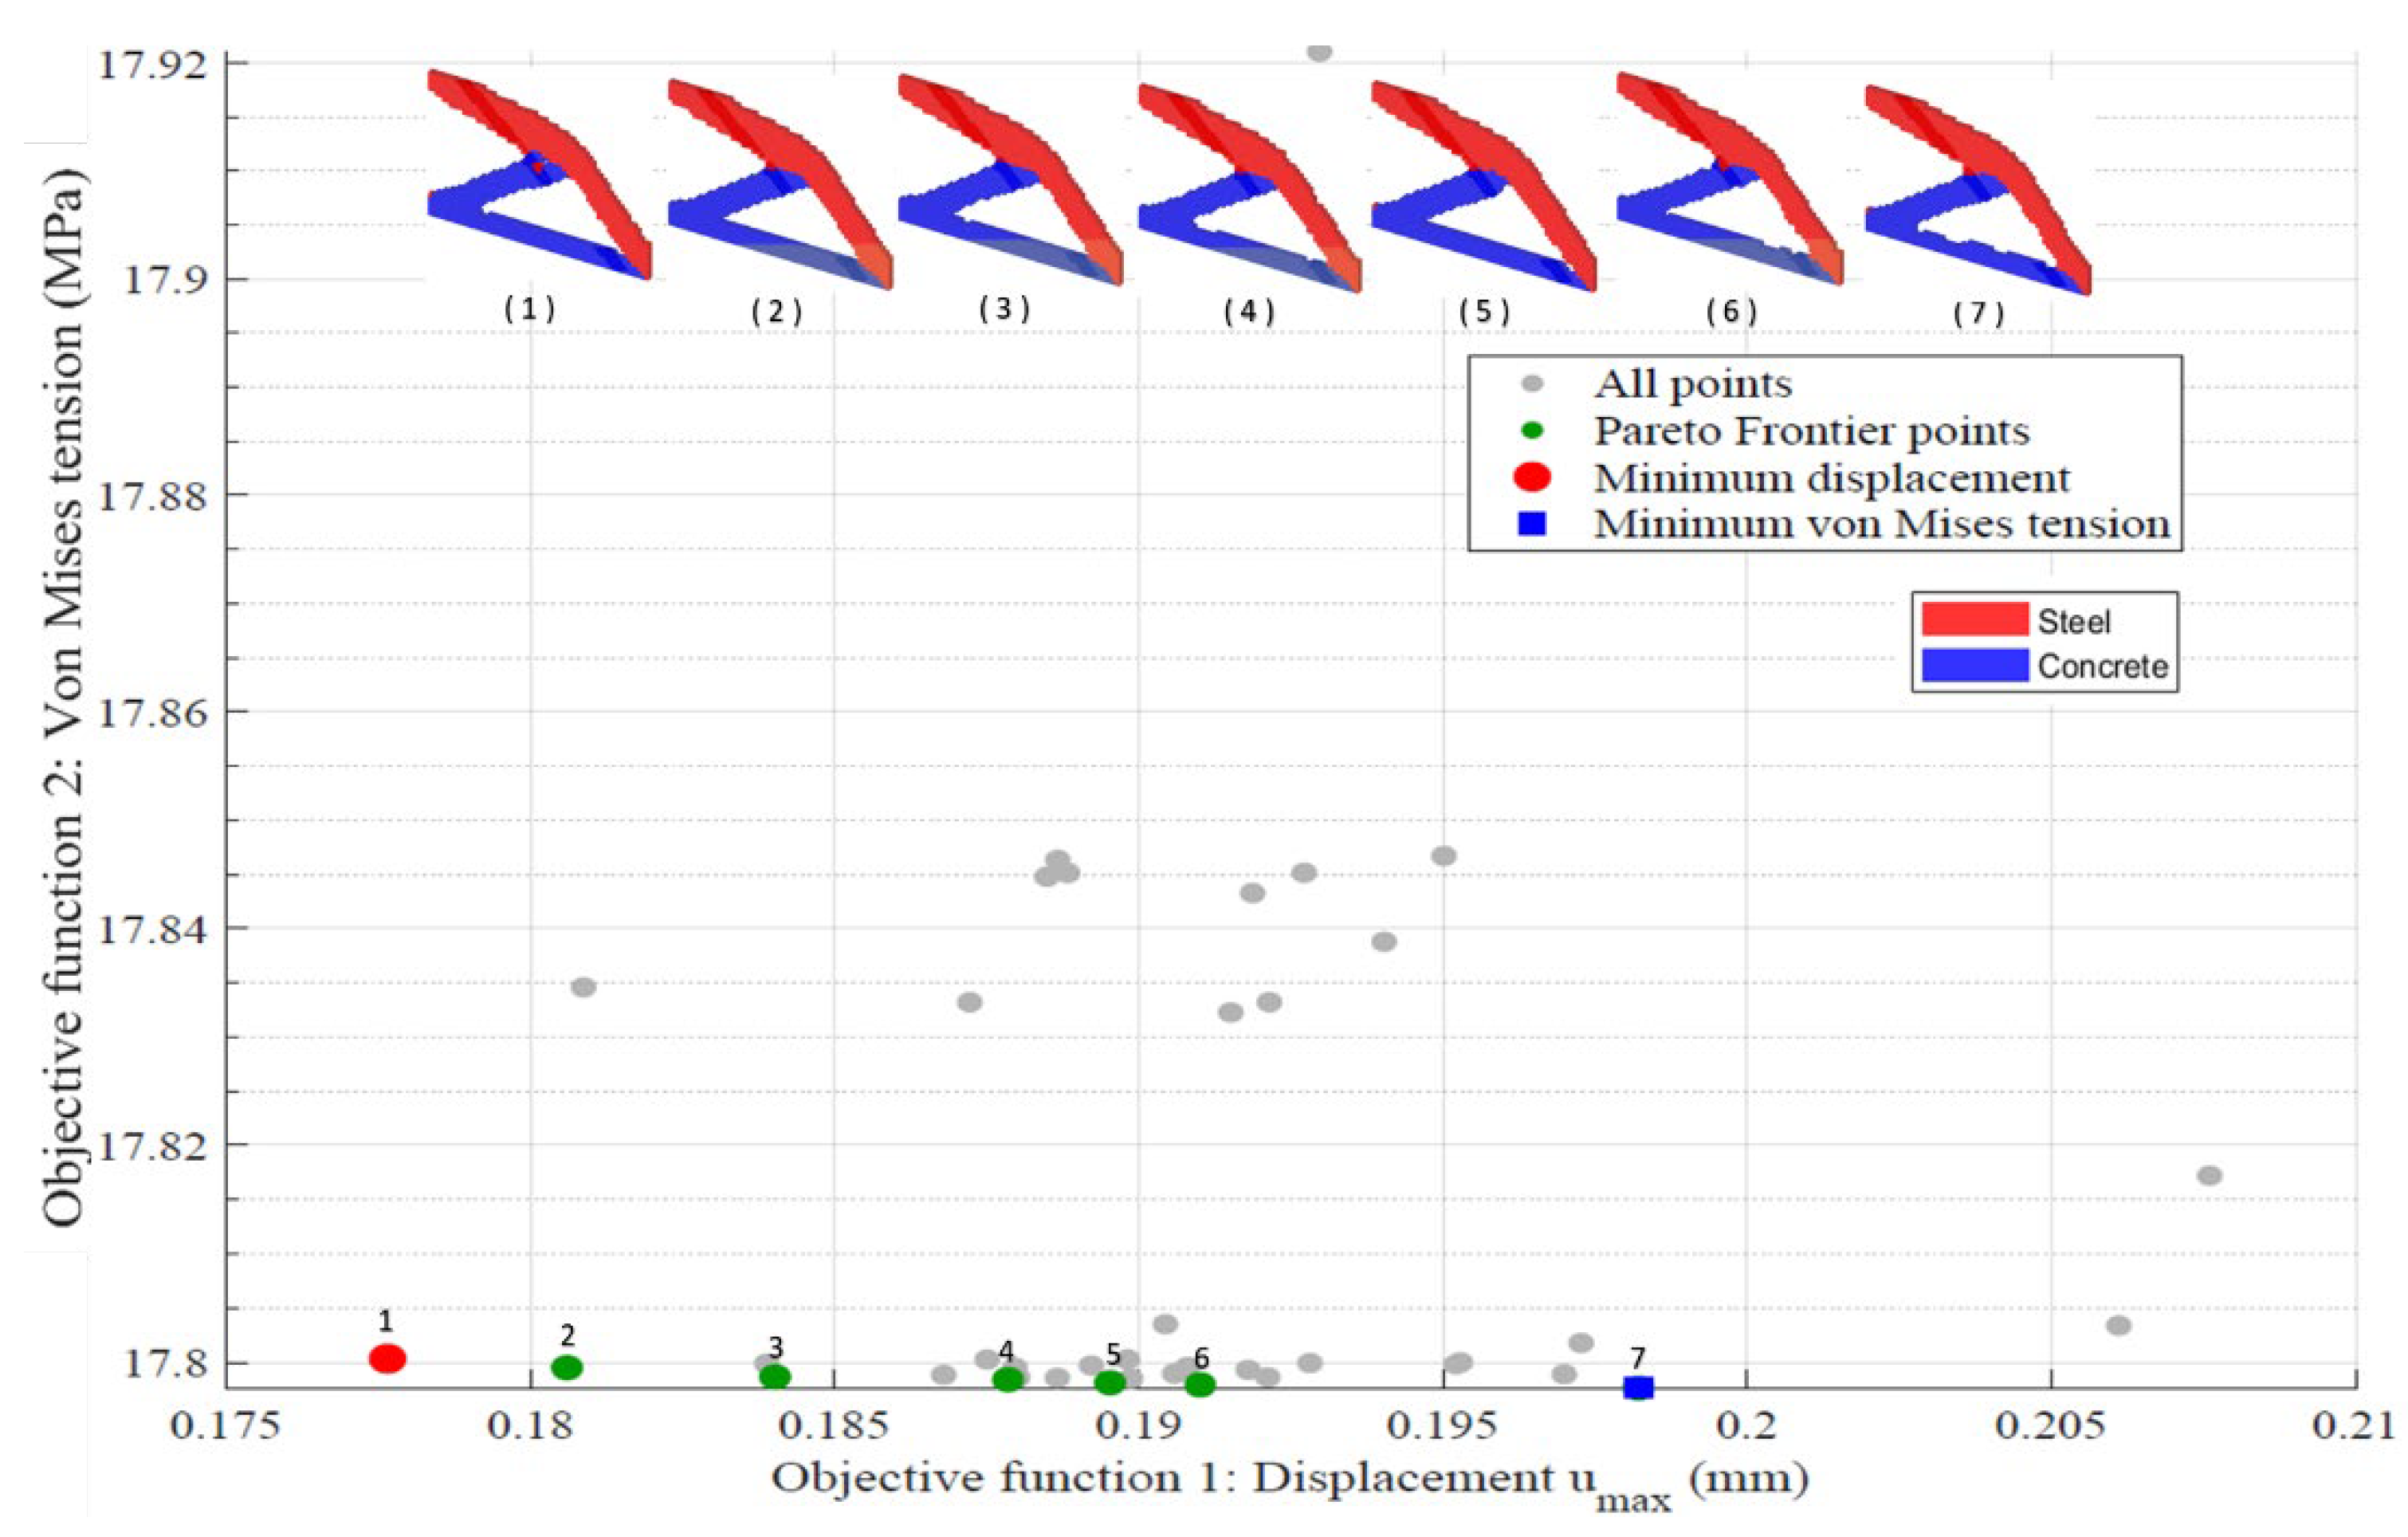
Figure 8.
Bottom-loaded cantilever beam: Variation of displacement and von Mises stress as a function of weight – DTO.
Figure 8.
Bottom-loaded cantilever beam: Variation of displacement and von Mises stress as a function of weight – DTO.
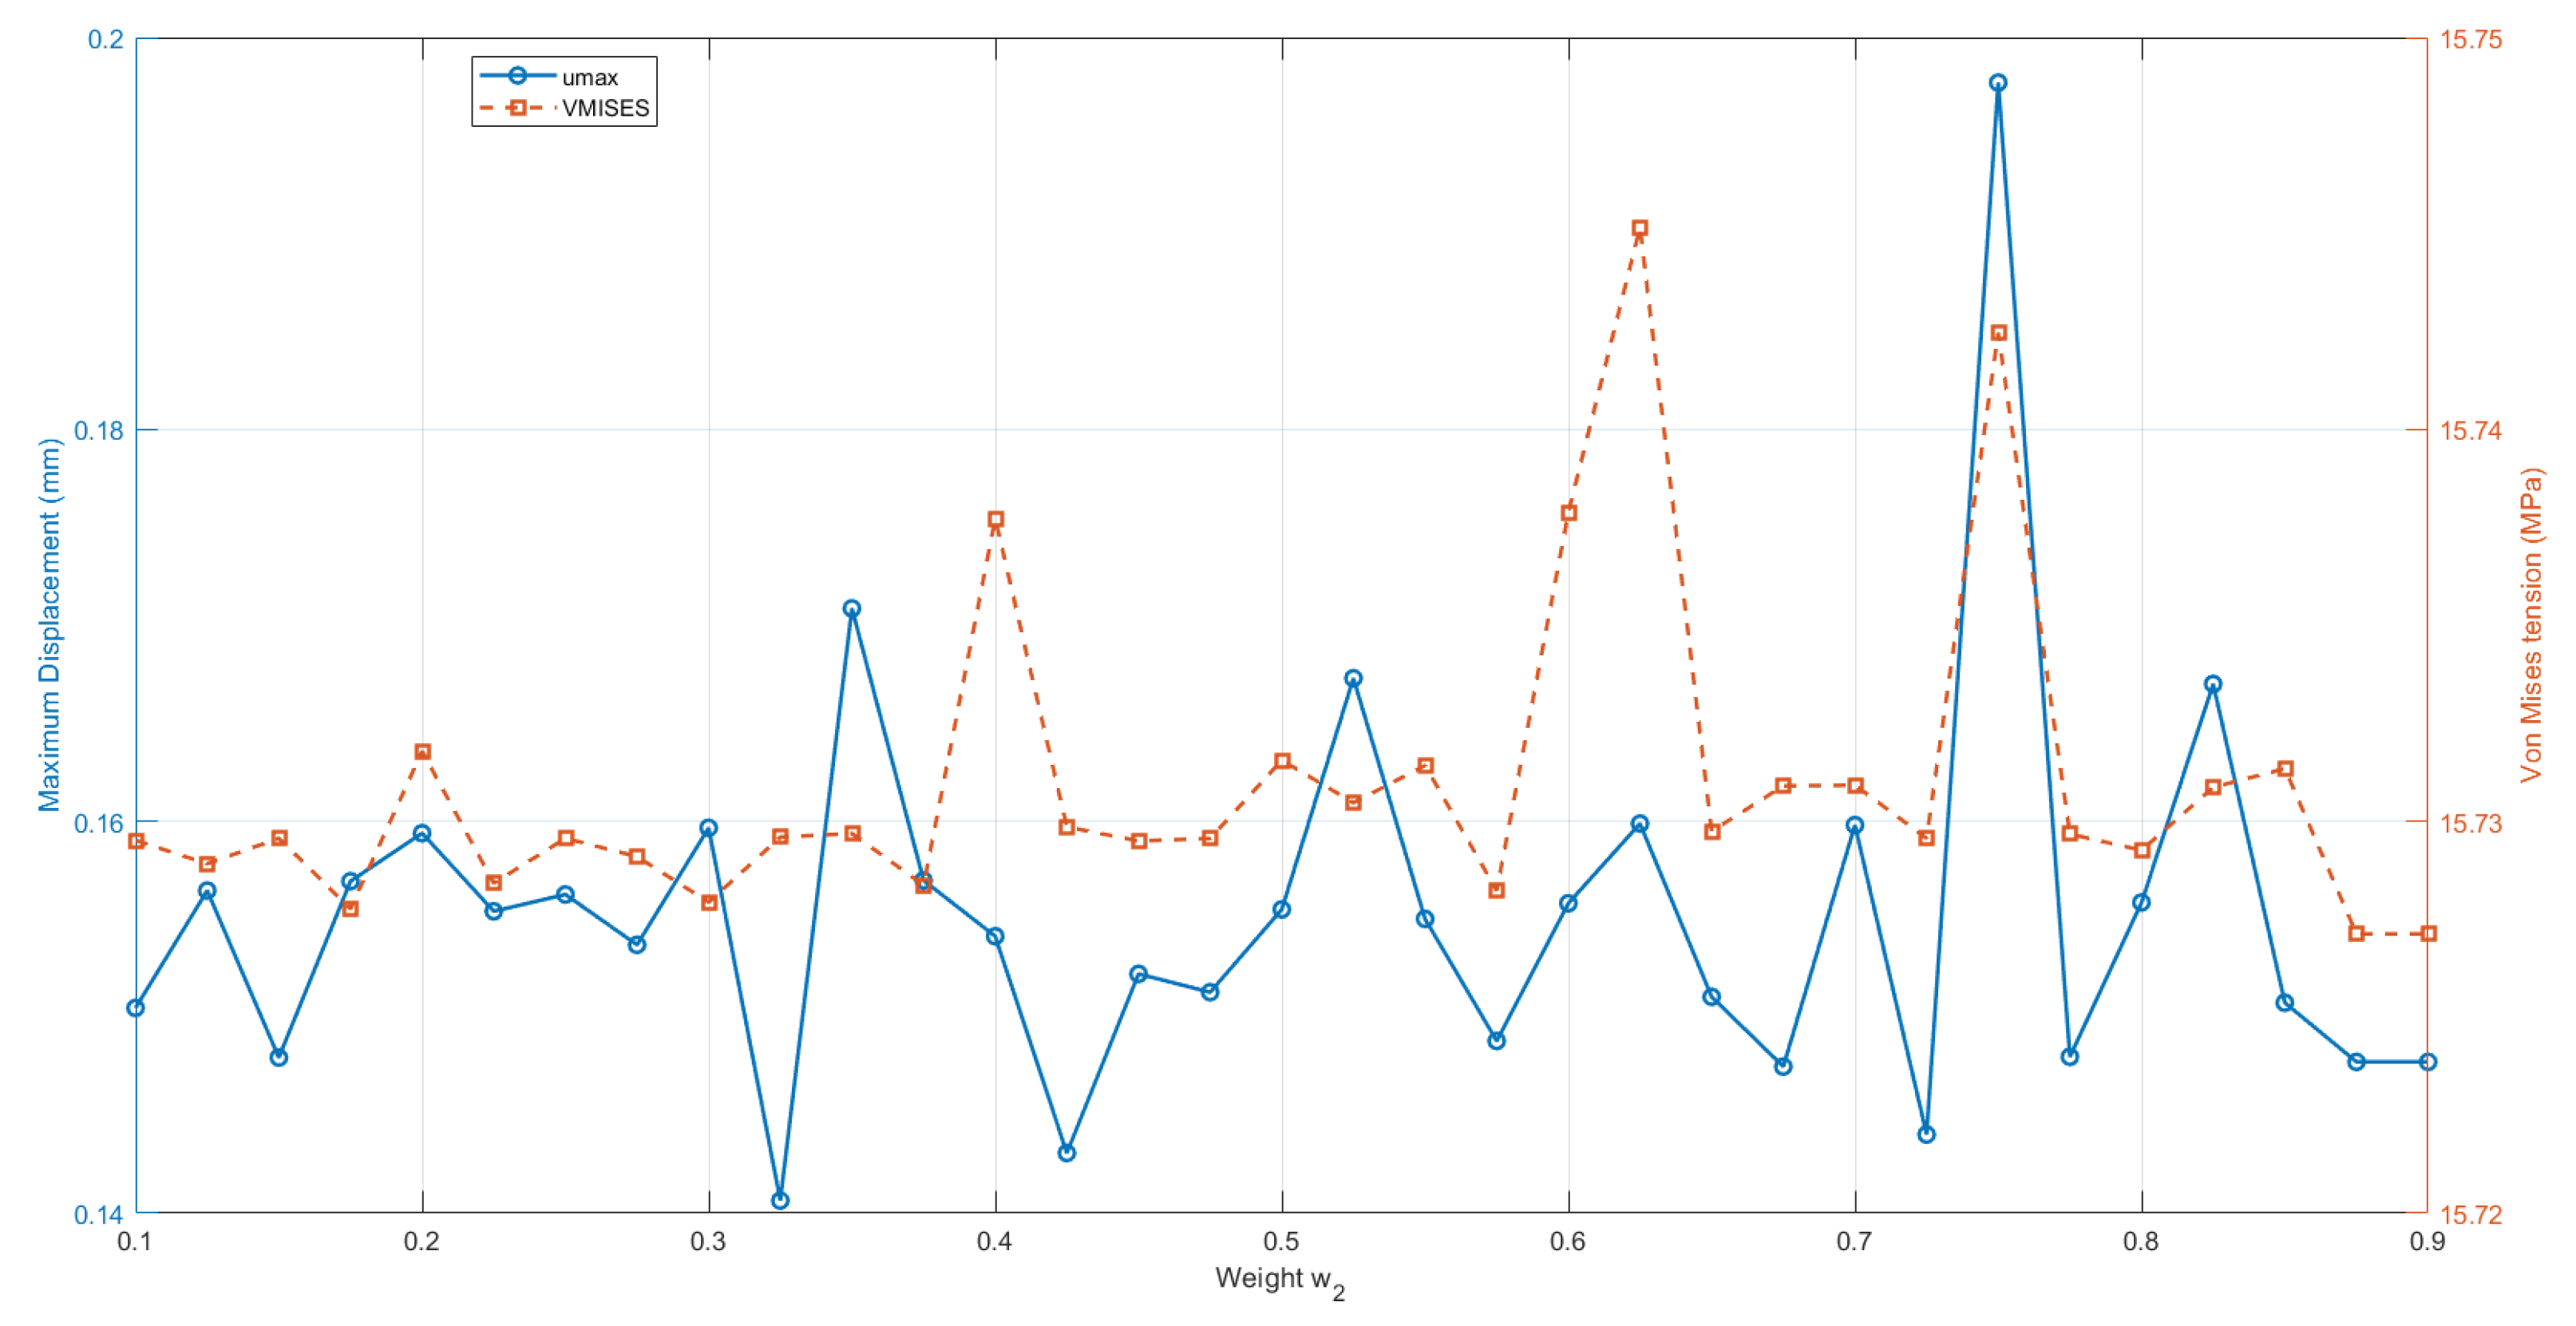
Figure 9.
Bottom-loaded cantilever beam: Variation of displacement and von Mises tension as a function of weight - SESO-FORM ().
Figure 9.
Bottom-loaded cantilever beam: Variation of displacement and von Mises tension as a function of weight - SESO-FORM ().
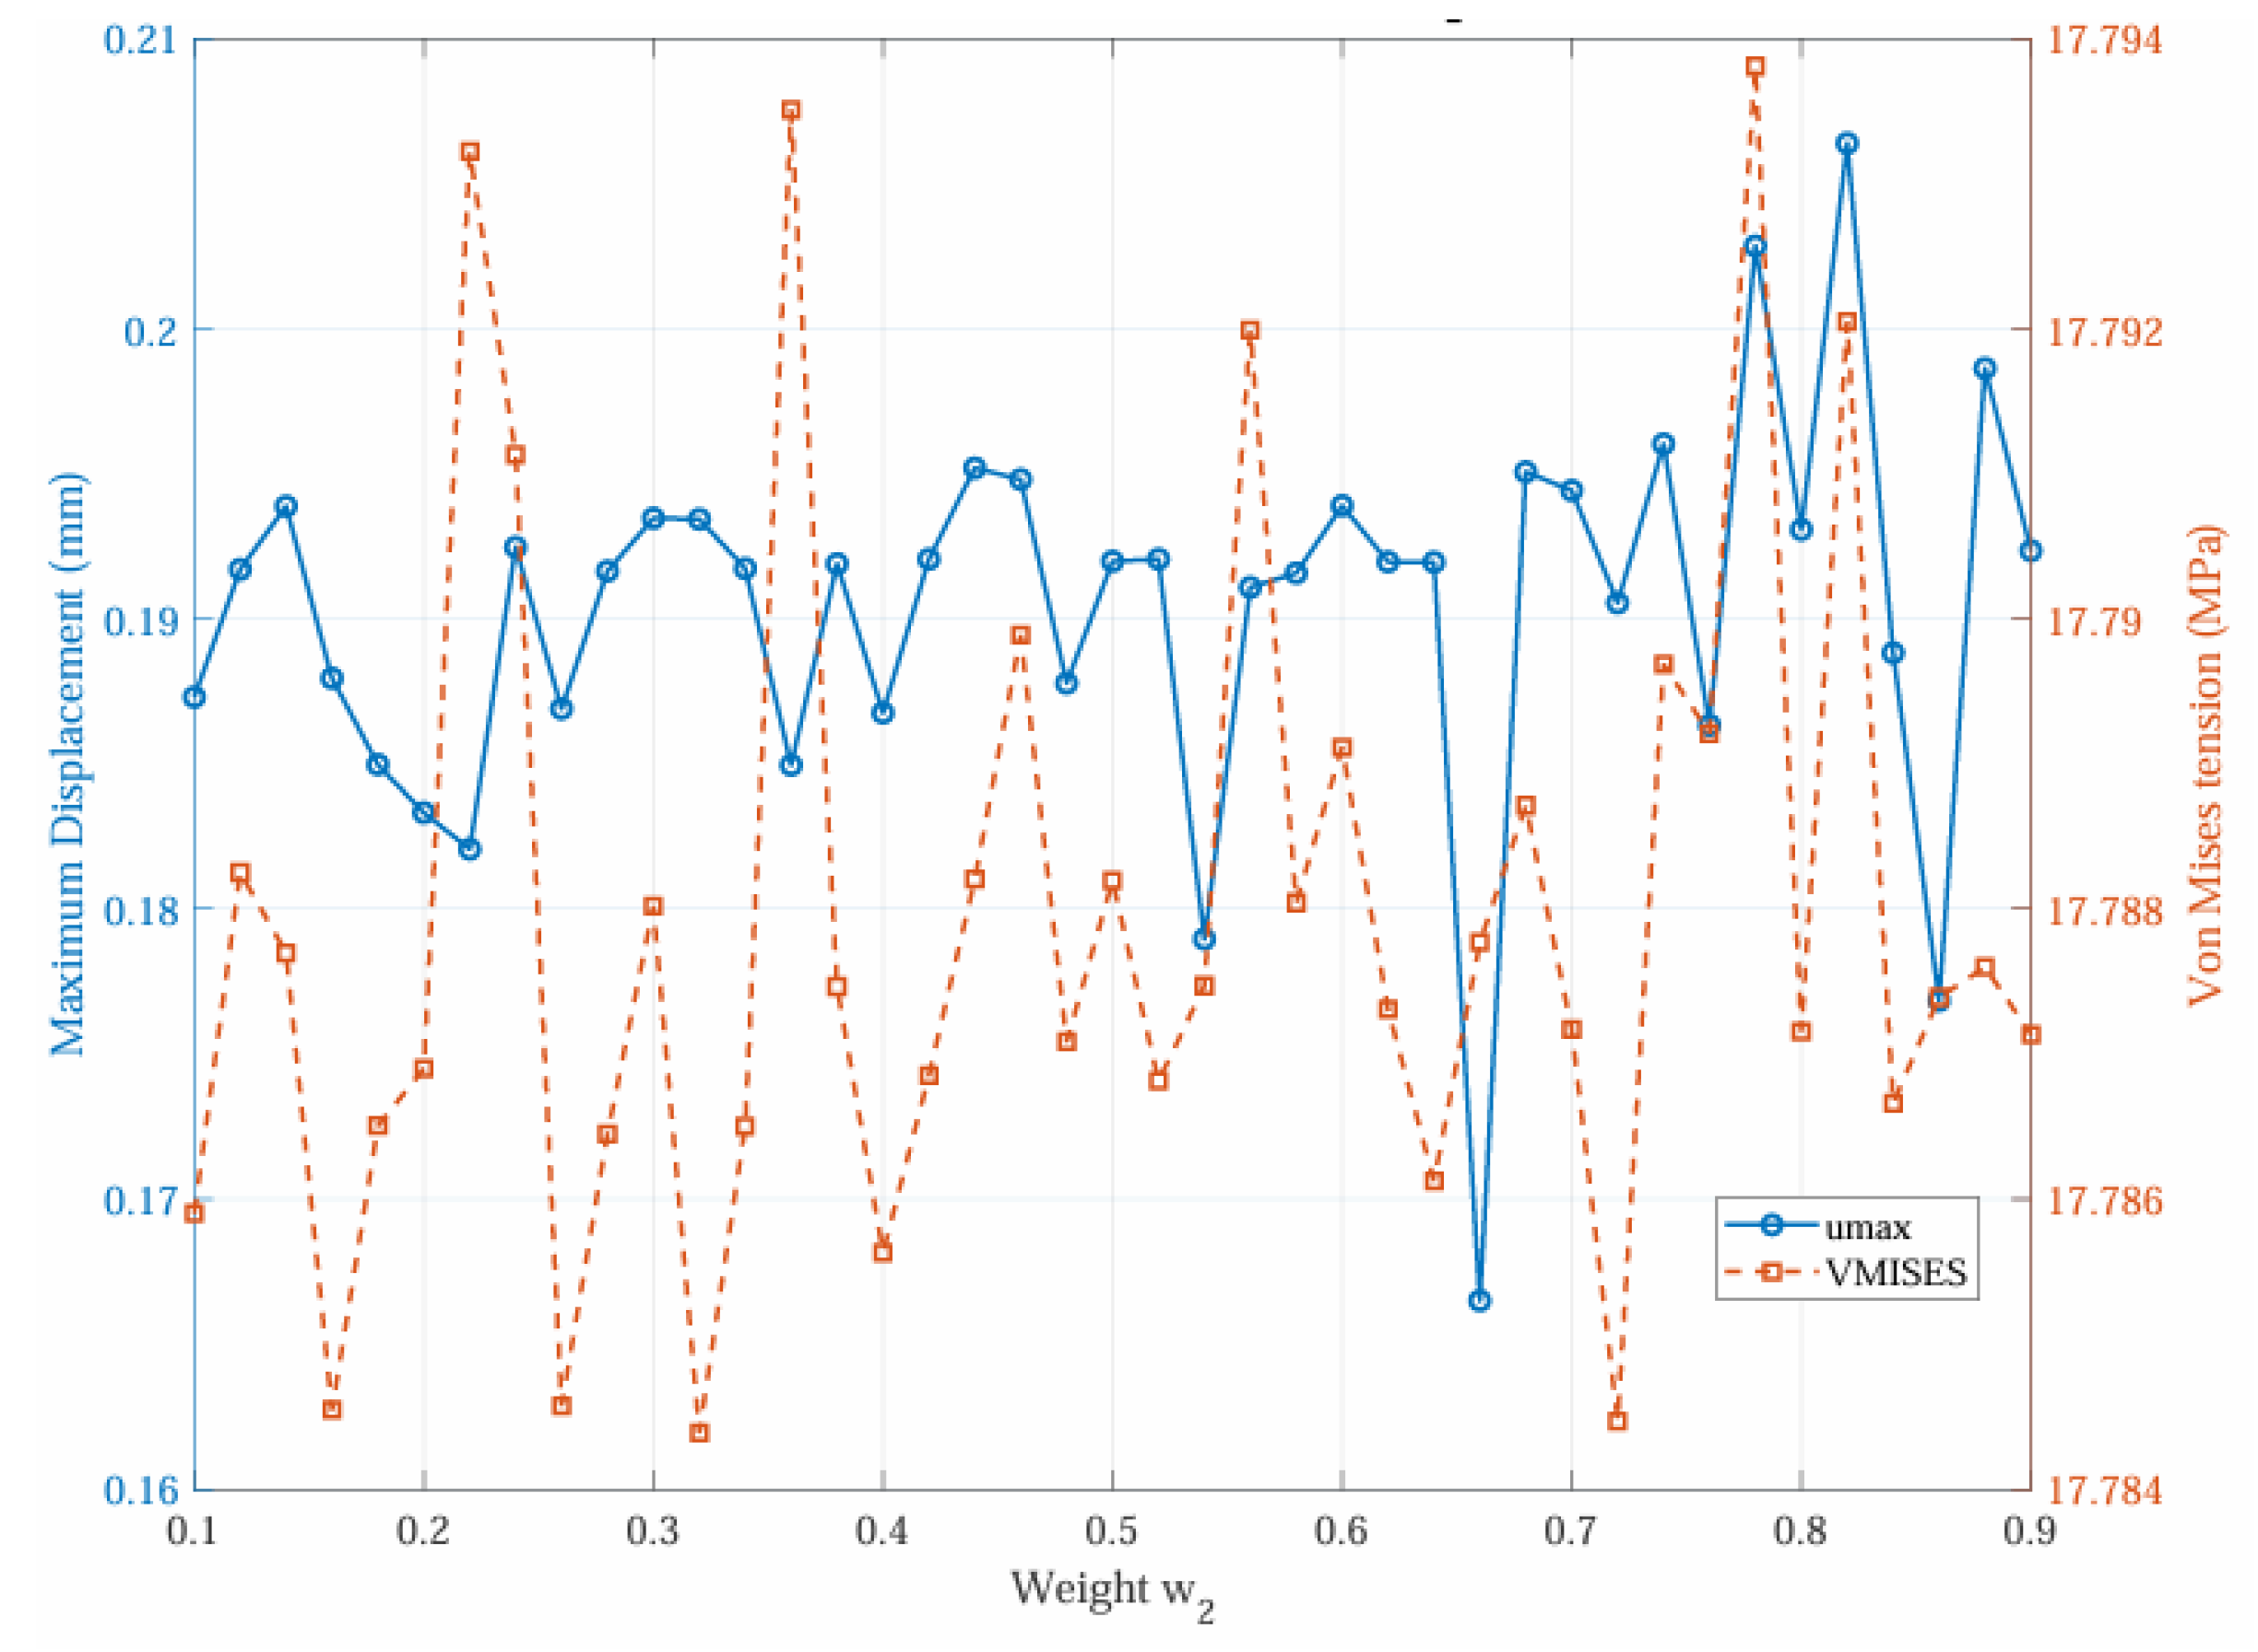
Figure 10.
Bottom-loaded cantilever beam: Variation of displacement and von Mises tension as a function of weight - SESO-FORM ().
Figure 10.
Bottom-loaded cantilever beam: Variation of displacement and von Mises tension as a function of weight - SESO-FORM ().
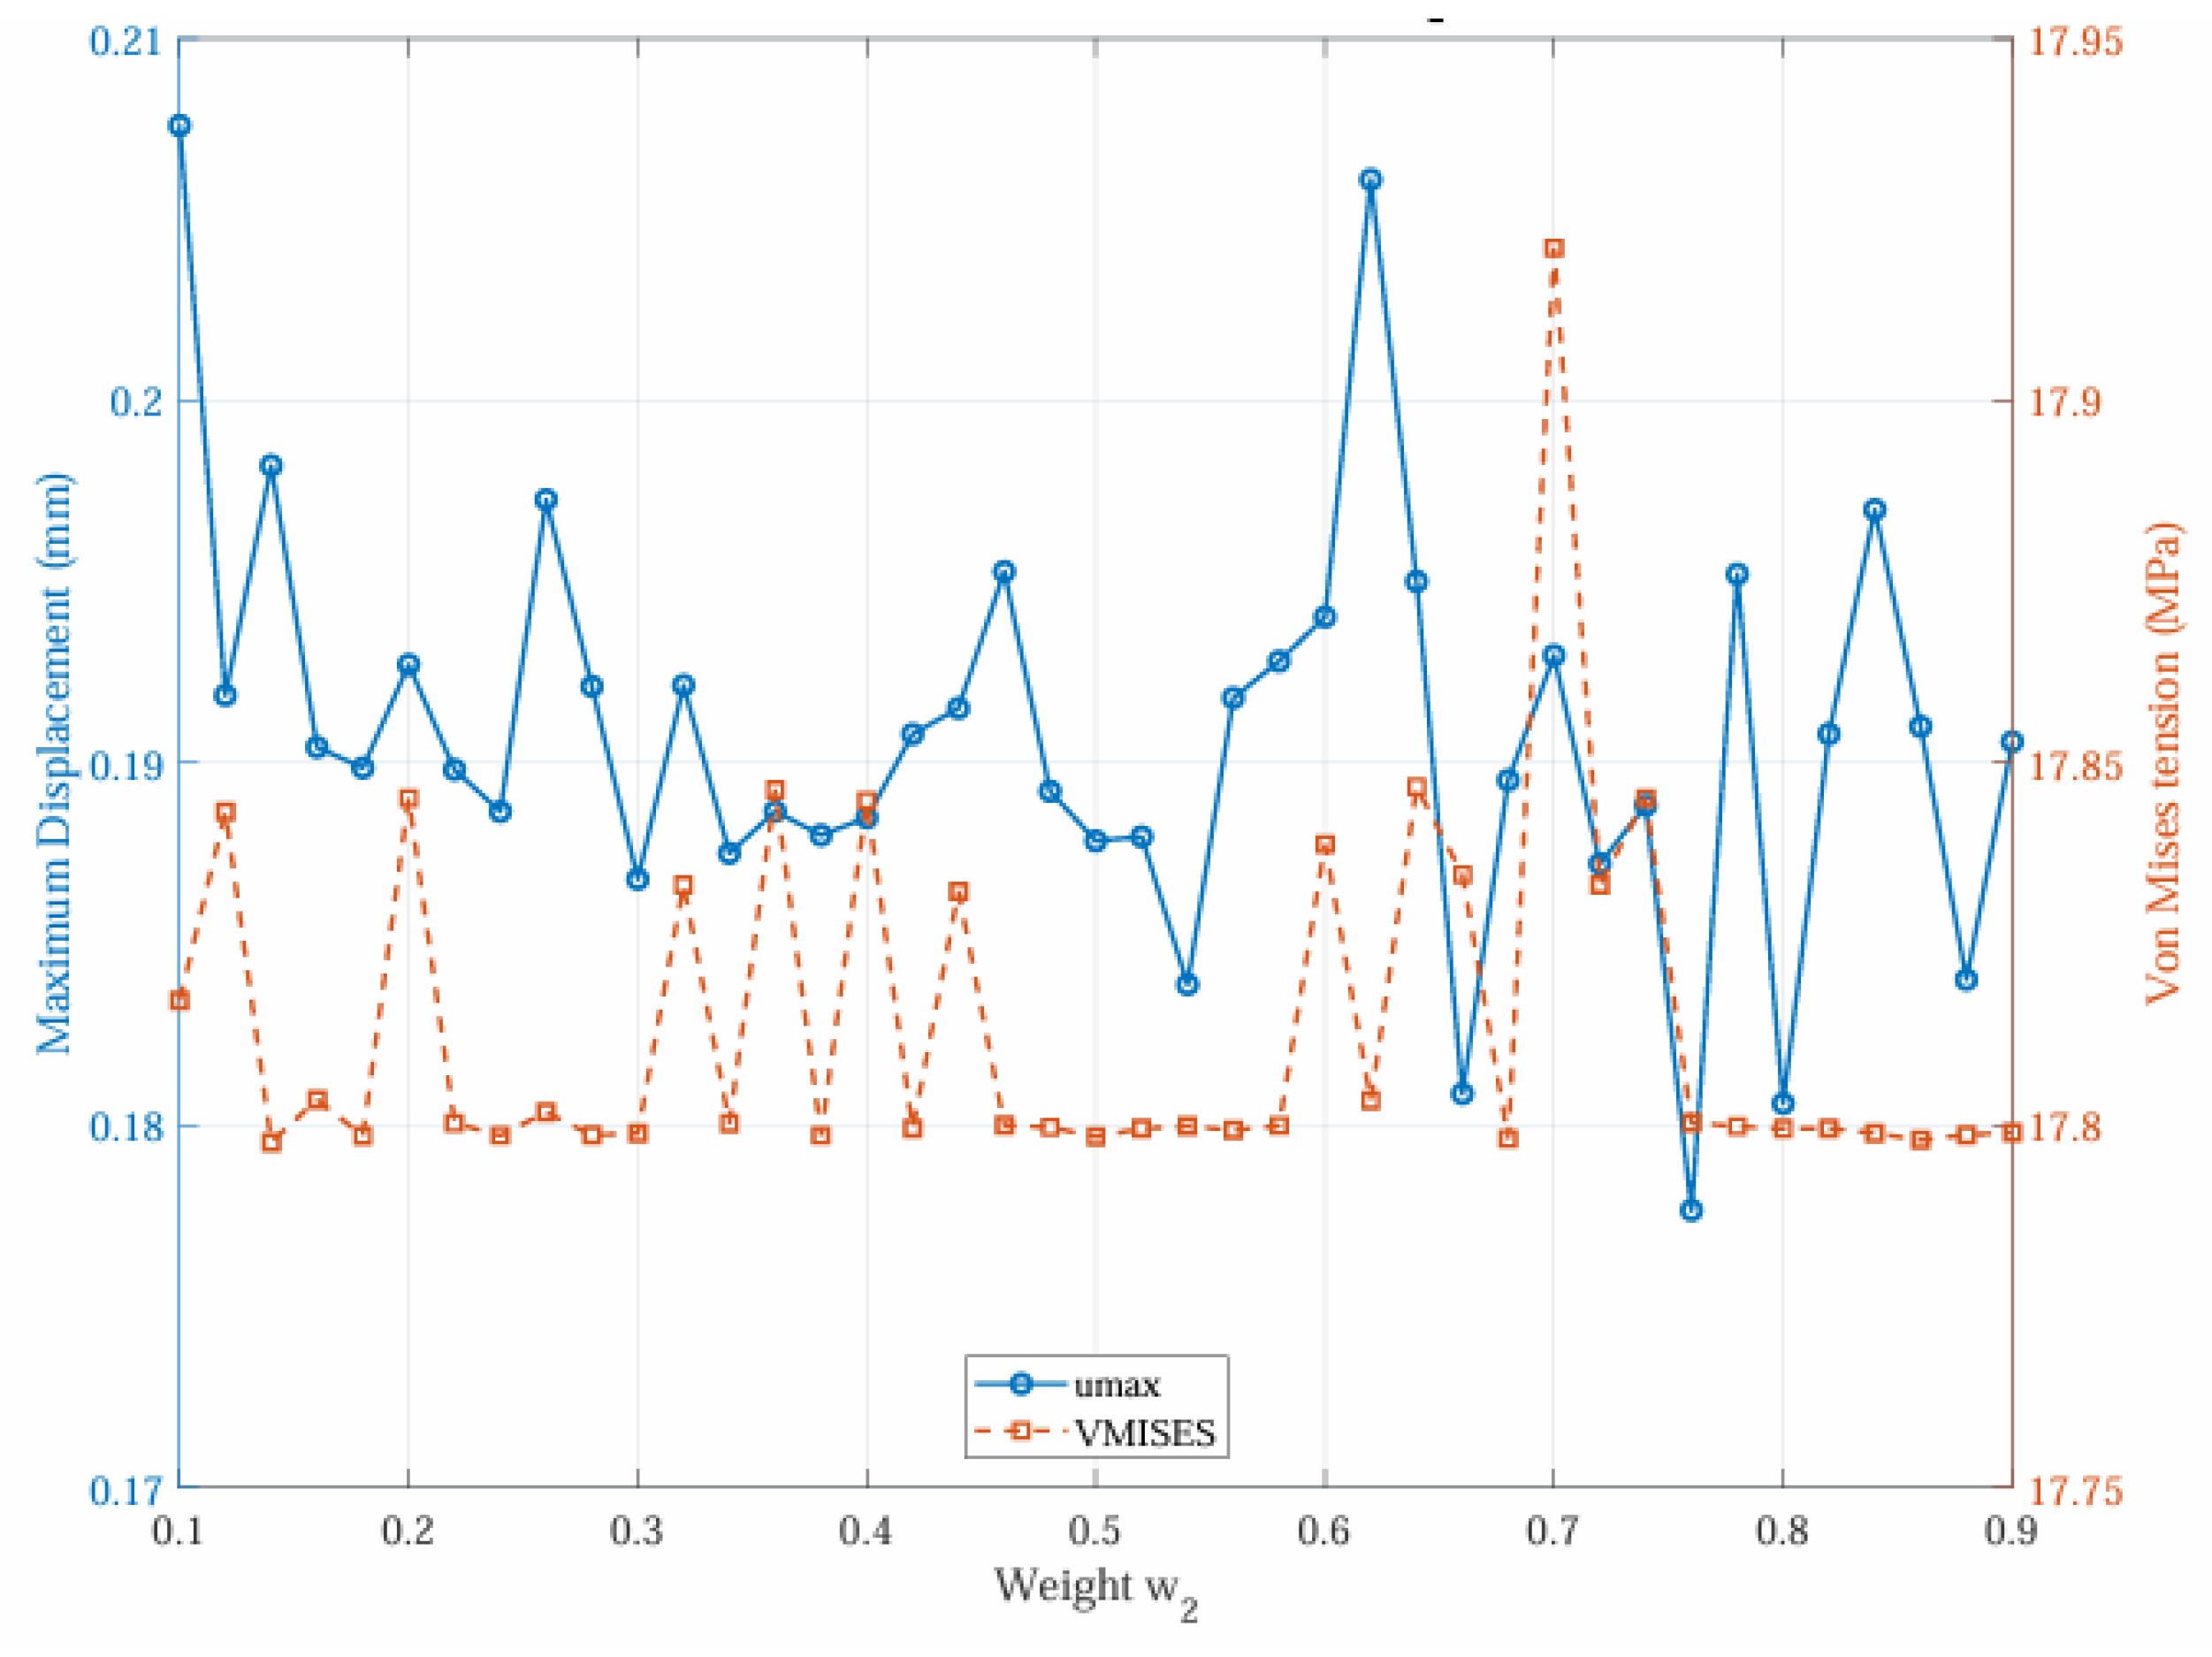
Figure 11.
Monte Carlo simulation histogram of the bottom-loaded cantilever beam - SESO-FORM (): (a) Von Mises minimum stress point (0.450) (b) minimum displacement point (0.725).
Figure 11.
Monte Carlo simulation histogram of the bottom-loaded cantilever beam - SESO-FORM (): (a) Von Mises minimum stress point (0.450) (b) minimum displacement point (0.725).
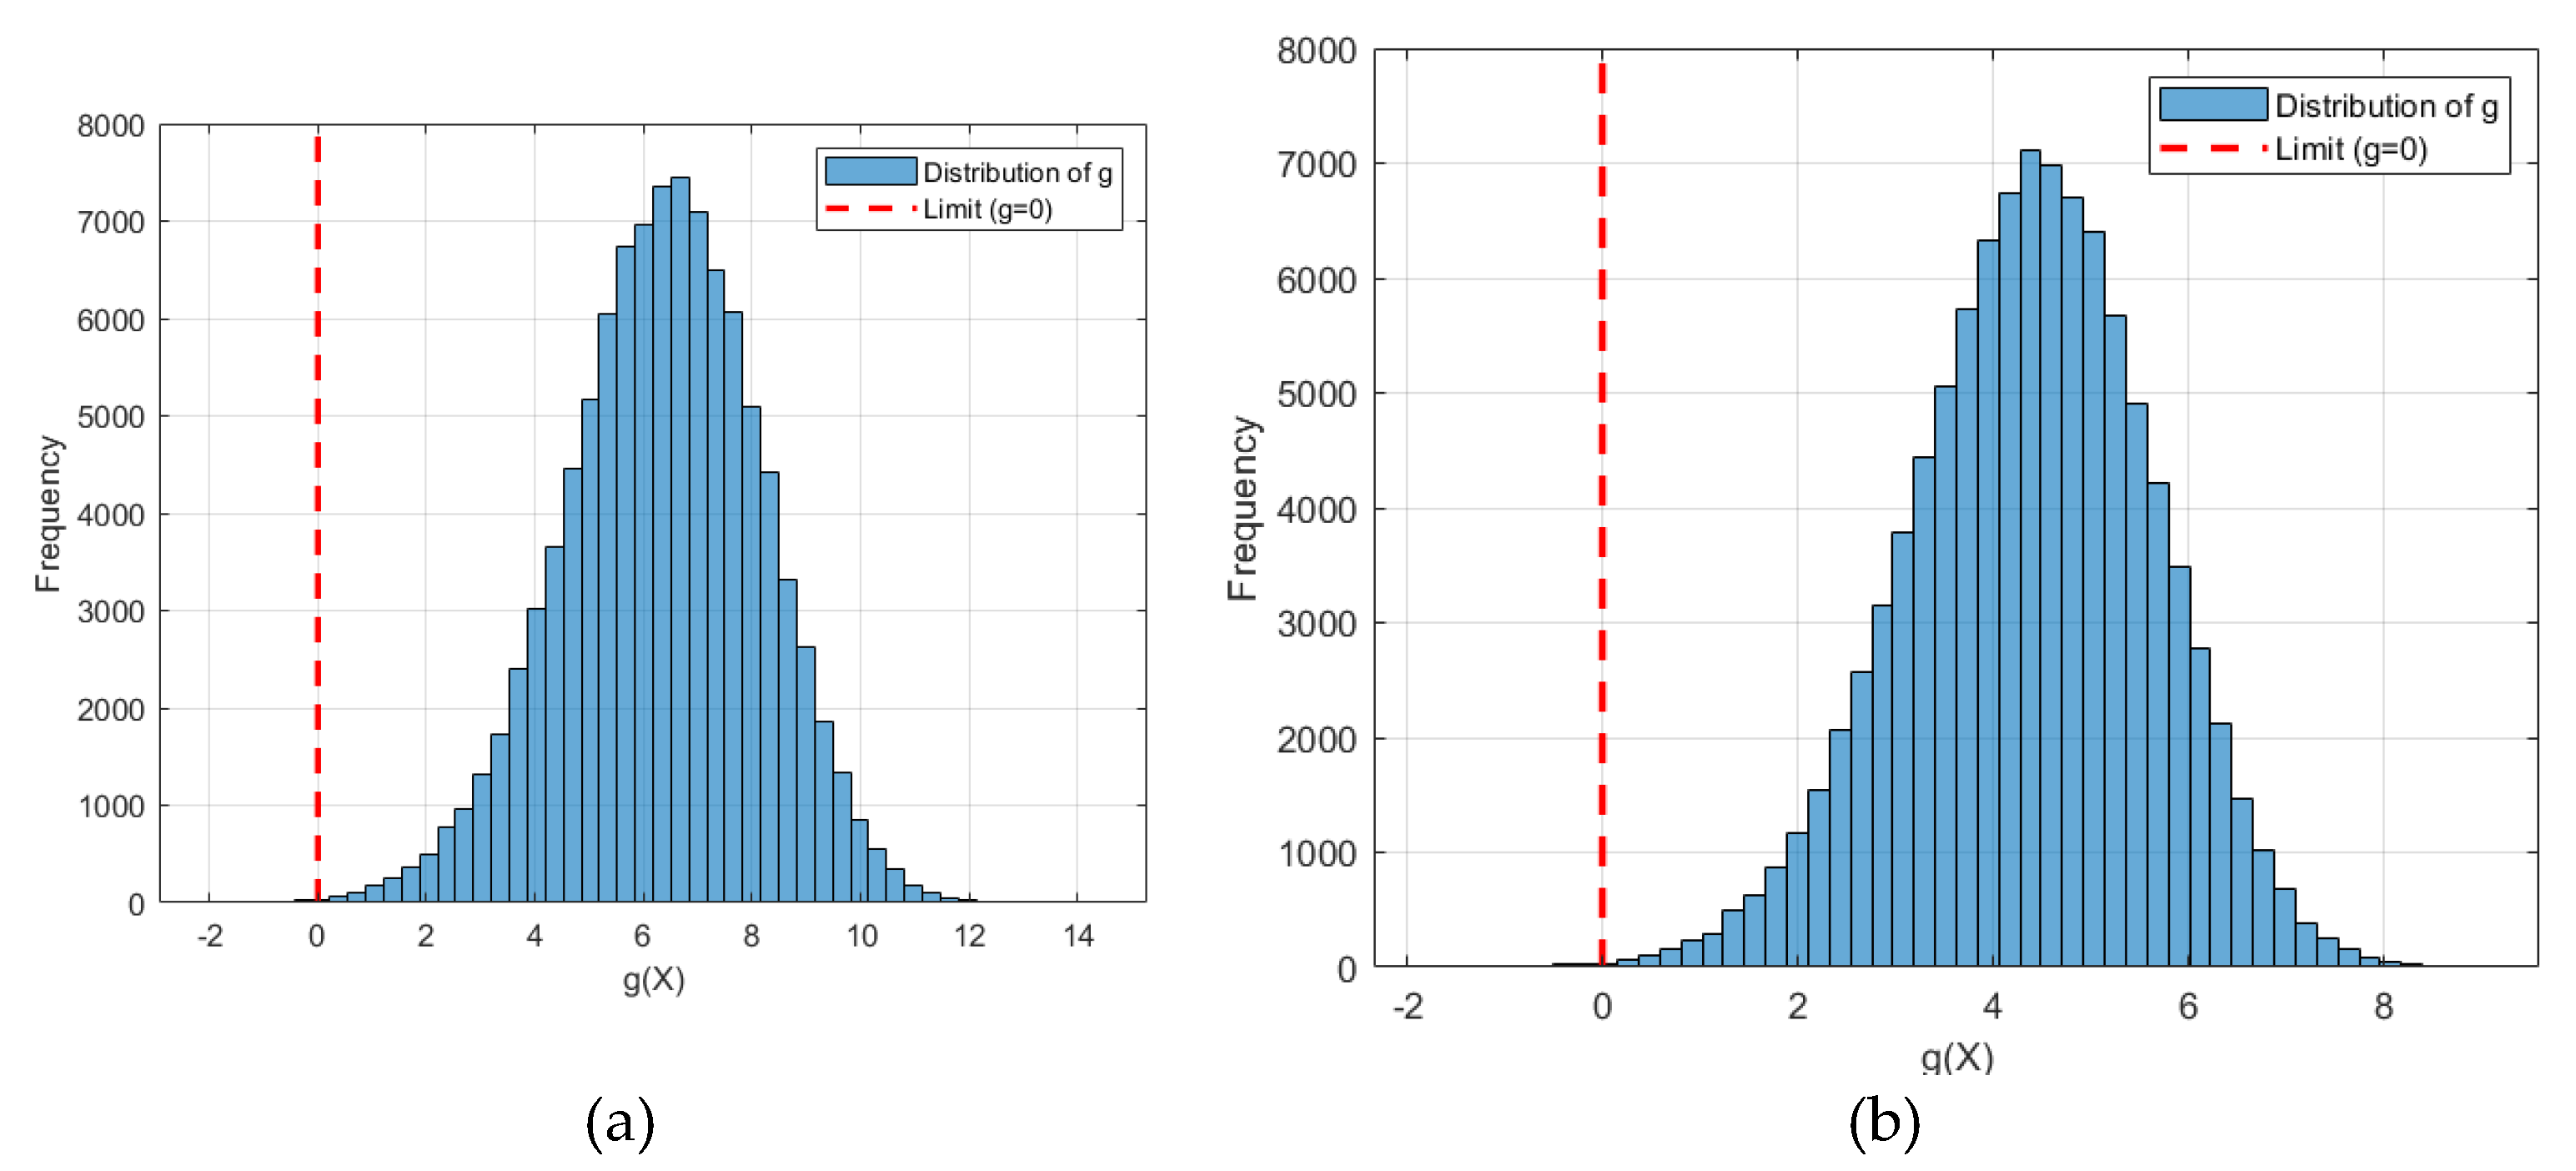
Figure 12.
Monte Carlo simulation histogram of the bottom-loaded cantilever beam - SESO-FORM (): (a) Von Mises minimum stress point () (b) minimum displacement point ().
Figure 12.
Monte Carlo simulation histogram of the bottom-loaded cantilever beam - SESO-FORM (): (a) Von Mises minimum stress point () (b) minimum displacement point ().
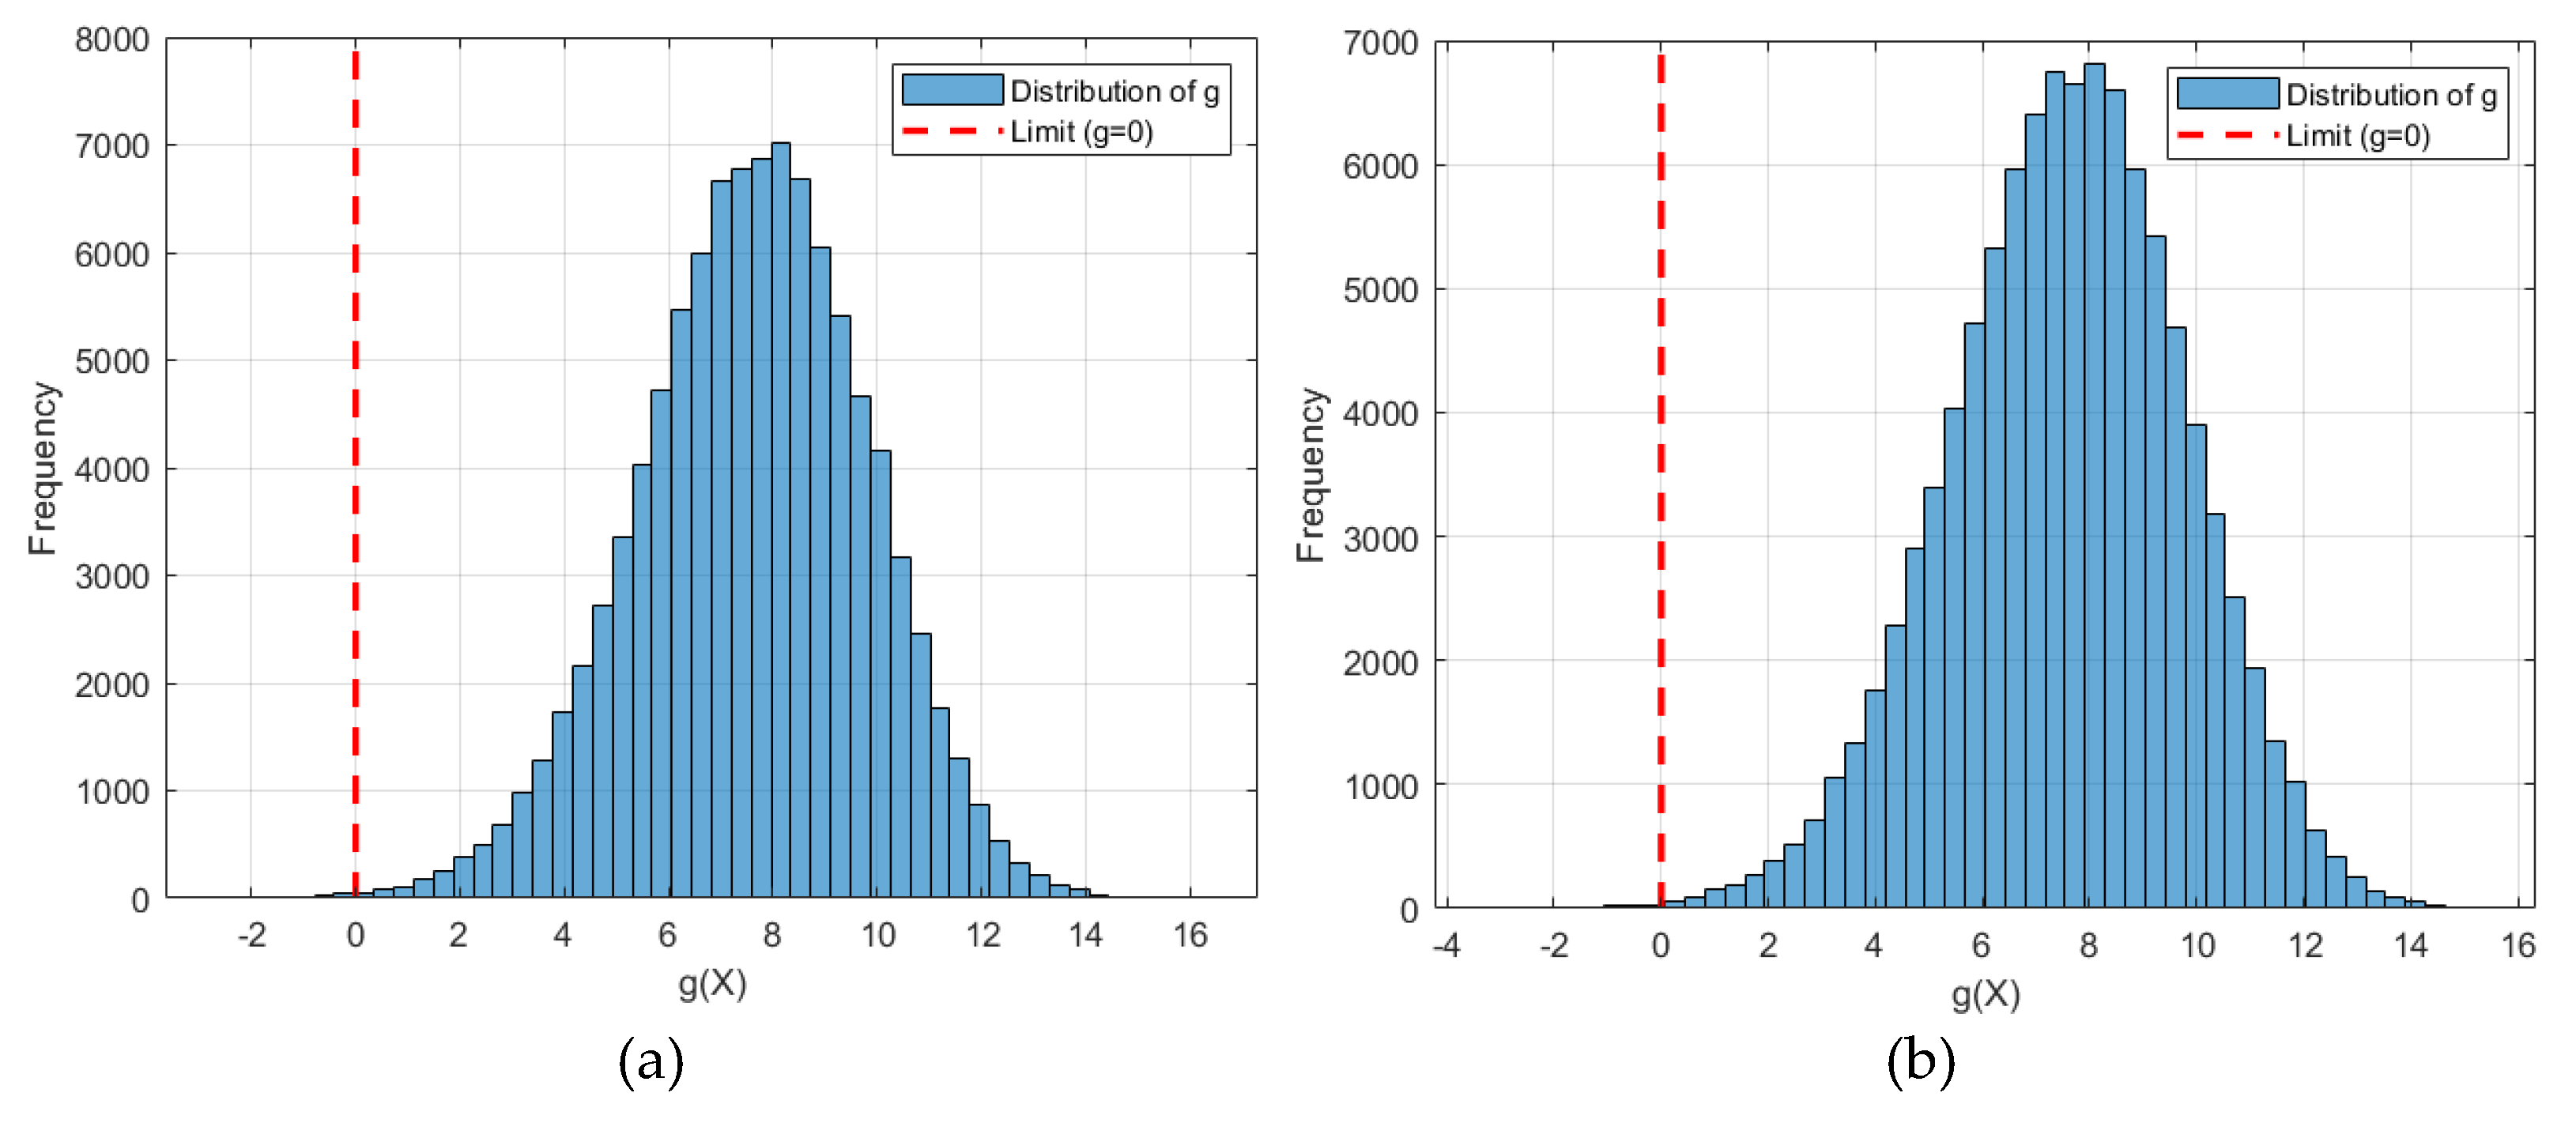
Figure 13.
Design domain and boundary conditions.
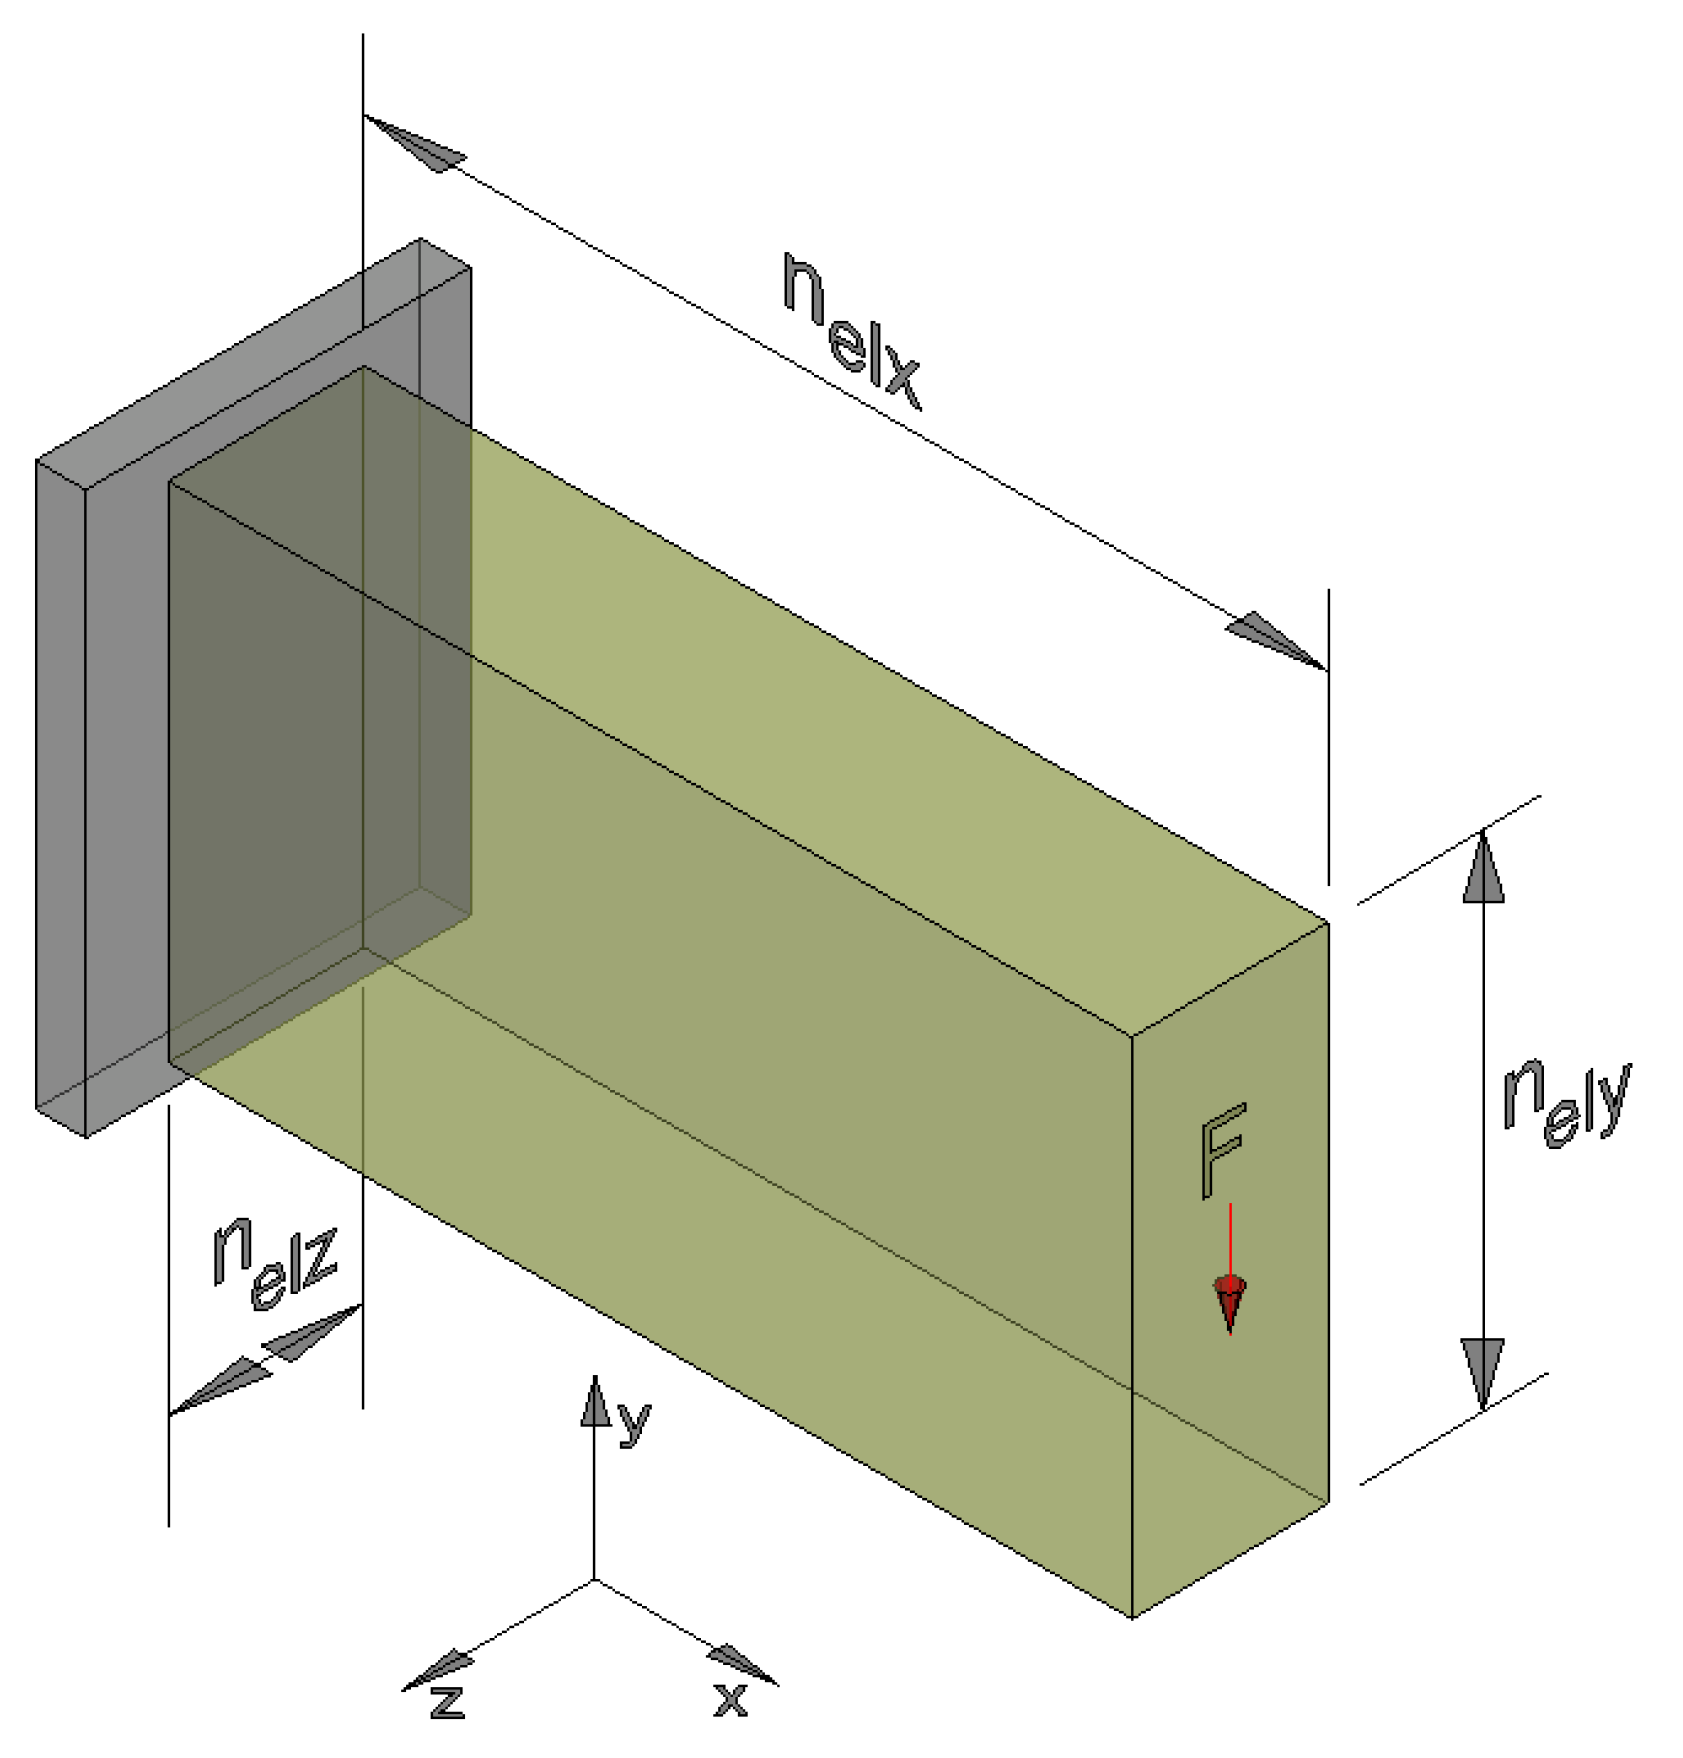
Figure 14.
Optimal settings: (a) SESO-DTO, (b) SESO-FORM (, (c) SESO-FORM ().
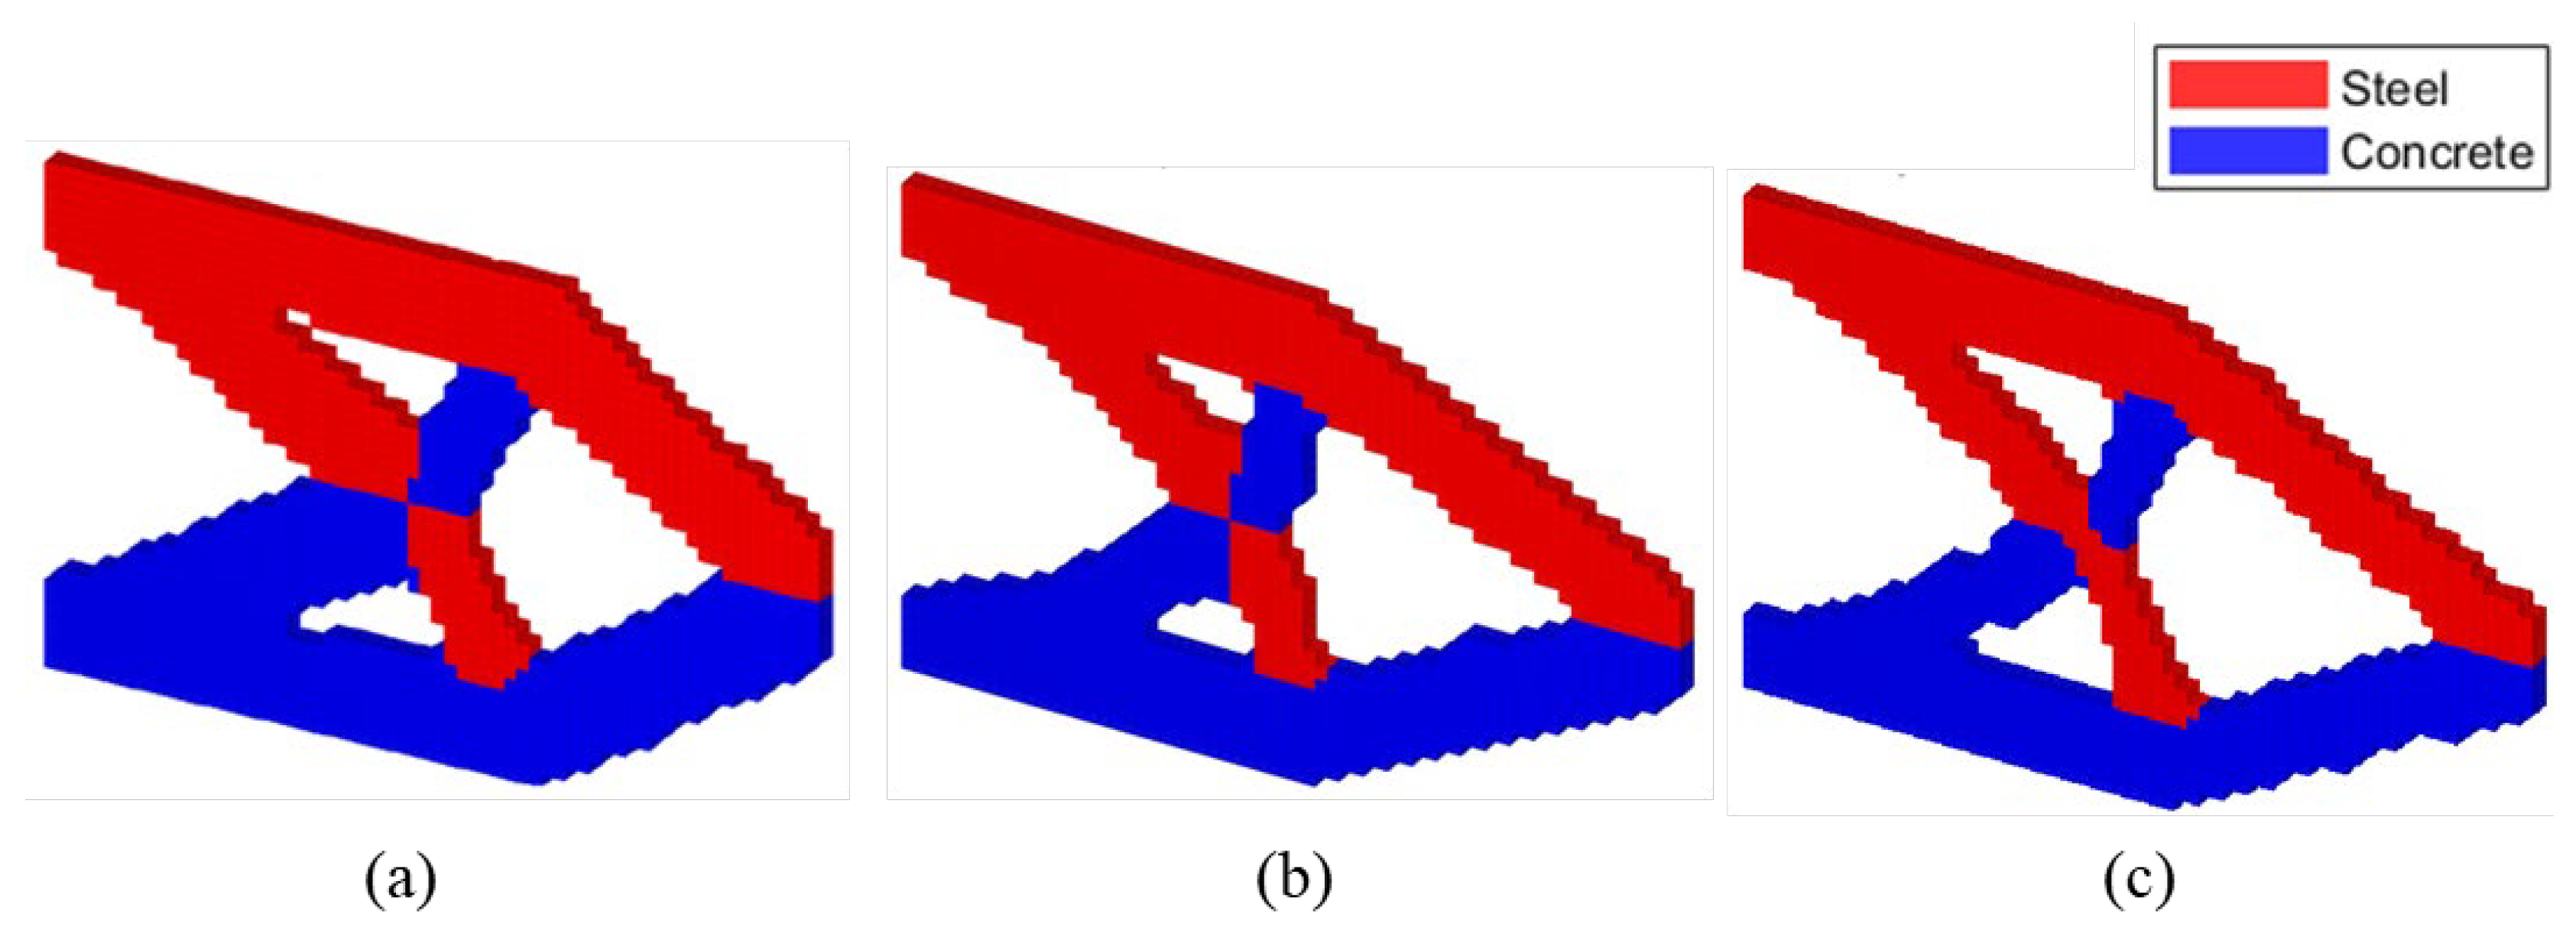
Figure 15.
Pareto Frontier: Optimal SESO-DTO.
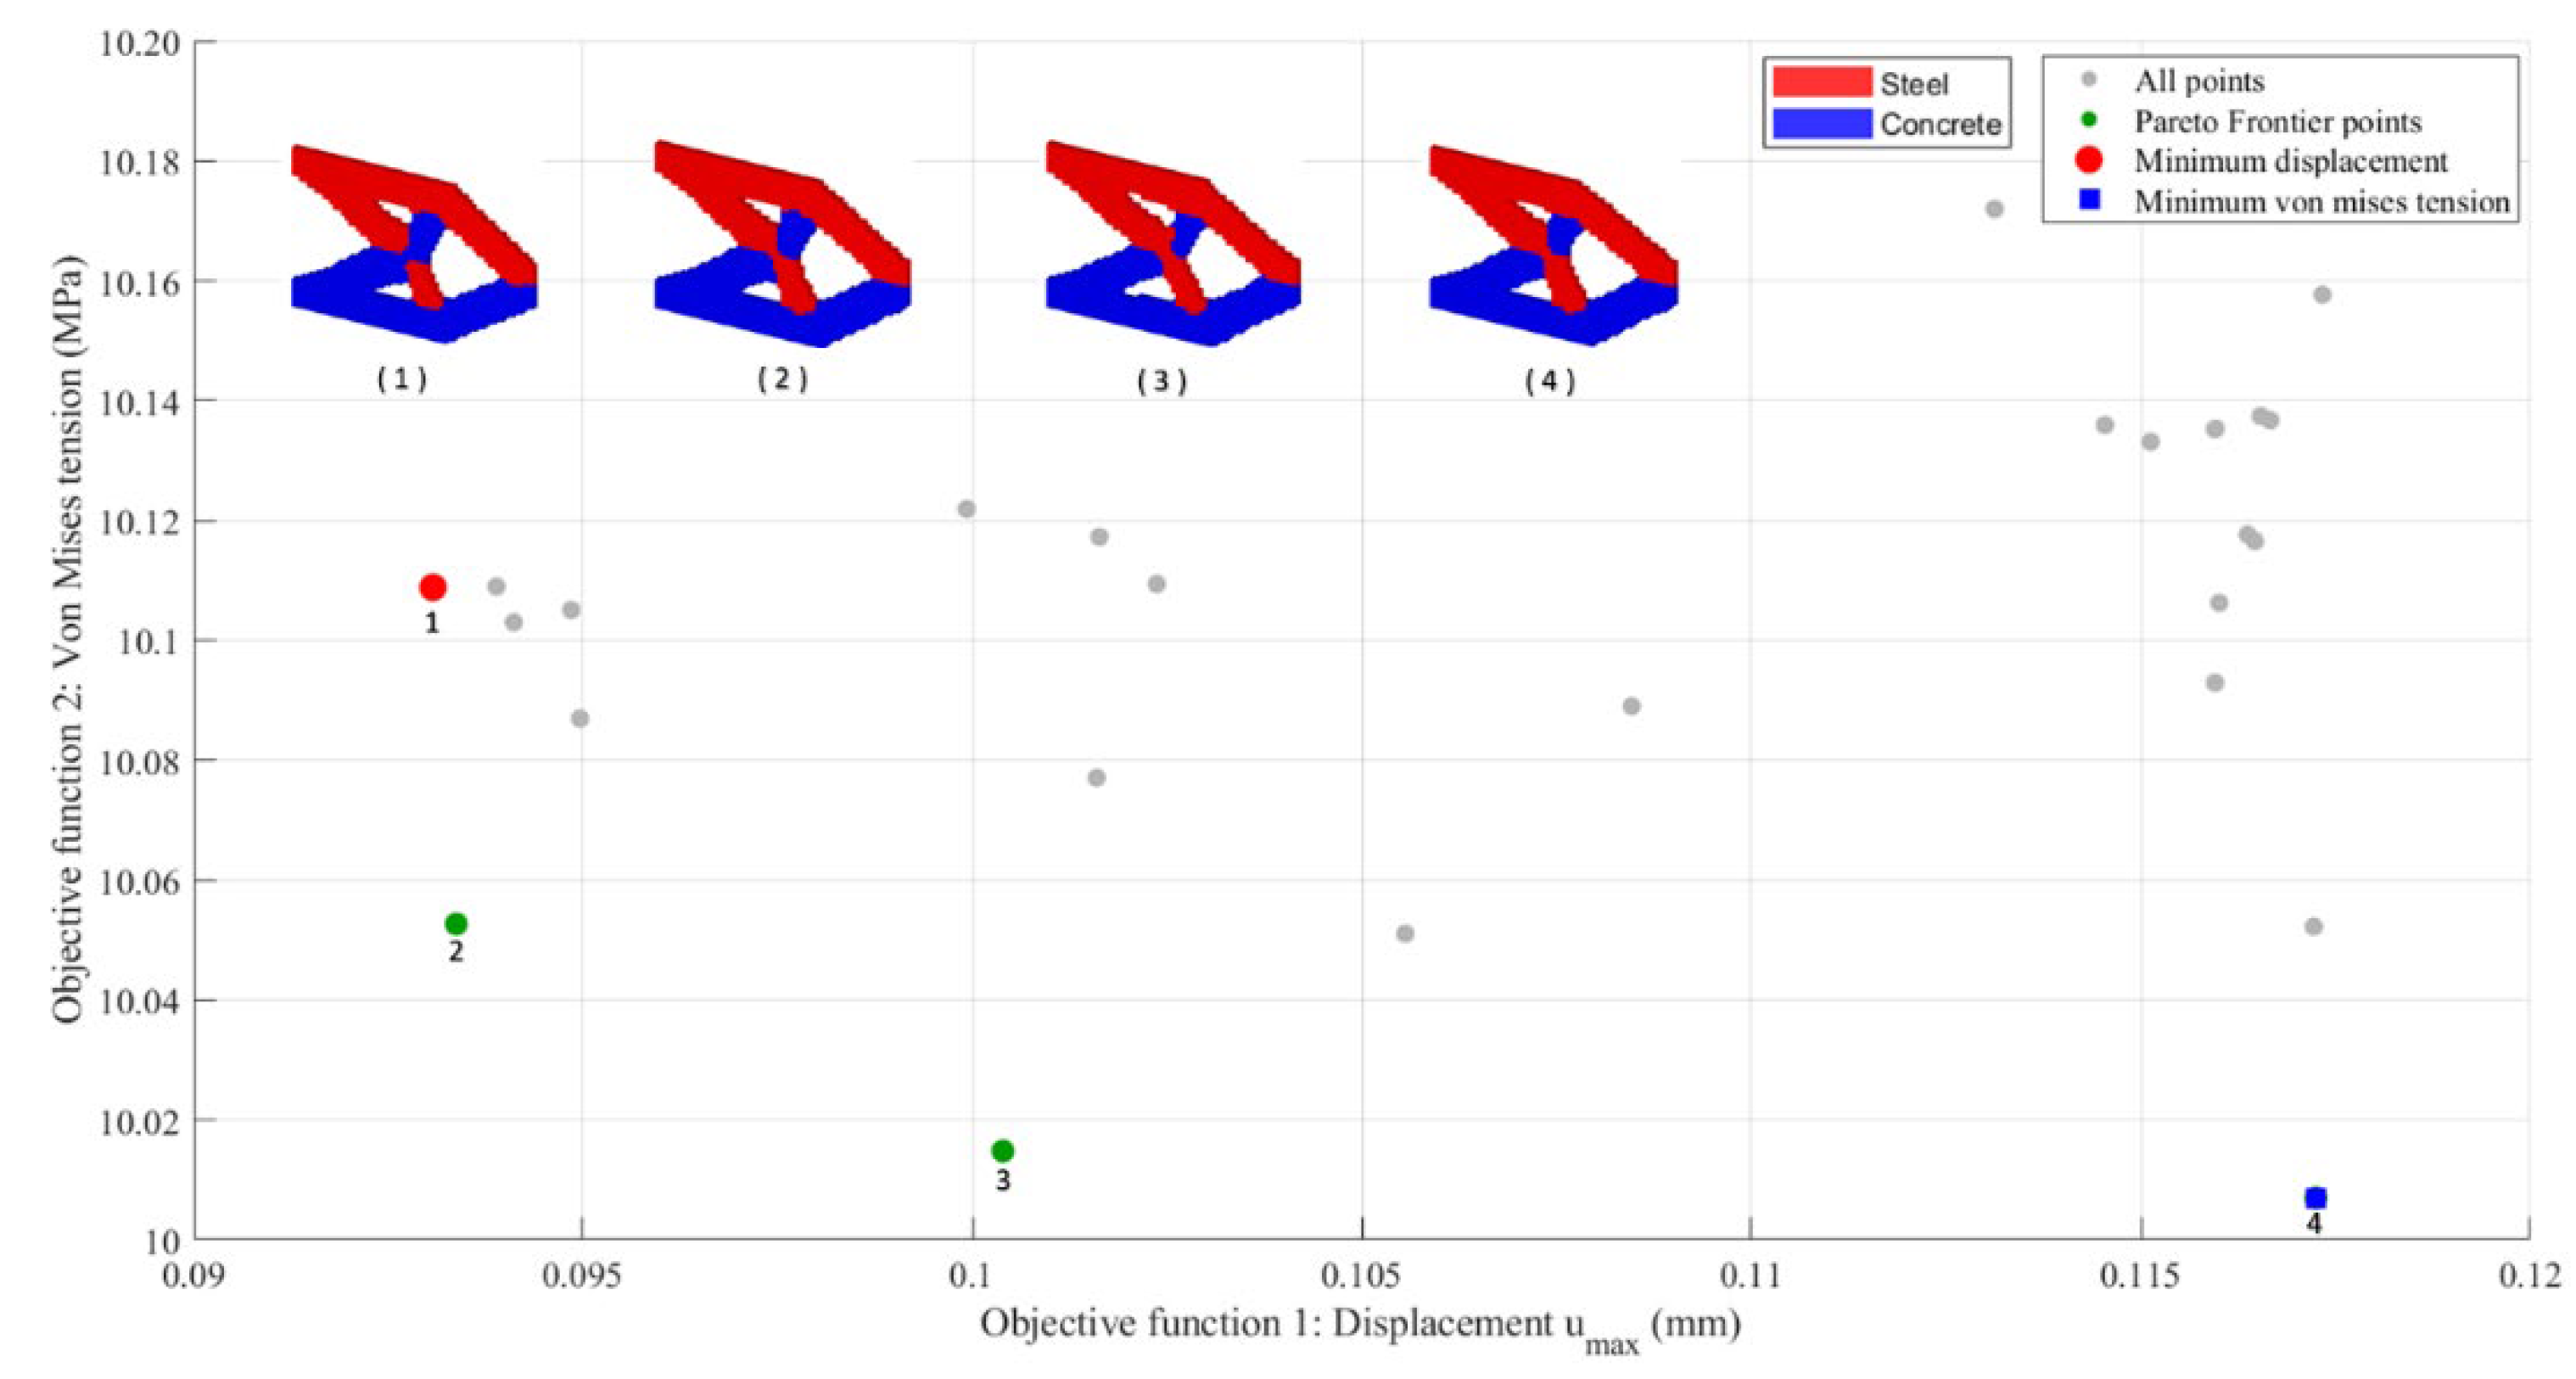
Figure 16.
Pareto Frontier: Optimal SESO-FORM ().
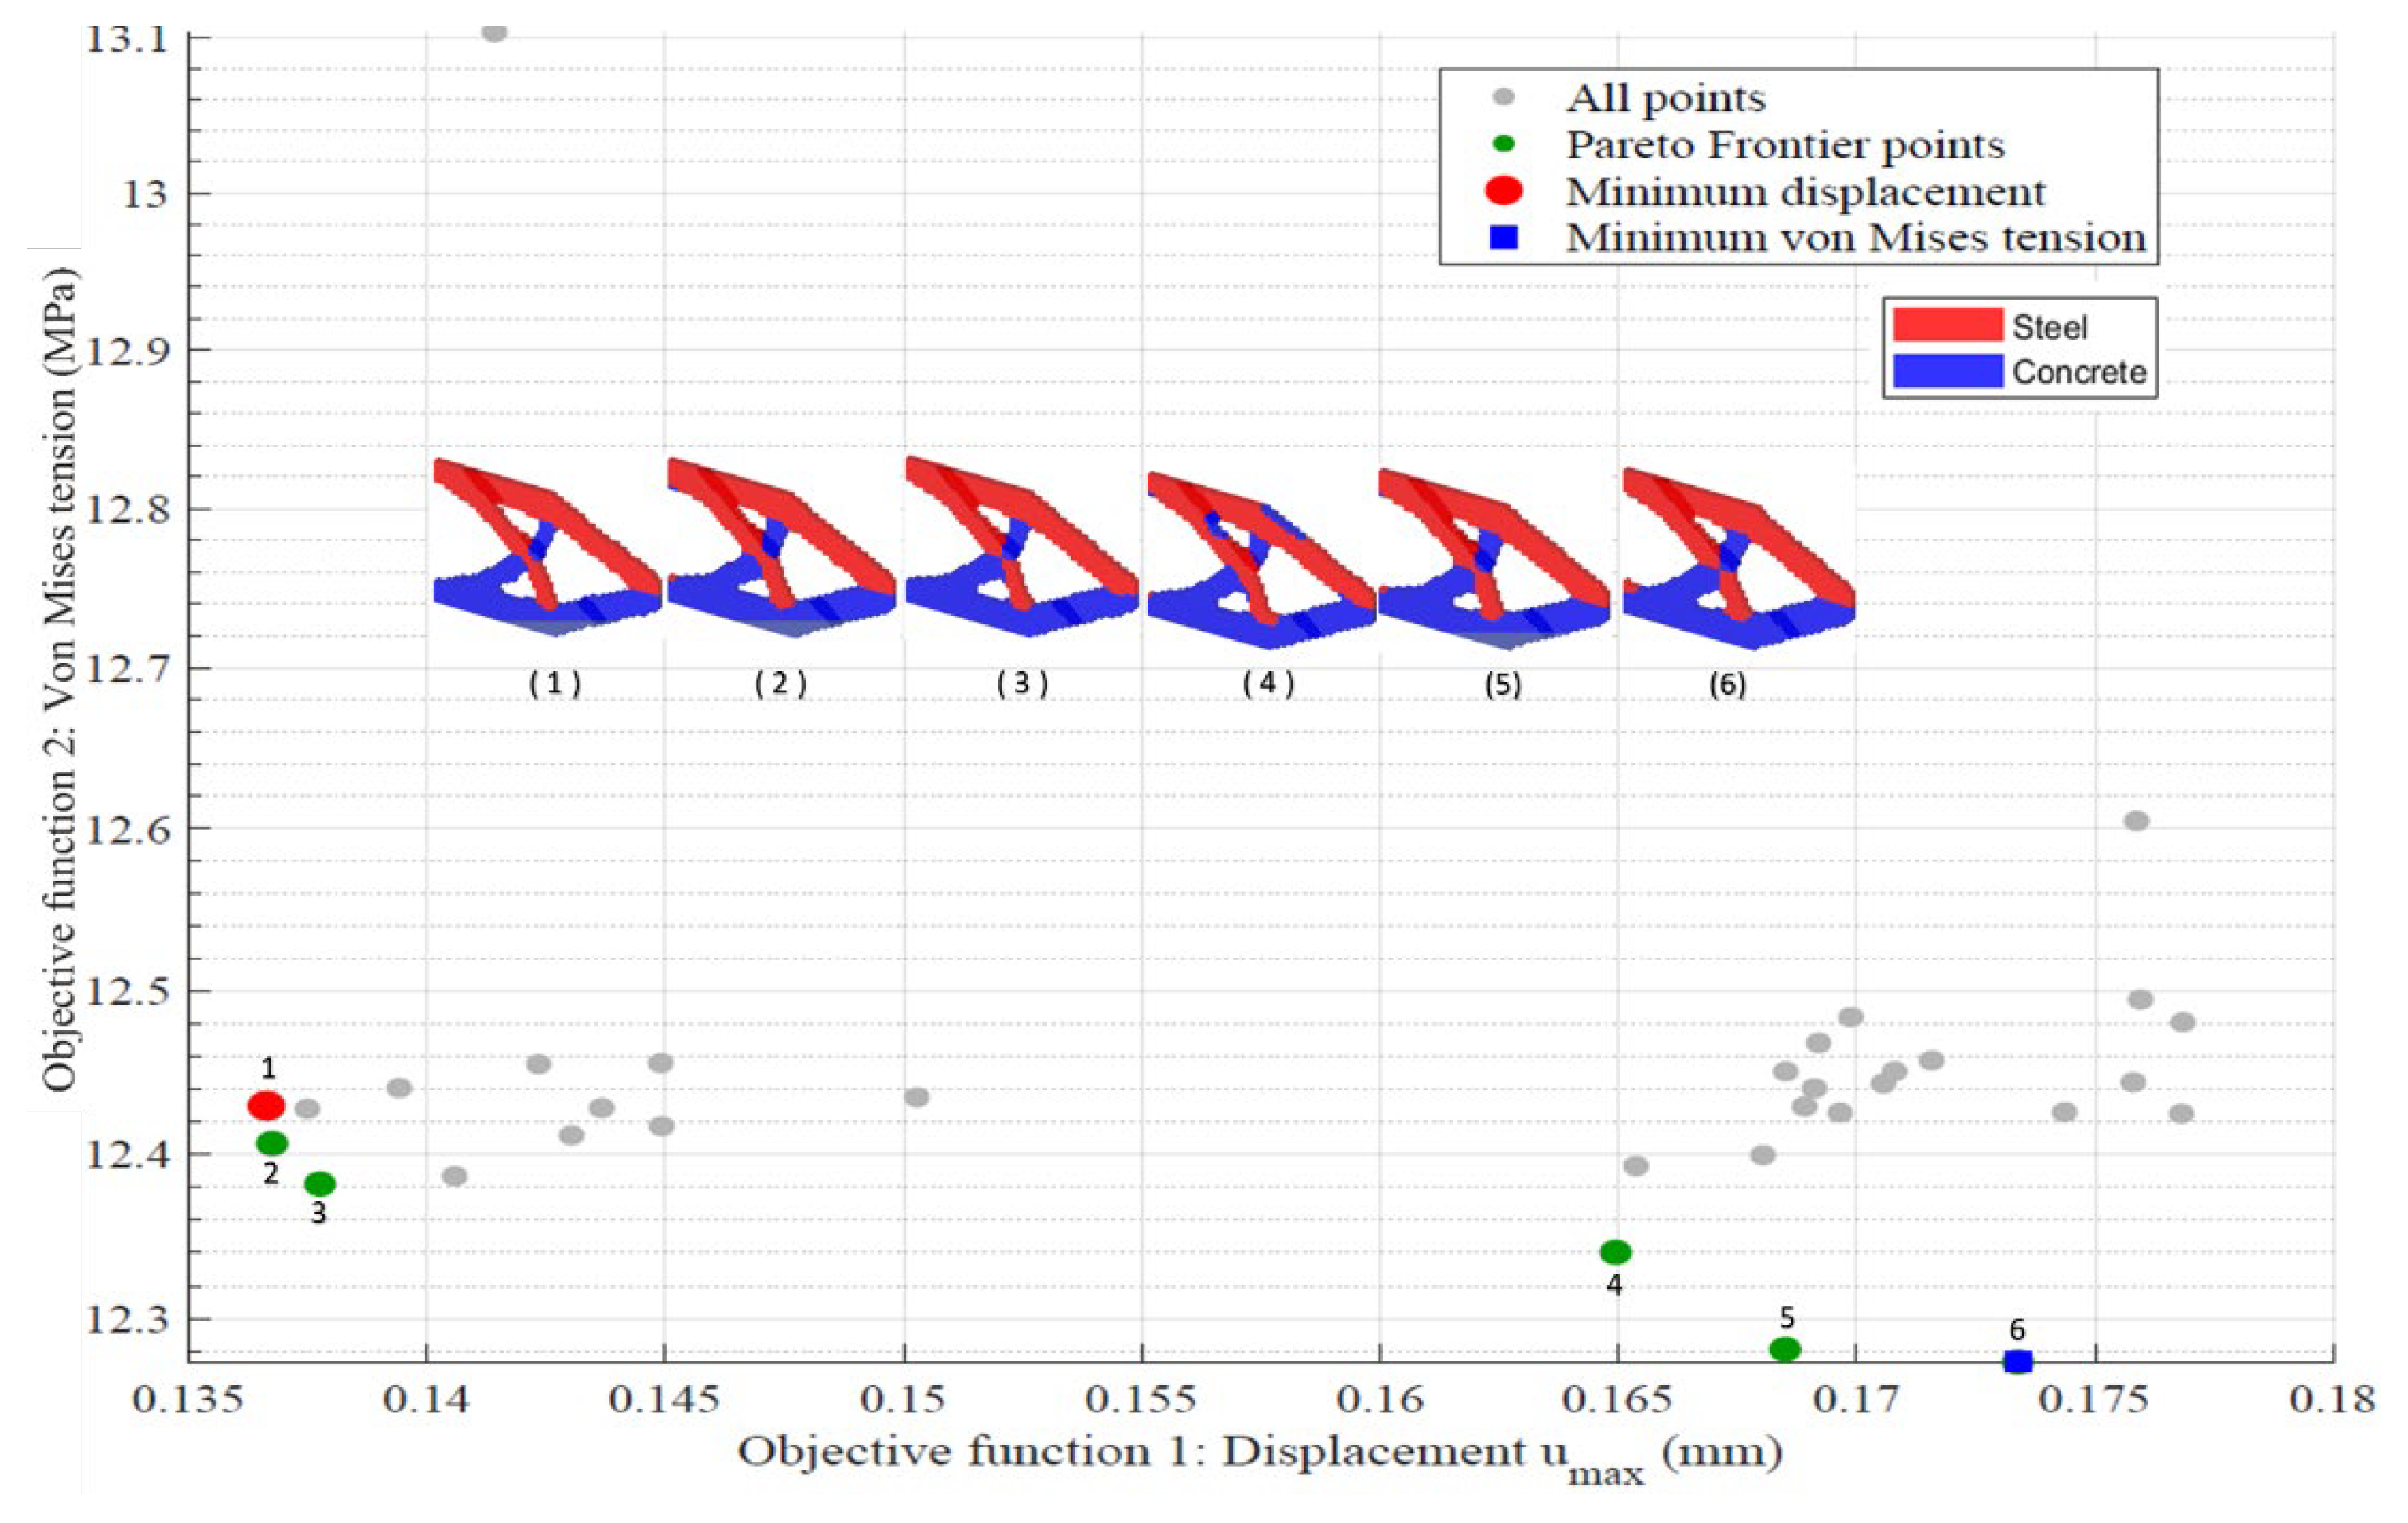
Figure 17.
Pareto Frontier: Optimal SESO-FORM- ().
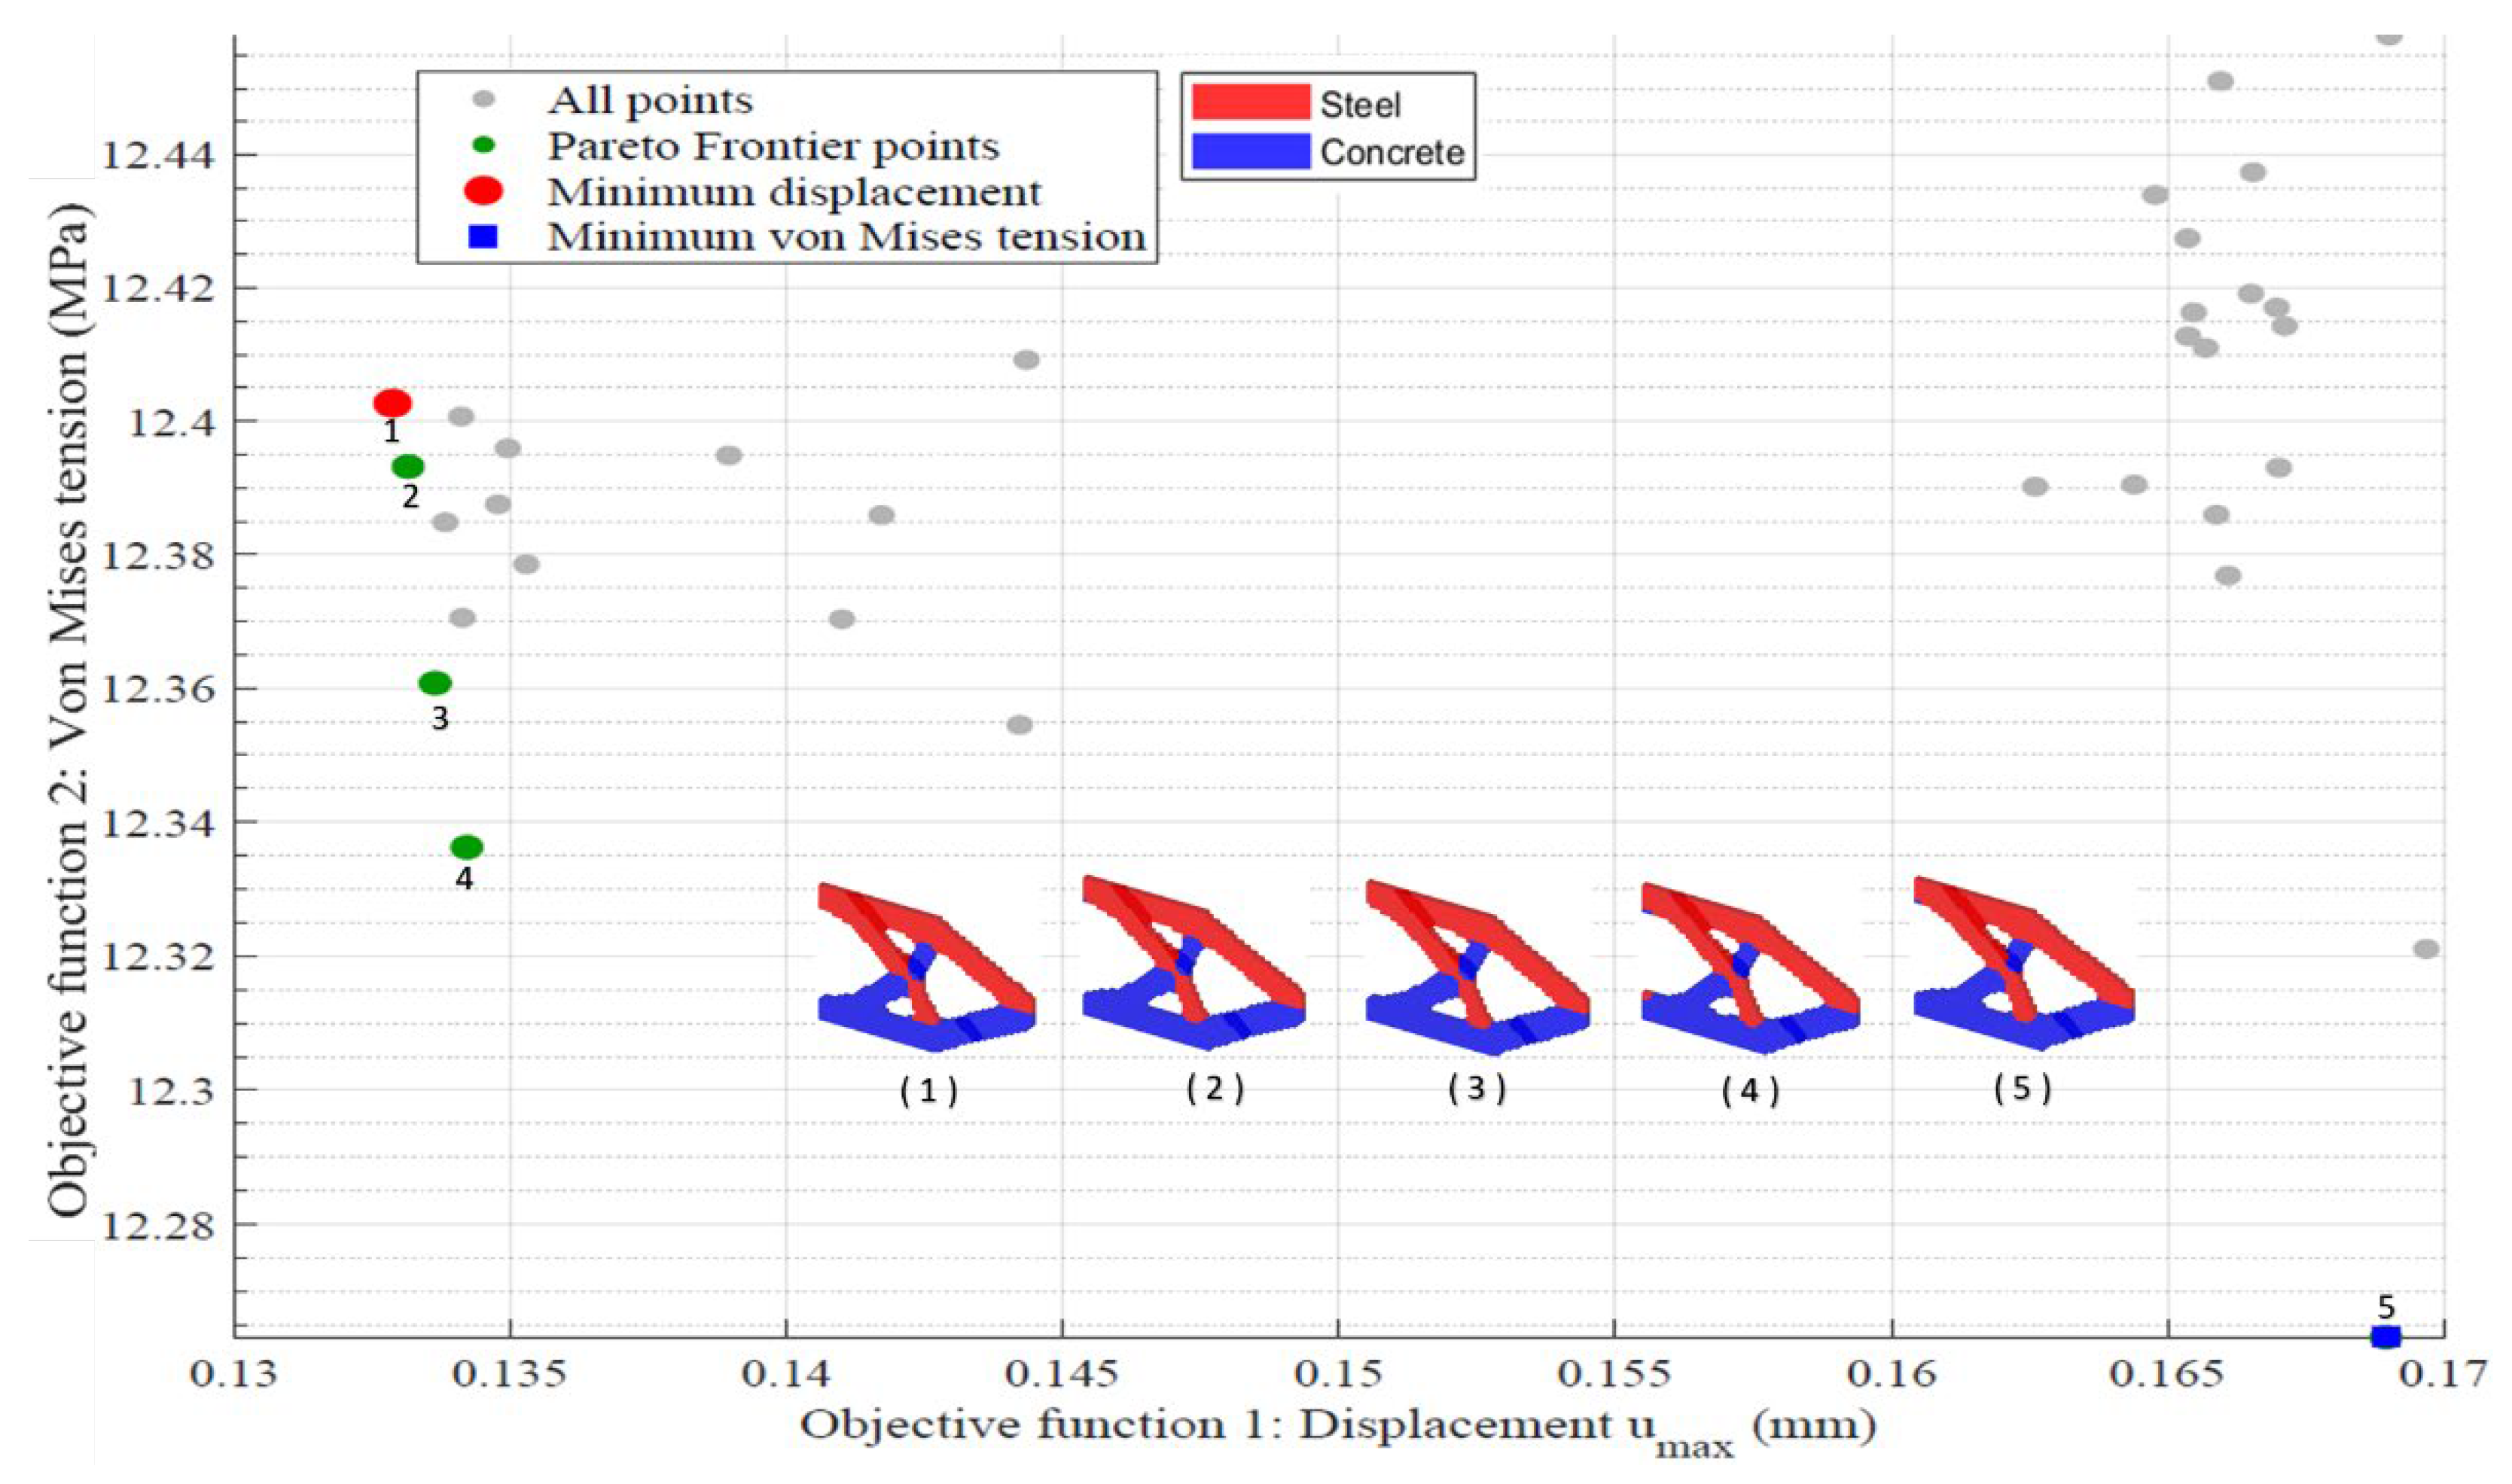
Figure 18.
Center-loaded cantilever beam: Variation of displacement and von Mises stress as a function of weight - DTO.
Figure 18.
Center-loaded cantilever beam: Variation of displacement and von Mises stress as a function of weight - DTO.
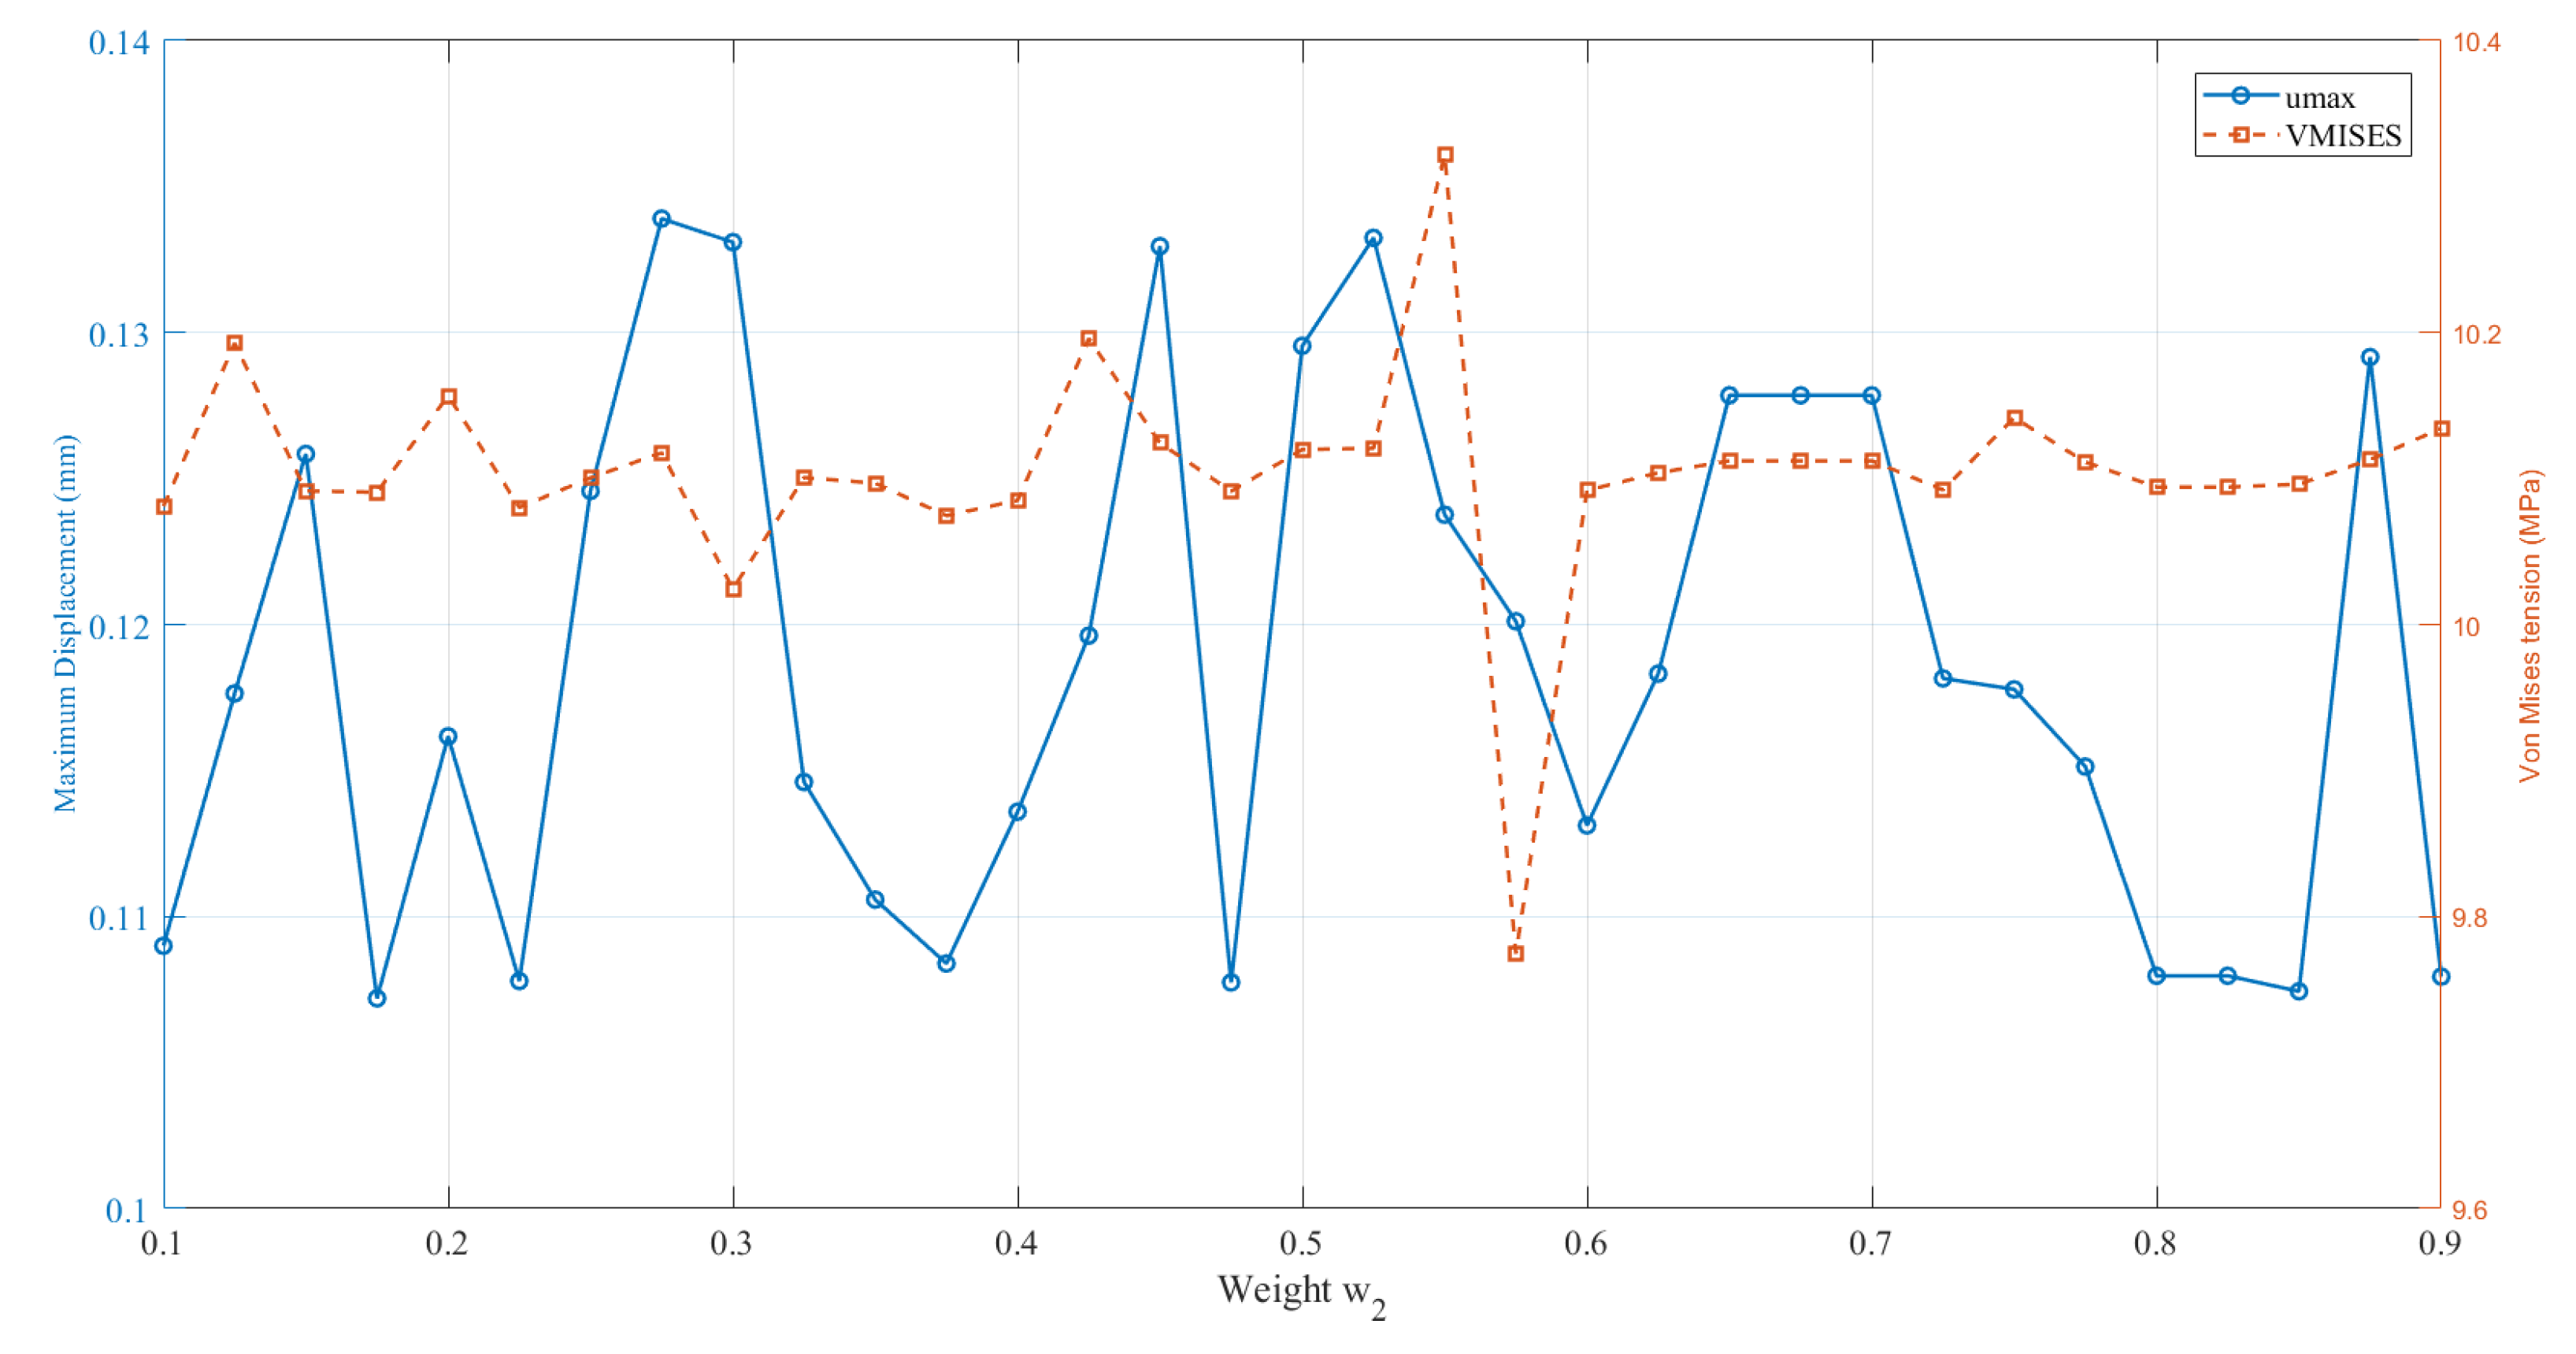
Figure 19.
Center-loaded cantilever beam: Variation of displacement and von Mises stress as a function of weight - SESO-FORM ().
Figure 19.
Center-loaded cantilever beam: Variation of displacement and von Mises stress as a function of weight - SESO-FORM ().
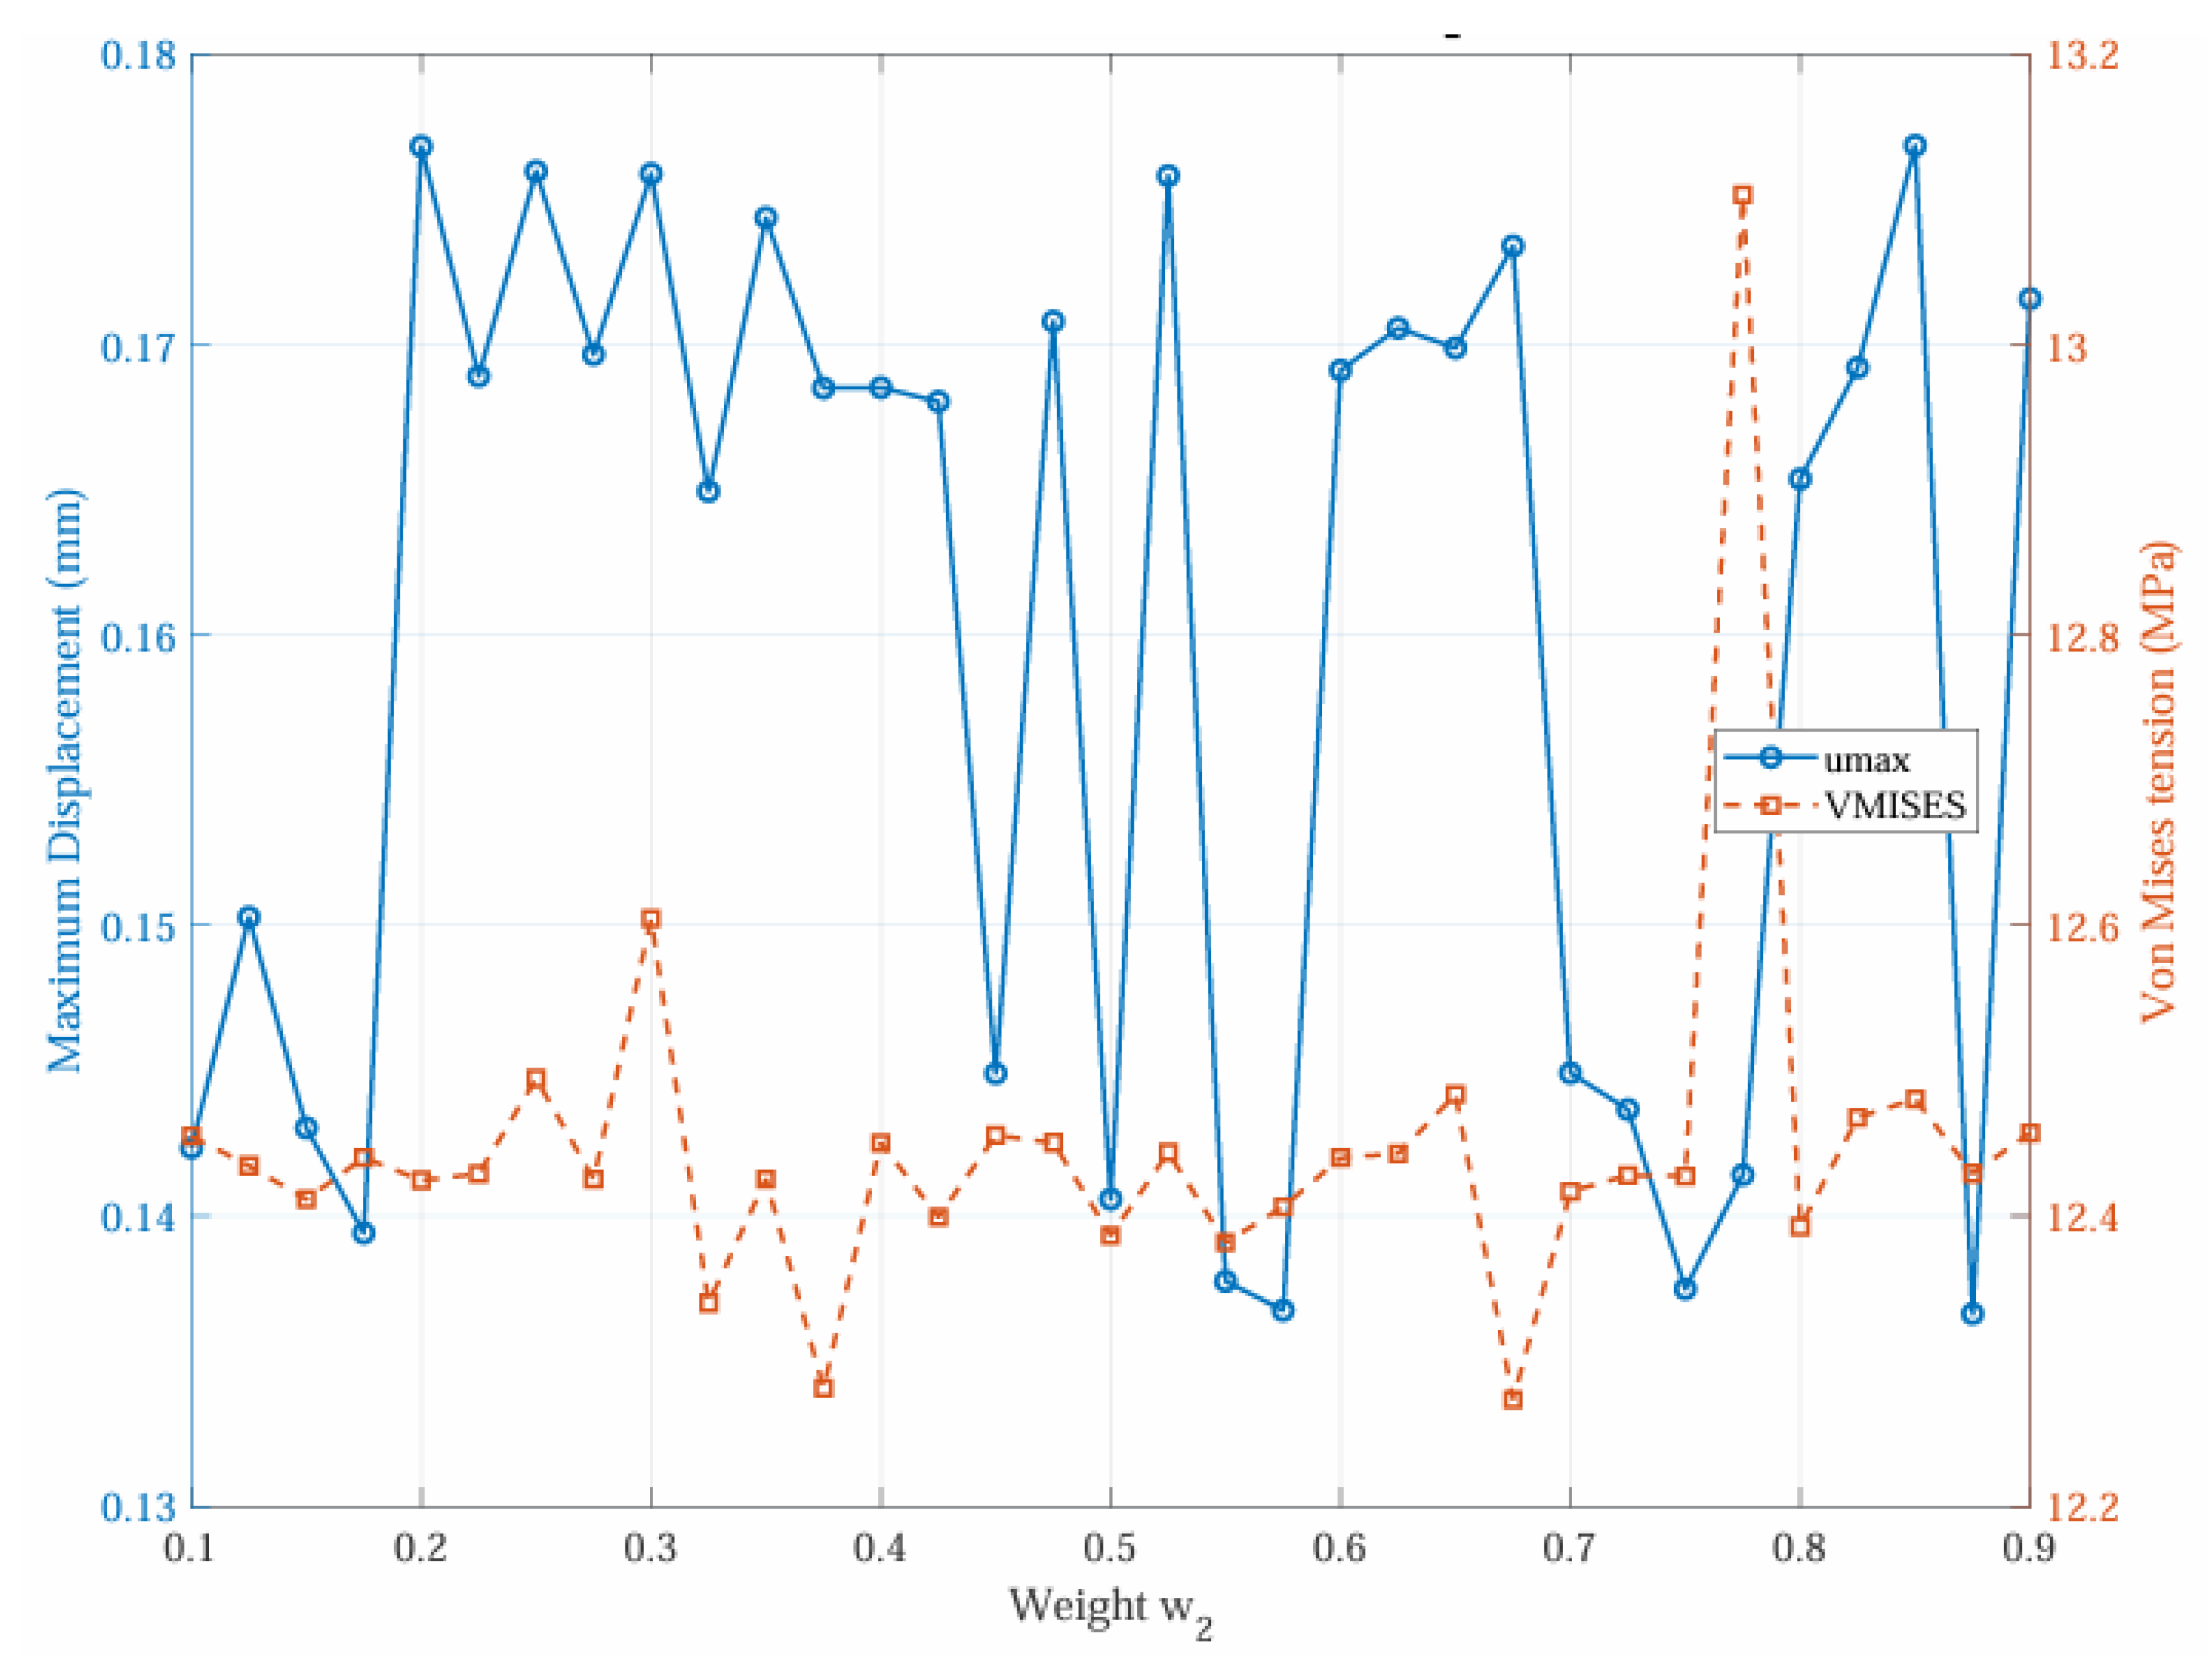
Figure 20.
Center-loaded cantilever beam: Variation of displacement and von Mises stress as a function of weight - SESO-FORM ().
Figure 20.
Center-loaded cantilever beam: Variation of displacement and von Mises stress as a function of weight - SESO-FORM ().
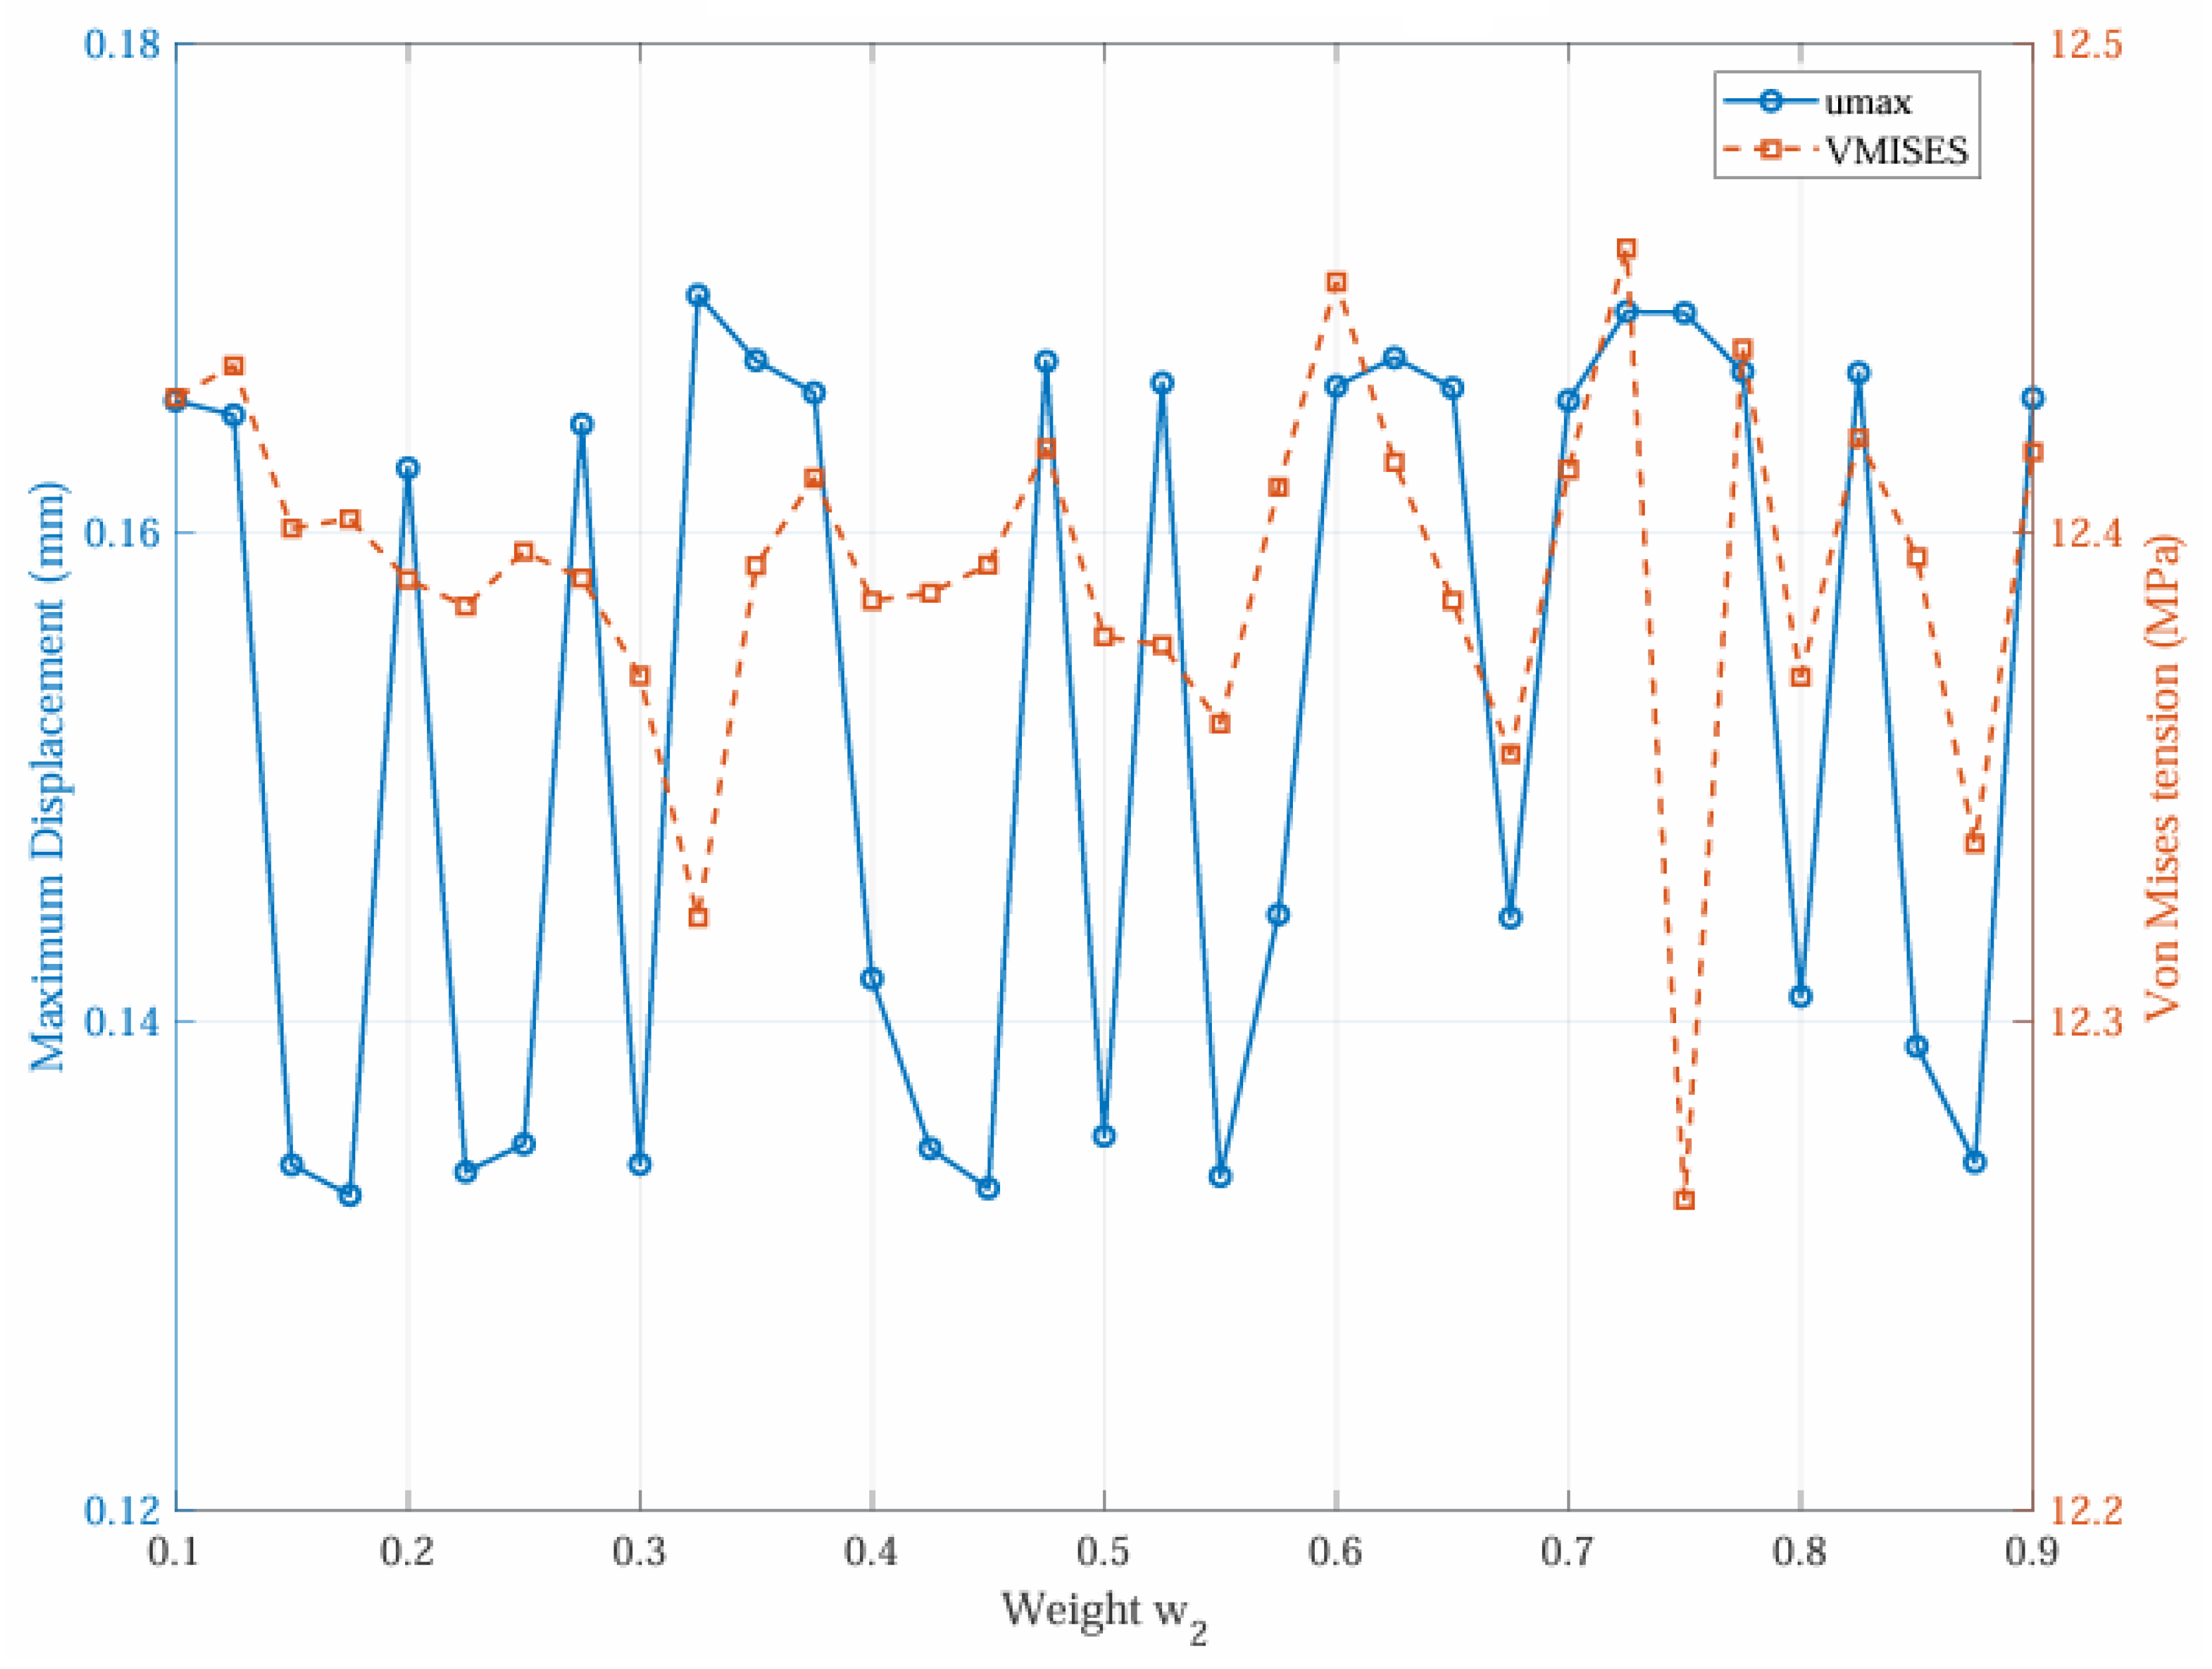
Figure 21.
Monte Carlo simulation histogram of the center-loaded cantilever beam - SESO-FORM (): (a) Von Mises minimum stress point (), (b) minimum displacement point ().
Figure 21.
Monte Carlo simulation histogram of the center-loaded cantilever beam - SESO-FORM (): (a) Von Mises minimum stress point (), (b) minimum displacement point ().
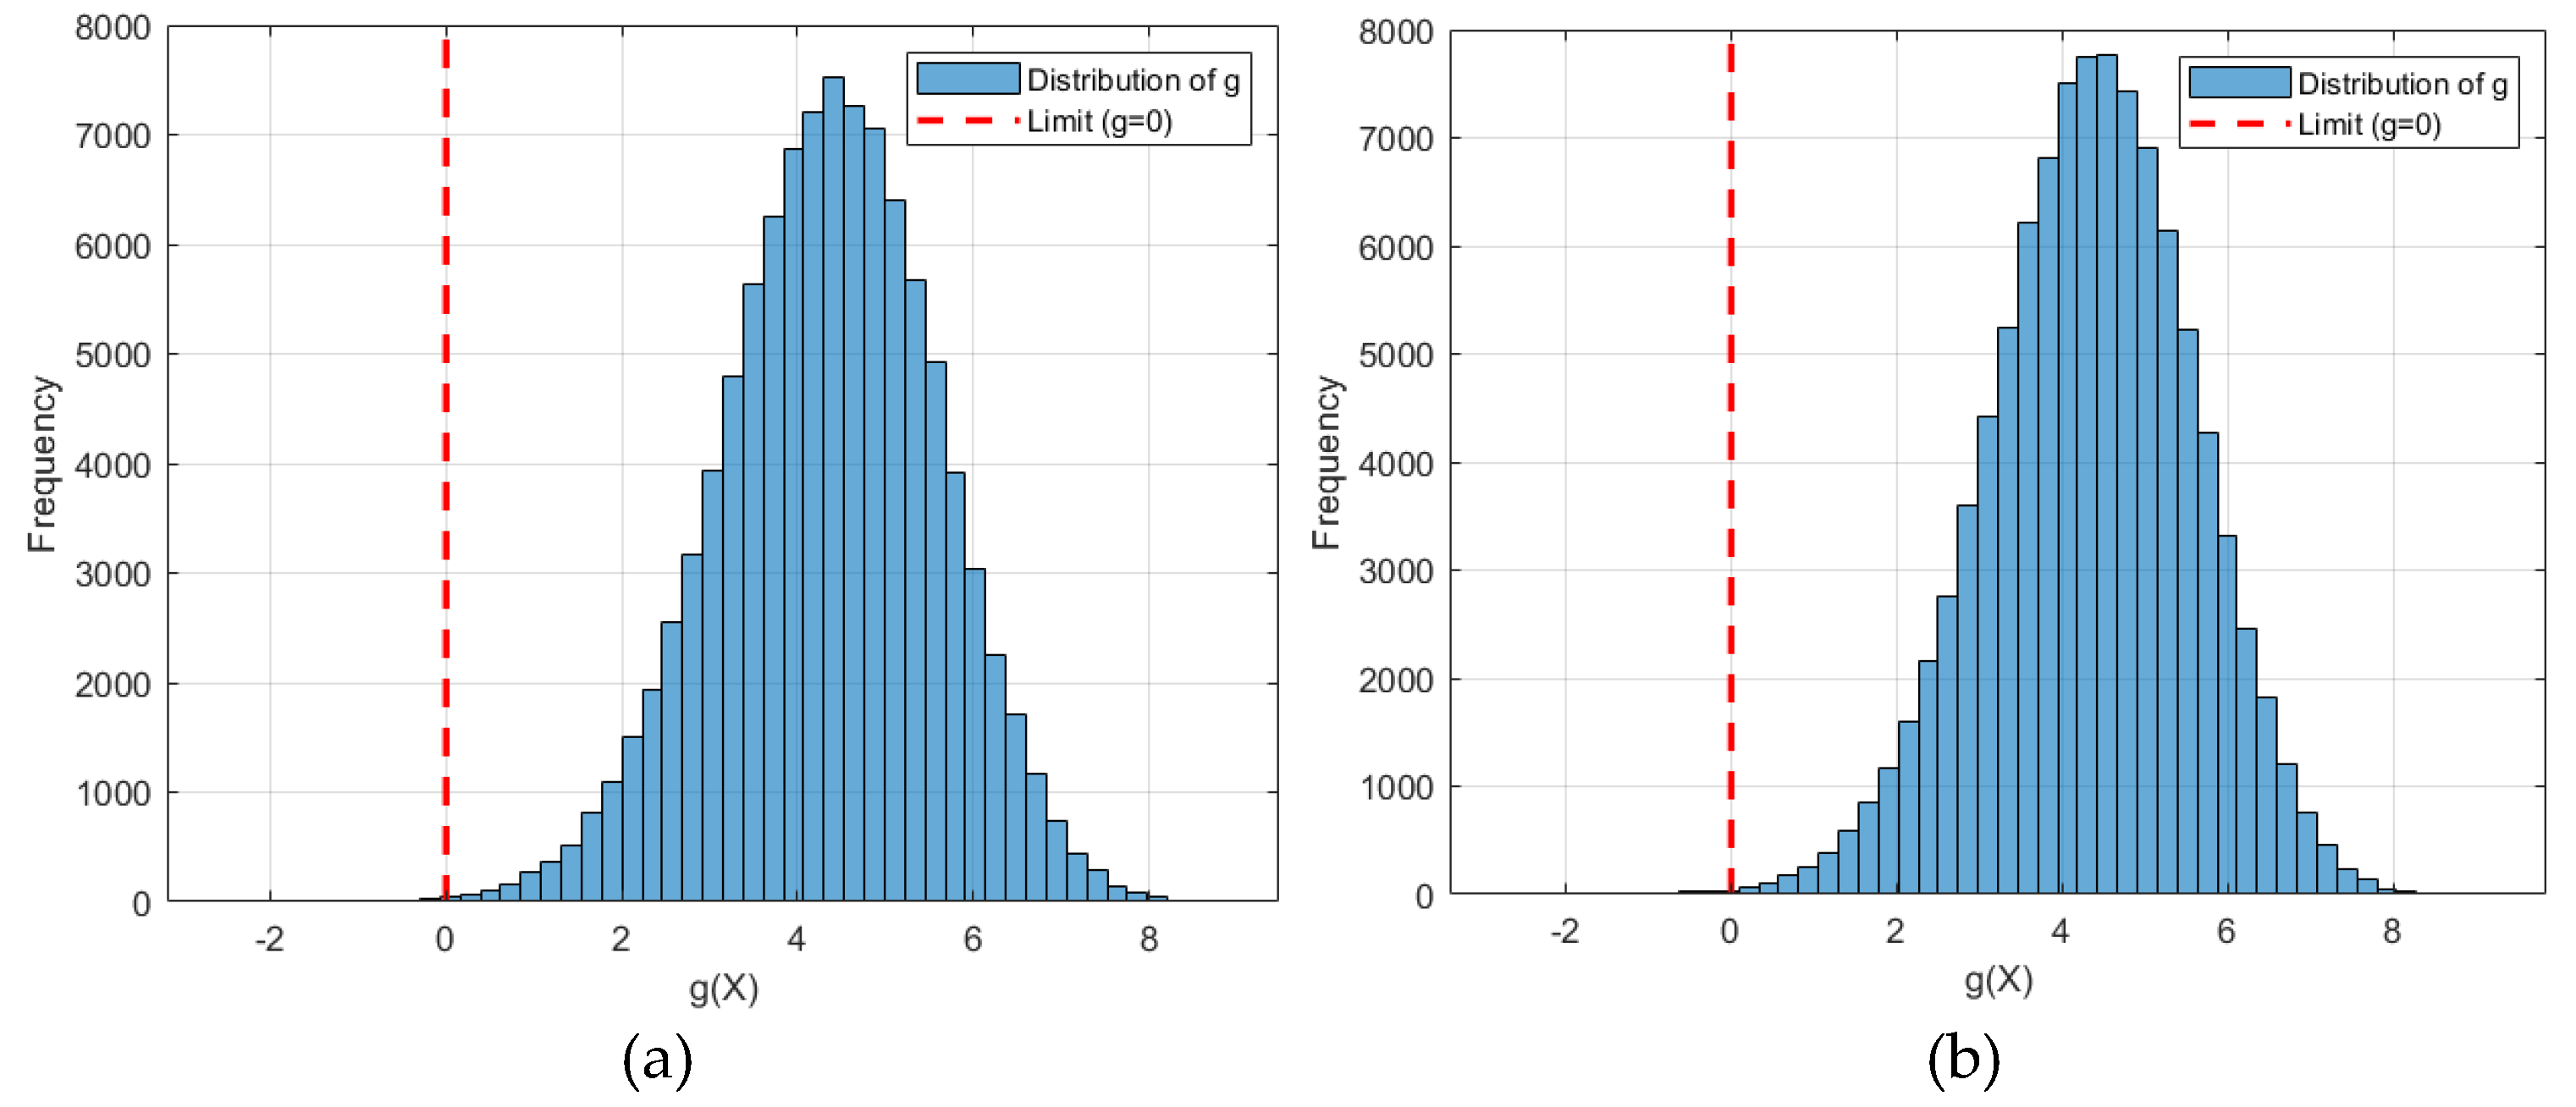
Figure 22.
Monte Carlo simulation histogram of the center-loaded cantilever beam - SESO-FORM (): (a) Von Mises minimum stress point (), (b) minimum displacement point ().
Figure 22.
Monte Carlo simulation histogram of the center-loaded cantilever beam - SESO-FORM (): (a) Von Mises minimum stress point (), (b) minimum displacement point ().


Table 1.
Statistical parameters of random variables.
| Variable Actions |
Manufacturing Variable |
Material Variable |
|||||||||
|---|---|---|---|---|---|---|---|---|---|---|---|
| Variable | μ | V | Variable | μ | V | Variable | μ | V | |||
| F | N | 1e6 | 0.1 | Volfrac | LN | 1 | 0.05 | E | LN | 0.48 | 0.05 |
Table 2.
Material properties adopted in the MMTO.
| Name | E (GPa) | Density (kg/m³) | Color |
|---|---|---|---|
| Empty | 0 | 0 | White |
| Concrete | 50 | 2200 | Blue |
| Steel | 200 | 7860 | Red |
Table 3.
Objective function values and weighting factors – (DTO).
| Optimal configuration |
(MPa) |
(mm) |
||
| 1 | 0.700 | 0.300 | 14.580 | 0.1234 |
| 2 | 0.100 | 0.900 | 14.579 | 0.1347 |
| 3 | 0.550 | 0.450 | 14.578 | 0.1373 |
| 4 | 0.600 | 0.400 | 14.577 | 0.1393 |
Table 4.
Objective function values and weighting factors – Bottom-loaded cantilever beam ().
| Optimal configuration |
Weights | Results | ||||||||
| F (N) |
V |
(MPa) |
(MPa) |
(mm) |
||||||
| 1 | 0.340 | 0.660 | 121,992 | 0.447 | 0.931 | 2.95 | 3.17 | 21 | 17.7877 | 0.1665 |
| 2 | 0.140 | 0.860 | 121,998 | 0.447 | 0.931 | 2.96 | 3.22 | 21 | 17.7874 | 0.1768 |
| 3 | 0.800 | 0.200 | 122,000 | 0.447 | 0.931 | 2.96 | 3.21 | 21 | 17.7869 | 0.1833 |
| 4 | 0.820 | 0.180 | 121,998 | 0.447 | 0.931 | 2.96 | 3.21 | 21 | 17.7865 | 0.1849 |
| 5 | 0.600 | 0.400 | 121,989 | 0.447 | 0.931 | 2.95 | 3.20 | 21 | 17.7856 | 0.1867 |
| 6 | 0.740 | 0.260 | 121,998 | 0.447 | 0.931 | 2.96 | 3.16 | 21 | 17.7846 | 0.1869 |
| 7 | 0.840 | 0.160 | 121,983 | 0.447 | 0.931 | 2.96 | 3.24 | 21 | 17.7845 | 0.1879 |
| 8 | 0.280 | 0.720 | 122,000 | 0.447 | 0.931 | 2.96 | 3.19 | 21 | 17.7844 | 0.1905 |
| 9 | 0.680 | 0.320 | 121,998 | 0.447 | 0.931 | 2.96 | 3.16 | 21 | 17.7843 | 0.1934 |
Table 5.
Objective function values and weighting factors – Bottom-loaded cantilever beam ().
| Optimal configuration |
Weights | Results | ||||||||
| F (N) |
V |
(MPa) |
(MPa) |
(mm) |
||||||
| 1 | 0.240 | 0.760 | 122,085 | 0.448 | 0.933 | 2.92 | 3.10 | 25.5 | 17.8003 | 0.1776 |
| 2 | 0.200 | 0.800 | 122,082 | 0.448 | 0.933 | 2.92 | 3.20 | 25.5 | 17.7995 | 0.1806 |
| 3 | 0.120 | 0.880 | 122,078 | 0.448 | 0.933 | 2.92 | 3.13 | 25.5 | 17.7987 | 0.1840 |
| 4 | 0.500 | 0.500 | 122,079 | 0.448 | 0.933 | 2.92 | 3.15 | 25.5 | 17.7984 | 0.1878 |
| 5 | 0.320 | 0.680 | 122,080 | 0.448 | 0.933 | 2.92 | 3.09 | 25.5 | 17.7981 | 0.1895 |
| 6 | 0.140 | 0.860 | 122,075 | 0.448 | 0.933 | 2.92 | 3.15 | 25.5 | 17.7979 | 0.1910 |
| 7 | 0.860 | 0.140 | 122,065 | 0.448 | 0.933 | 2.92 | 3.11 | 25.5 | 17.7979 | 0.1982 |
Table 6.
Objective function values and weighting factors – center-loaded cantilever beam (DTO).
| Optimal configuration |
(MPa) |
(mm) |
||
| 1 | 0.260 | 0.740 | 10.109 | 0.0931 |
| 2 | 0.760 | 0.240 | 10.053 | 0.0934 |
| 3 | 0.880 | 0.120 | 10.015 | 0.1004 |
| 4 | 0.740 | 0.260 | 10.007 | 0.1173 |
Table 7.
Objective function values and weighting factors – center-loaded cantilever beam ().
| Optimal configuration |
Weights | Results | ||||||||
| F (N) |
V |
(MPa) |
(MPa) |
(mm) |
||||||
| 1 | 0.125 | 0.875 | 123,261 | 0.445 | 0.927 | 3.14 | 3.19 | 14.5 | 12.4293 | 0.1366 |
| 2 | 0.425 | 0.575 | 123,066 | 0.445 | 0.927 | 3.12 | 3.13 | 14.5 | 12.4063 | 0.1367 |
| 3 | 0.450 | 0.550 | 123,066 | 0.445 | 0.927 | 3.12 | 3.15 | 14.5 | 12.3817 | 0.1377 |
| 4 | 0.675 | 0.325 | 122,015 | 0.447 | 0.932 | 2.96 | 3.33 | 14.5 | 12.3401 | 0.1649 |
| 5 | 0.625 | 0.375 | 123,057 | 0.443 | 0.927 | 3.11 | 3.13 | 14.5 | 12.2814 | 0.1685 |
| 6 | 0.325 | 0.675 | 123,079 | 0.445 | 0.927 | 3.12 | 3.16 | 14.5 | 12.2737 | 0.1733 |
Table 8.
Objective function values and weighting factors – center-loaded cantilever beam ().
| Optimal configuration |
Weights | Results | ||||||||
| F (N) |
V |
(MPa) |
(MPa) |
(mm) |
||||||
| 1 | 0.825 | 0.175 | 122,904 | 0.447 | 0.931 | 3.03 | 3.05 | 17.5 | 12.4026 | 0.1329 |
| 2 | 0.550 | 0.450 | 123,008 | 0.447 | 0.931 | 3.04 | 2.98 | 17.5 | 12.3932 | 0.1331 |
| 3 | 0.450 | 0.550 | 122,552 | 0.447 | 0.931 | 2.99 | 2.78 | 17.5 | 12.3607 | 0.1337 |
| 4 | 0.125 | 0.875 | 122,619 | 0.447 | 0.931 | 3.00 | 2.79 | 17.5 | 12.3362 | 0.1342 |
| 5 | 0.250 | 0.750 | 123,516 | 0.447 | 0.929 | 3.10 | 2.87 | 17.5 | 12.2633 | 0.1689 |
Disclaimer/Publisher’s Note: The statements, opinions and data contained in all publications are solely those of the individual author(s) and contributor(s) and not of MDPI and/or the editor(s). MDPI and/or the editor(s) disclaim responsibility for any injury to people or property resulting from any ideas, methods, instructions or products referred to in the content. |
© 2026 by the authors. Licensee MDPI, Basel, Switzerland. This article is an open access article distributed under the terms and conditions of the Creative Commons Attribution (CC BY) license.
Copyright: This open access article is published under a Creative Commons CC BY 4.0 license, which permit the free download, distribution, and reuse, provided that the author and preprint are cited in any reuse.


