
Submitted:
28 January 2026
Posted:
29 January 2026
You are already at the latest version
Abstract
This study investigates the dynamic artifacts (DAs) in knitted resistive strain sensors (KRSS) subjected to various deformation types, including stair-wise, trapezoidal, and triangle-type deformations. The presence of DAs, characterized by sharp peak-wise increases in resistance followed by a gradual decline, was observed across all KRSS samples. The amplitude of DA peaks increased with higher deformation velocities. The study also identified the temporal offset between resistance and deformation during linear deformation, suggesting a complex mechanism underlying DAs. The results demonstrate that DAs are most prominent in stepwise and trapezoidal deformations, while continuous defor-mations like triangle-type loading partially mask these artifacts. Manifestation of DAs in KRSS degrades the metrological characteristics of KRSS and cannot be ignored. This paper provides insights into the relationship between KRSS structure, deformation velocity, and DA behaviour, and highlights the need for developing compensation methods to mitigate the impact of DAs on measurement accuracy.
Keywords:
dynamical artifacts
; knitted resistive sensors
; smart textiles
; conductive yarns
1. Introduction
In recent years, the development of functionalized "smart" garments has attracted significant interest due to their potential to transform everyday clothing into highly functional, high-value products. One of the most attractive directions in smart textiles is the incorporation of embedded textile strain or pressure sensors. Such devices enable the recording of human biomechanical parameters for medical, sports, or virtual reality applications. Several prototypes have already been developed and described in numerous publications [1,2,3,4,5,6,7].
Textile strain/pressure sensors could be created using various manufacturing techniques, including weaving, knitting, embroidering, printing, or a combination of these methods [2]. Typically, these sensors are made using electro-conductive yarns, such as metal-plated or impregnated yarns, or coatings, such as graphite-based materials, and they primarily function is resistive strain or pressure gauges. The advantage of these sensors is that they can be integrated into garments together with electro-conductive pathways without compromising comfort. As an example, knitting technology has gained popularity as it allows for the integration of sensors during the manufacturing process using commercially available knitting equipment.
The principle behind resistive knitted strain sensors is relatively straightforward: as the fabric deforms, the number of electrical contacts between conductive yarn loops within the knitted structure changes, leading to variations in resistance. These sensors demonstrate high sensitivity and can withstand elongations up to 20-30% [3]. Furthermore, their characteristics can be controlled by selecting the type of conductive yarn and the structure of the knitted fabric, at least in theory.
Despite such promising prospects, knitted resistive strain sensors (KRSS) face challenges due to their poor metrological characteristics: KRSS often exhibit non-linearity and hysteresis [4]. In addition to these, KRSS demonstrates a peculiar phenomenon: under dynamic loading, the resistance of KRSS displays sharp peak-wise changes at the beginning of deformation, regardless of whether it's being loaded or unloaded. This phenomenon, referred to in the text as a dynamical artefact (DA), has been observed in knitted sensors in various publications [5,6,7]. A similar phenomenon was also observed in textile-based sensors produced using printing/coating technology with various electro-conductive paint fillers, as well as in polymer film piezo resistive transducers [8,9]. Up to now, researchers have generally ignored the existence of DA or tried to address DAs by using various filtering methods, which is challenging, as it may impact KRSS sensitivity and complicate data processing.
For the first time, the existence of DA was mentioned in literature for the case of textile polymer-coated sensors, but this phenomenon was not studied in detail [10]. To the authors' knowledge, only one research group has attempted to study and explain DA so far [9]. They worked on the development of a piezo-resistive pressure sensor based on a polymer film with embedded conductive nano-particles and tried to explain the DA using a 2D model based on tunnelling current between nano-particles and percolation theory. These researchers also proposed to use DA to increase the sensitivity of polymer film sensors for “on/off” applications instead of filtering or compensating them.
The present paper comprises the first attempt to provide a detailed description of DA manifestation in KRSS and explore its dependencies on deformation, loading rate, properties of conductive yarns, and structure of the knitted fabric. This is required as the first step to be made in understanding the phenomenology of DAs and creating accurate models of KRSS behaviour under dynamic load. The study employs knitted sensors, previously developed by the authors and applied for human motion monitoring as an example of KRSS [11,12].
2. Materials and Methods
2.1. Characteristics of Yarns and Studied Knitted Structures
The structure of KRSS was knitted using combed cotton yarn (Nm 40), plated by pneumatically bound elastane/polyester yarn (22/78 dtex), and electrically conductive yarn using technology developed by the authors [3]. The two types of conductive yarn were (Figure 1). used in the study: silver-plated polyamide yarn (Shieldex® 110/34 dtex HC+B), and acrylic yarn impregnated with copper salt (S.E. TECH Nm50).
Three types of stitches were studied: plain stitch (PL), rib 1×1 stitch (RB), and half-cardigan stitch (HC). The PL samples were manufactured with two different knitting densities, further named the low-density sample (LDS) and the high-density sample (HDS). All electroconductive fabrics were knitted using a 3¾" circular knitting machine with a 14th gauge [11]. Figure 2 shows the structures of the studied stitches. The size of the tested specimens was 155 x 40 mm.
Silver-plated polyamide (SPP) is a multifilament fiber yarn, while copper salt-impregnated acrylic (AIM) is a staple yarn. Consequently, SPP and AIM yarns exhibit significantly different hairiness, with SPP having fewer fibers sticking out and AIM having a "hairy" structure with numerous protruding fibers (Figure 1). The chosen knitting stitches also provide fabric with different properties: PL has the smoothest surface, RB is more voluminous and porous due to its double-faced structure, and HC has the highest volume and porosity due to tuck loops in its stitch [13].
2.2. Experimental Setup
A custom-made slider-crank device was assembled to provide dynamic deformation of KRSS (Figure 3). Figure 3A represents the deformation principle, but Figure 3B represents the assembled deformation device. Crank and connecting rod lengths were 20 and 100 mm, respectively, which provided the slider’s motion range of 0 - 40 mm. Fixed clamp attached one end of the KRSS sample to the unmoving device base, while the moving clamp attached another end of the sample to the slider. The crank rotation was controlled by a step motor 17HS4401 (Longrunner) operated by an Arduino circuit board. The minimal rotation step of the motor was 1.8o. This configuration allowed adjustment of KRSS deformation amplitude, velocity, and type of slider motion: stair-wise with incremental and decremental amplitudes, trapezoidal, and triangular. The slider velocity varied within a range of about 2 to 40 cm/s, which corresponds to the velocities of the deformation of the garment’s fabric in the majority of biomechanical motions.
The KRSS deformation was controlled by setting the crank's angular position (step motor axis rotation) and measured using the linear potentiometer. The potentiometer was home-calibrated to relate changes in resistance to the position of the slider. The resistances of KRSS and the potentiometer were measured using a custom-made 8-channel data acquisition module, already exploited in the authors’ previous projects [12,14]. The module was designed on the basis of the CY8C52LP family microcontroller (model CY8C5268LTI-LP030) from Infineon Technologies Company. The module measured the voltage drop over the sensor resistance, caused by injection of the DC using the microcontroller DAC current output, thereby implementing the two-electrode-four-wire method, suggested by the standard EN 16812:2016 [15]. The measured voltage was then recalculated by the module software to the resistance values in kOhms. The module enabled measurement of resistance up to 1024 kOhm; there was a possibility to set one of the 10 measurement ranges (the ranges 2, 4, 8, 16, 32, 64, 128, 256, 512, and 1024 kOhm). The sampling rate was 150 Hz; the time was measured using the internal timer of the controller. The ADC of the controller sampled the voltage over the potentiometer and the KRST resistance sequentially via an analog multiplexer. Hereby, the temporal desynchronization of the recorded time point, resistance of the potentiometer, and resistance of the KRSS sample did not exceed 6.7 milliseconds. The module communicated measured values over Bluetooth® connection to the LabVIEW–based data recording software.
The uncertainties of the experimental setup were estimated as B-type uncertainty. The calculation of the uncertainty of the resistance measurement accounted for the uncertainty of the controller reference voltage, the discretization error of the 8-bit DAP, and the discretization error of the 12-bit ADC, which in total yielded a fiducial error ± 2.5%. The absolute uncertainty depended on the pre-set measurement range of the data acquisition module. The uncertainty of the time measurement was estimated to be less than maximal temporal desynchronization between measured values (see above), and was assumed equal to ± 6.7 ms. The uncertainty of the extension measurement included uncertainty of the measurement of potentiometer resistance, the uncertainty of in-house calibration of the potentiometer, and hysteresis of the potentiometer, the latter provides the main contribution to the uncertainty. The resulting uncertainty of extension measurement was ± 3 mm.
2.3. Testing Method
One specimen was prepared for each combination of stitch type, yarn type, and stitch density. Nevertheless, only plain and half-cardigan specimens were tested for all loading types: star-wise, trapezoidal, and triangular. The rib stitch specimens and high-density plain stitch made with silver-plated yarn were tested only with triangle loading, just to demonstrate the existence of DA, because from the authors’ experience, KRSS made using this type of stitch have the shortest (in respect to other types) dynamic range and are not so useful for practical application. An overview of the studied samples and applied slider motion types is presented in Table 1. The specimens were subjected to tests of each loading type in random order.
The specimen was fixed between clamps in an unstretched state and warmed up by 10 loading–unloading cycles with maximal elongation of about 30%. After warming up, the specimen sagged because of elongation. Then the fixed clamp was released, the specimen was manually pre-stretched to remove sag, and the clamp was fastened again. If the specimen was mounted for the first time, the baseline resistance of the specimen was measured. In subsequent measurements, the specimen was manually pre-stretched in a way that its resistance was set equal to the baseline value ± 5%. Hereby, the repeatability of the insertion of the sample was provided.
The stair-wise loading was provided by a gradual increment of crank angle by 90 degrees from zero to 99o in 11 steps. This provided maximal total sample elongation of about 15.0%. The loading velocity was 13.3 cm/s. At each step, the crank remained in position for 5 seconds.
For the trapezoidal loading, the mounted specimen was pre-stretched by initial crank positioning at 36o, which corresponded to the initial relative deformation of 2.5%. The trapezoidal deformation included stretching with a constant velocity up to pre-set relative deformation, dwell for the pre-set time, and recoil at constant velocity to the initial pre-stretched deformation of 2.5%. The parameters of the trapezoidal deformation are summarized in Table 2.
3. Results
3.1. Stair-Wise Deformation
Figure 4 depicts the typical waveforms of KRSS resistance for the stair-wise type of slider motion. The figure illustrates KRSS response to deformation with a corresponding stepwise increase or decrease in resistance, representing the expected behaviour of the sensor. However, in addition to the anticipated variations due to elongation, KRSS resistance exhibits specific DAs that manifest as sharp peak-wise increases in resistance during both extension and recoil, followed by resistance creep. As a result, the resistance waveform exhibits a remarkable “Christmas tree candles” pattern: the resistance increases sharply in a peak-like manner and then gradually declines during both extension and recoil. This characteristic pattern was observed in all tested specimens.
3.2. Trapezoidal Deformation
Figure 5 presents the typical resistance-time curves for KRSS subjected to trapezoidal deformation at different slider motion velocities. The presence of DA was evident across all deformation velocities, and there was a clear tendency that the amplitude of DA peaks increased with higher deformation velocities. Analysis revealed that the DA peaks’ value is also affected by the “smoothness” of the KRSS structures. Specifically, less "fluffy" structures, such as plain stitch with high knitting density (PL PP HDS), exhibited more pronounced and sharper DAs. This demonstrates a relationship between knitting structure properties and the manifestation of DA.
Data analysis revealed several common features of DA, observed across all the KRSS samples studied:
- Resistance peak values were consistently higher during extension than during recoil, regardless of the type of KRSS sample.
- Within the range of sensor linearity, resistance peak values exhibited nearly linear dependence on KRSS deformation (green dotted lines in Figure 4) for both elongation and recoil.
- The resistance peak values, sharpness, and shape of DA peaks were found to be strongly dependent on the parameters of KRSS, such as the type of conductive yarn, knitting structure, and knitting density, as well as on the kinematic parameters of loading-unloading cycle and deformation velocity.
The present paper, for the first time, pays attention to the most intriguing feature of DA in KRSS. To observe this feature, both deformation and sample resistance should be recorded with a proper temporal resolution that provides at least 10 – 20 data points for the extension or recoil stage. During linear deformation, the resistance of the KRSS sample increases to a maximum and starts to decrease before the deformation reaches the final value. In other words, the specimen is still stretched, but its resistance has already decreased. This temporal offset between resistance and deformation suggests a complex mechanism of the DA artefacts, which could not be explained by just the mechanical relaxation of the strained knitted structure. Figure 5.b shows this feature for two values of KRSS deformation velocities.
One should note that resistance waveforms for low loading-unloading velocities demonstrate multiple peaks that look like ripple overlaying the smooth “principal” peak. This was caused by the vibration of the step engine motor shaft at low velocities. At high velocities, the vibration disappeared.
For each type of yarn and knitting stitch, an interesting feature of the observed loading/unloading curves is the invariance of the shape of the normalized resistance peak with respect to the KRSS deformation velocity, regardless of the type of stitches, knitting densities, or yarn types. To illustrate this feature, Figure 6 demonstrates time-resistance waveforms for the HC AIM sample for three different velocities, normalized with respect to time. The waveforms in Figure 6c and Figure 6d were normalized with respect to resistance, too. The time was scaled to set both loading and unloading times equal to unity. The sensor's resistance was normalized to the peak value of the loading waveform for stretching, and to the peak value of the unloading waveform for recoil. The similarity in the peak shapes holds for both extension and recoil stages and for all studied samples.
To study the dependence of the DA peak amplitude values on the loading/unloading velocities, the peak response waveforms were normalized. Figure 7a illustrates the parameters extracted from the original waveform, corresponding to a single loading–unloading cycle. The normalized peak values were calculated as follows:
where Ai - the amplitude value of the DA peak at loading (A1) or unloading (A2),
Bload - the baseline resistance of the loaded sample,
Bunload - the baseline resistance of the unloaded sample.
The baseline resistance of the loaded sample is the resistance immediately before the unloading starts. The baseline resistance if the unloaded sample corresponds to the resistance of the unloaded specimen just before the loading begins. The values of the parameters Bload and Bunload for the tested samples are summarized in Table 3. The baseline values are as expected: the resistance of unloaded samples made with silver-plated yarn is in the range of ohms due to the high conductivity of the silver-plated yarn itself. Conversely, the resistance of specimens made with copper salt-impregnated yarn is in the range of tens of kiloohms. A remarkable fact is the extremely high ratio Bload / Bunload for the plain silver-plated yarn sample: about 160 as opposed to 2-3 for other samples. This is an illustration of extremely high sensitivity, usually demonstrated by such a type of sensor [3].
Figure 7b shows the dependence of normalized peak values on loading/unloading velocities. All studied samples exhibited a clear increase in DA peak amplitude with a tendency to saturation for both loading and unloading cases. The possible exception is the amplitudes of the unloading peak in the plain stitch sample made with silver-plated yarn (PL SPP LDS), which demonstrated a slight decrease as unloading velocity increased; nevertheless, this variation of peak value is comparable with measurement uncertainty.
The shapes of the normalized DA peaks of the different samples for two different loading/unloading velocities are compared in Figure 8. The peaks’ waveforms are drawn versus normalized time, like one in Figure 6. These graphs allow for a comparison of the 'sharpness' of DAs depending on the yarn and stitch type.
3.3. Triangle Deformation
In the case of triangle-type deformation, all the above-discussed DA features are observed, too. Figure 9 represents typical resistance waveforms for the triangle-type deformation of the PL AIM LDS sample. The time scale was normalized to the loading–unloading period, so the arbitrary time for one loading cycle was set equal to unity. Figure 9a, c clearly shows that the amplitudes of the DA peaks increase as the deformation velocity rises. At the same time, the shape of the peaks remains the same (Figure 9b), hence demonstrating invariance of loading-unloading waveform shape with respect to the deformation velocity, observed earlier for the trapezoidal type of deformation (Figure 6).
It is important to note that, for triangle-type deformation, the DAs are less distinguishable than in the case of trapezoidal deformation. DA at the start of recoil could be almost entirely masked by the decrease in resistance caused by KRSS shrinkage and the simultaneous creep of resistance, especially for lower deformation velocities.
4. Discussion
The previous section demonstrated the presence of DA in KRSS with different structural compositions and material characteristics. The analysis indicates that these DAs are significantly influenced by the properties of the KRSS, as well as the nature of the deformation process. The results suggest that DAs are more pronounced in less fluffed and smoother knitted structures and yarns. For instance, the amplitudes of the DA peak at loading are, generally, higher for KRSSs that contain smooth silver-plated polyamide (PL) yarn (Figure 7b). Plain stitch sample, made with this type of yarn (PL SPP LDS), exhibits sharper resistance peaks, as compared to copper salt-impregnated acrylic (AIM) yarn, which has a "hairy" structure (see Figure 8). The visually perceived increase in sharpness of the DA peak with the increase of loading/unloading velocities, which could be seen in Figure 5, is just because the waveform “shrinks” at higher velocities. The shape of the peak remains the same for all velocities (Figure 6c, d; Figure 9b), but the amplitude of the peak in general gradually increases with the increase of the loading–unloading velocity (Figure 7b; Figure 9c). Both these features are important for the understanding of the DA mechanisms, as well as the development and verification of KRSS models.
DAs are more prominent during processes when rapid deformation of the KRSS is accompanied by stops in stationary positions, like during stepwise or trapezoidal stretching/recoiling. deformations. Such deformations are commonly encountered in various scenarios, including rehabilitation exercises involving body part movement with intermittent position fixation. In contrast, DAs can be masked in processes with continuous deformation, following, e.g., triangle or harmonic law, which are typical for applications like breathing monitoring. However, the masking effect does not imply the absence of DAs, and ignoring the impact of these artefacts can lead to inaccurate data.
It is important to note that the behaviour of the PL SPP LDS stitch sometimes deviates from the described general tendencies in DA behaviour. For instance, experimental data demonstrated a decrease in the second peak resistance value of this sample with an increase in unloading velocity during trapezoidal stretching/recoil tests (Figure 7b). Additionally, although the relative peak resistance values of this sample were higher than those of samples knitted with copper salt-impregnated yarn under loading conditions, they were still lower than the peak values observed in the ‘fluffier’ half-cardigan stitch with silver-plated yarn (HC SPP sample, Figure 8a, c). The authors hypothesize that these 'contradictions' may appear because some peak data had been missing, because of the very sharp and rapid manifestation of DAs in the PL SPP LDS stitch sample. Alongside, this sample demonstrated a low baseline resistance value (several ohms). Both these KRSS characteristics – either sampling rate or sensitivity threshold – were near the operating range limit of the data acquisition system.
Our results generally are aligned with previous research, where distinct resistance peaks were observed in KRSS knitted in a plain stitch [5,6] and in various types of double-bed knitted structures (such as double face, double left side, and interlock) [16], all fabricated using silver-plated polyamide yarns. Resistance peaks were also evident in sensors knitted in plain stitch using a qualitatively different type of conductive yarn, such as stainless steel-polyester blended staple yarn (BEKAERT BEKINTEX® BK) [17]. This confirms that the presence of DAs is a fundamental property of KRSS that should be considered in the design of KRSS-based measurement and monitoring systems.
On the other hand, some studies did not demonstrate DAs in knitted sensors. For example, Atalay et al. [18,19] reported smooth resistance responses in KRSS under periodic triangular loading. The KRSS was fabricated using a compressed interlock structure as the base with a single row of silver-plated polyamide yarn, knitted in the base structure as the sensing element. This research was focused on the monitoring of breathing, so the KRSS tests were conducted at a low loading speed (0.2 cm/s). It could be inferred that, in this case, the DAs were likely very weak and may have been completely obscured by the gradual resistance change under the applied load.
An intriguing observation is that similar DAs are observed in piezo resistive polymer structures: a remarkable “Christmas tree candles” pattern of sensor resistance was obtained for stepwise compression/extension of piezo resistive polymer film sensors [9]. These polymer sensors exhibit DA artefacts of varying intensity depending on the characteristics of the binder material. Less viscous binders or more elastic matrices tend to result in weaker DAs, while harder polymer matrices show more pronounced DA manifestations [8]. Several studies on the dynamic behaviour of polymer piezo resistive materials have demonstrated that DAs occur independently of the filler material used, whether it is carbon black (CB), carbon nanotubes (CNT), or graphene [20,21,22,23,24]. A strong dependence of DA manifestation on the type of loading, strain magnitude, and loading velocity has also been observed. Additionally, a DA masking effect was noted in cases of triangle-wise or sine-wise continuous deformation: the manifestation of DA could be confused with the increase of the sensor’s resistance due to deformation [21].
The parallel between the properties of DA in polymer piezo-resistive sensors and KRSS suggests some analogy between the parameters of the underlying processes. In particular, the viscosity of the substrate material in polymer sensors corresponds to the fluffiness of KRSS, and the irregularity of filler shape in polymer sensors aligns with the hairiness of conductive yarn, filler fraction with stitch density. This similarity becomes more apparent when considering that both KRSS and piezo resistive polymers are multifractional heterogeneous piezo resistive structures. Because of such similarities, one could hypothesize that KRSS, under certain assumptions, can serve as a macroscopic electro-mechanical model for polymer piezo-resistive sensors with micro/nano conductive fillers.
The presence of DAs in KRSS introduces both challenges and opportunities. While DA potentially degrades the metrological characteristics of KRSS, compensation methods could be developed to increase the accuracy of measurements using the approach employed for the polymer piezo resistive sensor applications [25,26]. These compensation methods require a deep analysis of KRSS properties under dynamic load and the development of a dynamic model of KRSS for use in compensation procedures.
Another proposed approach involves the use of DAs to increase the sensitivity of piezo-resistive polymer sensors [9]. This approach has already been applied to KRSS, too, in an application for the monitoring of rehabilitation exercises to detect undesirable body movements [12].
Future research should include the development of mathematical models to predict the behaviour of KRSS under dynamic loads and explore the potential use of DAs in measurements. Additionally, the potential similarity (in spirit of similarity theory) in the mathematical description of the DA in KRSS and polymer piezo resistive structures should be studied. These endeavours will facilitate further understanding of DA in KRSS and its applications in smart textiles and sensor technology.
5. Conclusions
In summary, this study highlights the dynamic artifact (DA) behaviour in knitted resistive strain sensors (KRSS) subjected to various types of deformation. The presence of DAs in KRSS degrades the metrological characteristics of KRSS and cannot be ignored. The present study demonstrates that DA peak amplitudes increase with the rise of deformation velocity and are sensitive to structural characteristics of the KRSS, including yarn composition, knitting density, and stitch type. Specifically, less "fluffy" structures, such as dense plain stitches made with silver-plated yarn, exhibit sharper and more pronounced DAs compared to those made with copper salt-impregnated yarn, indicating a direct correlation between structural smoothness and DA peak sharpness. The DAs are most prominent in stepwise and trapezoidal deformations, while they were partially masked in continuous triangular deformations.
The similarities in DA patterns between KRSS and piezo resistive polymer structures suggest potential for KRSS as a macroscopic model for polymer-based sensors, given the analogous influence of structural properties on DA manifestations. Future work should focus on developing dynamic models of KRSS that can predict sensor responses to predefined deformations and explore the potential of these models for real-time DA compensation in measurements.
Author Contributions
Conceptualization, A.O.J. and A.O.; methodology, A.O.J. and A.O.; software, A.K..; validation, A.O.J., A.K. and A.O.; formal analysis, A.O.J., A.K. and A.O.; investigation, A.O.J., A.K. and A.O.; resources, A.O.J..; data curation, A.O.J., A.K. and A.O.; writing—original draft preparation, A.O.J.; writing—review and editing, A.O.J., U.B..; visualization, A.O.J., U.B.; supervision, A.O., A.K., U.B..; project administration, A.O., U.B..; funding acquisition, A.O., A.K.. All authors have read and agreed to the published version of the manuscript.
Funding
This research was funded by the Latvian Scientific Council project lzp-2022/1-0290 “Development of knitted self-generating sensors: combining physics and knitting technology”.
Institutional Review Board Statement
Not applicable.
Data Availability Statement
The original contributions presented in this study are included in the article. Further inquiries can be directed to the corresponding author.
Conflicts of Interest
The authors declare no conflicts of interest.
Abbreviations
The following abbreviations are used in this manuscript:
| DAs | dynamic artifacts |
| KRSS | knitted resistive strain sensors |
| PL | plain stitch |
| RB | rib 1×1 stitch |
| HC | half-cardigan stitch |
| LDS | low-density sample |
| HDS | high-density sample |
| SPP | silver-plated polyamide |
| AIM | copper salt-impregnated acrylic |
References
- Sensoria. Sensoria Smart Socks- A Better Way to Run. Available online: http://www.sensoriafitness.com/.
- Raji, R.K.; Miao, X.; Wan, A.; Zhang, S.; Li, Y.; Frimpong, C. Progress on the Fabrication of Smart Textiles Based on Soft Strain Sensors. AATCC J. Res. 2019, 6, 1–12. [Google Scholar] [CrossRef]
- Oks, A.; Katashev, A.; Litvak, J. Knitted Resistive Fabric: Properties and Applications. Mater. Sci. Text. Cloth. Technol. 2015, 9, 28. [Google Scholar] [CrossRef]
- Stoppa, M.; Chiolerio, A. Wearable Electronics and Smart Textiles: A Critical Review. Sensors 2014, 14, 11957–11992. [Google Scholar] [CrossRef] [PubMed]
- Li, Y.; Miao, X.; Chen, J.Y.; Jiang, G.; Liu, Q. Sensing performance of knitted strain sensor on two-dimensional and three-dimensional surfaces. Mater. Des. 2021, 197. [Google Scholar] [CrossRef]
- Lee, S.; Choi, Y.; Sung, M.; Bae, J.; Choi, Y. A Knitted Sensing Glove for Human Hand Postures Pattern Recognition. Sensors 2021, 21, 1364. [Google Scholar] [CrossRef] [PubMed]
- Bozali, B.; Ghodrat, S.; Jansen, K.M.B. Development of a Knitted Strain Sensor for Health Monitoring Applications. Engineering Proceedings 2023. [Google Scholar] [CrossRef]
- O'Brien, B.; Thode, J.; Anderson, I.; Calius, E.; Haemmerle, E.; Xie, S. Integrated extension sensor based on resistance and voltage measurement for a dielectric elastomer. Proceedings of SPIE - The International Society for Optical Engineering; 2007. [Google Scholar] [CrossRef]
- Chauhan, A.S.; Taylor-Harrod, I.; Littlejohn, S.D.; Nogaret, A. Ultrafast pressure sensing with transient tunnelling currents. Nanoscale 2017, 9, 4544–4549. [Google Scholar] [CrossRef] [PubMed]
- Tognetti, A.; Bartalesi, R.; Lorussi, F.; De Rossi, D. Body segment position reconstruction and posture classification by smart textiles. Trans. Inst. Meas. Control. 2007, 29, 215–253. [Google Scholar] [CrossRef]
- Okss, A.; Kataševs, A.; Litvak, J. The New Type of Knitted Resistive Fabric and Its Application. The 13th International Conference on Global Research and Education "Inter Academia 2014", Digest, Latvia, Riga, 10-12 September 2014; Riga Technical University: Riga, 2014; pp. 74–75, ISBN 978-9934-10-583-8. [Google Scholar]
- Eizentals, P.; Katashev, A.; Oks, A.; Semjonova, G. Smart Shirt for Uncontrolled Movement Retraining. No: IFMBE Proceedings. Vol 76: XV Mediterranean Conference on Medical and Biological Engineering and Computing (MEDICON 2019), Portugal, Coimbra, 2019; Springer; pp. 933–937. [Google Scholar] [CrossRef]
- Spenser, J. Knitting Technology (Third Edition): A Comprehensive Handbook and Practical Guide. In Woodhead Publishing Series in Textiles; 2001. [Google Scholar]
- Eizentāls, P.; Kataševs, A.; Okss, A.; Pavāre, Z. DAid Pressure Socks System: Performance Evaluation. Gait and Posture 2021, Vol. 84, 368–376. [Google Scholar] [CrossRef] [PubMed]
- BS EN 16812:2016; Textiles and textile products — Electrically conductive textiles — Determination of the linear electrical resistance of conductive tracks. British Standard.
- Warncke, M.N.; Böhmer, C.H.; Sachse, C.; Fischer, S.; Häntzsche, E.; Nocke, A.; Mersch, J.; Cherif, C. Advancing Smart Textiles: Structural Evolution of Knitted Piezoresistive Strain Sensors for Enabling Precise Motion Capture. Polymers 2023, 15, 3936. [Google Scholar] [CrossRef] [PubMed]
- Tohidi, S.D.; Zille, A.; Catarino, A.P.; Rocha, A.M. Effects of Base Fabric Parameters on the Electro-Mechanical Behavior of Piezoresistive Knitted Sensors. IEEE Sensors J. 2018, 18, 4529–4535. [Google Scholar] [CrossRef]
- Atalay, O.; Kennon, W.R. Knitted Strain Sensors: Impact of Design Parameters on Sensing Properties. Sensors 2014, 14, 4712–4730. [Google Scholar] [CrossRef] [PubMed]
- Atalay, O.; Kennon, W.R.; Demirok, E. Weft-Knitted Strain Sensor for Monitoring Respiratory Rate and Its Electro-Mechanical Modeling. IEEE Sensors J. 2014, 15, 110–122. [Google Scholar] [CrossRef]
- Mersch, J.; Gerlach, G. Properties and special phenomena of strain sensors made of carbon particle-filled elastomers. tm - Tech. Mess. 2023, 90, 715–724. [Google Scholar] [CrossRef]
- Mersch, J.; Winger, H.; Nocke, A.; Cherif, C.; Gerlach, G. Experimental Investigation and Modeling of the Dynamic Resistance Response of Carbon Particle-Filled Polymers. Macromol. Mater. Eng. 2020, 305, 2000361. [Google Scholar] [CrossRef]
- Yang, H.; Yao, X.; Zheng, Z.; Gong, L.; Yuan, L.; Yuan, Y.; Liu, Y. Highly sensitive and stretchable graphene-silicone rubber composites for strain sensing. Compos. Sci. Technol. 2018, 167, 371–378. [Google Scholar] [CrossRef]
- Bhagavatheswaran, E.S.; Stöckelhuber, K.W.; Vaikuntam, S.R.; Wießner, S.; Pötschke, P.; Heinrich, G.; Das, A. Time & temperature dependent piezoresistive behavior of conductive elastomeric composites. Rubber Chem. Technol. 2018, 91, 651–667. [Google Scholar] [CrossRef]
- Georgousis, G.; Pandis, C.; Chatzimanolis-Moustakas, C.; Kyritsis, A.; Kontou, E.; Pissis, P.; Krajči, J.; Chodák, I.; Tabačiarová, J.; Mičušík, M.; et al. Study of the reinforcing mechanism and strain sensing in a carbon black filled elastomer. Compos. Part B: Eng. 2015, 80, 20–26. [Google Scholar] [CrossRef]
- Kim, J.-S.; Kim, G.-W. Hysteresis Compensation of Piezoresistive Carbon Nanotube/Polydimethylsiloxane Composite-Based Force Sensors. Sensors 2017, 17, 229. [Google Scholar] [CrossRef] [PubMed]
- Zhao, X.; Chen, Y.; Wei, G.; Pang, L.; Xu, C. A comprehensive compensation method for piezoresistive pressure sensor based on surface fitting and improved grey wolf algorithm. Measurement 2023, 207. [Google Scholar] [CrossRef]
Figure 1.
Electro conductive yarns: silver-coated polyamide (a), copper salt impregnated. acrylic (b).
Figure 1.
Electro conductive yarns: silver-coated polyamide (a), copper salt impregnated. acrylic (b).
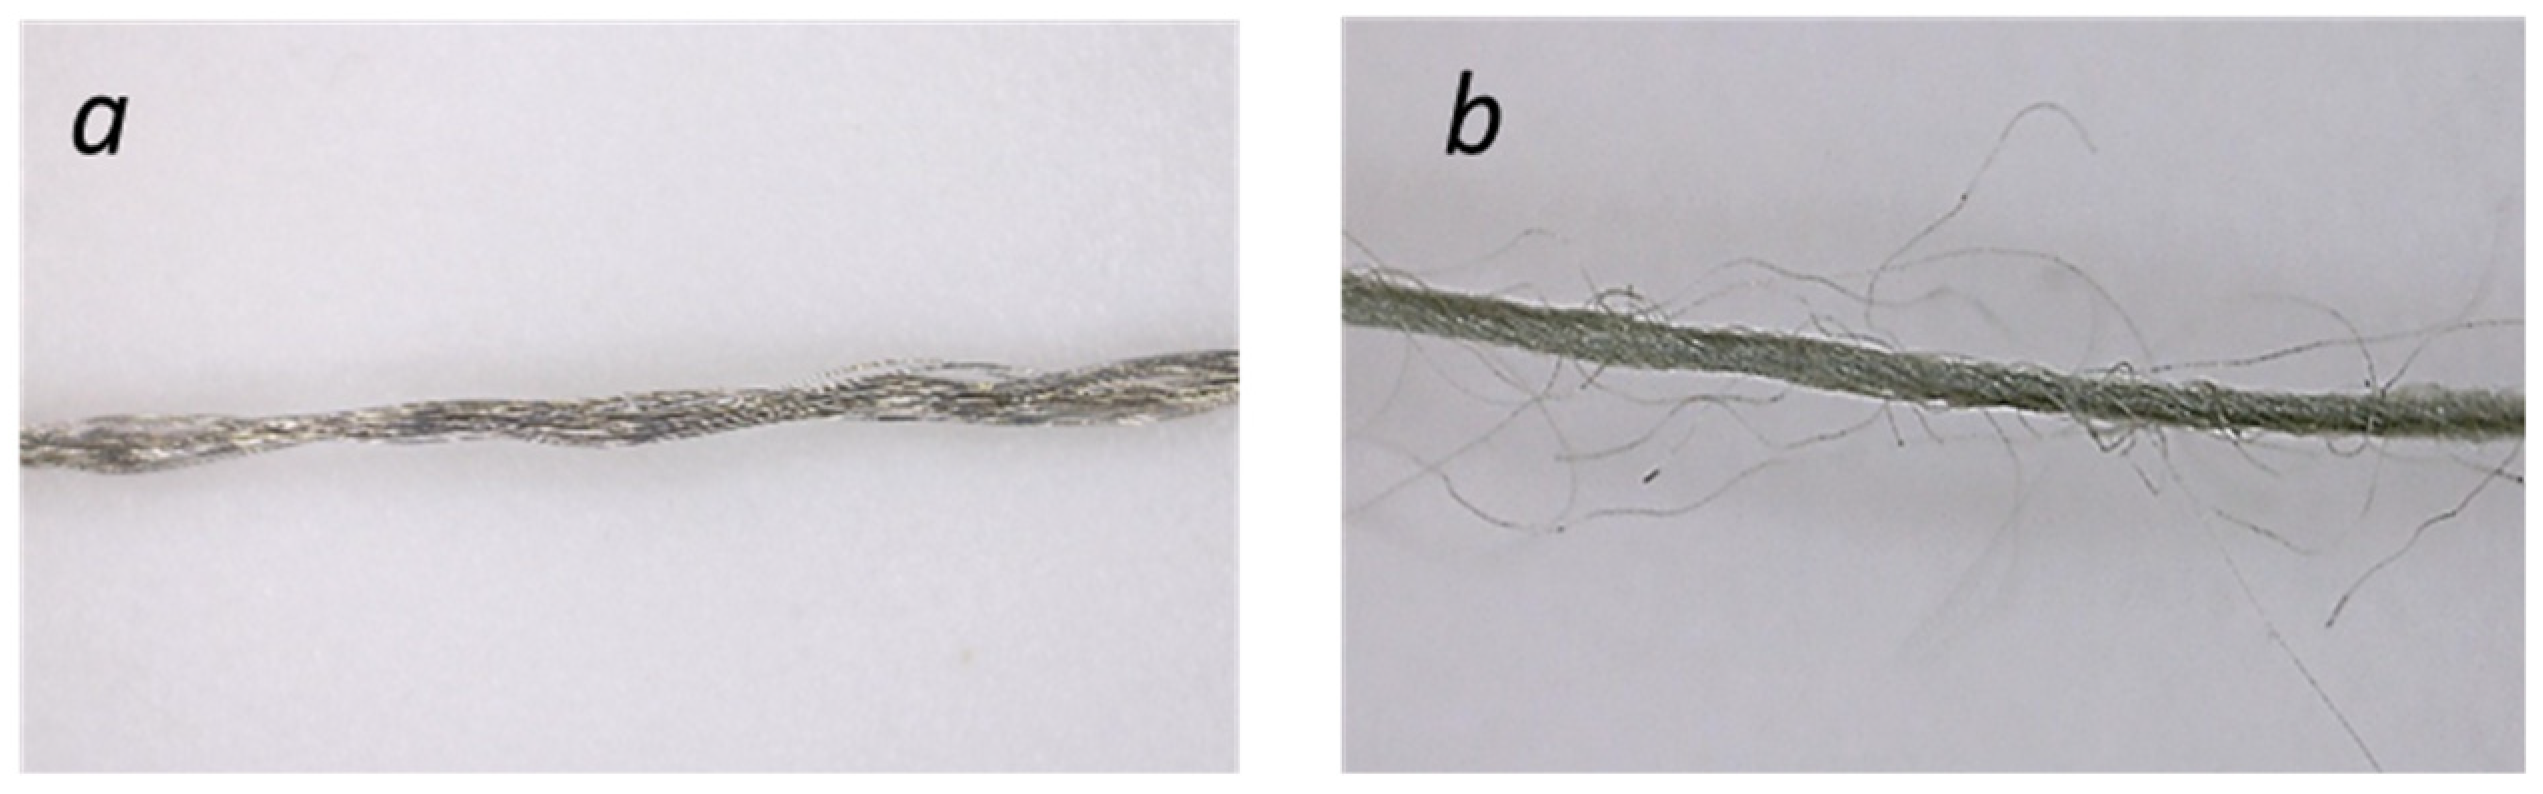
Figure 2.
The patterns of the studied knitted stitches.
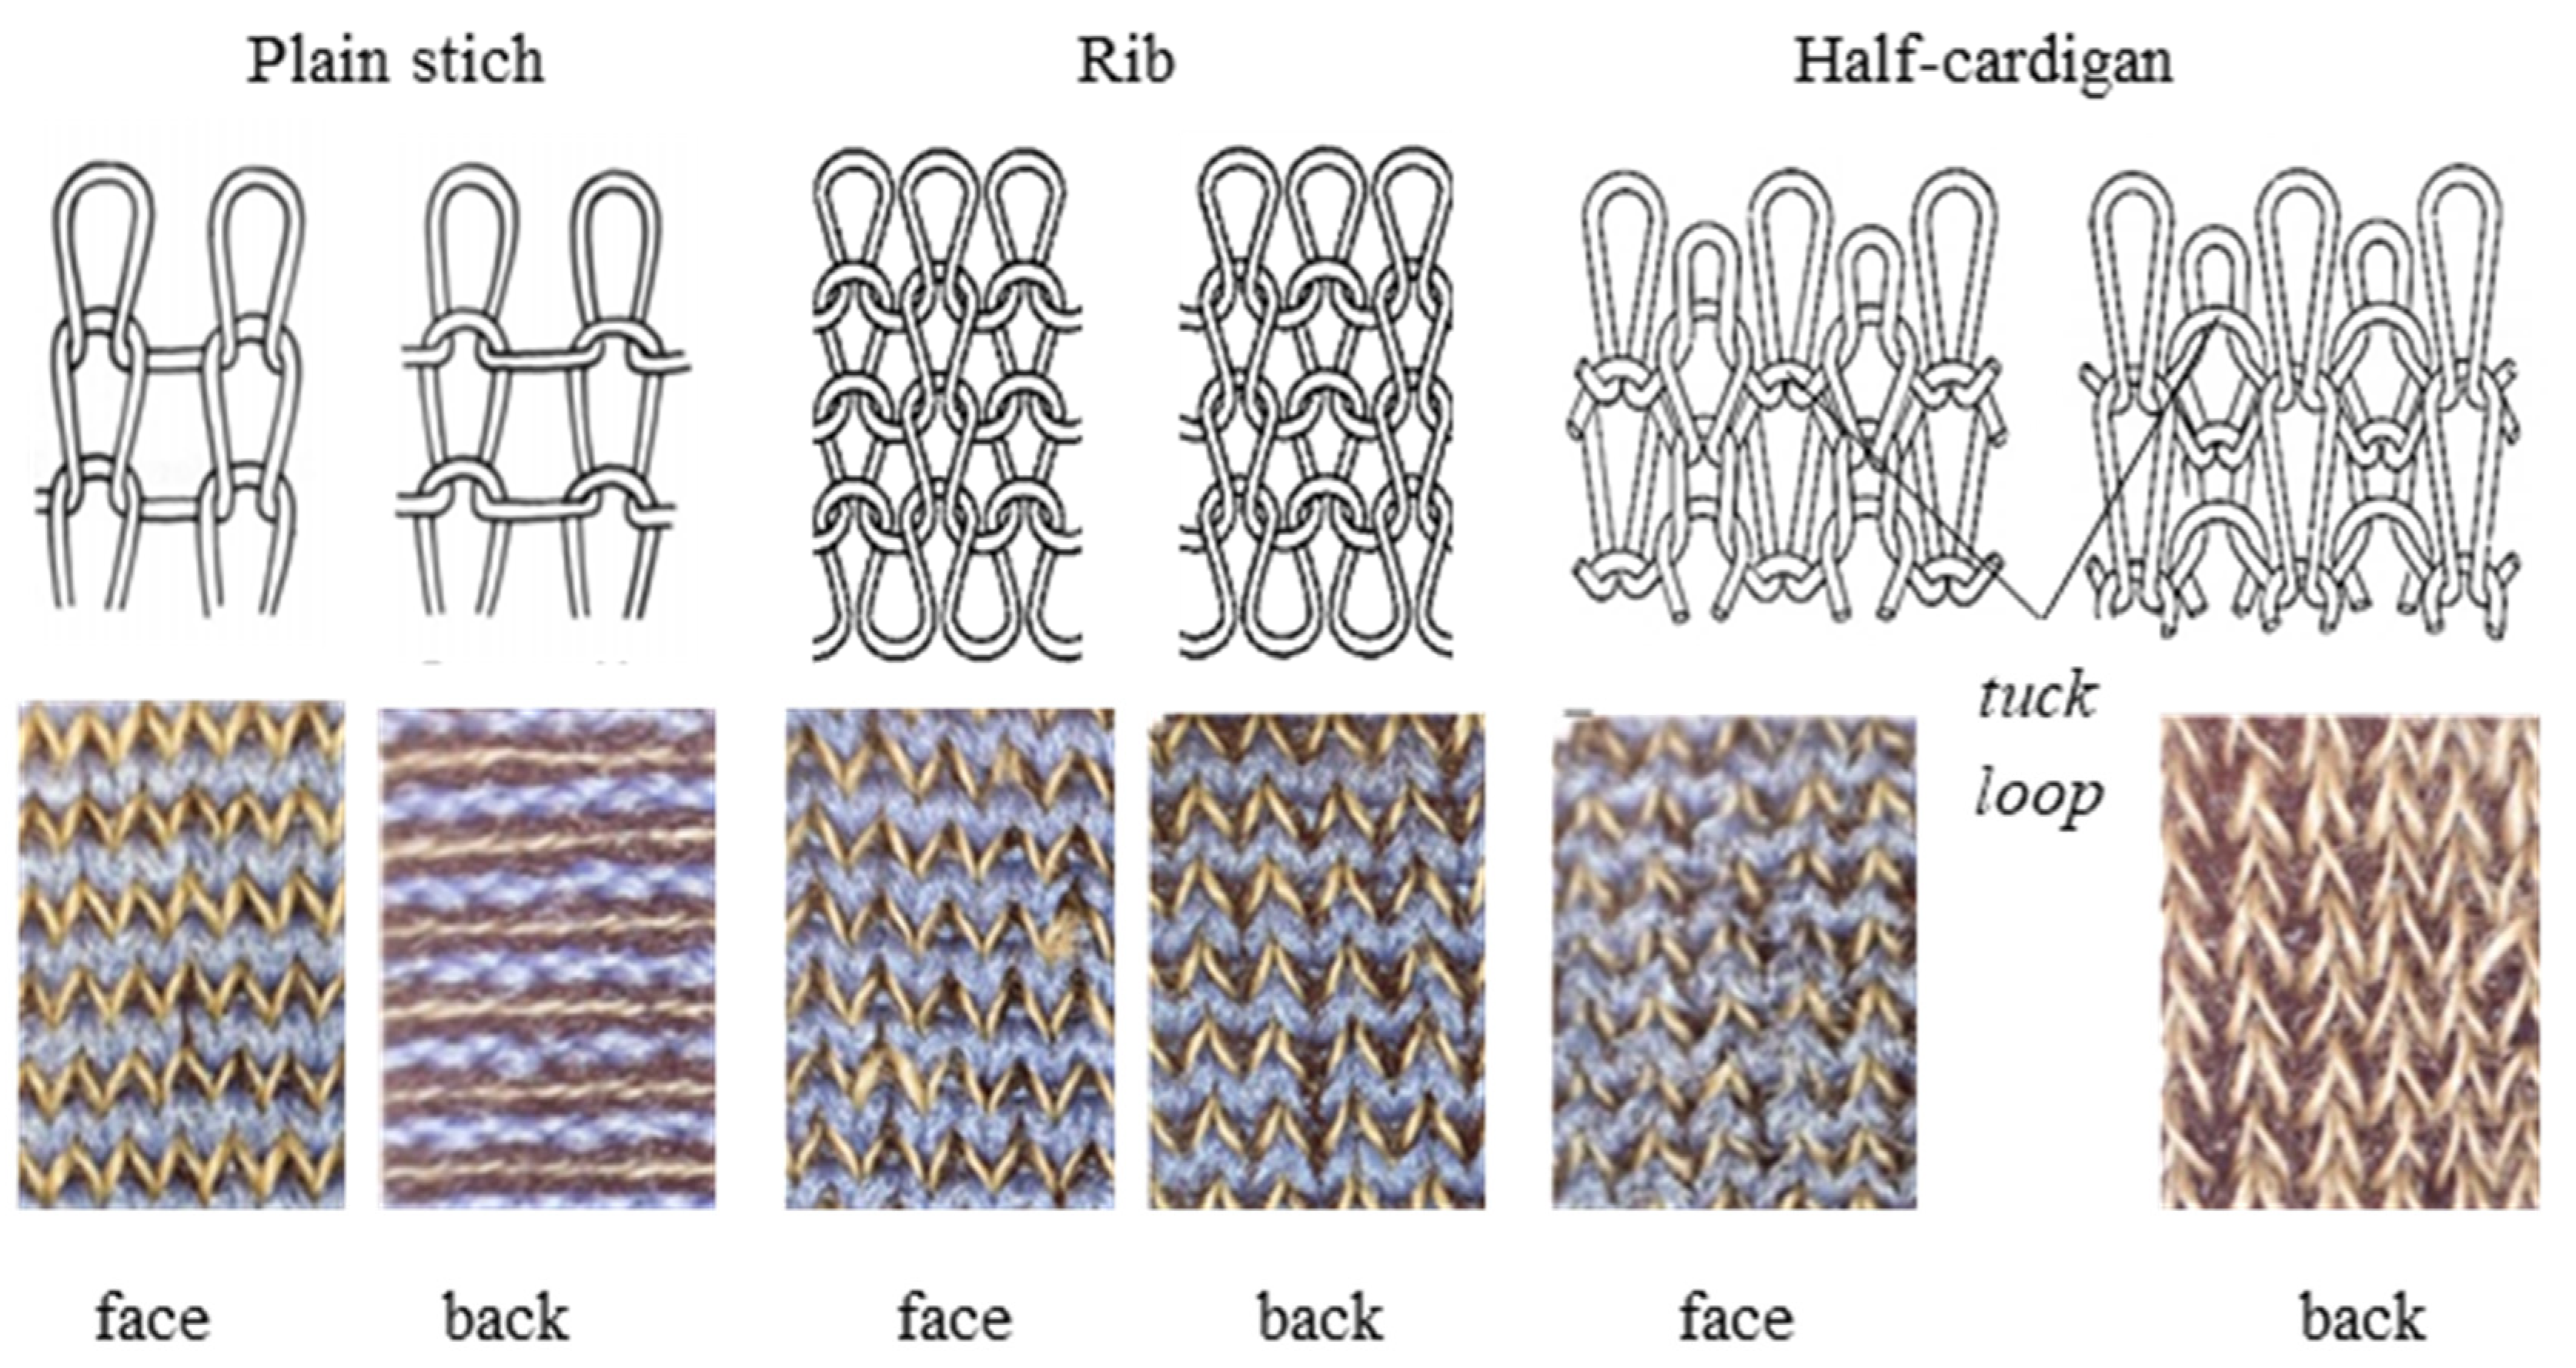
Figure 3.
Experimental setup of KRSS cyclic deformation. (A) deformation principle, (B) deformation slider-crank device.
Figure 3.
Experimental setup of KRSS cyclic deformation. (A) deformation principle, (B) deformation slider-crank device.
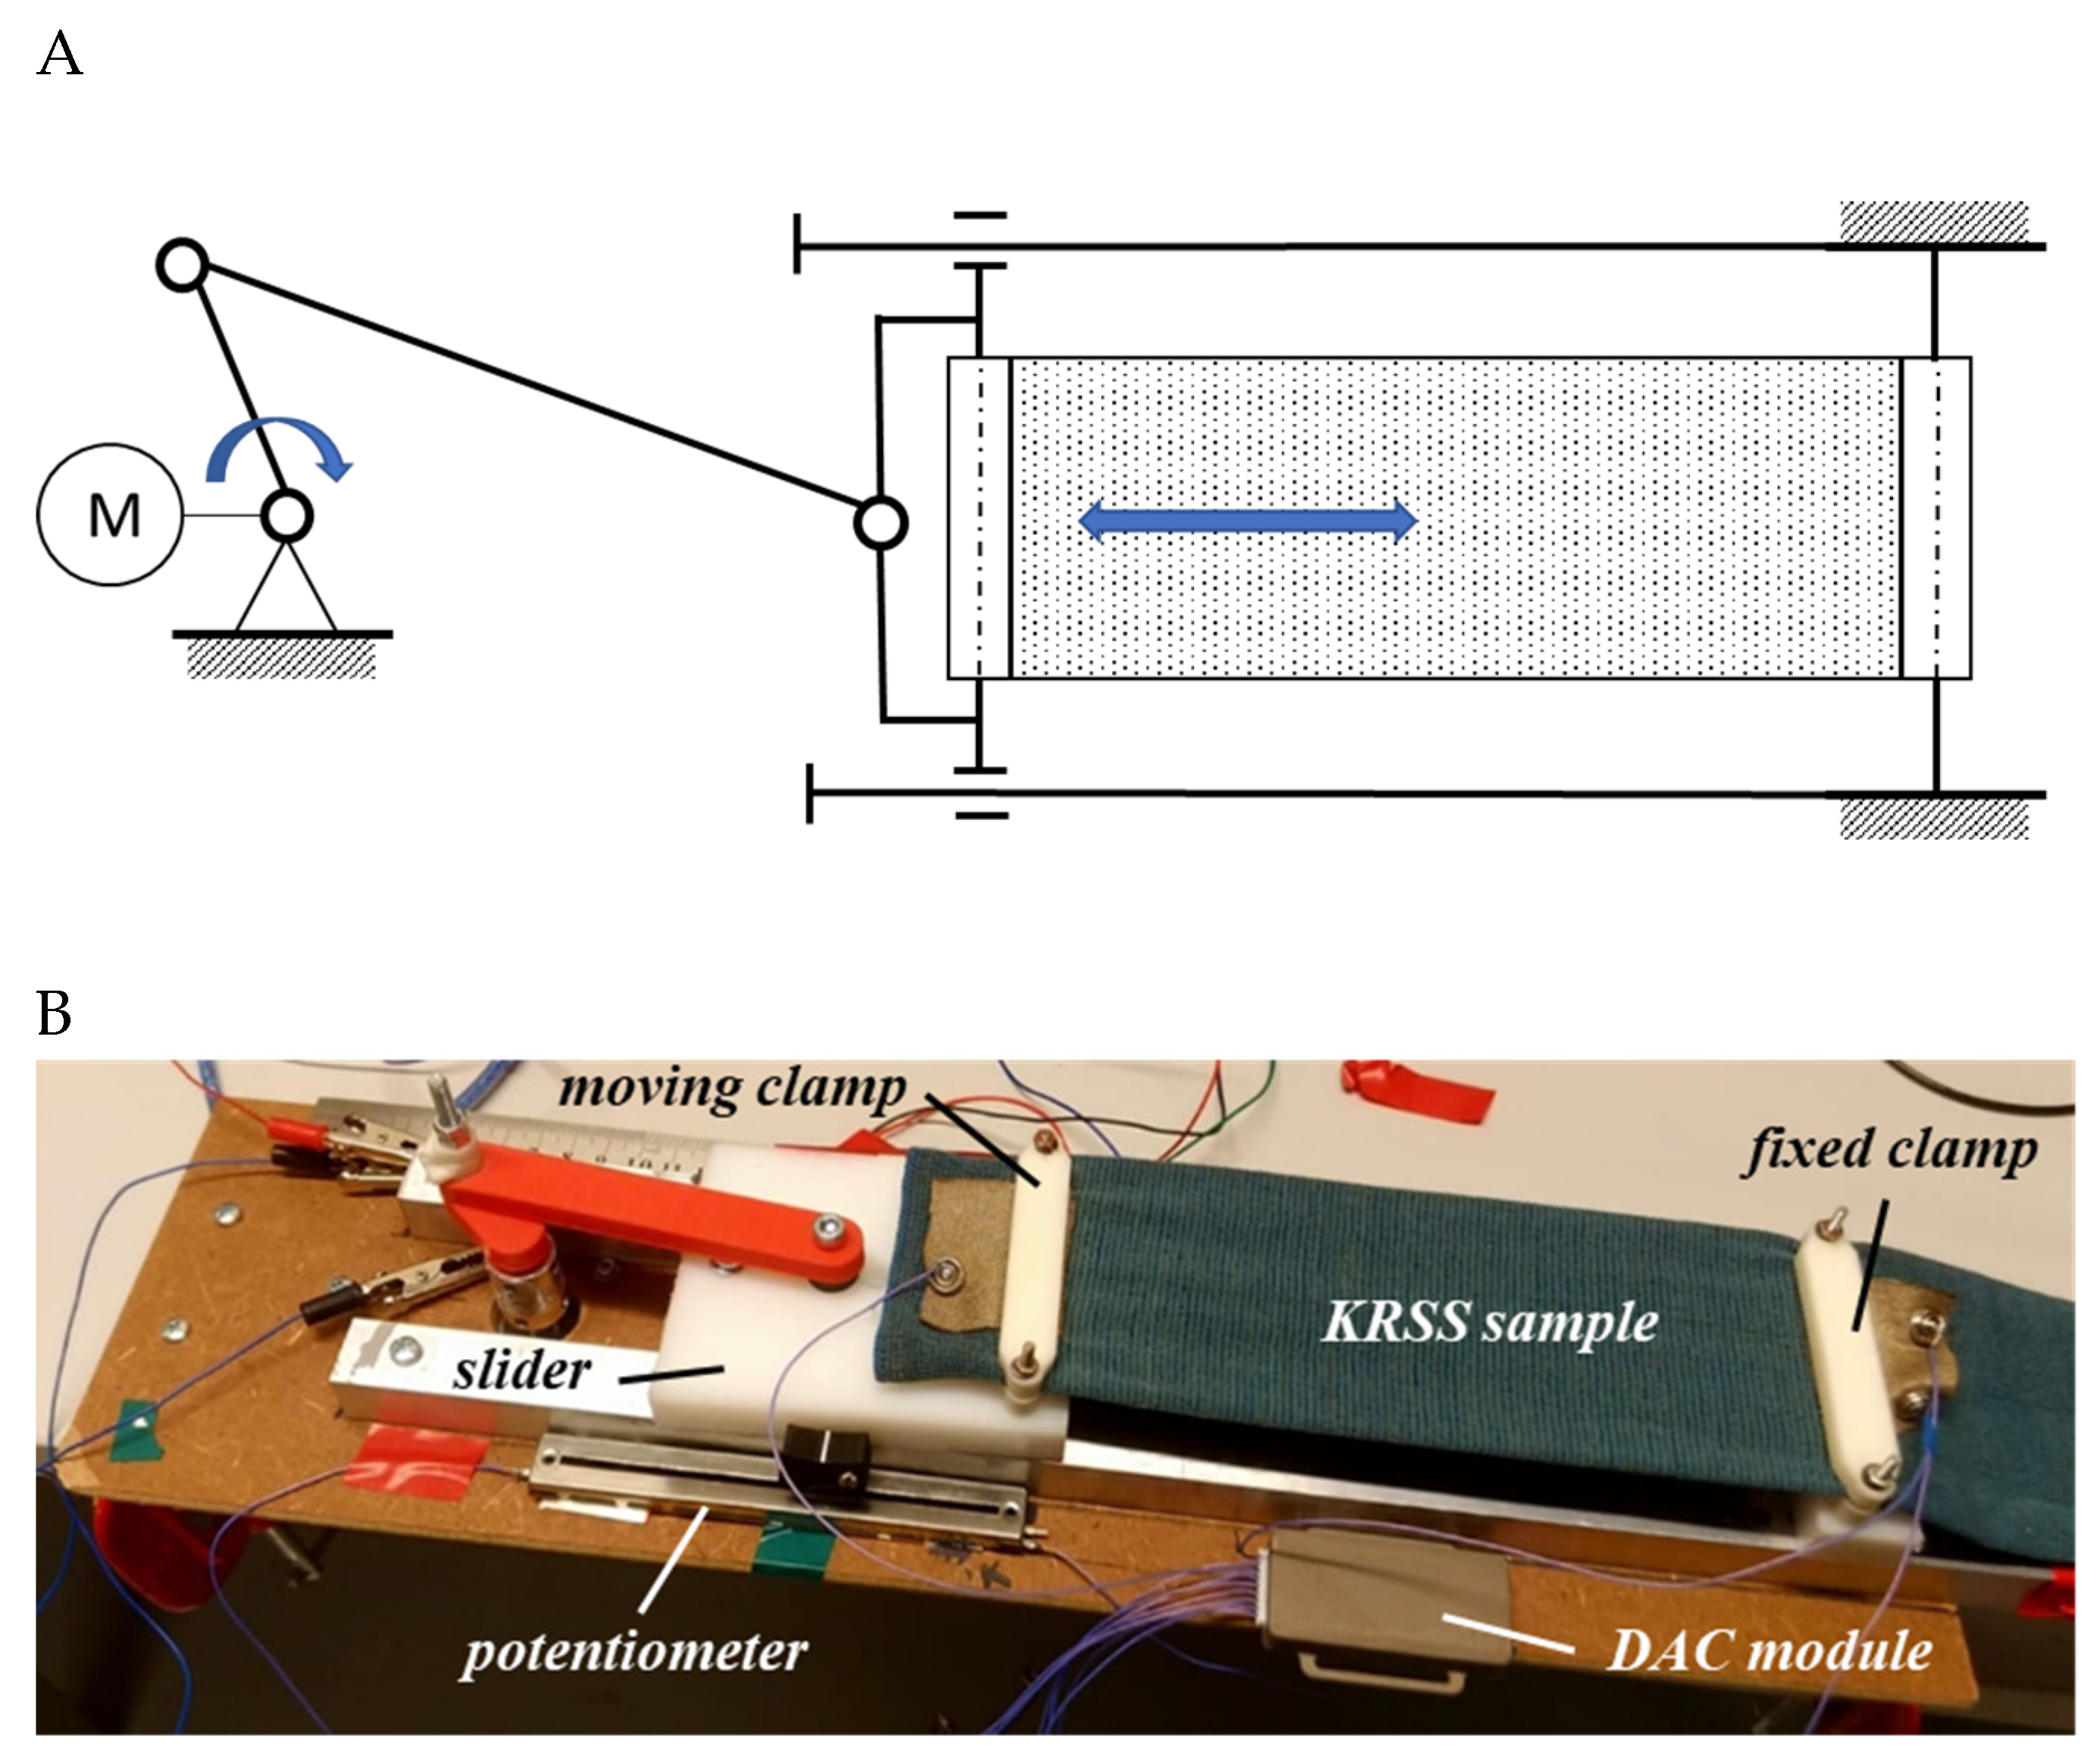
Figure 4.
The typical waveform of the KRSS reaction to the stepwise deformation. (The dotted lines emphasize the nearly linear dependence of artefact peaks on elongation).
Figure 4.
The typical waveform of the KRSS reaction to the stepwise deformation. (The dotted lines emphasize the nearly linear dependence of artefact peaks on elongation).
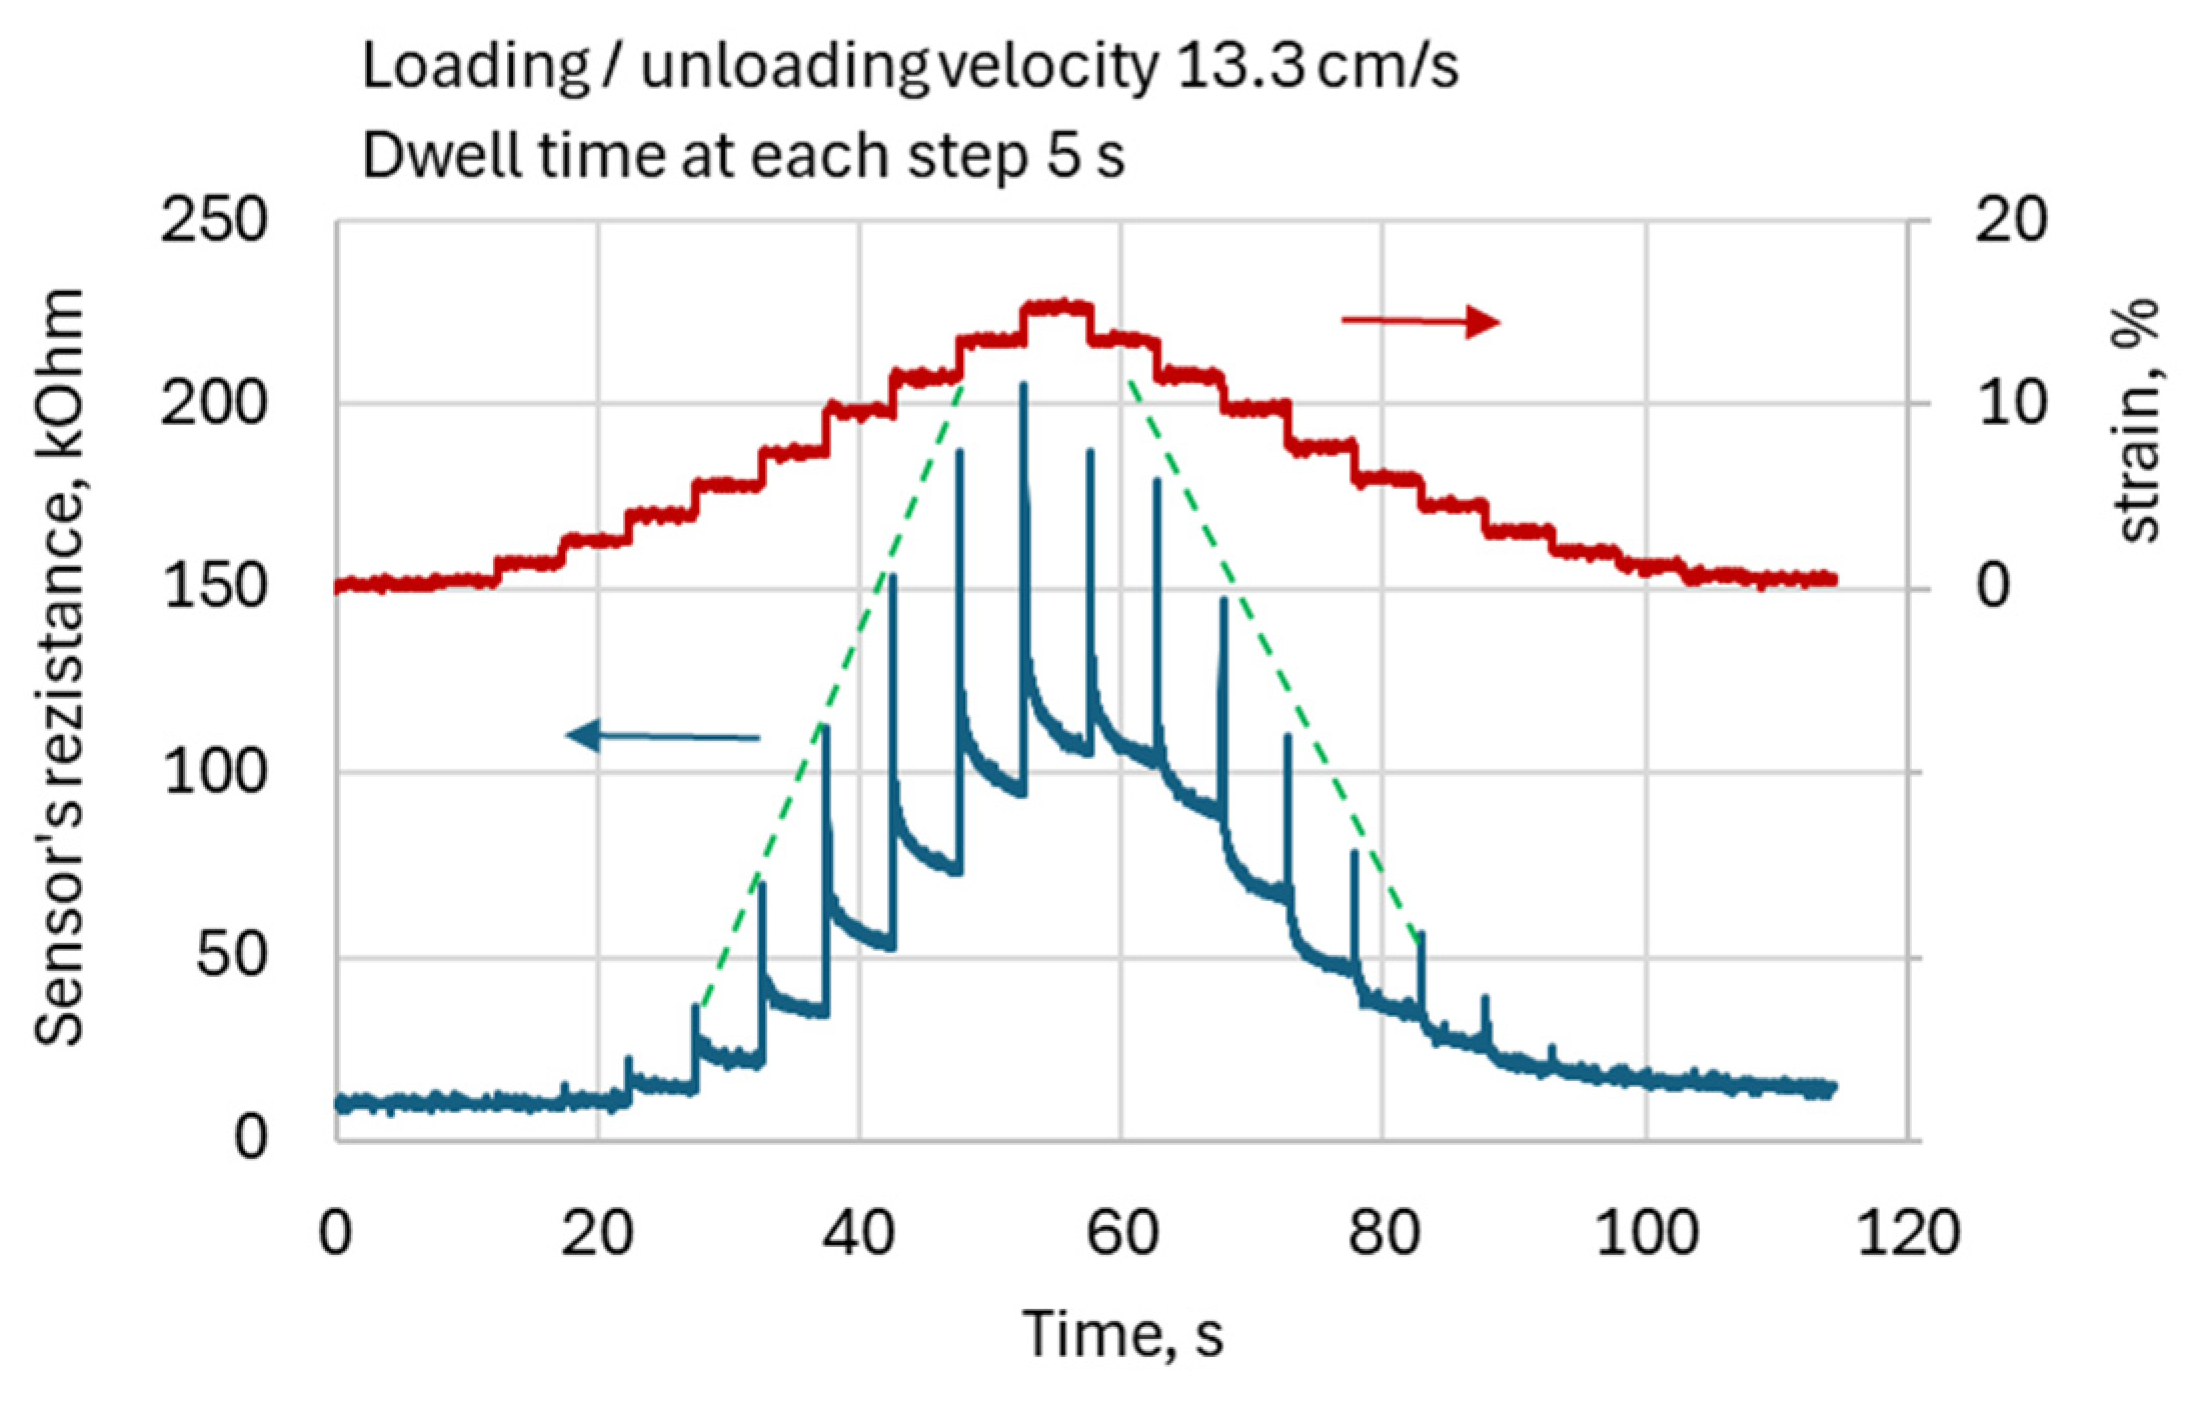
Figure 5.
The typical sensor reaction waveform for the trapezoid deformation with different loading-unloading velocities (a), details of the waveforms' edges (b), corresponding to low loading-unloading velocity of (zones I, II at diagram a) and high loading-unloading velocity (zones III, IV at diagram a). Data for high-density plain stitch knitted with copper impregnated yarn (PL AIM HDS).
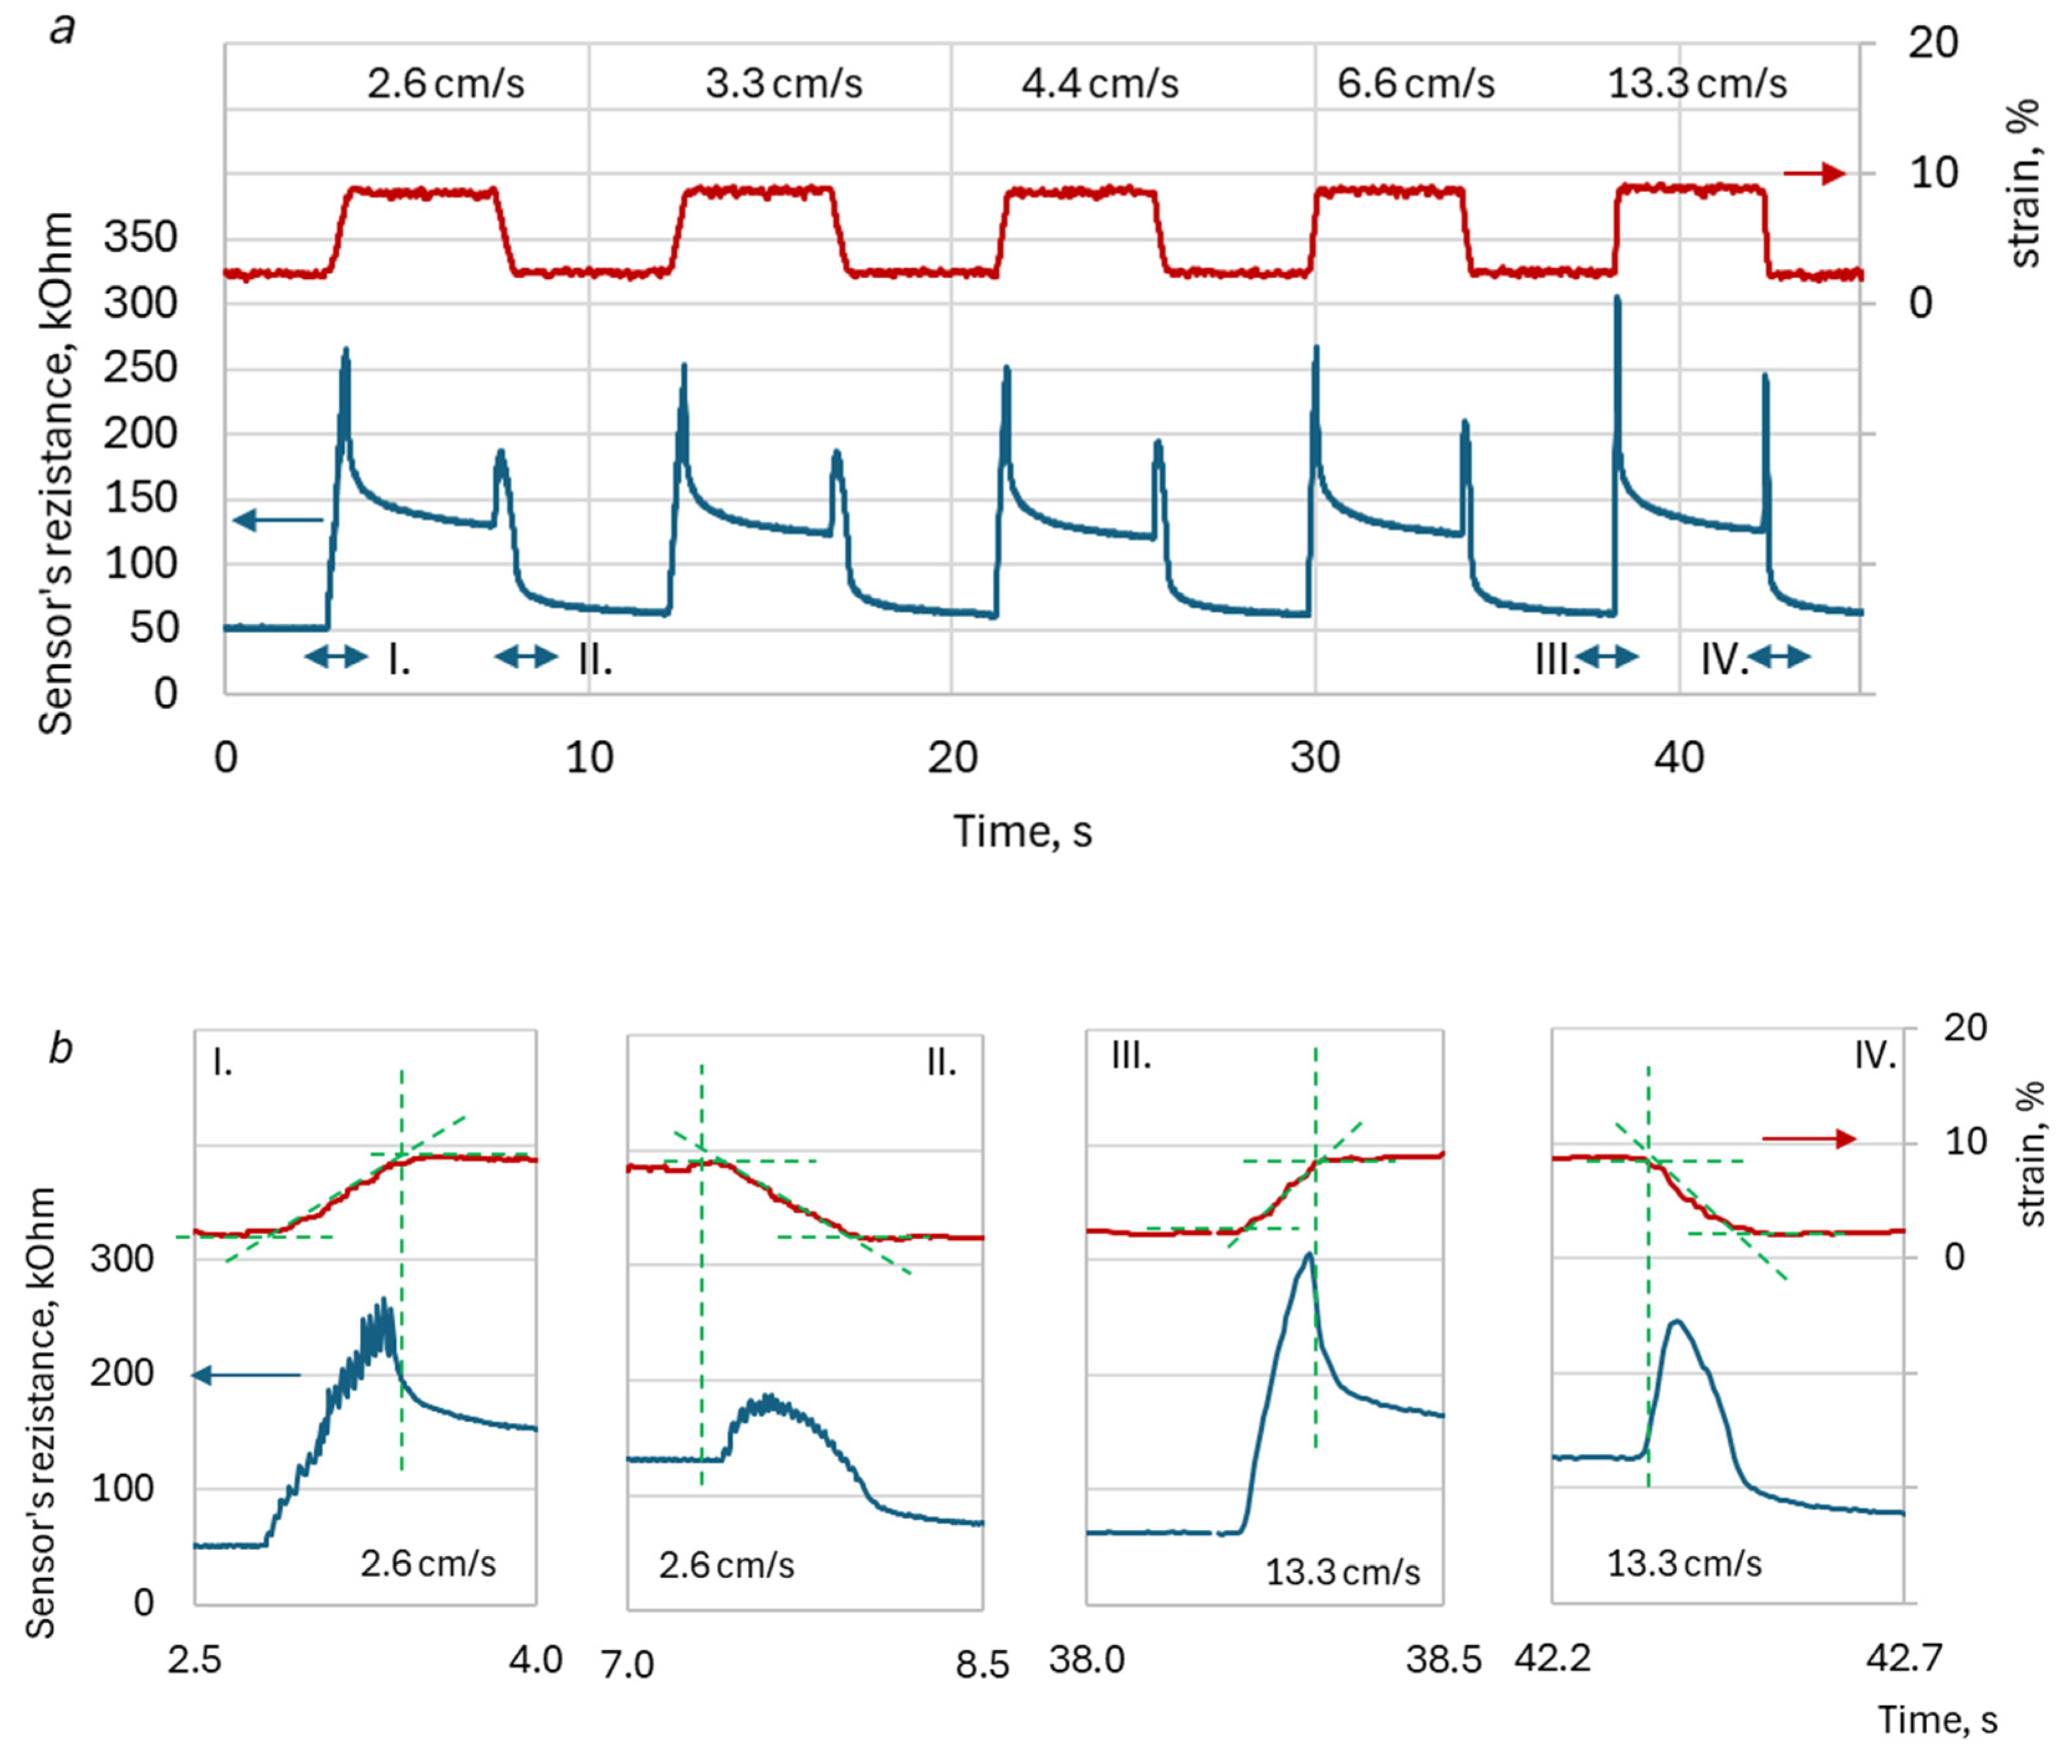
Figure 6.
Typical sensor response for loading (a, c) and unloading (b, d) at different velocities. The timescale is normalized. The waveforms in the second row (c, d) are normalized with respect to resistance. Data for the half-cardigan stitch knitted with copper impregnated yarn (PL AIM HDS).
Figure 6.
Typical sensor response for loading (a, c) and unloading (b, d) at different velocities. The timescale is normalized. The waveforms in the second row (c, d) are normalized with respect to resistance. Data for the half-cardigan stitch knitted with copper impregnated yarn (PL AIM HDS).
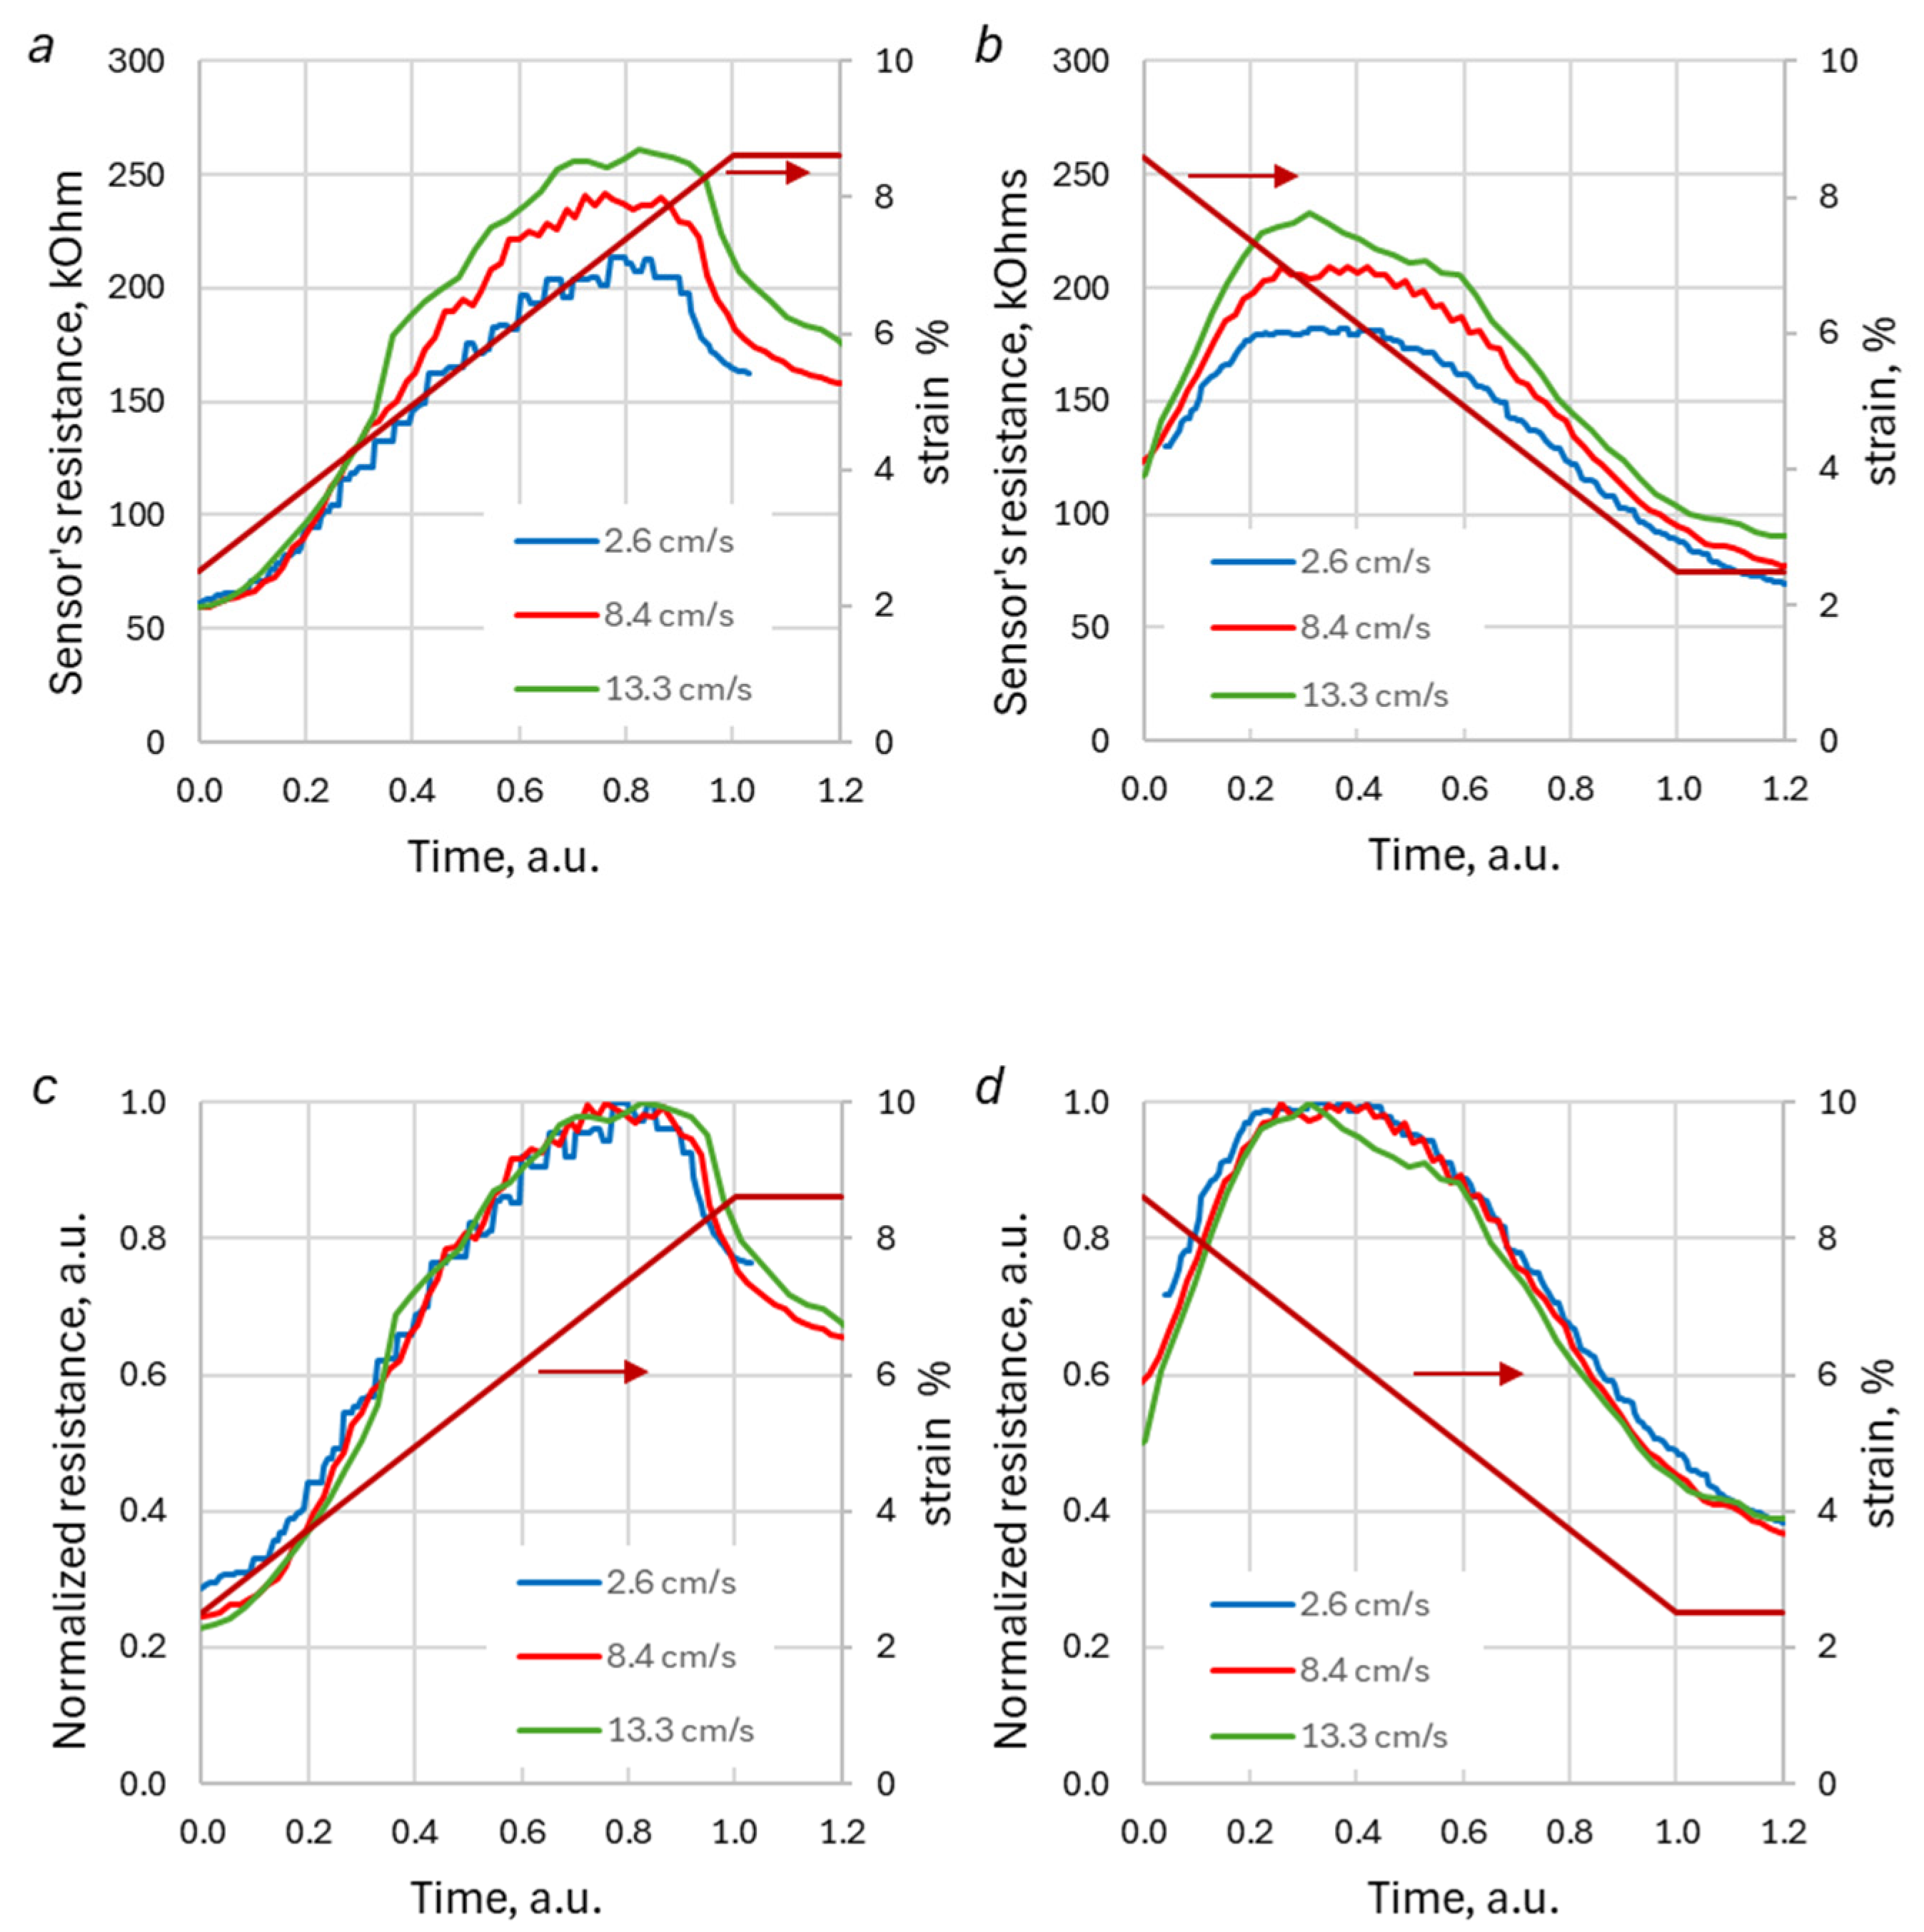
Figure 7.
Definition of peak and baseline values (a). The normalized peak values vs. loading velocities (b).
Figure 7.
Definition of peak and baseline values (a). The normalized peak values vs. loading velocities (b).
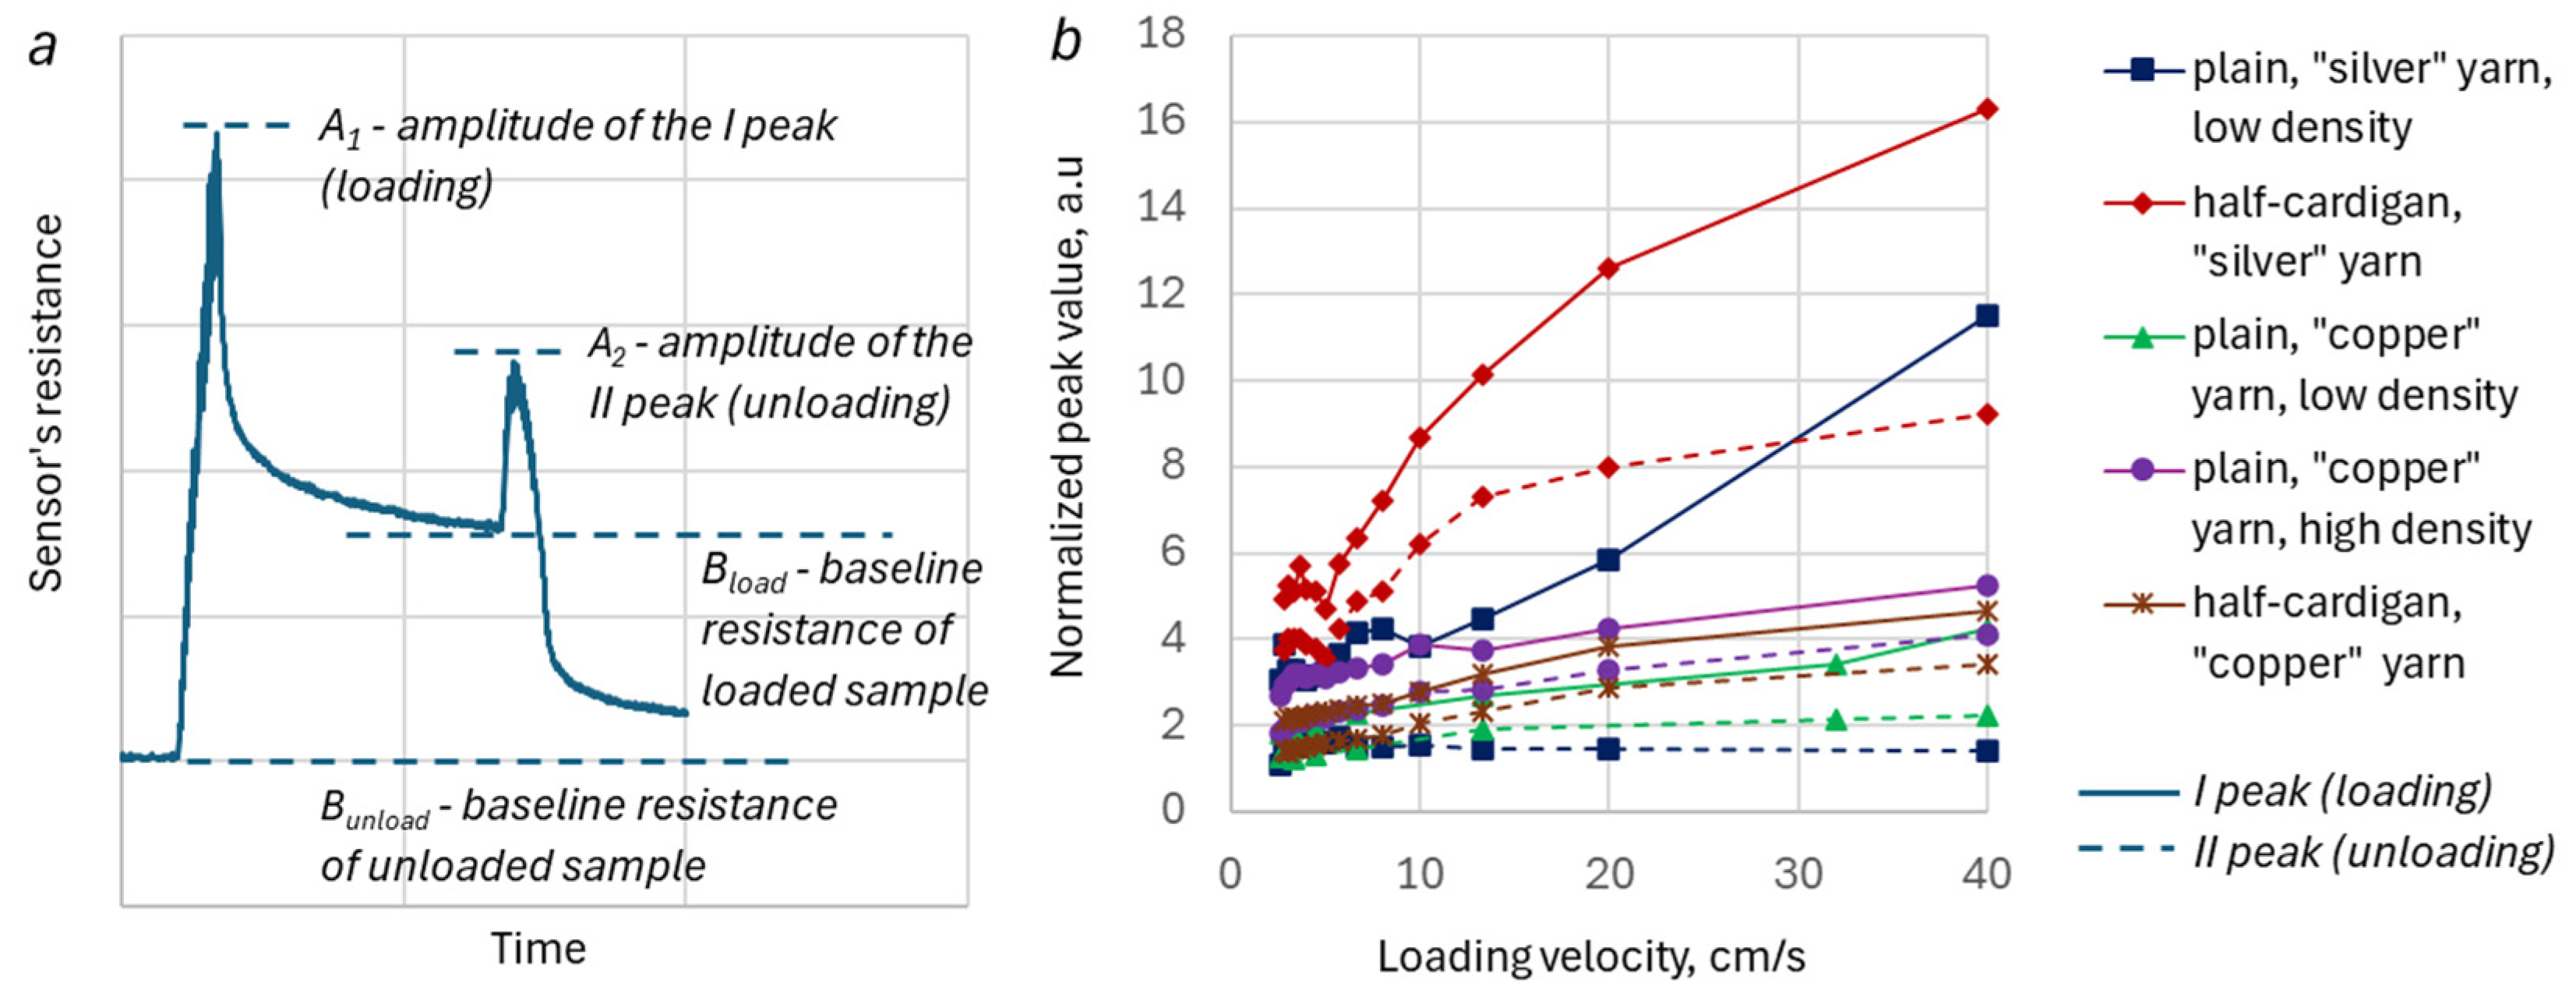
Figure 8.
Normalized sensor reaction for different types of sensors: loading at 3.3 cm s-1 (a), unloading at 3.3 cm s-1 (b), loading at 13.3 cm s-1 (c), unloading at 13.3 cm s-1 (d).
Figure 8.
Normalized sensor reaction for different types of sensors: loading at 3.3 cm s-1 (a), unloading at 3.3 cm s-1 (b), loading at 13.3 cm s-1 (c), unloading at 13.3 cm s-1 (d).
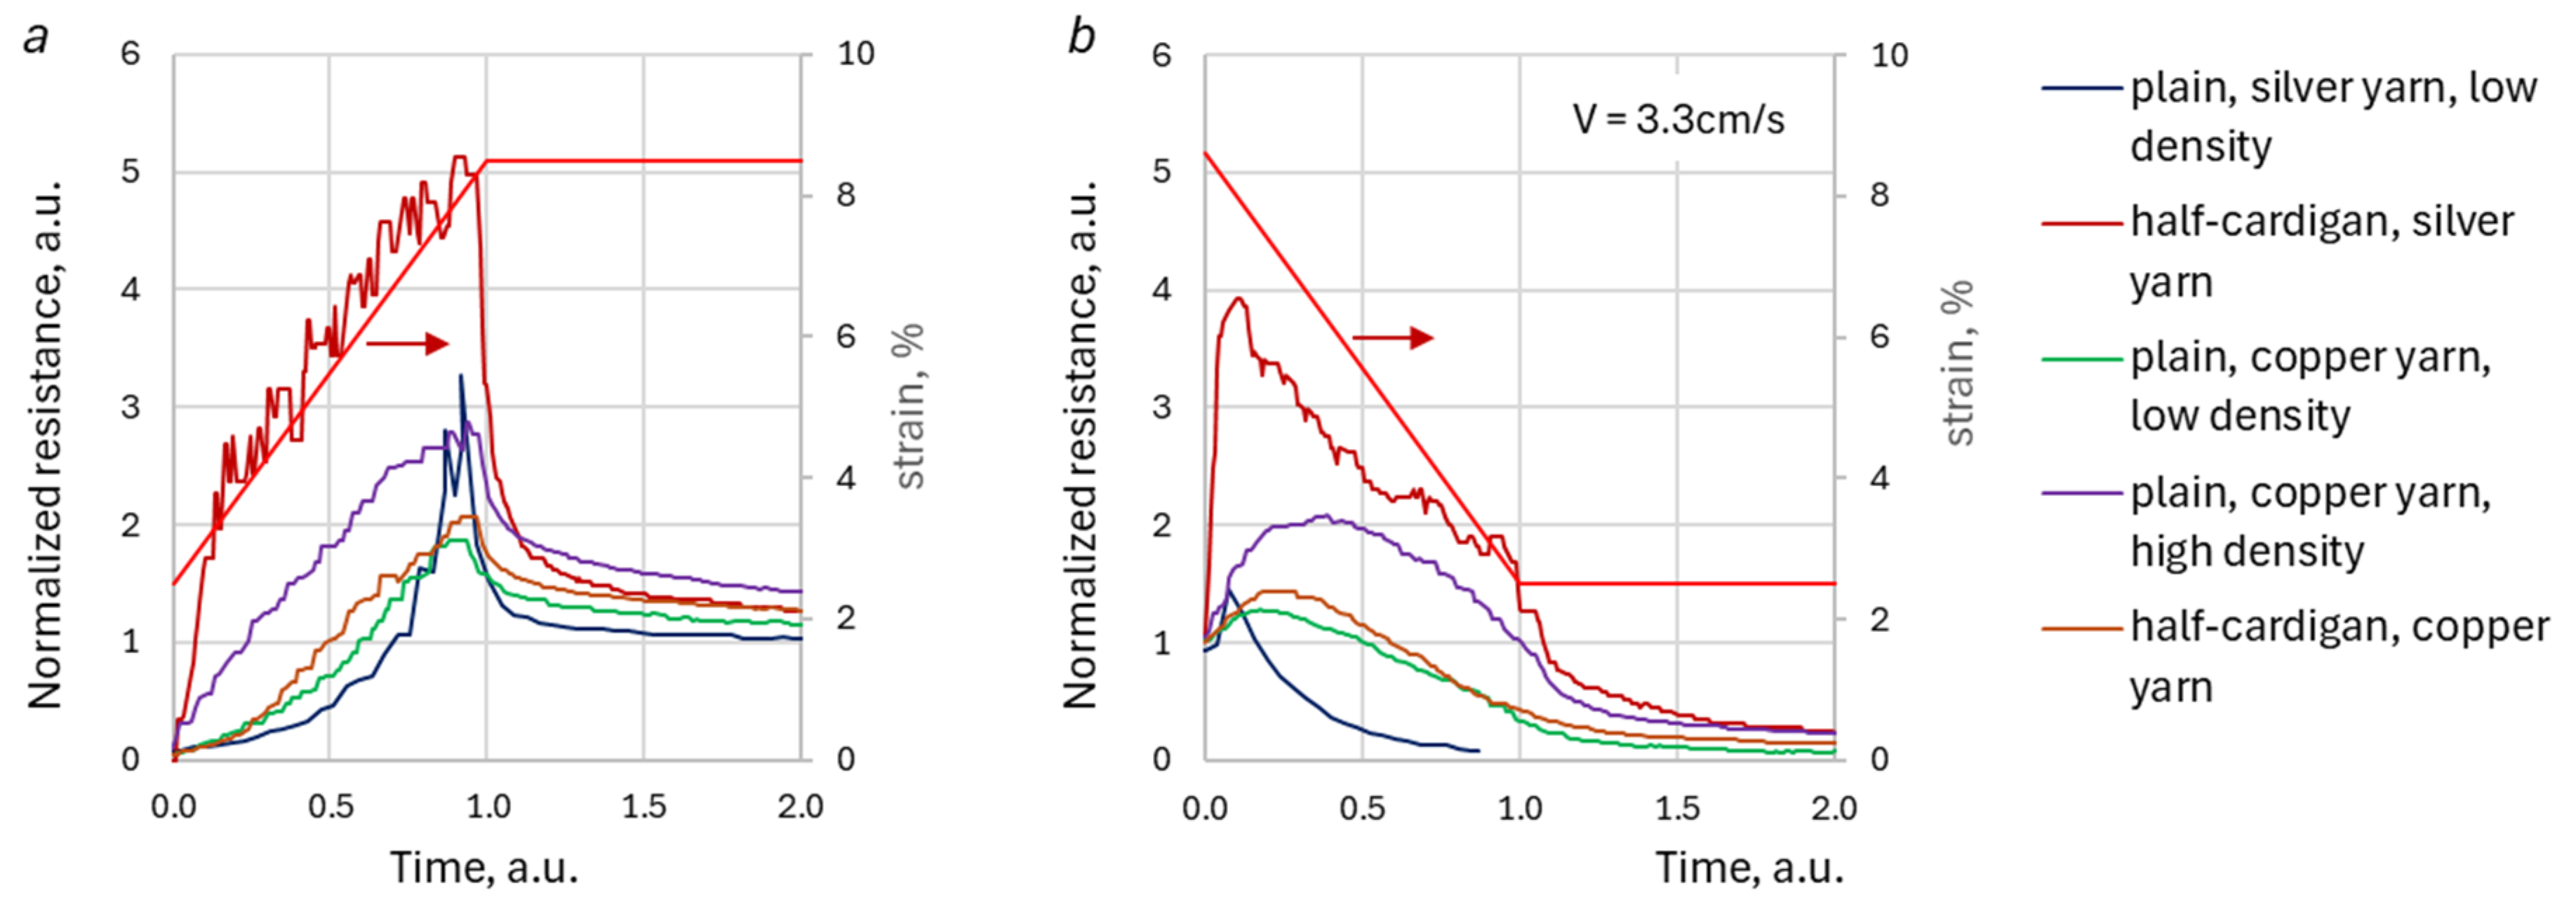
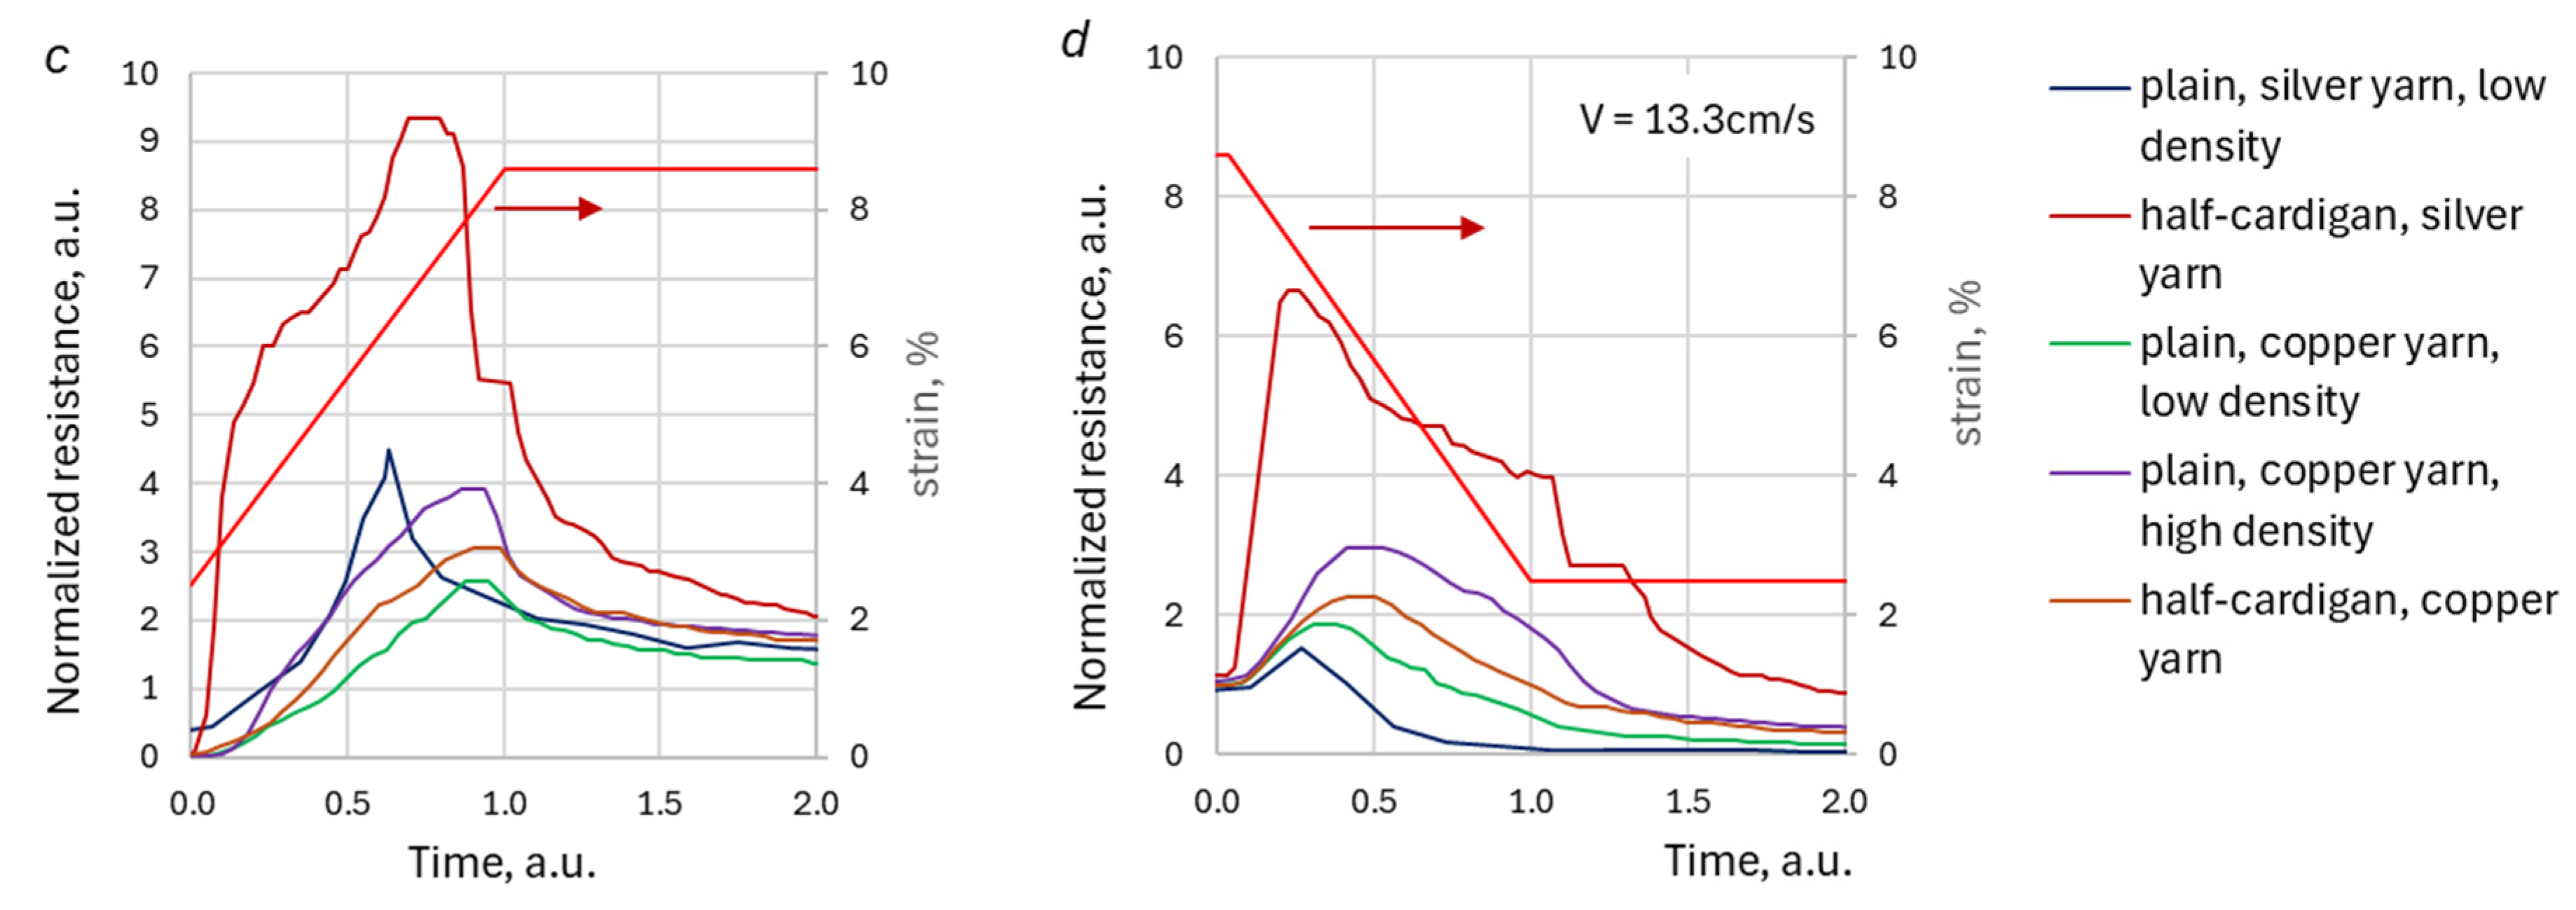
Figure 9.
The typical sensor reaction waveform, built in a normalized time scale, for the triangle type deformation: absolute values (a); normalized values (b); peak amplitude dependence on loading velocity (c). Data for low-density plain stitch knitted with copper impregnated yarn (PL AIM LDS).
Figure 9.
The typical sensor reaction waveform, built in a normalized time scale, for the triangle type deformation: absolute values (a); normalized values (b); peak amplitude dependence on loading velocity (c). Data for low-density plain stitch knitted with copper impregnated yarn (PL AIM LDS).
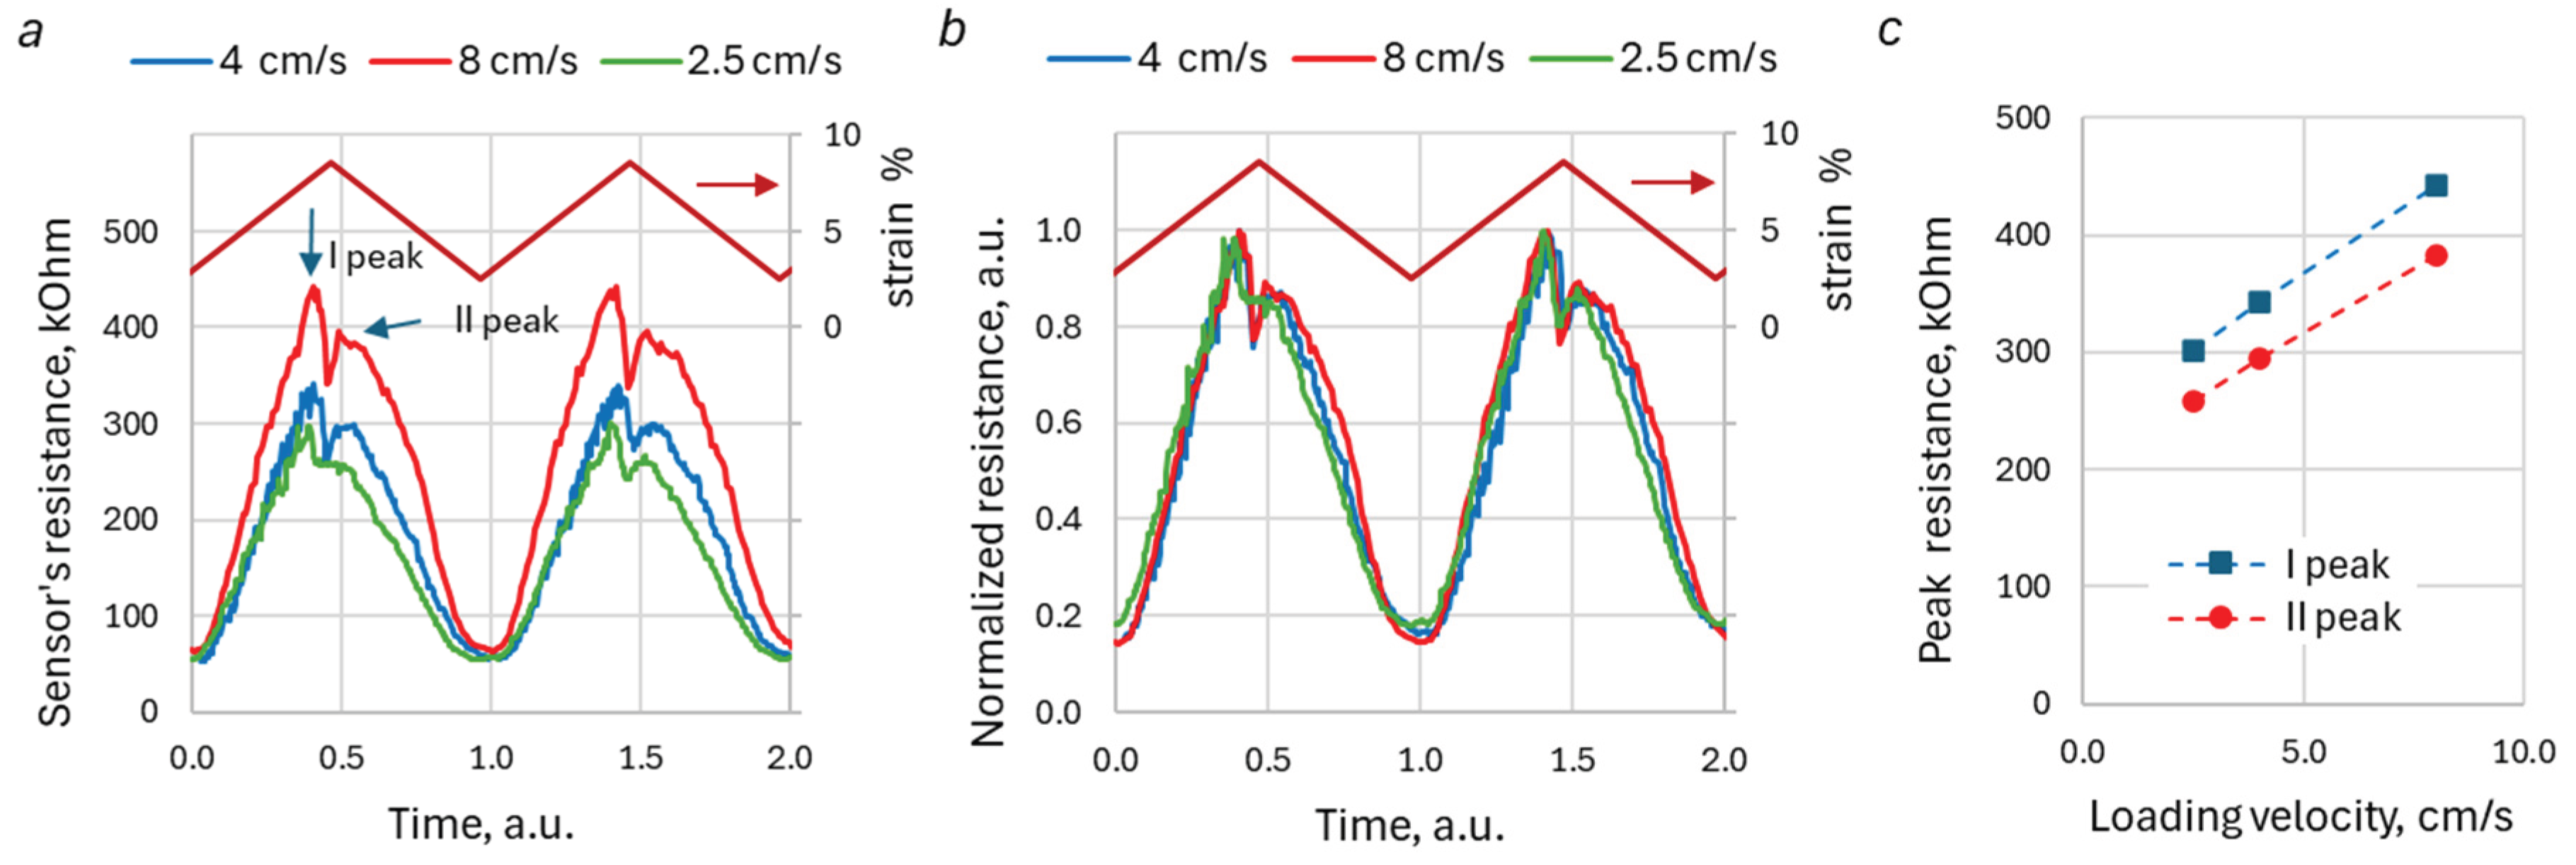

Table 1.
Studied samples and type of deformation.
| No. | Stitch type | Yarn | Stitch density* | Loading type | Abbreviation |
|---|---|---|---|---|---|
| 1 | Plain | Copper salt impregnated | High 109×162 | Stair-wise / Trapezoidal/Triangle |
PL AIM HDS |
| 2 | Plain | Copper salt impregnated | Low 101×124 | Stair-wise/ Trapezoidal/Triangle | PL AIM LDS |
| 3 | Plain | Silver platted | High 120×150 | Triangle | PL SPP HDS |
| 4 | Plain | Silver platted | Low 100×125 | Stair-wise/ Trapezoidal/Triangle | PL SPP LDS |
| 5 | Half -cardigan | Copper salt impregnated | Low 68×74 | Stair-wise/ Trapezoidal/Triangle | HC AIM |
| 6 | Half -cardigan | Silver platted | Low 68×74 | Stair-wise/ Trapezoidal/Triangle | HC SPP |
| 7 | Rib 1×1 | Copper salt impregnated | High 71×134 | Triangle | RB AIM HDS |
| 8 | Rib 1×bet1 | Copper salt impregnated | Low 70×90 | Triangle | RB AIM LDS |
*
Stitch density is given in courses
×
wales / 10cm.
Table 2.
Parameters of trapezoidal deformation.
| No. | Parameter | Values |
|---|---|---|
| 1 | Loading velocity, cm/s | 2.6; 2.9; 3.1; 3.3; 3.6; 4.0; 4.4; 5.0; 5.7; 6.7; 8.0; 10.0; 13.3; 20.0; 32.0; 40.0 |
| 2 | Relative deformation | 9%; 13%; 17% |
| 3 | Dwell time, s | 2; 4 |
To provide triangle loading, the same specimen set-up procedure was used. The loading/unloading velocities were 2.6, 4.2, and 8.4 cm/s.
Table 3.
Baseline resistance values.
| Specimens |
Bload, kOhm value (SD) |
Bunload, kOhm Value (SD) |
|
|---|---|---|---|
| PL AIM HDS | (plain, "copper" yarn, high density) | 123 (3) | 61.1 (1.0) |
| PL AIM LDS | (plain, "copper" yarn, low density) | 39 (3) | 13.0 (1.0) |
| PL PP LDS | (plain, "silver" yarn, low density) | 0.50 (0.06) | 0.0030 (0.0004) |
| HC AIM | (half-cardigan, "copper" yarn) | 99 (6) | 44.7 (1.1) |
| HC PP | (half-cardigan, "silver" yarn) | 0.033 (0.003) | 0.018 (0.002) |
Disclaimer/Publisher’s Note: The statements, opinions and data contained in all publications are solely those of the individual author(s) and contributor(s) and not of MDPI and/or the editor(s). MDPI and/or the editor(s) disclaim responsibility for any injury to people or property resulting from any ideas, methods, instructions or products referred to in the content. |
© 2026 by the authors. Licensee MDPI, Basel, Switzerland. This article is an open access article distributed under the terms and conditions of the Creative Commons Attribution (CC BY) license (http://creativecommons.org/licenses/by/4.0/).
Copyright: This open access article is published under a Creative Commons CC BY 4.0 license, which permit the free download, distribution, and reuse, provided that the author and preprint are cited in any reuse.


