
Submitted:
27 January 2026
Posted:
28 January 2026
You are already at the latest version
Abstract
Understanding spatial habitat use and population density is essential for effective wildlife conservation and management. This study integrates kernel density estimation and line transect distance sampling to assess habitat use patterns and population density of wild goats. Habitat use intensity was quantified using kernel density estimates derived from field observations, and relationships between log-transformed kernel density values and Euclidean distances to forests, agricultural areas, water bodies, and settlements were examined using univariate linear regression models. A significant negative relationship was detected between distance to forest and log-transformed kernel density (p = 0.047), indicating higher habitat use intensity closer to forested areas. Population density was estimated from distance-sampling surveys conducted in the northern and southern subregions. Detection functions were selected based on diagnostic plots and goodness-of-fit tests, and left truncation was applied to improve model fit. Overall density was estimated at 6.47 individuals/km2, with values similar across subregions. Uncertainty was mainly driven by variation in detection probability and group size. Together, these results emphasize the importance of forest habitats and suggest a relatively homogeneous population distribution, providing a baseline for future monitoring and conservation planning.
Keywords:
wildlife
; abundance
; density
; biodiversity
; conservation
; Türkiye
1. Introduction
Capra aegagrus, classified as a near-threatened species on the IUCN Red List [1], inhabits mountainous areas across the Middle East and the Caucasus, especially in highlands surrounding the Mediterranean basin [2,3]. This widespread mammal in Türkiye is found in the mountains bordering the Mediterranean Sea, from the Datça peninsula in the west to the east, across the Taurus and Anti-Taurus mountains, and within high hilly regions of eastern, north-eastern, and south-eastern Anatolia, at elevations from sea level up to 3000 m [4,5,6,7]. Studies suggest that altitude, terrain slope, and vegetation cover significantly influence wild goat distribution [8,9].
Capra aegagrus is also a vital prey for large predators such as the Anatolian leopard (Panthera pardus tulliana) and the grey wolf (Canis lupus) [9]. Prey species are fundamental to maintaining ecological balance, and their availability is a key determinant of carnivore populations [10,11,12]. Effective conservation management relies on understanding the abundance and distribution patterns of wildlife, particularly large mammals [13]. Knowledge about the state and developments of animal populations is essential for effectively implementing wildlife conservation efforts [14,15,16].
Wildlife is crucial to ecosystems and helps us understand species’ geographic ranges, which are vital for conserving biodiversity [17]. Data on animal presence and population trends, essential for conservation, can be collected using various methods [16]. Distance sampling, especially Line Transect Distance Sampling (further-LTDS), has recently become popular for estimating animal group size or density under challenging conditions [18,19]. Camera Trapping Distance Sampling (further-CTDS) can simultaneously estimate the densities of multiple species [20,21,22] and has been used to assess population size, activity, distribution, and structure [23,24,25,26,27,28].
Besides numerous studies within the country examining the morphological traits, distribution ranges, and habitat preferences of wild goats [4,6,29,30,31], there has been a notable increase in research focusing on population size, especially in recent years [32,33,34,35,36,37,38,39]. However, in order to draw definitive conclusions about the conservation status and population trends of the species in Türkiye, studies need to be conducted using different methods across various regions of the country.
The aim of this study was to assess the population distribution, habitat use, and habitat suitability of the wild goat (Capra aegagrus) in Batman Province, southeastern Türkiye, by integrating LTDS, Kernel Density Estimation (KDE), and Euclidean Distance Analysis (EDA). Specifically, the study sought to (i) identify spatial patterns of population concentration, (ii) determine the key environmental and anthropogenic factors influencing habitat suitability, and (iii) delineate high-suitability core areas and potential ecological corridors within a fragmented landscape. By combining field-based population data with spatial and environmental analyses, this study aims to provide a scientific basis for conservation planning, land-use management, and the long-term sustainability of C. aegagrus populations in the region.
2. Materials and Methods
2.1. Study Area
The research was conducted in Batman Province, located in south-eastern Türkiye (41°10′–41°40′ N, 38°40′–37°50′ E). The study landscape spans 4,349 km2 and is characterized by a rectangular topography, with mountainous terrain flanking the northern and southern borders. The northern region is bounded by the Mereto, Sultan, and Aydınlık mountains, reaching its highest elevation at Mereto Mountain (2,967 m). In contrast, the southern boundary is defined by the Raman and Karakaş mountains [40]. The central part of the province consists primarily of the Batman River basin, featuring fertile plains utilized for central settlements and intensive cultivation.
The region is dominated by a continental climate, and its vegetation is predominantly composed of steppe communities with Irano-Turanian floral elements. A significant hydrogeological feature of the area is the Ilısu Dam Lake, one of the largest reservoirs in the Southeastern Anatolia Project (GAP). Fully operational since 2020, the dam reservoir not only submerged the 10,000-year-old historical site of Hasankeyf but also introduced a substantial anthropogenic barrier. This reservoir now bisects the landscape, potentially affecting wildlife connectivity and movement patterns. Consequently, the research area was stratified into two distinct study regions, designated as North and South, to account for the ecological and geographical fragmentation caused by the Ilısu Dam Lake (Figure 1).
2.2. Transect Design and Sampling Strategy
Field surveys were conducted between October 2020 and May 2023. A total of 22 line transects were established: 8 in the northern region and 14 in the southern region (Figure 1). These regions are geographically separated by central settlements and cultivated plains. Due to the region’s complex topography, logistical difficulties, and security constraints, a fully randomized transect placement across the entire province was not feasible. Instead, a constrained systematic sampling approach was adopted. Transects were strategically positioned within accessible areas that represented suitable mountainous habitats for the wild goat. This design intentionally excluded unsuitable landscapes, such as low-lying plains, because sampling these areas would not significantly contribute to population density estimates for a montane species.
Furthermore, certain regions were inaccessible due to military restrictions. We acknowledge that the transect placement was influenced by these external safety and accessibility factors. However, such adaptive sampling strategies are widely accepted in wildlife studies conducted in rugged terrain where strict randomization is practically impossible [41,42]. Each transect was surveyed to ensure representative coverage of the ecological niches utilized by Capra aegagrus within both the North and South strata
2.3. Data Collected
Field surveys were conducted through 242 systematic walks across 22 established transects, with transect lengths ranging from 469 m to 2,625 m. To ensure seasonal representation, each transect was surveyed 11 times, resulting in a total sampling effort of 283.47 km. Observations were carried out between sunrise and sunset by two researchers using a laser rangefinder (6×21 Gen II SCRF-16), a DSLR camera (Canon EOS 660), a GPS unit (Magellan eXplorist 110), and binoculars (Nikon 7×50 CF WP). For each sighting, the date, time, geographic coordinates, altitude, and the distance and angle between the observer and the animals were recorded. In addition, the total number of individuals observed and their demographic structure (males, females, and young) were documented (Table S1). Of the 242 total walks, the target species (Capra aegagrus) was recorded in 87 surveys. This sample size meets the requirements for robust population estimation, as it exceeds the minimum recommended threshold of 60–80 encounters reported in the literature [43,44,45].
2.3. Data Analyses
The wild goat population density was estimated using LTDS protocols. Analyses were performed using the Distance package in R (R Core Team, 2023). Detection distances (r) and sighting angles (Ɵ) recorded during field surveys were converted into perpendicular distances (x) using the trigonometric formula (x = r sin Ɵ), as proposed by Thomas et al. [18].
To refine the detection function, asymmetric truncation was applied, excluding observations within 50 m (left truncation) and the 10% of observations furthest from the transect line (right truncation) to minimize the impact of outliers and movement near the transect line. Various detection functions were evaluated, and the Half-Normal key function with Cosine adjustment terms was selected as the most parsimonious model based on the lowest Akaike’s Information Criterion (AIC). Model fit was validated using Cramér–von Mises goodness-of-fit tests. Given the survey constraints, the analysis focused on estimating local density rather than extrapolating abundance to the entire province. Detailed mathematical frameworks for the LTDS method follow Buckland et al. [41].
Habitat suitability for Capra aegagrus was assessed using a spatially explicit, raster-based multi-criteria evaluation approach. Presence records were first used to generate a Kernel Density Estimation (KDE) surface that represents relative encounter intensity across the study area. This KDE layer was considered a proxy for habitat preference and served as the primary biological input to the model. Environmental predictors, including distances to forests, agricultural lands, water bodies, and settlements, were calculated using Euclidean Distance metrics.
To ensure comparability among predictors, all layers were standardized to a continuous scale ranging from 0 to 1. Variables for which proximity was assumed to increase suitability (KDE, distance to water, and distance to forested areas characterized by sparse and low-stature vegetation) were transformed such that higher values indicated greater suitability. Conversely, variables representing anthropogenic disturbance (distance to settlements and agricultural areas) were standardized so that increasing distance corresponded to higher suitability.
A weighted linear combination was then applied to generate the final habitat suitability index. Weights were assigned based on ecological relevance and field observations, with KDE receiving the highest contribution (0.40), followed by proximity to forested areas (0.25) and water sources (0.20). Lower weights were assigned to distance from agricultural lands (0.075) and settlements (0.075), reflecting their secondary but still relevant influence on habitat suitability.
The resulting continuous suitability surface was classified into five equal-interval habitat suitability classes: very low, low, medium, high, and very high. Area statistics for each class were calculated in square kilometers to quantify the spatial distribution of suitable habitats across the study area. All analyses were conducted in R using the terra package. The complete R workflow supporting this study is archived on Zenodo (https://doi.org/10.5281/zenodo.18374659).
3. Results
Between October 2020 and May 2023, the population density and habitat preferences of wild goats (Capra aegagrus) were investigated using Line Transect Distance Sampling (LTDS) and Kernel Density Estimation (KDE). Survey efforts covered 283.47 km of transects within a 431 km2 area, with 112.99 km2 effectively sampled. A total of 806 individuals (87 initial encounters) were recorded, comprising 461 juveniles, 73 males, and 272 females (Table 1, Table S1).
In this study, the LTDS method was applied to estimate population density and total population size of the target species within the study area, and the detection function, density, and population size parameters were calculated accordingly. For population analysis, a Half-Normal key function with a cosine adjustment was selected as the most parsimonious model. To reduce the effects of avoidance behavior at close distances and rounding errors in near-distance measurements, left truncation of 50 m and right truncation of 10% were applied. After truncation, a total of 65 valid encounters (n) remained, comprising 22 encounters in the northern region and 43 encounters in the southern region (Table 1).
The value of the detection function at zero distance, f(0) = 0.0043, indicates a high probability of detecting individuals near the transect line. The average probability of detection (Pa = 0.78, SE = 0.140, CV = 18.07%), despite its relatively high variability, supports the overall reliability of the model. The effective strip width (ESW) was estimated at 155.31 m, indicating that an effective sampling depth was achieved on both sides of the transect line after accounting for detection probability. The encounter rate (ER) was 0.23 per km, suggesting a relatively even distribution of observed groups per unit transect length across the study area.
Across all regions, the % CVs of the encounter rate parameters ER(S) and ER were below 25%, indicating high precision in the estimates. In particular, the %CV of Total ER(S) was 11.37%, demonstrating that the model performed in a highly stable manner for the overall dataset. Based on the analysis results, the estimated individual density for the entire study area was D = 6.47 individuals/km2 (SE = 1.498), with a corresponding total population size of N = 2,787 individuals (SE = 645.793). At the regional scale, the estimated density was D = 5.85 individuals/km2 (SE = 2.329) in the northern region, whereas a higher density of D = 6.47 individuals/km2 (SE = 1.498) was calculated for the southern stratum. Detailed statistics for all parameters are summarized in Table 2. The density-related parameters (DS and D) exhibited higher %CV values compared to other parameters across all strata (North DS: 37.75%; South DS: 25.47%; Total DS: 21.75%).
Distance histograms and the fitted detection functions obtained from the line transect analysis are presented in Figure 2. Following truncation, the majority of observations were concentrated at shorter distances from the transect line, with detection probability decreasing with increasing distance. Overall, a good fit was observed between the histograms and the fitted detection functions, indicating that the model assumptions were adequately met. In particular, for the North and South strata, the post-truncation distance distributions were more regular, and the fitted detection functions satisfactorily represented the observed histograms (Figure 2).
Finally, the integration of KDE enabled the transformation of these observations into a continuous density surface, enabling a fine-scale evaluation of habitat preferences. Ağırlıklı çekirdek yoğunluk tahmini (Weighted KDE) sonuçları, yaban keçilerinin Batman ilinin kuzey ve güney kesimlerinde yoğunlaştığını göstermektedir Figure 3A). Analiz yalnızca kuzey ve güney çalışma alanlarında toplanan verilerle sınırlı olduğundan diğer bölgelerdeki düşük yoğunluk değerleri veri yokluğundan kaynaklanmaktadır. The habitat suitability analysis indicated that suitable areas for Capra aegagrus were spatially limited within Batman Province. Of the total study area (4348.53 km2), the majority was classified as medium suitability (61.35%), followed by low suitability areas (37.37%). High and very high suitability classes together covered only 47.97 km2, corresponding to 1.10% of the study area. These highly suitable areas were mainly concentrated around kernel density hotspots and were closely associated with proximity to water resources and semi-open forested habitats, while areas near settlements and agricultural lands exhibited lower suitability. The results suggest that optimal habitats for Capra aegagrus in the region are fragmented and restricted to specific landscape patches (Figure 3B).
4. Discussion
The Line Transect Distance Sampling (LTDS) method, which estimates population density by measuring the distances of detected individuals from a line or point, is widely used in wildlife studies and is generally regarded as a simpler, faster, and more accurate approach than camera trap distance sampling (CTDS). Although CTDS is often considered more cost-effective and time-efficient, it may be subject to certain methodological limitations that can affect detection probability and density estimates [18,41,44,46,47,48,49]. Numerous studies have shown that LTDS is particularly well suited for estimating the density and abundance of gregarious ungulate species [12,15,16,50,51,52,53,54,55,56]. Accordingly, LTDS was selected to estimate the population density of Capra aegagrus in the present study. In addition to population density estimation, Kernel Density Estimation (KDE) and Euclidean Distance Analysis (EDA) were employed to provide complementary insights into the species’ spatial distribution and landscape use.
It has been reported that random placement of transects in LTDS enables reliable generalizations across the entire study area [55]. This method is among the most commonly used approaches for assessing the density of large herbivores in mountainous environments [41]. However, several researchers have highlighted the challenges of meeting the core assumptions of distance sampling in mountainous terrain, including non-random placement of transects, inaccuracies in distance and angle measurements, and evasive behavior of target species [57,58,59]. In the present study, which aimed to estimate the population density of wild goats inhabiting steep, rocky habitats, complete randomization of transect placement was not possible due to both methodological constraints described in the literature and safety concerns. Instead, transects were positioned using a restricted systematic sampling approach within accessible areas that represent suitable mountainous habitats for wild goats.
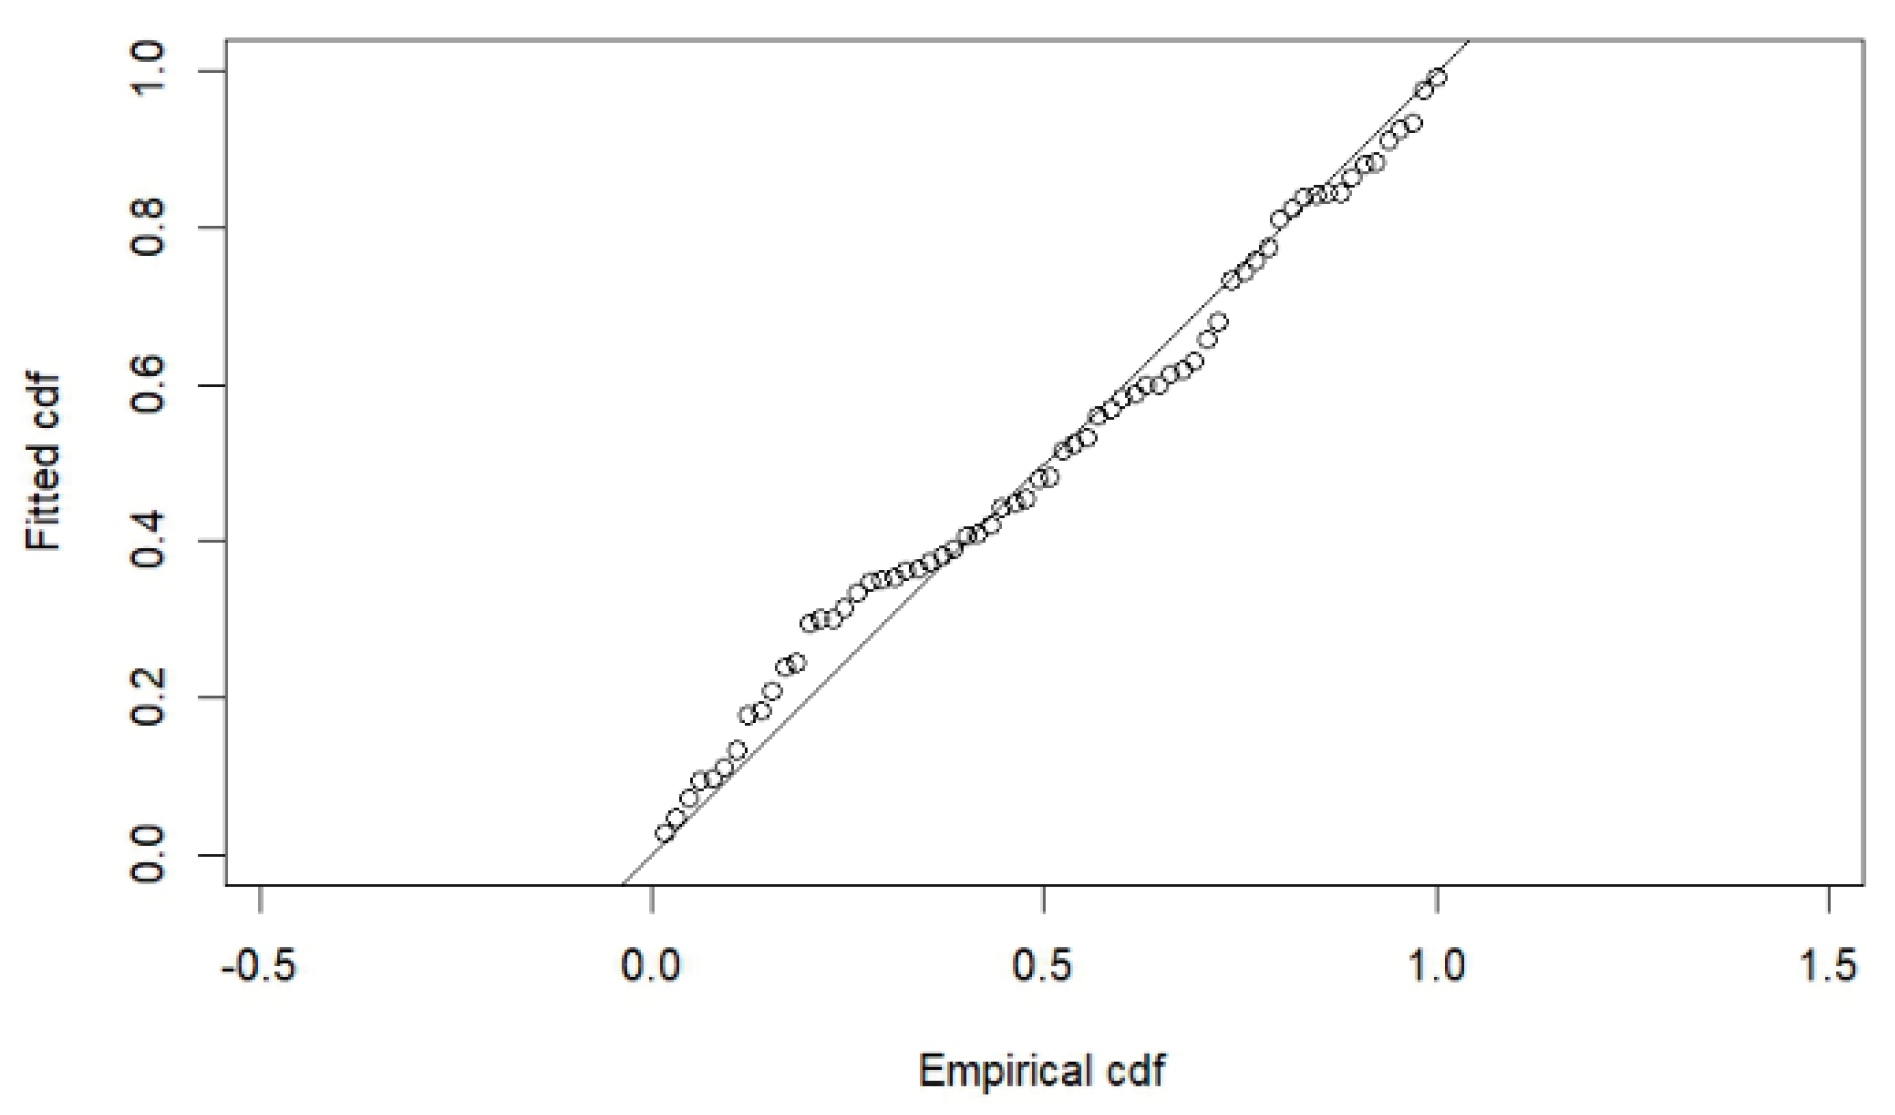
Goodness-of-fit tests indicated that the detection function provided an adequate fit to the observed data. The Kolmogorov–Smirnov (p = 0.35) and Cramér–von Mises (p = 0.301) tests showed no statistically significant deviation between the observed and predicted cumulative distributions, supporting the model’s fit. These results confirm that the observed distance data are consistent with the predicted distribution [41]. The general parallel pattern of the empirical and fitted cumulative distributions around the 1:1 line (Figure 3) suggests that the cosine-adjusted half-normal model, applied after left- and right-truncation, adequately represents the data. Overall, these findings provide a reasonable basis for interpreting the resulting abundance and density estimates. The high average detection probability (Pa = 0.78) observed in this study reflects the synergistic effect of the species’ social behavior and the region’s topography. The open, rocky landscape of Batman province, characterized by sparse vegetation, significantly minimizes the probability of missing large mammals within the 155-meter Effective Strip Width (ESW). This high detectability is further bolstered by the large mean cluster size (approximately 9 individuals), as larger groups are inherently more conspicuous in open terrains.
Figure 4.
Empirical and fitted cumulative distribution functions for the cosine-adjusted half-normal detection function following left and right truncation. Points denote the empirical distribution, whereas the solid line denotes the fitted model.
Figure 4.
Empirical and fitted cumulative distribution functions for the cosine-adjusted half-normal detection function following left and right truncation. Points denote the empirical distribution, whereas the solid line denotes the fitted model.
The estimated model parameters for the study areas showed differences across regions in both magnitude and uncertainty. The low %CV values (%11.37–23.05) and relatively narrow 95% confidence intervals for the ER(S) and ER parameters across all groups indicate that these parameters were reliably estimated by the model. In contrast, the higher %CV values observed for the DS and D parameters—particularly in the Northern population (DS: 37.75%; D: 39.82%)—suggest that these processes may be more strongly influenced by environmental variability or subject to increased data-related uncertainty. The similar point estimates and low uncertainty levels of the E(S) and M(S) parameters across all regions indicate that reproductive and maturation dynamics do not vary substantially at the regional scale. Examination of population size (N) estimates shows that the higher estimates and comparatively narrower confidence intervals obtained for the total population reflect increased model stability resulting from the pooled dataset. Conversely, the wide confidence interval for the N estimate in the Northern region underscores the need for additional data and highlights greater uncertainty in region-specific parameters.
While distance sampling analyses provide reliable estimates of population density at the landscape scale and offer insights into general distribution patterns, they do not capture how individuals utilize space within the landscape. This limitation was addressed through kernel density analyses, which revealed more detailed spatial patterns of habitat use. The weighted Kernel Density Estimation (KDE) analysis conducted in this study showed that wild goats were spatially concentrated in the northern and southern parts of the study area. The absence of observations in the central and other regions resulted in low or near-zero density values in these areas, which should be interpreted as a lack of data rather than a true absence of the species. The observed differences in density between the northern and southern regions may be associated with variations in sampling coverage, environmental conditions, or the relative distribution of observations. The use of a weighted KDE approach allowed for a more nuanced assessment of density patterns by incorporating not only the spatial locations of observations but also their associated weights. Nevertheless, the results are limited to the sampled areas, and future studies would benefit from broader and more spatially homogeneous sampling designs.
Euclidean distance analyses have shown a significant relationship between population density and the distance to settlements, agricultural areas, forests, and water sources. In the habitat suitability analysis, the species’ relationship with semi-open wooded areas and proximity to water sources was found to be higher than its relationship with settlements and agricultural areas. The fact that higher individual densities are generally associated with natural habitats suggests that these areas better meet ecological requirements such as shelter, feeding, and avoidance of human pressure. Similar results have been reported in studies on other ungulate and medium-sized mammal species [41,60,61]. In this study, proximity to forested areas with sparse vegetation cover in the region increased habitat suitability, thereby supporting previous findings on habitat selection by wild goats. Furthermore, these sparse woodlands and semi-natural areas meet the ecological needs of wild goats and offer greater visibility to observers than closed forests, which explains the high detection rate (p=0.78) in our analyses. In contrast, areas dominated by intensive agriculture and human settlements consistently exhibited lower suitability values. Previous studies have shown that disturbances associated with human land use and habitat fragmentation negatively affect habitat quality for large herbivores [62].
Previous studies conducted in Batman Province reported a total of 3,069 wild goats (Capra aegagrus; D = 2.23 individuals/km2) based on direct observations and 3,598 individuals (D = 2.62 individuals/km2) based on camera-trap data [37]. In contrast, the LTDS method applied in the same area in the present study, with an increased number of transects and an extended survey effort, yielded a substantially higher estimated density (D = 6.47 individuals/km2), while the estimated total population size remained comparable to previously reported values. This discrepancy suggests that increased sampling intensity can significantly influence density estimates without necessarily resulting in marked differences in total population size estimates.
Population sizes reported from other regions in Türkiye include 7,527 and 8,707 individuals in the Lakes Region in 2017 and 2018 [3], 3,092 and 3,182 individuals in Adıyaman Province in 2016 and 2017 [35], and 1,358 individuals in the Demirkazık Wildlife Area [39]. These estimates fall within the lower and upper bounds of the population size estimates obtained in the present study. Reported population densities of C. aegagrus in Türkiye range from 1.49 individuals per 100 ha in the Isparta region [32,33], 2.50 individuals/km2 in Mersin–Cehennemdere [34], 7.27 individuals/km2 in the Demirkazık Wildlife Area [39], and between 2.44 and 6.07 individuals/km2 in the Isparta–Yazılıkaya State Hunting Area between 2008 and 2019 [36]. Similar to findings reported for Batman [37], density estimates derived from point-count methods in these regions are largely consistent with the results of the present study.
Outside Türkiye, a census in Balochistan, Iran, reported 720 (D = 1.59) Capra aegagrus blythii individuals in 2019, 710 (D = 1.59) in 2020, 550 (D = 1.21) in 2021, and 548 (D = 1.21) in 2022 across an area of approximately 45,123.97 km2 [38]. These values fall within an acceptable range relative to estimates from our study. Overall, when compared with previous studies employing different methodologies both within and outside the study area [3,35,36,37,38,39,40,41,42], the total population size estimated in the present study consistently falls within the 95% confidence intervals of previously reported values, although mean population densities reported in the literature are generally lower than those estimated here.
The results of this study have important implications for the conservation and management of Capra aegagrus in Batman Province. Given that high and very-high suitability habitats cover only a small, fragmented proportion of the landscape, conservation efforts should prioritize protecting these core areas, particularly in the northern and southern parts of the province. Maintaining connectivity between these suitable patches is crucial to facilitate movement and gene flow, especially in a landscape bisected by the Ilısu Dam reservoir. Establishing and preserving ecological corridors across semi-open and rocky habitats could mitigate the isolating effects of large water bodies and intensive land use. Furthermore, limiting the expansion of agricultural activities and human settlements near identified high-suitability areas would help reduce habitat degradation and disturbance. Integrating habitat suitability maps into regional land-use planning and wildlife management strategies may support more effective conservation actions and contribute to the long-term persistence of Capra aegagrus populations in southeastern Türkiye.
5. Conclusions
This study demonstrates that integrating Line Transect Distance Sampling (LTDS), Kernel Density Estimation (KDE), and Euclidean Distance Analysis (EDA) provides a comprehensive perspective on the population dynamics and habitat use of wild goat (Capra aegagrus) populations in Batman Province. Spatial analyses revealed that the population is not homogeneously distributed across the landscape but is primarily concentrated in semi-open forested and rocky habitats, while human settlements and intensive agricultural areas significantly constrain habitat suitability. In particular, given habitat fragmentation and anthropogenic pressures from large-scale infrastructure projects such as the Ilısu Dam, protecting high-suitability core areas and maintaining ecological connectivity among them are critical for preserving genetic diversity and ensuring the long-term persistence of the species. Consequently, integrating the habitat suitability maps produced in this study into regional land-use planning and wildlife management strategies would facilitate the development of more effective and sustainable conservation actions for wild goat populations in southeastern Türkiye.
Supplementary Materials
The following supporting information can be downloaded at: Preprints.org, Table S1. The table below shows the coordinates, elevations, and lengths of the transects in the study area for the wild goat Capra aegagrus observations conducted using the Line transect method, as well as the coordinates where the species was observed in each encounter, the distance and angle between them, and the observer’s coordinates and the distance and angle to the species. Additionally, the table includes information such as the date, time, number, and structure of individuals/groups (male, female, and young) for each encounter.
Author Contributions
Conceptualization, S.U.; methodology, S.U. and E.Y.; software, S.U.; validation, S.U. and E.Y.; formal analysis, S.U.; investigation, S.U. and E.Y.; resources, S.U. and E.Y.; data curation, S.U.; writing—original draft preparation, visualization, S.U.; supervision, S.U.; project administration, S.U. All authors have read and agreed to the published version of the manuscript.
Funding
This research was partly supported by the Batman University (BATÜBAP-2022-YL22) project entitled “Determination of the Natural Distribution Areas and Population Densities of the Wild Goat Capra aegagrusErxleben, 1777 (Mammalia: Artiodactyla) species in Batman Province.”
Data Availability Statement
All data generated or analyzed during this study are included in this published article (and its Supplementary Information Files).
Acknowledgments
This study was partly based on EyüpYıldırım’s Master’s Thesis. We thank the staff of the Batman Provincial Directorate of Nature Conservation and National Parks for their support during our fieldwork. We are also grateful to the valued reviewers for their comments and critiques, which helped shape this article. The authors have reviewed and edited the content and take full responsibility for the final publication.
Conflicts of Interest
The authors have no competing interests to declare that are relevant to the contents of this article.
Abbreviations
The following abbreviations are used in this manuscript:
| IUCN | International Union for Conservation of Nature | NT | Near Threatened |
| LT | Line Transect | CT | Camera Trap |
| LTDS | Line transect distance sampling | CTDS | Camera trap distance sampling |
| DS | Distance sampling | AIC | Akaike’s Information Criterion) |
| P | Probability of observing an object in the area | f(0) | pdf value at zero for LT |
| D(S) | Estimate of the density of clusters | D | Estimate of the density of animals |
| E(S) | Expected cluster size | M(S) | Mean cluster size |
| ER | Encounter rate of animals | ESW | Effective strip width for LT |
| N | Estimate of the number of animals in the area | CV | Coefficient Variation |
| CI | Confidence Interval | SE | Standard Error |
References
- Weinberg, P.; Jdeidi, T.; Masseti, M.; Nader, I.; de Smet, K; Cuzin, F. Capra aegagrus (Mediterranean assessment). The IUCN Red List of Threatened Species 2010: e.T3786A10076391. Accessed on 06 November 2025.
- Macar, O.; Gürkan, B. Observations on the behavior of wild Goat (Capra aegagrus, Erxleben 1777). Hacettepe J. Biol. Chem. 2009, 37, 13–21. [Google Scholar]
- Ekinci, H.; Suel, H. Population size and structure of Wild Goat (Capra aegagrus, Erxleben); Example of Lakes Region. Science and Technique in the 21st Century 2023, 10, 40–46. [Google Scholar]
- Turan, N. Antalya-TermesosYabanKeçisi (Capra aegagrusaegagrus L.) PopulasyonununGelişimi, BugünküDurumuveSorunları; Türkiyeve Balkan ÜlkelerindeYabanHayatıSempozyumu: İstanbul, 1987. [Google Scholar]
- Demirsoy, A. YaşamınTemelKuralları, Omurgalılar / Amniyota (Sürgünler, KuşlarveMemeliler), 1st ed.; Meteksan A.Ş.: Ankara, 1992; Volume III, pp. 1–942. ISBN 975-7746-08-8. [Google Scholar]
- Çanakçıoğlu, H.; Mol, T. YabanHayvanlarıBilgisi; İstanbul ÜniversitesiYayınları, İstanbul ÜniversitesiRektörlüğüBasımevive Film MerkeziMüdürlüğü: İstanbul, 1996; pp. 1–550. [Google Scholar]
- Kence, A.; Ozut, D.; Balkız, O. Armenian mouflon survey in eastern Türkiye and Nakhticevan. In Caprinae News; Canada, 2002; pp. 1–2. [Google Scholar]
- Koohestani, M.; Naderi, S.; Shadloo, S. Evaluation of habitat quality and determining the distribution of Wild goat (Capra aegagrus) in Roodbarak prohibited hunting region, Kelardasht, Iran. Casp. J. Environ. Sci. 2022, 20, 863–870. [Google Scholar] [CrossRef]
- Zenbilci, M.; Özdemir, S.; Çıvğa, A.; Ünal, Y.; Oğurlu, İ. Habitat suitability modeling of wild goat (Capra aegagrusErxleben, 1777) in different periods. Šumar. List. 2024, 148, 273–284. [Google Scholar] [CrossRef]
- Carbone, C.; Gittleman, J.L. A common rule for the scaling of carnivore density. Science 2002, 295, 2273–2276. [Google Scholar] [CrossRef]
- Karanth, K.U.; Nichols, J.D.; Kumar, N.S.; Link, W.A.; Hines, J.E. Tigers and Their Prey: Predicting Carnivore Densities from Prey Abundance. Proc. Natl. Acad. Sci. U.S.A 2004, 101, 4854–4858. [Google Scholar] [CrossRef]
- Basak, K.; Suraj, M.; Ahmed, M.; Kumar, U.; Bhattacharjee, S. The first attempt to assess the population status of large predators and their prey in an unexplored central Indian Protected Area. Wildl. Lett. 2023, 1, 47–58. [Google Scholar] [CrossRef]
- Wang, S.W.; Macdonald, D.W. Feeding Habits and Niche Partitioning in a Predator Guild Composed of Tigers, Leopards, and Dholes in a Temperate Ecosystem in Central Bhutan. J. Zool. 2009, 277, 275–283. [Google Scholar] [CrossRef]
- Goldsmith, B. Monitoring for conservation and ecology, 1st ed.; Chapman & Hall: London, 1991; p. p. 275. [Google Scholar] [CrossRef]
- Plumptre, A.J.; Cox, D. Counting primates for conservation: primate surveys in Uganda. Primates 2006, 47, 65–73. [Google Scholar] [CrossRef] [PubMed]
- Leca, J.B.; Gunst, N.; Rompis, A.; Soma, G.; Putra, I.G.A.A.; Wandia, I.N. Population Density and Abundance of Ebony Leaf Monkeys (Trachypithecusauratus) in West Bali National Park, Indonesia. Primate Conserv. 2013, 26, 133–144. [Google Scholar] [CrossRef]
- Liu, H.; Gong, P.; Wang, J.; Clinton, N.; Bai, Y.; Liang, S. Annual dynamics of global land cover and its long-term changes from 1982 to 2015, link to GeoTIFF files, [dataset]; PANGAEA, 2020. [Google Scholar] [CrossRef]
- Thomas, L.; Buckland, S. T.; Rexstad, E. A.; Laake, J. L.; Strindberg, S.; Hedley, S. L.; Bishop, J. R. B.; Marques, T. A.; Burnham, K. P. Distance software: design and analysis of distance sampling surveys for estimating population size. J. Appl. Ecol. 2010, 47, 5–14. [Google Scholar] [CrossRef]
- Glass, R.; Forsyth, D.M.; Coulson, G.; Bianchet, M. F. Precision, accuracy, and bias of walked line-transect distance sampling to estimate eastern grey kangaroo population size. Wildl. Res. 2015, 42, 633–641. [Google Scholar] [CrossRef]
- Rowcliffe, J.M.; Field, J.; Turvey, S.T.; Carbone, C. Estimating animal density using camera traps without the need for individual recognition. J. App. Ecol. 2008, 45, 1228–1236. [Google Scholar] [CrossRef]
- Gilbert, N.A.; Clare, J.D.J.; Stenglein, J.L.; Zuckerberg, B. Abundance estimation of unmarked animals based on camera-trap data. Biol. Conserv. 2021, 35, 88–100. [Google Scholar] [CrossRef] [PubMed]
- Mason, S.S.; Hill, R.A.; Whittingham, M.J.; Cokill, J.; Smith, G.C.; Stephens, P.A. Camera trap distance sampling for terrestrial mammal population monitoring: Lessons learnt from a UK case study. Remote Sens. Ecol. Conserv. 2022, 8, 717–730. [Google Scholar] [CrossRef]
- Ancrenaz, M.; Hearn, A.; Ross, J.; Sollmann, R.; Wilting, A. Handbook for Wildlife Monitoring using Camera Traps; BBEC II Secretariat: Kota Kinabalu, Malaysia, 2012. [Google Scholar]
- McCallum, J. Changing use of camera traps in mammalian field research: habitats, taxa, and study types. Mammal Rev. 2013, 43, 196–206. [Google Scholar] [CrossRef]
- Rovero, F.; Zimmermann, F.; Berzi, D.; Meek, P. “Which camera trap type and how many do I need?” A review of camera features and study designs for a range of wildlife research applications. Hystrix It. J. Mamm. 2013, 24, 148–156. [Google Scholar] [CrossRef]
- Burton, A.C.; Neilson, E.; Moreira, D.; Ladle, A.; Steenweg, R.; Fisher, J.T.; et al. REVIEW: wildlife camera trapping: a review and recommendations for linking surveys to ecological processes. J. Appl. Ecol. 2015, 52, 675–685. [Google Scholar] [CrossRef]
- Meek, P.D.; Ballard, G.A.; Fleming, P.J.S. The Pitfalls of Wildlife Camera Trapping as a Survey Tool in Australia. Aust. Mammal. 2015, 37, 13–22. [Google Scholar] [CrossRef]
- Delisle, Z.J.; Miller, D.L.; Swihart, R.K. Modelling density surfaces of intraspecific classes using camera trap distance sampling. Methods Ecol. Evol. 2023, 14, 1287–1298. [Google Scholar] [CrossRef]
- Serez, M. Geyik, Karaca, Alageyik, YabankeçisiveYabankoyunlarındaYaşTayiniYöntemi. KTÜ J. For. Res. 1981, 4(1), 214–219. [Google Scholar]
- Balkız, Ö. TermessosveKaçkarDağıMilliParklarındaBilimselÇevreEğitimi. BilimveTeknik-TÜBİTAK 2001, 34–35. [Google Scholar]
- Arpacık, A.; Sarı, A. Yabankeçisi (Capra aegagrusErxleben, 1777)’nindiyetinioluşturanbazıodunsubitkitürleri: Giresun, Çamolukörneği. J. For. Res. 2022, 9, 185–193. [Google Scholar] [CrossRef]
- Gündoğdu, E. Population Ecology of Wild Goat Capra aegagrusErxleben 1777 in Isparta, Turkey. Phd Thesis, SüleymanDemirel University Institute of Science, Isparta, 2006. [Google Scholar]
- Gündoğdu, E.; Oğurlu, İ. The distribution of Wild Goat Capra aegagrusErxleben 1877 and population characteristics in Isparta, Türkiye. J. Anim. Vet. Adv. 2009, 8, 2318–2324. [Google Scholar]
- Gündoğdu, E. Population Size, Structure and Behaviours of Wild Goat in Cehennemdere Wildlife Improvement Area. Asian J Anim Vet Adv. 2011, 6, 555–563. [Google Scholar] [CrossRef]
- Keskin, F. Observations on wild goat Capra aegagrusErxl. populations in Adıyaman region. M.Sc. Thesis, Istanbul University, Cerrahpaşa Institute of Graduate Studies, İstanbul, 2019. [Google Scholar]
- Ünal, Y.; Oğurlu, İ. Population status of wild goat (Capra aegagrusErxl. 1777) in the Yazılıkaya State Reserve in Isparta. JoPAR 2022, 1, 24–33. [Google Scholar] [CrossRef]
- Yıldırım, E. Determination of the natural distribution areas and population densities of wild goat Capra aegagrusErxleben, 1777 (Mammalia: Artiodactyla) in Batman Province. M.Sc. Thesis, Batman University Graduate Education Institute, Batman, 2023. [Google Scholar]
- Ullah, N.; Basheer, I.; Minghai, Z.; Rajpar, M.N.; Rehan, M.; Khan, M.T. Spatiotemporal distribution and population trends of Sindh ibex (Capra aegagrusblythii) in Balochistan during 2019–2022. Eur. J. Wildl. Res. 2024, 70, 1–36. [Google Scholar] [CrossRef]
- Yiğen, S.M.; Gündoğdu, E. Population size of the Wild Goat (Capra aegagrus) in the Demirkazık Wildlife Development Area. Turkish Journal of Forestry 2025, 26, 374–383. [Google Scholar] [CrossRef]
- Bulut, G.; Doğan, A.; Şenkardeş, İ.; Avcı, R.; Tuzlacı, E. The Medicinal and Wild Food Plants of Batman City and Kozluk District (Batman-Turkey). Agric. Conspec. Sci. 2019, 84, 29–36. [Google Scholar]
- Buckland, S.T.; Anderson, D.R.; Burnham, K.P.; Laake, J.L. Distance Sampling: Estimating Abundance of Biological Populations, 1st ed.; Chapman & Hall: London; New York, 1993. [Google Scholar] [CrossRef]
- Fewster et al., 2009.
- Buckland, S.T.; Anderson, D.R.; Burnham, K.P.; Laake, J.L.; Borchers, D.L.; Thomas, L. Introduction to distance sampling: estimating abundance of biological populations; Oxford University Press: London, UK, 2001. [Google Scholar] [CrossRef]
- Thomas, L.; Buckland, S.T.; Bumham, K.P.; Anderson, D.R.; Laake, J.L.; Borchers, D.L.; Strindberg, S. Distance Sampling. In Encyclopedia of Environmetrics; El-Shaarawi, A.H., Piegorsch, W.W., Eds.; John Wiley & Sons, Ltd.: Chichester, 2002; Volume 1, pp. 544–552. [Google Scholar] [CrossRef]
- Kühl, H.; Maisels, F.; Ancrenaz, M.; Williamson, E.A. Best Practice Guidelines for Surveys and Monitoring of Great Ape Populations; Williamson, E.A., Ed.; IUCN SSC Primate Specialist Group (PSG): Gland, Switzerland, 2008; 32p, Available online: http://www.primate-sg-org/ISBN 978-2-8317-1062-4.
- Burnham, K.P.; Anderson, D.R.; Laake, J.L. Estimation of density from line transect sampling of biological populations. Wildl. Monogr. 1980, 72, 1–202. Available online: http://www.jstor.org/stable/3830641.
- Buckland, S.T.; Plumptre, A.J.; Thomas, L.; Rexstad, E.A. Line transect sampling of primates: Can animal-to-observer distance methods work? Int. J. Primatol. 2010, 31, 485–499. [Google Scholar] [CrossRef]
- Cassey, P.; McArdle, B.H. An assessment of distance sampling techniques for estimating animal abundance. Environmetrics 1999, 10, 261–278. [Google Scholar] [CrossRef]
- Wearn, O.R.; Glover-Kapfer, P. Snap happy: camera traps are an effective sampling tool when compared with alternative methods. R. Soc. Open Sci. 2019, 6, 181748. [Google Scholar] [CrossRef]
- Defler, T.R.; Pintor, D. Censusing primates by transect in a forest of known primate density. Int. J. Primatol. 1985, 6, 243–259. [Google Scholar] [CrossRef]
- Chapman, C.; Fedigan, L.M.; Fedigan, L. A comparison of transect methods of estimating population densities of Costa Rican primates. Brenesia 1988, 30, 67–80. [Google Scholar]
- Garcia, J.E. Comparisons of estimated densities computed for Saguinusfuscicollis and Saguinuslabiatus using line transect sampling. Primates Report 1993, 37, 19–29. [Google Scholar] [CrossRef]
- Peres, C. General guidelines for standardizing line transect surveys of tropical forest primates. Neotrop. Primates 1999. 7, ll–16. [Google Scholar] [CrossRef]
- Brugiere, D.; Fleury, M.C. Estimating primate densities using home range and line transect methods: a comparative test with the black colobus monkey Colobus satanus. Primates 2000, 41, 373–382. [Google Scholar] [CrossRef]
- Plumptre, A.J. Monitoring mammal populations with line transect techniques in African forests. J. Appl. Ecol. 2000, 37, 356–368. [Google Scholar] [CrossRef]
- Marshall, A.R.; Lovett, J.C.; White, P.C.L. Selection of line-transect methods for estimating the density of group-living animals: Lessons from the Primates. Am. J. Primatol. 2008, 70, 1–11. [Google Scholar] [CrossRef] [PubMed]
- Corlatti, L.; Fattorini, L.; Nelli, L. The use of blockcounts, mark–resight and distance sampling to estimate populationsize of amountain-dwelling ungulate. Population Ecology 2015, 57, 409–419. [Google Scholar] [CrossRef]
- O’Neill, H. Designing robust ranger based monitoringstrategies for the saiga antelope Saiga tatarica tatarica. PhD thesis, Imperial College London, UK, 2008. [Google Scholar]
- Singh, N.J.; Milner-Gulland, E.J. Monitoring ungulatesin Central Asia: current constraints and future potential. Oryx 2011, 45, 38–49. [Google Scholar] [CrossRef]
- Marques, T.A.; Thomas, L.; Martin, S.W.; Mellinger, D.K.; Ward, J.A.; Moretti, D.J.; Harris, D.; Tyack, P.L. Estimating animal population density using passive acoustics. Biol. Rev. 2012, 88, 287–309. [Google Scholar] [CrossRef]
- Shackleton, D. M. Wild sheep and goats and their relatives: Status survey and conservation action plan for Caprinae. Intl. Uni. Conserv. Nat. Pak 1997, 1–390. [Google Scholar]
- Fischer, J.; Lindenmayer, D.B. Landscape modification and habitat fragmentation: a synthesis. Global Ecology and Biogeography 2007, 16, 265–280. [Google Scholar] [CrossRef]
Figure 1.
Location of the study area and spatial distribution of line transects used for wild goat (Capra aegagrus) surveys in Batman Province, southeastern Türkiye. The map shows the position of Batman Province within Türkiye, land cover classes derived from CORINE data, major rivers and the Ilısu Dam reservoir, and the division of line transects into northern and southern survey sections. Transect lines and observation points indicate areas where LTDS was conducted to assess population distribution and habitat use.
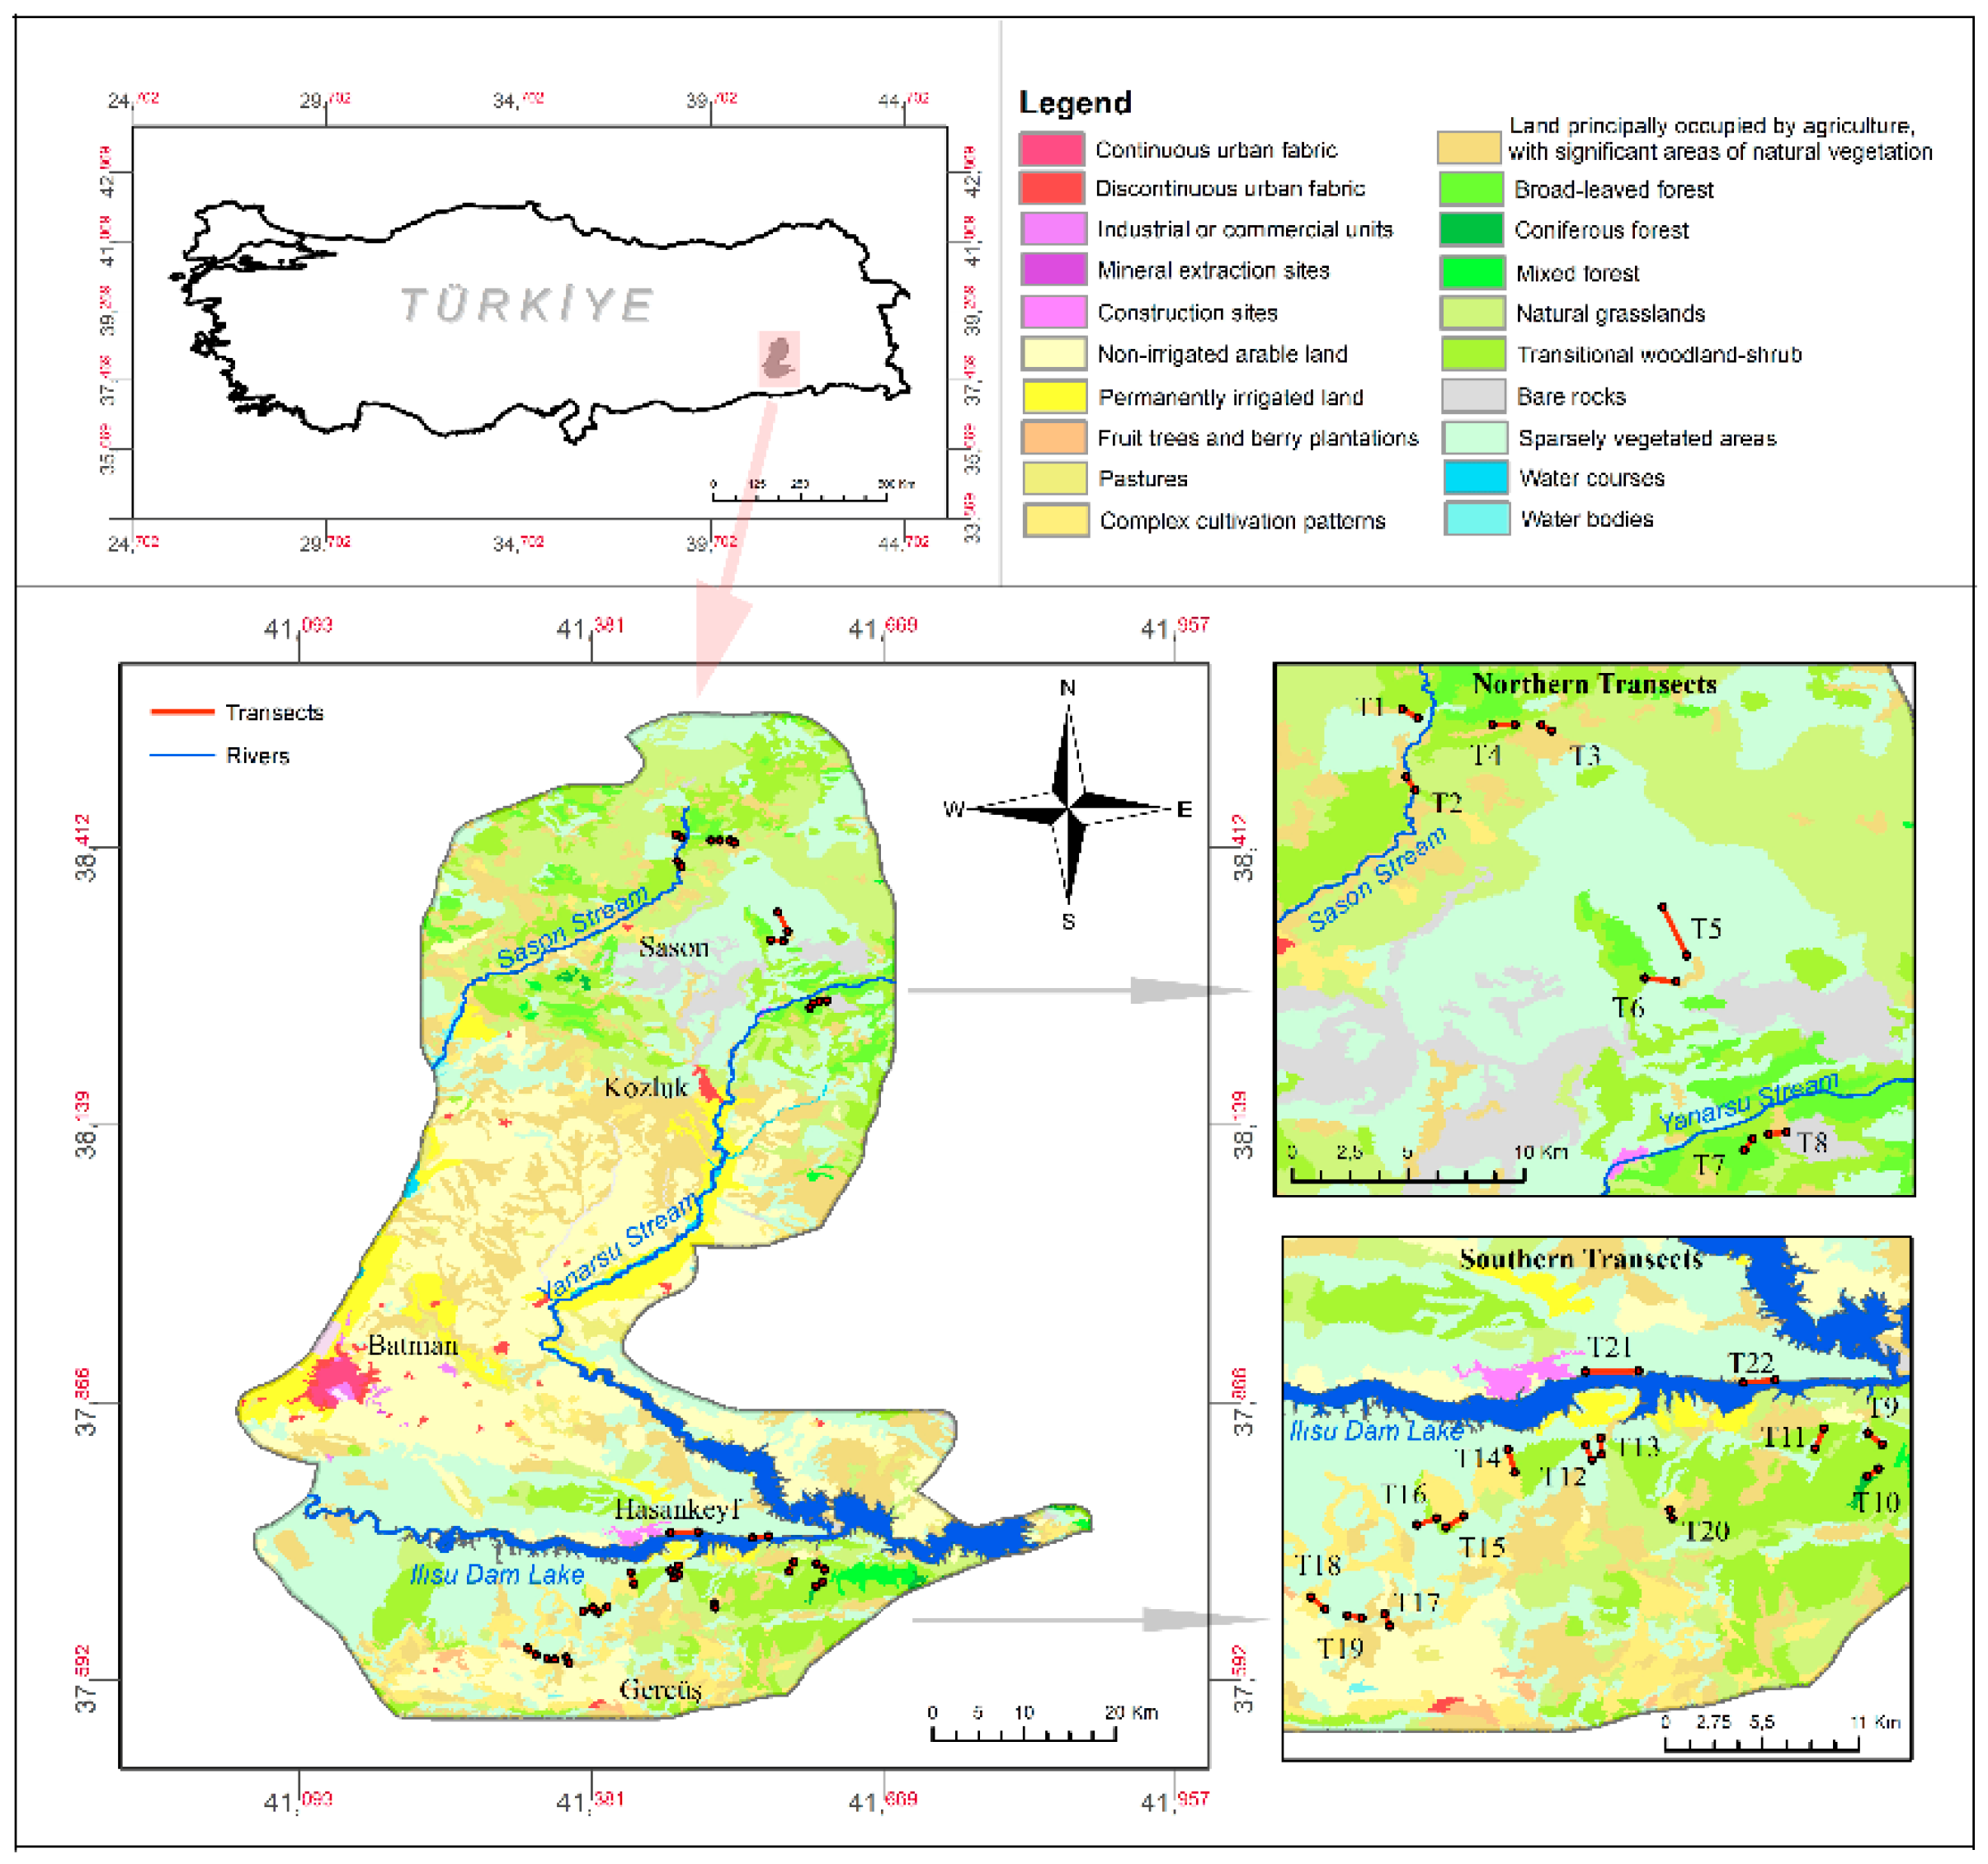
Figure 2.
Distance histograms and fitted detection functions obtained from the Line Transect Distance Sampling (LTDS) analysis for Capra aegagrus. Panels show results for the (A) North, (B) South, and (C) Total study areas. Bars represent the frequency of observations by distance class after truncation, while solid lines indicate the fitted detection functions, illustrating the decline in detection probability with increasing distance from the transect line.
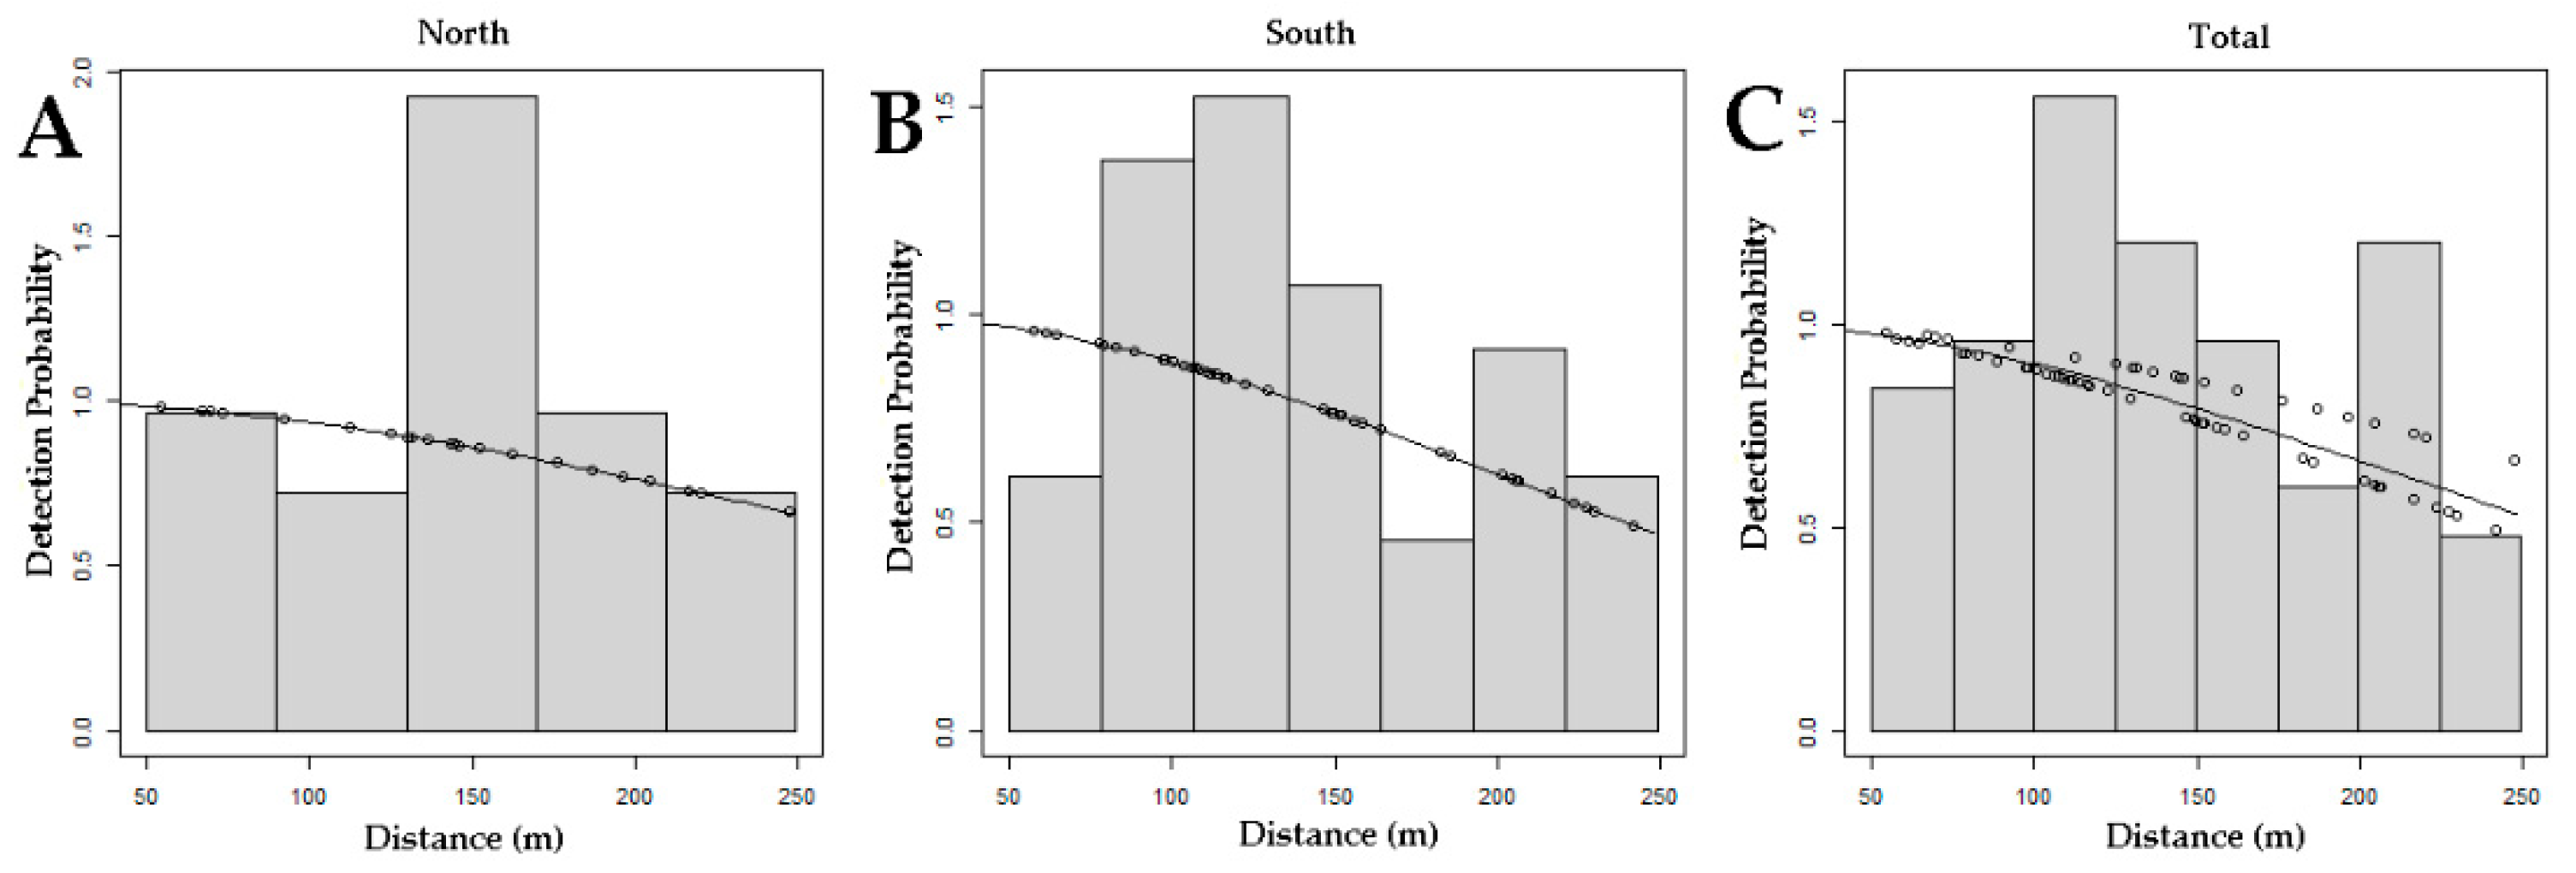
Figure 3.
(A) Kernel-weighted density surface representing the spatial intensity of Capra aegagrus observations derived from Kernel Density Estimation (KDE). Warmer colors indicate areas of higher observation density. (B) Habitat suitability map classified into five suitability classes based on environmental variables, illustrating the spatial distribution of suitable habitats for C. aegagrus across the study area. Observation points are overlaid to show their correspondence with high-suitability zones.
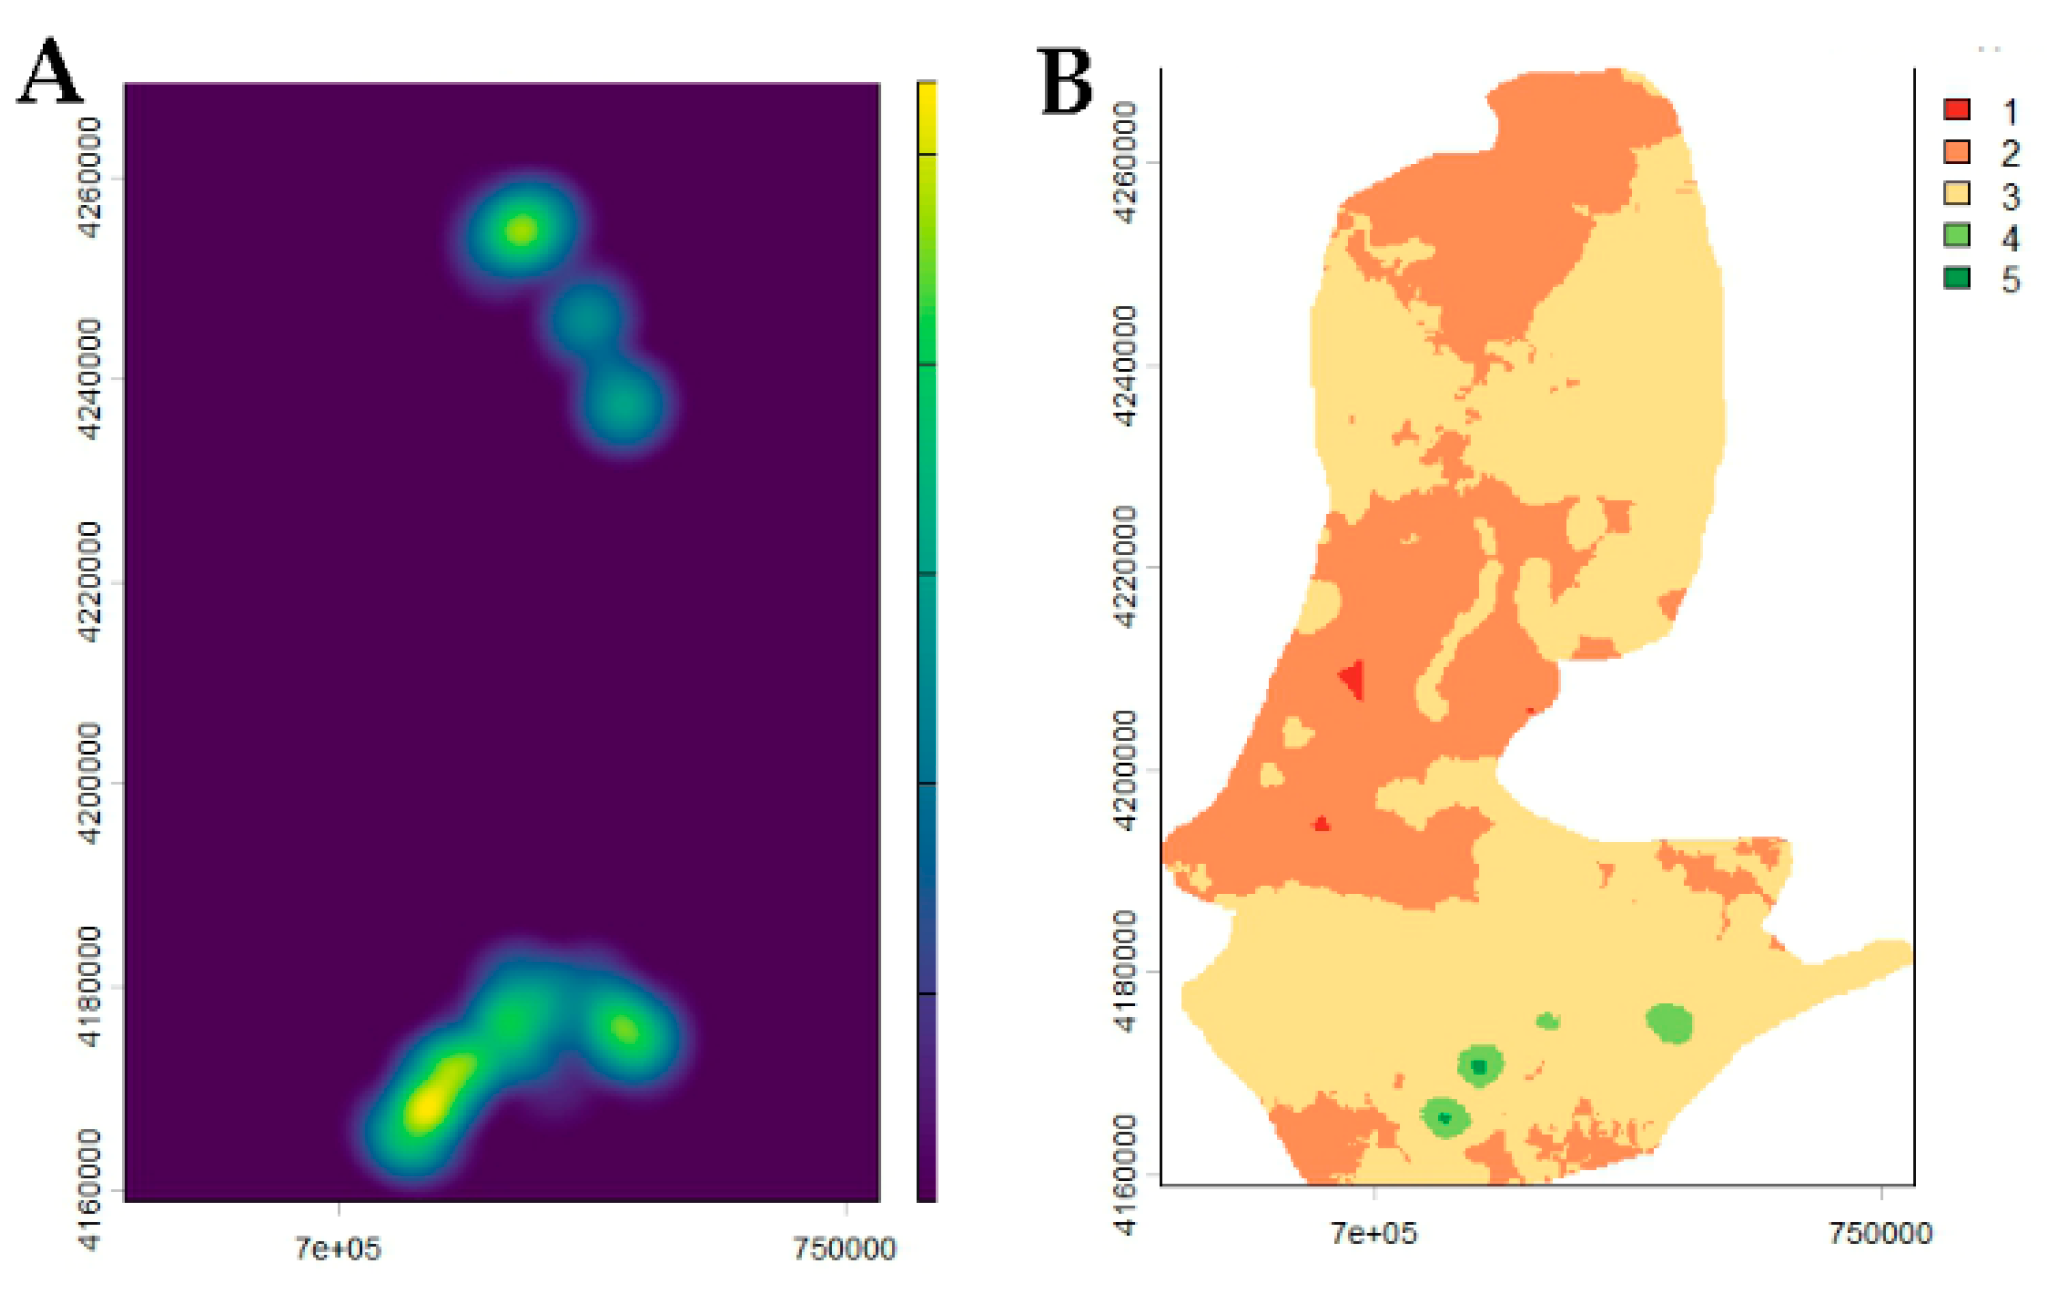

Table 1.
Summary of the study area, sampling effort, and encounter statistics for Line Transect Distance Sampling (LTDS) surveys conducted in the North and South strata and across the total study area. (n represents the number of independent encounters with Capra aegagrus, and k denotes the number of transect walks conducted during the survey period.
| North | South | Total | |
|---|---|---|---|
| Study area (km2) | 190 | 241 | 431 |
| Covered area (km2) | 36.57 | 76.42 | 112.99 |
| Sampling effort (km) | 91.75 | 191.72 | 283.47 |
| n | 22 | 43 | 65 |
| k | 88 | 154 | 242 |
Table 2.
Parameter estimates, standard errors (SE), coefficients of variation (%CV), and 95% confidence intervals (CI) derived from the Line Transect Distance Sampling (LTDS) analysis for Capra aegagrus in the North and South strata and for the total study area. Parameters include encounter rate of cluster [ER(S)], encounter rate of individuals (ER), density estimates of clusters (DS), density estimates of individuals (D), mean and expected cluster size [E(S), M(S)], and estimated population size (N).
| Parameter | Estimate | SE | %CV | 95% CI | |
|---|---|---|---|---|---|
| North | ER(S) | 0.23 | 0.046 | 19.24 | 0.14-0.32 |
| ER | 1.97 | 0.455 | 23.05 | 1.08-2.86 | |
| DS | 0.71 | 0.268 | 37.75 | 0.34-1.46 | |
| D | 5.85 | 2.329 | 39.82 | 2.74-12.50 | |
| E(S) | 8.22 | 1.104 | 13.42 | 6.06-10.38 | |
| M(S) | 8.23 | 1.124 | 13.65 | 6.03-10.43 | |
| N* | 1111 | 442.550 | 39.82 | 519-2375 | |
| South | ER(S) | 0.22 | 0.030 | 13.27 | 0.16-0.28 |
| ER | 2.08 | 0.368 | 17.74 | 1.36-2.80 | |
| DS | 0.75 | 0.191 | 25.47 | 0.45-1.23 | |
| D | 6.95 | 1.951 | 28.06 | 4.04-11.98 | |
| E(S) | 9.25 | 1.108 | 11.97 | 7.08-11.42 | |
| M(S) | 9.26 | 1.117 | 12.06 | 7.07-11.45 | |
| N | 1675 | 470.317 | 28.06 | 972-2887 | |
| Total | ER(S) | 0.23 | 0.026 | 11.37 | 0.18-0.28 |
| ER | 2.03 | 0.287 | 14.15 | 1.47-2.59 | |
| DS | 0.73 | 0.159 | 21.75 | 0.48-1.22 | |
| D | 6.47 | 1.498 | 23.17 | 4.11-10.16 | |
| E(S) | 8.81 | 0.780 | 9.07 | 7.28-10.34 | |
| M(S) | 8.91 | 0.828 | 9.29 | 7.29-10.53 | |
| N | 2787 | 645.793 | 23.17 | 1773-4379 |
Disclaimer/Publisher’s Note: The statements, opinions and data contained in all publications are solely those of the individual author(s) and contributor(s) and not of MDPI and/or the editor(s). MDPI and/or the editor(s) disclaim responsibility for any injury to people or property resulting from any ideas, methods, instructions or products referred to in the content. |
© 2026 by the authors. Licensee MDPI, Basel, Switzerland. This article is an open access article distributed under the terms and conditions of the Creative Commons Attribution (CC BY) license (http://creativecommons.org/licenses/by/4.0/).
Copyright: This open access article is published under a Creative Commons CC BY 4.0 license, which permit the free download, distribution, and reuse, provided that the author and preprint are cited in any reuse.


