
Submitted:
27 January 2026
Posted:
28 January 2026
You are already at the latest version
Abstract
In sports nutrition, performance adaptation emerges from the coordinated molecular interaction between physical training and nutrient availability. This narrative review introduces Training–Fuel Coupling (TFC) as a systems physiology framework that conceptualizes nutrient availability, timing, and recovery feeding as molecular control variables governing exercise-induced adaptation. Integrating evidence from exercise metabolism and nutritional science, the model describes how substrate availability modulates the dynamic crosstalk between AMP-activated protein kinase (AMPK) and mechanistic target of rapamycin (mTOR), shaping metabolic flexibility, anabolic recovery, and long-term performance optimization. Low-energy and low-glycogen contexts preferentially activate AMPK-dependent pathways supporting mitochondrial remodeling and oxidative efficiency, whereas nutrient-replete states facilitate mTOR-mediated protein synthesis and structural restoration. When strategically alternated through chrono-nutrition and nutritional periodization, these energetic states generate oscillatory signaling patterns that enhance adaptive efficiency while limiting chronic metabolic strain. From a sports nutrition perspective, TFC provides a mechanistic rationale for energy availability management, recovery nutrition, and the prevention of maladaptive states such as Relative Energy Deficiency in Sport (RED-S). By reframing nutrients as regulatory signals rather than passive fuel, this framework integrates molecular nutrition with performance physiology, offering a unifying model for individualized training–nutrition optimization and long-term metabolic resilience.
Keywords:
sports nutrition
; molecular nutrition
; energy availability
; chrono-nutrition
; AMPK–mTOR signaling
; nutritional periodization
; performance optimization
; RED-S
1. Introduction
Optimizing human performance requires more than balancing training load and energy intake—it requires understanding how energy metabolism and molecular signaling co-regulate adaptation. Traditional models of exercise metabolism frame nutrients as fuel and training as stimulus. Yet, mounting evidence shows that nutrients also serve as signals shaping molecular pathways and long-term adaptations [1,2,3,4,5]
Within sports nutrition, this perspective has shifted attention from macronutrient quantity toward energy availability, nutrient timing, and context-dependent signaling as key determinants of exercise-induced adaptation. Nutrients are increasingly recognized as regulatory inputs that interact with cellular energy-sensing networks, modulating the balance between catabolic and anabolic pathways. Through this lens, variations in substrate availability shape how training stress is processed at the molecular level, influencing mitochondrial remodeling, protein synthesis, and recovery efficiency across repeated training cycles [6,7,8,9,10].
The Training–Fuel Coupling (TFC) concept captures this bidirectional relationship: training modifies metabolic environment, and metabolic environment modifies how training is interpreted by the cell. This coupling links the energetic state of the muscle to adaptive pathways like mitochondrial biogenesis, hypertrophy, or fatigue resistance through the dynamic interplay of AMP-activated protein kinase (AMPK) and the mechanistic target of rapamycin (mTOR) signaling.
Despite abundant empirical data, there is still no unifying systems-level framework that explains when and how nutrient timing and availability modulate performance adaptations. This study therefore proposes a mechanistic conceptual model based on systems physiology and control theory principles, treating the organism as a self-regulating energetic system with defined inputs (exercise), controllers (signaling networks), and outputs (adaptation, performance).
We outline four model-derived hypotheses emerging from the Training–Fuel Coupling framework:
H1:
Variability in energetic state across training sessions enhances adaptation efficiency up to a physiological threshold.
H2:
Individual glycogen and amino acid availability thresholds determine the dominance of AMPK- versus mTOR-mediated signaling.
H3:
Periodized manipulation of nutrient timing (e.g., train-low, lift-fed) produces oscillatory signaling patterns that optimize long-term adaptation.
H4:
Continuous metabolic monitoring—such as continuous glucose monitoring (CGM), heart rate variability (HRV), and oxygen kinetics (O₂ kinetics)—can support closed-loop control of training based onTraining–Fuel Coupling(TFC) principles.
Literature Review
Physiological adaptation to exercise cannot be understood apart from the energetic context in which it occurs. Over the past two decades, the concept of metabolic flexibility has redefined performance as the ability of the organism to oscillate efficiently between carbohydrate and lipid oxidation, rather than a static notion of energetic efficiency. This switching capacity becomes the pivot of any model that attempts to link training-induced stress with nutritional support—including the Training–Fuel Coupling (TFC) model proposed here, in which flexibility represents a control variable that determines the efficiency of adaptation [11,12,13,14,15].
Research on glycogen availability has consistently shown that glycogen functions not merely as an energy reserve but as a contextual sensor. Its level directly influences the activation of AMPK and the transcription of peroxisome proliferator-activated receptor gamma coactivator 1-alpha (PGC-1α), and “train-low” strategies intensify oxidative signaling and mitochondrial biogenesis. However, when this strategy becomes chronic, anabolic capacity is reduced. Thus, glycogen appears as a switching threshold between two distinct metabolic regimes—the exact role assigned to it in the TFC hypothesis of adaptive regulation [16,17,18,19,20].
At the center of this balance lies the AMPK–mTOR crosstalk, a genuine logic gate of the system. Molecular literature demonstrates that AMPK activation inhibits mechanistic target of rapamycin complex 1 (mTORC1) when energy is low, while leucine and insulin intake reactivate the anabolic pathway. This alternation between inhibition and activation is what TFC describes as functional oscillation—a periodic succession of catabolic and anabolic states designed to maximize adaptation. Similarly, data on essential amino acid supplementation confirm that anabolism depends on the synchronization between protein intake and energetic status, not on absolute quantity [21,22,23,24,25].
These discoveries have given rise to a new paradigm: nutritional periodization. A series of studies have shown that deliberate variations in carbohydrate and protein intake between sessions train the metabolic system as effectively as variations in volume or intensity. Training–Fuel Coupling provides the theoretical foundation for this logic: the calculated alternation of energetic states maintains the dual sensitivity of AMPK–mTOR, preventing signal desensitization and optimizing adaptive efficiency [26,27,28,29,30].
An important reinterpretation of the literature on concurrent training (endurance and strength) supports the same idea. The so-called “interference effect” does not arise from the overlap of stimuli, but from energetic misalignment between the two exercise modalities. TFC offers a coherent explanatory framework: there is no intrinsic incompatibility between mixed training types, only a matter of metabolic timing—of positioning relative to glycogen and mTOR activation thresholds [31,32,33,34,35].
Likewise, evidence concerning chronobiology of metabolism suggests that the time of day and the post-exercise window modify nutrient sensitivity and gene expression responses. Circadian oscillations of AMPK and mTOR activity confirm that time acts as a dimension of regulation, not a passive context. Within this view, TFC integrates the temporal factor as part of the system’s control, proposing a rhythmic physiology of adaptation [36,37,38,39,40].
As research on redox signaling and the Sirtuin-1 NAD⁺ dependent deacetylase (SIRT1/NAD⁺) axis has advanced, where sirtuin-1 (SIRT1) activity depends on nicotinamide adenine dinucleotide (NAD⁺) availability, it has become evident that moderate oxidative stress is also a component of adaptive regulation. Reactive oxygen species are not merely by-products but calibrating signals capable of modulating the amplitude of AMPK and PGC-1α responses. In the TFC model, this redox loop operates as a fine feedback mechanism, adjusting the “volume” of the signal without altering its logical structure [41,42,43,44,45].
Recent literature also emphasizes that nutritional recovery is not a pause but the anabolic phase of the same adaptive cycle. Glycogen repletion and protein synthesis do not merely restore stores but reset thresholds for the next session. Thus, recovery becomes an active input of the system, not a passive interval between stimuli—a central principle in TFC [46,47,48,49,50].
Individual differences, often cited as evidence of adaptive unpredictability, can be understood in terms of mobile thresholds. “Non-responders” are not biological exceptions but individuals whose energetic oscillation fails to reach the optimal regulatory frequency. In this interpretation, personalization of training becomes a matter of calibrating the energetic cycle rather than rewriting mechanisms [51,52,53,54,55].
Technological advances have enabled continuous monitoring of metabolic signals—glucose, HRV, lactate, peripheral temperature—offering insight into the system’s energetic position. Practically, these variables become the “observables” of the control loop proposed by TFC, allowing real-time regulation of metabolic oscillations [56,57,58,59,60].
Viewed in isolation, many experimental findings appear contradictory. Some studies show benefits of carbohydrate restriction, others of supercompensation; some emphasize intensity, others frequency. TFC provides a unifying explanation: these differences merely reflect distinct phases of the same oscillating system. Rather than rejecting paradoxes, it integrates them into a shared logic of adaptive regulation [61,62,63,64].
Ultimately, converging evidence on AMPK–mTOR crosstalk, “train-low/recover-high” strategies, and endogenous energetic rhythms supports the idea that optimal performance results from an intelligent alternation of energetic states, not stability. Training–Fuel Coupling transforms these dispersed observations into a coherent architecture of physiological control, where stress and recovery emerge as complementary phases of the same adaptive equation [65,66,67,68,69].
2. Methodological Approach
Because the Training–Fuel Coupling framework is derived from the integration of heterogeneous mechanistic evidence rather than from primary data collection, the methodological approach adopted here emphasizes transparency in how evidence was selected, organized, and conceptually integrated. The following subsection delineates the narrative review design and evidence synthesis logic that underpins the construction of the proposed systems model.
2.1. Narrative Review Design and Conceptual Synthesis
This study was conducted as a narrative review with conceptual synthesis, designed to integrate mechanistic evidence from exercise physiology, nutrition science, and systems biology into a unified theoretical framework termed Training–Fuel Coupling (TFC). The methodological objective was not quantitative effect estimation, but the identification, organization, and integration of mechanistic patterns that explain how energetic context modulates adaptive signaling and performance outcomes.
Given the complexity of AMPK–mTOR crosstalk, substrate availability thresholds, and temporal regulation of adaptation, a narrative review approach was selected as the most appropriate methodological design. This format allows the synthesis of heterogeneous evidence—including human intervention studies, molecular experiments, animal models, and theoretical physiology—into a coherent explanatory architecture that cannot be captured by meta-analytic aggregation alone.
Literature Search Strategy - a structured but non-exhaustive literature search was conducted to identify studies relevant to the interaction between training load, nutrient availability, and molecular signaling pathways governing adaptation. The primary databases consulted included PubMed, Scopus, and Web of Science, covering publications from 2000 to 2025, a period corresponding to the maturation of molecular exercise physiology and nutritional periodization research.
Search terms were combined using Boolean logic and included keywords related to:
exercise metabolism, energy availability, glycogen, AMPK, mTOR, PGC-1α, SIRT1, nutritional periodization, train-low strategies, concurrent training, metabolic flexibility, and systems physiology. Reference lists of key reviews and landmark articles were also screened to identify additional conceptually relevant sources.
The search strategy prioritized mechanistic relevance and theoretical contribution over completeness. As such, studies were selected based on their ability to elucidate regulatory relationships, signaling thresholds, temporal dynamics, or feedback mechanisms linking energetic state to adaptive outcomes.
Study Selection and Inclusion Criteria - included studies met one or more of the following criteria:
- Experimental or theoretical work describing molecular regulators of energy sensing and growth signaling (e.g., AMPK, mTORC1, SIRT1, PGC-1α).
- Human or animal studies examining the effects of substrate availability, glycogen manipulation, or nutrient timing on training adaptation.
- Research addressing nutritional or training periodization, including “train-low”, “sleep-low”, fasted vs. fed training, and concurrent training paradigms.
- Conceptual or systems-level papers providing theoretical frameworks for metabolic regulation, feedback control, or adaptive dynamics.
No formal exclusion criteria based on sample size, population, or study design were imposed, as the aim was conceptual integration rather than statistical inference. Review articles were included when they contributed theoretical clarity or summarized mechanistic consensus.
Conceptual Synthesis and Systems Integration - rather than pooling outcomes quantitatively, the selected literature was reorganized through a systems physiology lens, treating the organism as a self-regulating energetic system. Evidence was mapped across three interacting layers:
- Control inputs – training load, intensity, and nutrient availability.
- Regulatory controllers – molecular signaling networks centered on AMPK, mTORC1, and SIRT1.
- Adaptive outputs – mitochondrial remodeling, protein synthesis, performance capacity, and recovery efficiency.
This mapping enabled the identification of recurrent regulatory motifs—reciprocal inhibition, threshold switching, oscillatory dominance, and feedback adjustment—which were subsequently formalized into the Training–Fuel Coupling framework. Hypotheses (H1–H4) were derived through analytical deduction based on the internal logic of this integrated system rather than post hoc interpretation of isolated findings.
Analytical Deduction and Model Validation - the conceptual model was evaluated through internal logical validation and external correspondence with empirical literature. Internal validation ensured consistency with established biological principles, including energy sensing polarity, signaling hierarchy, and feedback directionality. External validation assessed whether the predicted behaviors of the model—energetic variability, threshold regulation, oscillatory coupling, and closed-loop adaptation—were congruent with observed training and nutritional phenomena reported in experimental studies.
This dual validation approach aligns with best practices for theory-building narrative reviews, where robustness is achieved through coherence, explanatory power, and empirical plausibility rather than statistical aggregation.
Scope and Methodological Boundaries - this narrative review focuses primarily on skeletal muscle metabolism and performance adaptation, acknowledging that other regulatory systems (endocrine, immune, behavioral) are discussed only insofar as they interact with energetic control. Molecular thresholds and composite indices proposed within the TFC framework represent context-dependent estimates, intended to guide hypothesis generation rather than define universal physiological constants.
As a theory-building narrative review, this synthesis is inherently subject to selection bias, insofar as the included literature was prioritized for mechanistic relevance and conceptual contribution rather than exhaustive coverage. To mitigate this risk, evidence was drawn from multiple experimental levels (human, animal, and molecular), and contradictory or context-dependent findings were explicitly considered and integrated within the proposed systems framework rather than excluded.
Accordingly, the Training–Fuel Coupling model should be interpreted as a conceptual, hypothesis-generating framework whose validity rests on explanatory coherence and empirical plausibility, providing a structured basis for future experimental testing, longitudinal monitoring, and individualized training–nutrition optimization.
2.2. Conceptual Model Development
The development of the Training–Fuel Coupling (TFC) framework followed an analytical path grounded in systems physiology. Mechanistic evidence from exercise and nutrition research was reorganized within a unifying model that captures the regulatory interplay between energetic stress, molecular signaling, and adaptive outcomes. This methodological architecture was designed to formalize the logic through which training and substrate availability jointly determine the efficiency of physiological adaptation [70,71,72].
This model-building process was designed as a conceptual systems analysis aimed at developing a mechanistic framework linking training stimulus, substrate availability, and adaptive performance outcomes. Rather than collecting new experimental data, the research follows a model-building approach—integrating established physiological and molecular findings into a unified regulatory architecture termed the Training–Fuel Coupling (TFC) model [73].
The conceptual model development consisted of four sequential phases:
- Evidence Mapping: identification and organization of mechanistic studies describing interactions among exercise, nutrition, and molecular signaling (AMPK, mTOR, SIRT1).
- Systems Integration: synthesis of these mechanisms into a conceptual control model connecting energetic inputs, signaling controllers, and adaptive outputs.
- Analytical Deduction: derivation of system-level hypotheses describing expected behaviors under variable energetic and nutritional conditions.
- Model Validation: internal verification of logical consistency through diagrammatic reasoning and external consistency through correspondence with empirical literature.
This structure mirrors the logic of experimental design, where data are replaced by mechanistic evidence and statistical testing by systemic coherence analysis. The resulting framework constitutes a reproducible theoretical model capable of generating testable predictions for future empirical studies [74,75,76,77,78,79,80] (Figure 1)
The diagram functions as a methodological scaffold rather than a result: it formalizes how mechanistic findings are consolidated into a control architecture, from which system-level hypotheses (H1–H4) are analytically derived and then internally checked for coherence with established physiology. By separating evidence mapping, integrative modeling, hypothesis deduction, and internal validation, the workflow preserves inferential transparency, minimizes circularity, and yields a reproducible theoretical product that generates empirically testable predictions for subsequent studies.
2.3. Evidence Mapping
The first analytical phase consisted of mapping the existing mechanistic evidence describing how energetic stress, nutrient availability, and molecular signaling interact to determine training adaptation. Rather than a bibliometric survey, this phase functioned as a conceptual synthesis, extracting the structural logic of published findings in exercise metabolism and nutritional periodization. Studies were selected according to their contribution to mechanistic understanding—those that experimentally or theoretically linked training stimulus, substrate flux, and molecular regulators such as AMPK, mTOR, and SIRT1 [81,82].
The mapping process identified three complementary domains [83]. The first concerned the molecular controllers of energy and growth—AMPK as the principal energy sensor activated by low glycogen and ATP depletion, and mTORC1 as the key anabolic switch responsive to amino acid and insulin signaling. The second domain involved nutritional modulation, summarizing how carbohydrate and protein availability alter signaling kinetics across recovery and adaptation cycles. The third domain addressed training configuration, integrating endurance, resistance, and concurrent protocols that manipulate energy turnover and substrate oxidation. Collectively, these domains define the functional space within which metabolic regulation occurs [84].
From this mapping, patterns emerged that transcend individual studies. Repeatedly, evidence converged on the idea that alternating between energetic scarcity and abundance enhances adaptive signaling plasticity. Endurance trials under low-glycogen conditions amplified AMPK activity and mitochondrial biogenesis, whereas subsequent nutrient-rich recovery restored mTOR activation and protein synthesis. Resistance training combined with amino acid availability reinforced similar alternation effects, emphasizing temporal coupling between metabolic state and adaptive outcome. These consistencies provided the empirical foundation for treating energy state as a control variable rather than a background condition.
The resulting evidence map was organized as a matrix linking energetic context, dominant signaling pathway, and adaptive phenotype. Low-energy states aligned with oxidative remodeling and stress resilience; high-energy states with anabolic reconstruction and tissue growth. Transitional zones—moderate glycogen availability, mixed macronutrient recovery—produced hybrid adaptations characterized by efficiency gains without maximal hypertrophy. This structure clarified how substrate availability and training modality interact as dual inputs governing adaptation efficiency.
By systematizing dispersed findings into this logic matrix, the mapping phase established the empirical boundaries of the Training–Fuel Coupling framework [85,86]. It delineated where mechanistic consensus exists, where contradictions arise, and where theoretical modeling can extend interpretation. The process therefore converted a heterogeneous literature into a structured conceptual terrain from which the next phase, Systems Integration, could formalize the underlying control architecture.
2.4. Systems Integration
The integration phase translated the mapped evidence into a structured control model representing how training and nutritional inputs interact to regulate adaptive signaling. Building upon the relationships identified in the mapping stage, the Training–Fuel Coupling (TFC) framework was organized according to the logic of systems physiology: adaptive outcomes arise from the coordination of regulatory loops that maintain energy balance while promoting functional remodeling [86].
The model defines two primary control inputs. The first is training intensity and volume, which determine the magnitude of energetic stress through ATP turnover, glycogen depletion, and metabolite accumulation. The second is nutrient availability, modulating the degree of metabolic recovery and anabolic signaling through glucose, amino acids, and insulin responses. These inputs feed into three interacting regulatory controllers—AMPK, mTORC1, and SIRT1—each acting as a node in a coupled feedback network. AMPK functions as a negative feedback sensor, activated under energy deficit to restore balance through oxidative metabolism and substrate mobilization. mTORC1 serves as a positive feedback amplifier, driving protein synthesis and cellular growth under nutrient-rich conditions. SIRT1 acts as a modulator linking energy state to transcriptional control, fine-tuning both catabolic and anabolic responses [87,88].
The coupling of these controllers creates a bi-directional regulatory loop: exercise-induced energy stress activates AMPK and suppresses mTORC1, initiating mitochondrial biogenesis and metabolic reprogramming; post-exercise nutrient supply reverses this dominance, reactivating mTORC1 to rebuild structural and enzymatic capacity. When repeated across training cycles, this alternation generates oscillatory stability—a dynamic equilibrium between breakdown and synthesis that defines efficient adaptation [88,89].
The resulting control model is summarized schematically in Figure 2, which illustrates the dual-input, tri-controller structure of the Training–Fuel Coupling (TFC) system. It highlights how training load and nutritional fueling jointly modulate AMPK, mTORC1, and SIRT1 signaling to coordinate adaptive outcomes across energy stress and recovery phases.
As illustrated in Figure 2, the Training–Fuel Coupling framework operates as a self-regulating control system in which AMPK and mTORC1 act as alternating regulatory poles, with SIRT1 mediating their redox-dependent crosstalk. Through this dynamic interplay, training and nutrition jointly determine the polarity and magnitude of molecular signaling, translating energetic variability into functional remodeling. This structure forms the foundation for analyzing the system’s dynamic behavior.
2.5. Analytical Deduction
The analytical deduction phase explored the internal logic of the Training–Fuel Coupling (TFC) model to derive the dynamic behaviors predicted by its structure. Once the regulatory architecture was defined, the system’s feedback interactions were analyzed qualitatively to determine how variations in training intensity and substrate availability propagate through molecular signaling pathways to produce adaptive outcomes. This reasoning followed a control-theoretic logic rather than computational simulation: the goal was to identify consistent behavioral patterns—emergent modes—resulting from the model’s structure and feedback polarity [90,91].
The analysis began by examining energy flux sensitivity, defined as the degree to which energetic inputs (training load and nutrient availability) shift the balance between AMPK and mTOR dominance. Under low-energy conditions, AMPK activation suppresses mTOR signaling, initiating a catabolic state that enhances oxidative capacity and stress tolerance. When the energetic context reverses, nutrient-driven activation of mTORC1 dominates, promoting anabolic repair and protein synthesis. The alternation of these states across repeated training cycles generates a self-regulating oscillation—an adaptive rhythm that improves system efficiency over time.
From this dynamic emerged the first major behavioral principle: energetic variability enhances adaptive efficiency (Hypothesis H1). Alternating between states of energy scarcity and abundance preserves the responsiveness of both signaling axes, preventing desensitization and enabling a wider range of physiological adjustments. Conversely, constant energetic context (e.g., chronically high carbohydrate or continuous low-glycogen training) leads to pathway saturation and adaptive rigidity.
The second behavior derived from the model concerns threshold regulation (H2). The interplay between AMPK activation thresholds and mTOR sensitivity defines a switching boundary that determines when the system transitions from catabolic to anabolic dominance. Small perturbations in training load or substrate level near this threshold produce disproportionately large shifts in signaling outcome, explaining the non-linear and often individualized responses observed in practice. This threshold behavior reflects the bistable nature of coupled feedback loops—once the system crosses a critical energetic boundary, regulatory dominance flips rapidly, generating distinct adaptive trajectories.
A third emergent property is oscillatory coupling (H3), describing the periodic alternation of signaling dominance across microcycles. When training and feeding stimuli are alternated systematically, AMPK and mTOR form an interlocked rhythm—each phase preparing the molecular landscape for the other. This oscillation produces cumulative adaptations greater than the sum of isolated responses, analogous to resonance in physical systems. The model predicts that the frequency and amplitude of these oscillations determine the rate and magnitude of adaptation: excessive frequency yields instability, while insufficient alternation results in plateau.
Finally, the system demonstrates closed-loop regulation (H4), a property whereby adaptive outcomes modify future system sensitivity. As mitochondrial expansion lowers energy stress, subsequent training bouts elicit weaker AMPK activation, shifting the system gradually toward anabolic readiness. Similarly, increased muscle mass raises metabolic demand, re-sensitizing AMPK in later cycles. This feedback closure explains the adaptive phase-shifting observed in periodized training, where metabolic efficiency evolves without external recalibration.
To operationalize H1–H4 in a form that is directly measurable, we summarize a measurement-anchored control map linking OBSERVABLES to STATE ESTIMATION (indices), TUNING POLICY, and STABILIZED ADAPTATION across the microcycle (Figure 3). In this overlay, observables are treated as pragmatic proxies for state estimation, and the feedback arrow encodes how stabilized adaptation updates what is measured next.
Figure 3 is intentionally complementary to the mechanistic architecture: it specifies the measurement-to-control pathway (observables → indices → tuning policy) and the closed-loop feedback (stabilized adaptation → observables) without redefining intracellular signaling detail. The subsequent subsections formalize these indices and the microcycle oscillator assumptions used for analytical deduction.
These deductions, summarized in figure above, transform the TFC model from a static framework into a predictive regulatory system, capable of explaining diverse training phenomena within a single logic structure. The four emergent behaviors—variability, threshold, oscillation, and closure—represent testable hypotheses linking molecular regulation to practical adaptation. Each describes a distinct dynamic regime through which the training–nutrition interaction shapes performance outcomes, providing the mechanistic rationale for the quantitative formalization and conceptual results presented in the subsequent sections.
2.6. Quantitative Formalization and Operationalization of the TFC Dynamics
To express the emergent behaviors of the Training–Fuel Coupling (TFC) framework in measurable form, four composite indices were established—each representing a principal regulatory dimension of energetic control. These indices provide standardized, reproducible metrics that can be quantified experimentally or in applied monitoring contexts. Where applicable, variability-, stress-, and feedback-related indices (EVI, ESI, CLPI) were normalized to individual baseline values (z-scores) to ensure within-subject comparability across training cycles, whereas bounded phase-based indices (e.g., AOI) are reported on their natural 0–1 scale [90,91,92].
Energetic Variability Index (EVI) - the EVI quantifies how strongly molecular signaling fluctuates between catabolic (AMPK) and anabolic (mTORC1) dominance across repeated sessions:
where Rₐₘₚₖ,ᵢ and Rₘₜₒᵣ,ᵢ are phosphorylation ratios (phospho/total) for AMPK and mTORC1 in consecutive sessions, and σ₀ is the baseline standard deviation. In practice, EVI can be computed either as (1) the within-microcycle standard deviation of a session-wise dominance metric (e.g., log[RAMPK/RmTOR]), or (2) the standard deviation of session-to-session transitions as formalized above; when reported as a z-score relative to an individual baseline distribution, EVI values may be negative (below-baseline variability).
EVI = √Σ[(Rₐₘₚₖ,ᵢ₊₁ − Rₐₘₚₖ,ᵢ) − (Rₘₜₒᵣ,ᵢ₊₁ − Rₘₜₒᵣ,ᵢ)]² / (n−1) ÷ σ₀
Interpretation: High EVI (> +0.8 SD) = preserved signaling responsiveness; Low EVI (below baseline; z < 0) = metabolic rigidity.
Energetic Stress Index (ESI) - the ESI integrates adenylate and redox charge into a single descriptor of intracellular metabolic tension:
where AMP/ATP expresses adenylate energy charge and NAD⁺/NADH the redox ratio.
ESI = z (AMP / ATP) + z (NAD⁺ / NADH)
Interpretation: Positive ESI (> +1 SD) = catabolic / AMPK-dominant; Negative ESI (< –1 SD) = anabolic / mTORC1-dominant; Optimal ≈ 0 ± 1 SD.
Adaptive Oscillation Index (AOI) - the AOI quantifies the degree of anti-phase coupling between AMPK and mTORC1 activation across a training microcycle.
Let Δφ ∈ [0, π] denote the circular phase difference between φAMPK and φmTOR, estimated from cosine (cosinor) fits to their respective phosphorylation time-series.
AOI = Δφ / π
Interpretation: AOI ≈ 1 (Δφ ≈ π) reflects strong anti-phase alignment, indicating optimal alternation between catabolic (AMPK-dominant) and anabolic (mTORC1-dominant) states. AOI ≈ 0 (Δφ ≈ 0) indicates in-phase coupling, reflecting loss of metabolic alternation and reduced adaptive efficiency. Indicative thresholds: AOI > 0.7 = coherent anti-phase oscillation; AOI < 0.3 = desynchronization.
Closed-Loop Performance Index (CLPI) - the CLPI expresses the efficiency of feedback regulation linking energetic input, recovery, and performance stability:
where CVₛₑₛₛᵢₒₙ is the coefficient of variation of session-quality scores (RPE × [La]), ΔFuel the change in carbohydrate intake or CGM-derived energy availability, and ΔPerformance the relative change in performance output.
CLPI = (1 − CVₛₑₛₛᵢₒₙ) × (ΔFuel / ΔPerformance)
Interpretation: CLPI > +0.5 SD = effective self-regulation; CLPI < 0 = unstable feedback or poor recovery integration.
Operational Meaning - each index isolates a core layer of control within the TFC framework—variability (EVI), stress polarity (ESI), oscillatory timing (AOI), and feedback efficiency (CLPI). Together they transform the theoretical architecture into a quantifiable system, enabling the systematic testing of hypotheses H1–H4 across molecular, functional, and applied contexts.
All indices are dimensionless; variability-, stress-, and feedback-related indices (EVI, ESI, CLPI) are normalized to individual baseline values (z-scores), whereas bounded phase-based indices (e.g., AOI) are reported on their natural 0–1 scale. Positive composite scores denote efficient adaptive regulation; negative scores indicate desensitization or maladaptive instability.
Operationalization of the Indices
In applied settings, direct molecular quantification of AMPK–mTOR signaling or adenylate ratios is rarely feasible. Therefore, the Training–Fuel Coupling (TFC) framework can be operationalized through validated physiological and technological proxies that approximate the four regulatory dimensions described above [90,91,92,93,94,95].
Energetic Variability (EVI) - session-to-session variation in energetic context can be estimated from continuous glucose monitoring (CGM) and heart-rate variability (HRV). The ratio of low- to high-glucose training sessions within a week (Δmean glucose > ±1.5 mmol·L⁻¹·h⁻¹) and the standard deviation of daily HRV (SDNN or lnRMSSD) provide non-invasive correlates of metabolic diversity. An EVI derived from CGM–HRV variance above +0.8 SD denotes optimal energetic alternation.
Energetic Stress (ESI) - integrates adenylate and redox charge into a single descriptor of intracellular metabolic tension. In applied contexts, it can be inferred from post-exercise lactate, HRV suppression, and CGM glucose drift. High values reflect catabolic (AMPK-dominant) states, negative values anabolic (mTORC1-dominant) recovery; optimal adaptation occurs near equilibrium.
Adaptive Oscillation (AOI) - oscillatory coupling can be inferred from alternating patterns of session type and energetic context. Applying a cosine fit to the 7-day sequence of ESI values yields a phase estimate for metabolic stress and recovery. In applied settings, AOI can be approximated using a phase-based proxy derived from the anti-phase relationship between stress- and recovery-dominant sessions; coherence thresholds (AOIproxy > 0.7) reflect consistent alternation rather than in-phase synchronization.
Closed-Loop Performance (CLPI) - feedback efficiency can be quantified from session-quality variability and fueling adjustments. The parameter uses subjective exertion (RPE), external load (power or velocity), and fueling data (CGM-derived carbohydrate flux). High CLPI scores reflect adaptive stability—performance maintained with decreasing physiological strain [96,97,98].
Collectively, these proxy-based computations allow the TFC indices to be estimated using wearable sensors and routine performance data, transforming a mechanistic model into a field-ready monitoring framework. This operationalization enables longitudinal tracking of energetic variability, stress polarity, oscillatory coherence, and feedback efficiency—turning molecular logic into practical decision support for individualized training and nutrition periodization.
Practical estimation of these indices through wearable-derived data is summarized in Table 1, which lists non-invasive biomarkers, computational proxies, and interpretative thresholds for field application of the TFC framework.
Together, the practical biomarkers and proxy computations outlined in Table 1 enable real-world monitoring of Training–Fuel Coupling dynamics. By translating molecular principles into measurable physiological signals, these indices bridge laboratory precision with field applicability.
2.7. Model Validation and Visualization
Validation of the Training–Fuel Coupling (TFC) model was conducted at two complementary levels.
Internal validation confirmed that the regulatory architecture preserved established signaling polarities—AMPK as the energy-conserving feedback regulator, mTORC1 as the growth-promoting amplifier, and SIRT1 as the redox-sensitive modulator. This verification ensured the internal logical coherence of the dual-input, tri-controller design and the correct directionality of its feedback loops [99].
External validation examined the correspondence between model predictions and representative findings from exercise–nutrition research. Evidence from carbohydrate periodization, fasted versus fed training, and concurrent adaptation studies aligned with the predicted behaviors of the TFC framework, particularly the alternation of energetic dominance and the threshold-dependent transitions between catabolic and anabolic states [100].
Schematic visualization was employed throughout this process to consolidate the regulatory relationships and verify system coherence. This diagrammatic validation step ensured transparency between theoretical inference and physiological evidence, forming the methodological foundation for the analytical and empirical results [101].
3. Integrative Results of the Conceptual Framework
The validated Training–Fuel Coupling (TFC) model revealed four emergent behaviors that describe how training and nutritional inputs interact to determine adaptive outcomes. Unlike statistical results, these findings represent the mechanistic expressions of the system’s internal logic—patterns of regulation that arise from the interplay between energetic state and molecular control. Together, they explain how adaptation efficiency, threshold transitions, oscillatory dynamics, and feedback closure emerge from the same regulatory structure.
At the model level, the alternation between energetic scarcity and abundance generated a rhythmic modulation of AMPK and mTORC1 dominance, forming the basis of energetic variability. This property allowed the system to maintain sensitivity to both catabolic and anabolic stimuli, preventing pathway desensitization. Around this oscillating core, three additional regulatory behaviors appeared: a threshold mechanism that governs state transitions between energy stress and recovery; an oscillatory coupling pattern that produces phase-dependent optimization of adaptation; and a closed-loop feedback dynamic through which the outcomes of one cycle adjust the responsiveness of the next. Each of these emergent properties corresponds to one of the hypotheses formulated in the Introduction and derived analytically in the Methods.
The results are presented sequentially according to the system’s internal logic:
(1) Energetic variability and adaptive efficiency (H1), describing how alternating metabolic contexts enhance long-term adaptation;
(2) Threshold regulation of signaling dominance (H2), defining the energetic and molecular boundaries that separate catabolic from anabolic states;
(3) Oscillatory coupling and periodized adaptation (H3), explaining the rhythm of signaling alternation across microcycles; and
(4) Closed-loop regulation and feedback optimization (H4), illustrating how adaptive outcomes reshape future system sensitivity.
Each subsection integrates model-derived reasoning with empirical correspondence, linking mechanistic prediction to observed training phenomena. Collectively, these results transform the TFC model from a theoretical construct into a generative framework capable of explaining and predicting adaptation dynamics across diverse training and nutritional conditions.
The core mechanistic architecture of the Training–Fuel Coupling framework is summarized in Figure 4, mapping energetic context to signaling polarity (AMPK-mTORC1) and adaptive outputs.
This schematic consolidates the internal logic of the TFC model by mapping energetic context to regulatory polarity and phenotype formation. The two operational states—low-fuel and high-fuel—are defined by substrate availability and energy/redox charge, while the controllers hub formalizes the gating through AMPK–mTORC1–SIRT1/PGC-1α interactions. In this representation, training load and nutrient timing are not independent modifiers but levers that reposition the system across energetic thresholds, thereby determining whether remodeling is directed toward mitochondrial efficiency or myofibrillar accretion.
3.1. Energetic Variability and Adaptive Efficiency (H1)
Within the Training–Fuel Coupling (TFC) framework, adaptive efficiency emerges from the controlled alternation between energetic deficit and nutrient abundance. This behavior represents the system’s capacity to oscillate between AMPK-driven catabolism and mTOR-driven anabolism, a dynamic that enables simultaneous improvements in oxidative and structural performance traits. Rather than maximizing energy availability or minimizing stress, the model predicts that adaptation depends on variability—the capacity to move between metabolic extremes with appropriate timing and recovery.
Mechanistically, AMPK activation during energy stress initiates mitochondrial biogenesis and enhances substrate oxidation efficiency. This response elevates endurance capacity but temporarily suppresses anabolic processes. Subsequent nutrient availability reverses the regulatory dominance: increased amino acid and insulin signaling activate mTORC1, promoting translational efficiency and tissue repair. When these contrasting states alternate rhythmically, the system preserves responsiveness across both metabolic axes. The oscillation functions as an adaptive amplifier, converting transient energetic fluctuations into cumulative performance gains.
In the model, this alternation produces an energy-to-adaptation resonance: successive low- and high-energy states stimulate distinct but complementary pathways, leading to progressive improvement without chronic overload. By analogy to control theory, energetic variability increases the system’s adaptive gain—its ability to respond proportionally to new stimuli rather than stabilizing prematurely. This explains why monotonous training–feeding patterns often yield plateaus: constant energy context drives desensitization of AMPK and mTOR signaling, reducing molecular plasticity.
Empirical data align closely with this prediction. Endurance studies show that alternating low- and high-glycogen sessions enhances markers of mitochondrial adaptation (PGC-1α, citrate synthase activity) compared with uniform carbohydrate intake. In resistance and mixed modalities, alternating fasted and fed sessions increases both oxidative efficiency and lean mass, demonstrating that metabolic diversity reinforces adaptive potential. The model interprets these findings not as conflicting results but as evidence of the same principle—adaptation is optimized when energy availability fluctuates within physiologically manageable bounds.
Practically, energetic variability provides the mechanistic rationale for strategies such as “train-low, recover-high,” “sleep-low,” or mixed substrate periodization. These approaches exploit the oscillatory logic of the TFC model, deliberately modulating energetic context to maintain high signaling sensitivity. The model predicts an optimal frequency of alternation—frequent enough to prevent pathway saturation, but separated by sufficient recovery to avoid cumulative stress. Excessive variability disrupts regulatory synchronization, while insufficient variability induces stagnation.
In summary, Hypothesis 1 identifies energetic variability as a core determinant of adaptive efficiency. Through controlled alternation between AMPK and mTOR dominance, the TFC model transforms metabolic stress into a constructive signal, integrating endurance and hypertrophic processes within a single regulatory cycle. This principle establishes the foundation for subsequent system behaviors, in which threshold dynamics, oscillatory coupling, and feedback regulation refine and extend this adaptive logic.
Validation Logic
Prediction - At an equivalent external workload (ΔTSS ≈ 0), metabolic signaling will diverge according to glycogen availability. When glycogen <350 mmol·kg⁻¹ dw, the model predicts ↑p-AMPK^Thr172, ↑p-ACC^Ser79, and ↑PGC-1α mRNA, reflecting oxidative remodeling. When >500 mmol·kg⁻¹ dw, the anabolic profile dominates (↑p-p70S6K^Thr389, ↑p-4E-BP1^Thr37/46, ↑protein synthesis).
Mechanistic rationale - Substrate abundance gates molecular control: reduced glycogen raises AMP/ATP and NAD⁺/NADH, activating AMPK and SIRT1-PGC-1α; sufficient substrate reinstates Rheb–mTORC1 signaling and translational drive. Thus, variability in substrate status explains inter-individual differences in adaptation under identical external training loads.
Experimental test - Randomized crossover HIIT (8 × 3 min @ 90 % VO₂max) under low- vs. high-glycogen conditions; biopsies at 0/1/3 h. Primary outcomes: p-AMPK^Thr172, p-p70S6K^Thr389, p-ACC^Ser79 (phospho/total). A Condition × Time interaction (↑AMPK, ↓mTORC1 under low glycogen) with p < 0.05 would confirm energetic variability; absence of divergence (Δ < 0.2 SD) would falsify it.
To operationalize this concept, Table 2 presents the validation landscape for H1, summarizing how energetic context, nutrient availability, and redox state define the molecular variability underlying differential adaptive responses within the TFC framework.
This hypothesis establishes the contextual foundation of the TFC model, linking substrate-dependent signaling to differential adaptive outcomes under identical external workloads. By framing glycogen status, redox balance, and nutrient co-availability as dynamic regulators of molecular bias, it defines the first empirical layer of energetic control. The corresponding Validation Landscape integrates these dimensions into a unified experimental view, detailing how metabolic context, signaling reciprocity, and redox variability can be quantified and systematically tested.
3.2. Threshold Regulation of Signaling Dominance (H2)
The Training–Fuel Coupling (TFC) model predicts that adaptation transitions are governed not by gradual changes but by threshold-dependent switches in signaling dominance. Within the regulatory architecture, AMPK and mTORC1 operate as opposing control nodes separated by an energetic boundary that determines which pathway prevails at a given moment. This threshold reflects the point at which cellular energy charge, expressed through AMP/ATP and NAD⁺/NADH ratios, reaches a level sufficient to flip the system from a catabolic to an anabolic state. The model therefore treats adaptation as a sequence of controlled state transitions rather than a continuous scaling process.
Mechanistically, the threshold emerges from reciprocal inhibition between AMPK and mTORC1. When ATP depletion and increased AMP concentration activate AMPK, phosphorylation of TSC2 and Raptor suppresses mTORC1 signaling, stabilizing the system in a low-energy, oxidative mode. As substrate availability restores energy charge, this inhibition is relieved: rising insulin and amino acid levels activate Akt and Rag GTPases, re-engaging mTORC1 and shifting the system toward anabolic reconstruction. The moment of transition—the energetic threshold—defines a nonlinear inflection where small perturbations in fuel availability produce large shifts in regulatory dominance.
This behavior explains why individual responses to training and nutrition often diverge despite similar external loads. Athletes operating near this boundary may exhibit high variability in adaptation, as slight differences in glycogen stores or feeding timing determine which side of the threshold the system occupies. The model thus reinterprets the so-called “interference effect” of concurrent training: it is not a conflict between endurance and strength stimuli, but a misalignment in energetic state relative to the signaling threshold. When training and nutrition are synchronized to cross this threshold strategically, catabolic and anabolic signals become sequential rather than competitive.
Empirical findings support this interpretation. Studies show that post-exercise protein ingestion during low-glycogen recovery attenuates mTORC1 activation, while the same intake under glycogen-restored conditions amplifies it. Similarly, resistance sessions performed under mild energy deficit enhance oxidative enzyme activity but blunt hypertrophic signaling, reflecting a shift below the energetic threshold. These outcomes align with the TFC model’s prediction that adaptation follows a bistable logic: once a critical metabolic boundary is crossed, the system switches decisively between regulatory modes.
From a practical standpoint, threshold regulation implies that small adjustments in carbohydrate or protein timing can yield disproportionate effects on adaptation quality. It highlights the need for precision in periodized nutrition—manipulating energy state not only by magnitude but by timing relative to the signaling threshold. This view reframes metabolic control as a problem of regulatory positioning, in which the athlete’s metabolic state must oscillate across the boundary to sustain adaptive responsiveness.
In summary, Hypothesis 2 identifies the existence of an energetic threshold that governs the transition between catabolic and anabolic dominance. This threshold-driven behavior introduces nonlinearity into the adaptation process and provides a mechanistic explanation for interindividual variability in training outcomes. Within the TFC framework, it represents the system’s internal switch—an energy-dependent logic gate that coordinates the alternation of regulatory control across successive training–nutrition cycles.
Validation Logic
Prediction - Crossing the energetic threshold (~300 mmol·kg⁻¹ dw; AMP/ATP > 0.03, NAD⁺/NADH > 2.5) will flip signaling polarity: ↑p-AMPK^Thr172 and ↑p-ACC^Ser79 coincide with ↓p-mTOR^Ser2448 and ↓p-p70S6K^Thr389. The system transitions from anabolic to catabolic dominance once the energy charge drops below this limit.
Mechanistic rationale - Low glycogen elevates AMP and activates the AMPK–TSC2–Raptor axis, which suppresses mTORC1 until substrate replenishment restores anabolic drive. This reversible bistability explains sharp shifts in adaptation with small nutritional changes—a molecular switch linking energy state to signaling dominance.
Experimental test - Crossover strength protocol (5 × 5 @ 85 % 1 RM) under LOW (~300 mmol·kg⁻¹ dw) and HIGH (>500 mmol·kg⁻¹ dw) glycogen. Biopsies 0/1/3 h; outcomes p-AMPK^Thr172, p-p70S6K^Thr389, p-ACC^Ser79. A clear LOW : HIGH inversion (AMPK↑ / mTORC1↓) validates the threshold; trivial Δ < 0.2 SD refutes.
The dynamic interplay between cellular energy charge, redox coupling, and glycogen thresholds is organized in Table 3, which delineates the experimental logic and key methodological routes for testing the threshold-based switching behavior proposed in H2.
This hypothesis formalizes the concept of an energetic boundary that determines the polarity of molecular signaling. It describes how small shifts in energy charge and redox potential can flip the regulatory dominance between AMPK and mTORC1, acting as a bistable metabolic switch. The associated Validation Landscape articulates this mechanism across structural levels—from substrate thresholds and energetic stress indices to experimentally observable phosphorylation ratios—mapping the path from theoretical gating to falsifiable evidence.
3.3. Oscillatory Coupling and Periodized Adaptation (H3)
The Training–Fuel Coupling (TFC) framework interprets adaptation as a rhythmic process in which catabolic and anabolic states alternate in predictable cycles. This oscillatory coupling between AMPK and mTORC1 signaling represents the physiological foundation of periodized training, translating molecular timing into functional performance gains. Rather than treating recovery as a passive return to baseline, the model positions it as the complementary half of the adaptive rhythm—a phase that completes, not interrupts, the training signal.
In the integrated control system, AMPK and mTORC1 form a negative feedback pair. Activation of one pathway inherently suppresses the other, creating a self-sustaining oscillation around an energetic equilibrium point. During the stress phase, energy depletion triggers AMPK, enhancing mitochondrial efficiency and substrate oxidation. As recovery and feeding restore energy availability, mTORC1 activation dominates, stimulating protein synthesis and tissue repair. Once energetic abundance stabilizes, anabolic signaling declines, gradually re-sensitizing AMPK and setting the stage for the next stress phase. Each oscillation thus refines system responsiveness—AMPK improves efficiency under load, while mTORC1 strengthens capacity during recovery. This alternating dominance creates a rhythmic sequence that can be visualized across a typical training week, in Figure 5.
Low-fuel endurance sessions align with AMPK/SIRT1 peaks, whereas brief high-fuel windows precede fed resistance sessions, coinciding with mTORC1 dominance. This arrangement maintains metabolic sensitivity by alternating oxidative and anabolic contexts across the microcycle.
This cyclical alternation produces emergent stability through rhythmic imbalance. The system does not seek a static homeostasis but rather an adaptive rhythm, oscillating between states of stress and replenishment. Such behavior mirrors other biological control systems—from circadian regulation to endocrine feedback—where efficiency and resilience arise from controlled fluctuation, not constancy. In the TFC model, the amplitude of oscillation represents the degree of metabolic challenge, while its frequency reflects training density and nutritional timing. Optimal adaptation occurs when oscillations are neither too shallow nor too steep, maintaining synchronization between metabolic stress and recovery.
Empirical observations across endurance, resistance, and mixed training support this logic. Studies of carbohydrate periodization show that alternating glycogen-depleted and glycogen-restored sessions enhances both oxidative enzymes and performance capacity. In resistance training, alternating fasted and fed sessions yields superior adaptation compared to uniform feeding protocols. These findings correspond to the model’s prediction that oscillatory coupling—rather than constant energy state—maximizes signaling sensitivity and adaptive output. The alternation of AMPK and mTORC1 dominance thus functions as a biological metronome, coordinating energy flux with molecular remodeling.
At the practical level, oscillatory coupling provides the mechanistic rationale for structured periodization. Training cycles that deliberately modulate substrate availability (for example, high-intensity sessions under low glycogen followed by nutrient-rich recovery) replicate the natural oscillatory pattern of metabolic signaling. The TFC framework interprets successful periodization not as an art of scheduling but as the engineering of metabolic resonance—the tuning of energetic rhythm to the adaptive capacity of the organism. Disruption of this rhythm, through monotonous training or chronic nutritional excess, dampens oscillatory amplitude and leads to stagnation or maladaptation.
In summary, Hypothesis 3 defines adaptation as a product of rhythmic coupling between opposing regulatory pathways. The oscillatory behavior of the AMPK–mTORC1 system transforms metabolic stress into a structured pattern of activation and recovery, aligning molecular timing with functional periodization. Within the TFC model, this rhythmic alternation is the core dynamic that maintains adaptive momentum across cycles, ensuring that each phase of stress and recovery potentiates the next.
Validation Logic
Prediction - Alternating low-glycogen endurance (AMPK phase) and fed strength (mTORC1 phase) sessions over ~48 h cycles will enhance both oxidative and contractile adaptation. Expected outcomes: ↑CS (+15 %), ↑COX (+12 %), ↑CSA (+5–8 %), and ↑1 RM (+3–5 %) relative to isocaloric constant-fuel training.
Mechanistic rationale - Intentional metabolic oscillation maintains regulatory sensitivity: AMPK activation primes mitochondrial signaling, while subsequent nutrient-fed mTORC1 engagement rebuilds protein mass. The alternation prevents desensitization, synchronizing catabolic and anabolic phases for maximal adaptive yield.
Experimental test - 8-week intervention comparing oscillatory TFC microcycles (train-low → lift-fed) with constant fueling. Assess CS, COX, β-HAD activities; muscle CSA (ultrasound); 1 RM; and 40-min TT. A composite adaptive index ΣZ > +0.5 SD vs. control validates oscillatory coupling; loss of dual gains falsifies it.
Table 4 encapsulates the experimental configuration for H3, outlining the parameters of oscillatory coupling, nutritional synchronization, and adaptive coherence that can empirically validate the periodic logic of Training–Fuel Coupling.
This hypothesis extends the TFC framework into the temporal domain, proposing that deliberate oscillation between catabolic and anabolic phases stabilizes adaptive output over time. It unites molecular rhythm, nutritional synchronization, and mesocycle design into a single systems perspective of training adaptation. The Validation Landscape translates these ideas into testable constructs, outlining parameters of oscillatory coherence, adaptive amplitude, and synchronization fidelity that can empirically demonstrate how metabolic rhythm enhances performance plasticity.
3.4. Closed-Loop Regulation and Feedback Optimization (H4)
The Training–Fuel Coupling (TFC) model ultimately converges toward a closed-loop form of regulation, in which each adaptive outcome modifies the system’s future responsiveness. This behavior represents the self-organizing capacity of the human metabolic network—a process through which adaptation refines its own conditions. Unlike open systems, where each stimulus is treated as independent, the TFC framework assumes recursive adaptation: every training–nutrition cycle alters the internal parameters governing subsequent regulation.
Mechanistically, closed-loop regulation emerges from reciprocal feedback between structural and energetic adaptation. Mitochondrial expansion resulting from AMPK activation reduces future energy stress for a given workload, lowering the threshold for mTORC1 engagement during recovery. Conversely, hypertrophic remodeling driven by mTORC1 increases metabolic demand, re-sensitizing AMPK activation in later sessions. This bidirectional adjustment forms a metabolic feedback circuit that progressively narrows the gap between energy supply and energy cost, thereby improving system stability. Over repeated cycles, the feedback loop tunes itself—reducing oscillatory error while preserving rhythmic adaptability.
This property of feedback optimization explains why adaptation follows diminishing returns: as efficiency improves, the relative perturbation produced by a given training stimulus decreases. In the model, the system approaches a quasi-stable attractor—an adaptive equilibrium defined not by stasis, but by minimal error between energy input, recovery capacity, and performance output. Such behavior parallels control processes in engineered systems, where adaptive algorithms iteratively refine performance through feedback minimization. Biologically, this closed-loop tuning manifests as improved metabolic economy, enhanced recovery kinetics, and reduced fatigue for equivalent workloads.
Empirical evidence supports the existence of this self-tuning mechanism. Longitudinal studies reveal that trained individuals exhibit blunted AMPK activation and faster mTORC1 rebound compared to novices, reflecting a recalibrated energetic sensitivity. Similarly, repeated exposure to periodized training cycles reduces the amplitude but increases the efficiency of metabolic oscillations—a hallmark of optimized feedback regulation. These findings reinforce the TFC model’s interpretation of adaptation as a feedback process rather than a linear accumulation of effects.
From an applied perspective, recognizing adaptation as a closed-loop system redefines training progression. It shifts focus from imposing greater stress to refining system responsiveness—using recovery, nutrient timing, and load variation to maintain optimal feedback gain. Effective periodization therefore becomes a matter of managing sensitivity, not intensity. In this view, training ceases to be an external input and becomes an ongoing dialogue between system capacity and energetic context.
In summary, Hypothesis 4 establishes that adaptation within the TFC framework is governed by closed-loop feedback optimization. Each phase of training and recovery modifies the parameters controlling subsequent adaptation, creating a self-tuning cycle that stabilizes efficiency while preserving responsiveness. This behavior completes the regulatory circuit of the model, demonstrating how metabolic systems transform fluctuating energy states into sustained performance through recursive adjustment and feedback integration.
Validation Logic
Prediction - If feedback markers (RPE×[La], ΔHRV, CGM Δglucose ± 1.5 mmol·L⁻¹·h⁻¹) reflect energetic state, integrating them into a closed-loop fueling algorithm should stabilize training quality (↓CV session quality) and accelerate recovery (↓ΔCK 48 h).
Mechanistic rationale - Physiological feedback creates a self-tuning loop: metabolic stress sensed via HRV and CGM modifies substrate intake, shifting the system toward its optimal energy zone. Over repeated cycles, this feedback reduces signal amplitude but improves efficiency—a hallmark of adaptive homeostasis.
Experimental test - 6-week comparative trial: closed-loop (adaptive fueling guided by CGM + HRV + RPE) vs. fixed schedule. Metrics: Δ1 RM, ΔTT, variability of session quality, recovery kinetics. Improvements of +3–5 % strength, +2–3 % endurance, and lower CV (p < 0.05) confirm the feedback hypothesis; null AUC ≈ 0.5 falsifies it.
To translate the feedback logic of H4 into measurable constructs, Table 5 provides the validation landscape summarizing the physiological inputs, control algorithms, and computational indices through which adaptive self-regulation can be verified.
This hypothesis operationalizes the TFC model within a feedback paradigm, where internal physiological signals actively shape substrate intake and training behavior. It defines adaptation as an emergent property of recurrent feedback—where sensing, adjustment, and efficiency evolve together toward homeostatic optimization. The following Validation Landscape presents the systems-level blueprint for testing this principle, integrating physiological telemetry, computational modeling, and real-time control into a measurable framework of adaptive self-regulation.
3.5. Validation Model Summary
The four TFC hypotheses collectively define a mechanistic framework that can be validated through tiered experimentation.
At the molecular level, validation involves quantifying reciprocal phosphorylation patterns (↑p-AMPK^Thr172, ↑p-ACC^Ser79, ↓p-p70S6K^Thr389) across energetic contexts defined by muscle glycogen (≈300–600 mmol·kg⁻¹ dw), AMP/ATP ratio, and NAD⁺/NADH redox balance.
At the functional level, validation requires integrated assessment of mitochondrial and contractile adaptations—ΔCS, ΔCOX, ΔCSA, Δ1RM, and time-trial performance—to confirm oscillatory synergy predicted by H3.
At the systems level, feedback-based monitoring (RPE×[La], ΔHRV, Δglucose) provides real-time markers for the closed-loop adaptation process described in H4.
Together, these validation pathways form a coherent experimental model:
- Contextual gating (H1–H2) → mechanistic confirmation via phosphorylation assays and metabolic profiling.
- Oscillatory adaptation (H3) → mesocycle interventions demonstrating dual-pathway enhancement.
- Feedback optimization (H4) → longitudinal monitoring of adaptive efficiency and stability.
This tiered validation model bridges theoretical deduction and empirical testing, allowing the Training–Fuel Coupling architecture to evolve from a conceptual construct into a falsifiable, experimentally grounded physiological framework.
The cumulative logic of the four hypotheses converges into a coherent validation architecture that spans molecular, functional, and systemic levels of regulation. To illustrate this integrative structure, Table 6 consolidates the essential components of the Training–Fuel Coupling framework—linking theoretical premises, mechanistic rationale, and empirical tests into a single experimental roadmap.
Collectively, these validation tiers establish a coherent experimental architecture for the Training–Fuel Coupling framework, integrating molecular signaling, functional adaptation, and systems regulation within a unified physiological logic. The framework consolidates the four emergent behaviors—energetic variability, threshold switching, oscillatory coupling, and feedback optimization—into a reproducible model that links mechanistic precision with applied relevance.
The corresponding Decision Matrix (Table 7) operationalizes this logic by aligning training objectives, energetic contexts, and adaptive outcomes. It provides a structured synthesis of evidence-based configurations through which the TFC model can guide the design of microcycles, nutritional timing, and monitoring strategies in both research and practice.
The decision matrix consolidates the conceptual foundations of Training–Fuel Coupling into an operational synthesis. Each combination of training goal, substrate state, and feeding context represents a controllable expression of the model’s internal logic, translating energetic variability, threshold dynamics, and feedback regulation into practice.
By positioning metabolic state as an adjustable input rather than an uncontrolled background variable, the matrix transforms periodization into a form of energetic governance. It illustrates that performance optimization arises not from maximizing either stress or recovery in isolation, but from the rhythmic alternation of catabolic and anabolic conditions within physiological safety boundaries.
Within this applied interpretation, the TFC framework extends beyond theoretical integration and becomes a decision architecture—a structured means of designing adaptive microcycles based on measurable energetic cues. Such systematization enables hypothesis-driven experimentation, objective calibration of training–nutrition interactions, and personalized control of metabolic oscillation toward efficient long-term adaptation.
3.6. Testable Predictions
The Training–Fuel Coupling (TFC) model generates a series of experimentally testable hypotheses:
1) Reciprocal signaling amplitude - within alternating low-fuel and high-fuel microcycles, AMPK and mTORC1 phosphorylation amplitudes will oscillate in anti-phase (p-AMPK^Thr172↑ when glycogen is low; p-p70S6K^Thr389↑ after refueling).
2) Threshold-dependent switching - metabolic dominance will shift when glycogen content passes a critical range (~300–500 mmol·kg⁻¹ dw), reflected in inverted correlations between AMPK and mTORC1 activity.
3) SIRT1 modulation of cross-talk - NAD⁺/NADH oscillations will parallel AMPK phase activation and predict mTORC1 re-sensitization after refueling.
4) Performance-phase coupling - functional adaptations will follow the same periodicity—improved oxidative efficiency during AMPK phases, enhanced muscle hypertrophy and strength during mTORC1 phases.
5) Systems coherence - derived composite indices (Energetic Variability Index, Adaptive Oscillation Index, Closed-Loop Performance Index) will covary with molecular and performance oscillations across repeated 7-day microcycles.
Validation of these predictions requires longitudinal, multi-omics designs combining muscle biopsy, continuous glucose monitoring, and performance testing across controlled train-low / train-high rotations.
Building on these mechanistic predictions, the translational implications of the Training–Fuel Coupling framework can be exemplified through applied microcycle configurations. Table 8 illustrates how the model’s energetic principles—variability, threshold control, oscillation, and feedback—can be structured within weekly training designs across endurance, team, and strength disciplines.
These exemplary configurations demonstrate how the theoretical architecture of the Training–Fuel Coupling framework can be operationalized into coherent training–nutrition systems. Each microcycle embodies the same regulatory principles identified by the model—controlled energetic variability, threshold management, rhythmic alternation, and feedback stabilization—translated into weekly practice. Rather than prescribing rigid protocols, the table outlines energetic logics that can be adapted to discipline-specific demands, physiological constraints, and individual monitoring data. In doing so, it bridges molecular physiology with applied periodization, illustrating that adaptive efficiency depends not on training volume or diet composition alone, but on the orchestrated timing of both within the self-regulating energetic loop described by the TFC model.
4. Discussion
The Training–Fuel Coupling (TFC) model offers a mechanistic synthesis that unites molecular, nutritional, and training evidence within a single regulatory framework. Its principal contribution lies in redefining adaptation as a system behavior—an emergent property of dynamic control loops linking energy availability, signaling balance, and functional remodeling. Through this lens, the long-debated divide between “train-low” metabolic stress and “feed-high” recovery is resolved not as a contradiction but as a sequence of regulatory states that, when properly alternated, optimize the rhythm of adaptation [102,103,104,105].
Integration with Previous Research - Previous studies have independently described the benefits of metabolic stress and nutrient abundance, yet often treated them as competing stimuli. Endurance literature highlights the mitochondrial benefits of low-glycogen training, while resistance research emphasizes protein synthesis under nutrient-rich conditions. The TFC framework reconciles these findings by demonstrating that both processes are phases of the same adaptive oscillation. Similar oscillatory behavior has been documented in cellular systems such as AMPK–mTOR feedback, circadian energy sensing, and hormonal regulation, suggesting that rhythm-based adaptation is a conserved biological strategy [106,107,108].
The concept also aligns with emerging perspectives in molecular exercise physiology that view training adaptation as a nonlinear process governed by thresholds, sensitivity, and feedback. Studies using transcriptomic and proteomic profiling confirm that repeated energy fluctuations elicit cyclical activation of metabolic and anabolic gene networks, mirroring the alternating dominance predicted by the model. Moreover, the self-tuning feedback mechanism proposed in the TFC framework parallels observations from long-term training studies, where improved fitness is accompanied by reduced signaling amplitude but enhanced response precision—a hallmark of closed-loop regulation [109,110,111,112].
Interpretation of Findings Relative to Hypotheses - the four hypotheses derived from the analytical phase describe complementary aspects of this self-organizing system. Hypothesis 1—energetic variability enhances adaptive efficiency—is supported by consistent evidence showing superior outcomes from alternating metabolic conditions. Hypothesis 2—threshold regulation—finds analogs in bistable molecular systems, where minor changes in substrate level induce large signaling shifts, explaining individual variability in training responses. Hypothesis 3—oscillatory coupling—connects directly to the principles of periodized training, establishing a molecular basis for timing-dependent adaptation. Finally, Hypothesis 4—closed-loop optimization—extends these ideas into a long-term perspective, showing how adaptation progressively recalibrates its own sensitivity to energetic stimuli. Together, these behaviors form a continuum from acute metabolic signaling to chronic system stabilization.
Broader Implications - by articulating adaptation as a self-regulating control process, the TFC model bridges reductionist and applied perspectives in sport science. It provides a theoretical foundation for nutritional periodization strategies and hybrid training designs, offering predictive guidance on when to emphasize metabolic stress versus recovery nutrition. Beyond athletic performance, the same logic may apply to clinical contexts where energy regulation and tissue remodeling are critical, including metabolic syndrome, sarcopenia, or rehabilitation following immobilization. In such settings, managing the timing of energetic inputs could restore adaptive plasticity without excessive physiological strain [113,114,115].
Boundaries and Safety Considerations - The practical implementation of the Training–Fuel Coupling (TFC) framework requires oscillation within physiological limits of energy availability and recovery. In this framework, energy availability refers to the instantaneous metabolic state, whereas energetic variability describes the regulated alternation of energy availability across training cycles. The distinction between functional energetic variability and chronic energy deficiency is essential to prevent maladaptation.
Controlled “train-low” strategies are effective only when glycogen availability fluctuates within a safe range (~300–500 mmol·kg⁻¹ dw) and protein intake remains sufficient to support post-exercise mTORC1 reactivation. Sustained depletion beyond these limits may suppress anabolic signaling, compromise endocrine and immune balance, and increase the risk of relative energy deficiency in sport (RED-S) [116,117].
Oscillatory amplitude should therefore be modulated by context, as sex, training phase, and nutritional history influence the safe energetic bandwidth. Female and adolescent athletes, as well as periods of elevated training load, require narrower fluctuations and closer monitoring. Continuous feedback through HRV, CGM, and subjective wellness indices may help identify early deviations from adaptive zones [118,119,120].
In this view, the TFC concept emphasizes metabolic variability as a regulated adaptive process, not as voluntary deprivation. Taken together, these considerations clarify that Training–Fuel Coupling is not intended as a prescriptive nutritional protocol, but as a conceptual framework for understanding how energy availability and nutrient timing shape adaptive signaling. The model does not advocate chronic energy restriction or fixed feeding strategies; rather, it provides a systems-level rationale for aligning metabolic stress and recovery nutrition within safe physiological boundaries. From this perspective, maladaptive outcomes such as Relative Energy Deficiency in Sport (RED-S) can be interpreted as a failure of regulatory oscillation and recovery integration, rather than an inherent consequence of metabolic stress itself.
Limitations and Scope - the Training–Fuel Coupling (TFC) framework is a conceptual synthesis rather than an empirical dataset. Its logic is derived from established signaling interactions, physiological observations, and theoretical integration. Therefore, the numerical thresholds indicated for glycogen or redox status represent context-dependent estimates, not universal constants. The oscillatory patterns proposed are model-derived abstractions that require experimental quantification under varied training and nutritional settings. Moreover, the framework focuses on skeletal muscle and energy metabolism, while other regulatory levels—endocrine, immune, and behavioral—remain simplified. Future studies should test the model’s predictions across different populations, sport modalities, and time scales to refine its generalizability.
Future Directions - should formalize the TFC framework into quantitative models that simulate adaptive dynamics under varying training and nutritional schedules. Integrating wearable sensor data, metabolomics, and machine learning could allow the real-time estimation of energetic state and regulatory phase, enabling individualized periodization. Experimental validation of oscillatory coupling—via molecular markers of AMPK/mTOR activity across repeated cycles—would test the predictive accuracy of the framework. Further, longitudinal studies exploring how closed-loop adaptation shapes long-term efficiency may reveal how metabolic systems approach steady-state performance without plateauing.
Conceptual Significance - in conceptual terms, the TFC model reframes human adaptation as an intelligent process of energetic governance—a dynamic interplay between stress and recovery, scarcity and abundance, catabolism and anabolism. It captures the essence of biological resilience: not merely resistance to change, but the capacity to transform fluctuation into structure. By coupling mechanistic precision with ecological relevance, the framework offers a unified language for interpreting training, metabolism, and nutrition as elements of a single adaptive continuum. In doing so, it positions metabolic oscillation as both a mechanism and a metaphor for sustainable performance and systemic balance.
5. Conclusions
The Training–Fuel Coupling (TFC) model provides a systems-level explanation of how exercise and nutrition interact to regulate adaptation. By framing training and feeding as coordinated control inputs within a dynamic regulatory network, the model unifies previously isolated findings across molecular, metabolic, and functional domains. The resulting framework describes adaptation not as the accumulation of stimuli but as the rhythmic alternation of energetic states that drive efficiency through controlled instability.
Across its four emergent behaviors—variability, threshold, oscillation, and feedback—the TFC model captures the logic of human adaptability: responsiveness sustained through contrast, precision achieved through fluctuation, and stability maintained through feedback. It reconciles the apparent contradictions of endurance and strength paradigms, showing that performance optimization depends less on stimulus magnitude than on temporal coordination between metabolic stress and recovery nutrition.
By integrating molecular sports nutrition with energy availability and chrono-nutrition principles, the Training–Fuel Coupling framework positions performance optimization as a self-tuning process linking cellular signaling to whole-body adaptation.
Author Contributions
Conceptualization, M.S. and D.C.M.; Methodology, M.S. and D.C.M.; Formal analysis, M.S. and D.C.M.; Investigation, M.S. and D.C.M.; Resources, M.S. and D.C.M.; Data curation, M.S. and D.C.M.; Writing—original draft preparation, M.S. and D.C.M.; Writing—review and editing, M.S. and D.C.M.; Visualization, M.S. and D.C.M.; Supervision, M.S. and D.C.M.; Project administration, M.S. and D.C.M.; Funding acquisition, M.S. and D.C.M. All authors have equal contribution. All authors have read and agreed to the published version of the manuscript.
Funding
This research received no external funding.
Data Availability Statement
No new datasets were generated or analyzed in this narrative review. All information is derived from published sources cited in the References. Data sharing is not applicable.
References
- Coffey, V.G.; Hawley, J.A. The molecular bases of training adaptation. Sports Med. 2007, 37, 737–763. [Google Scholar] [CrossRef]
- Hawley, J.A.; Burke, L.M.; Phillips, S.M.; Spriet, L.L. Nutritional modulation of training-induced skeletal muscle adaptations. J. Appl. Physiol. 2011, 110, 834–845. [Google Scholar] [CrossRef]
- Egan, B.; Zierath, J.R. Exercise metabolism and the molecular regulation of skeletal muscle adaptation. Cell Metab. 2013, 17, 162–184. [Google Scholar] [CrossRef]
- Hawley, J.A.; Hargreaves, M.; Joyner, M.J.; Zierath, J.R. Integrative biology of exercise. Cell;PubMed 2014, 159, 738–749. [Google Scholar] [CrossRef] [PubMed]
- Atherton, P.J.; Smith, K. Muscle protein synthesis in response to nutrition and exercise. J. Physiol. 2012, 590, 1049–1057. [Google Scholar] [CrossRef]
- Hardie, D.G.; Ross, F.A.; Hawley, S.A. AMPK: a nutrient and energy sensor that maintains energy homeostasis. Nat. Rev. Mol. Cell Biol. 2012, 13, 251–262. [Google Scholar] [CrossRef] [PubMed]
- Gwinn, D.M.; Shackelford, D.B.; Egan, D.F.; Mihaylova, M.M.; Mery, A.; Vasquez, D.S.; Turk, B.E.; Shaw, R.J. AMPK phosphorylation of raptor mediates a metabolic checkpoint. Mol. Cell 2008, 30, 214–226. [Google Scholar] [CrossRef] [PubMed]
- Fujii, T.; Kobayashi, K.; Kaneko, M.; Osana, S.; Tsai, C.-T.; Ito, S.; Hata, K. RGM Family Involved in the Regulation of Hepcidin Expression in Anemia of Chronic Disease. Immuno 2024, 4, 266–285. [Google Scholar] [CrossRef]
- Inoki, K.; Zhu, T.; Guan, K.-L. TSC2 mediates cellular energy response to control cell growth and survival. Cell 2003, 115, 577–590. [Google Scholar] [CrossRef]
- Jäger, S.; Handschin, C.; St-Pierre, J.; Spiegelman, B.M. AMP-activated protein kinase (AMPK) action in skeletal muscle via direct phosphorylation of PGC-1α. Proc. Natl. Acad. Sci. USA 2007, 104, 12017–12022. [Google Scholar] [CrossRef]
- Hargreaves, M.; Spriet, L.L. Exercise Metabolism: Fuels for the Fire. Cold Spring Harb. Perspect. Med. 2018, 8, a029744. [Google Scholar] [CrossRef]
- Kelley, D.E.; Mandarino, L.J. Fuel selection in human skeletal muscle in insulin resistance: a reexamination. Diabetes 2000, 49, 677–683. [Google Scholar] [CrossRef]
- Mănescu, A.M.; Hangu, S.Ș.; Mănescu, D.C. Nutritional Supplements for Muscle Hypertrophy: Mechanisms and Morphology—Focused Evidence. Nutrients 2025, 17, 3603. [Google Scholar] [CrossRef]
- Galgani, J.E.; Moro, C.; Ravussin, E. Metabolic flexibility and insulin resistance. Am. J. Physiol. Endocrinol. Metab. 2008, 295, E1009–E1017. [Google Scholar] [CrossRef] [PubMed]
- Goodpaster, B.H.; Sparks, L.M. Metabolic Flexibility in Health and Disease. Cell Metab. 2017, 25, 1027–1036. [Google Scholar] [CrossRef]
- McBride, A.; Ghilagaber, S.; Nikolaev, A.; Hardie, D.G. The glycogen-binding domain on the AMPK beta subunit allows the kinase to act as a glycogen sensor. Cell Metab. 2009, 9, 23–34. [Google Scholar] [CrossRef]
- Hansen, A.K.; Fischer, C.P.; Plomgaard, P.; Andersen, J.L.; Saltin, B.; Pedersen, B.K. Skeletal muscle adaptation: training twice every second day vs. training once daily. J. Appl. Physiol. 2005, 98, 93–99. [Google Scholar] [CrossRef] [PubMed]
- Yeo, W.K.; Paton, C.D.; Garnham, A.P.; Burke, L.M.; Carey, A.L.; Hawley, J.A. Skeletal muscle adaptation and performance responses to once a day versus twice every second day endurance training regimens. J. Appl. Physiol. 2008, 105, 1462–1470. [Google Scholar] [CrossRef] [PubMed]
- Psilander, N.; Frank, P.; Flockhart, M.; Sahlin, K. Exercise with low glycogen increases PGC-1α gene expression in human skeletal muscle. Eur. J. Appl. Physiol. 2013, 113, 951–963. [Google Scholar] [CrossRef]
- Knuiman, P.; Hopman, M.T.E.; Mensink, M. Glycogen availability and skeletal muscle adaptations with endurance and resistance exercise. Nutr. Metab. (Lond). 2015, 12, 59. [Google Scholar] [CrossRef]
- Smiles, W.J.; Ovens, A.J.; Kemp, B.E.; Galic, S.; Petersen, J.; Oakhill, J.S. New developments in AMPK and mTORC1 cross-talk. Essays Biochem. 2024, 68, 321–336. [Google Scholar] [CrossRef]
- White, J.P. Amino Acid Trafficking and Skeletal Muscle Protein Synthesis: A Case of Supply and Demand. Front. Cell Dev. Biol. 2021, 9, 656604. [Google Scholar] [CrossRef] [PubMed]
- D’Hulst, G.; Masschelein, E.; De Bock, K. Resistance exercise enhances long-term mTORC1 sensitivity to leucine. Mol. Metab. 2022, 66, 101615. [Google Scholar] [CrossRef]
- Ely, I.A.; Phillips, B.E.; Smith, K.; Wilkinson, D.J.; Piasecki, M.; Breen, L.; Larsen, M.S.; Atherton, P.J. A focus on leucine in the nutritional regulation of human skeletal muscle metabolism in ageing, exercise and unloading states. Clin. Nutr. 2023, 42, 1849–1865. [Google Scholar] [CrossRef]
- Ferrando, A.A.; Wolfe, R.R.; Hirsch, K.R.; Church, D.D.; Kviatkovsky, S.A.; Roberts, M.D.; Stout, J.R.; Gonzalez, D.E.; Sowinski, R.J.; Kreider, R.B.; et al. International Society of Sports Nutrition Position Stand: Effects of essential amino acid supplementation on exercise and performance. J. Int. Soc. Sports Nutr. 2023, 20, 2263409. [Google Scholar] [CrossRef]
- Morton, J.P.; Hearris, M.; Fell, M.J.; Owens, D.J.; Halson, S.; Trommelen, J. UCI Sports Nutrition Project: Nutritional Periodization: Strategies to Enhance Training Adaptation and Recovery. Int. J. Sport Nutr. Exerc. Metab. 2025, 1–26. [Google Scholar] [CrossRef]
- Stellingwerff, T.; Morton, J.P.; Burke, L.M. A Framework for Periodized Nutrition for Athletics. Int. J. Sport Nutr. Exerc. Metab. 2019, 29, 141–151. [Google Scholar] [CrossRef]
- Mănescu, D.C. Alimentaţia în Fitness şi Bodybuilding; Editura ASE: Bucharest, Romania, 2010. [Google Scholar]
- Gejl, K.D.; Nybo, L. Performance effects of periodized carbohydrate restriction in endurance trained athletes—a systematic review and meta-analysis. J. Int. Soc. Sports Nutr. 2021, 18, 37. [Google Scholar] [CrossRef] [PubMed]
- Podlogar, T.; Wallis, G.A. New Horizons in Carbohydrate Research and Application for Endurance Athletes. Sports Med. 2022, 52 (Suppl 1), 5–23. [Google Scholar] [CrossRef] [PubMed]
- Schumann, M.; Feuerbacher, J.F.; Sünkeler, M.; Freitag, N.; Rønnestad, B.R.; Doma, K.; Lundberg, T.R. Compatibility of Concurrent Aerobic and Strength Training for Skeletal Muscle Size and Function: An Updated Systematic Review and Meta-Analysis. Sports Med. 2022, 52, 601–612. [Google Scholar] [CrossRef]
- Huiberts, R.O.; Wüst, R.C.I.; van der Zwaard, S. Concurrent Strength and Endurance Training: A Systematic Review and Meta-Analysis on the Impact of Sex and Training Status. Sports Med. 2024, 54, 485–503. [Google Scholar] [CrossRef]
- Jones, T.W.; Eddens, L.; Kupusarevic, J.; Simoes, D.C.M.; Furber, M.J.W.; van Someren, K.A.; Howatson, G. Aerobic exercise intensity does not affect the anabolic signaling following resistance exercise in endurance athletes. Sci. Rep. 2021, 11, 10785. [Google Scholar] [CrossRef] [PubMed]
- Lee, M.J.; Caruana, N.J.; Saner, N.J.; Kuang, J.; Stokes, T.; McLeod, J.C.; Oikawa, S.Y.; Bishop, D.J.; Bartlett, J.D.; Phillips, S.M. Resistance-only and concurrent exercise induce similar myofibrillar protein synthesis rates and associated molecular responses in moderately active men before and after training. FASEB J. 2024, 38, e23392. [Google Scholar] [CrossRef] [PubMed]
- Denadai, B.S.; Greco, C.C. Muscle fatigue and interference phenomenon during concurrent aerobic and strength training: An alternative hypothetical model. Med. Hypotheses 2025, 198, 111614. [Google Scholar] [CrossRef]
- Wolff, C.A.; Esser, K.A. Exercise Timing and Circadian Rhythms. Curr. Opin. Physiol. 2019, 10, 64–69. [Google Scholar] [CrossRef]
- Mansingh, S.; Handschin, C. Time to Train: The Involvement of the Molecular Clock in Exercise Adaptation of Skeletal Muscle. Front. Physiol. 2022, 13, 902031. [Google Scholar] [CrossRef]
- Aoyama, S.; Shibata, S. Time-of-Day-Dependent Physiological Responses to Meal and Exercise. Front. Nutr. 2020, 7, 18. [Google Scholar] [CrossRef]
- Negri, M.; Pivonello, C.; Amatrudo, F.; Cimmino, F.; Trinchese, G.; Vetrani, C.; Iaccarino, G.; Pivonello, R.; Mollica, M.P.; Colao, A. Effects of Chrono-Exercise and Chrono-Nutrition on Muscle Health: Understanding the Molecular Mechanisms Activated by Timed Exercise and Consumption of Proteins and Carbohydrates. Nutr. Rev. 2025, 83, 1571–1593. [Google Scholar] [CrossRef]
- Mishima, T.; Takenaka, Y.; Hashimoto-Hachiya, A.; Tanigawa, Y.; Suzuki, N.; Oishi, K.; Ogasawara, R. Time-of-day effect of high-intensity muscle contraction on mTOR signaling and protein synthesis in mice. Sci. Rep. 2025, 15, 23702. [Google Scholar] [CrossRef]
- Henriquez-Olguin, C.; Meneses-Valdes, R.; Jensen, T.E. Compartmentalized muscle redox signals controlling exercise metabolism—Current state, future challenges. Redox Biology 2020, 35, 101473. [Google Scholar] [CrossRef]
- Zhou, Y.; Zhang, X.; Baker, J.S.; Davison, G.W.; Yan, X. Redox signaling and skeletal muscle adaptation during aerobic exercise. iScience 2024, 27, 109643. [Google Scholar] [CrossRef] [PubMed]
- Powers, S.K.; Radak, Z.; Ji, L.L.; Jackson, M. Reactive oxygen species promote endurance exercise-induced adaptations in skeletal muscles. Journal of Sport and Health Science 2024, 13, 780–792. [Google Scholar] [CrossRef]
- Ji, L.L.; Yeo, D. Maintenance of NAD⁺ Homeostasis in Skeletal Muscle during Aging and Exercise. Cells 2022, 11, 710. [Google Scholar] [CrossRef] [PubMed]
- Lamb, D.A.; Moore, J.H.; Mesquita, P.H.C.; Smith, M.A.; Vann, C.G.; Osburn, S.C.; et al. Resistance training increases muscle NAD⁺ and NADH concentrations as well as NAMPT protein levels and global sirtuin activity in middle-aged, overweight, untrained individuals. Aging (Albany NY) 2020, 12, 9447–9460. [Google Scholar] [CrossRef]
- Wang, L.; Meng, Q.; Su, C.-H. From Food Supplements to Functional Foods: Emerging Perspectives on Post-Exercise Recovery Nutrition. Nutrients 2024, 16, 4081. [Google Scholar] [CrossRef]
- Mănescu, D.C. Nutritional tips for muscular mass hypertrophy. Marathon 2016, 8, 79–83. [Google Scholar]
- Margolis, L.M.; Allen, J.T.; Hatch-McChesney, A.; Pasiakos, S.M. Coingestion of Carbohydrate and Protein on Muscle Glycogen Synthesis after Exercise: A Meta-analysis. Medicine & Science in Sports & Exercise 2021, 53, 384–393. [Google Scholar] [CrossRef]
- Trommelen, J.; van Lieshout, G.A.A.; Nyakayiru, J.; Holwerda, A.M.; Smeets, J.S.J.; Hendriks, F.K.; et al. The anabolic response to protein ingestion during recovery from exercise has no upper limit in magnitude and duration in vivo in humans. Cell Reports Medicine 2023, 4, 101324. [Google Scholar] [CrossRef]
- Podlogar, T.; Shad, B.J.; Seabright, A.P.; Odell, O.J.; Lord, S.O.; Civil, R.; et al. Postexercise muscle glycogen synthesis with glucose, galactose, and combined galactose-glucose ingestion. American Journal of Physiology—Endocrinology and Metabolism 2023, 325, E672–E681. [Google Scholar] [CrossRef]
- Ross, R.; Goodpaster, B.H.; Koch, L.G.; Sarzynski, M.A.; Kohrt, W.M.; Johannsen, N.M.; Skinner, J.S.; Castro, A.; Irving, B.A.; Noland, R.C.; Sparks, L.M.; Spielmann, G.; Day, A.G.; Pitsch, W.; Hopkins, W.G.; Bouchard, C. Precision exercise medicine: understanding exercise response variability. Br. J. Sports Med. 2019, 53, 1141–1153. [Google Scholar] [CrossRef] [PubMed]
- Noone, J.; Mucinski, J.M.; DeLany, J.P.; Sparks, L.M.; Goodpaster, B.H. Understanding the variation in exercise responses to guide personalized physical activity prescriptions. Cell Metab. 2024, 36, 702–724. [Google Scholar] [CrossRef]
- Bonafiglia, J.T.; Preobrazenski, N.; Gurd, B.J. A Systematic Review Examining the Approaches Used to Estimate Interindividual Differences in Trainability and Classify Individual Responses to Exercise Training. Front. Physiol. 2021, 12, 665044. [Google Scholar] [CrossRef] [PubMed]
- Hrubeniuk, T.J.; Bonafiglia, J.T.; Bouchard, D.R.; Gurd, B.J.; Sénéchal, M. Directions for Exercise Treatment Response Heterogeneity and Individual Response Research. Int. J. Sports Med. 2022, 43, 11–22. [Google Scholar] [CrossRef]
- Chrzanowski-Smith, O.J.; Piatrikova, E.; Betts, J.A.; Williams, S.; Gonzalez, J.T. Variability in exercise physiology: Can capturing intra-individual variation help better understand true inter-individual responses? Eur. J. Sport Sci. 2020, 20, 452–460. [Google Scholar] [CrossRef]
- Muñoz Fabra, E.; Díez, J.-L.; Bondia, J.; Laguna Sanz, A.J. A Comprehensive Review of Continuous Glucose Monitoring Accuracy during Exercise Periods. Sensors 2021, 21, 479. [Google Scholar] [CrossRef]
- Düking, P.; Zinner, C.; Trabelsi, K.; Reed, J.L.; Holmberg, H.-C.; Kunz, P.; Sperlich, B. Monitoring and adapting endurance training on the basis of heart rate variability monitored by wearable technologies: A systematic review with meta-analysis. J. Sci. Med. Sport 2021, 24, 1180–1192. [Google Scholar] [CrossRef]
- Mănescu, D.C.; Mănescu, A.M. Artificial Intelligence in the Selection of Top-Performing Athletes for Team Sports: A Proof-of-Concept Predictive Modeling Study. Appl. Sci. 2025, 15, 9918. [Google Scholar] [CrossRef]
- Xuan, X.; Chen, C.; Molinero-Fernandez, A.; Ekelund, E.; Cardinale, D.; Swarén, M.; Wedholm, L.; Cuartero, M.; Crespo, G.A. Fully Integrated Wearable Device for Continuous Sweat Lactate Monitoring in Sports. ACS Sens. 2023, 8, 2401–2409. [Google Scholar] [CrossRef] [PubMed]
- Dolson, C.M.; Harlow, E.R.; Phelan, D.M.; Gabbett, T.J.; Gaal, B.; McMellen, C.; Geletka, B.J.; Calcei, J.G.; Voos, J.E.; Seshadri, D.R. Wearable Sensor Technology to Predict Core Body Temperature: A Systematic Review. Sensors 2022, 22, 7639. [Google Scholar] [CrossRef] [PubMed]
- Solem, K.; Clauss, M.; Jensen, J. Glycogen supercompensation in skeletal muscle after cycling or running followed by a high carbohydrate intake the following days: a systematic review and meta-analysis. Front. Physiol. 2025, 16, 1620943. [Google Scholar] [CrossRef]
- Prieto-Bellver, G.; Diaz-Lara, J.; Bishop, D.J.; Fernández-Sáez, J.; Abián-Vicén, J.; San-Millan, I.; Santos-Concejero, J. A Five-Week Periodized Carbohydrate Diet Does Not Improve Maximal Lactate Steady-State Exercise Capacity and Substrate Oxidation in Well-Trained Cyclists compared to a High-Carbohydrate Diet. Nutrients 2024, 16, 318. [Google Scholar] [CrossRef]
- Nøst, H.L.; Aune, M.A.; van den Tillaar, R. The Effect of Polarized Training Intensity Distribution on Maximal Oxygen Uptake and Work Economy Among Endurance Athletes: A Systematic Review. Sports 2024, 12, 326. [Google Scholar] [CrossRef] [PubMed]
- Yin, M.; Li, H.; Bai, M.; Liu, H.; Chen, Z.; Deng, J.; Deng, S.; Meng, C.; Vollaard, N.B.J.; Little, J.P.; Li, Y. Is low-volume high-intensity interval training a time-efficient strategy to improve cardiometabolic health and body composition? A meta-analysis. Appl. Physiol. Nutr. Metab. 2024, 49, 273–292. [Google Scholar] [CrossRef] [PubMed]
- Bodine, S.C.; Stitt, T.N.; Gonzalez, M.; Kline, W.O.; Stover, G.L.; Bauerlein, R.; Zlotchenko, E.; Scrimgeour, A.; Lawrence, J.C.; Glass, D.J.; Yancopoulos, G.D. Akt/mTOR pathway is a crucial regulator of skeletal muscle hypertrophy and can prevent muscle atrophy in vivo. Nat. Cell Biol. 2001, 3, 1014–1019. [Google Scholar] [CrossRef]
- Hearris, M.A.; Owens, D.J.; Strauss, J.A.; Shepherd, S.O.; Sharples, A.P.; Morton, J.P.; Louis, J.B. Graded reductions in pre-exercise glycogen concentration do not augment exercise-induced nuclear AMPK and PGC-1α protein content in human muscle. Exp. Physiol. 2020, 105, 1882–1894. [Google Scholar] [CrossRef]
- Russo, I.; Della Gatta, P.A.; Garnham, A.; Porter, J.; Burke, L.M.; Costa, R.J.S. The Effects of an Acute “Train-Low” Nutritional Protocol on Markers of Recovery Optimization in Endurance-Trained Male Athletes. Int. J. Sports Physiol. Perform. 2021, 16, 1764–1776. [Google Scholar] [CrossRef]
- Martin, R.A.; Viggars, M.R.; Esser, K.A. Metabolism and exercise: the skeletal muscle clock takes centre stage. Nat. Rev. Endocrinol. 2023, 19, 272–284. [Google Scholar] [CrossRef]
- Naderi, A.; Gobbi, N.; Ali, A.; Berjisian, E.; Hamidvand, A.; Forbes, S.C.; Koozehchian, M.S.; Karayigit, R.; Saunders, B. Carbohydrates and Endurance Exercise: A Narrative Review of a Food First Approach. Nutrients 2023, 15, 1367. [Google Scholar] [CrossRef]
- Baetica, A.A.; Westbrook, A.M.; El-Samad, H. Control theoretical concepts for synthetic and systems biology. Curr. Opin. Syst. Biol. 2019, 14, 50–57. [Google Scholar] [CrossRef]
- Suen, T.; Navlakha, S. A feedback control principle common to several biological and engineered systems. J. R. Soc. Interface 2022, 19, 20210711. [Google Scholar] [CrossRef] [PubMed]
- Stoica, G.-D.; Stoian, M. Durability, Circularity and Sustainability in the Food Market—A Bibliometric Analysis. Proc. Int. Conf. Bus. Excell. 2022, 16(1), 456–465. [Google Scholar] [CrossRef]
- Brady, S.S.; et al. Development of Conceptual Models to Guide Public Health Research, Practice, and Policy: Synthesizing Traditional and Contemporary Paradigms. Health Promot. Pract. 2020, 21, 510–524. [Google Scholar] [CrossRef]
- Smiles, W.J.; Yamada, M.; Camera, D.M. New developments in AMPK and mTORC1 cross-talk. Essays Biochem. 2024, 68, 321–336. [Google Scholar] [CrossRef] [PubMed]
- Mănescu, DC. Computational Analysis of Neuromuscular Adaptations to Strength and Plyometric Training: An Integrated Modeling Study. Sports 2025, 13(9), 298. [Google Scholar] [CrossRef]
- Bennett, M.A.; et al. The effect of three weeks of “sleep low-train low” energy availability strategy on the physiological adaptations to a home-based high-intensity interval training program: A randomized control trial. PLoS ONE 2021, 16, e0260959. [Google Scholar] [CrossRef]
- Mănescu, A.M.; Mănescu, D.C. Self-Supervised Gait Event Detection from Smartphone IMUs for Human Performance and Sports Medicine. Appl. Sci. 2025, 15, 11974. [Google Scholar] [CrossRef]
- Bowler, S.M.; Dixon, B.; Monk, T.; Highton, J.; Rowlands, D.S. Use of Continuous Glucose Monitors in Sport: Possible Applications and Considerations. Int. J. Sport Nutr. Exerc. Metab. 2023, 33, 121–132. [Google Scholar] [CrossRef]
- Kiviniemi, A.M.; Hautala, A.J.; Kinnunen, H.; Tulppo, M.P. Endurance Training Guided Individually by Daily Heart Rate Variability Measurements. Eur. J. Appl. Physiol. 2007, 101, 743–751. [Google Scholar] [CrossRef]
- Mentzoni, B.N.; et al. Accuracy and agreement of 4 handheld blood lactate analyzers. Eur. J. Appl. Physiol. 2024, 124, 3781–3788. [Google Scholar] [CrossRef]
- Tricco, A.C.; Lillie, E.; Zarin, W.; O’Brien, K.K.; Colquhoun, H.; Levac, D.; Moher, D.; Peters, M.D.J.; Horsley, T.; Weeks, L.; et al. PRISMA Extension for Scoping Reviews (PRISMA-ScR): Checklist and Explanation. Ann. Intern. Med. 2018, 169, 467–473. [Google Scholar] [CrossRef]
- Grames, E.M.; Schwartz, D.; Elphick, C.S. A Systematic Method for Hypothesis Synthesis and Conceptual Model Development. Methods Ecol. Evol. 2022, 13, 2078–2087. [Google Scholar] [CrossRef]
- Campbell, F.; Tricco, A.C.; Munn, Z.; Pollock, D.; Saran, A.; Sutton, A.; et al. Mapping reviews, scoping reviews, and evidence and gap maps (EGMs): the same but different— the “Big Picture” review family . Systematic Reviews 2023, 12, 45. [Google Scholar] [CrossRef]
- Peters, M.D.J.; Marnie, C.; Tricco, A.C.; Pollock, D.; Munn, Z.; Alexander, L.; McInerney, P.; Godfrey, C.M.; Khalil, H. Updated methodological guidance for the conduct of scoping reviews. JBI Evidence Synthesis 2020, 18, 2119–2126. [Google Scholar] [CrossRef]
- Wolffe, T.A.M.; Whaley, P.; Halsall, C.; Rooney, A.A.; Walker, V.R. Systematic evidence maps as a novel tool to support evidence-based decision-making in chemicals policy and risk management. Environment International 2019, 130, 104871. [Google Scholar] [CrossRef]
- Grames, E.M.; Stillman, A.N.; Tingley, M.W.; Elphick, C.S. A systematic method for hypothesis synthesis and conceptual model development. Methods in Ecology and Evolution 2022, 13, 2078–2087. [Google Scholar] [CrossRef]
- Balagué, N.; Pol, R.; Torrents, C.; Ric, A.; Hristovski, R. Network Physiology of Exercise: Vision and Perspectives. Frontiers in Physiology 2020, 11, 611550. [Google Scholar] [CrossRef]
- Billman, G.E. Homeostasis: The Underappreciated and Far Too Often Ignored Central Organizing Principle of Physiology. Frontiers in Physiology 2020, 11, 200. [Google Scholar] [CrossRef] [PubMed]
- Baetica, A.A.; Westbrook, A.M.; El-Samad, H. Control theoretical concepts for synthetic and systems biology. Current Opinion in Systems Biology 2019, 14, 50–57. [Google Scholar] [CrossRef]
- El-Samad, H. Biological feedback control—Respect the loops. Cell Systems 2021, 12, 477–487. [Google Scholar] [CrossRef] [PubMed]
- Sennesh, E.; Quigley, K.S. Interoception as modeling, allostasis as control. Biological Psychology 2022, 167, 108242. [Google Scholar] [CrossRef]
- Doyle, M.M.; Keane, M.; McGarrigle, A.; Malone, F.D. A SAS macro for modelling periodic data using cosinor analysis. Computer Methods and Programs in Biomedicine 2021, 209, 106292. [Google Scholar] [CrossRef]
- Flockhart, M.; Nilsson, L.C.J.; Larsen, F.J. Continuous glucose monitoring in endurance athletes: Potential, challenges and research opportunities. Sports Medicine 2023, 53, 2019–2034. [Google Scholar] [CrossRef]
- Lundstrom, C.J.; Foreman, N.; Baggish, A.L. Practices and applications of heart rate variability monitoring in endurance athletes. International Journal of Sports Medicine 2023, 44, 9–19. [Google Scholar] [CrossRef] [PubMed]
- Raa, I.; Sunde, G.A.; Bolann, B.; Kvåle, R.; Eliassen, H.S.; Wentzel-Larsen, T.; Heltne, J.-K. Validation of a point-of-care capillary lactate measuring device. Scandinavian Journal of Trauma, Resuscitation and Emergency Medicine 2020, 28, 83. [Google Scholar] [CrossRef] [PubMed]
- Littlejohns, L.B.; Hill, C.; Neudorf, C. Diverse approaches to creating and using causal loop diagrams in public health research: Recommendations from a scoping review. Public Health Reviews 2021, 42, 1604352. [Google Scholar] [CrossRef]
- Dhirasasna, N.; Sahin, O.; Miller, R.; Hinkel, J. A multi-methodology approach to creating a causal loop diagram. Systems 2019, 7, 42. [Google Scholar] [CrossRef]
- Cassidy, R.; Borghi, J.; Semwanga, A.R.; Binyaruka, P.; Singh, N.S.; Blanchet, K. How to do (or not to do)using causal loop diagrams for health system research. Health Policy and Planning 2022, 37, 1328–1336. [Google Scholar] [CrossRef]
- Inoue, A.; dos Santos Bunn, P.; Crivoi do Carmo, E.; Lattari, E.; da Silva, E.B. Internal training load perceived by athletes and planned by coaches: A systematic review and meta-analysis. Sports Medicine – Open 2022, 8, 20. [Google Scholar] [CrossRef]
- Liu, H.; Yang, W.; Liu, H.; Bao, D.; Cui, Y.; Ho, I.M.K.; Li, Q. Criterion-related validity of session rating of perceived exertion scales in athletes: A meta-analysis. BMC Sports Science, Medicine and Rehabilitation 2023, 15, 112. [Google Scholar] [CrossRef]
- Uleman, J.F.; Luijten, M.; Abdo, W.F.; Vyrastekova, J.; Gerhardus, A.; Runge, J.; Rod, N.H.; Verhagen, M. Triangulation for causal loop diagrams: Constructing biopsychosocial models using group model building, literature review, and causal discovery. npj Complexity 2024, 1, 19. [Google Scholar] [CrossRef]
- Smith, J.A.B.; Murach, K.A.; Dyar, K.A.; Zierath, J.R. Exercise metabolism and adaptation in skeletal muscle. Nat. Rev. Mol. Cell Biol. 2023, 24, 607–632. [Google Scholar] [CrossRef] [PubMed]
- Egan, B.; Sharples, A.P. Molecular responses to acute exercise and their relevance for adaptations in skeletal muscle to exercise training. Physiol. Rev. 2023, 103, 2057–2170. [Google Scholar] [CrossRef]
- Furrer, R.; Hawley, J.A.; Handschin, C. The molecular athlete: Exercise physiology from mechanisms to medals. Physiol. Rev. 2023, 103, 1693–1787. [Google Scholar] [CrossRef]
- Barrett, L.F.; Simmons, W.K. An active inference theory of allostasis and interoception in depression. Philos. Trans. R. Soc. B Biol. Sci. 2016, 371, 20160011. [Google Scholar] [CrossRef]
- Impey, S.G.; Hearris, M.A.; Hammond, K.M.; Bartlett, J.D.; Louis, J.; Close, G.L.; Morton, J.P. Fuel for the Work Required: A Theoretical Framework for Carbohydrate Periodization and the Glycogen Threshold Hypothesis. Sports Med. 2018, 48, 1031–1048. [Google Scholar] [CrossRef]
- Marquet, L.-A.; Brisswalter, J.; Louis, J.; Tiollier, E.; Burke, L.M.; Hawley, J.A.; Hausswirth, C. Enhanced endurance performance by periodization of carbohydrate intake: “Sleep low” strategy. Med. Sci. Sports Exerc. 2016, 48, 663–672. [Google Scholar] [CrossRef]
- Furrer, R.; et al. Molecular control of endurance training adaptation in male mouse skeletal muscle. Nat. Metab. 2023, 5, 2020–2035. [Google Scholar] [CrossRef] [PubMed]
- Furrer, R.; Handschin, C. Molecular aspects of the exercise response and training adaptation in skeletal muscle. Free Radic. Biol. Med. 2024, 223, 53–68. [Google Scholar] [CrossRef] [PubMed]
- Nair, V.D.; et al. Molecular adaptations in response to exercise training are associated with tissue-specific transcriptomic and epigenomic signatures. Cell Genom. 2024, 4, 100421. [Google Scholar] [CrossRef]
- Mănescu, D. C. Training Load Oscillation and Epigenetic Plasticity: Molecular Pathways Connecting Energy Metabolism and Athletic Personality. Preprints 2025, 2025111181. [Google Scholar] [CrossRef]
- Jacques, M.; et al. Molecular landscape of sex- and modality-specific exercise adaptation in human skeletal muscle through large-scale multi-omics integration. Cell Rep. 2025, 44, 115750. [Google Scholar] [CrossRef]
- Spaulding, H.R.; Yan, Z. AMPK and the adaptation to exercise. Annu. Rev. Physiol. 2022, 84, 209–227. [Google Scholar] [CrossRef] [PubMed]
- Bobba-Alves, N.; Juster, R.-P.; Picard, M. The energetic cost of allostasis and allostatic load. Psychoneuroendocrinology 2022, 146, 105951. [Google Scholar] [CrossRef] [PubMed]
- Mehrhof, S.Z.; Fleming, H.; Nord, C.L. An interoceptive model of energy allostasis linking metabolic and mental health. Sci. Adv. 2025, 11, eady4356. [Google Scholar] [CrossRef] [PubMed]
- Louis, J.; Marquet, L.-A.; Tiollier, E.; Bermon, S.; Hausswirth, C.; Brisswalter, J. The impact of sleeping with reduced glycogen stores on immunity and sleep in triathletes. Eur. J. Appl. Physiol. 2016, 116, 1941–1954. [Google Scholar] [CrossRef]
- Mountjoy, M.; Sundgot-Borgen, J.K.; Burke, L.M.; Ackerman, K.E.; Blauwet, C.; Constantini, N.; Lebrun, C.; Lundy, B.; Melin, A.K.; Meyer, N.L.; et al. IOC consensus statement on relative energy deficiency in sport (RED-S): 2018 update. Br. J. Sports Med. 2018, 52, 687–697. [Google Scholar] [CrossRef]
- Carrasco-Poyatos, M.; González-Quílez, A.; Altini, M.; Granero-Gallegos, A. Heart rate variability-guided training in professional runners: Effects on performance and vagal modulation. Physiol. Behav. 2022, 244, 113654. [Google Scholar] [CrossRef]
- Mănescu, D.C. Big Data Analytics Framework for Decision-Making in Sports Performance Optimization. Data 2025, 10, 116. [Google Scholar] [CrossRef]
- Medellín Ruiz, J.P.; Rubio-Arias, J.Á.; Clemente-Suarez, V.J.; Ramos-Campo, D.J. Effectiveness of training prescription guided by heart rate variability versus predefined training for physiological and aerobic performance improvements: A systematic review and meta-analysis. Appl. Sci. 2020, 10, 8532. [Google Scholar] [CrossRef]
Figure 1.
Schematic of the model-building workflow used in this study, showing the left-to-right progression from evidence aggregation to internal validation. Chevrons indicate directional dependence between phases; colors distinguish phase roles without implying quantitative weight.
Figure 1.
Schematic of the model-building workflow used in this study, showing the left-to-right progression from evidence aggregation to internal validation. Chevrons indicate directional dependence between phases; colors distinguish phase roles without implying quantitative weight.
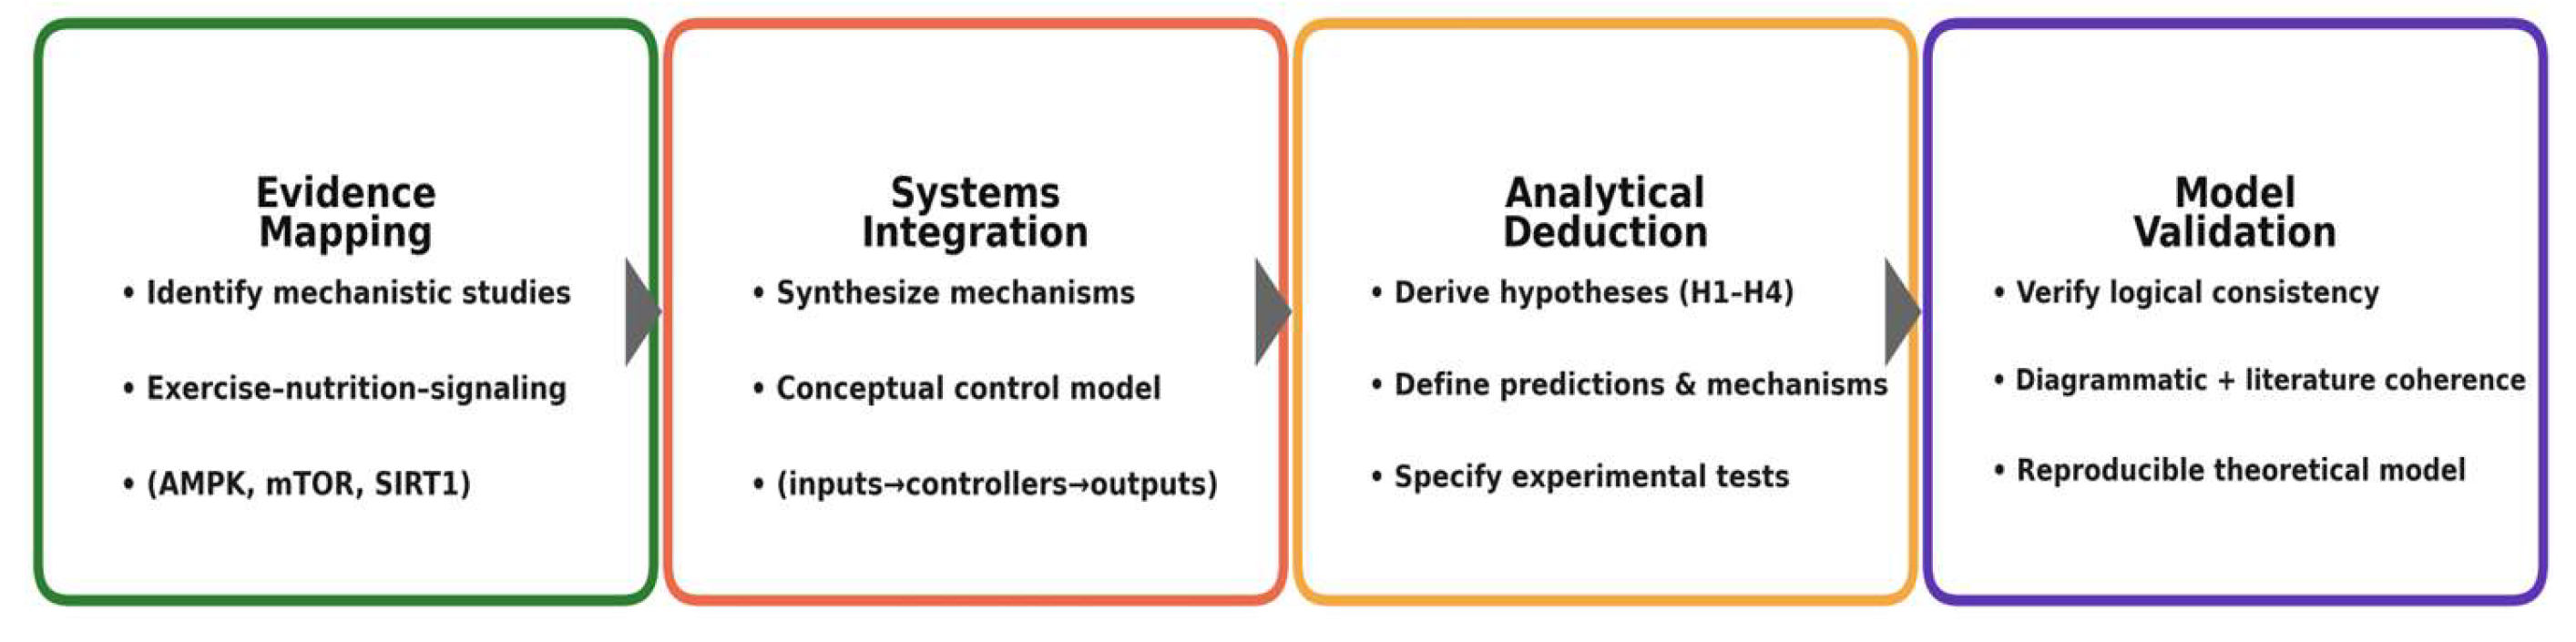
Figure 2.
Core regulatory architecture of the Training–Fuel Coupling (TFC) model. Training load and nutritional fueling act as dual control inputs regulating molecular pathways (AMPK, mTORC1, and SIRT1) that determine adaptive outcomes in endurance and hypertrophy. Monitoring feedback (HRV, CGM, lactate) closes the regulatory loop, ensuring dynamic balance between energy stress and fuel availability.
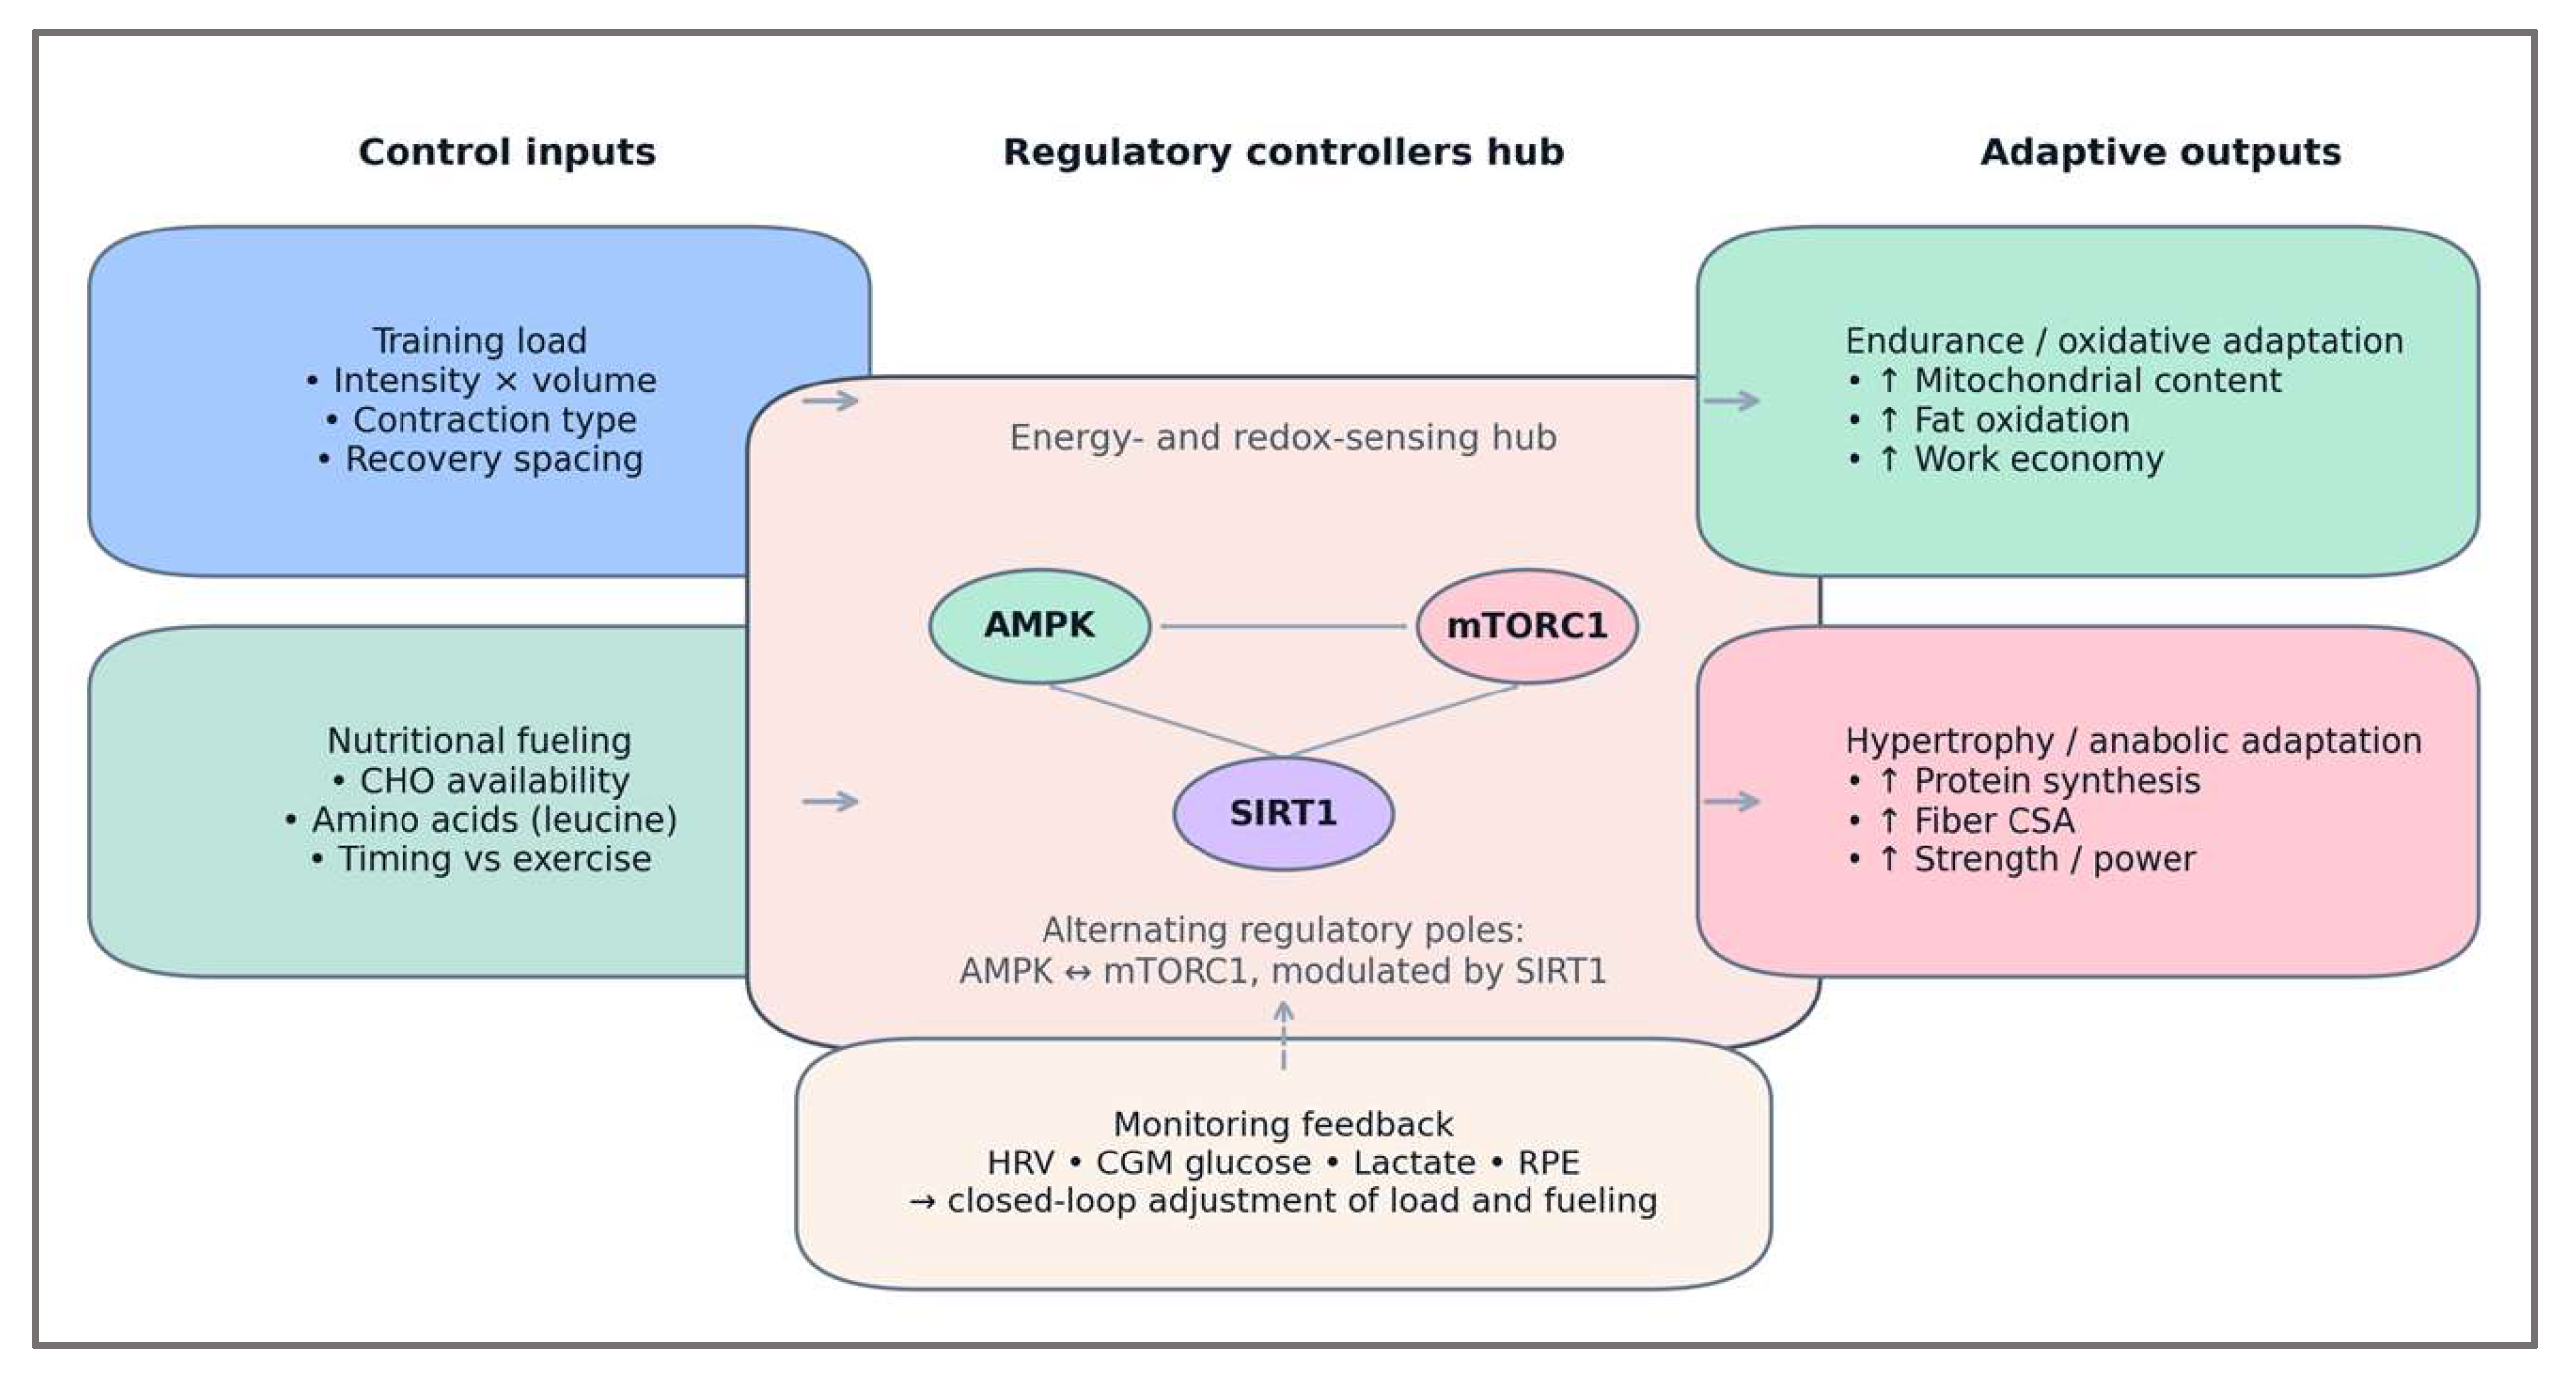
Figure 3.
Measurement-anchored control map. Six routinely accessible observables—CGM (glucose), HRV (autonomic), Lactate (threshold), RPE (perceived), Pace/Power (work rate), and Sleep (timing)—inform STATE ESTIMATION (indices), which compresses signals into EVI (energy variability), ESI (systemic stress), AOI (adaptive oscillation), and CLPI (closed-loop performance). These indices parameterize the TUNING POLICY, which updates next-session load + fueling timing and sets oscillation phase & amplitude, shaping the Microcycle oscillator (anti-phase AMPK-mTORC1). STABILIZED ADAPTATION (performance + recovery + resilience) feeds back to subsequent OBSERVABLES, enabling iterative closed-loop regulation across the microcycle (H1 Variability, H2 Thresholds, H3 Oscillation, H4 Closed-loop).
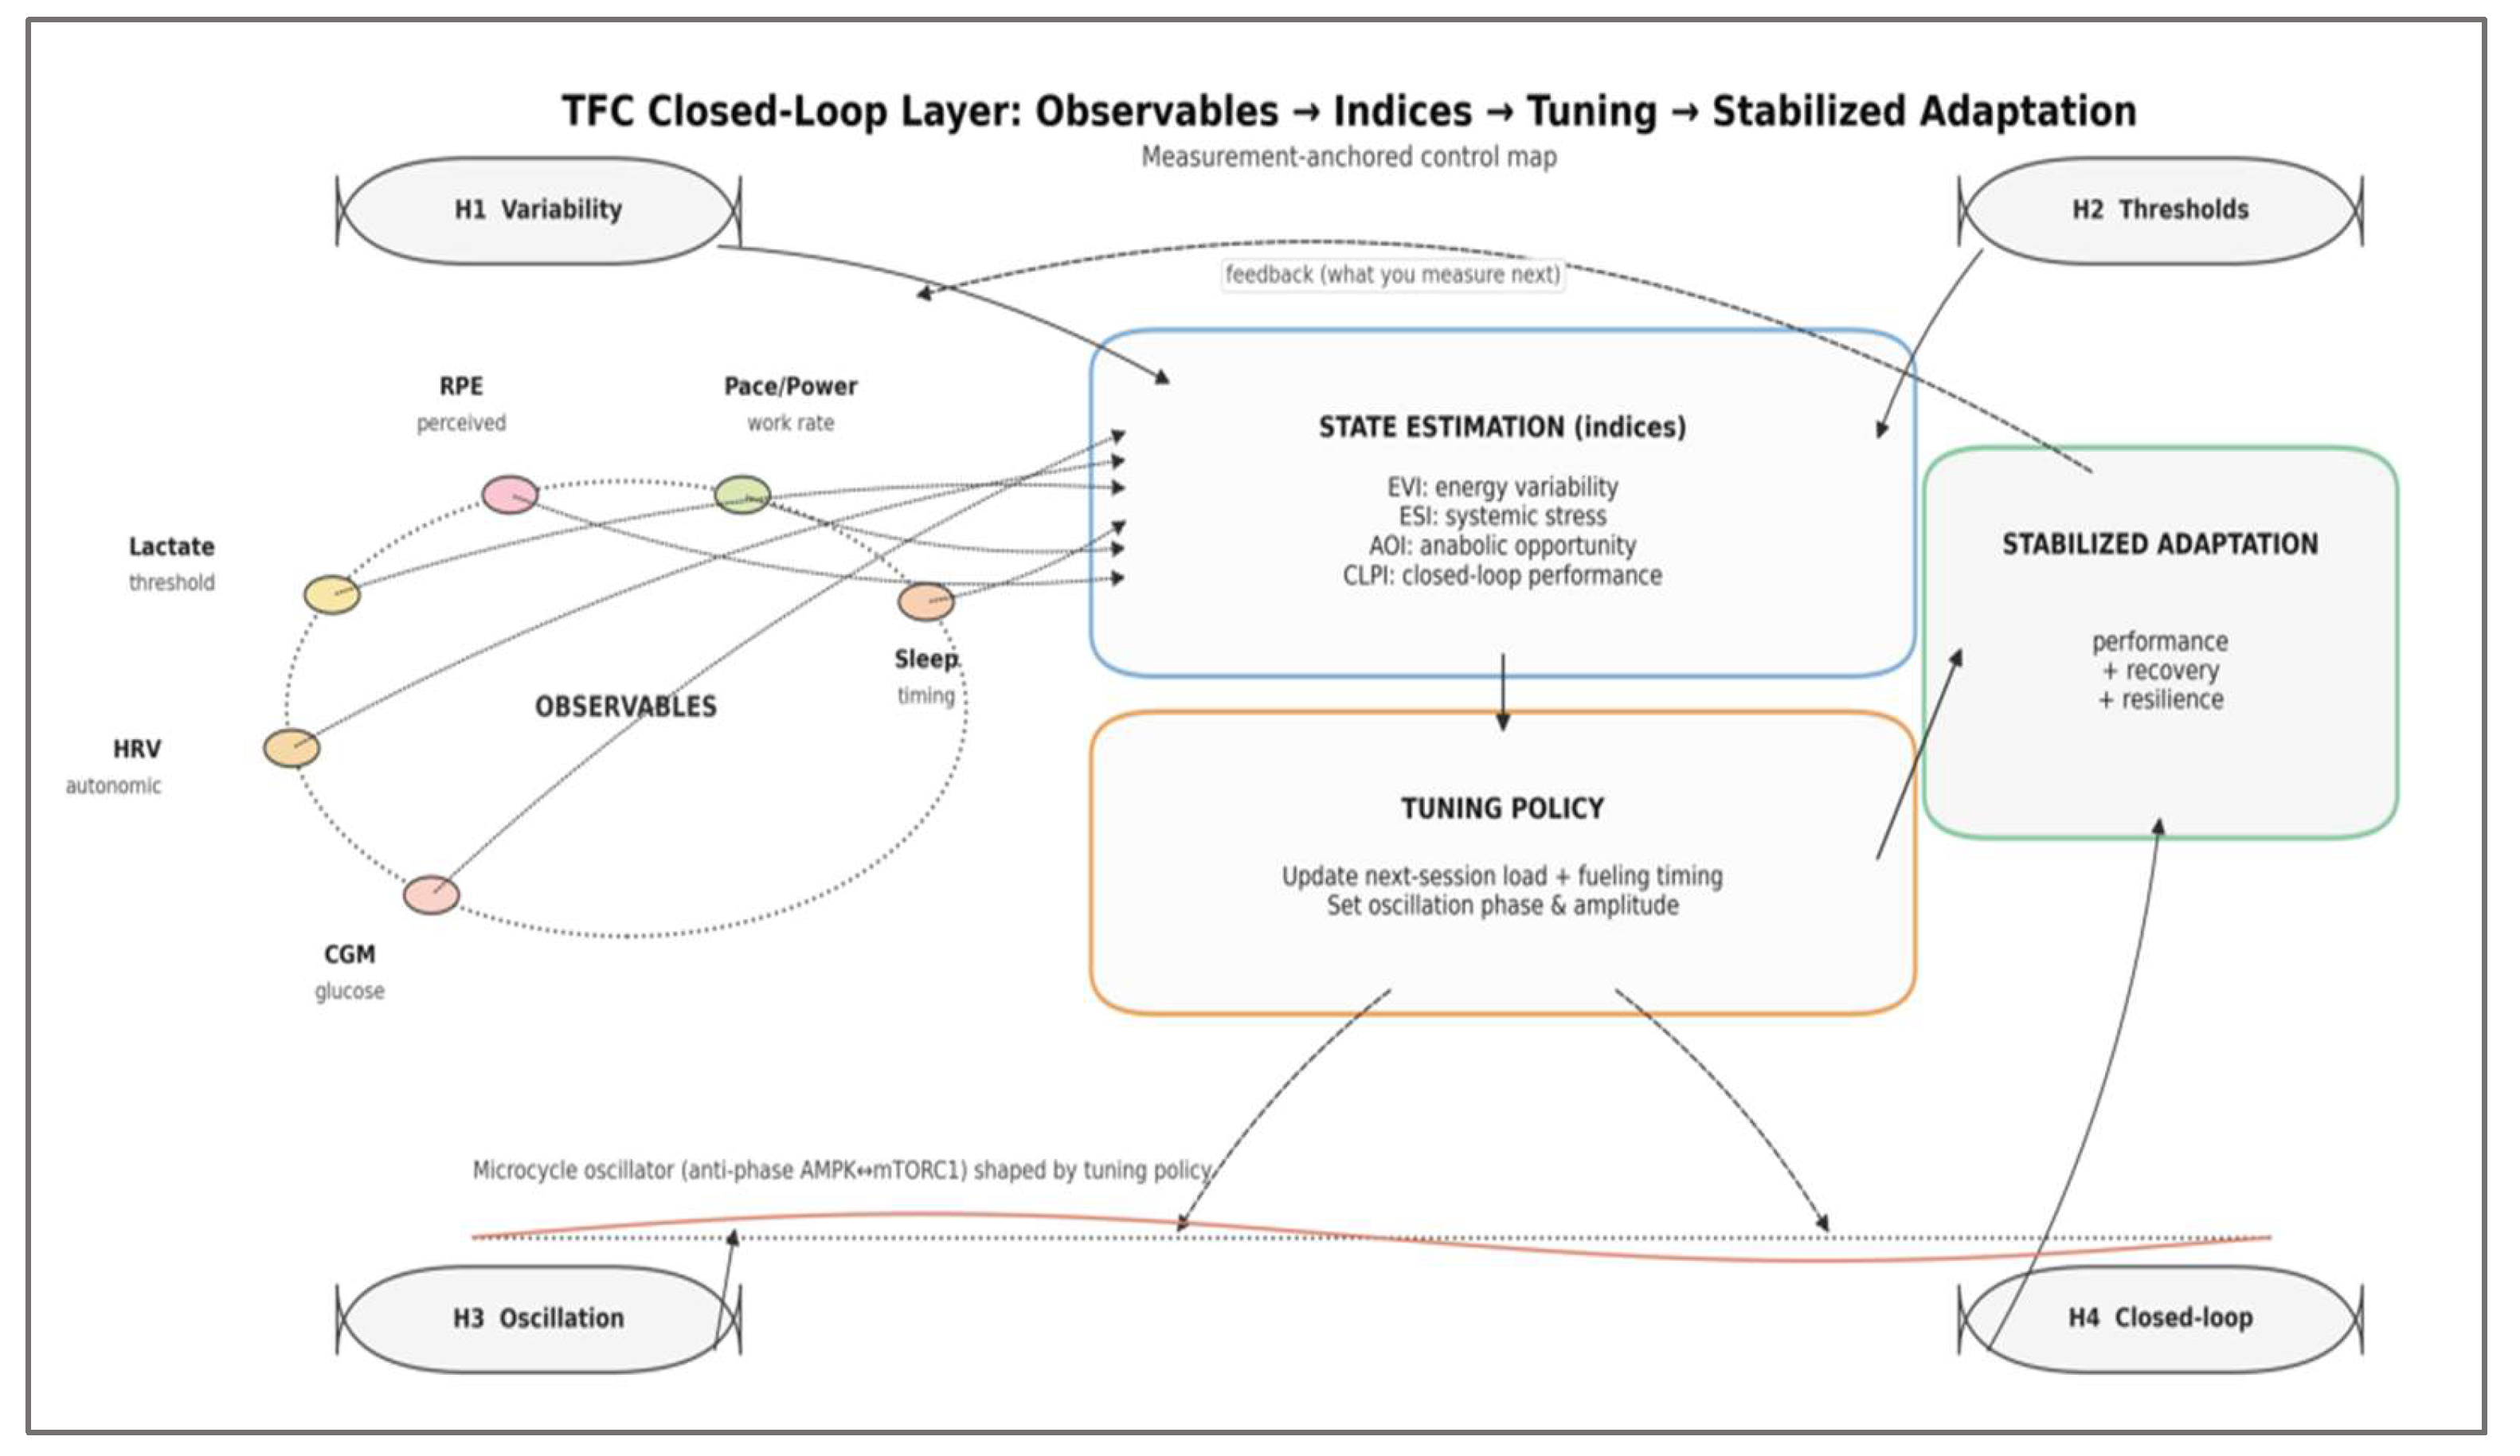
Figure 4.
Core mechanistic schema of the Training–Fuel Coupling (TFC) framework. Low-fuel contexts (glycogen↓, AMP/ATP↑, NAD⁺/NADH↑) bias AMPK/SIRT1–PGC-1α and oxidative remodeling, whereas high-fuel contexts (glycogen↑, insulin/leucine↑) bias mTORC1/p70S6K and translational drive. Inputs (load and fuel) act through a controllers hub; context switching (thresholds, timing, periodization) flips signaling dominance and shapes adaptive outputs.
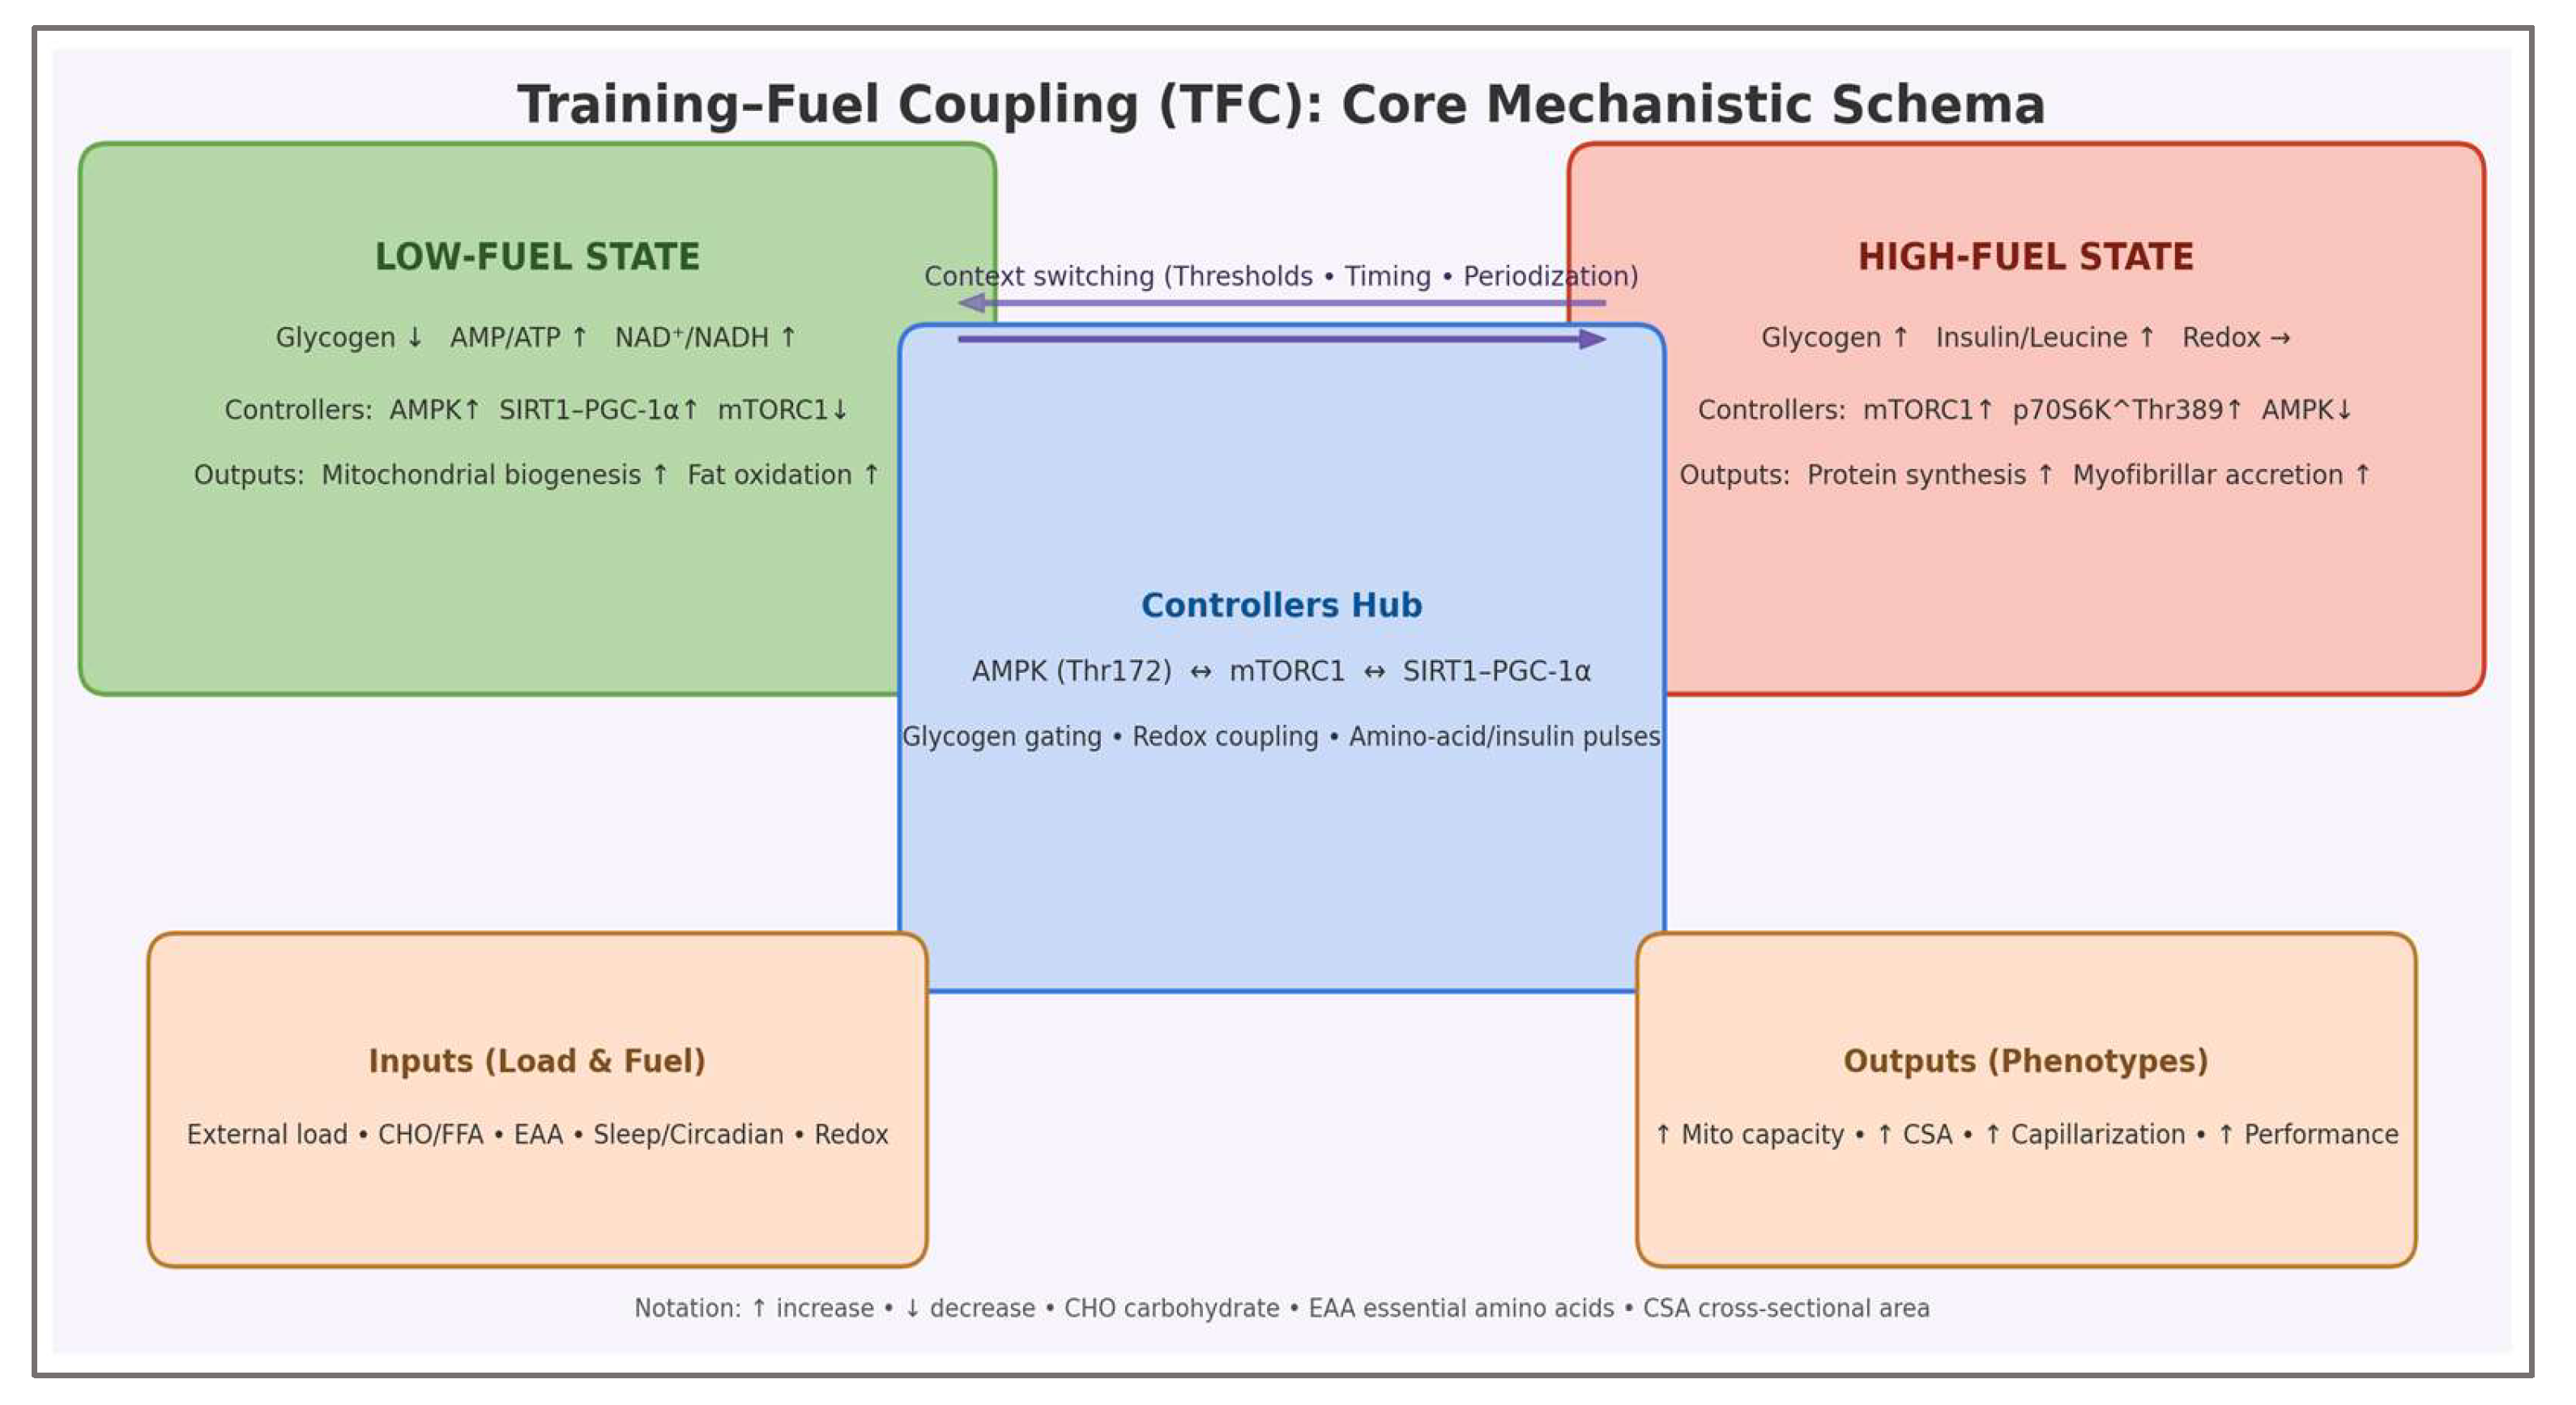
Figure 5.
Oscillatory coupling across a 7-day microcycle.
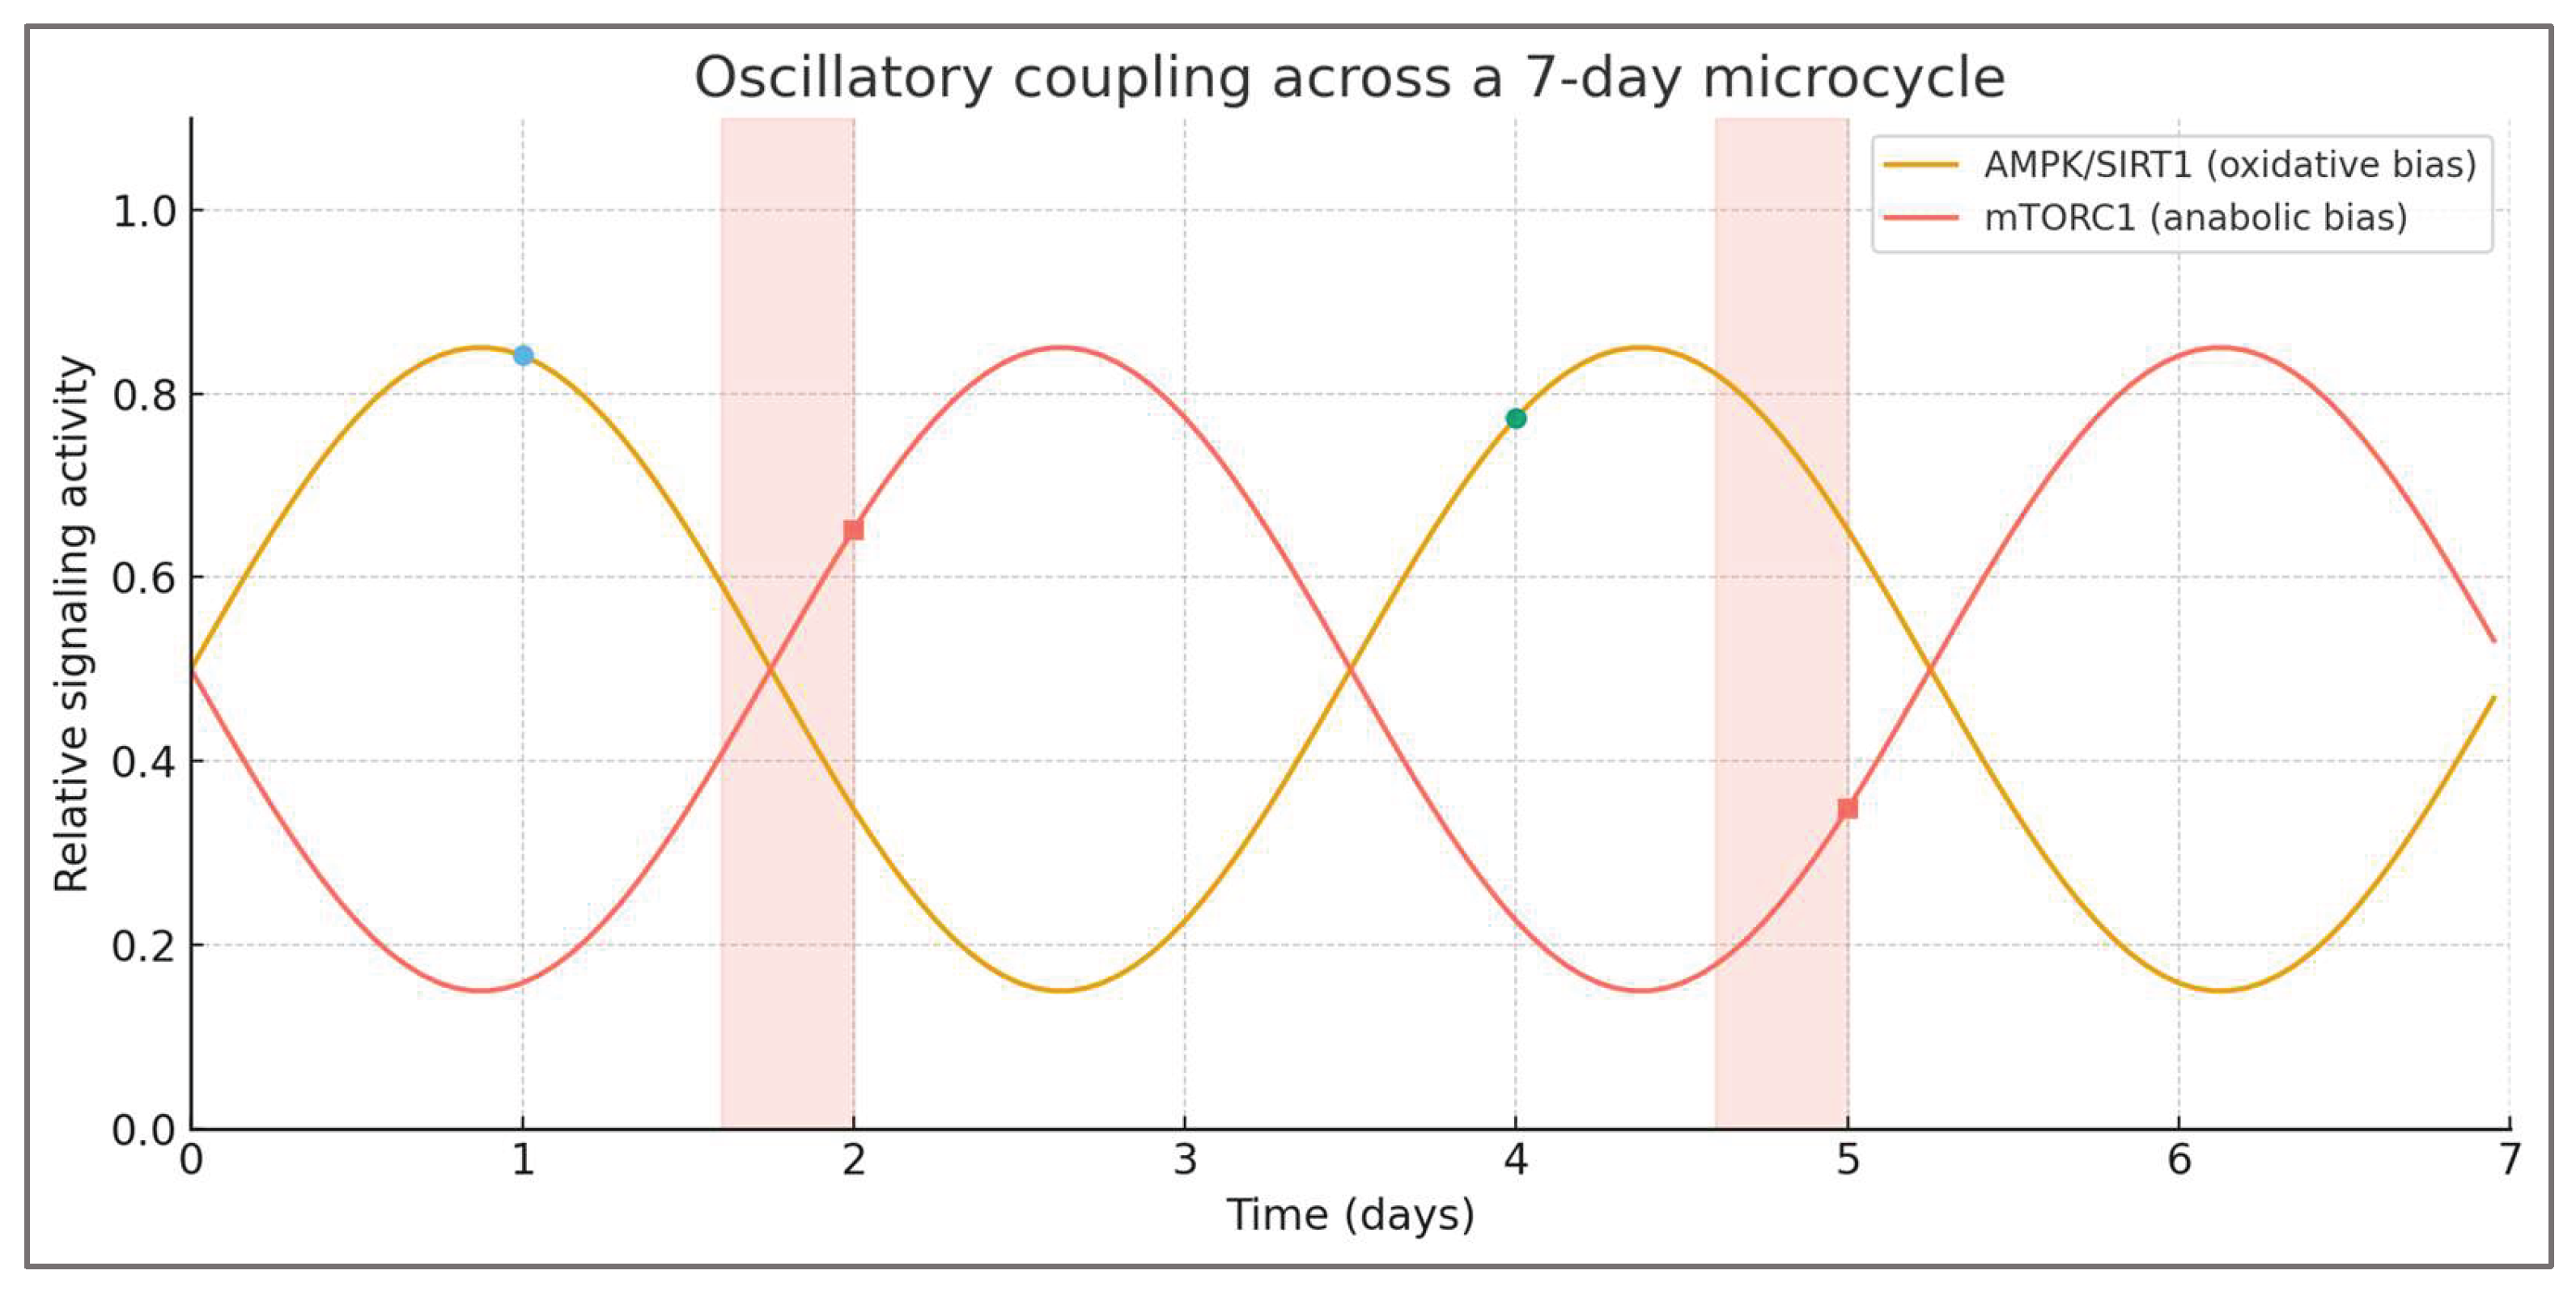

Table 1.
Practical Biomarkers of Energetic State and TFC Proxy Indices.
| Index | Primary Biomarker(s) | Device / Method | Operational Formula or Metric | Interpretation | Threshold (indicative) |
|
Energetic Variability Index (EVI) |
Mean CGM glucose (Δ mmol·L⁻¹·h⁻¹); HRV (SDNN or lnRMSSD) | Continuous Glucose Monitor (CGM); HRV chest strap or wearable | EVIproxy = SDz(CGM) + SDz (HRV) |
Captures session-to-session variability in energetic context | > +0.8 SD → optimal adaptive variability; < 0 → metabolic rigidity |
|
Energetic Stress Index (ESI) |
Blood lactate [La]; HRV suppression; CGM glucose drift | Portable lactate analyzer; HRV sensor; CGM | ESIproxy = z([La]) - z(HRV) - z(ΔGlucose) |
Integrates catabolic stress (AMPK) vs. anabolic recovery (mTORC1) | +1 → catabolic (AMPK phase); −1 → anabolic (mTORC1 phase) |
|
Adaptive Oscillation Index (AOI) |
Sequence of ESI values across 7 days | Computed from daily proxy data | AOIproxy = Δφ / π (Δφ from a cosinor fit to the 7-day ESI proxy time-series) | Measures rhythmic coupling between AMPK and mTORC1 activation | > 0.7 → coherent oscillation; < 0.3 → desynchronization |
|
Closed-Loop Performance Index (CLPI) |
Session quality (RPE × [La]); fueling adjustment (ΔFuel / ΔPerf) | RPE log; lactate analyzer; CGM or nutrition app | CLPIproxy = (1 – CVsession) × (ΔFuel / ΔPerf) |
Quantifies efficiency of adaptive feedback regulation | > +0.5 SD → stable self-regulation; < 0 → feedback inefficiency |
| Composite Energetic Score (optional) | Weighted mean of standardized indices (z(EVI)+z(ESI)+ z(AOI)+z(CLPI))/4 |
Derived variable | Aggregates system-level adaptive efficiency | High positive → optimal coupling; negative → instability | ±1 SD = normal range; > +1 SD = high adaptive coherence |
Notes. All indices are dimensionless; EVI, ESI, and CLPI are standardized as within-individual z-scores, whereas AOI is reported on its natural 0–1 scale (phase-based). For the Composite Energetic Score, AOI (or AOIproxy) is additionally standardized (z-scored) prior to aggregation. CGM = continuous glucose monitoring; HRV = heart-rate variability; [La] = post-exercise blood lactate concentration; CV = coefficient of variation; ΔFuel = change in carbohydrate intake or energy availability; ΔPerf = change in session performance output.
Table 2.
Validation Landscape for H1 — Energetic Variability and Adaptive Efficiency. Experimental design variables, signaling markers, and validation priorities defining substrate-dependent adaptive modulation.
Table 2.
Validation Landscape for H1 — Energetic Variability and Adaptive Efficiency. Experimental design variables, signaling markers, and validation priorities defining substrate-dependent adaptive modulation.
| Dimension | Descriptor | Operational range / marker | Expected molecular bias | Adaptive outcome | Key verification methods |
| Energetic context | Muscle glycogen availability | LOW < 350 mmol·kg⁻¹ dw / HIGH > 500 mmol·kg⁻¹ dw | LOW → ↑p-AMPK^Thr172, ↑p-ACC^Ser79, ↑PGC-1α; HIGH → ↑p-p70S6K^Thr389, ↑4E-BP1^Thr37/46 | Divergent activation of oxidative vs. anabolic signaling pathways | Muscle biopsies 0/1/3 h post-exercise; phospho/total ratios |
| Substrate state | Carbohydrate–protein co-availability | LOW: fasted or depleted; HIGH: CHO 0.5 g·kg⁻¹ + EAA 0.3 g·kg⁻¹ | Nutrient-rich condition re-activates mTORC1; low substrate sustains AMPK tone | Bias toward recovery (fed) or mitochondrial signaling (depleted) | Controlled pre-exercise feeding; isotopic tracer FSR measurement |
| Redox balance | NAD⁺/NADH ratio | 1.8–2.8 range | ↑NAD⁺ activates SIRT1–PGC-1α; ↓NAD⁺ favors mTORC1 translation | Fine-tuning of metabolic flexibility | Enzymatic assays (NAD⁺/NADH); Western blot for Ac-PGC-1α |
| Metabolic readout | p-AMPK/p-p70S6K ratio | HIGH vs. LOW comparison | Reciprocal activation pattern (AMPK↑ mTORC1↓ or vice versa) | Defines variability of energetic signaling | Densitometric quantification; normalization to total protein |
| Computational proxy | Energetic Variability Index (EVI) = SD of (AMPK/mTORC1 ratio) across sessions | EVI > +0.8 SD → enhanced adaptive responsiveness | Quantifies sensitivity to context variation | Predicts adaptation efficiency | Time-series modeling; intra-individual variance analysis |
| Validation priority | Experimental scope | Acute molecular and short-term training contexts | Tier 1 – acute signaling; Tier 2 – repeated exposure; Tier 3 – cross-modal adaptation | Demonstrates how contextual variation enhances adaptive gain | Crossover HIIT trials; biopsy and performance endpoints |
| Potential confounders | Behavioral and physiological factors | Nutrition timing, fiber type composition, habitual energy intake, recovery status | Alter adaptive bias or dampen variability effect | Controlled feeding, fiber-type matching, standardized recovery window | Repeated-measures design; pre-post balance check |
Notes: Glycogen thresholds estimated from train-low literature (250–600 mmol·kg⁻¹ dw). Phosphorylation residues per UniProt: AMPK^Thr172, ACC^Ser79, p70S6K^Thr389, 4E-BP1^Thr37/46. NAD⁺/NADH ratio serves as a redox proxy for SIRT1–PGC-1α activation. EVI = Energetic Variability Index. Abbreviations: CHO – carbohydrate; EAA – essential amino acids; FSR – fractional synthesis rate; SD – standard deviation.
Table 3.
Validation Landscape for H2 — Threshold Regulation of Signaling Dominance. Experimental framework for quantifying energetic boundaries, signaling polarity, and bistable metabolic transitions.
Table 3.
Validation Landscape for H2 — Threshold Regulation of Signaling Dominance. Experimental framework for quantifying energetic boundaries, signaling polarity, and bistable metabolic transitions.
| Dimension | Descriptor | Operational range / marker | Expected molecular bias | Adaptive outcome | Key verification methods |
| Energy threshold | Muscle glycogen concentration | ~300 mmol·kg⁻¹ dw boundary | Below threshold → ↑p-AMPK^Thr172, ↓p-p70S6K^Thr389, ↓p-mTOR^Ser2448 | Transition from anabolic toward oxidative phenotype | Phosphorylation assays; load-matched strength sessions |
|
Energy charge |
AMP/ATP ratio | >0.03 (LOW) / <0.02 (HIGH) | ↑AMP triggers AMPK autophosphorylation and TSC2-mediated mTORC1 inhibition | ↑Fat oxidation, ↓Protein synthesis | LC–MS nucleotide profiling; energy charge quantification |
|
Redox coupling |
NAD⁺/NADH ratio | >2.5 (LOW) / <1.8 (HIGH) | ↑NAD⁺ promotes SIRT1 activation and PGC-1α deacetylation | ↑Mitochondrial biogenesis and oxidative remodeling | Western blot (Ac-PGC-1α); enzymatic assays (CS, COX) |
| Metabolic readout | p-ACC^Ser79 / p-mTOR^Ser2448 ratio | LOW/HIGH comparison | ↑p-ACC and ↓p-mTOR indicate metabolic gating | Defines activation–inhibition boundary and threshold crossing | Densitometry; phospho/total normalization |
| Computational proxy | Energetic Stress Index (ESI) = z(AMP/ATP) + z(NAD⁺/NADH) | ESI > +1.0 SD → AMPK dominance | Continuous estimate of threshold crossing probability | Predicts binary signaling transitions (on/off) | Systems modeling; ROC analysis; machine-learning classification |
| Validation priority | Model testing tier | Human experimental model | Tier 1 – acute molecular; Tier 2 – repeated exposure; Tier 3 – adaptive trend | Confirms bistability and reversibility of the signaling switch | Sequential trials; biomarker reproducibility across conditions |
| Potential confounders | Inter-individual and environmental modifiers | Context-dependent: nutrition timing, circadian phase, sex | May shift apparent threshold or dampen response magnitude | Controls required for feeding state, chronobiology, and energy availability | Crossover design; standardized diet; matched training load |
Notes: Energy charge derived from adenylate pool (ATP + ADP + AMP). Redox ratios measured enzymatically (NAD⁺/NADH). Glycogen thresholds from train-low literature (250–600 mmol·kg⁻¹ dw). Phosphorylation residues per UniProt: AMPK^Thr172, p70S6K^Thr389, mTOR^Ser2448, ACC^Ser79. Abbreviations: CS – citrate synthase; COX – cytochrome c oxidase; SD – standard deviation; ESI – Energetic Stress Index.
Table 4.
Validation Landscape for H3 — Oscillatory Coupling and Periodized Adaptation. Integrated experimental parameters linking metabolic rhythm, training periodization, and composite adaptive gain.
Table 4.
Validation Landscape for H3 — Oscillatory Coupling and Periodized Adaptation. Integrated experimental parameters linking metabolic rhythm, training periodization, and composite adaptive gain.
| Dimension | Descriptor | Operational range / marker |
Expected molecular bias |
Adaptive outcome | Key verification methods |
| Cycle architecture | Catabolic–anabolic alternation | ~48 h oscillation: endurance (AMPK) → strength (mTORC1) | Alternating ↑p-AMPK^Thr172 and ↑p-p70S6K^Thr389 phases | Integrated oxidative and hypertrophic adaptation | Controlled microcycle scheduling; session timing verification |
| Energetic amplitude | ΔGlycogen between phases | ≈ ±200 mmol·kg⁻¹ dw | Greater amplitude → stronger signaling oscillation | ↑CS +15 %, ↑COX +12 %, ↑CSA +5–8 % | Glycogen assay; enzymatic quantification; muscle imaging |
| Nutritional synchronization | Feeding window and macronutrient timing | Protein early (0–1 h) with delayed CHO (2–3 h) after low-glycogen session | Leucine and insulin signaling reinforce mTORC1 activation post-AMPK phase | Amplified adaptation efficiency (Δ1RM +3–5 %) | Dietary control; post-exercise metabolic profiling |
| Metabolic readout | Oscillation coherence between AMPK/mTORC1 pathways | Phase shift ≈ π (180° out of phase) | Anti-phase coupling between AMPK and mTORC1 markers | Predicts synergistic adaptation | Cosine-fit modeling; phospho-signature time course |
| Computational proxy | Adaptive Oscillation Index (AOI) = Δφ / π (phase difference from cosinor-fitted AMPK and mTORC1 time-series) | AOI > 0.7 → coherent anti-phase oscillation | Quantifies systemic oscillatory alignment | Predicts global adaptation score | Signal analysis; cross-correlation algorithms |
| Validation priority | Model scalability | Short-term mesocycle studies (6–8 weeks); athlete-level | Tier 2 – longitudinal training; Tier 3 – systems adaptation | Demonstrates emergent stability from oscillatory control | Randomized intervention trials; performance & biopsy endpoints |
| Potential confounders | Recovery duration, sleep, circadian phase, hormonal fluctuations | Inter-individual variation in oscillation amplitude | Desynchronization reduces adaptive coherence | ↑Variance of ΔCS or ΔCSA | Standardized recovery timing; circadian alignment; sleep tracking |
Notes: Oscillatory coupling refers to anti-phase alternation between AMPK- and mTORC1-dominant states within ~48 h microcycles. Δphase ≈ π indicates maximal metabolic opposition. AOI = Adaptive Oscillation Index, a bounded phase-based metric (0–1) derived from Δphase; Δphase ≈ π indicates maximal anti-phase alternation between AMPK- and mTORC1-dominant states. CS – citrate synthase; COX – cytochrome c oxidase; CSA – cross-sectional area; Δ – within-condition change.
Table 5.
Validation Landscape for H4 — Closed-Loop Regulation and Feedback Optimization. Systems-level framework for testing dynamic feedback, performance stability, and adaptive efficiency.
Table 5.
Validation Landscape for H4 — Closed-Loop Regulation and Feedback Optimization. Systems-level framework for testing dynamic feedback, performance stability, and adaptive efficiency.
| Dimension | Descriptor | Operational range / marker |
Expected molecular bias |
Adaptive outcome | Key verification methods |
| Feedback inputs | Composite physiological signals (RPE × [La] × ΔHRV) | r > 0.6 vs. glycogen depletion; CV < 10 % | Reliable internal sensing of energetic status | Dynamic fueling adjustments improve session quality | Continuous monitoring of RPE, HRV, lactate |
| Control algorithm | Adaptive fueling via CGM-HRV-RPE integration | Δglucose ±1.5 mmol·L⁻¹·h⁻¹, HRV LF/HF ratio normalization | Closed-loop modulation of substrate intake → AMPK-mTORC1 balance | Stable performance output across microcycles | Algorithmic feedback loop; wearable integration |
| Energetic feedback gain | Sensitivity of fueling adjustment to physiological drift | Gain coefficient k_feedback ≈ 0.4–0.6 | Higher gain → faster correction of energy imbalance | ↓Session variability; ↑adaptive efficiency | Regression analysis; signal-response modeling |
| Metabolic readout | p-AMPK^Thr172 amplitude across cycles | ↓Amplitude (−20 %) with maintained output | Reduced stress oscillation → adaptive homeostasis | Efficient substrate use with less molecular noise | Serial biopsies; longitudinal phospho-profiling |
| Computational proxy | Closed-Loop Performance Index (CLPI) = stability × gain | CLPI > +0.5 SD → optimized adaptation | Quantifies efficiency of feedback learning | Predicts performance retention across cycles | Time-series analysis; machine-learning prediction |
| Validation priority | Systems-level training studies | Athlete or advanced trainee cohorts; 6–8-week duration | Tier 2 – longitudinal performance; Tier 3 – real-time sensor adaptation | Demonstrates emergent self-regulation | Controlled trials with integrated wearables |
| Potential confounders | Sensor delay, data noise, motivation, hydration status | Context-dependent; may distort feedback accuracy | Delayed or false feedback → suboptimal control | Blunted adaptation or instability | Signal filtering; algorithm calibration; controlled hydration |
Notes: Closed-loop regulation denotes adaptive adjustment of substrate intake and training load based on real-time feedback. Composite index = RPE × [La] × ΔHRV. CGM – continuous glucose monitoring; HRV – heart-rate variability; LF/HF – low/high-frequency spectral ratio. CLPI = Closed-Loop Performance Index, combining feedback gain and stability metrics. CV – coefficient of variation; SD – standard deviation.
Table 6.
Experimental Validation Model for the Training–Fuel Coupling (TFC) Framework.
| H# | Core construct |
Prediction (summary) |
Mechanistic rationale |
Experimental test (design) |
Primary outcomes / falsification criteria |
|---|---|---|---|---|---|
| H1 | Energetic variability → adaptive efficiency | At same external load, signaling diverges with glycogen state: <350 mmol·kg⁻¹ dw → ↑p-AMPK^Thr172 ↑p-ACC^Ser79 ↑PGC-1α; >500 mmol·kg⁻¹ dw → ↑p-p70S6K^Thr389 ↑4E-BP1^Thr37/46. | Substrate state modulates AMP/ATP and NAD⁺/NADH ratios, shifting control between AMPK–SIRT1–PGC-1α and Rheb–mTORC1 pathways. | Randomized crossover HIIT (8×3 min @ 90% VO₂max) under LOW vs HIGH glycogen; biopsies 0/1/3 h. | Condition × Time effect (↑AMPK, ↓mTORC1 in LOW, p < 0.05); Δ < 0.2 SD = falsified. |
| H2 | Threshold regulation of signaling dominance | Crossing energetic threshold (~300 mmol·kg⁻¹ dw; AMP/ATP > 0.03, NAD⁺/NADH > 2.5) flips signaling polarity (↑AMPK / ↓mTORC1). | Glycogen depletion activates AMPK–TSC2–Raptor cascade; substrate repletion re-engages mTORC1. System behaves as bistable molecular switch. | Strength crossover (5×5 @ 85% 1RM) under LOW vs HIGH glycogen; biopsies 0/1/3 h. | LOW: AMPK↑, mTORC1↓; HIGH: inverse. Trivial Δ < 0.2 SD = falsified. |
| H3 | Oscillatory coupling → dual adaptation | Alternating AMPK-dominant endurance and mTORC1-dominant strength (≈48 h cycle) yields dual enhancement (↑CS +15 %, ↑COX +12 %, ↑CSA +5–8 %). | Periodic metabolic oscillation prevents desensitization, aligning catabolic/anabolic phases to maximize net adaptation. | 8-week intervention: oscillatory (TFC microcycle train-low→lift-fed) vs constant-fuel control. | ΣZ > +0.5 SD = validated; loss of dual gains = falsified. |
| H4 | Closed-loop regulation → feedback optimization | Feedback indices (RPE×[La], ΔHRV, Δglucose ± 1.5 mmol L⁻¹ h⁻¹) predict energetic state (r > 0.6) and enable adaptive fueling that stabilizes performance. | Iterative sensing of metabolic stress drives adaptive homeostasis (↓signal amplitude, ↑efficiency). | 6-week closed-loop (CGM + HRV + RPE) vs fixed schedule; monitor Δ1RM, ΔTT, session variability. | ↑Δ1RM (+3–5 %), ↑ΔTT (+2–3 %), ↓CV session quality (p < 0.05) = validated; AUC ≈ 0.5 = falsified. |
Notes: AMPK – AMP-activated protein kinase; mTORC1 – mechanistic target of rapamycin complex 1; p- denotes phosphorylated residue; LOW/HIGH – glycogen condition (~300 vs >500 mmol·kg⁻¹ dw).
Table 7.
Training–Fuel Coupling (TFC) Decision Matrix — Linking Training Goals, Energetic Context, and Adaptive Outcomes.
Table 7.
Training–Fuel Coupling (TFC) Decision Matrix — Linking Training Goals, Energetic Context, and Adaptive Outcomes.
| Training Goal | Session Type | Energetic Context (Glycogen / Redox) | Feeding Strategy | Dominant Signaling Pathway | Expected Adaptive Outcome | Monitoring / Control Variable | Safety / Practical Notes |
| Aerobic capacity / mitochondrial biogenesis | Prolonged endurance (HIIT, tempo runs, long intervals) | Low glycogen (<350 mmol·kg⁻¹ dw); NAD⁺/NADH > 2.5; AMP/ATP > 0.03 | Train-low: fasted or CHO-depleted; protein early (0–1 h), CHO delayed (2–3 h) | ↑AMPK / ↑SIRT1–PGC-1α | ↑CS, ↑COX, ↑β-HAD; ↑oxidative efficiency | HRV ↓5–10 %, CGM Δglucose < −1 mmol·L⁻¹·h⁻¹ | Avoid chronic depletion; monitor LEA/RED-S risk |
| Strength / hypertrophy | Resistance or mixed-power sessions (5×5, 8–12RM) | High glycogen (>500 mmol·kg⁻¹ dw); NAD⁺/NADH < 1.8 | Lift-fed: CHO 0.5–1.0 g·kg⁻¹ + EAA 0.3 g·kg⁻¹ pre/post | ↑mTORC1 / ↑p70S6K / ↓AMPK | ↑CSA, ↑1RM, ↑protein synthesis | ΔHRV recovery +5–8 %, RPE ≤7/10 | Match caloric intake to workload; avoid overfeeding days off |
| Concurrent / hybrid training | Endurance + resistance within 24–48 h | Alternating low → high glycogen microcycle | Train-low, lift-fed sequencing | Anti-phase AMPK–mTORC1 oscillation | Dual adaptation (↑oxidative + ↑strength) | AOI > 0.7 (phase coherence) | Maintain 24–48 h separation between opposing sessions (≈48 h when both sessions are high-intensity or recovery markers are unfavorable). |
| Metabolic flexibility / body composition | Mixed metabolic circuit, intervals + moderate-load resistance | Moderate glycogen (~400 mmol·kg⁻¹ dw) | Isoenergetic cycling: moderate CHO, high protein | Balanced AMPK-mTOR equilibrium | ↑Fat oxidation, ↑efficiency, ↓mass gain | ESI ≈ 0, EVI moderate | Ensure micronutrient sufficiency |
| Recovery / adaptive rebound | Active recovery, mobility, rest days | Nutrient-rich, low energy stress | Recover-high: CHO 1.0 g·kg⁻¹ + EAA 0.4 g·kg⁻¹ | ↑mTORC1 / ↓AMPK | ↑Protein synthesis, glycogen resynthesis | CLPI > +0.5 SD | Avoid excess fatigue or underfeeding |
| Monitoring-based adjustment | Ongoing (wearable data) | Context-dependent | CGM + HRV + RPE adaptive loop | Balanced oscillation (feedback optimization) | ↑Adaptive stability, ↓performance variability | Δglucose ±1.5 mmol·L⁻¹·h⁻¹; HRV normalized | Calibrate algorithm weekly; sensor lag compensation |
Notes: AMPK – AMP-activated protein kinase; mTORC1 – mechanistic target of rapamycin complex 1; NAD⁺/NADH – redox ratio; HRV – heart rate variability; CGM – continuous glucose monitoring; RPE – rating of perceived exertion; AOI – Adaptive Oscillation Index; ESI – Energetic Stress Index; EVI – Energetic Variability Index; CLPI – Closed-Loop Performance Index; CSA – cross-sectional area; CS – citrate synthase; COX – cytochrome c oxidase; β-HAD – β-hydroxyacyl-CoA dehydrogenase; LEA – low energy availability; RED-S – relative energy deficiency in sport.
Table 8.
Exemplary Microcycles Translating the Training–Fuel Coupling (TFC) Framework into Practice.
Table 8.
Exemplary Microcycles Translating the Training–Fuel Coupling (TFC) Framework into Practice.
| Discipline |
Microcycle Structure (5–7 days) |
Energetic Logic / Feeding Pattern |
Expected Adaptive Focus |
| Endurance (Marathon / Triathlon) | Day 1: Long aerobic (train-low) | Day 2: Rest or technique (recover-high) | Day 3: HIIT (train-moderate) | Day 4: Recovery (feed-high) | Day 5: Tempo or progressive long run (train-low) | Day 6–7: Refuel & taper | Alternating low–high glycogen states (Δ ≈ 200 mmol·kg⁻¹ dw). Post–low sessions: delayed CHO (2–3 h), protein early. Post–high sessions: immediate CHO + EAA. | ↑Mitochondrial biogenesis, ↑oxidative efficiency, ↑metabolic flexibility |
| Team Sports (Football / Basketball) | Day 1: Tactical + small-sided games (train-moderate) | Day 2: Speed–power (lift-fed) | Day 3: Aerobic technical (train-low) | Day 4: Rest / active recovery | Day 5: Match-simulation (feed-high) | Day 6–7: Regeneration | Micro-oscillation of glycogen: technical days ≈350 mmol·kg⁻¹, match days >500 mmol·kg⁻¹. Use sleep-low 1×/week. Maintain protein 1.6–1.8 g·kg⁻¹·day⁻¹. | ↑Game endurance, ↑recovery kinetics, stable anabolic–oxidative balance |
| Strength / Power (Weightlifting / CrossFit) | Day 1: Fasted mobility + AMPK activation (short aerobic) | Day 2: Strength session (lift-fed) | Day 3: Rest or low-intensity conditioning | Day 4: Power + accessory lifts (feed-high) | Day 5: Low-glycogen hypertrophy (train-low) | Day 6: Full refuel + recovery | Day 7: Optional deload | Controlled alternation of AMPK–mTOR phases within week. High-CHO days align with strength sessions; low-CHO days with metabolic conditioning. | ↑Hypertrophy efficiency, ↑substrate turnover, ↓training fatigue |
Notes: CHO – carbohydrate; EAA – essential amino acids; HRV – heart rate variability; Δ – within-week glycogen difference. Glycogen ranges based on train-low literature (250–600 mmol·kg⁻¹ dw). Amplitudes should be adjusted for sex, season, and training phase.
Disclaimer/Publisher’s Note: The statements, opinions and data contained in all publications are solely those of the individual author(s) and contributor(s) and not of MDPI and/or the editor(s). MDPI and/or the editor(s) disclaim responsibility for any injury to people or property resulting from any ideas, methods, instructions or products referred to in the content. |
© 2026 by the authors. Licensee MDPI, Basel, Switzerland. This article is an open access article distributed under the terms and conditions of the Creative Commons Attribution (CC BY) license (http://creativecommons.org/licenses/by/4.0/).
Copyright: This open access article is published under a Creative Commons CC BY 4.0 license, which permit the free download, distribution, and reuse, provided that the author and preprint are cited in any reuse.


