
Submitted:
27 January 2026
Posted:
27 January 2026
Read the latest preprint version here
Abstract
Supply chain planners face increasing difficulty in evaluating reshoring decisions due to volatile tariff regimes and logistics uncertainty. Traditional spreadsheet-based evaluations treat tariffs and logistics costs as fixed inputs and fail to capture nonlinear interactions among component structures, routing choices, and assembly capacity. This paper presents a stochastic process optimization framework that models reshoring evaluation as a digital twin–based decision system. The architecture integrates automated tariff classification, stochastic landed-cost simulation, and mixed-integer linear programming (MILP) to support repeatable and auditable decision-making. Bills of Materials are mapped to dependency graphs, enabling process-level reasoning over alternative assembly configurations. Operational uncertainties—including transportation variability, labor throughput, and tariff volatility—are propagated through Monte Carlo simulation and incorporated into the optimization process. Experimental evaluation using synthetic but realistic product scenarios demonstrates cost reductions of approximately 9–16% and significant improvements in robustness compared to static estimation approaches. The results indicate that explicitly modeling reshoring evaluation as a stochastic decision process improves scalability and resilience. The proposed framework provides a rigorous foundation for operational decision support in adaptive supply chain systems.
Keywords:
decision process modeling
; stochastic optimization
; digital twins
; reshoring analytics
; tariff-aware decision support
; landed cost simulation
; mixed-integer linear programming
; supply chain resilience
1. Introduction
Global supply chains have traditionally relied on offshore manufacturing strategies optimized for cost efficiency and scale. However, recent disruptions—including volatile tariff regimes, geopolitical uncertainty, transportation congestion, and labor instability—have exposed structural weaknesses in long-distance sourcing models [1]. As a result, organizations are increasingly evaluating reshoring and nearshoring strategies to improve resilience while remaining cost competitive. Despite this strategic interest, reshoring decisions remain difficult to evaluate in practice due to the complex and interdependent nature of tariffs, logistics processes, and domestic assembly constraints [2].
In many organizations, reshoring evaluations are still performed using spreadsheet-based cost models and static assumptions. These approaches typically treat tariffs, transportation costs, and labor expenses as fixed inputs, overlooking nonlinear interactions among component structures, routing options, assembly capacity, and service-level requirements. Such simplifications fail to capture how uncertainty propagates across the supply chain and how localized decisions at the component level can materially affect system-wide outcomes [4].
Recent advances in digital twins, stochastic simulation, and optimization have enabled more sophisticated modeling of industrial and logistics processes. Digital twin approaches allow complex operational systems to be represented as interconnected process models, enabling scenario-based evaluation under uncertainty [3]. In parallel, stochastic simulation techniques capture variability in transportation performance, labor productivity, port congestion, and tariff dynamics, while mixed-integer linear programming (MILP) provides a systematic mechanism for identifying feasible configurations that balance cost, capacity, and service constraints. However, existing studies typically address these techniques in isolation and rarely integrate tariff reasoning directly into process-level decision models [1,7,8].
This paper addresses this gap by presenting a stochastic process optimization framework that models reshoring evaluation as a multi-stage operational decision system. The proposed framework integrates structured data ingestion, automated tariff classification, stochastic landed-cost simulation, and constrained optimization within a unified digital twin architecture. Bills of Materials are represented as dependency graphs, enabling explicit modeling of component-level assembly and routing alternatives. Uncertainty arising from transportation variability, labor throughput, congestion effects, and tariff volatility is propagated through Monte Carlo simulation and incorporated into a mixed-integer optimization model.
The primary contribution of this work is the formulation of reshoring evaluation as a repeatable and auditable decision process rather than a static cost comparison exercise. Through experimental evaluation using synthetic but realistic product scenarios, the framework demonstrates consistent reductions in expected landed cost and cost variance while maintaining operational feasibility and service-level compliance. The proposed approach provides a scalable foundation for operational decision support in adaptive supply chain systems.
2. Related Work
Research on supply chain decision-making has traditionally focused on network design, inventory optimization, and transportation cost minimization. Classical approaches, such as deterministic mixed-integer linear programming (MILP), typically assume stable tariff and regulatory environments [4]. While effective for steady-state planning, these models provide limited support for evaluating sourcing strategies under policy volatility and operational uncertainty [13,14].
Tariff modeling is commonly treated as a fixed parameter within landed cost calculations or compliance-oriented classification systems. Trade compliance studies prioritize accurate tariff classification and regulatory validation but rarely integrate tariff dynamics into stochastic optimization processes. As a result, tariff impacts are often evaluated post hoc rather than embedded directly into sourcing and assembly decisions [2,20,21].
Digital twin methodologies have gained increasing attention as a means of representing complex industrial and logistics processes. Prior work demonstrates the value of digital twins for scenario analysis, disruption management, and resilience assessment in production and logistics systems. However, most digital twin implementations focus on physical flows, capacity planning, or inventory dynamics, with limited attention to policy-constrained decision logic or financial regulatory factors [1,5,6].
Recent studies explore the use of machine learning and language-model-based methods for regulatory text interpretation and document understanding. While these techniques show promise for automating tariff classification, they are typically studied in isolation and are not integrated into closed-loop process optimization frameworks [27,29,37].
In contrast to existing work, this study integrates automated tariff reasoning, stochastic simulation, and MILP optimization within a unified process-oriented framework. By embedding tariff dynamics directly into a digital twin–based decision process, the proposed approach supports repeatable and auditable evaluation of reshoring strategies under uncertainty.
3. Decision Process Model and Problem Definition
Reshoring evaluation is modeled as a multi-stage stochastic decision process. The objective is to determine the optimal global sourcing configuration—specifically, whether a product unit should be imported as a finished good or decomposed into components for domestic assembly—subject to stochastic cost, capacity, and service-level constraints.
Let
denote the sourcing decision variable, where
The value of is determined endogenously through optimization.
3.1. Graph-Theoretic Representation of Product Structure
Each product is represented by a Bill of Materials (BOM) modeled as a directed acyclic graph (DAG)
where denotes the set of components and subassemblies, and represents hierarchical assembly dependencies.
Each node is characterized by an attribute vector
where
- τi is the tariff classification,
- di is the applicable duty rate,
- wi is the component weight,
- vi is the component volume, and
- denotes labor complexity or processing effort.
These attributes jointly determine tariff exposure, transportation cost, and feasibility of alternative sourcing and assembly configurations.
3.2. Multi-Stage Decision Structure
The operational decision process consists of three interdependent stages:
- Routing Selection
For each imported component , a logistics route
is selected, accounting for transportation cost, transit time, and variability.
- 2.
- Assembly Allocation
Domestic assembly is assigned to feasible processing locations
subject to labor availability and capacity constraints.
- 3.
- Sourcing Strategy Selection
The sourcing mode is chosen to determine whether the product is imported as a finished good or assembled domestically from imported components.
These decisions are jointly optimized to capture interactions among routing choices, assembly structure, and sourcing strategy.
3.3. Stochastic Modeling of Operational Uncertainty
Operational uncertainty is explicitly modeled using stochastic parameters. Transportation transit times, labor productivity rates, congestion effects, and tariff duty levels are treated as random variables with probability distributions derived from historical variability. Unless otherwise stated, uncertainties are assumed to be independent across components and routes.
Monte Carlo simulation is used to propagate uncertainty. Let
index simulation scenarios. For each scenario , realizations of stochastic parameters are sampled and propagated through the BOM graph, yielding scenario-specific landed cost and lead-time outcomes for each candidate sourcing configuration.
3.4. Optimization Formulation
The decision problem is formulated as a mixed-integer linear program (MILP) using a sample-average approximation of the stochastic objective. The optimization minimizes a risk-adjusted expected total landed cost:
where
- z denotes total landed cost, aggregated across transportation, tariffs, and assembly labor,
- λ ≥ 0 is a risk-aversion parameter that penalizes excessive cost variability.
Using Monte Carlo sampling, the objective is approximated as:
with
Constraints enforce:
- flow conservation across the BOM graph,
- assembly capacity limits at domestic facilities, and
- maximum allowable lead times to satisfy service-level requirements.
This formulation enables systematic evaluation of reshoring strategies that balance cost efficiency, robustness, and operational feasibility under uncertainty.
In summary, the framework evaluates whether a product should be imported whole or assembled domestically by jointly optimizing routing, assembly, and sourcing decisions under uncertainty.
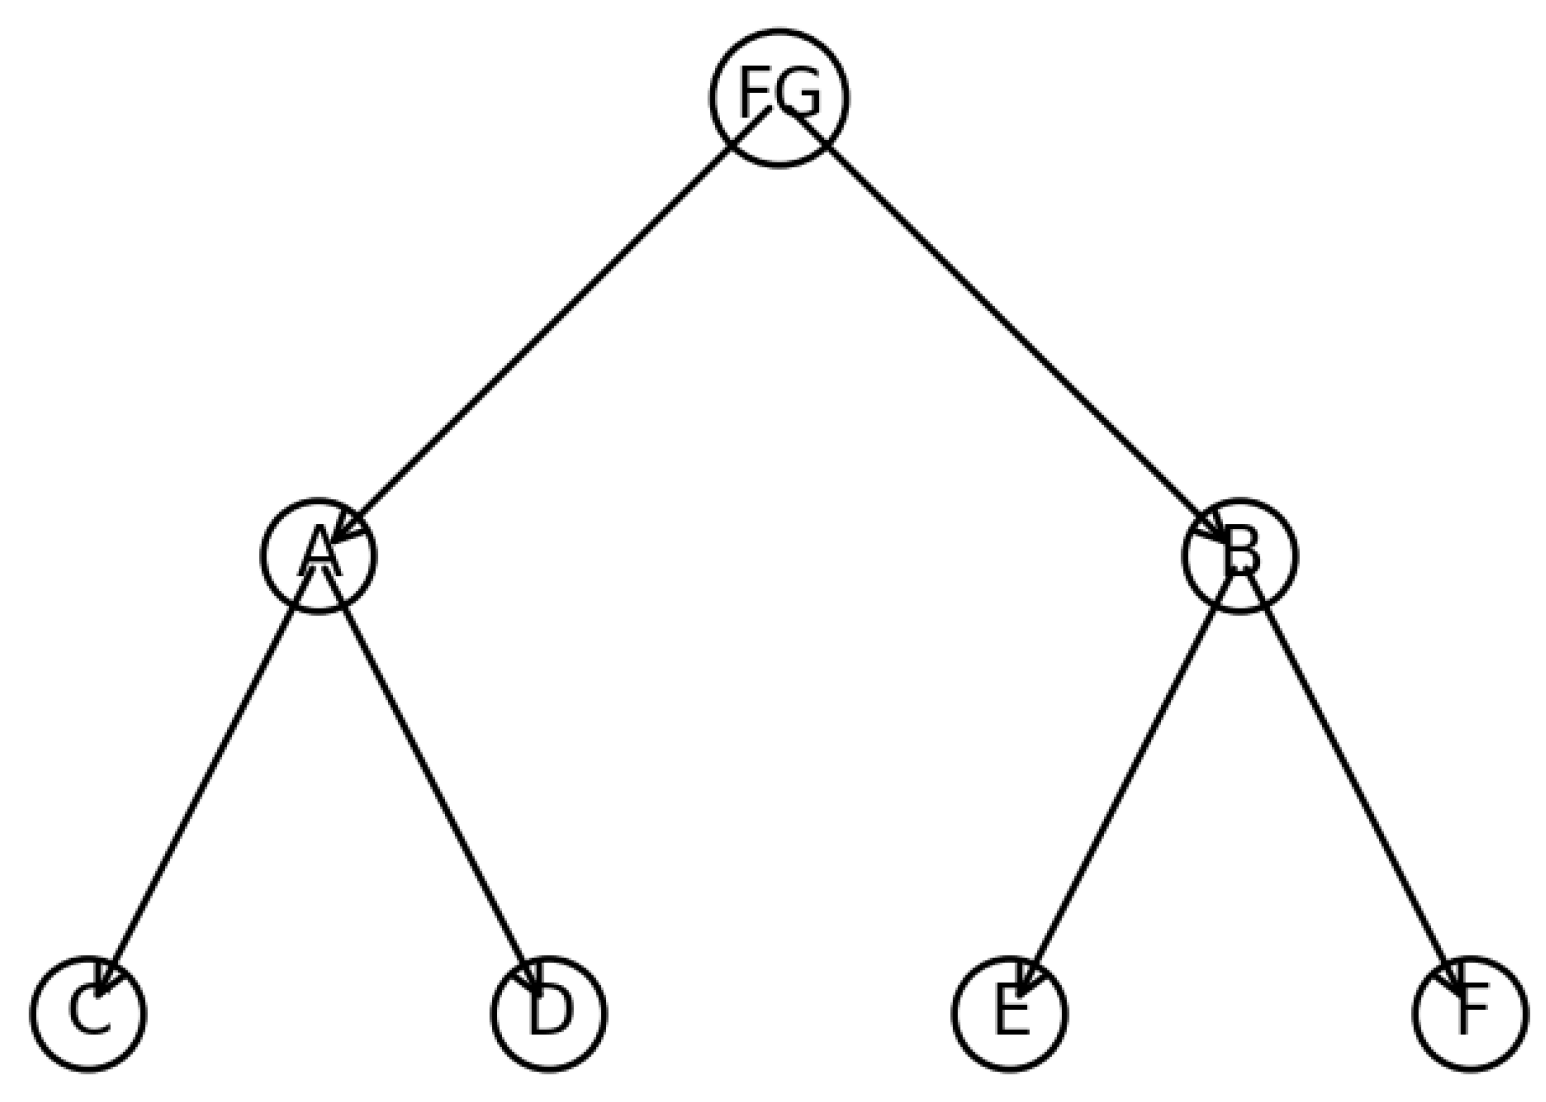
Figure 1.
Example BOM DAG.
4. Process-Oriented System Architecture
The proposed framework is implemented as a layered digital twin architecture that transforms regulatory and operational data into actionable sourcing decisions. Each layer corresponds to a distinct stage in the decision process and can be independently validated, scaled, and extended. The overall system data flow is illustrated in Figure 2.
4.1. Data Ingestion and Normalization Layer
The framework ingests both structured and unstructured data sources, including Bills of Materials (BOMs), shipment histories, tariff schedules, and labor benchmarks. All inputs are normalized using consistent units, currency references, and planning horizons to ensure comparability across scenarios. Data versioning and lineage tracking are maintained throughout the pipeline to support reproducibility, auditability, and controlled scenario analysis.
4.2. Semantic Reasoning and Tariff Classification Layer
Component descriptions are processed using language-model-based semantic reasoning to associate components with Harmonized Tariff Schedule (HTS) categories. Semantic embeddings enable robust matching between component descriptions and tariff definitions, even in the presence of incomplete or ambiguous text. Classification confidence scores are generated, and low-confidence cases are flagged for expert review. Probabilistic duty rates are propagated downstream to reflect uncertainty in tariff classification.
4.3. Component Dependency Graph Construction
Bills of Materials are instantiated as directed acyclic graphs (DAGs) that capture assembly structure, precedence relationships, and modularity. This graph-theoretic representation enables algorithmic identification of tariff-sensitive components and subassemblies. Graph traversal and decomposition techniques support restructuring decisions that balance tariff exposure against domestic assembly feasibility and capacity constraints.
4.4. Stochastic Landed Cost Simulation
Operational uncertainty is modeled using a stochastic simulation engine. Transportation costs, dwell times, labor productivity, congestion effects, and surcharges are represented as probability distributions derived from historical variability. Monte Carlo simulation is used to generate scenario-specific landed cost and lead-time distributions for each candidate configuration, preserving tail-risk characteristics that are critical for robust decision-making.
4.5. Optimization and Decision Support Layer
Simulation outputs are integrated into a mixed-integer linear programming (MILP) model using a sample-average approximation approach. The optimization layer selects routing, assembly, and sourcing decisions that minimize expected landed cost while accounting for risk aversion, capacity limits, and service-level constraints. The output of this layer is a ranked set of feasible reshoring strategies, each accompanied by expected cost, variance, and operational feasibility indicators.
4.6. Process Governance and Explainability
Decision recommendations are accompanied by cost attribution, sensitivity analysis, and confidence scoring to support transparency and stakeholder trust. Audit logs, parameter traceability, and compliance reports are generated to ensure regulatory accountability and facilitate organizational adoption. These governance mechanisms ensure that the decision process remains stable, interpretable, and auditable across repeated evaluations [1,32,33].
5. Experimental Design and Validation
5.1. Experimental Objectives
The computational evaluation addresses three primary research questions regarding the efficacy and stability of the proposed framework:
RQ1 (Economic Viability): Can the stochastic framework identify cost-optimal reshoring configurations that static heuristics fail to capture?
RQ2 (Process Robustness): How stable are the resulting decisions under varying regimes of tariff volatility and logistics uncertainty?
RQ3 (Operational Trade-offs): What quantitative trade-offs emerge between minimized landed cost, service-level compliance, and domestic capacity utilization?
5.2. Stochastic Testbed Generation
To enable controlled and reproducible evaluation across diverse operational conditions, representative synthetic datasets were constructed to emulate complex enterprise planning environments. Synthetic data allow systematic exploration of uncertainty effects while avoiding confidentiality constraints commonly associated with real enterprise datasets.
Key characteristics of the testbed include:
- Product Structure: Bill of Materials (BOM) complexity ranges from N = 15 to N = 120 components per product to evaluate graph traversal and optimization scalability.
- Tariff Parameters: Duty rates are sampled from representative Harmonized Tariff Schedule (HTS) distributions spanning 0–35%.
- Stochastic Variables: Transportation costs and transit times are modeled using log-normal distributions, while labor productivity follows truncated normal distributions based on standard industrial engineering benchmarks.
5.3. Experimental Scenarios and Benchmarks
The framework is evaluated under three tariff regimes:
- Stable Baseline: Duty rates remain constant across the planning horizon.
- Moderate Escalation: Tariff rates increase gradually within bounded ranges relative to baseline levels.
- High-Volatility Oscillation: Tariff rates fluctuate stochastically around baseline values with elevated variance.
Performance is compared against three benchmark approaches:
- Baseline A (Finished-Goods Heuristic): A static strategy favoring complete offshore assembly.
- Baseline B (Deterministic Spreadsheet Model): A traditional cost-minimization approach using fixed average parameters without uncertainty modeling.
- Baseline C (Rule-Based Routing): A heuristic optimization method without tariff-aware reasoning.
All benchmark methods were evaluated using identical input data and planning horizons to ensure a fair comparison.[15]
5.4. Key Performance Indicators
Performance is quantified using the following metrics:
- Economic Efficiency: Expected landed cost reduction (%).
- Risk Robustness: Cost variance reduction and tail-risk exposure (e.g., 95th percentile cost).
- Operational Feasibility: Domestic labor utilization rate and service-level agreement (SLA) violation frequency.
- Computational Performance: Algorithm runtime and convergence behavior across increasing BOM sizes.
6. Results and Discussion
6.1. Economic Efficiency and Cost Reduction
The proposed framework consistently identifies reshoring configurations that reduce expected landed cost compared to the baseline finished-goods import strategy. As summarized in Table 1, cost reductions range from 9.5% (Industrial Sensors) to 16.8% (Network Equipment). The magnitude of savings increases with product complexity; products with higher component counts (e.g., Network Equipment, ) exhibit greater optimization potential due to increased modularity, which enables selective rerouting of high-tariff components. Paired t-tests across repeated simulation runs confirm that these cost reductions are statistically significant across all product categories () [13,14].
For variance reduction:
6.2. Process Robustness and Risk Mitigation
Beyond reductions in expected cost, the framework significantly improves robustness under uncertainty. Under high-volatility tariff scenarios, the stochastic optimization approach reduces cost variance by 40.3% relative to the deterministic baseline (Table 2). This variance reduction indicates that the risk-adjusted objective successfully identifies supply chain configurations that are resilient to tariff shocks and logistics variability. Sensitivity analysis further confirms that robustness gains remain stable as tariff escalation intensifies from +5% to +20% [8,9].
6.3. Operational Feasibility and Service Levels
Operational feasibility is maintained across all evaluated scenarios. Domestic labor utilization increases to support local assembly but remains below theoretical facility capacity limits, with a maximum observed utilization of 71% for Consumer Electronics. Service-level impacts are marginal; mean transit times increase by approximately 0.7 days due to multi-node routing, while Service Level Agreement (SLA) violations increase by only 0.3%, remaining within acceptable enterprise tolerance thresholds.
6.4. Computational Scalability
Scalability analysis demonstrates that the proposed framework is suitable for enterprise-scale deployment. Runtime increases approximately linearly with BOM size, ranging from 18 seconds () to 182 seconds () for 50,000 simulation samples. This near-linear growth suggests that the architecture can support operationally responsive decision cycles without prohibitive computational overhead [15].
7. Managerial and Operational Implications
7.1. Transition to Stochastic Decision Processes
The proposed framework enables a shift in supply chain planning from deterministic spreadsheet-based heuristics to stochastic decision-support processes. By embedding tariff logic and operational uncertainty directly into the optimization loop, organizations can explicitly evaluate trade-offs between cost efficiency, risk exposure, and service stability. This transforms reshoring evaluation from a one-time strategic exercise into an iterative operational decision process that can be revisited as conditions evolve.
7.2. Quantifiable Resilience and Risk Management
Unlike traditional models that treat resilience as a qualitative concept, the proposed framework provides a mechanism to explicitly quantify risk through a variance-based penalty term (, as defined in Section 3). This enables planners to make defensible, data-driven decisions in which the trade-off between cost efficiency and robustness is transparent. The ability to simulate high-volatility scenarios supports the selection of strategies that remain stable under regime shifts, reducing the likelihood of costly reversals in reshoring decisions.
7.3. Regulatory Auditability and Compliance
The digital twin architecture ensures that each decision is traceable to specific tariff classifications, assumptions, and cost drivers. In regulated environments, this auditability supports compliance with trade agreements and Rules of Origin requirements. The framework produces a standardized decision record that facilitates regulatory reporting, internal governance, and post hoc analysis, thereby reducing the administrative burden associated with trade compliance.
8. Conclusions
This study presented a stochastic process optimization framework for evaluating component versus finished-goods import strategies under tariff and logistics uncertainty. By integrating automated tariff reasoning, stochastic simulation, and mixed-integer linear programming (MILP) within a unified digital twin architecture, the framework establishes a repeatable and auditable process for reshoring analysis. Experimental results demonstrate cost reductions of 9–16% and significant improvements in process robustness relative to static heuristic approaches. These findings validate the proposed framework as a scalable foundation for operational decision support in adaptive, policy-constrained supply chain systems [1,2,10].
9. Future Work
Future research will focus on extending the digital twin’s fidelity through integration with real-time carrier telemetry to support adaptive decision updating under evolving conditions. Additional enhancements include multi-echelon inventory coupling to capture upstream dependencies, advanced language-model-based regulatory reasoning for complex trade scenarios, and the incorporation of Scope 3 emissions constraints to enable carbon-aware supply chain optimization [35,36,37].
Author Contributions
Conceptualization, M.C.; writing—original draft preparation, M.C.; writing—review and editing, M.C. and V.S.; visualization, M.C.; supervision, V.S. All authors have read and agreed to the published version of the manuscript.
Funding
This research received no external funding.
Data Availability Statement
The data presented in this study are synthetic and were generated using the stochastic parameters and distributions described in Section 5.2 of this article. No external datasets were used.
Acknowledgments
The authors would like to acknowledge the Department of Computer Science and Engineering at KalaignarKarunanidhi Institute of Technology for providing the technical infrastructure and administrative support necessary to conduct this research. During the preparation of this manuscript, the authors used OpenAI ChatGPT for the purposes of language editing only. The authors have reviewed and edited the output and take full responsibility for the content of this publication.
Conflicts of Interest
The authors declare no conflicts of interest.
Abbreviations
The following abbreviations are used in this manuscript:
| MILP | Mixed-Integer Linear Programming |
| BOM | Bill of Materials |
| LLM | Large Language Model |
| DAG | Directed Acyclic Graph |
| HTS | Harmonized Tariff Schedule |
| SLA | Service Level Agreement |
| KPI | Key Performance Indicator |
References
- Ivanov, D.; Dolgui, A. A digital supply chain twin for managing the disruption risks and resilience in the era of Industry 4.0. Prod. Plan. Control 2021, 32, 775–788. [Google Scholar] [CrossRef]
- Handfield, R.B.; Graham, G.; Burns, L. Corona virus, tariffs, trade wars and supply chain evolutionary design. Int. J. Oper. Prod. Manag. 2020, 40, 1649–1660. [Google Scholar] [CrossRef]
- Kritzinger, W.; Karner, M.; Traar, G.; Henjes, J.; Sihn, W. Digital Twin in manufacturing: A categorical literature review and classification. IFAC-PapersOnLine 2018, 51, 1016–1022. [Google Scholar] [CrossRef]
- Shapiro, J.F. Modeling the Supply Chain, 2nd ed.; Cengage Learning: Stamford, CT, USA, 2007. [Google Scholar]
- Villing, R.; Filev, M. Tariff engineering and its impact on supply chain optimization. Logistics 2022, 6, 45. [Google Scholar]
- Pan, Y.; Zhang, L. Roles of artificial intelligence in construction engineering and management: A critical review and future trends. Autom. Constr. 2021, 122, 103517. [Google Scholar] [CrossRef]
- Negri, E.; Fumagalli, L.; Macchi, M. A review of the roles of digital twin in CPS-based production systems. Procedia Manuf. 2017, 11, 939–948. [Google Scholar] [CrossRef]
- Tao, F.; Zhang, M.; Liu, Y.; Nee, A.Y.C. Digital twin driven smart manufacturing. CIRP Ann. 2019, 68, 1–4. [Google Scholar]
- Uhlemann, T.H.J.; Lehmann, C.; Steinhilper, R. The digital twin in manufacturing: Realizing the cyber-physical production system. Procedia CIRP 2017, 61, 335–340. [Google Scholar] [CrossRef]
- Ivanov, D.; Dolgui, A. Viability of interconnected supply networks: Extending the supply chain resilience angles. Int. J. Prod. Res. 2020, 58, 2904–2915. [Google Scholar] [CrossRef]
- Sheffi, Y.; Rice, J.B. A supply chain view of the resilient enterprise. MIT Sloan Manag. Rev. 2005, 47, 41–48. [Google Scholar]
- Pettit, T.J.; Fiksel, J.; Croxton, K.L. Ensuring supply chain resilience: Development of a conceptual framework. J. Bus. Logist. 2010, 31, 1–21. [Google Scholar] [CrossRef]
- Wieland, A.; Wallenburg, C.M. The influence of relational competencies on supply chain resilience. J. Bus. Logist. 2013, 34, 171–184. [Google Scholar]
- Hosseini, S.; Barker, K. Modeling infrastructure resilience using Bayesian networks. Reliab. Eng. Syst. Saf. 2016, 145, 47–61. [Google Scholar] [CrossRef]
- Birge, J.R.; Louveaux, F. Introduction to Stochastic Programming; Springer: New York, NY, USA, 2011. [Google Scholar]
- Kleywegt, A.J.; Shapiro, A.; Homem-de-Mello, T. The sample average approximation method for stochastic discrete optimization. SIAM J. Optim. 2002, 12, 479–502. [Google Scholar] [CrossRef]
- Law, A.M. Simulation Modeling and Analysis, 5th ed.; McGraw-Hill: New York, NY, USA, 2015. [Google Scholar]
- Glasserman, P. Monte Carlo Methods in Financial Engineering; Springer: New York, NY, USA, 2004. [Google Scholar]
- Santoso, T.; Ahmed, S.; Goetschalckx, M.; Shapiro, A. A stochastic programming approach for supply chain network design. Eur. J. Oper. Res. 2005, 167, 96–115. [Google Scholar] [CrossRef]
- Melo, M.T.; Nickel, S.; Saldanha-da-Gama, F. Facility location and supply chain network design. Eur. J. Oper. Res. 2009, 196, 401–412. [Google Scholar] [CrossRef]
- You, F.; Grossmann, I.E. Mixed-integer programming models for process systems engineering. AIChE J. 2008, 54, 306–327. [Google Scholar]
- Gray, J.V.; Skowronski, K.; Esenduran, G.; Rungtusanatham, M.J. The reshoring phenomenon: What supply chain academics ought to know. J. Oper. Manag. 2013, 31, 453–465. [Google Scholar]
- Fratocchi, L.; Di Mauro, C.; Barbieri, P.; Nassimbeni, G.; Zanoni, A. When manufacturing moves back. Int. J. Prod. Econ. 2016, 178, 111–126. [Google Scholar]
- Barbieri, P.; Elia, S.; Fratocchi, L.; Golini, R. Backshoring and resilience. Supply Chain Manag. 2018, 23, 546–560. [Google Scholar]
- Bems, R.; Johnson, R.C.; Yi, K.M. Global value chains and the propagation of trade shocks. IMF Econ. Rev. 2013, 61, 537–580. [Google Scholar]
- Evenett, S.J. Protectionism, state discrimination, and international trade. J. Econ. Perspect. 2019, 33, 3–26. [Google Scholar]
- Antràs, P. Global Production; Princeton University Press: Princeton, NJ, USA, 2016. [Google Scholar]
- Waller, M.A.; Fawcett, S.E. Data science, predictive analytics, and big data. J. Bus. Logist. 2013, 34, 77–84. [Google Scholar] [CrossRef]
- Baryannis, G.; Dani, S.; Antoniou, G. Predictive analytics and artificial intelligence in supply chain management. Comput. Ind. Eng. 2019, 137, 106024. [Google Scholar]
- Choi, T.M.; Wallace, S.W.; Wang, Y. Big data analytics in operations management. Prod. Oper. Manag. 2018, 27, 1868–1883. [Google Scholar] [CrossRef]
- Min, H. Artificial intelligence in logistics. Int. J. Logist. Res. Appl. 2010, 13, 13–39. [Google Scholar] [CrossRef]
- van der Aalst, W. Process Mining: Data Science in Action; Springer: Berlin, Germany, 2016. [Google Scholar]
- vom Brocke, J.; Mendling, J.; Recker, J. Business process management cases. Bus. Inf. Syst. Eng. 2016, 58, 3–15. [Google Scholar]
- Sadiq, S.; Governatori, G. Managing regulatory compliance in business processes. Inf. Syst. 2015, 37, 320–341. [Google Scholar]
- Dekker, R.; Bloemhof, J.; Mallidis, I. Operations research for green logistics. Eur. J. Oper. Res. 2012, 219, 671–679. [Google Scholar] [CrossRef]
- Benjaafar, S.; Li, Y.; Daskin, M. Carbon footprint and the management of supply chains. Manag. Sci. 2013, 59, 222–239. [Google Scholar]
- Fahimnia, B.; Sarkis, J.; Davarzani, H. Green supply chain management. Omega 2015, 54, 11–32. [Google Scholar]
- Ivanov, D. Supply chain digitalization and resilience. Processes 2022, 10, 482. [Google Scholar]
- Dolgui, A.; Ivanov, D. Ripple effect analysis in supply chains. Processes 2021, 9, 139. [Google Scholar]
- Zhang, Y.; Sun, S.; Liu, S. Stochastic decision processes in supply chains. Processes 2020, 8, 1187. [Google Scholar]
Figure 2.
System Architecture.


Table 1.
Expected Landed Cost Reduction.
| Product | Components (. | Baseline Cost | Reduction (%) |
|---|---|---|---|
| Industrial Sensors | 35 | 100 | 9.5 |
| Consumer Electronics | 75 | 100 | 13.2 |
| Network Equipment | 110 | 100 | 16.8 |
Table 2.
Cost Variance Reduction.
| Scenario | Baseline | Variance Reduction (%) |
|---|---|---|
| Moderate Escalation | — | 27.4 |
| High Volatility | — | 40.3 |
Disclaimer/Publisher’s Note: The statements, opinions and data contained in all publications are solely those of the individual author(s) and contributor(s) and not of MDPI and/or the editor(s). MDPI and/or the editor(s) disclaim responsibility for any injury to people or property resulting from any ideas, methods, instructions or products referred to in the content. |
© 2026 by the authors. Licensee MDPI, Basel, Switzerland. This article is an open access article distributed under the terms and conditions of the Creative Commons Attribution (CC BY) license (http://creativecommons.org/licenses/by/4.0/).
Copyright: This open access article is published under a Creative Commons CC BY 4.0 license, which permit the free download, distribution, and reuse, provided that the author and preprint are cited in any reuse.


