Submitted:
26 January 2026
Posted:
27 January 2026
You are already at the latest version
Abstract
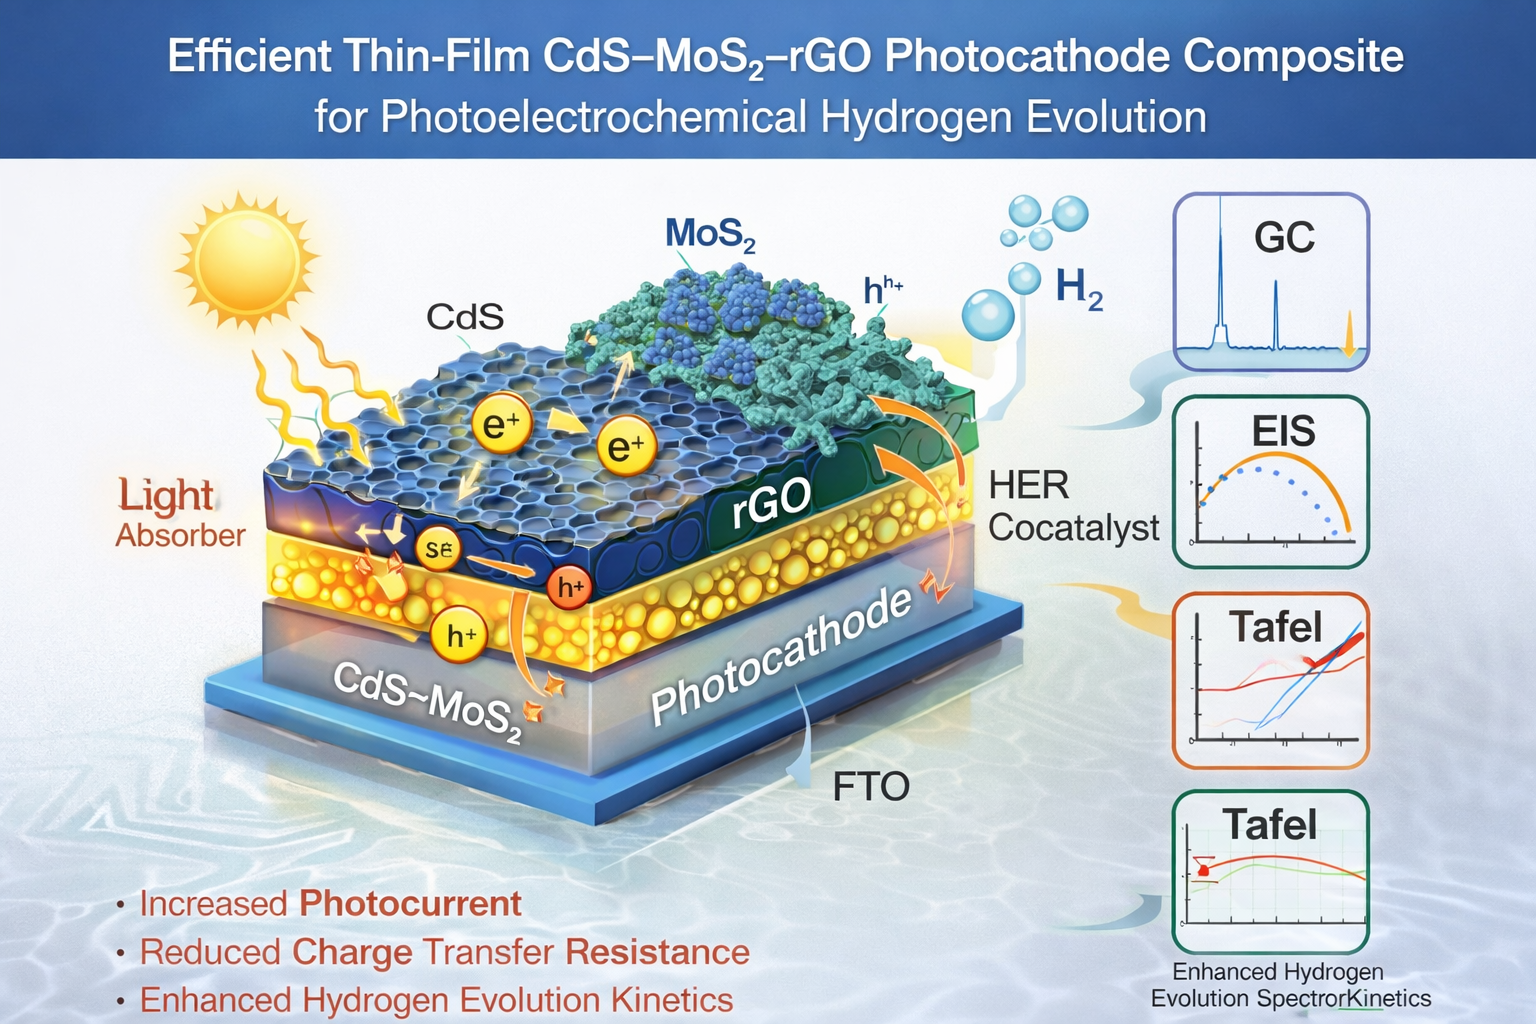
In this work, a CdS–MoS₂–rGO thin-film photocathode was fabricated on FTO substrates via a single-ink drop–spin-coating method followed by annealing under N₂ atmosphere. Among the studied compositions, the film containing 86:9:5 wt% of CdS, MoS₂, and rGO exhibited the best photoelectrochemical performance. Under visible-light illumination from a 50 W halogen lamp (~0.25 sun) in neutral electrolyte, the optimized photocathode achieved a photocurrent density of 0.83 mA cm⁻² at −0.75 V vs Ag/AgCl and retained approximately 96% of its initial current during 60 min of chopped-light operation. Electrochemical impedance spectroscopy revealed a reduced charge-transfer resistance (~120 Ω·cm²), while the Tafel slope decreased to ~85 mV dec⁻¹, indicating enhanced charge transfer and hydrogen evolution kinetics. Hydrogen production was confirmed by gas chromatography, with an evolution rate of ~58.6 μmol h⁻¹. The improved performance is attributed to the synergistic roles of CdS as the light absorber, rGO as an electron-transport network, and MoS₂ as a cocatalyst. These results demonstrate the potential of the CdS–MoS₂–rGO architecture for photoelectrochemical hydrogen evolution under neutral conditions.
Keywords:
photoelecrochemical (PEC)
; hydrogen evolution reaction (HER)
; CdS
; reduced graphene oxide (rGO)
; tri-composite
; tafel plot
1. Introduction
Photoelectrochemical (PEC) hydrogen evolution has attracted considerable attention as a sustainable route for converting solar energy into chemical fuel [1]. An effective PEC photocathode requires suitable band-edge alignment, efficient light absorption, rapid charge transport, and resistance to photocorrosion under aqueous conditions [1,2]. Among visible-light-responsive semiconductors, cadmium sulfide (CdS) has been widely investigated due to its appropriate band gap and sufficiently negative conduction band edge for proton reduction [2,3]. However, pristine CdS often suffers from severe photocorrosion and rapid electron–hole recombination, which limit its long-term stability and practical application [3,4].
Various strategies have been explored to overcome these limitations, including coupling CdS with cocatalysts and conductive supports to improve charge separation and suppress recombination [4,5]. In particular, molybdenum disulfide (MoS₂) has emerged as an attractive non-precious cocatalyst for the hydrogen evolution reaction (HER) [6,7]. The edge sites of MoS₂ provide near-optimal hydrogen adsorption energy, while metallic or defect-rich regions can further enhance electron transfer kinetics [7,8]. Nevertheless, MoS₂ alone exhibits limited light absorption and charge transport capability, necessitating integration with suitable photoabsorbers and conductive scaffolds [8,9].
Reduced graphene oxide (rGO) is frequently employed as a conductive support due to its high electrical conductivity, large surface area, and ability to form percolating networks that facilitate electron transport [10,11]. When combined with semiconductors, rGO can act as an efficient electron extraction layer, reducing charge accumulation and mitigating photocorrosion [11,12]. The incorporation of rGO into composite photocathodes has therefore been shown to improve both photoelectrochemical activity and operational stability [12,13].
In this context, constructing a ternary composite that integrates CdS as the light absorber, rGO as the electron transport network, and MoS₂ as the HER cocatalyst represents a rational approach to enhance PEC hydrogen evolution [9,13,14]. Such a configuration is expected to promote vectorial charge transfer, where photogenerated electrons are extracted from CdS, transported through rGO, and consumed at MoS₂ catalytic sites [14,15]. At the same time, the presence of rGO and MoS₂ can suppress photocorrosion of CdS by alleviating interfacial charge accumulation [12,15]. Recent studies have demonstrated that CdS-based photocathodes can achieve enhanced hydrogen evolution performance when coupled with suitable cocatalysts and conductive supports. In particular, MoS₂ has been widely reported as an efficient and earth-abundant cocatalyst for proton reduction, while reduced graphene oxide plays a key role in facilitating charge transport and suppressing recombination. Building on these findings, the present work explores a CdS–MoS₂–rGO composite system to improve photoelectrochemical activity and stability under neutral pH conditions [2,3,4].
In the present work, a CdS–MoS₂–rGO thin-film photocathode was fabricated using a simple solution-based drop–spin-coating method followed by thermal treatment under nitrogen atmosphere. The photoelectrochemical performance of the ternary system was systematically compared with binary and single-component control films under neutral pH conditions. Special attention was given to charge-transfer kinetics, interfacial properties, and operational stability. The results provide insight into the synergistic roles of each component and demonstrate the potential of the CdS–MoS₂–rGO architecture for PEC hydrogen evolution in mild aqueous environments.
2. Materials and Methods
All chemicals were of analytical grade and used without further purification. Natural graphite flakes, potassium permanganate (KMnO₄), sulfuric acid (H₂SO₄), hydrochloric acid (HCl), hydrogen peroxide (H₂O₂, 30%), cadmium nitrate tetrahydrate (Cd(NO₃)₂·4H₂O), sodium molybdate dihydrate (Na₂MoO₄·2H₂O), thiourea, ethanol, and aqueous ammonia (25–28 wt%) were purchased from commercial suppliers such as Sigma-Aldrich and Thermo Fisher Scientific. Fluorine-doped tin oxide (FTO, 15 Ω sq⁻¹) glass substrates were cut into 2 × 2 cm² pieces and used as conductive supports.
2.1. Preparation of Graphene Oxide (GO)
Graphene oxide (GO) was prepared using a modified Hummers method reported in the literature [1,2]. In a typical procedure, graphite flakes were dispersed in concentrated H₂SO₄ under continuous stirring while maintaining the temperature below 10 °C. KMnO₄ was gradually added to the suspension, followed by controlled heating to 35–45 °C and stirring for 2 h. The reaction mixture was then cooled and carefully diluted with ice–water, and the reaction was quenched by the slow addition of H₂O₂ until a bright-yellow suspension was obtained. The resulting product was washed repeatedly with dilute HCl and deionized water until near-neutral pH was reached. The final GO dispersion was obtained by sonication and centrifugation, yielding a stable aqueous suspension (~3.5–4 mg mL⁻¹).
2.2. Preparation of FTO Substrates
Prior to film deposition, FTO substrates were sequentially cleaned by ultrasonication in acetone, isopropanol, and deionized water for 10 min each. The substrates were dried under nitrogen flow and subsequently treated with UV–ozone for 15 min to enhance surface wettability. A brief plasma cleaning step was applied to obtain a hydrophilic surface suitable for uniform thin-film deposition.
2.3. Preparation of CdS–MoS₂–rGO Composite Ink
The composite precursor ink was prepared by dissolving calculated amounts of Cd(NO₃)₂·4H₂O, Na₂MoO₄·2H₂O, and thiourea in deionized water under stirring until a clear solution was obtained. The quantities listed in Table 1 were calculated based on the target wt% ratios of CdS, MoS₂, and rGO at a fixed total solid loading.The pH of the solution was adjusted to 10.2 using aqueous ammonia, and the mixture was aged for 15 min to form metal–thiourea complexes. Thiourea was used in tenfold molar excess relative to the total metal content to ensure complete sulfurization during thermal treatment [3,4]. Ethanol was then added to obtain an ethanol–water co-solvent ratio of 85:15 (v/v). A measured volume of GO dispersion was introduced to achieve the desired rGO weight percentage in the final composite. A trace amount (0.01–0.03 wt%) of poly(vinylidene fluoride) (PVDF) was added as a binder to improve film adhesion. The final ink was sonicated for 30 min to ensure homogeneity(see table one).
The four compositions investigated in this work were selected to systematically evaluate the effect of varying MoS₂ and rGO contents while maintaining CdS as the primary light absorber. Increasing MoS₂ content provides additional catalytic edge sites for hydrogen evolution, whereas rGO enhances charge transport and suppresses recombination. By adjusting the relative proportions of these components, the compositions allow identification of an optimal balance between light absorption, electron transport, and catalytic activity. This approach enables meaningful comparison of structure–performance relationships within the ternary system. Pure CdS and pure MoS₂ films were experimentally attempted on FTO substrates; however, both exhibited poor mechanical stability and irreproducible photoelectrochemical behavior due to delamination under operating conditions. Therefore, rGO-supported binary films were employed as reliable and stable control samples for comparative analysis.
2.4. Film Deposition and Thermal Treatment
The composite ink was deposited onto pretreated FTO substrates using a drop–spin-coating technique. Each film was formed by three successive coating cycles at 3000 rpm for 60 s, with intermediate soft-baking at 110–120 °C to remove residual solvent. After the final coating, the films were annealed under flowing nitrogen using a stepwise heating program (90–120 °C, 160 °C, and 210–230 °C) to convert the metal–thiourea complexes into crystalline CdS and MoS₂ and to reduce GO to rGO [3,4,5].
2.5. Characterization Techniques
X-ray diffraction (XRD) patterns were recorded using Cu Kα radiation (λ = 1.5406 Å) to identify crystalline phases. Surface morphology was examined by field-emission scanning electron microscopy (FE-SEM). X-ray photoelectron spectroscopy (XPS) was performed to analyze surface chemical states. UV–visible absorption spectra were collected using a UV–Vis spectrophotometer in the range of 400–800 nm. Film thickness was measured using a stylus profilometer, and electrical conductivity was determined by a four-point probe method.
2.6. Photoelectrochemical Measurements
Photoelectrochemical measurements were carried out in a three-electrode configuration using a quartz cell. The CdS–MoS₂–rGO/FTO film served as the working electrode, a platinum mesh was used as the counter electrode, and an Ag/AgCl (3 M KCl) electrode was employed as the reference electrode. The electrolyte consisted of 0.5 M Na₂SO₄ adjusted to pH 7.0. Prior to measurements, the electrolyte was purged with nitrogen for 30 min. Illumination was provided by a 50 W halogen lamp corresponding to approximately 0.25 sun intensity. Linear sweep voltammetry, chronoamperometry, and electrochemical impedance spectroscopy were performed under dark and illuminated conditions. Hydrogen evolution was quantified using gas chromatography.component in X 10 mL ink, (1.2 mg mL⁻¹), EtOH:H₂O 85:15 v/v.
† Thiourea amount corresponds to tenfold molar excess relative to total metal content.
Aliquots of CdS-MoS2 solution were add to absolute EtOH yielding ethanol:water co-solvent ratio of 85:15 (v/v). in order to control thickness limitation and suppress cracking through the coating films on FTO glass across three coats, the total solid loading was set up to (1.0-1.2 mg mL-1). Then the ethanoic GO dispersion was added to obtain ((from 1 to 5 depends to film control) wt % GO) in final composite; typically, (6-10 µL) ink sufficed to thin film (modified by coat count). Trace of (0.01 -0.03 wt%) amount of poly(vinylidene fluoride) (PVDF) binder was to improve film adhesion on the FTO glass substrate. (relative to projected film composite) was add and the mixture sonicated to 30 min to obtain homogenous ink[5,11,12].
2.4. CdS-MoS2-rGO Film and Other Control Films Deposition (Three Thin Coats) and Thermal Conversion
Finally, the composite ink was drop-cast onto FTO slide and immediately spun-coated three times. Each coat at 3000 rmp for 60 and then soft-baked at (110-120) °C to remove solvent and setting binder prior to the next application. After the third the slide’s film was annealed in flowing of N2 gas films were annealed in flowing N₂ according to procedures; from 90-120 °C (10 min.) → 160 °C (10 min ) → 210-230 °C (45 min) (ramp≈ °C min-1). The above steps reduce GO→ rGO, covert CdS-thiourea complexes to CdS) and form catalytically active MoS2 while minimizing oxidation therefore annealing in air is not recommended[13,14,15].
2.5. Measurement Techniques; X-Ray Powered Diffraction (XRD)
The XRD of CdS-MoS2-rGO, and other control samples were carried out on GBC MMA XRD at wavelength of 1.54 Å while the supplied voltage and current were kept at -40 kV, 25 mA respectively. Scanning Electron Microscope (SEM); The sample’s surface morphology examined via JEOL-7500F field emission. The procedure operated at 5 kV and 8 mm working distance. X-ray photoelectron spectroscopy (XPS) it was performed on PHI660 using a monochromatic Mg Kα X-ray was used as a beam source. The survey scan was 200 eV pass energy with high-resolution regions on (C 1S, O 1s, Cd 3d, S 2p, Mo 3d). UV-Vis spectrum recorded by UV-1800 SHIMADZU in range (400 -800) nm. Film thickness and conductivity; thickness measurement was done through a Vccco Dektak 150 profilometer while conductivity measured via four points probes (Jandel Engineering Ltd, UK).
2.6. Photoelectrochemical Measurement
For (PEC) experiment; A quartz cell (5 x 5 x 5 cm) was fully-closed and placed inside closed box as comprised to faraday cage. was placed inside a closed cabinet that comprised a Faraday cage. A conventional three-electrode photoelectrochemical cell was used, consisting of the CdS–MoS₂–rGO/FTO working electrode, a platinum mesh counter electrode, and an Ag/AgCl reference electrode..The prepared thin film was used as working electrode (WE) after pasted with copper wire at the top edge of FTO-Coated glass by silver glue. Then Epoxy-resin was covered the all age of FTO –film including pasted area. Pt- Mesh (1 x 2 cm) was acted as counter electrode(CE). While Ag/AgCl with aqueous salt bridge (contained KCl, 3M) performed as references electrode(RE)., 0.5 M Na2SO4 adjusted to pH 7.0 by phosphate buffered. The neutral electrolyte was previously bubbled with N2 gas for 30 min before each experiment. The electrolyte was bubbled with N2 gas for 30 min before each experiment. The cyclic voltammetry (CV), chronoamperograms and EIS were tested with and without light illumination. I.R bandpass filter (315-710 nm) was placed at 1.5 cm after the light source. Sun light simulator of (50 watts,0.25 sun) was used as source light Which it simulated 100 mW cm⁻². For more details, LSV were recorded with and without illumination at rage of (0.0 -1.25) V vs Ag/AgCl (3 M KCl) with scan rate 5 mVs-. More negative potential ≈ −1.30 V vs Ag/AgCl could resulting in photocorrosion CdS in containing film[16]. The experiments of Chronoamperograms; The measurements performed also with, and without illumination at potential of -0.75 V vs Ag/AgCl with chopped-light each two min. for 60 min. Additional potentials tests carried out at more negative bias range ( -0.8 - -0.95) V to obtain more photocurrent efficiency[16]. In some experiments hydrogen evolution gas were connected GC for H2 quantification where Faradic efficiency was calculated. EIS was carried out under illumination at external bias of -0.82 vs Ag/AgCl at frequencies rage of (10-200) KHz. EIS model EC-Lab V10.44 and Z-View 3.5C software were utilized to collect data, spectrum and fitting respectively[17]
3. Results and Discussion
3.1. Linear Sweep Voltammetry (LSV) and Photocurrent Density
Figure S1 displayed (LSV) of CdS-rGO-MoS2 at different ratios as well as other control films according Figure 1 calculations. While pure CdS and pure MoS₂ films prepared on FTO were found to be mechanically unstable under PEC conditions, exhibiting delamination and irreproducible current responses; therefore, rGO-supported binary films were employed as reliable control electrodes.Table 2 showed the outcomes results of LSV. As can be seen from table 2 and Figure 1: under the dark state all under dark conditions, all working electrode’s film show only limited electrochemical current densities with more negative potential. However, the ternary film CdS-MoS2 –rGO showed slight kinetic advantage in the dark current densities. It approximately increases from (193-209) µA cm⁻² for film from a-d (86:9:5 CadS; MoS2; rGO). And the onset potential moved from -0.68(a) to -0.64 V (d). In contrast rGO control film remains has lowest current density (~30 µA cm⁻²). Other control films Cntr.2 and contr.3 showed higher current densities reached (150 and 160 ) µA cm⁻² respectively with more negative potential than ternary film.
Cathodic current densities are plotted as negative values following the conventional representation for photocathodes, where hydrogen evolution occurs under reductive bias..Under light illumination, the photocurrent density of ternary electrodes increased by 516, 561, and 627 µA cm⁻² for a-c respectively. Then IT reached the maximum of 836 µA cm⁻² for d. relative to other controls d-film is markedly superior. It higher rGO by 8.72 times, and higher MoS2-rGO and CdS-rGO by 4.1 and 3.0 times respectively under identical conditions. These data demonstrate that light when light be absorbed by CdS, it not yes sufficient for HER. Therefore, the presence of electrons transport- accelerator along rGO network and provided reaction eges csites at MoS₂ are essential to sustain the HER centers[18,19]. In addition, illumination shifted the onset potential to less negative values lowering the HER overpotential. For example, the onset optional moved from -0.68 → 0.54 V in a-film, -0.66→ -0.52 in b-film, -0.65→ 0.52 V in c-film and -0.64 → -0.49 V in d-film. d –film (86:9:5) was sufficient to drive rapid extraction and in-plane conduction, MoS₂ (~9 wt%) provides abundant edge sites without excessive shading, while CdS remains main light absorber. As we tried further increase rGO in rGO/MoS₂ or leads to induce electronic traps or parasitic absorption[20].
3.2. Chronoamperometric Investigations
Next step was to investigate chonoamperometry of CdS-MoS2-rGO photocathode film; under bias of -0.75 vs Ag/AgCl, and chopped light each 5 min. for 1 h. as can be showed in Figure 1 When the light was switched on d-Film (CdS–MoS₂–rGO) showed highest and most stable cathodic photocurrent density. delivered the highest and most stable cathodic photocurrent density at ≈ −0.78 mA cm⁻², dark baseline current reached near −0.22 mA cm⁻². The on/off contrast (ΔJ) was around (−0.56 mA cm⁻²). which it exceeds all other controls (see Table 3). For example, the cathodic current of Cntr.1 showed very limited substantial current traces even in the light. In Cntr.3 control film the current was increased from 44µA to 184µA when the light was switched meaning the light boost PEC system by 144 µA. in Cntr.2 the light enhanced the system by 467 µA when raised the current from (72 to 539) µA. During over 60 min of PEC operation, d-film only lost about 4% of its photocatalyst efficiency of its initial light on current. Which made it favorable film based on CdS photocathodes under long-continuous operation. Mechanistically, the superior performance of d-film related to complementary function of each continent; CdS nanoparticle providing strong light adsorption, MoS2 supplying sufficient active sites for HER and enhancing low-resistance way for photogenerated electrons.
3.3. UV-Visible and X-Ray Diffraction (XRD) Studies
Figure S.2 UV-Vis-spectrum of d-film(CdS-MoS2-rGO), Cntr.2 (CdS-rGO), Cntr.3(MoS2) and Cntr.1 rGO Among all films absorptions, d-film (CdS–MoS₂–rGO) showed highest and broadest absorption at visible range which it consistent within combined contributions; of direct-gap absorber (CdS), transmission excitonic of MoS₂ layers, and the broadband of rGO. D-film showed suitable absorption range till ≈675 nm[21]. While Cntr.2(CdS–rGO) spectrum remain below d-film curve absorbance. Which it reflected the absence of; MoS₂ excitonic features and the reduced strength of oscillator upon partial rGO dilution[22]. The Cntr.3 (MoS₂–rGO) spectrum displays the characteristic MoS₂ excitonic resonances at range of 600–700 nm region[23]. Cntr.1 (rGO) provided broadband background which enhances light harvesting. Especially when it combined with semiconductors like CdS. The ternary d-film showed higher optical density at (A₄₅₀, A₅₅₀, A₆₅₀) than any other controls. Which it indicated the improvement of solar-light harvesting across blue–green regions. Thus, the optical absorbance were follow the ordered-Film > Cntr.2 ≳ Cntr.3 > rGO mirrors the photocurrent hierarchy observed. The rGO film exhibits single broad (002) peaks at 24.8° which indicated that graphene oxide fully reduced to rGO. Another weak peak at 2θ ≈ 43–45° is assigned to the (100) indicated modest of hexagonal in-plane order rGO[24]. In control Cntr.2 (CdS-rGO) displayed peaks at 2θ ≈ 24.8° (100), 26.5° (002), 28.2° (101), 36.7° (102), 43.9° (110), 47.8° (103), and 51.8° (112), related to hexagonal CdS. Cntr.3 (MoS2-rGO) showed dominant 2H-MoS₂ (002) peaks at ~14.4° (002). The optical absorption bandgap behavior of the prepared samples was evaluated using UV–Vis spectroscopy according to Tauc method, as shown in the Supplementary Information (S.3)and summarized in table (S.4). in more details, the CdS–rGO film showed a direct bandgap of 2.26 eV, which it is significantly agreement with previously reported values for CdS-based materials [25]. However, when MoS₂ and rGO are introduced, the band gap of the CdS–MoS₂–rGO composite slightly decreases to around 2.22 eV[26]. Such a change is likely due to interactions of CdS/MoS₂ interface film that improved charge transport through the rGO framework. For comparison purpose, the MoS₂–rGO control sample shows an indirect band gap of approximately 1.48 eV, consistent with multilayer MoS₂. This behavior is observed usually in hybrid CdS/MoS₂ systems due to attributed to interfacial electronic interactions. while no clear band-gap edge can be identified for rGO due to its semi-metallic nature[27].
Figure 2.
Powder X-ray diffraction (XRD) of Cntr.1 (rGO), Cntr.2(CdS-rGO),Cntr.3 (MoS2-rGO) and d-(CdS-MoS2-rGO) film.
Figure 2.
Powder X-ray diffraction (XRD) of Cntr.1 (rGO), Cntr.2(CdS-rGO),Cntr.3 (MoS2-rGO) and d-(CdS-MoS2-rGO) film.
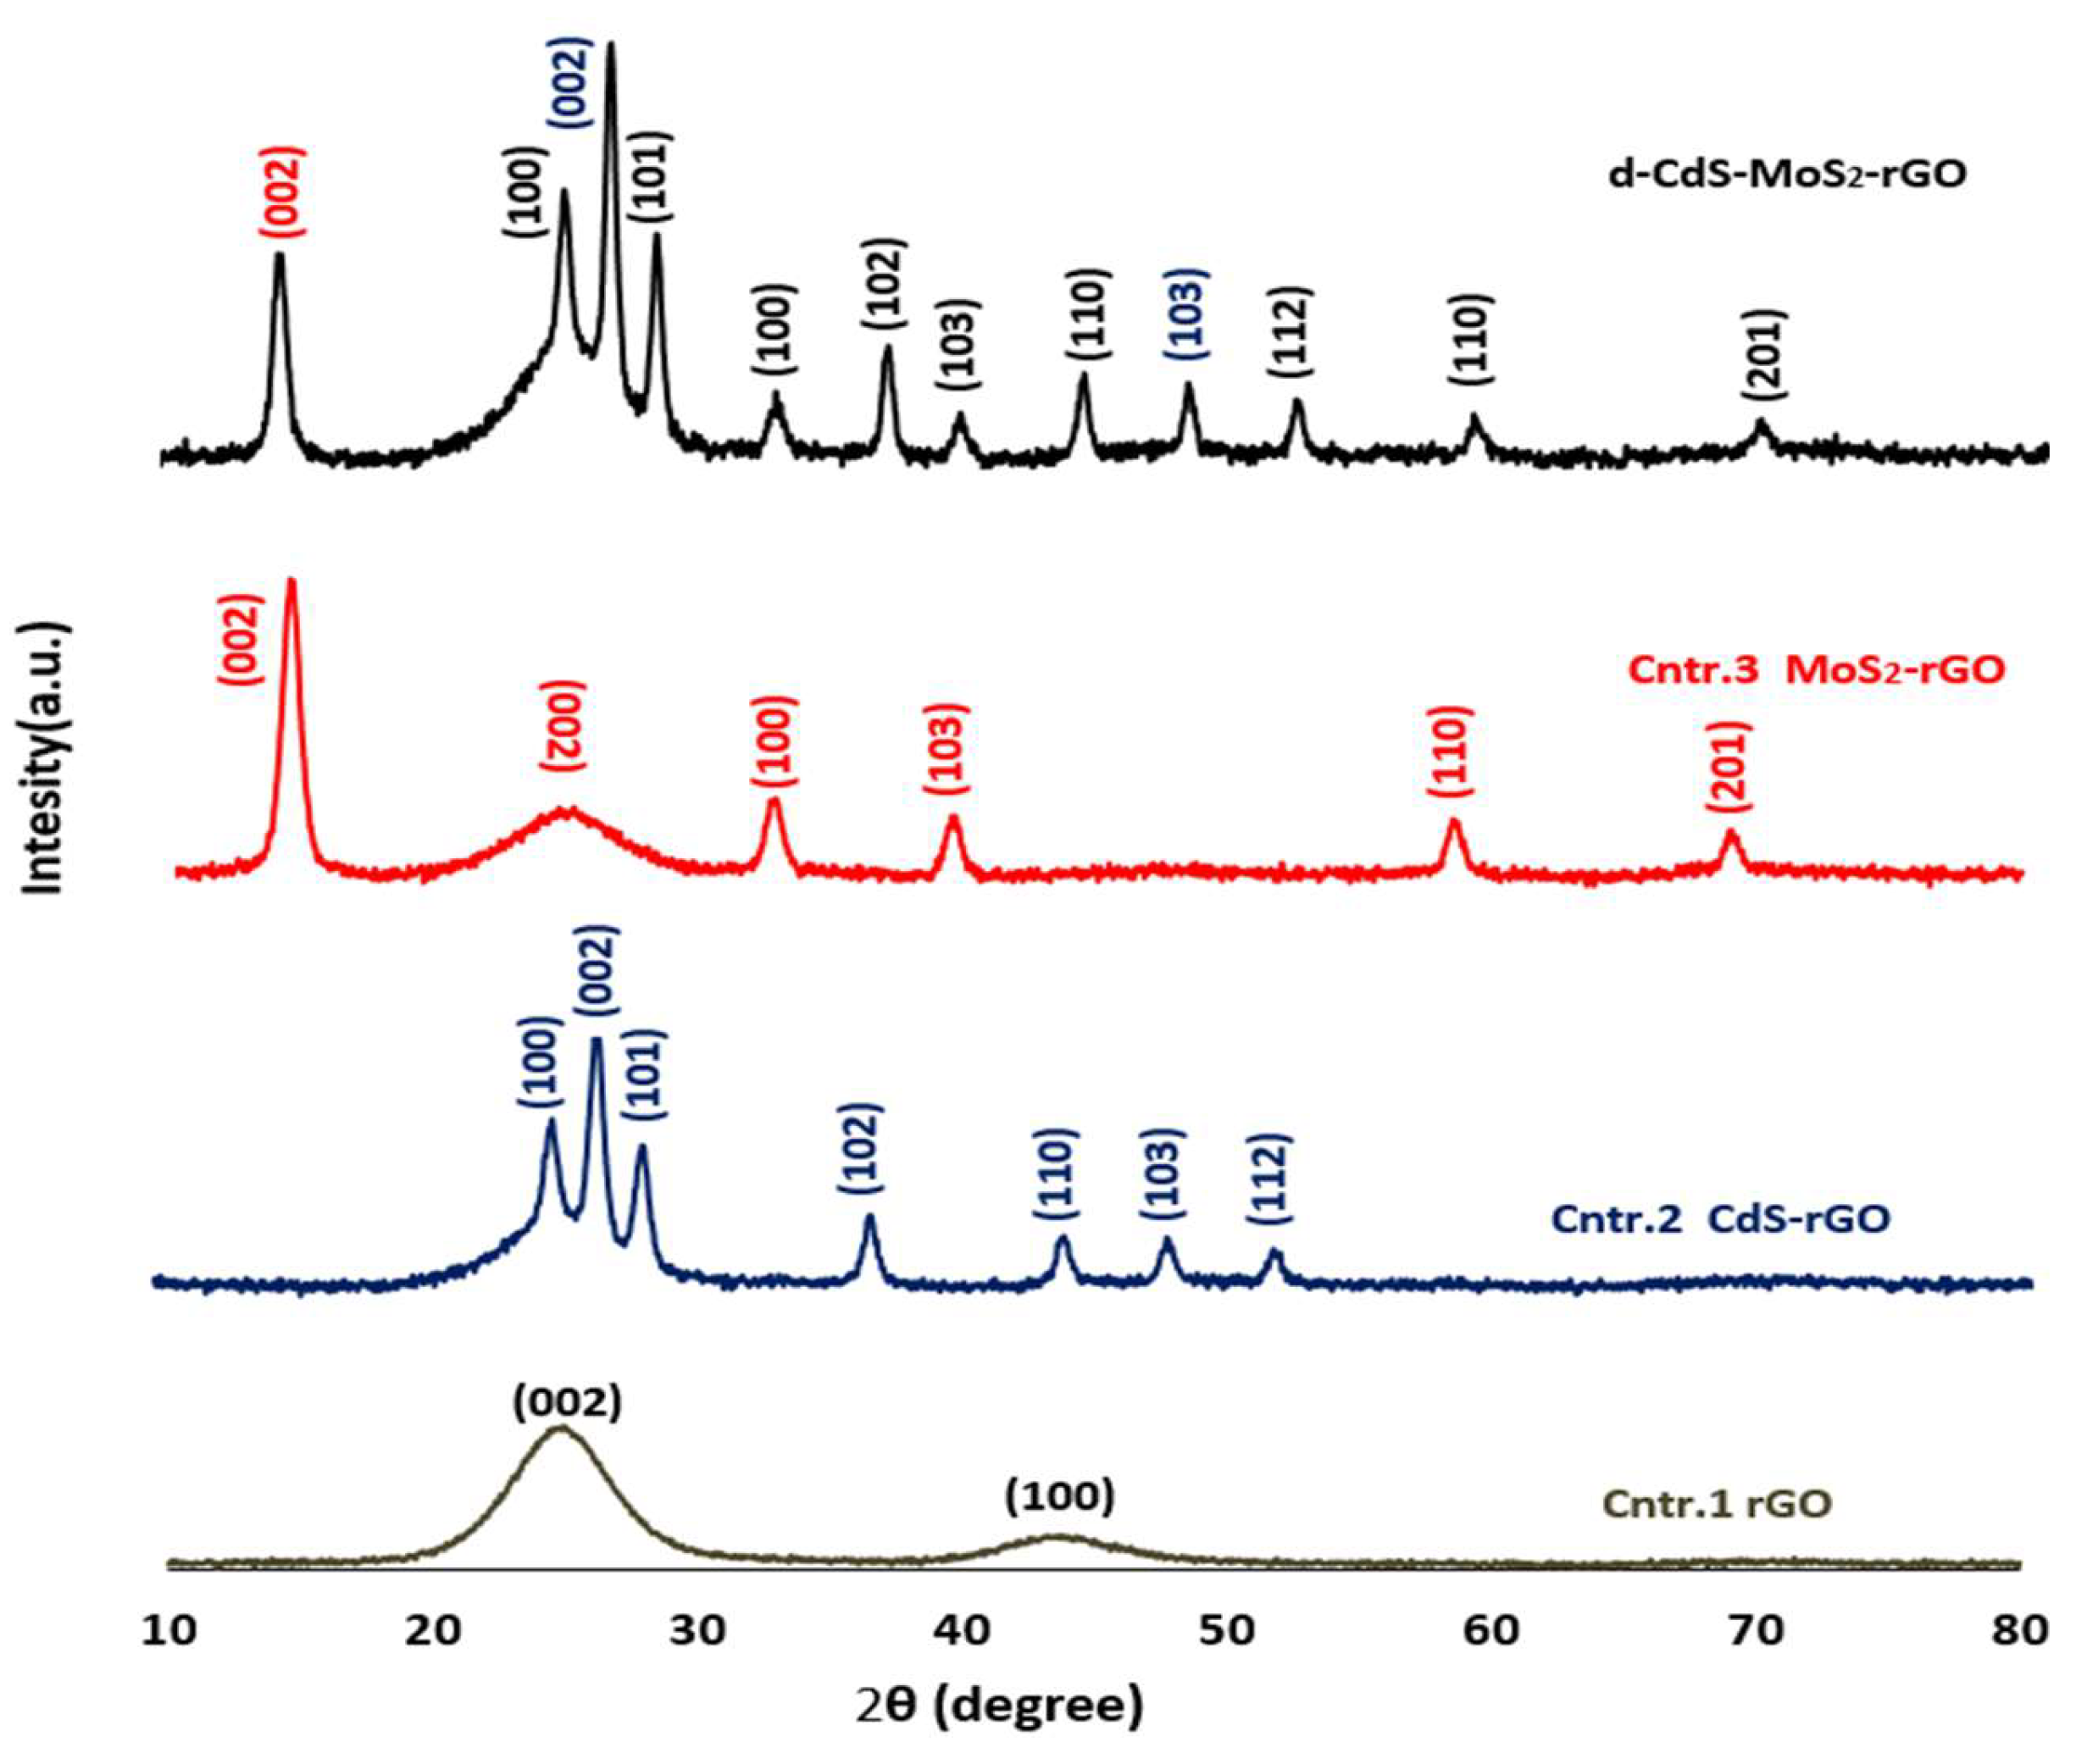
accompanied with weak peaks at ~32.7°(100) , ~39.5 (103) and 58.5° (110). In addition rGO peak appeared at 2θ ≈ 24.8° (002). However, the ternary d-(CdS-MoS2-rGO) Film contains reflections peaks of both CdS and MoS₂ on top of the rGO background. Which confirmed the successful co-assembly without additional crystalline peaks.
3.4. SEM Measurement and Surface Morphology
Figure 3 shows the SEM images of a) rGO , b) rGO-CdS , c) rGO-MoS2 and d) rGO-CdS-MoS2 films rGO film has wrinkled sheets which the corrugation produced inter sheets with high roughness factors which resulting in increased the electrochemically of accessible area, prepare edge-defect site for heterogeneous nucleation, and creating continuous sp²-carbon network for lateral electrons transport. In rGO–CdS film CdS nanoparticles uniformly decorated rGO scaffold. The high density of nucleation centers on rGO can maintain the electrolyte access, reduce light-blocking of the carbon network, and provide numerous CdS/rGO hetero-interfaces resulting in facilitate electron transfer from photo-excited CdS into the conductive rGO. While in rGO–MoS₂ distinct flower reosettes can be observed at size of ~150–300 nm. which resulted in; providing edge-rich morphology that useful for HER activities. with clear inter-rosette spacing that limits restacking. This anisotropic, edge-rich morphology is advantageous for HER. While unsaturated S-edge sites dominate the exposed area. In addition, rGO backbone provided an electron sink and mitigates charge buildup
3.5. X-Ray Photoelectron Spectroscopy
As can be seen in Figure 4 a) C 1s — rGO envelope showed peaks at (284.7, 285.5, 286.5, 287.6, (288.9 and 290.8) eV which contributed to Sp3(in C-C), Sp2(C=C), C-O, C=O, C-C=O and π-π* respectively [29]. In b) O 1s — rGO a three components are observed at (531.4, 532.6 and 534.3) eV belong to C=O, C-O and C-C=O respectively [25].In c) Cd 3d- CdS XPS a clean Cd+2 doubled peaks at 405 and 411.7 eV which assign to Cd 3d5/2 and Cd 3d3/2 respectively [30].In d) S 2p-CdS envelope it was observed two peaks at (161.6-162.8)eVand (163.6-163.9) eV relate a weak S⁰/S–S shoulder S 2p-CdS and minor SOx due to its brief ambient exposure [31].In e) Mo-3d it was noted a doubled peaks at (229.5-232.7)eV due to electron configuration of Mo+4 with small low shoulder around 228.6 eV contributed to 1T-like/reduced Mo at S-vacancies. f) The S 2s –MoS2 XPS spectra showed clean doubled cites at (162.0-163.2) eV with small widths [32]. 162.8) eV and (163.6-163.9) eV relate a weak S⁰/S–S shoulder S 2p-CdS and minor SOx due to its brief ambient exposure [31].In e) Mo-3d it was noted a doubled peaks at (229.5-232.7)eV due to electron configuration of Mo+4 with small low shoulder around 228.6 eV contributed to 1T-like/reduced Mo at S-vacancies. f) The S 2s –MoS2 XPS spectra showed clean doubled cites at (162.0-163.2) eV with small widths [28]. In overall, the XPS investigation supports the efficient photo generated electron extraction from CdS into rGO and rapid delivery to MoS2 edge sites, enhancing HER. XPS analysis was focused on the composite films to probe interfacial chemical states relevant to charge transfer, while reference-material XPS measurements are reserved for future detailed studies.
Figure 4.
XPS spectra of CdS-MoS2-rGO film; a) C 1s and b) O1s related to rGO. C) and d) represent Cd-3d and S 2p-CdS respectively. While e and f represent Mo-3d and S 2p (MoS2) resp.
Figure 4.
XPS spectra of CdS-MoS2-rGO film; a) C 1s and b) O1s related to rGO. C) and d) represent Cd-3d and S 2p-CdS respectively. While e and f represent Mo-3d and S 2p (MoS2) resp.
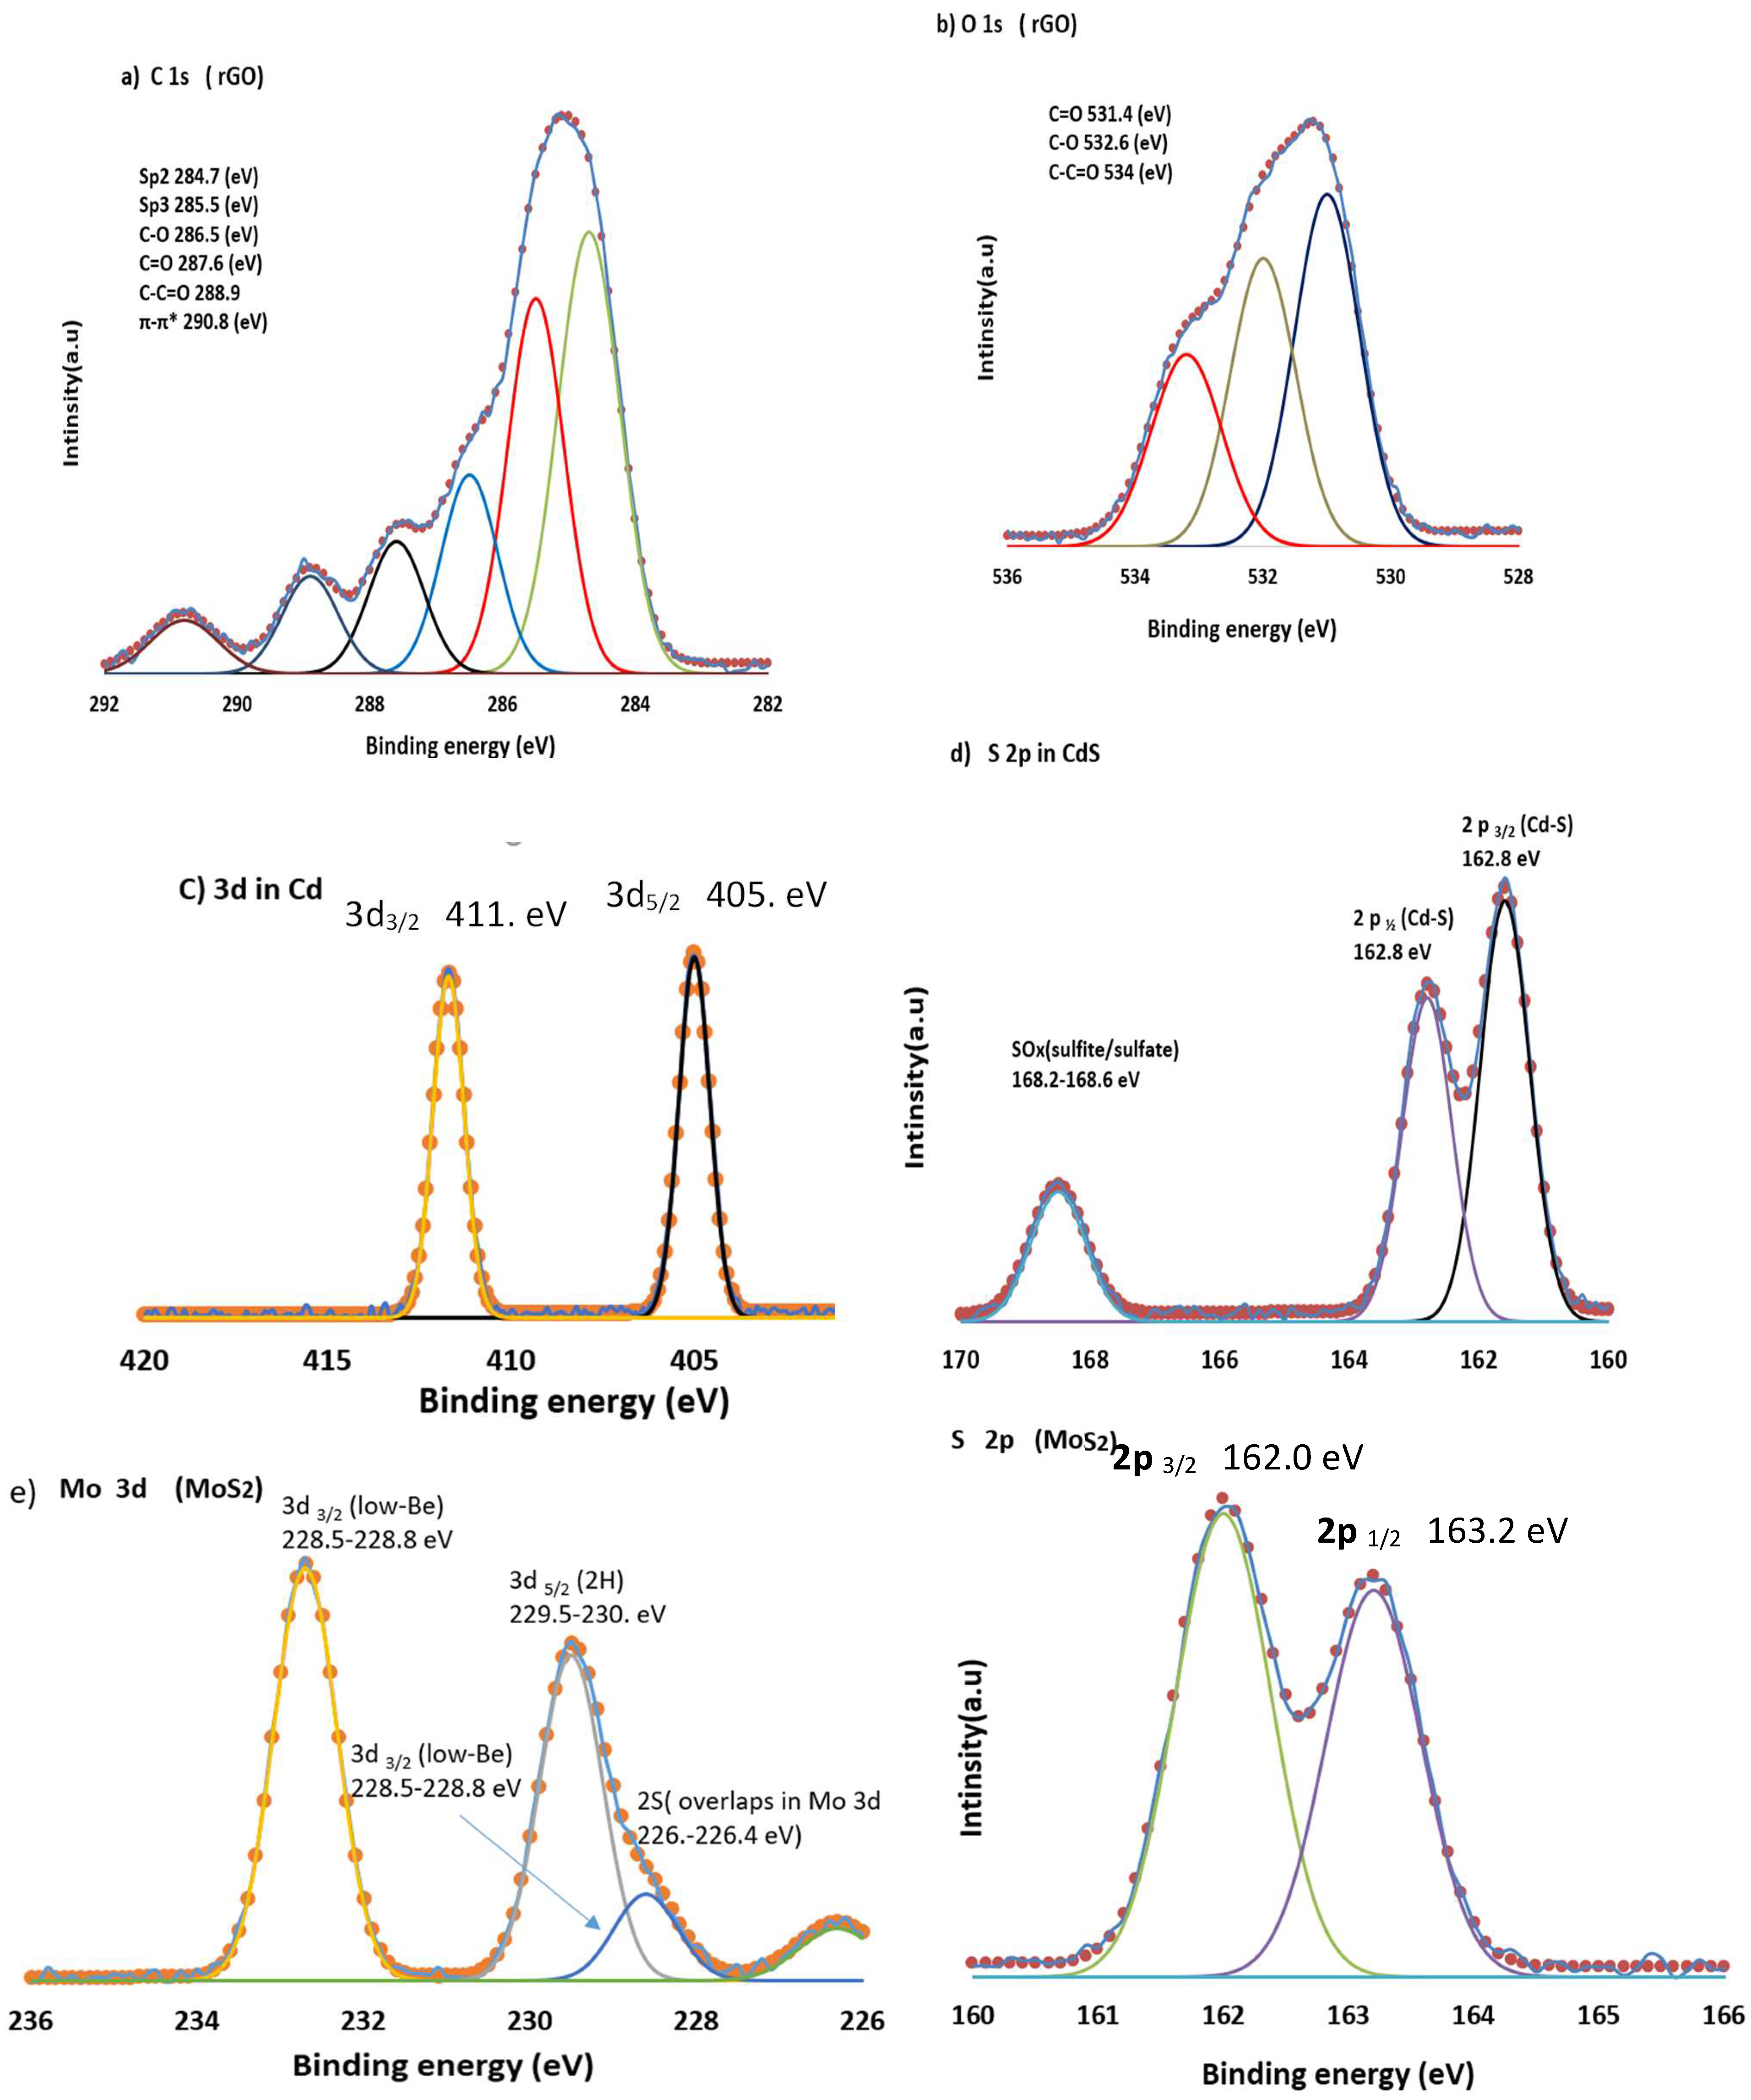
Figure 5.
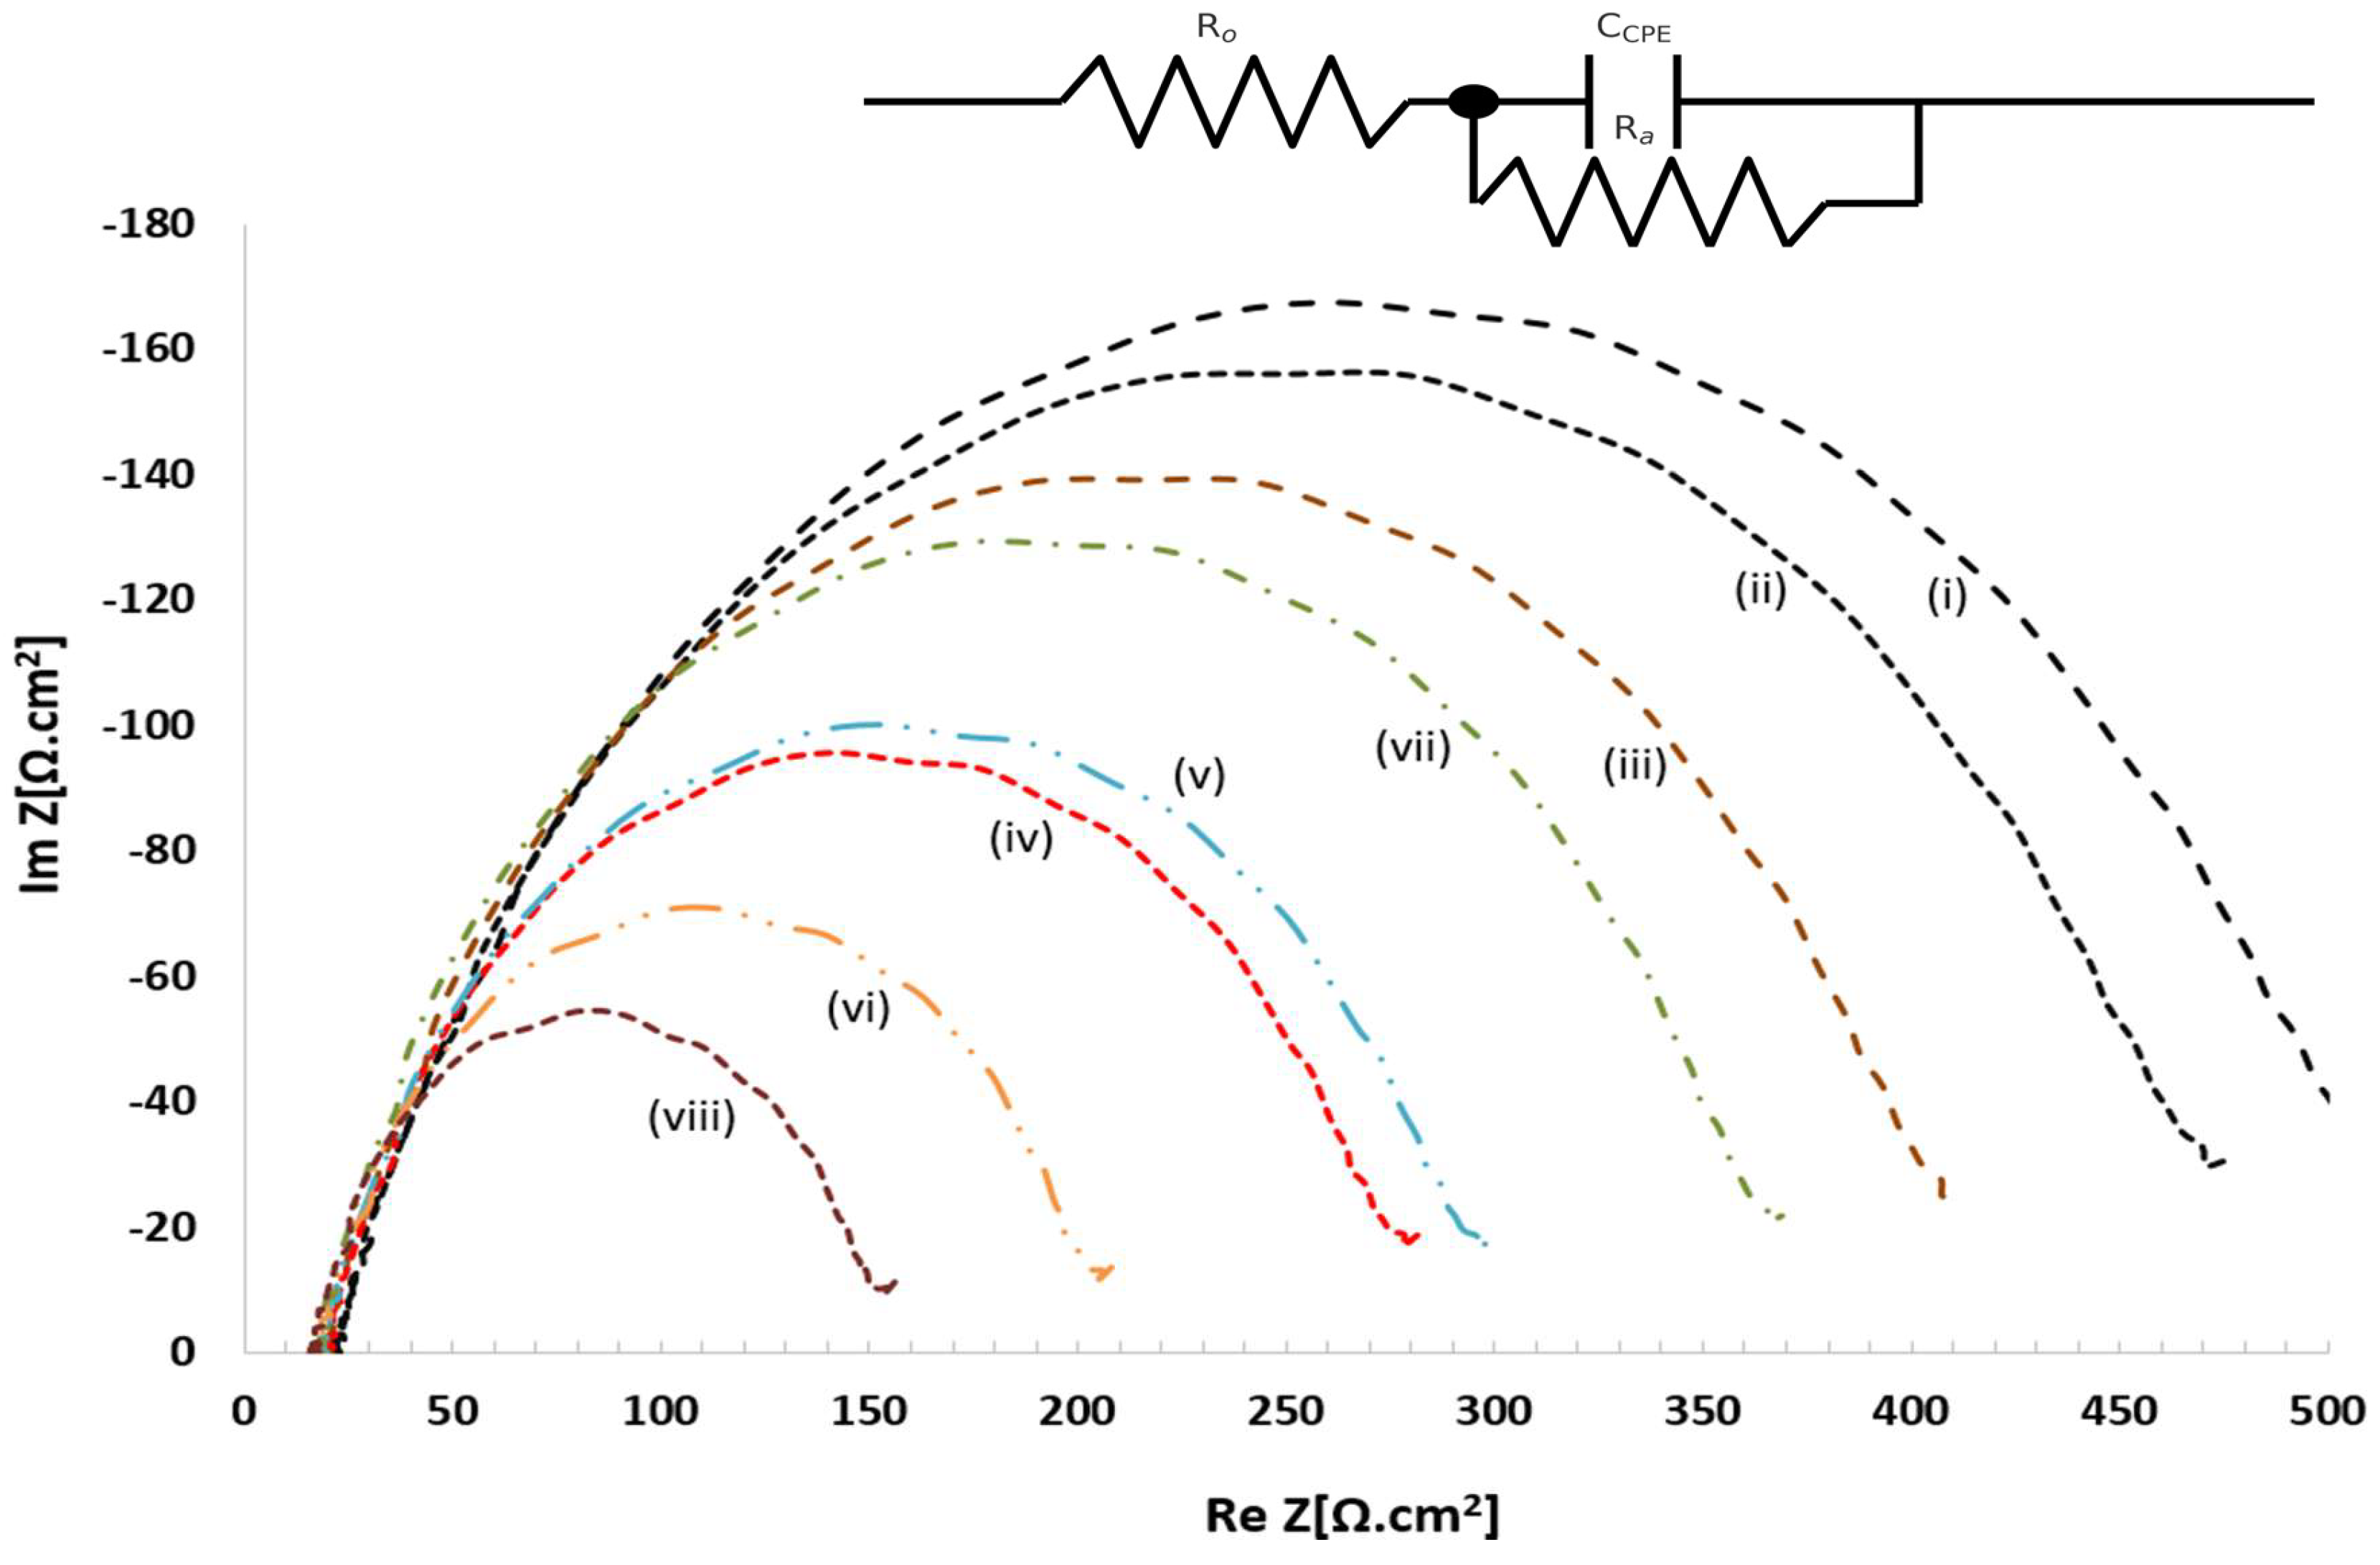
i -rGO in dark and ii- rGO in the light , (iii)-MoS2-rGO in dark and (vii)-CdS-MoS2-rGO-dark , and (v)-CdS-rGO-dark and (iv) MoS2-rGO light), and vi-CdS-rGO light and finally viii-CdS-MoS2-rGO. The inset electrical circuit model single-time constant Randles circuit type (Rs-R1-(R2∥CPE)).
Figure 5.
i -rGO in dark and ii- rGO in the light , (iii)-MoS2-rGO in dark and (vii)-CdS-MoS2-rGO-dark , and (v)-CdS-rGO-dark and (iv) MoS2-rGO light), and vi-CdS-rGO light and finally viii-CdS-MoS2-rGO. The inset electrical circuit model single-time constant Randles circuit type (Rs-R1-(R2∥CPE)).
3.6. Electrochemical Impedance Spectroscopy (EIS) & Tafel Plots Studies
Figure 5.a) shows Nyquist plots that labeled from (i-viii). Which it was fitted with an excellent match to equivalent electrical circuit model single-time constant Randles circuit type (Rs-R1-(R2∥CPE)) as can be seen in inset plot (b). At neutral pH , the low to intermediate frequencies processes refer to adsorption that involved transfer of ions (charge carriers) from the diffuse layer to the try-composite-photo-catalyst. Ro, and Ra represent adsorption resistance and interfacial charge transfer resistance respectively. Also it is an excellent match to equivalent electrical circuit model single-time constant Randles circuit type (Rs-R1-(R2∥CPE)) as can be seen in inset plot (b). At neutral pH , the low to intermediate frequencies processes refer to adsorption that involved transfer of ions (charge carriers) from the diffuse layer to the try-composite-photo-catalyst. Ro, and Ra represent adsorption resistance and interfacial charge transfer resistance respectively.
While the capacity of constant-phase element (CPE) involved Q and n parameters represents the non-ideal double layer and accounts for the depressed semicircle respectively. Table 3 summarized parameters reported by fitting Nyquist plots with an electrical equivalent circuit model [33].
Wher Ro represented resistance of uncompensated solution/electrolyte, while Rct denoted resistance of the charge-transfer at the electrode/electrolyte interfaces. QCPE and nCPE attributed to the constant-phase element with its exponential factor. Which it reflected capacitance behavior of interfacial non-ideal. Cdl is the capacitance of double-layer, and kct is the rate constant of apparent charge-transfer. It calculated from the reciprocal of Rct. However, the reduction value of Rct and higher of Cdl and kct under light illumination, indicated the facilitation of charge separation and interfacial charge transport enhancement in the ternary CdS–MoS₂–rGO film relative to binary or single-component controls[34]..
For more details, (Ro) series resistance were varied gradually between (40 → 36 Ω·cm²). This decreasing value across the set, confirmed the differences in semicircle diameter primarily that can have reflected to the interfacial kinetics. In addition, under illumination Ra percentage (%) among all phot- electrodes decreased following the trend; rGO (−19%), MoS₂–rGO (−28%), CdS–rGO (−33%), and CdS–MoS₂–rGO (−53%). However, lowest Ra that obtained was belong to ternary electrode under light (121 Ω·cm²), Concomitantly, both Q and Cdl values were increased while the CPE exponent n was varied (0.82 → 0.92). which it indicates to more ideal capacitive behavior during photo-operation and provided largest electro-chemical active surface area (ECSA). The tri-light composites CdS-MoS2-Rgo also showed highest kinetic descriptor k_ct ≈ (Rct·Cdl)⁻¹. Followed by CdS–rGO–light and MoS₂–rGO–light. Dependong on the equation i₀ = RT/(nFRct) (n = 2), the exchange current density increased from 28 µA.cm-2 at rGO–dark to 107 µA.cm-2 at tri-light composites CdS-MoS2-rGO[35].
Mechanistically, CdS provides light-carrier generation, rGO offers low charge resistance percolation network that extracts and delocalizes electrons. While and MoS₂ provided HER-active edge sites. This system exhibits smallest Rct, highest Cdl, and most ideal interfacial capacitive responses for HER photocathode performance.
As can be seen in S.5 when the light was switched on, the d) tri- CdS–MoS₂–rGO photocathode composite obtained lowest Tafel slope at (85 mV dec⁻¹). which it reflected the high accelerated interfacial hydrogen evolution kinetics among all other binary or single-component controls. Notably, even at dark d) tri-composite tafel slope remained small comparatively at (120 mV dec⁻¹) showing favorable charge-transfer pathways even in the absence of photocarriers. For comparison purpose, Cntr.2) CdS–rGO composite improved HER activity over pare rGO. When its tafel plots reached (110 and 140 mV dec⁻¹ under light and dark, respectively). Actually, Cntr.2 film confirmed when, photo-generation coupled with a conductive scaffold boosts the catalytic turnover. Other bi-composite MoS₂–rGO (Cntr.3) exhibits higher tafel plots performer reached (135 and 160 mV dec⁻¹ under light and dark). This results reflected the limited poor absorber as well as restricted electrons supplier. Thus, the trend of HER activity trend under light follows CdS–MoS₂–rGO » CdS–rGO > MoS₂–rGO. This is due to interplay synergistic among light absorption between charge transport, and catalytic processes that can suppress the recombination reaction through heterointerfaces.
The enhanced performance of the CdS–MoS₂–rGO photocathode can be understood in terms of band alignment and interfacial charge transfer. Upon illumination, photogenerated electrons in CdS are transferred to rGO due to its favorable Fermi level, which suppresses charge recombination. These electrons are subsequently delivered to MoS₂ edge sites, where proton reduction occurs efficiently. This charge-transfer pathway is consistent with the observed reduction in charge-transfer resistance and improved reaction kinetics.

Table 4.
Charge-Transfer Resistance (Rct), Exchange Current Density (i₀), and Tafel Slope of d-film and other control films.
Table 4.
Charge-Transfer Resistance (Rct), Exchange Current Density (i₀), and Tafel Slope of d-film and other control films.
| Sample | Rct (Ω·cm²) | i₀ (mA·cm⁻²) | Tafel slope (mV·dec⁻¹) |
| (i) rGO — dark | 445 | 0.028 | 280 |
| (ii) rGO — light | 355 | 0.036 | 255 |
| (iii) MoS₂–rGO — dark | 332 | 0.041 | 211 |
| (iv) MoS₂–rGO — light | 217 | 0.058 | 176 |
| (v) CdS–rGO — dark | 242 | 0.053 | 146 |
| (vi) CdS–rGO — light | 157 | 0.083 | 126 |
| (vii) CdS–MoS₂–rGO — dark | 256 | 0.049 | 111 |
| (viii) CdS–MoS₂–rGO — light | 118 | 0.055 | 86 |
3.6. Gas Chromatography (GC) and Hydrogen Evolution Rates
As can be seen in Figure S.6 a confirmed distinct H₂ peaks was appeared at ≈2.0 min of retention time. These peaks related to d) CdS–MoS₂–rGO photocathode. However, under illumination, the film generates the largest H₂ rate reached to 58.6 µmol h⁻¹. While in the dark yielded rate up to 14.1 µmol h⁻¹. These results confirmed that visible-light excitation in CdS is essential to drive proton reduction while blank electrolyte produced only negligible hydrogen rate as expected. The high H2 rates under light and lowest Tafel plots ensured the synergistic roles of the three components CdS-nanoparticles, rGO sheets and, MoS2 which they generate electrons-holes, rapid extracting electrons with low resistances and edges served as competent her sites respectively. It can be concluded that d) tri : CdS–MoS₂–rGO film provide the optimum balance between photons absorption, carrier transport and catalytic turnover. rGO control film showed limited trace hydrogen evolution at both cases dark and light, while CdS-rGO and MoS2-rGO exhibted (9.2 µmol h⁻¹ dark, (41.2 µmol h⁻¹light) and (7.2 µmol h⁻¹dark (,(24 µmol h⁻¹ light) respectively. The fast and stable photocurrent response under chopped illumination reflects efficient carrier separation and rapid electron extraction by the rGO network, consistent with the reduced Rct and enhanced capacitive behavior observed in EIS measurements. Although atomic-scale HRTEM characterization was not available, the combined SEM, XRD, XPS, and EIS results provide consistent evidence for effective heterojunction formation and interfacial charge transfer. The amount of evolved hydrogen was quantified using gas chromatography (GC). During PEC operation, the gas produced at the photocathode was collected and injected into the GC system for analysis. Hydrogen evolution rates were calculated from the measured peak areas using calibration with standard hydrogen gas. The moderate photocurrent density can be attributed to the low-intensity halogen illumination, neutral electrolyte, and thin active layer, while the high photocurrent retention (~96%) confirms good operational stability. The ABPE efficiencies of the different compositions do not show pronounced differences under the applied experimental conditions. This behavior can be attributed to the use of low-intensity illumination (0.25 sun) and neutral pH electrolyte, where the applied bias plays a dominant role in determining efficiency. While ABPE values are similar, clear differences in charge-transfer resistance and reaction kinetics are evident from EIS and Tafel analyses, indicating that the compositional optimization primarily enhances interfacial charge transport rather than bias-dependent efficiency. The amount of evolved hydrogen was quantified for all investigated samples under identical photoelectrochemical conditions using gas chromatography. The ternary CdS–MoS₂–rGO photocathode exhibited the highest hydrogen evolution rate, while the binary and single-component control films produced lower amounts of hydrogen. These results follow the same trend observed in the photocurrent and kinetic analyses, further supporting the structure–performance relationship among the different compositions.
3.7. Applied-Bias Photon-to-Current Efficiency (ABPE)
ABPE efficiency for d) CdS-MoS2-rGO film and other control films. Firstly, the potential converted to RHE instead of Ag/AgCl (3 M KCl) at 25 °C, by Equation[36]:
V_RHE = V_Ag/AgCl + 0.210 + 0.059 × pH
When ( V_Ag/AgCl = −0.75 V ) at (pH = 7), the V_RHE value be =( −0.077 V). then after, the applied-Bias Photon-to-Current Efficiency was calculated via equation[37]:
η_ABPE(V) = |J(V)| × (1.23 - V_RHE) / P_in × 100%
(when η represent the efficiency , J the net photocurrent density in unit A/cm-2 (calculate substituted light current – dark current) and P_in represent the power simulated light sources in unit W.cm^-2 . After Substituted the numbers into the equation last equation, the efficiency can be calculated as can show in Figure 6.
Overall, the photoelectrochemical performance trends observed for the different compositions can be directly correlated with their structural and interfacial characteristics. Variations in MoS₂ and rGO content influence catalytic site density and charge-transport pathways, as reflected by changes in charge-transfer resistance, reaction kinetics, and hydrogen evolution rates. This consistent behavior across structural, electrochemical, and catalytic analyses establishes a clear structure–performance relationship within the CdS–MoS₂–rGO system.
5. Conclusions
CdS–MoS₂–rGO thin-film electrochemical -photocathode prepared a single and scalable precursor ink exhibited synergistic improvement in PEC-HER at neutral pH. The optimized 86:9:5 composition ratios shows; (i) higher photocurrent and less-negative onset potential than all other controls film, (ii) lowiceest illuminated Rct wth highest Cdl, which reflected the faster interfacial charge transfer and largest ECSA, (iii) a lowest illuminated Tafel slope around (~85 mV dec⁻¹) resulted in improved HER kinetics, (iv) a stable over 1 hour of operation with only ~4% current loss through chopped-light testing, and (v) hydrogen evolution rate verified substantially by GC. All resulting data demonstrated the cooperative mechanism within tri-composite CdS-MoS2-rGO.Where CdS generated photo-charges carriers, rGO provided channels for electrons transmission with minimal resistive loss, and finally MoS₂ that supplied Co-catalytically competent at edge sites. CdS-MoS2-rGO film within ration 86:9:5 respectively was optimized mechanism functions making it superior to their binary implementations.
In spite of CdS–MoS₂–rGO photocathode exhibited an excellent performance under halogen lamp illumination and maintains stability for 1 h, further investigation under standard AM 1.5G simulated sunlight as well as extend durability of testing are required to validate scalability. In addition, while CdS provides strong visible absorption, its intrinsic toxicity and photocorrosion risk could limit large-scale application unless passivation gc Environmental risk assessment and toxicological evaluation of CdS-based photocathodes will be addressed in future studies focused on long-term operation and large-scale deployment.
Supplementary Materials
The following supporting information can be downloaded at the website of this paper posted on Preprints.org.
Author Contributions
Conceptualization, investigation and methodology M.A. software, formal analysis, resources and data curation, A.S.; writing—original draft preparation, writing—review and editing and visualization, M.M.A.; supervision, project administration, H.A. All authors have read and agreed to the published version of the manuscript
Funding
This research received no external funding
Data Availability Statement
The original data are presented in this study for more inquiries can be contacted corresponding author.
Acknowledgments
We thank the University of Mosul for its support.
Conflicts of Interest
The authors declare no conflicts of interest.
References
- Xu, Y.; Schoonen, M.A. The absolute energy positions of conduction and valence bands of selected semiconducting minerals. Am. Miner. 2000, 85, 543–556. [CrossRef]
- Nasir, J.A.; Rehman, Z.-U.; Shah, S.N.A.; Khan, A.; Butler, I.S.; Catlow, C.R.A. Recent developments and perspectives in CdS-based photocatalysts for water splitting. J. Mater. Chem. A 2020, 8, 20752–20780. [CrossRef]
- Hinnemann, B.; Moses, P.G.; Bonde, J.; Jørgensen, K.P.; Nielsen, J.H.; Horch, S.; Chorkendorff, I.; Nørskov, J.K. Biomimetic Hydrogen Evolution: MoS2Nanoparticles as Catalyst for Hydrogen Evolution. J. Am. Chem. Soc. 2005, 127, 5308–5309. [CrossRef]
- Voiry, D.; Salehi, M.; Silva, R.; Fujita, T.; Chen, M.; Asefa, T.; Shenoy, V.B.; Eda, G.; Chhowalla, M. Conducting MoS2 Nanosheets as Catalysts for Hydrogen Evolution Reaction. Nano Lett. 2013, 13, 6222–6227. [CrossRef]
- Lu, K.-Q.; Li, Y.-H.; Tang, Z.-R.; Xu, Y.-J. Roles of Graphene Oxide in Heterogeneous Photocatalysis. ACS Mater. Au 2021, 1, 37–54. [CrossRef]
- Hummers, W.S., Jr.; Offeman, R.E. Preparation of Graphitic Oxide. J. Am. Chem. Soc. 1958, 80, 1339. [CrossRef]
- Marcano, D.C., et al., Improved Synthesis of Graphene Oxide. ACS Nano, 2010. 4(8): p. 4806-4814.
- Ortega-Borges, R.; Lincot, D. Mechanism of Chemical Bath Deposition of Cadmium Sulfide Thin Films in the Ammonia-Thiourea System: In Situ Kinetic Study and Modelization. J. Electrochem. Soc. 1993, 140, 3464–3473. [CrossRef]
- Najm, A.S.; Naeem, H.S.; Alwarid, D.A.R.M.; Aljuhani, A.; Hasbullah, S.A.; Hasan, H.A.; Sopian, K.; Bais, B.; Al-Iessa, H.J.; Majdi, H.S.; et al. Mechanism of Chemical Bath Deposition of CdS Thin Films: Influence of Sulphur Precursor Concentration on Microstructural and Optoelectronic Characterizations. Coatings 2022, 12, 1400. [CrossRef]
- Bao, N.; Shen, L.; Takata, T.; Domen, K.; Gupta, A.; Yanagisawa, A.K.; Grimes‖, C.A. Facile Cd−Thiourea Complex Thermolysis Synthesis of Phase-Controlled CdS Nanocrystals for Photocatalytic Hydrogen Production under Visible Light. J. Phys. Chem. C 2007, 111, 17527–17534. [CrossRef]
- Yin, Y.; Han, J.; Zhang, Y.; Zhang, X.; Xu, P.; Yuan, Q.; Samad, L.; Wang, X.; Wang, Y.; Zhang, Z.; et al. Contributions of Phase, Sulfur Vacancies, and Edges to the Hydrogen Evolution Reaction Catalytic Activity of Porous Molybdenum Disulfide Nanosheets. J. Am. Chem. Soc. 2016, 138, 7965–7972. [CrossRef]
- Mondal, A.; Prabhakaran, A.; Gupta, S.; Subramanian, V.R. Boosting Photocatalytic Activity Using Reduced Graphene Oxide (RGO)/Semiconductor Nanocomposites: Issues and Future Scope. ACS Omega 2021, 6, 8734–8743. [CrossRef]
- Ren, H.; Zou, X.; Cheng, J.; Ling, T.; Bai, X.; Chen, D. Facile Solution Spin-Coating SnO2 Thin Film Covering Cracks of TiO2 Hole Blocking Layer for Perovskite Solar Cells. Coatings 2018, 8, 314. [CrossRef]
- Weidling, A.M.; Turkani, V.S.; Akhavan, V.; Schroder, K.A.; Swisher, S.L. Large-area photonic lift-off process for flexible thin-film transistors. npj Flex. Electron. 2022, 6, 1–10. [CrossRef]
- Kolhe, S.; Kuljarni, S.; Nigavekar, A.; Sharma, S. Effects of air annealing on chemincally deposited CdS films exmained by XPS and XRD. Sol. Energy Mater. 1984, 10, 47–54. [CrossRef]
- Allen J. Bard and Larry R. Faulkner, Electrochemical Methods: Fundamentals and Applications, New York: Wiley, 2001, 2nd ed. Russian Journal of Electrochemistry, 2002. 38(12): p. 1364-1365.
- Vivier, V.; Orazem, M.E. Impedance Analysis of Electrochemical Systems. Chem. Rev. 2022, 122, 11131–11168. [CrossRef]
- Yan, Y.; Xia, B.; Xu, Z.; Wang, X. Recent Development of Molybdenum Sulfides as Advanced Electrocatalysts for Hydrogen Evolution Reaction. ACS Catal. 2014, 4, 1693–1705. [CrossRef]
- Kamat, P.V. Graphene-Based Nanoarchitectures. Anchoring Semiconductor and Metal Nanoparticles on a Two-Dimensional Carbon Support. J. Phys. Chem. Lett. 2009, 1, 520–527. [CrossRef]
- Xiang, Q.; Cheng, B.; Yu, J. Graphene-Based Photocatalysts for Solar-Fuel Generation. Angew. Chem. Int. Ed. Engl. 2015, 54, 11350–11366. [CrossRef]
- Zong, X.; Wu, G.; Yan, H.; Ma, G.; Shi, J.; Wen, F.; Wang, L.; Li, C. Photocatalytic H2 Evolution on MoS2/CdS Catalysts under Visible Light Irradiation. J. Phys. Chem. C 2010, 114, 1963–1968. [CrossRef]
- Seo, D.-B.; Trung, T.N.; Bae, S.-S.; Kim, E.-T. Improved Photoelectrochemical Performance of MoS2 through Morphology-Controlled Chemical Vapor Deposition Growth on Graphene. Nanomaterials 2021, 11, 1585. [CrossRef]
- Krishna Kumar, A.S.; Jiang, S.-J.; Warchoł, J.K. Synthesis and Characterization of Two-Dimensional Transition Metal Dichalcogenide Magnetic MoS2@Fe3O4 Nanoparticles for Adsorption of Cr(VI)/Cr(III). ACS Omega 2017, 2, 6187–6200. [CrossRef]
- Sumair Ahmed, S., et al., Improved Performance of CuFe2O4/rGO Nanohybrid as an Anode Material for Lithium-ion Batteries Prepared Via Facile One-step Method. Current Nanoscience, 2019. 15(4): p. 420-429.
- Maticiuc, N.; Hiie, J.; Mikli, V.; Potlog, T.; Valdna, V. Structural and optical properties of cadmium sulfide thin films modified by hydrogen annealing. Mater. Sci. Semicond. Process. 2014, 26, 169–174. [CrossRef]
- Kar, S.; Ghosh, S.; Pal, T. MoS2-CdS composite for photocatalytic reduction of hexavalent chromium and thin film optoelectronic device applications. Sci. Rep. 2024, 14, 1–12. [CrossRef]
- Jones, L.A.H.; Xing, Z.; Swallow, J.E.N.; Shiel, H.; Featherstone, T.J.; Smiles, M.J.; Fleck, N.; Thakur, P.K.; Lee, T.-L.; Hardwick, L.J.; et al. Band Alignments, Electronic Structure, and Core-Level Spectra of Bulk Molybdenum Dichalcogenides (MoS2, MoSe2, and MoTe2). J. Phys. Chem. C 2022, 126, 21022–21033. [CrossRef]
- Hamid, K.; Bin Mukhlish, M.Z.; Uddin, T. Sunlight-activated heterostructure MoS2/CdS nanocomposite photocatalyst with enhanced photocatalytic activity: band alignment and mechanism study. RSC Adv. 2024, 14, 38908–38923. [CrossRef]
- Johra, F.T.; Jung, W.-G. Hydrothermally reduced graphene oxide as a supercapacitor. Appl. Surf. Sci. 2015, 357, 1911–1914. [CrossRef]
- Ziabari, A.A.; Ghodsi, F. Growth, characterization and studying of sol–gel derived CdS nanoscrystalline thin films incorporated in polyethyleneglycol: Effects of post-heat treatment. Sol. Energy Mater. Sol. Cells 2012, 105, 249–262. [CrossRef]
- Yan, Z.; Du, L.; Phillips, D.L. Multilayer core–shell MoS2/CdS nanorods with very high photocatalytic activity for hydrogen production under visible-light excitation and investigation of the photocatalytic mechanism by femtosecond transient absorption spectroscopy. RSC Adv. 2017, 7, 55993–55999. [CrossRef]
- Yao, Y.; Ao, K.; Lv, P.; Wei, Q. MoS2 Coexisting in 1T and 2H Phases Synthesized by Common Hydrothermal Method for Hydrogen Evolution Reaction. Nanomaterials 2019, 9, 844. [CrossRef]
- Macdonald, J.R., Impedance spectroscopy: emphasizing solid materials and systems. Applied Optics, 1989. 28(6): p. 1083.
- Macdonald, J.R., et al., Impedance spectroscopy: theory, experiment, and applications. 2018: John Wiley & Sons.
- Lasia, A., Electrochemical impedance spectroscopy and its applications, in Modern aspects of electrochemistry. 2002, Springer. p. 143-248.
- Kékedy-Nagy, L., et al., An Electrochemical Study of Ammonium Dihydrogen Phosphate on Mg and Mg Alloy Electrodes. Electrocatalysis, 2021. 12(3): p. 251-263.
- Wan, X.; Lu, D.; Wang, X.; Liu, G.; Fu, Y.; Hu, C.; Rong, N.; Wang, H.; Cheng, Z. Enhanced Photoelectrochemical Water Oxidation on BiVO4 Photoanodes Functionalized by Bimetallic Dicyanamide Molecular Catalysts. Sustainability 2023, 15, 3129. [CrossRef]
Figure 1.
Chronoamperograms at 0.75 V (vs Ag/AgCl) over 1 h of operation, with and without light illumination (0.25 sun), of FTO slides coated with thin films of; d-film, Cntr.1, Cntr.2 and Cntr.3 (*=’light on’, #=’light off’).
Figure 1.
Chronoamperograms at 0.75 V (vs Ag/AgCl) over 1 h of operation, with and without light illumination (0.25 sun), of FTO slides coated with thin films of; d-film, Cntr.1, Cntr.2 and Cntr.3 (*=’light on’, #=’light off’).
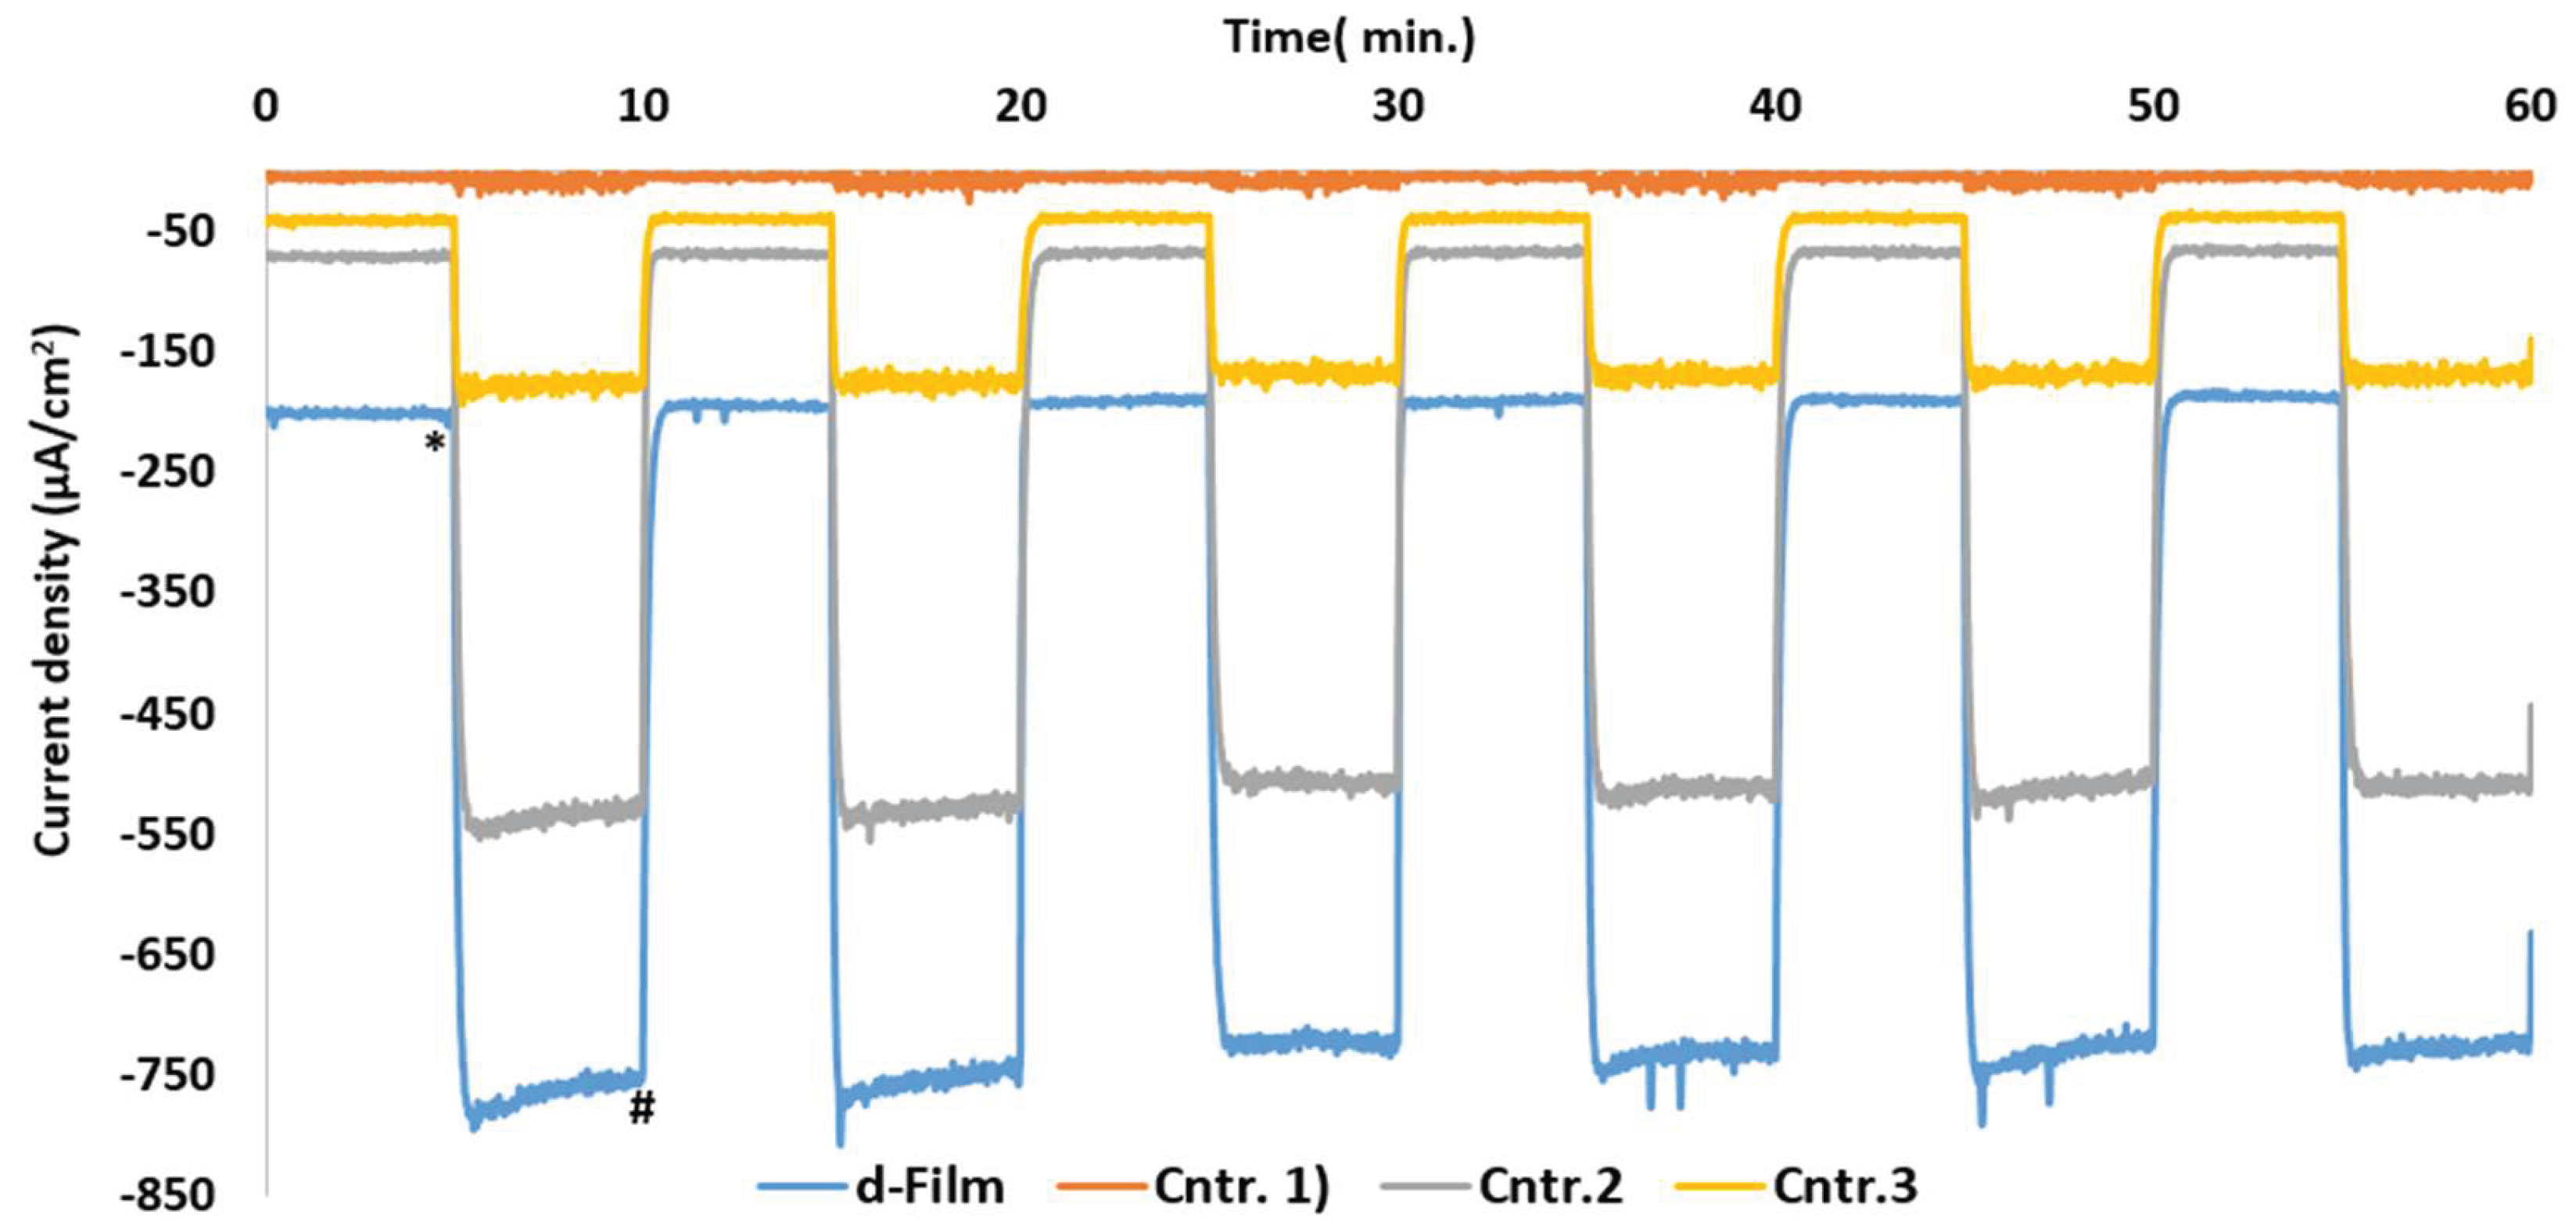
Figure 3.
SEM image of a) rGO showed multilayers- wrinkled (b) rGO–CdS ( CdS nanoparticles around (∼40–120 nm) provided CdS/rGO heterojunctions; (c) rGO–MoS₂ flowered-like MoS₂ rosettes arround (∼150–300 nm) exposed edge-rich catalytic sites; (d) tri-composites rGO–CdS–MoS₂ film.
Figure 3.
SEM image of a) rGO showed multilayers- wrinkled (b) rGO–CdS ( CdS nanoparticles around (∼40–120 nm) provided CdS/rGO heterojunctions; (c) rGO–MoS₂ flowered-like MoS₂ rosettes arround (∼150–300 nm) exposed edge-rich catalytic sites; (d) tri-composites rGO–CdS–MoS₂ film.
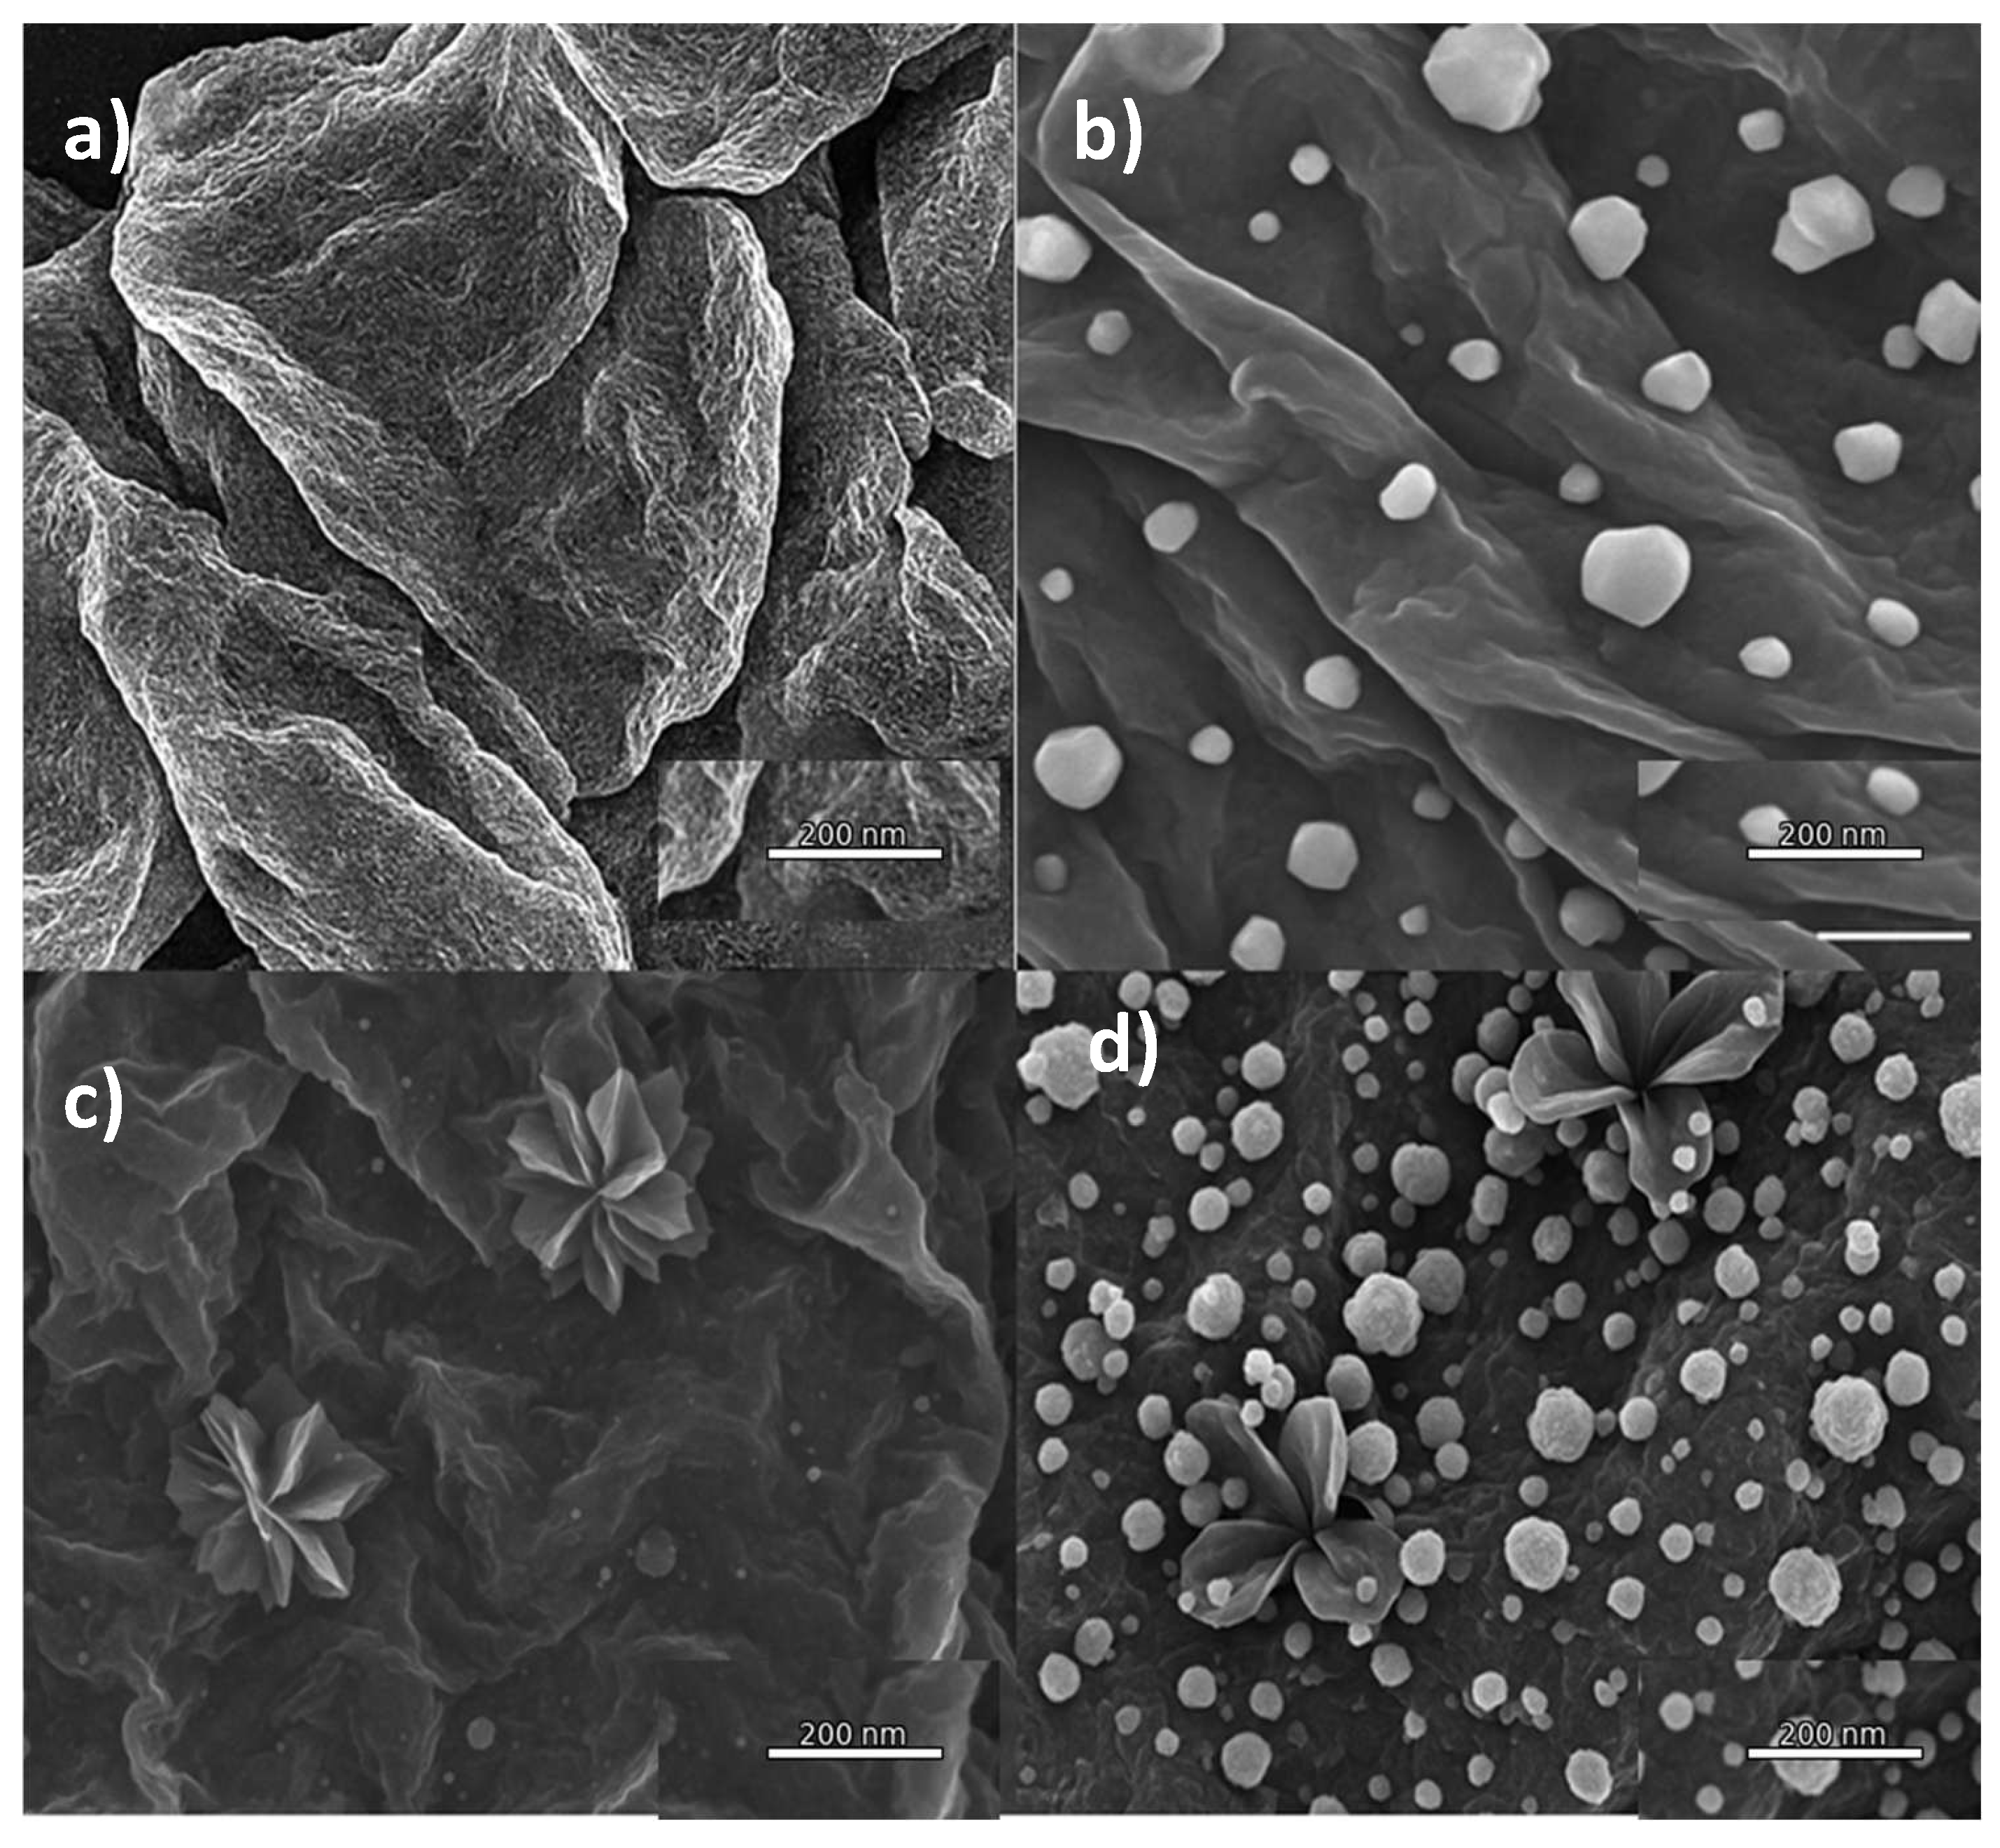
Figure 6.
Applied-bias photon-to-current efficiency (ABPE) of the d) CdS–MoS₂–rGO photocathode and control films measured under identical bias and illumination conditions.
Figure 6.
Applied-bias photon-to-current efficiency (ABPE) of the d) CdS–MoS₂–rGO photocathode and control films measured under identical bias and illumination conditions.
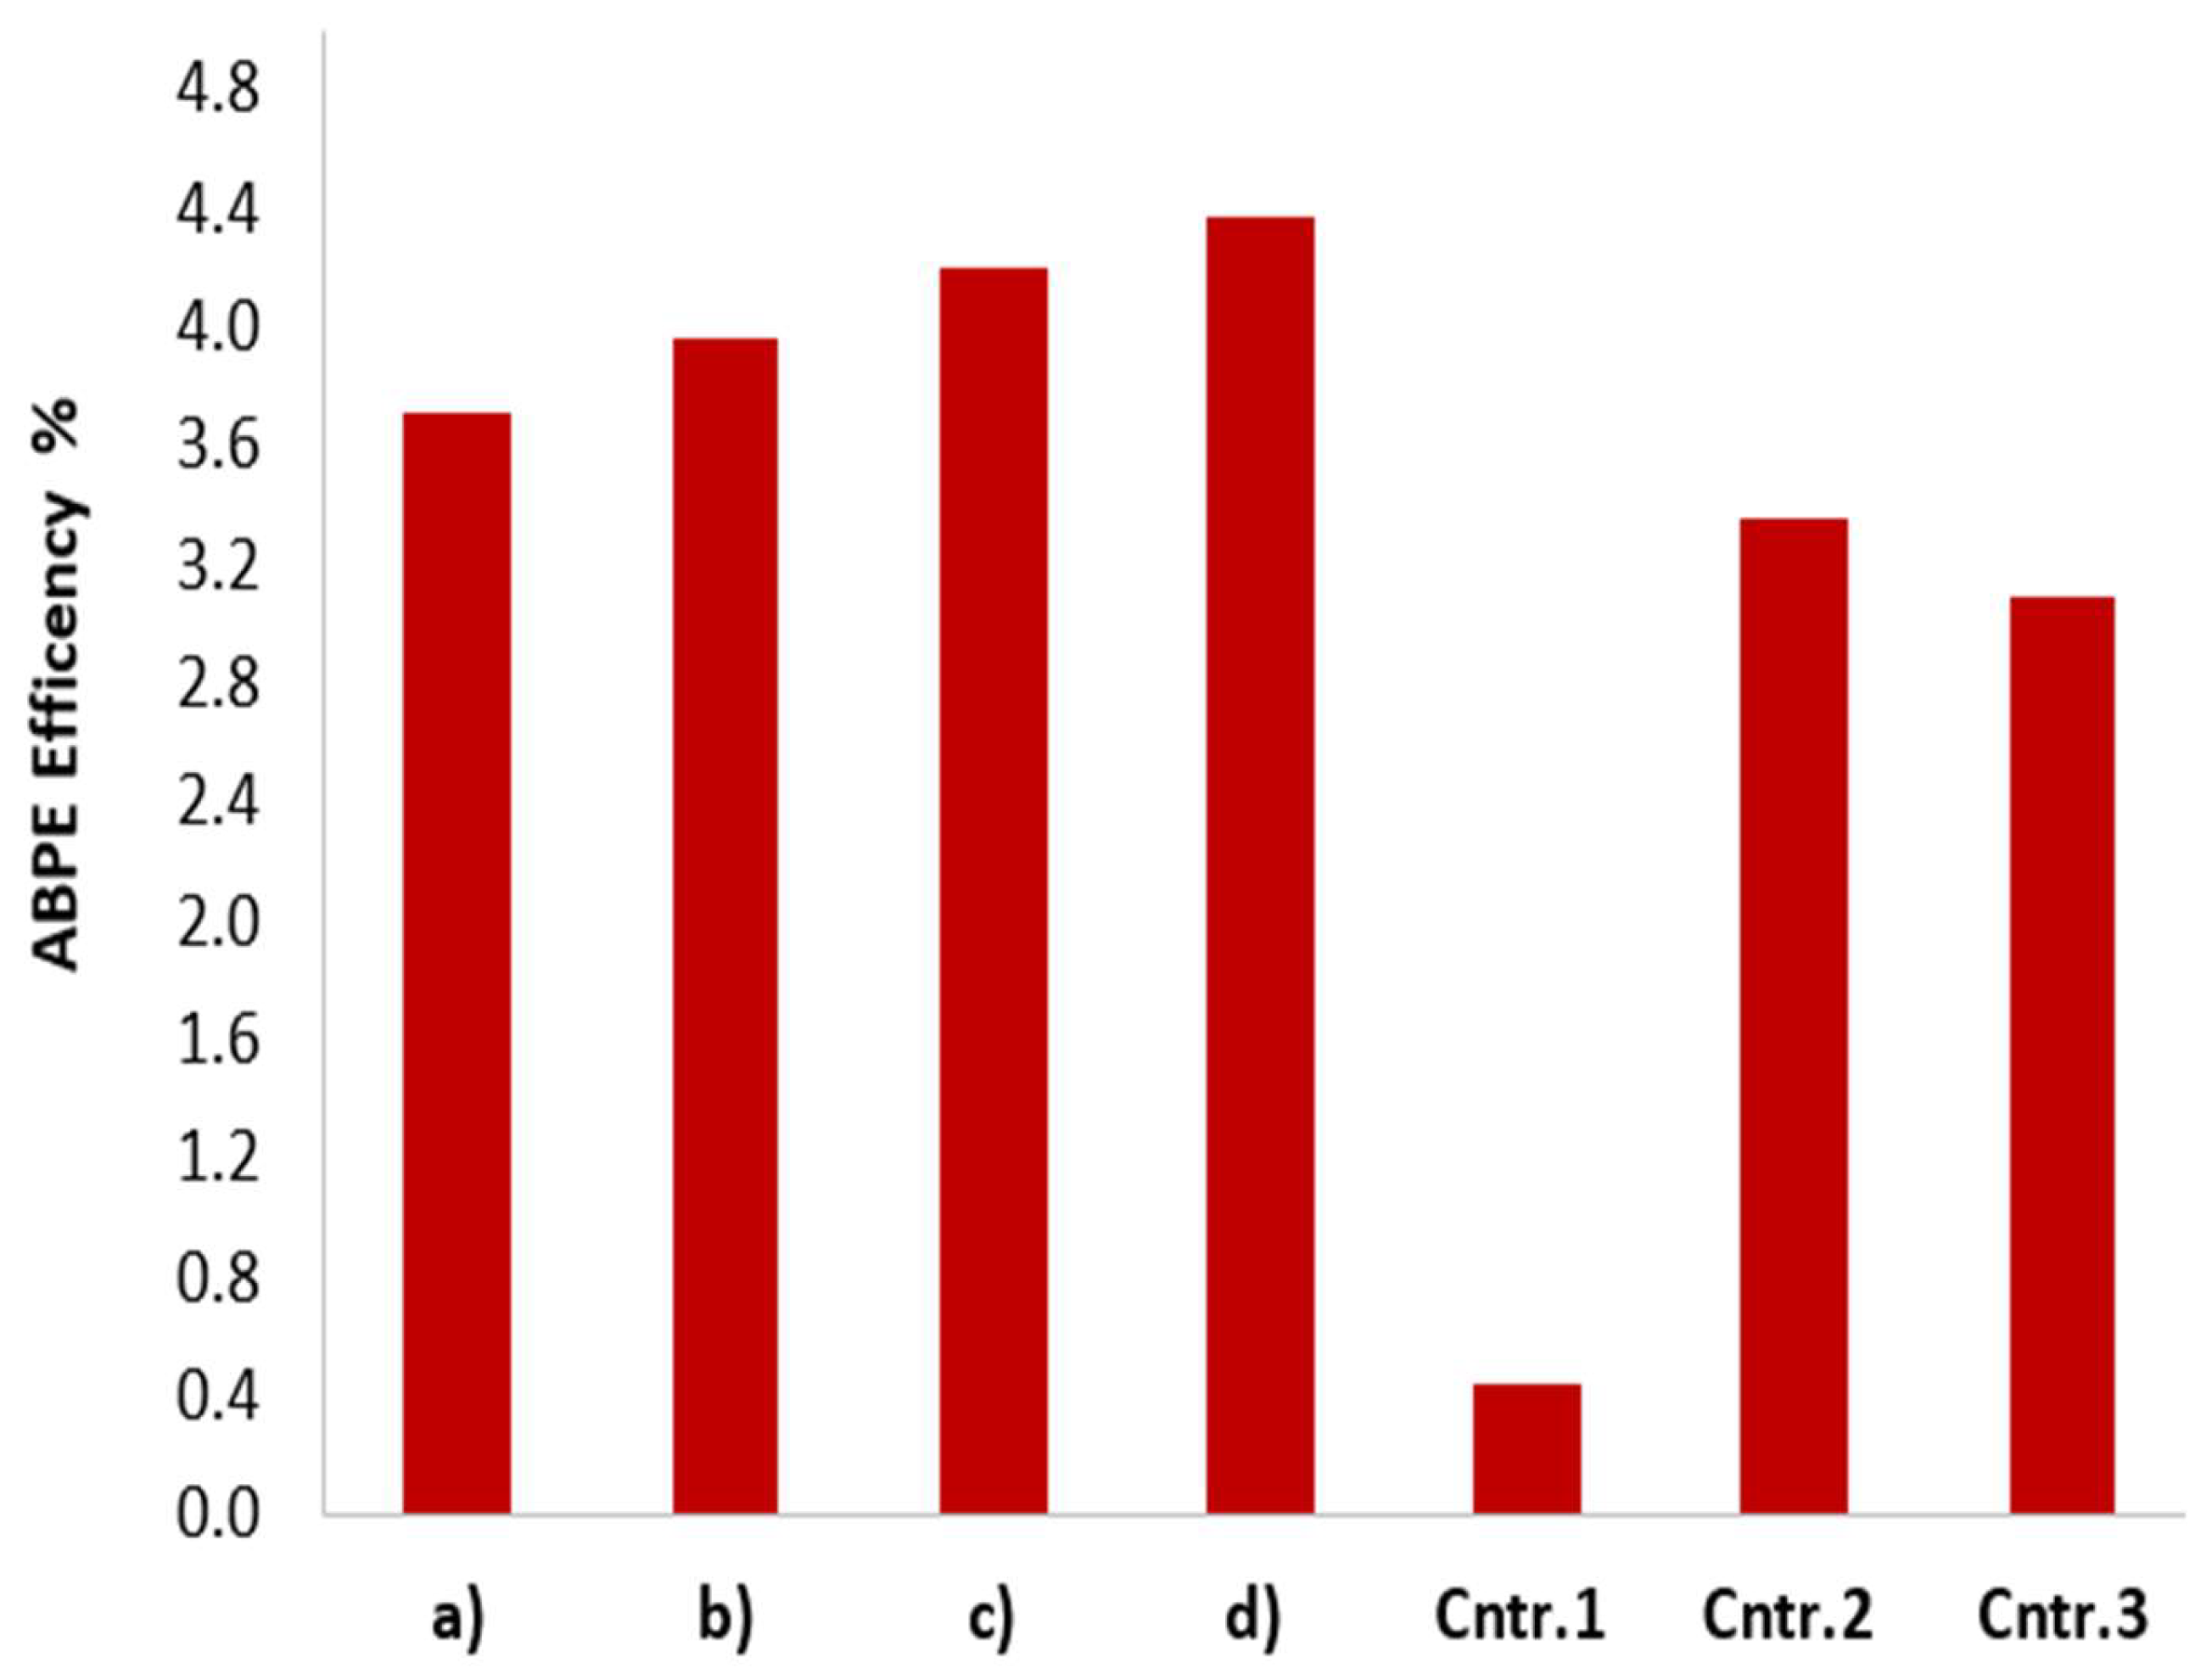
Table 1.
Calculated A,B,C,D composite component in X 10 mL ink, ( 1.2 mg mL⁻¹), EtOH:H₂O 85:15 v/v.
| Sample | CdS (wt%) | MoS₂ (wt%) | rGO (wt%) | m(CdS) (mg) | m(MoS₂) (mg) | m(rGO) (mg) | Cd(NO₃)₂ (mL) | Na₂MoO₄ (mL) | GO (4mg mL⁻¹) (µL) | water (mL) | EtOH (mL) | Thiourea† (mg) |
| a (93:5:2) | 93.0 | 5.0 | 2.0 | 11.16 | 0.60 | 0.24 | 0.772 | 0.037 | 60 | 0.690 | 8.435 | 61.6 |
| b (96:3:1) | 96.0 | 3.0 | 1.0 | 11.52 | 0.36 | 0.12 | 0.797 | 0.022 | 30 | 0.680 | 8.465 | 62.4 |
| c (97:2:1) | 97.0 | 2.0 | 1.0 | 11.64 | 0.24 | 0.12 | 0.806 | 0.015 | 30 | 0.679 | 8.465 | 62.5 |
| d (86:9:5) | 86.0 | 9.0 | 5.0 | 10.32 | 1.08 | 0.60 | 0.714 | 0.067 | 150 | 0.718 | 8.345 | 61.5 |
| Ctrl 1 (0/0/100) | 0.0 | 0.0 | 100 | 0.0 | 0.0 | 12.0 | 0.0 | 0.0 | 3000 | 1.500 | 5.495 | 0.0 |
| Ctrl 2 (95/0/5) | 95.0 | 0.0 | 5.0 | 11.40 | 0.0 | 0.60 | 0.789 | 0.0 | 150 | 0.711 | 8.345 | 60.1 |
| Ctrl 3 (0/95/5) | 0.0 | 95.0 | 5.0 | 0.0 | 11.40 | 0.60 | 0.0 | 0.712 | 150 | 0.788 | 8.345 | 54.2 |
† Thiourea amount corresponds to tenfold molar excess relative to total metal content.
Table 2.
shows the outcomes results of LSV.
| Samples & controls film | Dark current density (µA·cm⁻²) | Light current density (µA·cm⁻²) | Dark onset potential (V) | Light onset potential (V) |
| a) | 193 | 709 | −0.68 | −0.54 |
| b) | 196 | 757 | −0.66 | −0.52 |
| c) | 201 | 803 | −0.65 | −0.52 |
| d) | 209 | 836 | −0.64 | −0.49 |
| Cntr.1 (rGO) | 30 | 86 | −0.82 | −0.73 |
| Cntr.2 (CdS–rGO) | 160 | 643 | −0.72 | −0.55 |
| Cntr.3 (MoS₂–rGO) | 150 | 592 | −0.75 | −0.61 |
Table 3.
summarized outcomes results from(EIS) fitting data.
| Label | Film type | R₀ (Ω·cm²) | Rct (Ω·cm²) | QCPE (µΩ⁻¹·cm⁻²·sⁿ ×10⁻⁴) | nCPE | Cdl (µF·cm⁻²) | kct (s⁻¹) |
| (i) | rGO — dark | 40 | 450 | 1.5 | 0.82 | 6 | 370 |
| (ii) | rGO — light | 39 | 360 | 2.0 | 0.85 | 7 | 397 |
| (iii) | MoS₂–rGO — dark | 38 | 310 | 2.2 | 0.86 | 7.5 | 430 |
| (iv) | MoS₂–rGO — light | 38 | 220 | 2.8 | 0.88 | 9 | 505 |
| (v) | CdS–rGO — dark | 38 | 240 | 2.5 | 0.88 | 8.5 | 490 |
| (vi) | CdS–rGO — light | 37 | 155 | 3.3 | 0.90 | 10 | 645 |
| (vii) | CdS–MoS₂–rGO — dark | 37 | 260 | 3.0 | 0.90 | 9.5 | 405 |
| (viii) | CdS–MoS₂–rGO — light | 36 | 120 | 3.8 | 0.92 | 11 | 758 |
Neutral pH operation offers a practical compromise between activity and stability for CdS-based photocathodes. Under these conditions, rapid electron extraction by rGO and catalytic turnover at MoS₂ edge sites suppress charge accumulation and photocorrosion, enabling sustained hydrogen evolution. This behavior defines the operational advantage boundary of the CdS–MoS₂–rGO system under mild aqueous environments.
Table 3.
summarized outcomes results from(EIS) fitting data.
| Label | Film type | R₀ (Ω·cm²) | Rct (Ω·cm²) | QCPE (µΩ⁻¹·cm⁻²·sⁿ ×10⁻⁴) | nCPE | Cdl (µF·cm⁻²) | kct (s⁻¹) |
| (i) | rGO — dark | 40 | 450 | 1.5 | 0.82 | 6 | 370 |
| (ii) | rGO — light | 39 | 360 | 2.0 | 0.85 | 7 | 397 |
| (iii) | MoS₂–rGO — dark | 38 | 310 | 2.2 | 0.86 | 7.5 | 430 |
| (iv) | MoS₂–rGO — light | 38 | 220 | 2.8 | 0.88 | 9 | 505 |
| (v) | CdS–rGO — dark | 38 | 240 | 2.5 | 0.88 | 8.5 | 490 |
| (vi) | CdS–rGO — light | 37 | 155 | 3.3 | 0.90 | 10 | 645 |
| (vii) | CdS–MoS₂–rGO — dark | 37 | 260 | 3.0 | 0.90 | 9.5 | 405 |
| (viii) | CdS–MoS₂–rGO — light | 36 | 120 | 3.8 | 0.92 | 11 | 758 |
Disclaimer/Publisher’s Note: The statements, opinions and data contained in all publications are solely those of the individual author(s) and contributor(s) and not of MDPI and/or the editor(s). MDPI and/or the editor(s) disclaim responsibility for any injury to people or property resulting from any ideas, methods, instructions or products referred to in the content. |
© 2026 by the authors. Licensee MDPI, Basel, Switzerland. This article is an open access article distributed under the terms and conditions of the Creative Commons Attribution (CC BY) license.
Copyright: This open access article is published under a Creative Commons CC BY 4.0 license, which permit the free download, distribution, and reuse, provided that the author and preprint are cited in any reuse.


