
Submitted:
23 January 2026
Posted:
27 January 2026
You are already at the latest version
Abstract
Accurate detection and severity estimation of corrosion on metallic surfaces is essential for maintaining material integrity and ensuring operational safety in industrial systems. To address limitations in manual inspection methods, this study presents a two-stage deep learning pipeline tailored for high-resolution scanning electron microscopy images. The framework combines instance-level corrosion segmentation using the YOLOv8-seg architecture with subsequent severity classification performed by EfficientNet-B0 and ResNet18. In the segmentation stage, models are trained using both manually annotated and automatically generated binary masks, enabling robust instance mask prediction through prototype-based mask decoding. The classification stage assesses the severity of corrosion by analyzing localized regions based on morphological features, leveraging convolutional neural networks optimized for binary output. Experimental results demonstrate strong performance: the segmentation model trained on manual annotations achieves a mean Intersection-over-Union (mIoU) of 89.91, a mask mAP@50 of 98.6, and an ROC-AUC of 94.69. For severity classification, EfficientNet-B0 achieves an accuracy of 93.75% and an F1-score of 93.29, outperforming ResNet18. These findings underscore the potential of combining lightweight segmentation and classification models to enable precise and automated corrosion analysis, supporting integration into real-time inspection workflows and intelligent material diagnostics in industrial settings.
Keywords:
corrosion detection
; instance segmentation
; YOLOv8
; EfficientNet
; SEM imagery
; computer vision
; CNN classification
; industrial inspection
1. Introduction
Corrosion is a critical challenge in materials science and engineering, contributing to structural degradation, safety hazards, and significant economic costs, estimated at more than $2.5 trillion annually worldwide [1]. This problem is particularly severe in key industries such as aerospace, marine, and energy sectors, where corrosion can compromise component reliability and endanger human safety [2]. The degradation of metallic materials typically arises from electrochemical and chemical reactions, resulting in a loss of mechanical integrity and serviceability over time [3]. Addressing corrosion challenges is essential for developing sustainable, climate-resilient energy systems and infrastructures, as emphasized by global initiatives such as the Paris Agreement and the 2030 Agenda for Sustainable Development by the United Nations [4].
Current corrosion evaluation methods, though reliable, often depend on manual visual inspection and subjective interpretation of microstructural changes, leading to poor reproducibility and extended analysis times [5]. Scanning electron microscopy (SEM) has become a valuable tool in corrosion research, capable of capturing high-resolution images of surface morphology, pit formation, and crack propagation [3,6]. Advancements in 3D imaging techniques, such as X-ray computed tomography and focused ion beam machines with SEM, have provided improved insights into pit-to-crack transitions and stress corrosion cracking [7]. However, the sheer volume and complexity of SEM image data make manual analysis time-consuming and prone to inconsistency and limit scalability [8].
Recent advances in artificial intelligence (AI), particularly deep learning (DL), present a compelling opportunity to automate and enhance the analysis of corrosion processes [2,9,10]. DL techniques are being applied for corrosion assessment and material degradation analysis, potentially offering insights into the safety, reliability, and sustainability of infrastructure systems [9,11]. Convolutional neural networks (CNNs), widely adopted in medical diagnostics, remote sensing, and industrial quality control, offer powerful image analysis capabilities, including automated feature extraction and pattern recognition [12,13]. These capabilities are particularly suited to analyzing SEM images, where corrosion features such as localized pitting, cracks, and rust formation often appear subtle and heterogeneous [5].
While recent studies have begun applying advanced CNN architectures, such as YOLOv8, to corrosion detection and segmentation tasks, existing research often overlooks the impact of hyper parameter tuning on model optimization, potentially limiting the robustness and generalizability of the findings [12,14]. Furthermore, existing image-based approaches tend to rely on low-quality training data or static feature extraction methods, which lack the capacity to represent the complex, multiscale, and time-dependent nature of corrosion [9]. Moreover, most models treat images in isolation, ignoring temporal dynamics that are crucial for understanding corrosion progression and forecasting future degradation. In parallel, little work has been done to correlate corrosion behavior with upstream material processing parameters, such as annealing time and thermal history, which significantly influence microstructure and, by extension, corrosion resistance [15].
To address these gaps, we propose a novel DL-based framework for the automated analysis of SEM images of corrosion. Our approach is designed to fulfil two primary tasks: (1) classify corrosion severity and (2) segment affected surface regions. We evaluate the performance of our models on a systematically designed dataset comprising SEM images from metallic samples subjected to different annealing times (60, 90, and 120 minutes) and exposure durations (1, 7, 14, and 21 days). This allows us to assess how thermal treatment influences corrosion behavior, providing both a challenge and a framework for evaluating the robustness and generalizability of our models.
The AI-based SEM analysis workflow in this study aims to streamline corrosion assessment, reduce human workload, and enhance consistency. The integration of temporal modeling also holds potential for predictive maintenance, enabling early warnings and lifecycle forecasting in industrial systems. Ultimately, this work contributes to a more intelligent and efficient corrosion characterization process, bridging advanced microscopy with state-of-the-art machine learning.
2. Literature Survey
Recent advances in DL architectures have enabled sophisticated automated corrosion detection and assessment for SEM imagery [16,17,18,19,20]. This review examines state-of-the-art approaches directly relevant to the current temporal-thermal correlation framework, focusing on YOLO-based detection, EfficientNet classification, and data-driven material optimization.
2.1. YOLOv8 Architectures for Corrosion Detection and Segmentation
2.1.1. YOLOv8 Performance in Industrial Applications
YOLOv8 achieves exceptional performance metrics of 95% accuracy, 100% precision, 90% recall, and a 94.74% F1-score for corrosion detection tasks, significantly outperforming earlier YOLO versions [12,14]. The architectural improvements include enhanced feature pyramid networks and anchor-free detection mechanisms essential for irregular corrosion morphology in SEM imagery. Zhao et al. [20] demonstrated high-precision pixel-level corrosion mapping for localized corrosion in structural alloys, though it was limited to static analysis without temporal progression modeling. Comparative studies reveal YOLOv8 offers superior segmentation accuracy over YOLOv5 through optimized multi-scale object detection capabilities [14]. The YOLOv8-seg architecture employs prototype-based instance mask generation, constructing 32 low-resolution prototype masks via convolutional transformations. Each detection instance generates 32-dimensional mask coefficient vectors for instance-specific binary masks through a linear combination with prototype basis.
2.1.2. SEM-Specific Advantages and Limitations
YOLOv8-seg processes 640×640 input images as 3-channel RGB tensors, even for grayscale SEM inputs, through channel expansion during preprocessing. The architecture comprises a backbone (hierarchical feature extraction), neck (multiscale feature aggregation), and segmentation head (simultaneous objectness scores, bounding boxes, and pixel-wise masks). Current implementations focus on detection accuracy without addressing temporal progression or correlation with material processing parameters such as annealing conditions.
2.2. EfficientNet-B0 for Corrosion Severity Classification
2.2.1. Compound Scaling for Corrosion Analysis
EfficientNet-B0 employs compound scaling methodology systematically balancing network depth, width, and resolution for optimal corrosion classification performance [12] . The architecture's 16 MBConv blocks with Squeeze-and-Excitation modules enable dynamic channel-wise feature recalibration essential for subtle corrosion feature detection in SEM imagery. In our implementation, EfficientNet-B0 achieves 93.75% accuracy, representing 12.5% improvement over ResNet18 baseline. Integrated frameworks combining YOLOv8 segmentation with EfficientNet-B0 classification demonstrate comprehensive assessment capabilities [12], though lacking temporal progression analysis.
Transfer learning evaluations reveal EfficientNet maintains optimal computational efficiency while achieving superior feature representation compared to ResNet and MobileNet architectures [21]. The compound scaling approach proves particularly advantageous for multi-scale corrosion morphology analysis, ensuring architectural modifications maintain balance between computational efficiency and feature representation capability.
2.2.2. Classification Performance Gap
Current EfficientNet implementations lack integration of temporal dynamics essential for understanding corrosion progression patterns. Classification approaches treat severity assessment as static problems without considering degradation evolution over time or correlation with upstream material processing parameters [22,23,24,25].
2.3. Data-Driven Material Optimization and Environmental Correlation
2.3.1. Machine Learning for Corrosion-Resistant Steel Design
Yang et al. [26] pioneered comprehensive data-driven approaches combining machine learning with systematic experimental validation for optimizing corrosion resistance in Sn-added low-alloy steel. Their methodology employed random forest algorithms with Spearman correlation analysis to identify optimal Sn microalloying concentrations (0.1-0.3 wt%), determining 0.2 wt% as the optimal composition for atmospheric corrosion resistance in Beijing environments.
The hybrid approach combined dimensionality reduction through random forest and Spearman correlation with comprehensive experimental verification using XRD, XPS, and potentiodynamic polarization measurements. Their predictive models achieved exceptional R2 = 0.99 accuracy for corrosion current prediction, demonstrating the effectiveness of integrated computational-experimental approaches.
2.3.2. Environmental Factor Analysis and Big Data Integration
Yang et al. [26] identified ambient temperature and relative humidity as primary environmental factors influencing atmospheric corrosion of low-alloy steel, with exposure time ranking third. Their atmospheric corrosion sensor integration with big data analytics provided dynamic monitoring capabilities, capturing real-time corrosion behavior under varying environmental conditions over 9-month exposure periods.
The F-index evaluation methodology [F = (QB - QEle)/(QB + QEle)] enabled quantitative corrosion resistance assessment, revealing optimal performance through protective SnO2 film formation and enhanced α-FeOOH development with α/γ* ratios following 2Sn > 3Sn > 1Sn > 0Sn. This work demonstrated that 0.2 wt% Sn addition minimized temperature contribution to corrosion acceleration across 15-30°C ranges.
2.3.3. Research Extension Opportunity
While Yang et al. [26] successfully optimized compositional parameters through data-driven approaches, systematic investigation of thermal processing parameters (annealing time, temperature) combined with temporal progression modeling remains unexplored. Current approaches focus on environmental correlation and compositional optimization without addressing systematic thermal treatment effects on microstructure-corrosion relationships in SEM-based analysis.
2.4. Research Gaps and Technical Challenges
2.4.1. Temporal-Thermal Correlation Gap
State-of-the-art approaches treat corrosion detection as static image analysis problems, ignoring temporal dynamics crucial for understanding degradation evolution. While Yang et al. [26] demonstrated environmental correlation over extended periods, no existing studies address systematic temporal progression modeling in SEM analysis combined with thermal treatment parameter variation (annealing conditions affecting microstructure-corrosion relationships).
2.4.2. Annotation Scalability for Industrial Implementation
High-performing segmentation approaches require extensive manual annotation for optimal performance, presenting significant scalability challenges for industrial deployment. The tension between research-grade accuracy and industrial scalability remains unaddressed, limiting practical implementation potential for large-scale SEM-based corrosion assessment systems [10,12,27].
2.5. Technical Contributions and Performance Positioning
2.5.1. Novel Framework Contributions
This work addresses identified gaps through systematic technical innovations:
Temporal-thermal correlation framework: First systematic integration of temporal progression modeling (1, 7, 14, 21 days of exposure) with thermal processing analysis (AN_60, AN_90, and AN_120 minutes of annealing), enabling comprehensive processing-performance correlation extending beyond existing compositional optimization approaches [26].
Dual annotation strategy: Achieves flexibility between research accuracy (89.91% mIoU with manual annotation) and industrial scalability (80.67% mIoU with automated annotation), representing a 9.24% improvement over automated approaches while addressing practical deployment scalability challenges [10,20,27,28,29].
Integrated multi-modal architecture: YOLOv8-seg (640×640 input processing, 32 prototype-based mask generation) combined with EfficientNet-B0 classification provides unified spatial-temporal analysis within a single framework, advancing beyond environmental correlation approaches to systematic processing-performance analysis [12,30,31].
2.5.2. Performance Positioning Against Direct Competitors
Table 1 shows the performance comparison against direct competitors, highlighting the advantages of the proposed approach in the context of SEM-based corrosion analysis and segmentation. The current work demonstrates strong performance in SEM temporal–thermal analysis, achieving 89.91% mIoU and 93.75% classification accuracy, while addressing both spatial segmentation and temporal behavior.
In comparison, Yang et al. focus on compositional optimization with high predictive accuracy but do not explore thermal processing effects. YOLOv8-based industrial detection reports high accuracy and F1-score but is limited to static analysis without temporal correlation. Zhao et al. achieve high-precision SEM segmentation; however, temporal progression is not considered. Similarly, YOLOv3 and YOLOv5-based metal surface segmentation improves accuracy but lacks annealing or thermal correlation. Overall, the comparison demonstrates that the proposed method uniquely integrates segmentation accuracy, temporal analysis, and thermal relevance, positioning it favorably against existing state-of-the-art approaches.
2.5.3. Quantitative Technical Advantages
Superior segmentation performance: 89.91% mIoU with manual annotation demonstrates significant improvement over the automated baseline (80.67%), with 94.69% ROC-AUC showing exceptional discriminative capability for corrosion region identification in SEM imagery [10,17].
Enhanced classification accuracy: 93.75% accuracy with EfficientNet-B0 represents a 12.5% improvement over the ResNet18 baseline, with temporal-based severity assessment (1 hr→7 days→14-21 days) enabling degradation progression analysis unavailable in existing approaches.
Industrial deployment capability: YOLOv8-seg architecture supports real-time 640×640 input processing with prototype-based mask generation, enabling practical industrial implementation through a dual annotation strategy balancing accuracy and scalability requirements [10,27,29].
Systematic processing-performance correlation: Controlled experimental design with systematic variation of temporal (4 exposure durations) and thermal (3 annealing conditions) parameters enables quantitative annealing-corrosion relationship assessment, extending data-driven optimization approaches from compositional to thermal processing analysis.
The following methodology section details the implementation of this comprehensive temporal-thermal correlation framework, demonstrating measurable performance advances through systematic integration of material processing parameters with temporal progression modeling for automated SEM-based corrosion assessment.
3. Methodology
3.1. System Architecture Overview
This work presents a three-stage AI pipeline for automated corrosion analysis of SEM images. We designed the system architecture with sequential processing stages that handle both classification and segmentation tasks across three annealing conditions (AN_60, AN_90, and AN_120), as shown in Figure 1. The integrated framework delivers complete corrosion assessment capabilities through modular design, allowing standalone segmentation analysis for spatial localization and unified classification-segmentation analysis for complete corrosion characterization. This architecture accommodates both research applications requiring detailed analysis and industrial scenarios demanding rapid assessment capabilities. Additionally, the system quantitatively evaluates model performance using standard classification and segmentation metrics.
3.2. Dataset Construction and Experimental Design
3.2.1. Experimental Framework
Table 2 shows the experimental design matrix, summarizing the key parameters and conditions used to ensure comprehensive and systematic evaluation of corrosion behavior. A complete SEM dataset was systematically constructed to investigate corrosion progression across temporal and thermal treatment parameters. The dataset captures corrosion states at four distinct temporal intervals (1 hour, 7 days, 14 days, and 21 days) under controlled environmental exposure conditions, enabling quantitative analysis of degradation evolution patterns.
3.2.2. Thermal Treatment Protocol
Three distinct annealing conditions were applied to evaluate thermal treatment effects on corrosion resistance. AN_60 (60-minute annealing) represents short-term thermal treatment resulting in limited grain growth and residual stress conditions with preserved manufacturing-induced microstructural characteristics. AN_90 (90-minute annealing) provides intermediate thermal treatment with partial stress relief and initial grain refinement, achieving balance between stress relief and grain structure optimization. AN_120 (120-minute annealing) ensures complete stress relief and effective grain structure development through extended thermal processing for maximum microstructural optimization.
3.2.3. Data Pre-Processing Pipeline
A detailed preprocessing pipeline was developed to ensure data quality and consistency for DL applications. Image preprocessing operations included manual cropping to remove extraneous magnification labels, scale bars, and metadata overlays, followed by metadata normalization using standardized lookup tables for consistent parameter documentation. Quality control validation ensured uniform imaging parameters across all samples, with format standardization for DL framework compatibility.
3.2.4. Dataset Partitioning Strategy
Dataset partitioning strategies were optimized for specific task requirements. Classification tasks employed a three-way split (training, validation, testing) to enable complete model evaluation and prevent overfitting. Segmentation tasks utilized a two-way split (training, validation) to maximize training data availability for complex pixel-wise learning requirements.
3.2.5. Data Augmentation Framework
Task-specific augmentation strategies were designed to enhance dataset diversity while preserving critical corrosion morphology characteristics. Classification augmentation applied standard transformation protocols to the complete 96-image dataset, including geometric transformations, photometric adjustments, and regularization methods while preserving temporal progression characteristics essential for severity classification. Segmentation augmentation took a dual approach with manual annotation employing 4× augmentation multiplication on 96 high-quality images, generating 384 training samples through horizontal/vertical flips, controlled rotational variations, affine transformations maintaining spatial relationships, and illumination adjustments addressing imaging variability. Automated annotation utilized variable dataset with NPY-generated segmentation masks for scalable large-scale applications. Figure 2 shows original and augmented images across different classes.
3.3. Classification Pipeline
3.3.1. Temporal-Based Classification Framework
The classification system was designed to generate predictions across three distinct temporal corrosion severity categories based on exposure duration and corresponding material degradation patterns. The framework addresses early-stage corrosion (1-hour exposure, Label 0) with minimal surface degradation, intermediate corrosion (7-day exposure, Label 1) with visible surface changes, and advanced corrosion (14-21day exposure, Label 2) with significant material degradation. Figure 3 illustrates the corrosion severity categories, visually defining the low, moderate, and severe classes used for classification and analysis.
3.3.2. Model Architecture Implementation
Two convolutional neural network architectures were selected for multi-class corrosion severity assessment. EfficientNet-B0 served as the primary architecture employing compound scaling optimization for balanced performance and computational efficiency, enabling automated assessment of corrosion progression with consistent AI-driven classification. ResNet-18 functioned as the baseline comparison model utilizing residual learning mechanisms for feature extraction, providing performance benchmarking against the primary architecture.
3.3.3. Training Strategy
A refined two-phase training approach was adopted for effective feature adaptation. Phase 1 employed frozen backbone training with trainable classification head for transfer learning from pre-trained weights. Phase 2 incorporated end-to-end fine-tuning with reduced learning rate for effective feature adaptation to corrosion-specific patterns, ensuring specialized learning for materials science applications.
3.3.4. Data Pre-Processing and Augmentation
The preprocessing pipeline addressed image standardization and enhancement requirements. Classification-specific preprocessing included grayscale conversion and resizing to 224×224 pixels with 3-channel format replication for architecture compatibility. Pixel intensity normalization followed standardization protocols:
where μ represents the dataset mean and σ represents the standard deviation.
Augmentation strategies incorporated random transforms including flips, rotations, affine transformations, and color jittering. Class balancing was achieved using weighted sampling with sklearn.utils.class-weight. Regularization techniques included Mix-up and dropout for enhanced generalization.
3.3.5. Performance Evaluation Framework
Model performance was quantitatively assessed using standard classification metrics including accuracy, precision, recall, F1-score, and confusion matrix analysis for detailed class-wise performance evaluation, enabling complete comparison between EfficientNet-B0 and ResNet-18 architectures.
Evaluation metrics used:
A 4-fold cross-validation scheme was employed to assess model generalizability and prevent overfitting. The dataset was stratified by class labels and split into 80% training, 10% validation, and 10% testing subsets.
Classification performance was evaluated using the following metrics:
Accuracy: Overall proportion of correct predictions
Precision (P) = TP/(TP + FP): Proportion of correctly predicted positives
Recall (R) = TP/(TP + FN): Ability to identify actual positives
F1-score = 2 × (Precision × Recall)/(Precision + Recall): Harmonic mean of precision and recall
Confusion matrix analysis: Detailed breakdown of class-wise prediction outcomes
These metrics enabled a complete comparison between EfficientNet-B0 and ResNet-18, providing insights into class-specific performance across all corrosion severity levels.
3.3.6. Gradient-Weighted Class Activation Mapping
GradCAM analysis was applied to provide visual interpretation of classification model decision-making processes, generating attention heatmaps highlighting critical regions within SEM images that contribute most significantly to classification predictions across different corrosion severity levels.
3.4. Segmentation Pipeline
3.4.1. Segmentation Framework
The segmentation framework was designed to perform accurate segmentation of corrosion-affected regions for quantitative assessment of material degradation in SEM imagery. The framework employs instance segmentation methodology to distinguish between corroded and non-corroded regions at the pixel level, enabling precise boundary detection and quantitative area measurements [32].
3.4.2. Dual Annotation Methodology
Two distinct annotation approaches were explored to evaluate performance trade-offs between operational efficiency and segmentation precision. Automated annotation utilized automatically generated ground truth from NPY segmentation masks, providing scalable processing capabilities for large datasets without manual intervention requirements targeting industrial screening applications. Manual annotation employed expert-generated ground truth masks enhanced with 4× data augmentation strategies, providing high-precision reference standards for model training and evaluation targeting research applications requiring maximum spatial accuracy. Table 3 presents the segmentation annotation strategy comparison, highlighting the differences between automated and augmented annotation approaches, and their impact on segmentation performance. Figure 4 presents the original images alongside their annotated counterparts, highlighting the quality and accuracy of the segmentation labels used for model training and evaluation.
3.4.3. YOLOv8 Architecture Implementation
The segmentation pipeline employed YOLOv8 architecture configured for multi-class corrosion detection across three annealing conditions (AN_60, AN_90, AN_120), providing real-time object detection and segmentation capabilities with integrated functionality for complete corrosion analysis.
3.4.4. Training Configuration
Both segmentation models underwent identical training protocols with different annotation strategies. YOLO Automated utilized variable dataset size with fully automated NPY-generated masks, while YOLO Augmented employed 96 base images with manual annotation enhanced through 4× augmentation techniques, generating 384 training samples. Both models were trained for 200 epochs using train/validation data splits optimized for segmentation task requirements.
3.4.5. Performance Analysis Framework
Detailed evaluation employed multiple quantitative metrics for segmentation assessment. Spatial accuracy assessment utilized Mean Intersection over Union (IoU), Box/Mask Precision, and Recall for boundary detection assessment.
Detection performance was evaluated using mAP50 and mAP50-95 for both box and mask detection across varying IoU thresholds. Discriminative analysis employed ROC curve analysis and AUC performance metrics for class separation evaluation. Sample-level evaluation assessed individual image performance correlation with corrosion characteristics and morphological complexity.
Evaluation metrics used:
All segmentation models were evaluated using quantitative spatial and object-level metrics. The dataset was split into 80% training and 20% validation. Four-fold cross-validation was applied to ensure stability and generalizability of segmentation results.
Mean intersection over union (IoU):
IoU measures the overlap between predicted and actual segmentation masks, calculated as the ratio of their intersection over union. Higher IoU indicates better pixel-wise prediction accuracy.
where A is the predicted segmentation mask and B is the ground truth.
Box and mask detection metrics:
Mean Average Precision at 50% IoU threshold (mAP@50) and averaged from 50% to 95% in 5% steps (mAP@50--95) were calculated for both bounding boxes and masks. mAP@50 evaluates model detection accuracy at a strict IoU threshold of 0.5, while mAP@50--95 assesses performance across multiple thresholds (from 0.5 to 0.95 in 0.05 steps), reflecting both loose and strict matching.
mAP = mean(AP_1, AP_2, ..., AP_N)
ROC curve and AUC analysis:
ROC-AUC and Precision-Recall AUC scores were utilized to evaluate class separation and discriminative capacity.
GradCAM IoU evaluation:
Intersection over Union between GradCAM heat maps and ground truth corrosion regions was calculated to measure interpretability focus.
3.4.6. Segmentation Interpretability Analysis
Gradient-weighted class activation mapping (Grad-CAM) visualization was applied to the segmentation framework to provide interpretability analysis, validating model attention mechanisms during the segmentation process and ensuring focus on corrosion-relevant features rather than artifacts or background elements.
3.4.7. Model Interpretability and Visualization Framework
Model interpretability represents a critical requirement for establishing trust and validation in DL applications within materials science domains. The interpretability framework implements the GradCAM methodology to generate visual explanations for both classification and segmentation tasks. The validation framework provides quantitative validation metrics that establish correlation between automated attention patterns and expert-identified corrosion regions, ensuring model decisions align with established materials science principles and domain expertise.
3.4.8. Integrated Pipeline Framework
The complete methodology provides a modular processing framework capable of independent classification analysis for temporal corrosion severity assessment using EfficientNet-B0 and ResNet-18 architectures, standalone segmentation analysis for precise spatial corrosion localization with dual annotation approaches, and unified classification-segmentation analysis for complete corrosion characterization combining temporal and spatial assessment. The unified pipeline generates detailed corrosion analysis reports combining temporal severity assessment with spatial localization capabilities, supporting both research applications requiring detailed analysis and industrial scenarios demanding rapid assessment capabilities through automated, objective evaluation of material degradation across varying thermal treatment conditions and temporal exposure scenarios. Table 4 provides a summary of the performance evaluation metrics, outlining the key quantitative measures used to assess segmentation and classification effectiveness across the evaluated models.
4. Results
4.1. Segmentation Results
A. Mean IoU Comparison
The results show that YOLO augmented model consistently outperforms the YOLO automated model across all evaluated metrics, highlighting the effectiveness of enhanced data preparation. The augmented approach achieves a mean IoU of 89.91, representing a 9.24-point improvement over the automated method, indicating more accurate spatial alignment between predictions and ground truth. Box-level detection performance shows particularly strong gains, with the augmented model reaching 98.6% mAP@50, compared to 86.6% for the automated approach, reflecting substantial improvements in both localization accuracy and detection reliability. These results confirm that augmentation significantly enhances model robustness and generalization, especially in applications requiring high precision and recall. Table 5 presents the mean IoU comparison, highlighting the segmentation accuracy differences between models and annotation strategies.
B. mAP@50/mAP@50–95Comparison
The results show a substantial performance improvement of the YOLO Augmented model over the YOLO Automated model across both detection and segmentation metrics. For bounding box detection, the augmented approach achieves a Box mAP@50 of 98.6%, significantly higher than 86.6% obtained with automated training, and also demonstrates strong localization robustness with 91.2% mAP@50–95 compared to 55.1%. Similarly, segmentation performance improves markedly, with Mask mAP@50 increasing from 63.6% to 98.6% and Mask mAP@50–95 rising from 24.0% to 82.1%, indicating far superior accuracy across stricter IoU thresholds. Overall, these results confirm that augmentation leads to more consistent, high-quality predictions, particularly for tasks requiring precise localization and detailed mask boundaries. Table 6 presents the mAP@50 and mAP@50–95 comparison, evaluating segmentation performance under both relaxed and strict IoU thresholds across the compared methods.
C. ROC AUC & Precision-Recall AUC
The YOLO Augmented model demonstrates strong and consistent classification performance, as evidenced by its ROC and Precision–Recall evaluation metrics. The model achieves a ROC AUC of 94.69%, indicating excellent class separability with a high true positive rate and low false positive rate across thresholds. Complementing this, the Precision–Recall AUC of 95.45% reflects a superior balance between precision and recall, which is particularly important for datasets with class imbalance. The mean AUC of 93.70% and a narrow AUC range of 88–95% further indicate stable and reliable performance across samples, with predictions tightly clustered in a high-performance region. Overall, the ROC and PR curves confirm that the augmented model provides robust, discriminative, and generalizable detection capability suitable for high-reliability applications. Table 7 summarizes the ROC AUC and Precision–Recall AUC results, highlighting the classification capability and robustness of the evaluated models across varying decision thresholds. Figure 5 shows the ROC curve, highlighting segmentation performance. Figure 6 illustrates the distribution of ROC values, showing the consistency and variability of the model’s performance.
D. Grad-CAM Analysis
The YOLO Augmented model demonstrates strong and interpretable attention behavior in the Grad-CAM analysis, reinforcing its segmentation performance. As shown in Table 12, the model achieves a mean Grad-CAM IoU of 78.79%, with a best-case IoU of 91.47%, indicating that the regions driving the model’s predictions closely align with the ground-truth segmentation masks. Even in the worst case, the Grad-CAM IoU remains at 67.24%, reflecting stable and reliable attention localization. The reported +3.8% improvement in attention quality highlights the positive impact of augmentation in guiding the model to focus on meaningful object features rather than background noise. Visual overlays further confirm that activation maps concentrate on object interiors and boundaries, resulting in superior feature focus and improved interpretability, which supports both the quantitative segmentation gains and the trustworthiness of the YOLO Augmented model. Table 8 summarizes the Grad-CAM performance, quantifying how well the model’s attention maps align with ground-truth segmentation regions and supporting the interpretability of the segmentation results. Figure 7 presents the Grad-CAM analysis, visually demonstrating the regions of interest that most influence the model’s segmentation predictions and confirming focused attention on corrosion areas.
4.2. Classification Results
A. Model Results Comparison
The results demonstrate a clear performance advantage of the EfficientNet-B0 architecture over the ResNet-18 baseline. Using a two-phase fine-tuning strategy combined with temporal-based severity class definitions and grayscale preprocessing with data augmentation, EfficientNet-B0 achieves an accuracy of 93.75%, substantially outperforming the 79.60% accuracy obtained by ResNet-18 trained with standard preprocessing and training procedures. This improvement highlights the effectiveness of both the advanced training strategy and enhanced preprocessing in capturing discriminative features, while also showing that EfficientNet-B0 provides superior representational capacity and generalization compared to the baseline model. Table 9 compares the classification models, highlighting differences in accuracy and performance to identify the most effective architecture for corrosion severity classification.
B. Confusion Matrix
The confusion matrix summarizes the classification performance across three corrosion severity classes: low, moderate, and severe corrosion. The model shows excellent accuracy for low and severe corrosion, correctly classifying 6 out of 6 low-corrosion images and 7 out of 7 severe-corrosion images, indicating strong separability for these classes. Most misclassification occurs in the moderate corrosion category, where 2 images are correctly identified while 1 image is misclassified as low corrosion, suggesting partial overlap in visual features between low and moderate severity. Notably, there are no confusions involving the severe corrosion class, highlighting the model’s robustness in detecting critical cases. Overall, the confusion matrix indicates high classification reliability, with errors limited and primarily concentrated in adjacent severity levels, which is expected in progressive condition assessment tasks. Figure 8 shows the confusion matrix, illustrating the classification accuracy across corrosion severity classes and highlighting patterns of correct predictions and misclassifications.
5. Discussion
5.1. Overall Corrosion Segmentation Performance Analysis
A comprehensive evaluation focused on segmentation metrics demonstrates the clear superiority of the YOLO Augmented approach over the automated annotation baseline. The augmented model achieves a mean IoU of 89.91,which indicates significantly more accurate spatial alignment between predicted masks and ground truth corrosion regions.
Segmentation performance shows substantial gains across IoU thresholds, with Mask mAP@50 improving from 63.6% to 98.6% and Mask mAP@50–95 increasing from 24.0% to 82.1%, highlighting the model’s ability to produce precise and consistent masks even under stricter evaluation criteria. These improvements confirm stronger boundary delineation and reduced under-segmentation in complex corrosion patterns. Complementing the quantitative results, Grad-CAM analysis provides qualitative validation by demonstrating that the augmented model consistently focuses on true corrosion regions and boundaries, with activation maps closely aligned to the predicted segmentation masks.
This attention behavior indicates that the model has learned meaningful spatial and structural features rather than relying on background noise. Overall, the results confirm that augmentation significantly enhances segmentation accuracy, robustness, and interpretability, making the YOLO Augmented model highly effective for reliable corrosion segmentation tasks.
5.2. Overall Classification Performance Analysis
The classification results demonstrate a clear performance advantage of the EfficientNet-B0 architecture over the ResNet-18 baseline, highlighting the effectiveness of the proposed training strategy. By employing a two-phase fine-tuning approach along with temporal-based severity class definitions and grayscale preprocessing with data augmentation, EfficientNet-B0 achieves a classification accuracy of 93.75%, substantially outperforming the 79.60% accuracy obtained using standard training and preprocessing. This improvement reflects the model’s enhanced ability to learn discriminative features and generalize across corrosion severity levels.
The confusion matrix further supports this observation, showing perfect classification for both low and severe corrosion classes, which indicates strong separability for clearly defined severity categories. Minor misclassification is limited to the moderate corrosion class, where a small overlap with low corrosion is observed, consistent with the gradual and progressive nature of corrosion. Importantly, no samples are incorrectly classified as severe corrosion, underscoring the model’s reliability in identifying critical cases. Overall, these results confirm that the proposed approach delivers highly accurate, robust, and clinically reliable corrosion severity classification.
5.3. Synergistic Effect of the Two-Stage Framework
Integrating YOLOv8-seg for instance segmentation with EfficientNet-B0 for severity classification provided a synergistic benefit over single-model approaches. The modular design allows precise localization of corroded regions, followed by an in-depth analysis of their morphological characteristics. This workflow reduces the dependency on manual inspection and enhances reproducibility in quantitative corrosion assessment.
Additionally, the framework’s lightweight computational footprint supports near-real-time processing, enabling potential integration into industrial inspection pipelines and predictive maintenance systems. It is a useful tool for large-scale projects like aerospace, marine, and energy infrastructure because it can automate corrosion analysis while still being easy to understand. This innovation streamlines the inspection process and significantly improves the accuracy of corrosion detection. As industries increasingly adopt such technologies, the potential for predictive maintenance will lead to reduced downtime and enhanced safety in high-stakes environments.
6. Conclusions
The proposed two-stage deep learning framework effectively addresses the challenges of corrosion detection and severity estimation on metallic surfaces, leveraging high-resolution SEM images. The integration of YOLOv8-seg for instance-level segmentation and EfficientNet-B0/ResNet18 for severity classification enabled precise identification of corrosion regions while ensuring accurate severity assessment. The use of both manually annotated and automatically generated masks strengthened the robustness of segmentation, yielding an mIoU of 89.91, a mask mAP@50 of 98.6, and a ROC-AUC of 94.69. For severity classification, EfficientNet-B0 achieved superior performance, with an accuracy of 93.75% and an F1-score of 93.29, outperforming ResNet18. These outcomes demonstrate that lightweight yet high-performing models can be effectively combined to deliver reliable and scalable automated corrosion analysis. Overall, the findings demonstrate the potential of this approach to serve as a practical alternative to manual inspection methods, supporting real-time industrial workflows and advancing intelligent material diagnostics for enhanced safety and structural integrity.
Author Contributions
Conceptualization was done by S.A ., S.M and S.N.; methodology was done by T.K., C.S.,H.S.,O.U.E.A.,A.B.,U.K.,P.K.M.&S.N.; validation was done by S.A., S.M., and Y.K.L.; formal analysis was done by S.A., S.M., and Y.K.L.; writing original draft was done by T.K., C.S.,H.S.,O.U.E.A.,A.B.,U.K.,P.K.M. .&S.N.; writing—original draft preparation, S.A. and S.M.; writing—review and editing, S.A. and S.M.; supervision, Y.K.L.; project administration, Y.K.L.; funding acquisition, Y.K.L. All authors have read and agreed to the published version of the manuscript.
Funding
The authors appreciate the support provided by the Ministry of Education and Busan Metropolitan City on the project “Busan Regional Innovation and Education (RISE).
Conflicts of Interest
The authors declare no conflict of interest.
References
- Corrosion Confusion? Advanced Corrosion Resistance Made Simple - Auxbolts. Available online: https://www.auxbolts.com/advanced-corrosion-resistance/.
- Forkan, A.R.M. CorrDetector: A framework for structural corrosion detection from drone images using ensemble deep learning. Expert Syst. Appl. 2022, vol. 193, 116461. [Google Scholar] [CrossRef]
- Mohapatra, S.; Satpathy, B.; Sarkar, A.; Kumar, S.; Aich, S. Recent advances in medium - manganese steel: a review of key findings, challenges, and future perspectives. J. Mater. Sci. 2024, no. 0123456789. [Google Scholar] [CrossRef]
- Bender, R. Corrosion challenges towards a sustainable society. Mater. Corros. 2022, vol. 73(no. 11), 1730–1751. [Google Scholar] [CrossRef]
- Oyedeji, O.A.; Khan, S.; Erkoyuncu, J.A. Application of CNN for multiple phase corrosion identification and region detection. Appl. Soft Comput. 2024, vol. 164, 112008. [Google Scholar] [CrossRef]
- Mohapatra, S.; Palai, D.; Satpathy, B.; Das, S.; Das, K. Electrochemical study of intercritically annealed Fe-0.18C-7Mn-4Al steel. Mater. Today Commun. 2022, vol. 34, 105282, 2023. [Google Scholar] [CrossRef]
- Turnbull, A. Corrosion pitting and environmentally assisted small crack growth. Proc. R. Soc. A Math. Phys. Eng. Sci. 2014, vol. 470(no. 2169), 20140254. [Google Scholar] [CrossRef]
- Li, Y.; Li, H.; Guan, Y.; Zhang, X. Dense metal corrosion depth estimation. 2023, no. September, 1–14. [Google Scholar] [CrossRef]
- Rajendran, M.; Subbian, D. Deep learning in corrosion assessment and control: A critical review of techniques and challenges. Corros. Rev. 1–20, 2025. [CrossRef]
- Burton, B.; Nash, W.T.; Birbilis, N. RustSEG: Automated segmentation of corrosion using deep learning. Comput. Vis. pattern Recognit. 2022, 1–30. [Google Scholar]
- Shirsath, K.; Parjane, V.A.; Meherkhamb, A.; Ratnaparkhi, S.; Kanade, S. review paper of deep learning for automated corrosion detection. 2022, no. 02, 955–958. [Google Scholar]
- Farooqui, M. A Deep Learning Approach to Industrial Corrosion Detection. Comput. Mater. Contin. 2024, vol. 81(no. 2), 2587–2605. [Google Scholar] [CrossRef]
- You, A.; Be, M.; In, I. Estimation of rebar corrosion level using magnetic sensor array with convolutional neural network. 2016, 2025. [Google Scholar] [CrossRef]
- Casas, E.; Ramos, L.; Romero, C.; Rivas-Echeverría, F. A comparative study of YOLOv5 and YOLOv8 for corrosion segmentation tasks in metal surfaces. Array 2024, vol. 22, 100351. [Google Scholar] [CrossRef]
- Tao, S.S.D.-H.X.L.; Qin, Z.; Wu, Z.; Gao, Z.; Wang, J.; Hu, W.; Behnamian, Y.; Luo, J.-L. Review-material degradation assessed by digital image processing: Fundamentals, progresses, and challenges. Journal of Materials Sciences and Technology vol. 53(no. 0), 146–162.
- Nash, W.; Zheng, L.; Birbilis, N. Deep learning corrosion detection with confidence. npj Mater. Degrad. 2022, vol. 6(no. 1), 1–13. [Google Scholar] [CrossRef]
- Tan, L.; Chen, X.; Yuan, D.; Tang, T. DSNet: A Computer Vision-Based Detection and Corrosion Segmentation Network for Corroded Bolt Detection in Tunnel. 2024, vol. 2024. [Google Scholar] [CrossRef]
- Katsamenis, I.; Protopapadakis, E.; Doulamis, A.; Doulamis, N.; Voulodimos, A. Pixel-Level Corrosion Detection on Metal Constructions by Fusion of Deep Learning Semantic and Contour Segmentation. Advances in Visual Computing 2020, 160–169. [Google Scholar]
- Nash, W.T.; Powell, C.J.; Drummond, T.; Birbilis, N. Automated Corrosion Detection Using Crowdsourced Training for Deep Learning. Corrosion 2019, vol. 76(no. 2), 135–141. [Google Scholar] [CrossRef] [PubMed]
- Zhao, L.; Locke, J.; Xu, F.; Yao, T.; Guo, X. Accurate segmentation of localized corrosion in structural alloys via deep learning. npj Mater. Degrad. 2025, vol. 9. [Google Scholar] [CrossRef]
- Zhao, Z.; Bakar, E.; Razak, N.; Akhtar, M.N. Assessment of Corrosion Image Rating Based on Transfer Learning. Arab. J. Sci. Eng. 2024, vol. 50. [Google Scholar] [CrossRef]
- Zhao, Z.; Bakar, E.B.A.; Razak, N.B.A.; Akhtar, M.N. Corrosion image classification method based on EfficientNetV2. Heliyon 2024, vol. 10(no. 17), e36754. [Google Scholar] [CrossRef]
- Li, X.; Liu, C.; Zhou, D.; Yu, L.; Lu, X. A unified deep learning model for thermoacoustic instability detection in swirl premixed flames based on spatial-temporal features. Aerosp. Sci. Technol. vol. 159, 109994, 2025. [CrossRef]
- Abdulmutaali, A.; Aldrich, C.; Lepkova, K. Unsupervised process monitoring of corrosion based on electrochemical noise and multivariate image analysis. npj Mater. Degrad. vol. 9(no. 1), 43, 2025. [CrossRef]
- Cantero-Chinchilla, S.; Simpson, C.A.; Ballisat, A.; Croxford, A.J.; Wilcox, P.D. Convolutional neural networks for ultrasound corrosion profile time series regression. NDT E Int. 2023, vol. 133, 102756. [Google Scholar] [CrossRef]
- Yang, L.; Yang, X.; Wang, B.; Wang, Z.; Cheng, X.; Li, X. Corrosion resistance optimization of Sn-additional low-alloy high strength steel by data-driven identification and field exposure verification. J. Mater. Res. Technol. 2023, vol. 25, 3624–3641. [Google Scholar] [CrossRef]
- Chou, J.-S.; Liu, C.-Y.; Shih, H.-Y.; Lin, Z.-T. Automated annotation of steel corrosion in UAV-captured images from beneath bridge decks using metaheuristic-optimized computer vision. Structures vol. 75, 108696, 2025. [CrossRef]
- RajKumar, A. Unsupervised machine learning for automated corrosion staging using optical microscopy images. npj Mater. Degrad. vol. 9(no. 1), 83, 2025. [CrossRef]
- Lee, H.; Shin, H.H.; Maeng, S.; Kim, D.G.; Moon, H. Efficient Semi-automatic Annotation System based on Deep Learning. 2023, vol. 18(no. 6), 267–275. [Google Scholar]
- Song, G.; Fu, D.; Chang, W.; Fu, Z.; Ma, L.; Zhang, D. Corrosion resistant performance prediction in high-entropy alloys: A framework for model, interpretation and multi-dimensional visualization. Corros. Sci. vol. 255, 113105, 2025. [CrossRef]
- Alviz-Meza, A.; Hadechini-Meza, L.L.; Peña-Ballesteros, D.Y. Deep neural networks for external corrosion classification in industrial above-ground storage tanks. Heliyon 2024, vol. 10(no. 15), e34882. [Google Scholar] [CrossRef]
- Wang, J.; Sun, H.; Xiong, W.; Han, G.; Wu, D. Recognition of steel bridge corrosion considering the effect of training dataset quality. Case Stud. Constr. Mater. 2024, vol. 21, e03722. [Google Scholar] [CrossRef]
Figure 1.
Three stage analytical framework.
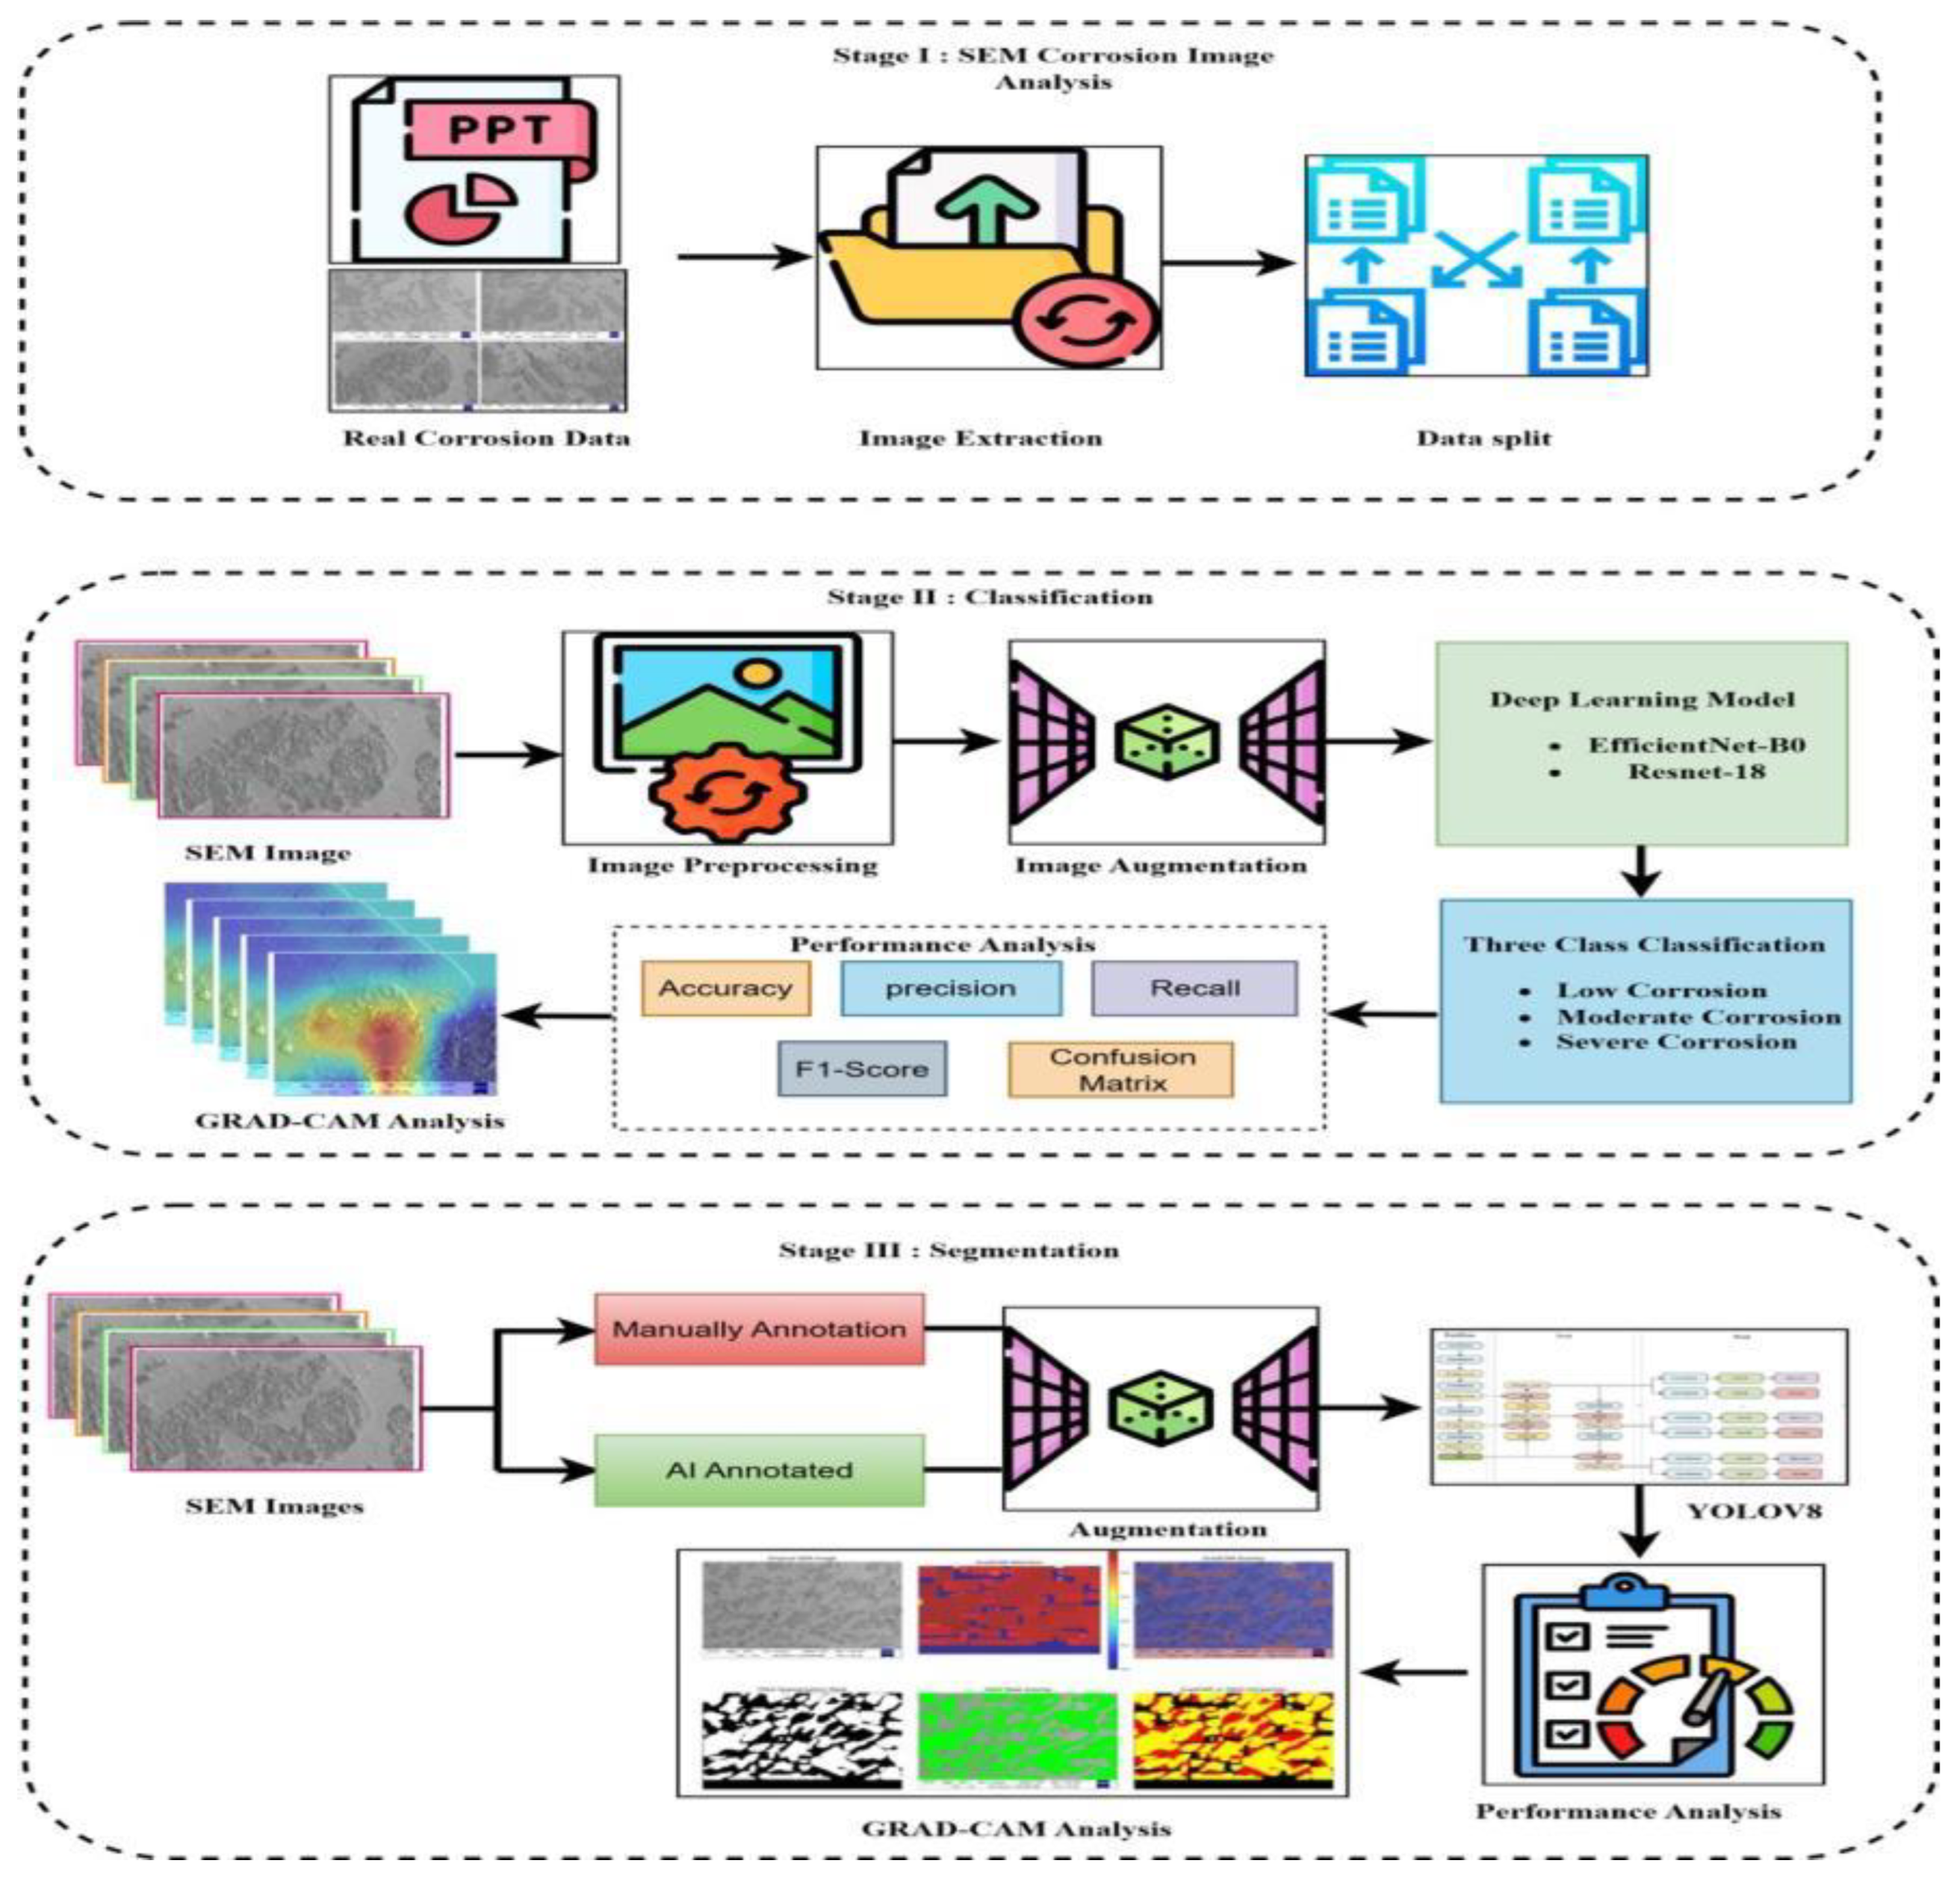
Figure 2.
Original and augmented images.
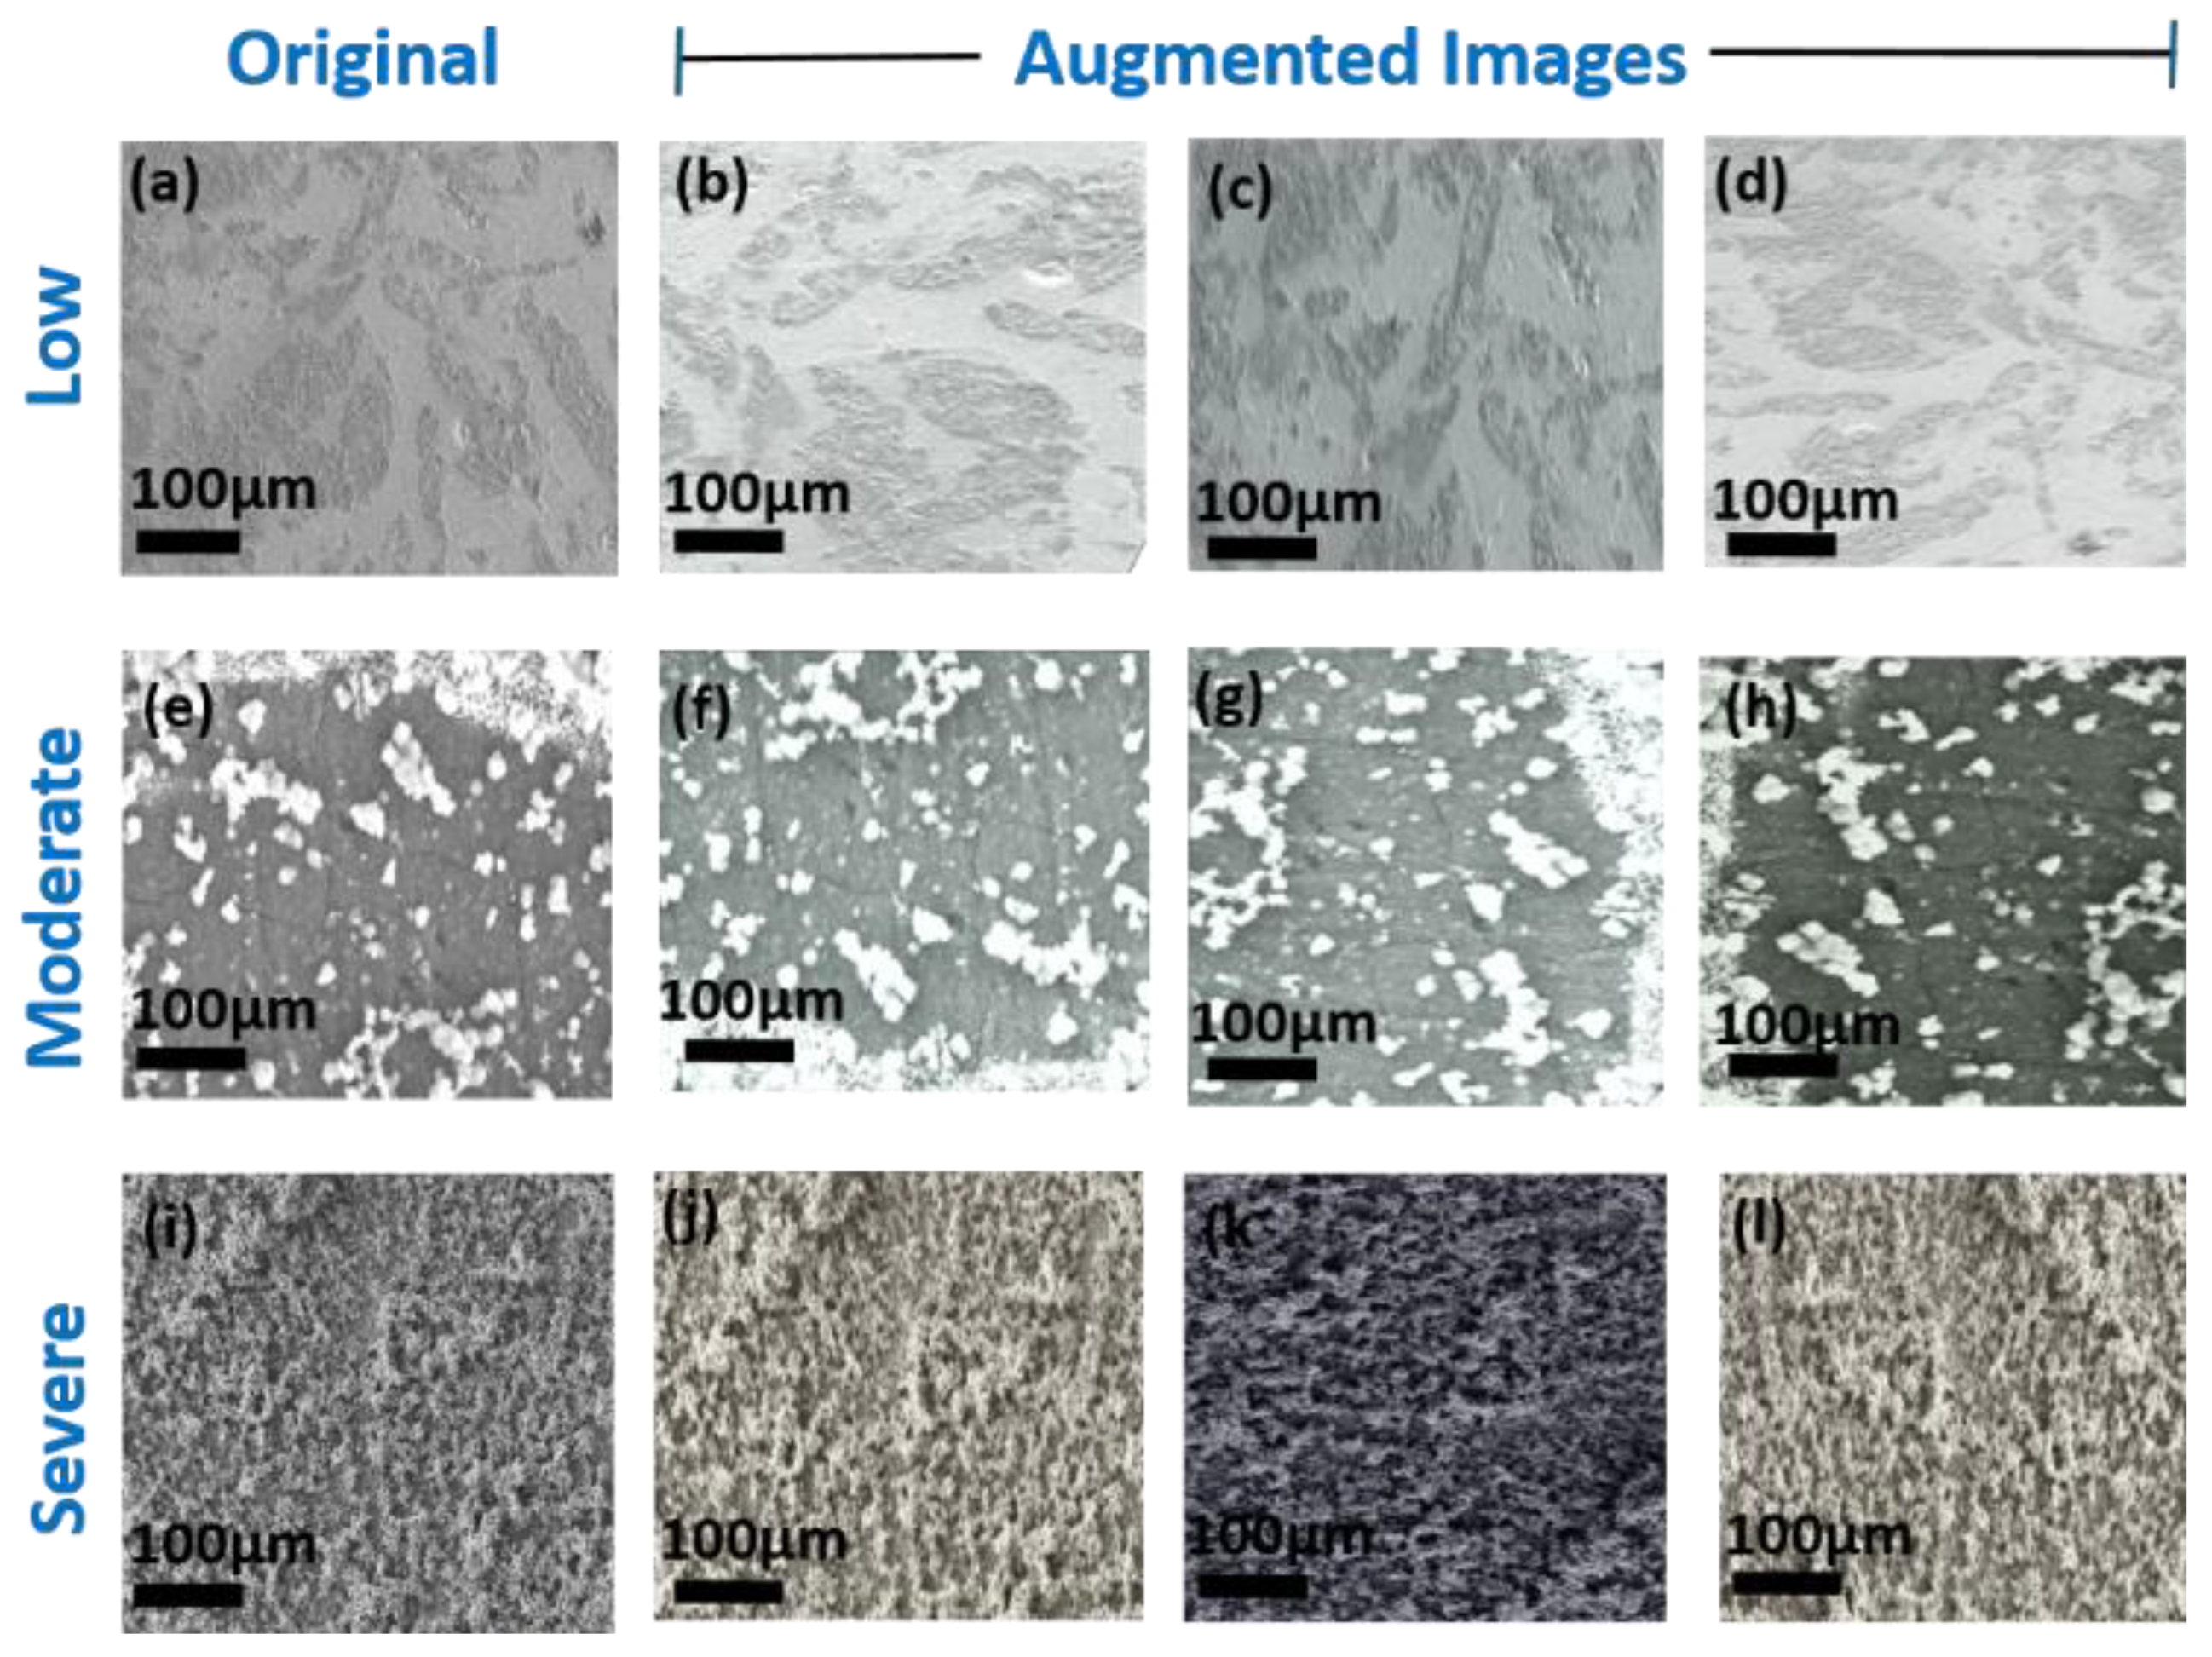
Figure 3.
Corrosion severity categories.
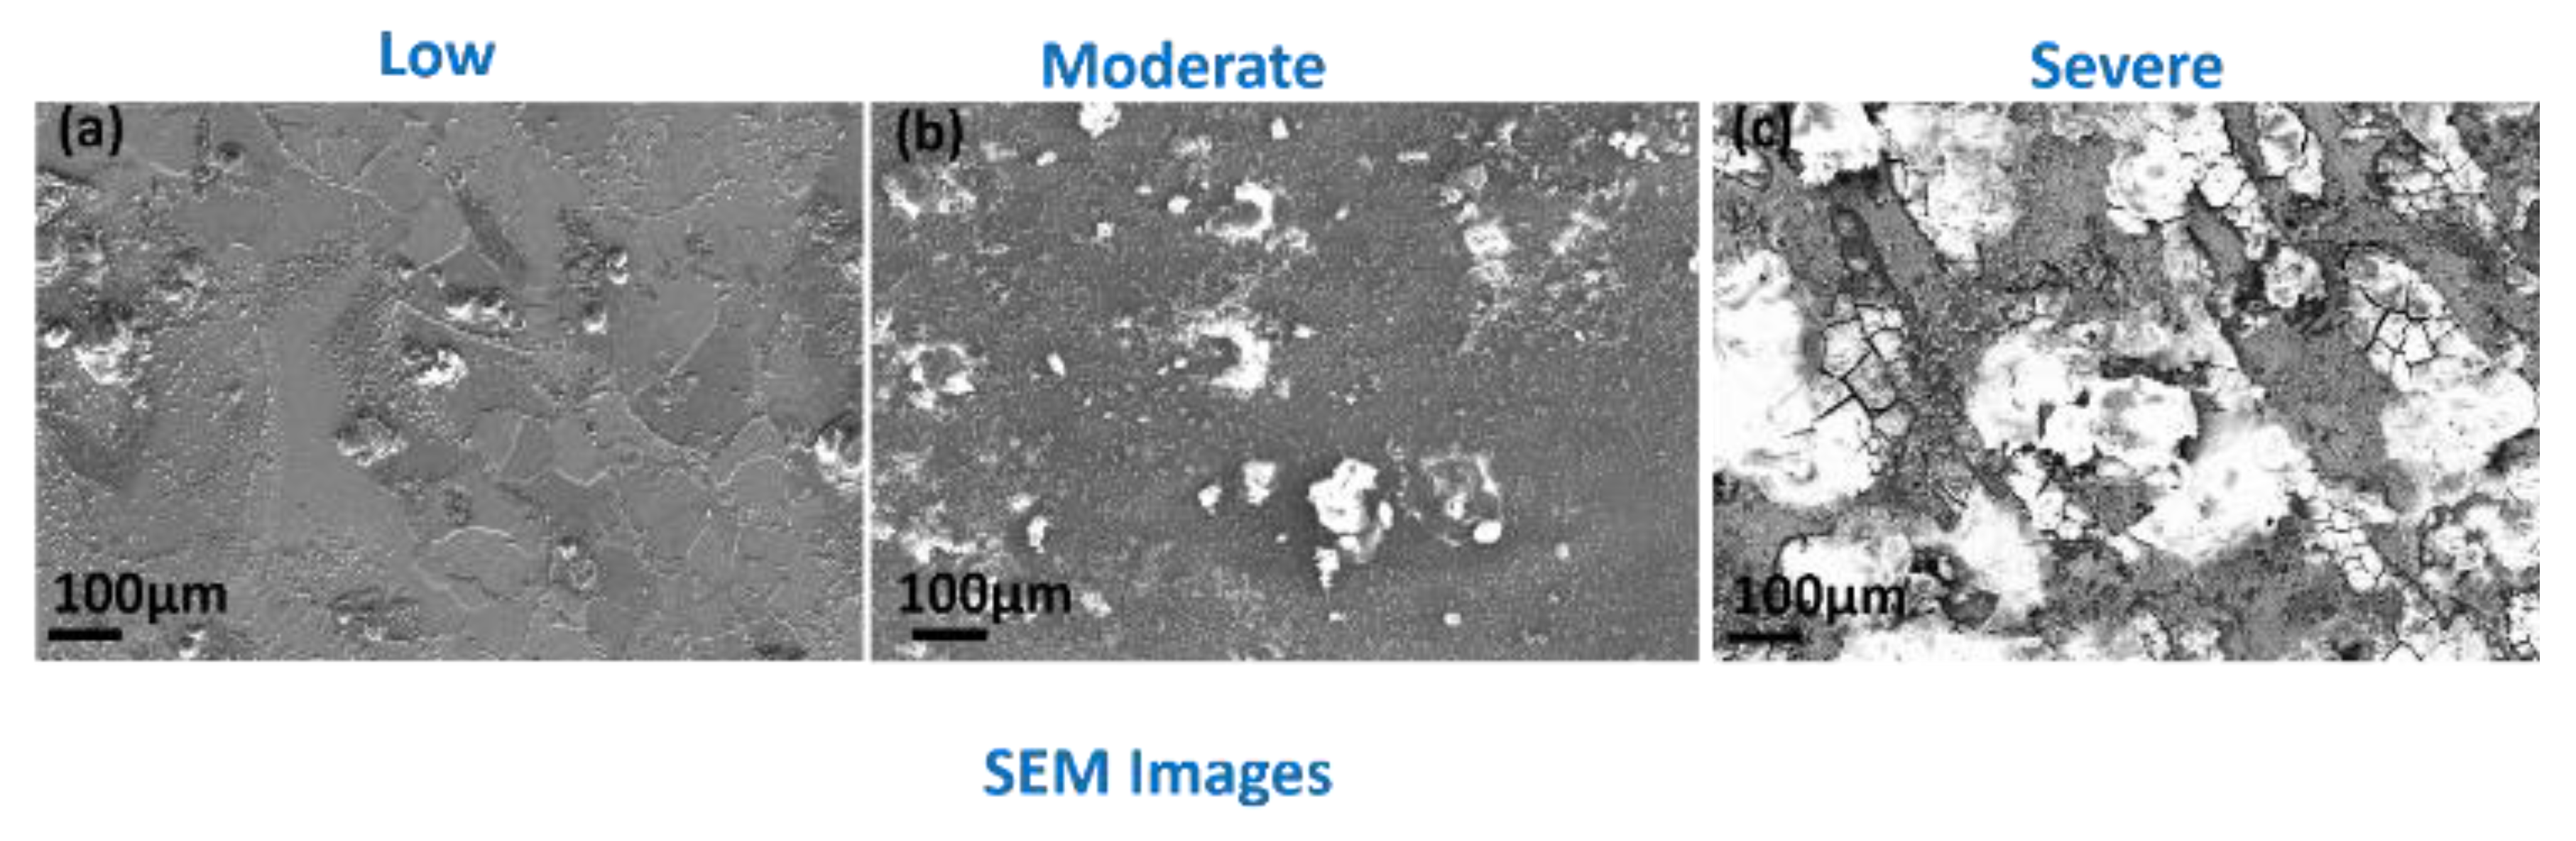
Figure 4.
Original and annotated images.
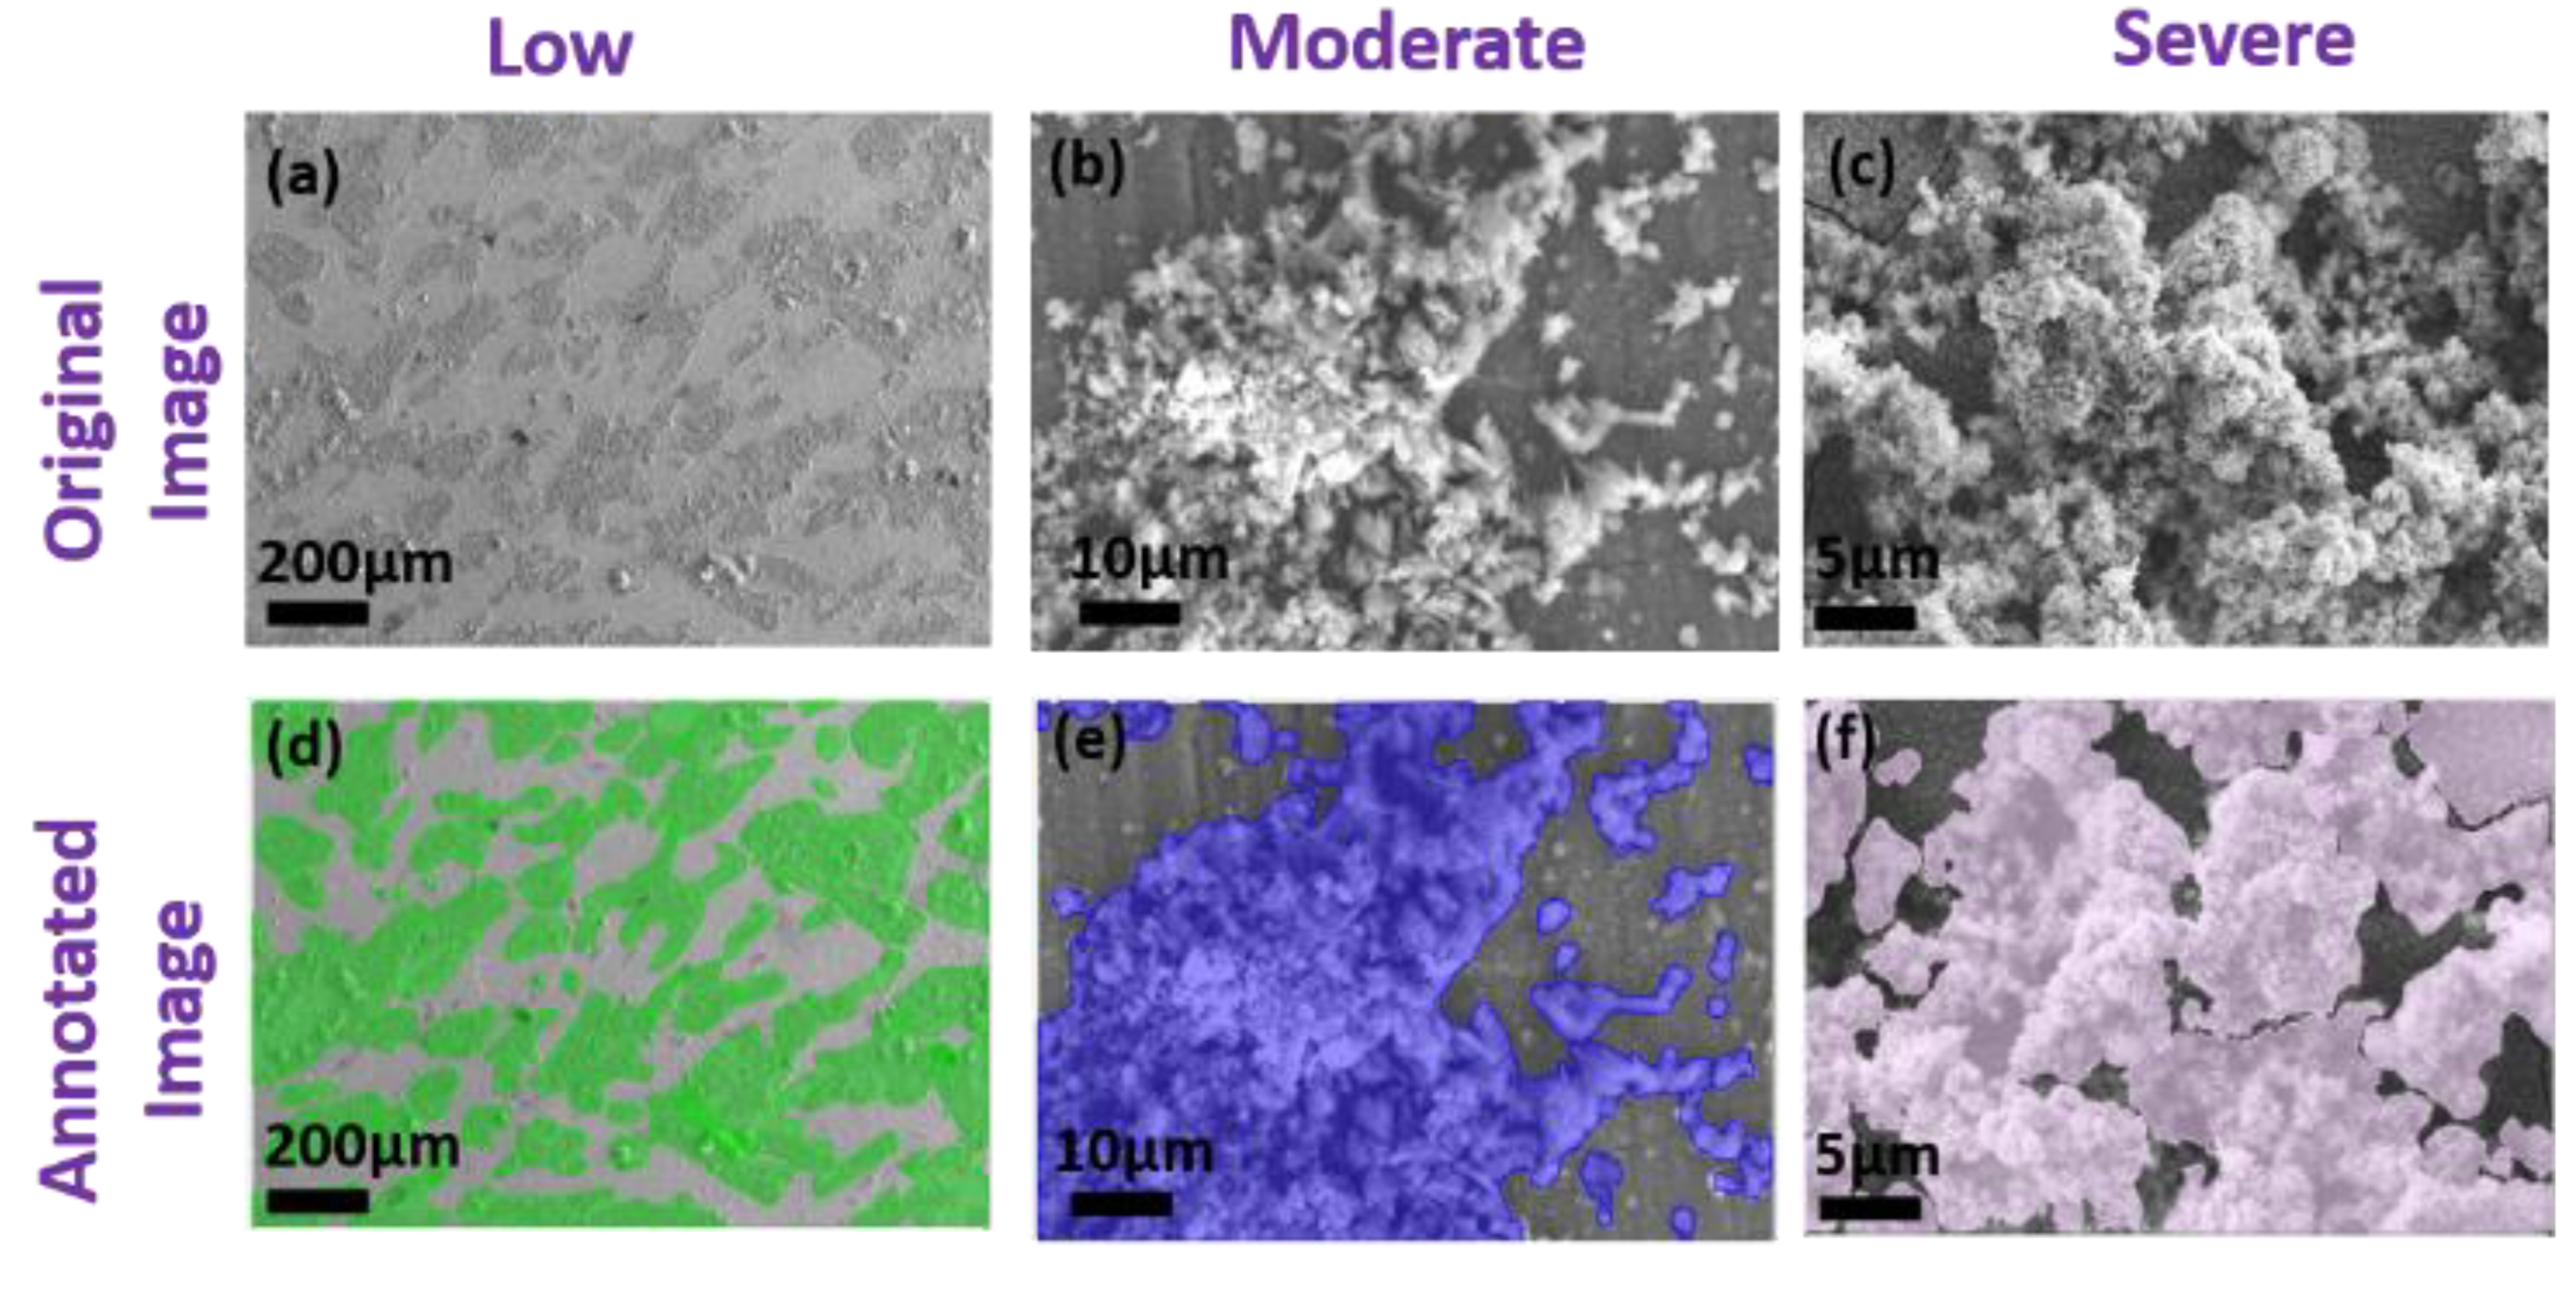
Figure 5.
ROC Curve.
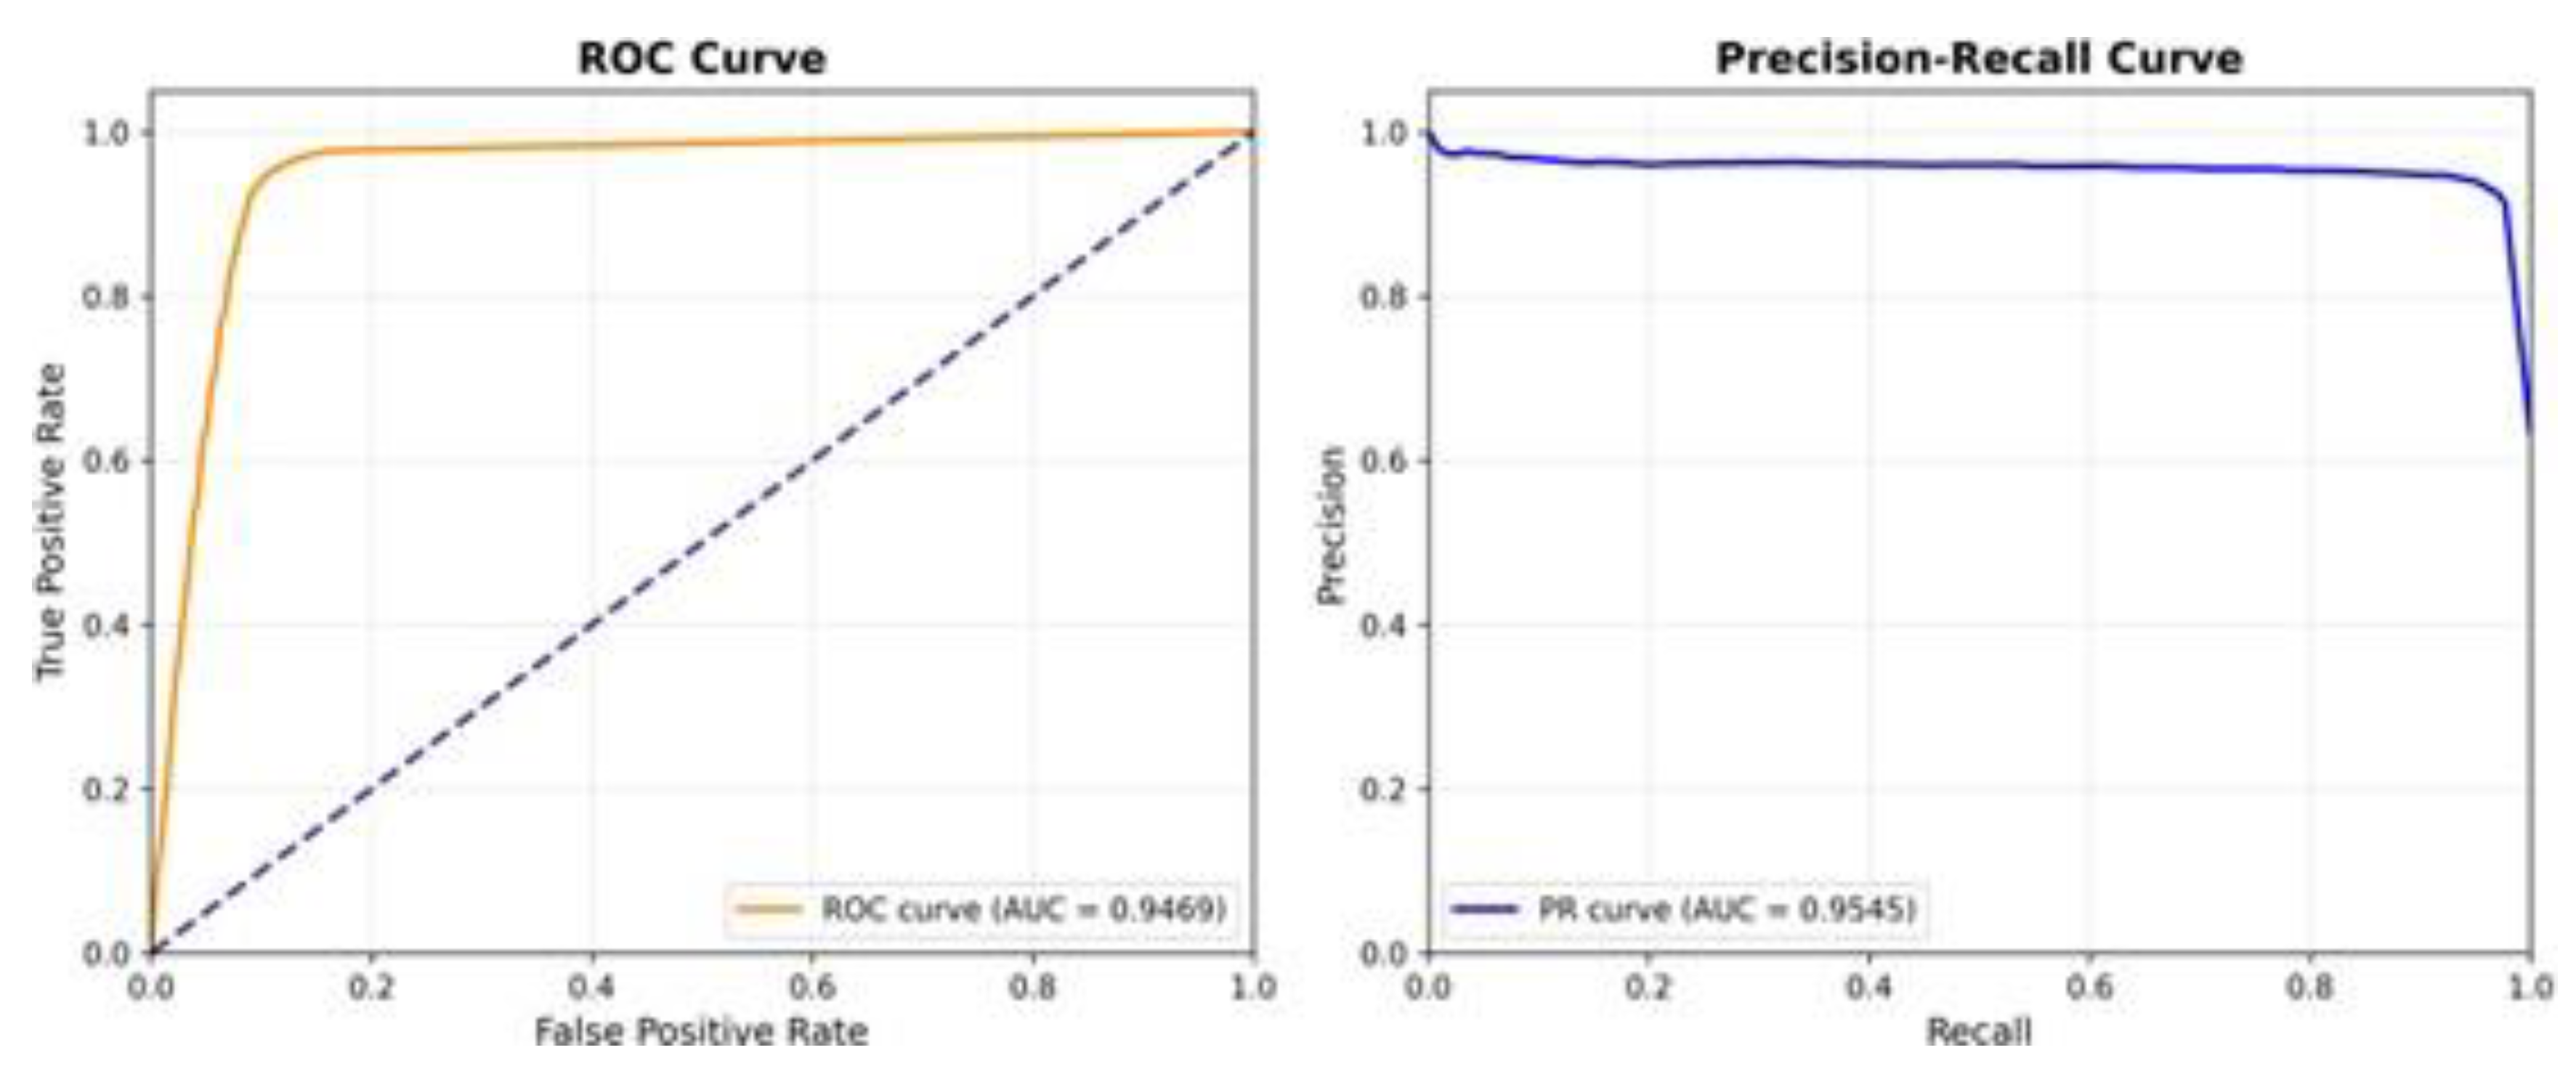
Figure 6.
Distribution of ROC.
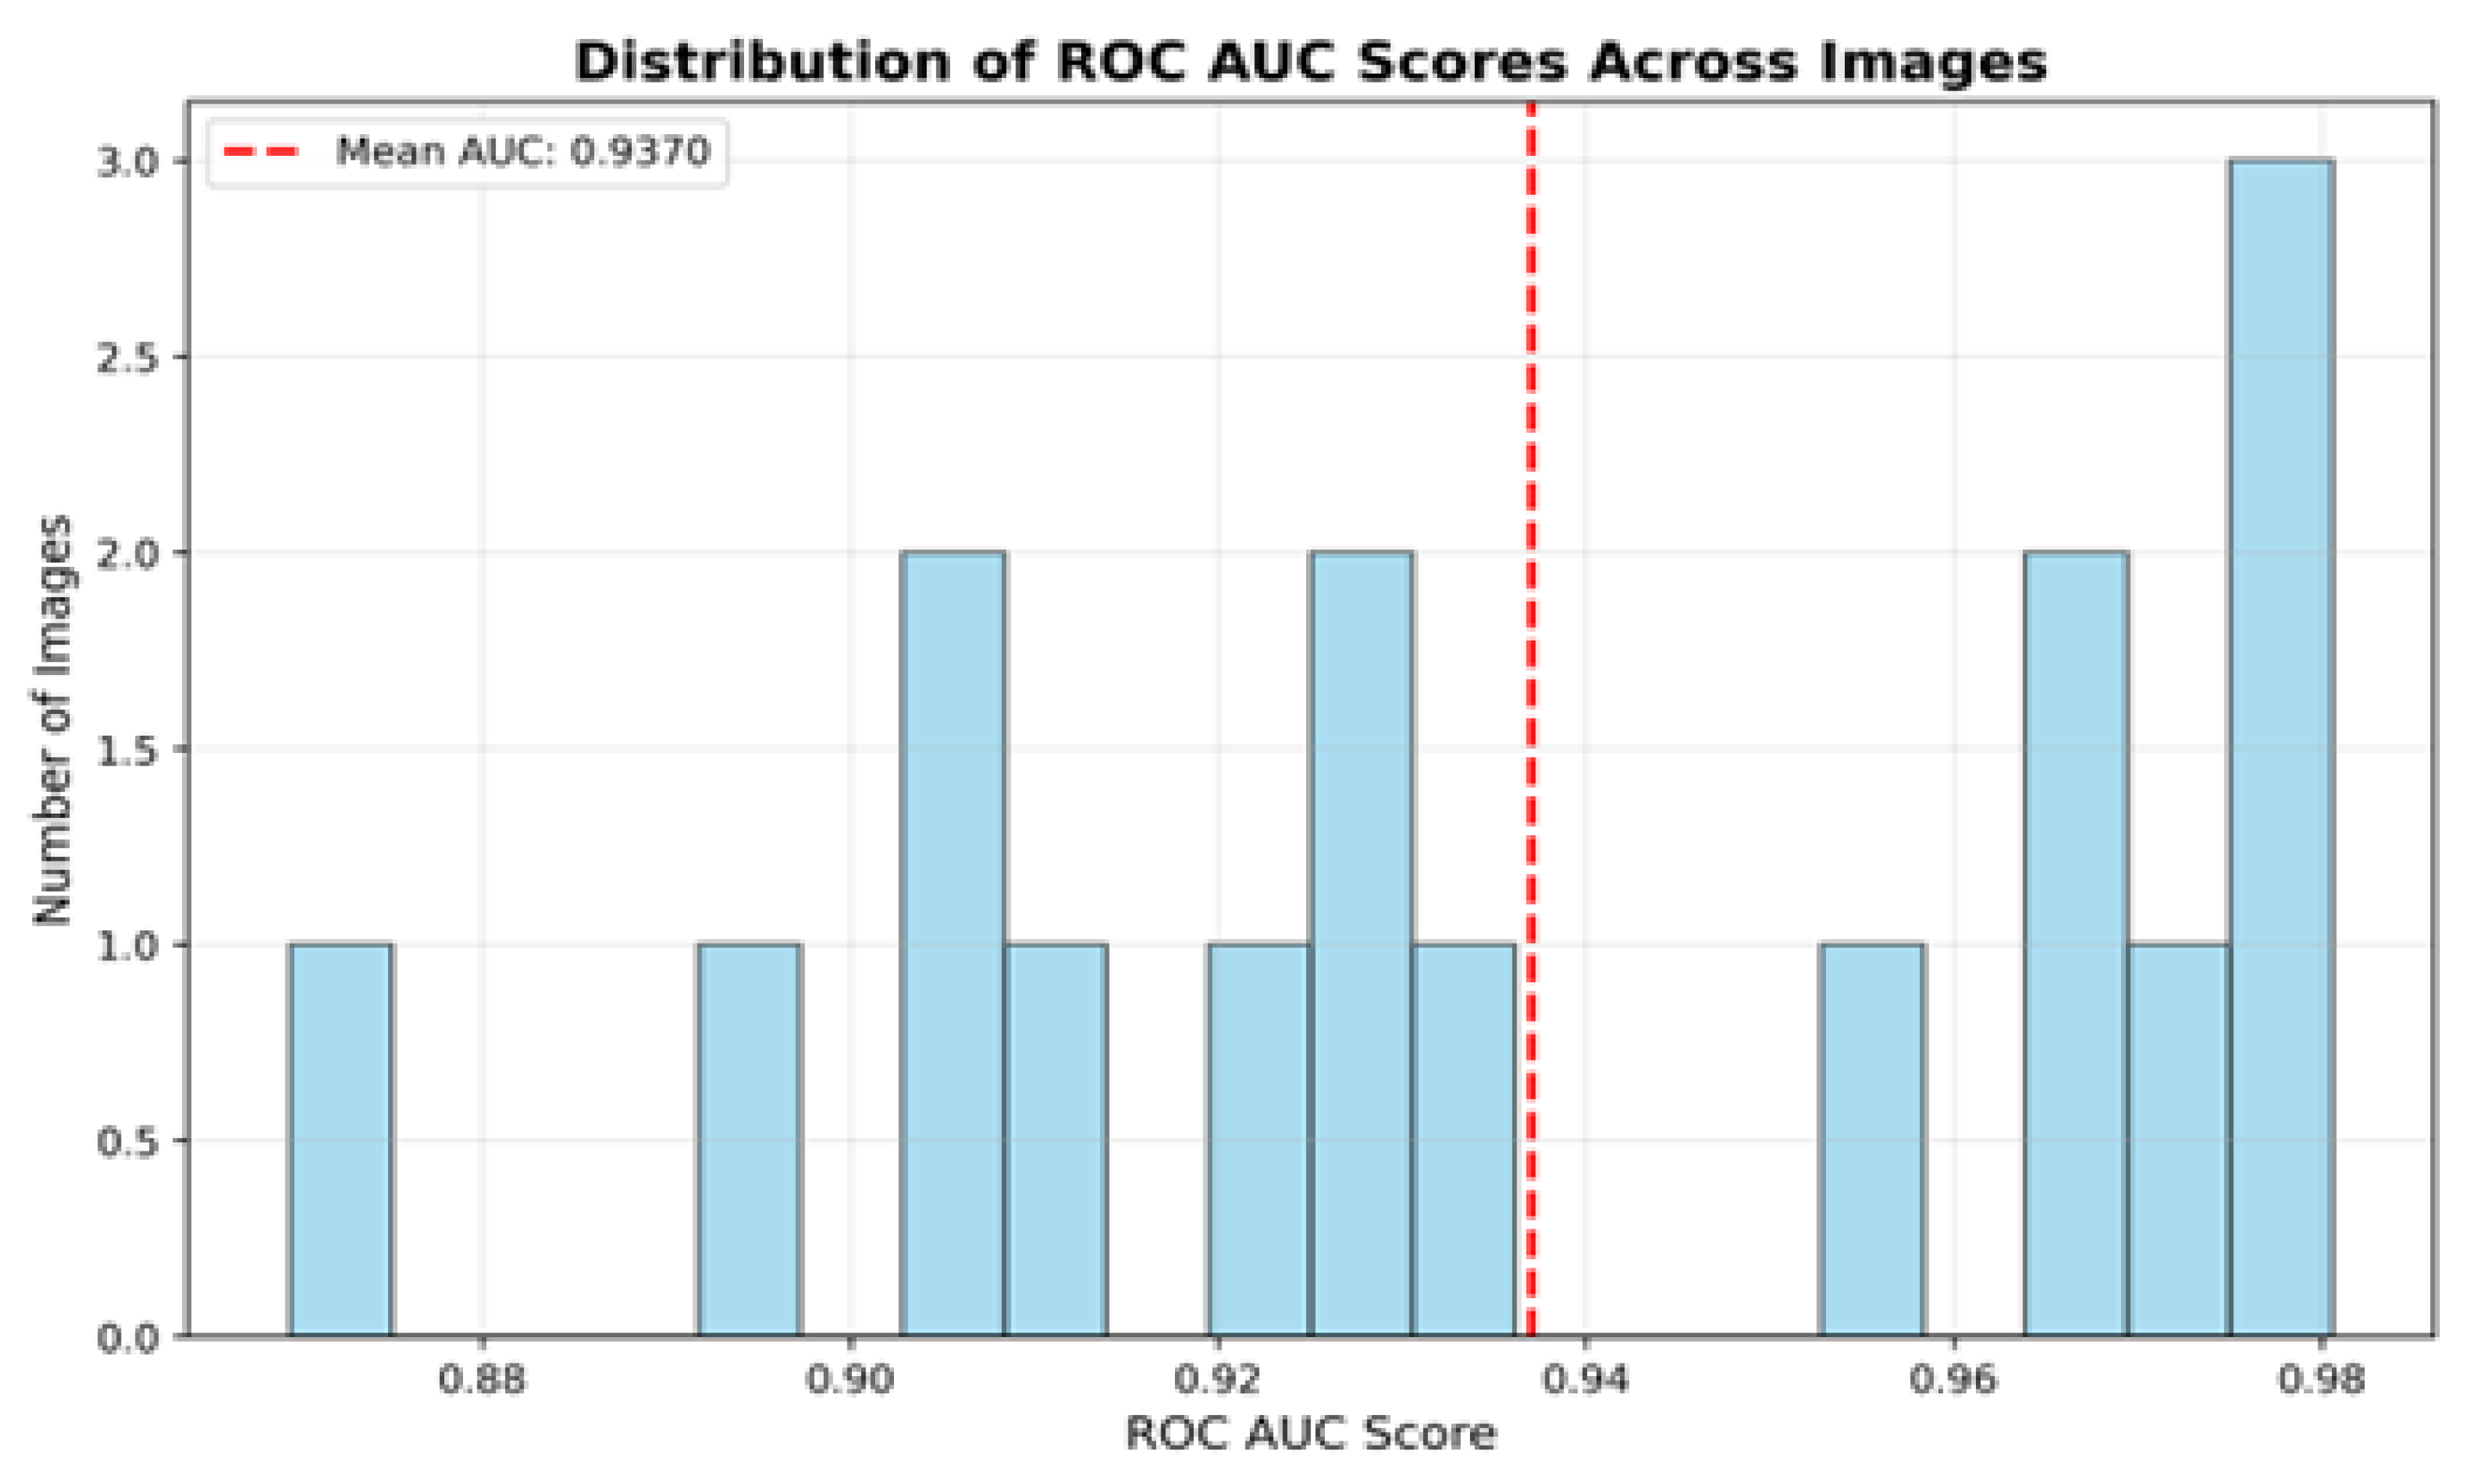
Figure 7.
Grad-CAM Analysis.
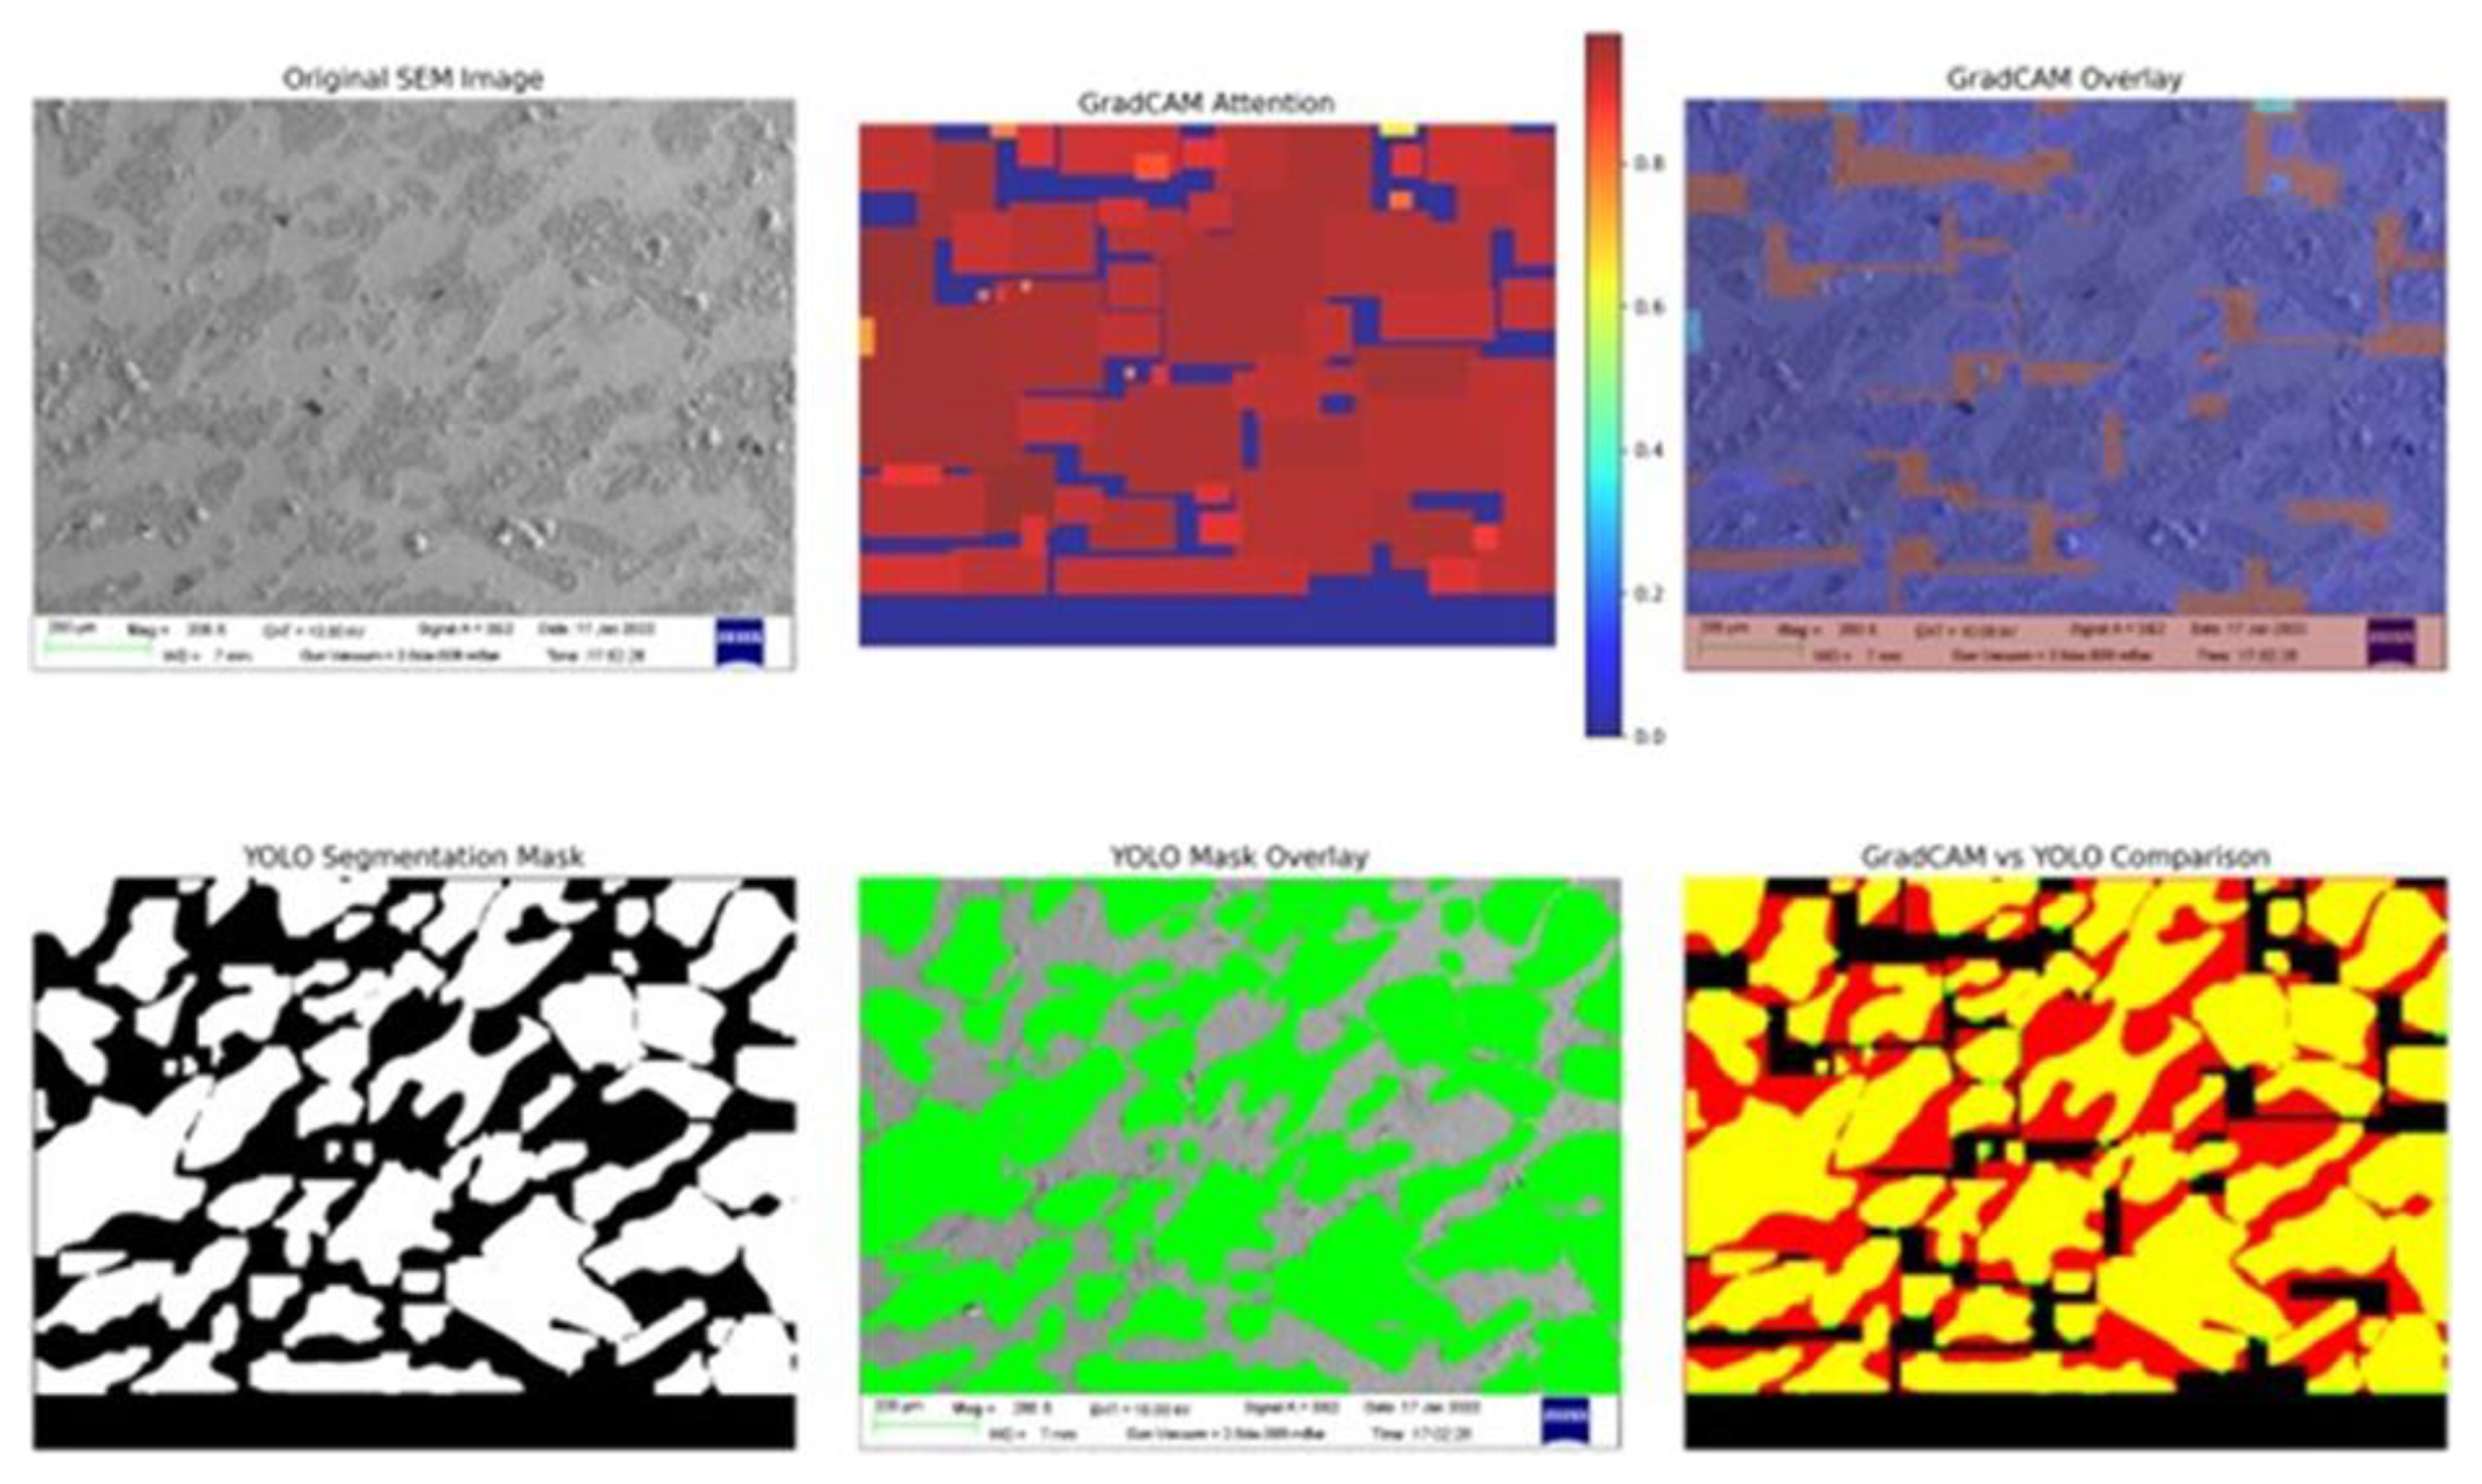
Figure 8.
Confusion Matrix.
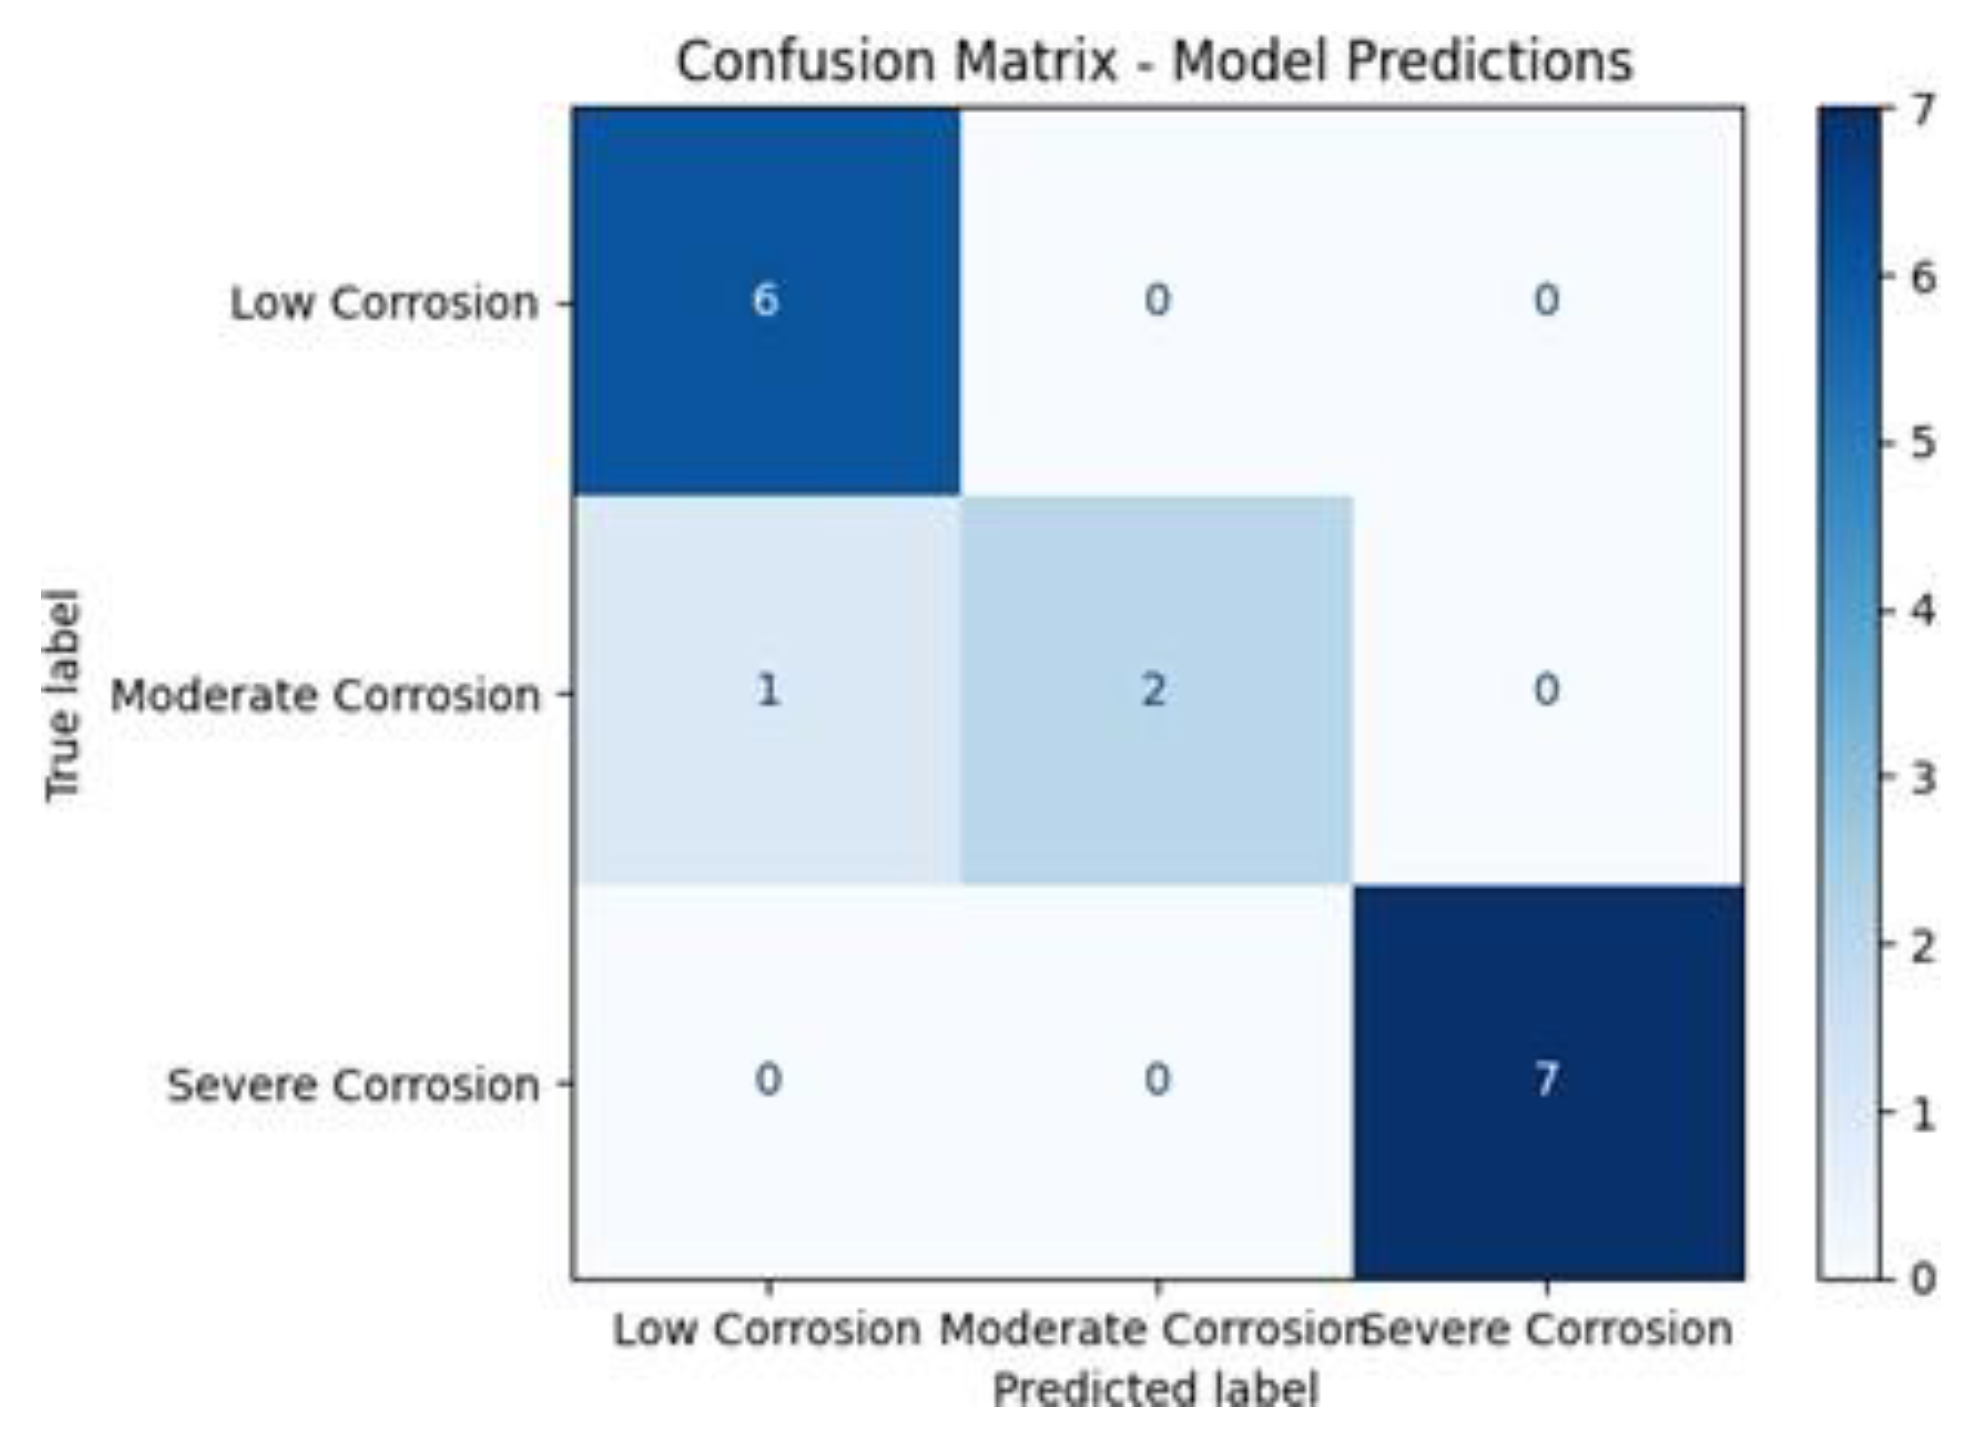

Table 1.
Performance Comparison.
| Method | Application | Performance metrics | Technical limitation | Year |
|---|---|---|---|---|
| Current Work | SEM Temporal-Thermal Analysis | 89.91% mIoU, 93.75% Accuracy | Dataset size constraints | 2025 |
| Yang et al. [26] | Compositional Optimization | R2 = 0.99 prediction accuracy | Thermal processing unexplored | 2023 |
| YOLOv8 [12] | Industrial Detection | 95% Accuracy, 94.74% F1-score | Static analysis only | 2024 |
| Zhao et al. [20] | SEM Segmentation | High-precision mapping | No temporal progression | 2025 |
| YOLOv8 vs. YOLOv5 [14] | Metal Surface Segmentation | Improved accuracy | No annealing correlation | 2024 |
Table 2.
Experimental design matrix.
| Parameter | Specification | Purpose | Data points |
|---|---|---|---|
| Exposure Duration | 1hr, 7 days, 14 days, 21 days | Temporal progression analysis | 4 time points |
| Annealing Conditions | 60, 90, and120 minutes | Thermal treatment evaluation | 3 conditions |
| Total Images | 117 SEM images | Complete experimental coverage | Full matrix |
| Material Type | Mn-based steel alloys | Standardized substrate | Consistent material |
Table 3.
Segmentation annotation strategy comparison.
| Annotation method | Data source | Dataset size | Training epochs | Advantages | Target application |
|---|---|---|---|---|---|
| Automated | NPY-generated masks | Variable | 200 | Scalability, consistency, minimal human intervention | Industrial screening |
| Manual + Augmentation | Hand-annotated + 4× augmentation | 96 images → 384 images | 200 | Maximum precision, domain expertise integration | Research applications |
Table 4.
Summary of performance evaluation metrics.
| Task | Metric | Description |
|---|---|---|
| Segmentation | Mean IoU | Assess pixel-wise overlap between prediction and ground truth |
| mAP@50/mAP@50–95 | Evaluate box/mask precision across IoU thresholds | |
| ROC AUC/PR AUC | Measure discrimination capability across corrosion levels | |
| GradCAM-IoU | Measure attention map alignment with true corroded regions | |
| Classification | Accuracy | Evaluate the prediction performance |
| Confusion Matrix | Visualize prediction correctness and class imbalance |
Table 5.
Mean IoU comparison.
| Model Type | Mean | Box Precision | Box Recall | Mask Precision | Mask Recall | Box mAP50 | Mask mAP50 |
| IoU | (%) | (%) | (%) | (%) | (%) | (%) | |
| YOLO Automated | 80.67 | 75.3 | 79.2 | 73.0 | 56.8 | 86.6 | 63.6 |
| YOLO Augmented | 89.91 | 99.7 | 96.5 | 98.5 | 97.1 | 98.6 | 98.6 |
Table 6.
mAP@50/mAP@50–95 comparison.
| Model Type | Box mAP50 | (%) Box mAP50-9 | 5 (%) Mask mAP50 | Mask mAP50-95 (%) |
| YOLO Automated | 86.6 | 55.1 | 63.6 | 24.0 |
| YOLO Augmented | 98.6 | 91.2 | 98.6 | 82.1 |
Table 7.
ROC AUC & Precision-Recall AUC.
| Metric | Performance Value | Distribution Characteristics |
| ROC AUC | 94.69% | Excellent class separation |
| Precision-Recall AUC | 95.45% | Superior recall-precision balance |
| Mean AUC Distribution | 93.70% | Consistent across samples |
| AUC Range | 88-95% | Tight clustering in high-performance range |
Table 8.
Grad-CAM Performance.
| Model Type | Mean GradCAM IoU | Best GradCAM IoU | Worst GradCAM IoU | Attention Quality | Interpretability |
| YOLO Augmented | 78.79 | 91.47 | 67.24 | +3.8% improvement | Superior feature focus |
Table 9.
CLASSIFICATION MODELS COMPARISON.
| Architecture | Training Strategy | Class Definition | Preprocessing | Accuracy |
|---|---|---|---|---|
| EfficientNet-B0 | Two-phase fine-tuning | Temporal-based severity | Grayscale + Augmentation | 93.75% |
| ResNet-18 (Baseline) | Standard training | Same | Standard preprocessing | 79.60% |
Disclaimer/Publisher’s Note: The statements, opinions and data contained in all publications are solely those of the individual author(s) and contributor(s) and not of MDPI and/or the editor(s). MDPI and/or the editor(s) disclaim responsibility for any injury to people or property resulting from any ideas, methods, instructions or products referred to in the content. |
© 2026 by the authors. Licensee MDPI, Basel, Switzerland. This article is an open access article distributed under the terms and conditions of the Creative Commons Attribution (CC BY) license (http://creativecommons.org/licenses/by/4.0/).
Copyright: This open access article is published under a Creative Commons CC BY 4.0 license, which permit the free download, distribution, and reuse, provided that the author and preprint are cited in any reuse.


