
Submitted:
25 January 2026
Posted:
26 January 2026
You are already at the latest version
Abstract
Chronic lymphocytic leukemia (CLL) is characterized by recurrent chromosomal abnormalities and variable degrees of genomic instability. Telomere dysfunction contributes to this process, and the three-dimensional (3D) nuclear organization of telomeres reflects structural alterations associated with chromosomal aberrations. The objective of this study was biological characterization rather than prognostication. We investigated how 3D telomere architecture varies across cytogenetic subgroups of CLL, without correlating telomere parameters with clinical outcomes. TeloView® technology was applied to peripheral blood samples from 48 CLL patients to quantify 3D telomere parameters, including telomere number, length (signal intensity), aggregate formation, nuclear volume, and a/c ratio. Cytogenetic abnormalities—del(13q14), trisomy 12, del(11q22), and del(17p13)—were identified using conventional karyotyping following DSP30/IL-2 stimulation and interphase fluorescence in situ hybridization. Telomere parameters were compared across cytogenetic subgroups to assess their association with genomic instability. Distinct differences in 3D telomere architecture were observed among cytogenetic categories. High-risk abnormalities, including del(17p13) and del(11q22), were associated with increased telomere aggregates, higher signal intensity clusters, and larger nuclear volumes, whereas cases with isolated del(13q14) displayed more preserved telomere profiles. Trisomy 12 exhibited an intermediate telomeric pattern. In conclusion, 3D telomere organization parallels the biological gradient of cytogenetic complexity in CLL, supporting a mechanistic association between telomere structural disruption and genomic instability.
Keywords:
CLL
; telomere
; chromosomal abnormalities
; genomic instability
1. Introduction
Chronic lymphocytic leukemia (CLL) is the most common leukemia in adults in Western countries and is characterized by the clonal expansion and accumulation of mature-appearing but functionally incompetent B lymphocytes in the peripheral blood, bone marrow, and lymphoid tissues [1,2]. The clinical course of CLL is highly heterogeneous, ranging from indolent disease with prolonged survival to aggressive forms requiring early therapeutic intervention [1,2]. This variability reflects underlying genetic and molecular alterations that influence disease biology and clonal evolution [3].
Cytogenetically, CLL is characterized by recurrent chromosomal abnormalities that contribute to biological heterogeneity and guide clinical management. The most frequent alterations include deletion of 13q14, trisomy 12, deletion of 11q22–23, and deletion of 17p13, typically detected by fluorescence in situ hybridization (FISH) and complementary cytogenetic approaches [4]. Among these, isolated del(13q14) is generally associated with a more indolent disease course, whereas del(17p13), involving TP53, is linked to genomic instability, treatment resistance, and adverse outcomes [5,6].
Genomic instability is a fundamental hallmark of cancer and plays a central role in tumor initiation, progression, and therapeutic resistance [7,8]. It is characterized by an increased frequency of genetic alterations, including chromosomal rearrangements, copy number changes, and aneuploidy, which promote clonal diversity and evolution [9]. In CLL, genomic instability contributes to disease progression and therapeutic failure and is closely linked to cytogenetic complexity [10]. Telomeres, which protect chromosome ends from degradation and end-to-end fusion, are essential for maintaining genomic stability [11].
Beyond telomere length, the three-dimensional (3D) nuclear organization of telomeres has emerged as an important structural indicator of genomic integrity [12,13]. Telomeres are non-randomly distributed within the nuclear space and participate in a dynamic 3D network that reflects higher-order genome organization [14]. Disruption of telomere spatial organization, frequently observed in malignant cells, is associated with increased genomic instability, telomere aggregation, and altered gene regulation [12,13,14,15,16].
Advances in imaging technologies, including 3D fluorescence in situ hybridization (3D-FISH), have enabled the quantitative assessment of telomere architecture at the single-cell level. TeloView® software allows systematic measurement of multiple 3D telomere parameters, providing biologically relevant readouts of nuclear organization and genomic instability [17,18]. In the present study, we applied TeloView® analysis to CLL samples to examine how 3D telomere architecture varies across defined cytogenetic subgroups.
Importantly, the aim of this study was biological characterization rather than prognostication. The analysis was designed to investigate whether telomere structure and aggregation parallel the degree of cytogenetic complexity in CLL, without incorporating clinical outcomes or established prognostic variables such as IGHV mutation status, recurrent gene mutations, disease stage, or survival. Accordingly, the findings are intended to provide mechanistic insight into telomere organization and genomic instability in CLL and should be interpreted within this biological framework.
2. Material and Methods
2.1. Patients
A total of 48 peripheral blood samples from CLL patients with either normal or abnormal karyotypes were included in this study (32 male and 16 female; median age: 58.5 years; age range: 48–74 years). The diagnosis of chronic lymphocytic leukemia (CLL) was made according to the International Workshop on CLL (iwCLL) criteria [19], based on peripheral blood lymphocytosis (≥5×10⁹/L), characteristic lymphocyte morphology, and immunophenotyping confirming B-cell clonality with expression of CD5, CD19, CD20, and CD23. None of the patients had a prior diagnosis of other hematological disorders. Written informed consent was obtained from all participants in accordance with the Declaration of Helsinki. The study was approved by the Research Ethics Board for human studies (protocol no. 1243/2017).
2.2. Metaphase Induction (G-Banding Analysis)
Metaphase induction was performed using 10⁶ peripheral blood mononuclear cells. The cells were cultured in RPMI 1640 medium (Thermo Fisher Scientific, Waltham, MA, USA) supplemented with 10% fetal calf serum, along with the immunostimulatory CpG-oligonucleotide DSP30 (TIB MolBiol, Berlin, Germany) and interleukin-2 (IL-2) (Peprotech, Colonia Narvarte, Mexico). After 72 hours of incubation, colcemid (Sigma, Munich, Germany) was added to arrest cells in metaphase prior to chromosome preparation. Chromosomes were prepared following standard cytogenetic procedures, and the analysis and interpretation were conducted according to International System for Human Cytogenomic Nomenclature guidelines (ISCN 2020) [20]. Image analysis was carried out using an AxioImager M1 microscope (Carl Zeiss, Jena, Germany) equipped with appropriate filters and image capture software. Chromosome identification was based on an average resolution of 450 bands per haploid set. A minimum of 20 metaphases were analyzed per sample.
2.3. Interphase Fluorescence In Situ Hybridization (iFISH)
Interphase fluorescence in situ hybridization (iFISH) was performed on peripheral blood samples to detect recurrent chromosomal abnormalities associated with CLL. The analysis was conducted on unstimulated cells, in accordance with standard cytogenetic practices for CLL diagnostics. The CLL FISH panel included probes specific for the following regions: 13q14 (D13S319), trisomy 12 (centromere 12, D12Z1), 11q22 (ATM), and 17p13 (TP53). Interphase nuclei were prepared from fresh, unstimulated peripheral blood collected in heparinized tubes. Following hypotonic treatment with 0.075 M KCl, cells were fixed in methanol:acetic acid (3:1) and dropped onto clean glass slides. FISH was performed using commercially available, locus-specific probes provided by Kreatech Diagnostics (now part of Leica Biosystems). Hybridization and post-hybridization procedures were carried out according to the manufacturer’s protocol. Hybridization was performed overnight at 37 °C in a humidified chamber. Slides were washed under stringent conditions to ensure specificity, and nuclei were counterstained with DAPI (4′,6-diamidino-2-phenylindole). Signal evaluation was conducted using a AxioImager M1 microscope (Carl Zeiss, Jena, Germany) fluorescence microscope equipped with appropriate filter sets. For each probe, at least 100 interphase nuclei were analyzed per sample. FISH results were interpreted following the ISCN 2020 [20]. Abnormalities were recorded as present when the number of nuclei with an abnormal signal pattern exceeded established laboratory cut-off values, validated through internal controls and existing literature.
2.4. Quantitative Fluorescent In Situ Hybridization (Q-FISH)
For Q-FISH analysis, slides containing fixed stimulated cells were incubated in 3.7% formaldehyde/1xPBS solution for 10 minutes, and after the slides were soaked in 20% glycerol/1xPBS solution for 45min. The cells were treated by four repeated cycles of freeze-thaw in glycerol. After, the slides were incubated in 0.1 HCL solution and fixation in 70% formamide/2xSCC for 1 hour. For hybridization, slides were covered with 8μL of PNA telomeric probe (Agilent Dako, Santa Clara, California, USA), sealed with coverslip and rubber cement. For denaturation, the slides were placed on a hot plate, protected from direct light, for 3 minutes, at 82 °C. The hybridization was carried out for 2 hours, at 30 °C. The slides were then washed three times in 70% formamide/10mM Tris (pH 7.4) solution, for 15 minutes followed by washing in 1xPBS at room temperature for 2 minutes, while shaking and in 0.1xSSC at 55 °C for 5 minutes while shaking. Finally, the slides were washed in 2xSSC/ 0.05% Tween 20 solution for three times, for 5 minutes, at room temperature while shaking. After the final, all cycles of washing, the nuclei were counter-stained with 4’,6-diamino-2-phenylindole (DAPI) (0.1μg/mL) and antifade reagent (Thermo Fisher Scientific, Waltham - Massachusetts, EUA), and covered with coverslips for image acquisition.
2.5. 3D Image Acquisition and Analysis Using TeloView® System
Thirty interphase nuclei were analyzed, for each sample, by using an AxioImager M1 microscope (Carl Zeiss, Jena, Germany), coupled to an AxioCam HRm charge-coupled device (Carl Zeiss, Jena, Germany) and a 63-x oil objective lens (Carl Zeiss, Jena, Germany). The acquisition time was 500 milliseconds (ms) for Cy3 (telomeres) and 5 ms for DAPI (nuclei). Sixty z-stacks were acquired at a sampling distance of x,y: 102 nm and z: 200 nm for each slice of the stack. AxioVision 4.8 software (Carl Zeiss, Jena, Germany) was used for 3D image acquisition. Deconvolved images were converted into TIFF files and exported for 3D-analysis using the TeloView® software (Telo Genomics Corp., Toronto, ON, Canada) [17,18].
2.6. Data Image Analysis – 3D Telomere Architecture
The evaluation of the telomeric architecture of CLL cells was performed by TeloView® software [17,18], proprietary to Telo Genomics, Toronto, Canada. It measures six distinct parameters for each sample: (1) telomere length based on signal intensity, (2) the number of telomere signals per nucleus, (3) the number of telomeric aggregates (clusters of telomeres that cannot be resolved further at an optical resolution limit of 200 nm), (4) nuclear volume, (5) a/c ratio (a spatial feature assessing cell cycle progression and proliferation), and (6) the spatial distribution of telomeres within the nuclear space, which reflects gene expression. For the distinct subgroups of CLL cells, based on cytogenetic profile, a graphical representation was obtained showing the distribution of the intensity of the acquired telomere fluorescent signals, the distribution of the frequency of telomere aggregates per cell and the acquired signals per cell.
2.7. Statistical Analysis for Telomere Architecture
Based on cytogenetic analysis of CLL cells, four distinct subgroups were defined. The telomeric parameters (number, length, telomere aggregates, nuclear volumes, and a/c ratio) were compared between these subgroups using analysis of variance (ANOVA). All telomere parameters in CLL subgroups were compared using chi-square analysis. Additionally, cell parameter averages were analyzed using nested factorial analysis of variance. All statistical analyses were performed using GraphPad Prism version 8.0 (GraphPad Software, San Diego, CA, USA) [21]. The significance level was set at 0.05.
3. Results
Among the 48 CLL cases analyzed, age distribution showed that 12 patients were under 50 years old, 16 patients were between 50 and 60 years, and 20 patients were older than 60 years, reflecting the typical predominance of CLL in older adults. The cohort included 32 males (66.7%) and 16 females (33.3%), demonstrating the expected male predominance in CLL. Cytogenetic findings revealed substantial heterogeneity (Table 1). A total of 12 patients (25%) exhibited a normal karyotype with no chromosomal abnormalities detected by iFISH, a profile often associated with favorable clinical outcomes, though complementary molecular analyses would be necessary to refine prognostic interpretation.
Deletion of 13q14, either isolated or in mosaic form, was identified in 16 patients (33.3%), making it the most frequent abnormality in the cohort. Consistent with its recognized association with favorable prognosis, isolated del(13q) typically indicates indolent disease; however, its prognostic behavior may vary depending on whether the deletion is monoallelic versus biallelic and the size of the affected clone. Larger deletions or higher percentages of nuclei harboring del(13q) correlate with shorter time to first treatment. This deleted region often encompasses DLEU2 and miR-15a/16-1, key regulators of apoptosis and cell cycle control whose loss contributes to leukemogenesis [22,23].
Trisomy 12 was observed in 12 patients (25%), appearing either as an isolated abnormality or in combination with del(13q) or TP53 loss. This abnormality aligns with the intermediate-risk category in the Döhner classification and is often associated with atypical morphology and more aggressive disease features (Figure 1). In contrast, deletion of 17p13, involving TP53, was present in 10 patients (20.8%), consistent with a high-risk cytogenetic profile and poor response to conventional chemoimmunotherapy. Additionally, deletion of 11q22 (ATM) was identified in 9 patients (18.7%), a finding typically associated with bulky lymphadenopathy and reduced treatment-free survival. Overall, these results emphasize the prognostic value of comprehensive cytogenetic evaluation and support the integration of Döhner risk stratification to guide individualized management in CLL.
For the 3D telomere investigation, we assessed the overall signal intensity of telomeres, which indicates their length, and found notable variations over specific chromosomal abnormalities in CLL patients. 3D telomere architecture, by TeloView® analysis (Telo Genomics Corp.) [17,18] showed that telomeres became shorter as the correlation between chromosomal changes and prognosis for CLL take place (Figure 2). This shortening was reflected in a greater proportion of telomeres with low signal intensities. In Figure 2, telomere length (depicted by signal intensity on the x-axis) was plotted against the number of telomeres (y-axis) for each analyzed cell across all time points. Signals were categorized by intensity levels, highlighting telomere distribution within each sample or time point. Cancer cells often exhibit altered telomere counts per cell and shorter telomere lengths compared to normal cells [13].
In this study, we observed variations in the total detectable telomere signals across CLL samples with different cytogenetic alterations (Table 2). TeloView® analysis (Telo Genomics Corp.) [17,18] of a cohort of 28 CLL patients revealed that samples with del(17p13) and del(11q22)—markers of aggressive disease—exhibited the highest numbers of telomeric signals, aggregates, and signal intensities. This increase is likely attributed to telomere clustering, where closely spaced or fused telomeres are detected as brighter and sometimes more numerous signals. This pattern was consistently observed in all patients with del(17p13) and del(11q22) (Figure 3). In contrast, patients with del(13q14) displayed fewer aggregates and more spatially separated telomeres in interphase nuclei, indicative of more stable nuclear architecture. The TeloView® analysis software distinguishes between single telomeres and aggregates based on size and intensity. While aggregates may appear as fewer discrete telomeres under higher resolution, they often contribute to increased total signal counts and intensities due to overlapping fluorescence. Therefore, rather than decreasing signal detection, aggregate formation can lead to an apparent increase in these metrics.
Comparison of telomere intensities and distributions across different CLL cytogenetic profiles revealed significant differences, as indicated by the p-values shown in Figure 2. The 3D telomere architecture varied notably with cytogenetic status, showing increased nuclear volume and altered a/c ratios. A higher a/c ratio, which reflects a more disk-like nuclear shape, is typically associated with later stages of the cell cycle and increased proliferative activity. Telomere shortening may promote the formation of aggregates, linking these structural changes to genomic instability and the development of chromosomal abnormalities in CLL.
4. Discussion
In this study, we used TeloView® technology [17,18] to analyze the 3D telomere architecture in CLL patients, revealing patterns associated with specific chromosomal abnormalities. These findings build on and extend previous research linking 3D telomere dynamics with cytogenetic alterations and tumor evolution. Importantly, however, the aim of the present work was biological characterization rather than prognostication. The purpose of applying TeloView® to this CLL cohort was to investigate how 3D telomere organization reflects underlying genomic instability across cytogenetic subgroups, rather than to develop, validate, or compare prognostic scoring systems.
The consistent presence of 3D telomere aggregates in cases harboring del(17p13) and del(11q22) aligns with the established relationship between aggressive cytogenetic abnormalities and telomere dysfunction [12,13,14,15,16]. Prior studies, including Jebaraj et al. (2021) [11] and Lin et al. (2014) [24], reported that telomere attrition and architectural disruption correlate with genomic complexity and adverse disease. Our results corroborate these observations and strengthen the biological understanding that genome-unstable CLL subgroups exhibit more extensive telomere clustering, elevated aggregate frequency, and shorter telomeres. While such findings have prognostic implications, the goal of the present study was to characterize the mechanistic associations between telomere structure and cytogenetic complexity, not to use telomere metrics as outcome predictors.
Patients with isolated del(13q14) demonstrated longer telomeres, fewer aggregates, and a more preserved 3D nuclear architecture, consistent with a biologically more stable genome. Similarly, intermediate-risk cases with trisomy 12 showed moderate telomere disorganization, further supporting the concept that 3D telomere architecture mirrors the biological gradient of genomic instability. These findings reinforce the role of telomere biology as a structural hallmark associated with chromosomal alterations but should not be interpreted as an attempt to redefine clinical risk groups.
The 3D telomere dynamics observed across cytogenetic subgroups in this cohort align with findings from myelodysplastic syndromes, acute myeloid leukemia, multiple myeloma, and Hodgkin lymphoma [12,13,14,15]. Prior investigations have employed 3D telomere profiling to stratify malignancies by biological behavior. In contrast, our study focuses specifically on the mechanistic relationship between telomere structural variation and CLL cytogenetic categories, without drawing conclusions regarding treatment response or survival. Although increased aggregate formation in high-risk subgroups may suggest potential links to therapeutic resistance, our analysis does not evaluate treatment outcomes or clinical endpoints.
Additionally, the altered a/c ratios identified—reflecting nuclear shape and proliferation status—are consistent with models of genomic instability described by Li et al. (2021) [7]. Together, these findings support the concept that telomere biology, nuclear architecture, and genomic instability are interlinked processes contributing to the evolution of chromosomal abnormalities in CLL.
Our cytogenetic findings in 48 CLL cases, including del(13q14), trisomy 12, del(11q22), and del(17p13), are consistent with ERIC recommendations and the classical Döhner hierarchy [2]. While these categories carry known prognostic significance, here they are used strictly as biological anchors to contextualize telomere structural variation. Likewise, our use of DSP30/IL-2 stimulation improved detection of chromosomal abnormalities, consistent with previous reports [28], but the purpose of including stimulated and unstimulated analyses was methodological clarification—not risk assessment.
Collectively, our results highlight telomere aggregation as a potential biological mechanism promoting genomic instability through increased proximity of chromosomal ends, a phenomenon originally demonstrated by Vermolen et al. (2005) [17]. The increased aggregates observed in cytogenetically complex CLL reinforce the concept that telomere architecture contributes to clonal evolution. Nevertheless, our conclusions remain firmly within the realm of mechanistic biology.
It is crucial to reiterate that this study was not designed to correlate telomere parameters with clinical prognostic markers or outcomes. Key prognostic variables—such as IGHV mutation status, NOTCH1 and TP53 gene mutations, CLL staging, treatment history, and survival data—were not required for the central scientific question addressed here: whether telomere structure and aggregation parallel cytogenetic complexity. Thus, the findings reported should be interpreted as biological insights into telomere organization, not as predictors of clinical behavior.
Despite the relevance of these observations, several limitations must be acknowledged. First, the relatively small sample size may restrict generalizability. Second, the absence of clinical outcome variables limits the ability to integrate telomere biology with clinical endpoints—but, as noted, this was not the aim of the study. Third, future investigations incorporating IGHV status, gene mutation profiles, and longitudinal follow-up could further expand the biological framework established here.
In summary, this study provides mechanistic evidence that 3D telomere architecture reflects genomic instability across cytogenetic subgroups in CLL. The findings contribute to the biological understanding of how telomere structure relates to chromosomal abnormalities and clonal complexity, reinforcing the role of telomere dynamics as a meaningful biomarker of genomic instability—within a biological, not prognostic, context.
Author Contributions
FMO: conceptualized the study, coordinated patient recruitment, supervised experimental procedures, and contributed to data analysis and manuscript writing. BMRF: assisted in cytogenetic and FISH analyses, provided clinical data interpretation, and participated in manuscript revisions. SM: provided the TeloView® platform and technical support for 3D telomere analysis, contributed to image analysis interpretation, and supervised the final drafting and critical revision of the manuscript. All authors read and approved the final version of the manuscript.
Institutional Review Board Statement
The study was approved by the Ethics Committee, which is affiliated with the Federal University of Jataí (98331018.7.0000.8155).
Informed Consent Statement
Written informed consent was obtained from all patients.
Data Availability Statement
The raw data generated and/or analyzed during the current study are not publicly available due to ethical and confidentiality restrictions imposed by the research ethics committee. The data includes sensitive and potentially identifiable information from participants, and even with anonymization, there is a risk of compromising their privacy. However, the datasets may be made available from the corresponding author upon reasonable request and pending approval by the ethics committee.
Acknowledgments
We thank Telo Genomics Corp. for the use of TeloView® software platform. The authors also thank the Genomic Centre for Cancer Research and Diagnosis (GCCRD) for imaging. The GCCRD is funded by the Canada Foundation for Innovation and supported by CancerCare Manitoba Foundation, the University of Manitoba and the Canada Research Chair Tier 1 (S.M.). The GCCRD is a member of the Canadian National Scientific Platforms (CNSP) and of Canada BioImaging. Research group in Molecular Epidemiology (EPIMOL), CNPq, Brazil. Association for Health Education & Research, Brazil. Genomic Medicine Study Group (GMEG).
Conflicts of Interest
The authors declare no commercial or financial relationships that could be construed as a potential conflict of interest. Although one of the authors (S.M.) is affiliated with Telo Genomics Corp., which provided the TeloView® platform used in this study, all image acquisition, telomere measurements, data analysis, and interpretation were independently performed by the research team at the Federal University of Jataí. The involvement of Telo Genomics Corp. was limited to providing software access, and the company had no influence on study design, data analysis, or the decision to publish the results.
References
- Wainman, LM; Khan, WA; Kaur, P. Chronic Lymphocytic Leukemia: Current Knowledge and Future Advances in Cytogenomic Testing. In Advancements in Cancer Research [Internet]; Sergi, CM, Ed.; Exon Publications: Brisbane (AU); Chapter 6, 17 Aug 2023. [Google Scholar] [PubMed]
- Baliakas, P; Espinet, B; Mellink, C; Jarosova, M; Athanasiadou, A; Ghia, P; Kater, AP; Oscier, D; Haferlach, C; Stamatopoulos, K. Cytogenetics in Chronic Lymphocytic Leukemia: ERIC Perspectives and Recommendations. Hemasphere 2022, 6(4), e707. [Google Scholar] [CrossRef] [PubMed]
- Nadeu, F; Diaz-Navarro, A; Delgado, J; Puente, XS; Campo, E. Genomic and Epigenomic Alterations in Chronic Lymphocytic Leukemia. Annu Rev Pathol. 2020, 15, 149–177. [Google Scholar] [CrossRef] [PubMed]
- Muñoz-Novas, C; González-Gascón-Y-Marín, I; Figueroa, I; Sánchez-Paz, L; Pérez-Carretero, C; Quijada-Álamo, M; Rodríguez-Vicente, AE; Infante, MS; Foncillas, MÁ; Landete, E; Churruca, J; Marín, K; Ramos, V; Sánchez Salto, A; Hernández-Rivas, JÁ. Association of Cytogenetics Aberrations and IGHV Mutations with Outcome in Chronic Lymphocytic Leukemia Patients in a Real-World Clinical Setting. Glob Med Genet. 2024, 11(1), 59–68. [Google Scholar] [CrossRef] [PubMed]
- Trivedi, PJ; Patel, DM; Kazi, M; Varma, P. Cytogenetic Heterogeneity in Chronic Lymphocytic Leukemia. J Assoc Genet Technol. 2023, 49(1), 4–9. [Google Scholar]
- Ondroušková, E; Bohúnová, M; Závacká, K; Čech, P; Šmuhařová, P; Boudný, M; Oršulová, M; Panovská, A; Radová, L; Doubek, M; Plevová, K; Jarošová, M. Duplication of 8q24 in Chronic Lymphocytic Leukemia: Cytogenetic and Molecular Biologic Analysis of MYC Aberrations. Front Oncol 2022, 12, 859618. [Google Scholar] [CrossRef]
- Li, H; Zimmerman, SE; Weyemi, U. Genomic instability and metabolism in cancer. Int Rev Cell Mol Biol. 2021, 364, 241–265. [Google Scholar]
- Salmaninejad, A; Ilkhani, K; Marzban, H; Navashenaq, JG; Rahimirad, S; Radnia, F; Yousefi, M; Bahmanpour, Z; Azhdari, S; Sahebkar, A. Genomic Instability in Cancer: Molecular Mechanisms and Therapeutic Potentials. Curr Pharm Des. 2021, 27(28), 3161–3169. [Google Scholar] [CrossRef]
- Guo, S; Zhu, X; Huang, Z; Wei, C; Yu, J; Zhang, L; Feng, J; Li, M; Li, Z. Genomic instability drives tumorigenesis and metastasis and its implications for cancer therapy. Biomed Pharmacother 2023, 157, 114036. [Google Scholar] [CrossRef]
- Condoluci, A; Rossi, D. Genomic Instability and Clonal Evolution in Chronic Lymphocytic Leukemia: Clinical Relevance. J Natl Compr Canc Netw. 2020, 19(2), 227–233. [Google Scholar] [CrossRef]
- Jebaraj, BMC; Stilgenbauer, S. Telomere Dysfunction in Chronic Lymphocytic Leukemia. Front Oncol. 2021, 10, 612665. [Google Scholar] [CrossRef]
- Knecht, H; Johnson, N; Bienz, MN; Brousset, P; Memeo, L; Shifrin, Y; Alikhah, A; Louis, SF; Mai, S. Analysis by TeloView® Technology Predicts the Response of Hodgkin’s Lymphoma to First-Line ABVD Therapy. Cancers (Basel) 2024, 16(16), 2816. [Google Scholar] [CrossRef] [PubMed]
- Gadji, M; Adebayo Awe, J; Rodrigues, P; Kumar, R; Houston, DS; Klewes, L; Dièye, TN; Rego, EM; Passetto, RF; de Oliveira, FM; Mai, S. Profiling three-dimensional nuclear telomeric architecture of myelodysplastic syndromes and acute myeloid leukemia defines patient subgroups. Clin Cancer Res. 2012, 18(12), 3293–304. [Google Scholar] [CrossRef] [PubMed]
- Rangel-Pozzo, A; Corrêa de Souza, D; Schmid-Braz, AT; de Azambuja, AP; Ferraz-Aguiar, T; Borgonovo, T; Mai, S. 3D Telomere Structure Analysis to DetectGenomic Instability and Cytogenetic Evolutionin Myelodysplastic Syndromes. Cells 2019, 8(4), 304. [Google Scholar] [CrossRef] [PubMed]
- Kumar, S; Rajkumar, SV; Jevremovic, D; Kyle, RA; Shifrin, Y; Nguyen, M; Husain, Z; Alikhah, A; Jafari, A; Mai, S; Anderson, K; Louis, S. Three-dimensional telomere profiling predicts risk of progression in smoldering multiple myeloma. Am J Hematol 2024, 99(8), 1532–1539. [Google Scholar] [CrossRef]
- Oliveira, FM; Jamur, VR; Merfort, LW; Pozzo, AR; Mai, S. Three-dimensional nuclear telomere architecture and differential expression of aurora kinase genes in chronic myeloid leukemia to measure cell transformation. BMC Cancer 2022, 22(1), 1024. [Google Scholar] [CrossRef]
- Vermolen, B.; Garini, Y.; Mai, S.; Mougey, V.; Fest, T.; Chuang, T.C.; Chuang, A.Y.; Wark, L.; Young, I.T. Characterizing the three-dimensional organization of telomeres. Cytom. Part A J. Int. Soc. Anal. Cytol. 2005, 67, 144–150. [Google Scholar] [CrossRef]
- Chuang, T.C.Y.; Moshir, S.; Garini, Y.; Chuang, A.Y.-C.; Young, I.T.; Vermolen, B.; Doel, R.v.D.; Mougey, V.; Perrin, M.; Braun, M.; et al. The three-dimensional organization of telomeres in the nucleus of mammalian cells. BMC Biol. 2004, 2, 12. [Google Scholar] [CrossRef]
- Hallek, M; Cheson, BD; Catovsky, D; Caligaris-Cappio, F; Dighiero, G; Döhner, H; et al. iwCLL guidelines for diagnosis, indications for treatment, response assessment, and supportive management of CLL. Blood 2018, 131(25), 2745–2760. [Google Scholar] [CrossRef]
- McGowan-Jordan, J.; Hastings, R. J.; Moore, S. (Eds.) ISCN 2020: An International System for Human Cytogenomic Nomenclature (2020); Karger, 2020; ISBN 978-3-318-06706-4. [Google Scholar]
- GraphPad Software. GraphPad Prism version 8.0 for Windows; GraphPad Software: San Diego, California, USA, 2018. [Google Scholar]
- Van Dyke, DL; Shanafelt, TD; Call, TG; et al. A comprehensive evaluation of the prognostic significance of 13q deletions in patients with B-chronic lymphocytic leukemia. Br J Haematol. 2010, 148(4), 544–550. [Google Scholar] [CrossRef]
- Klein, U; Lia, M; Crespo, M; et al. The DLEU2/miR-15a/16-1 cluster controls B cell proliferation and its deletion leads to chronic lymphocytic leukemia. Cancer Cell. 2010, 17(1), 28–40. [Google Scholar] [CrossRef]
- Lin, TT; Norris, K; Heppel, NH; Pratt, G; Allan, JM; Allsup, DJ; Bailey, J; Cawkwell, L; Hills, R; Grimstead, JW; Jones, RE; Britt-Compton, B; Fegan, C; Baird, DM; Pepper, C. Telomere dysfunction accurately predicts clinical outcome in chronic lymphocytic leukaemia, even in patients with early-stage disease. Br J Haematol 2014, 167(2), 214–23. [Google Scholar] [CrossRef]
- Roos, G; Kröber, A; Grabowski, P; Kienle, D; Bühler, A; Döhner, H; et al. Short telomeres are associated with genetic complexity, high-risk genomic aberrations, and short survival in chronic lymphocytic leukemia. Blood 2008, 111(4), 2246–52. [Google Scholar] [CrossRef]
- Ricca, I; Rocca, B; Baldazzi, C; Ciavarella, S; Cavazzini, F; Martinelli, S; et al. Telomere length and telomerase expression are associated with genomic complexity in chronic lymphocytic leukemia. Haematologica 2012, 97(1), 56–63. [Google Scholar] [CrossRef]
- Scarfò, L; Torelli, GF; Oldani, E; Zibellini, S; Tedeschi, A; Gianelli, U; et al. Short telomeres correlate with clonal evolution and disease progression in chronic lymphocytic leukemia. Leukemia 2019, 33(1), 163–70. [Google Scholar] [CrossRef]
- Holmes, PJ; Peiper, SC; Uppal, GK; Gong, JZ; Wang, ZX; Bajaj, R. Efficacy of DSP30-IL2/TPA for detection of cytogenetic abnormalities in chronic lymphocytic leukaemia/small lymphocytic lymphoma. Int J Lab Hematol 2016, 38(5), 483–9. [Google Scholar] [CrossRef]
Figure 1.
Chronic lymphocytic leukemia karyotype immuno-stimulated by the combination of DSP30 and IL-2. The red arrows show the co-existence of trisomy 12 and del(17p11.2), 47,XY,+12,del(17)(p11.2)[20].
Figure 1.
Chronic lymphocytic leukemia karyotype immuno-stimulated by the combination of DSP30 and IL-2. The red arrows show the co-existence of trisomy 12 and del(17p11.2), 47,XY,+12,del(17)(p11.2)[20].
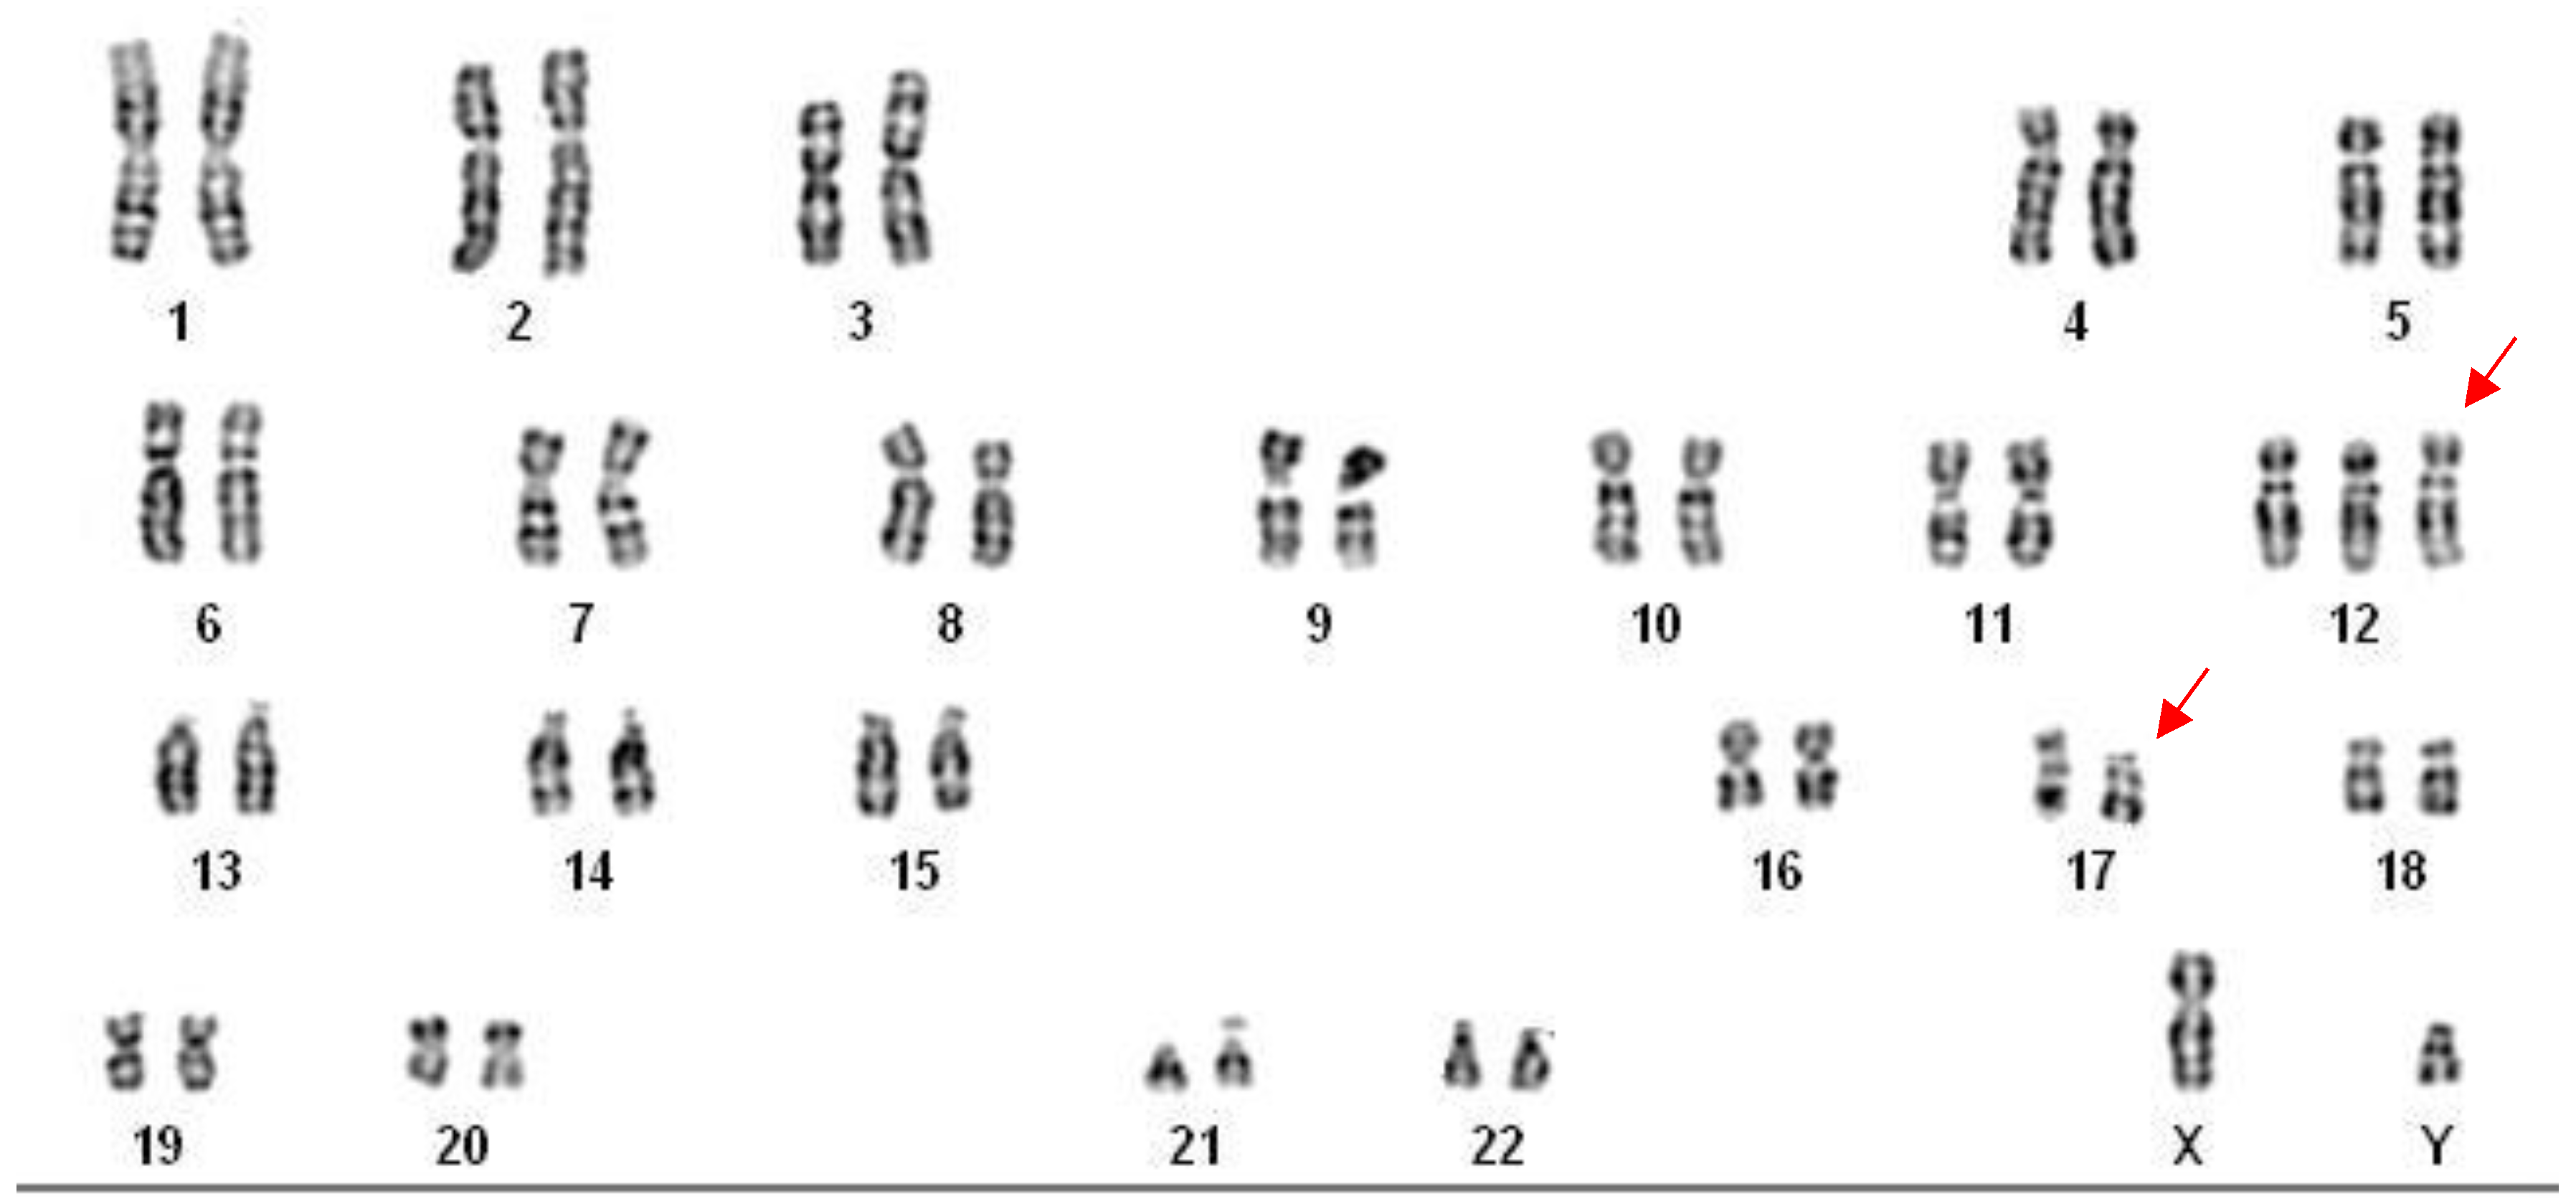
Figure 2.
Graph distribution of number of telomeres according to their intensity (length of telomeres) for Chronic Lymphocytic Leukemia patients [del(13q14), Trisomy 12, del(17p13) and del(11q22)]. The image represents the 3D telomere distribution of the 3D telomeric profile.
Figure 2.
Graph distribution of number of telomeres according to their intensity (length of telomeres) for Chronic Lymphocytic Leukemia patients [del(13q14), Trisomy 12, del(17p13) and del(11q22)]. The image represents the 3D telomere distribution of the 3D telomeric profile.
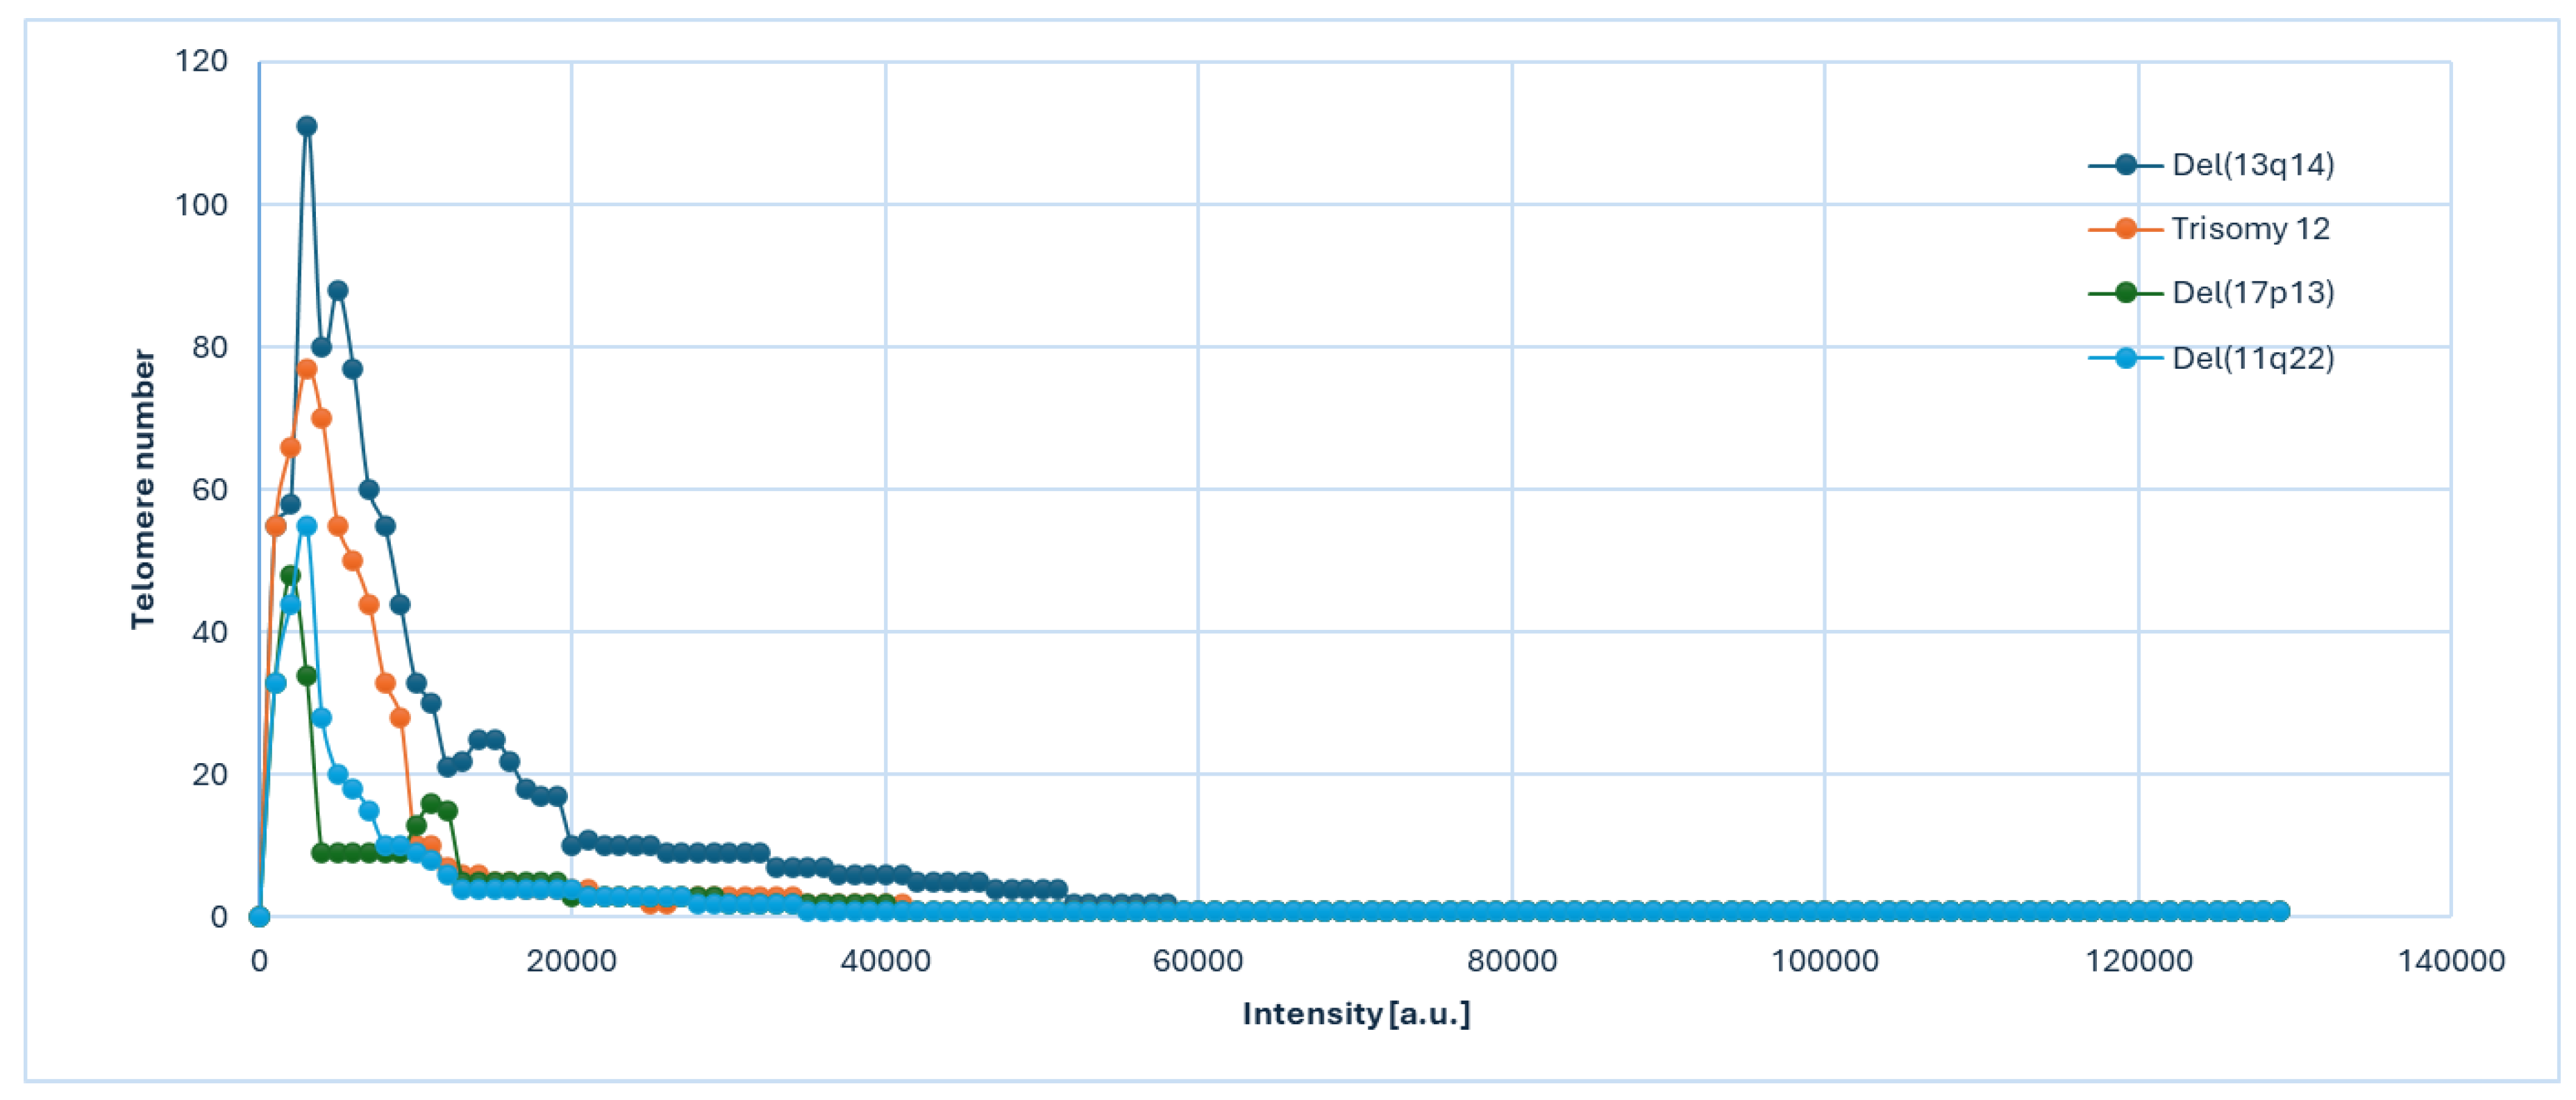
Figure 3.
3D telomere architecture in CLL cells. (A) Representative 3D nuclear telomere distribution (red) within the counterstained nucleus (blue) in a CLL sample harboring del(13q14). (B) 3D Telomere distribution in CLL sample with karyotype: 47,XY,+12,del(17)(p11.2)[20]. The orange arrows indicate the presence of telomere aggregates.
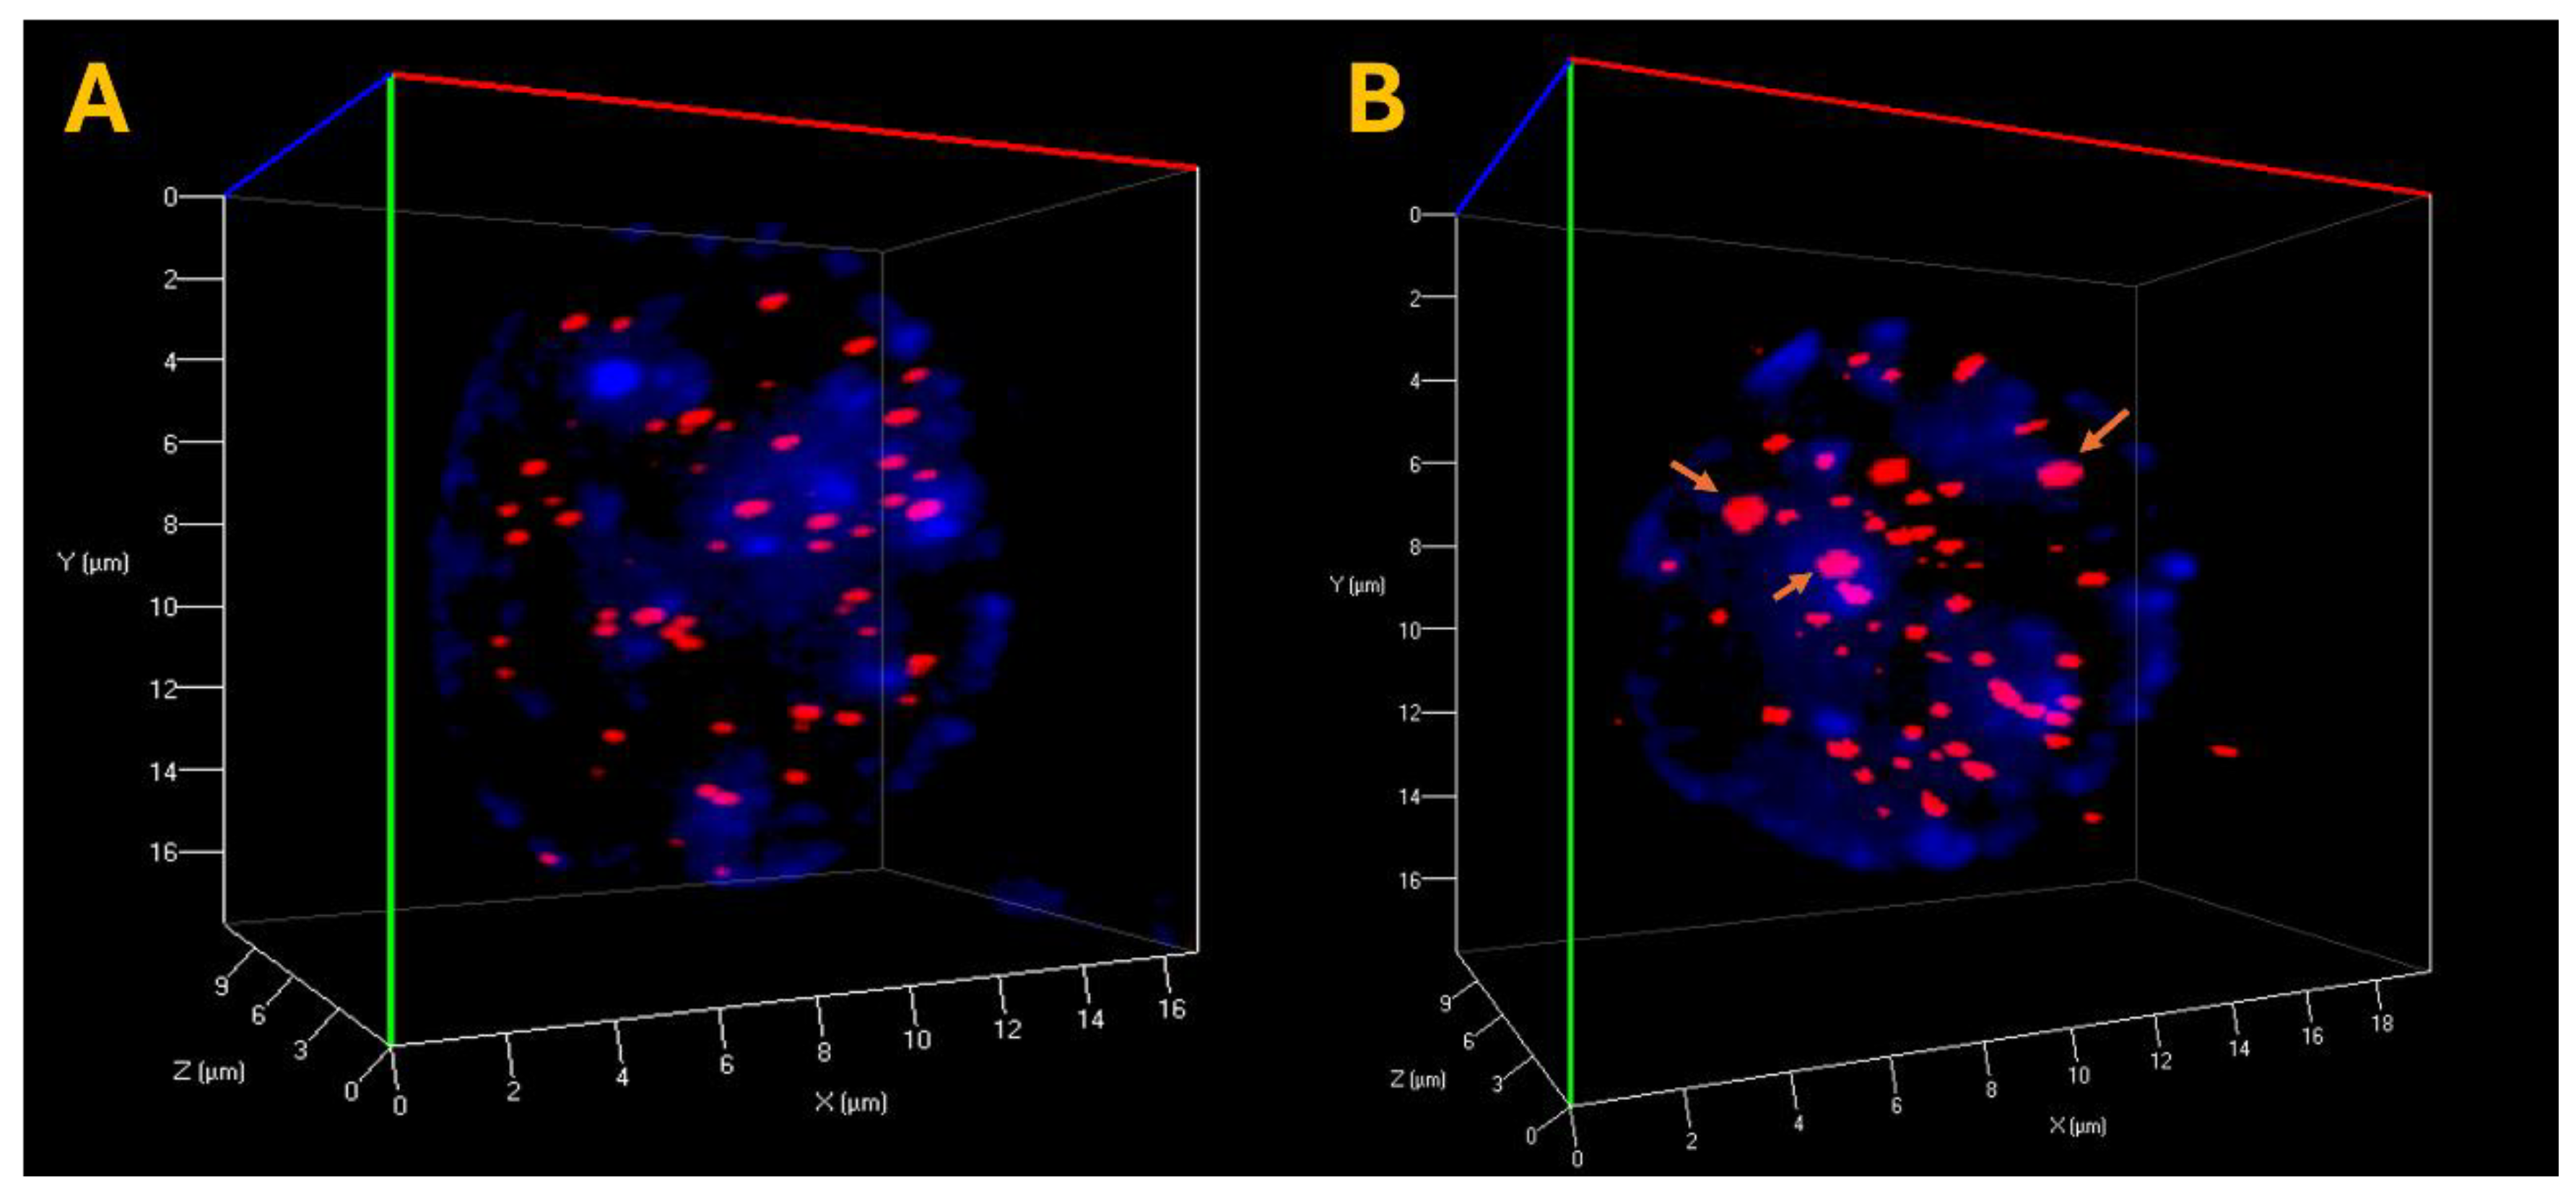

Table 1.
Integrative Karyotype–FISH analysis and Döhner risk stratification in chronic lymphocytic leukemia.
Table 1.
Integrative Karyotype–FISH analysis and Döhner risk stratification in chronic lymphocytic leukemia.
| Patient | Age | Sex | G-Banding | FISH | Döhner Risk |
|---|---|---|---|---|---|
| CLL001 | 49 | F | 46,XX [20] | ish normal signal pattern | Favorable |
| CLL002 | 50 | F | 46,XX [20] | ish normal signal pattern | Favorable |
| CLL003 | 51 | M | 46,XY [20] | ish normal signal pattern | Favorable |
| CLL004 | 55 | M | 46,XY,del(13)(q14.3)[20] | ish del(13q14)(D13S319×1)[55/100] | Favorable |
| CLL005 | 71 | F | 46,XX,del(13)(q14.2)[20] | ish del(13q14)(D13S319×1)[64/100] | Favorable |
| CLL006 | 74 | M | 46,XY,del(13)(q14.3)[14]/46,XY[6] | ish del(13q14)(D13S319×1)[61/100] | Favorable |
| CLL007 | 55 | M | 46,XY,del(13)(q14.1q14.3)[20] | ish del(13q14)(D13S319×1)[58/100] | Favorable |
| CLL008 | 49 | M | 46,XY[20] | ish normal signal pattern | Favorable |
| CLL009 | 57 | F | 46,XX[20] | ish normal signal pattern | Favorable |
| CLL010 | 55 | F | 46,XX,del(13)(q14.2)[12]/46,XX[8] | ish del(13q14)(D13S319×1)[67/100] | Favorable |
| CLL011 | 67 | M | 47,XY,+12[20] | ish +12(D12Z1×3)[32/100] | Intermediate |
| CLL012 | 68 | M | 47,XY,+12[20] | ish +12(D12Z1×3)[41/100] | Intermediate |
| CLL013 | 71 | F | 47,XX,+12[20] | ish +12(D12Z1×3)[36/100] | Intermediate |
| CLL014 | 70 | M | 47,XY,+12,del(13)(q14.2q14.3)[20] | ish +12(D12Z1×3)[42/100]; ish del(13q14)(D13S319×1)[32/100] | Intermediate |
| CLL015 | 47 | M | 46,XY[20] | ish normal signal pattern | Favorable |
| CLL016 | 48 | F | 47,XX,+12[20] | ish +12(D12Z1×3)[29/100] | Intermediate |
| CLL017 | 49 | M | 46,XY,del(17)(p11.1),del(6)(q21)[20] | ish del(17p13)(TP53×1)[54/100] | High Risk |
| CLL018 | 55 | M | 46,XY,del(17)(p11.2),add(1)(p36.1)[20] | ish del(17p13)(TP53×1)[36/100] | High Risk |
| CLL019 | 52 | M | 46,XY,del(17)(p13.1)[20] | ish del(17p13)(TP53×1)[41/100] | High Risk |
| CLL020 | 58 | F | 46,XX,del(17)(p11.1)[12]/46,XX[8] | ish del(17p13)(TP53×1)[48/100] | High Risk |
| CLL021 | 62 | M | 47,XY,+12,del(17)(p11.2)[20] | ish +12(D12Z1×3)[41/100] | Intermediate |
| CLL022 | 68 | M | 46,XY,del(13)(q14.2q21.1)[20] | ish del(13q14)(D13S319×1)[66/100] | Favorable |
| CLL023 | 67 | M | 46,XY,del(11)(q22.3)[20] | ish del(11q22)(ATM×1)[26/100] | High Risk |
| CLL024 | 66 | M | 46,XY,del(17)(p11.2)[14]/46,XY[6] | ish del(17p13)(TP53×1)[38/100] | High Risk |
| CLL025 | 62 | M | 47,XY,del(11)(q23.1),+12[20] | ish del(11q22)(ATM×1)[24/100]; +12(D12Z1×3)[39/100] | High Risk |
| CLL026 | 58 | M | 46,XY,del(11)(q22.3)[20] | ish del(11q22)(ATM×1)[31/100] | High Risk |
| CLL027 | 52 | M | 46,XY,del(11)(q23.1),del(17)(p11.2)[20] | ish del(11q22)(ATM×1)[28/100]; del(17p13)(TP53×1)[43/100] | High Risk |
| CLL028 | 51 | M | 46,XY,del(13)(q14.2)[10]/46,XY[10] | ish del(13q14)(D13S319×1)[57/100] | Favorable |
| CLL029 | 63 | F | 46,XX,del(13)(q14.2)[20] | ish del(13q14)(D13S319×1)[62/100] | Favorable |
| CLL030 | 59 | M | 47,XY,+12[20] | ish +12(D12Z1×3)[37/100] | Intermediate |
| CLL031 | 72 | F | 46,XX[20] | normal signal pattern | Favorable |
| CLL032 | 56 | M | 46,XY,del(11)(q22.3)[20] | ish del(11q22)(ATM×1)[29/100] | High Risk |
| CLL033 | 69 | M | 46,XY,del(17)(p11.2)[20] | ish del(17p13)(TP53×1)[47/100] | High Risk |
| CLL034 | 48 | F | 47,XX,+12[20] | ish +12(D12Z1×3)[34/100] | Intermediate |
| CLL035 | 66 | M | 46,XY,del(13)(q14.3)[20] | ish del(13q14)(D13S319×1)[59/100] | Favorable |
| CLL036 | 52 | F | 46,XX,del(11)(q23.1)[20] | ish del(11q22)(ATM×1)[22/100] | High Risk |
| CLL037 | 58 | M | 47,XY,+12,del(13)(q14.3)[20] | ish +12(D12Z1×3)[40/100]; del(13q14)(D13S319×1)[35/100] | Intermediate |
| CLL038 | 73 | M | 46,XY[20] | normal signal pattern | Favorable |
| CLL039 | 54 | F | 46,XX,del(17)(p11.1)[20] | ish del(17p13)(TP53×1)[45/100] | High Risk |
| CLL040 | 61 | M | 46,XY[20] | normal signal pattern | Unclassified |
| CLL041 | 57 | M | 46,XY,del(13)(q14.2)[12]/46,XY[8] | ish del(13q14)(D13S319×1)[63/100] | Favorable |
| CLL042 | 49 | F | 46,XX,del(11)(q22.3),del(17)(p11.2)[20] | ish del(11q22)(ATM×1)[27/100]; del(17p13)(TP53×1)[39/100] | High Risk |
| CLL043 | 64 | M | 47,XY,+12[20] | ish +12(D12Z1×3)[33/100] | Intermediate |
| CLL044 | 53 | F | 46,XX[20] | normal signal pattern | Favorable |
| CLL045 | 67 | M | 46,XY,del(13)(q14.1q14.3)[20] | ish del(13q14)(D13S319×1)[60/100] | Favorable |
| CLL046 | 70 | F | 47,XX,+12,del(17)(p11.2)[20] | ish +12(D12Z1×3)[43/100]; del(17p13)(TP53×1)[40/100] | Unclassified |
| CLL047 | 60 | M | 46,XY,del(11)(q22.3)[14]/46,XY[6] | ish del(11q22)(ATM×1)[30/100] | High Risk |
| CLL048 | 51 | F | 46,XX,del(13)(q14.2)[20] | ish del(13q14)(D13S319×1)[56/100] | Favorable |
Table 2.
Statistical analysis of telomere parameters for CLL samples based on interphase nuclei information.
Table 2.
Statistical analysis of telomere parameters for CLL samples based on interphase nuclei information.
| CLL patients | Total number of signals (Mean ± SD) | Total number of aggregates (Mean ± SD) | Total intensity (Mean ± SD) | Average intensity of all signals (Mean ± SD) | a/c Ratio (Mean ± SD) | Nuclear Volume (Mean ± SD) |
|---|---|---|---|---|---|---|
| Normal karyotype(a) | 29,56732 ± 2,87 | 1,77 ± 0,89 | 387342,566 | 12023,897 ± 432 | 6,65 ± 2,21 | 334543 ± 14324 |
| del(13q14)(b) | 33,67832 ± 2,43 | 3,66 ± 1,12 | 403234,763 | 13287,432 ± 443 | 5,44 ± 1,12 | 389652 ± 15432 |
| Trisomy 12(c) | 37,88341 ± 2,89 | 4,89 ± 1,15 | 603562,762 | 14432,432 ± 467 | 5,34 ± 1,54 | 443245 ± 16983 |
| del(17p13)(d) | 43,67343 ± 2,77 | 6,77 ± 0,94 | 656231,887 | 15893,341 ± 433 | 4,12 ± 0,99 | 489432 ± 18932 |
| del(11q22)(e) | 41,78322 ± 3,12 | 5,43 ± 1,21 | 778327,982 | 15584,453 ± 476 | 3,55 ± 1,66 | 456654 ± 13243 |
| p value | p<0,0001 | p<0,0001 | p<0,0001 | p<0,0001 | p<0,0001 | p<0,0001 |
| (a) vs (b)/(a) vs (c)/(a) vs (d)/ (a) vs (e) |
Disclaimer/Publisher’s Note: The statements, opinions and data contained in all publications are solely those of the individual author(s) and contributor(s) and not of MDPI and/or the editor(s). MDPI and/or the editor(s) disclaim responsibility for any injury to people or property resulting from any ideas, methods, instructions or products referred to in the content. |
© 2026 by the authors. Licensee MDPI, Basel, Switzerland. This article is an open access article distributed under the terms and conditions of the Creative Commons Attribution (CC BY) license (http://creativecommons.org/licenses/by/4.0/).
Copyright: This open access article is published under a Creative Commons CC BY 4.0 license, which permit the free download, distribution, and reuse, provided that the author and preprint are cited in any reuse.


