
Submitted:
23 January 2026
Posted:
23 January 2026
You are already at the latest version
Abstract
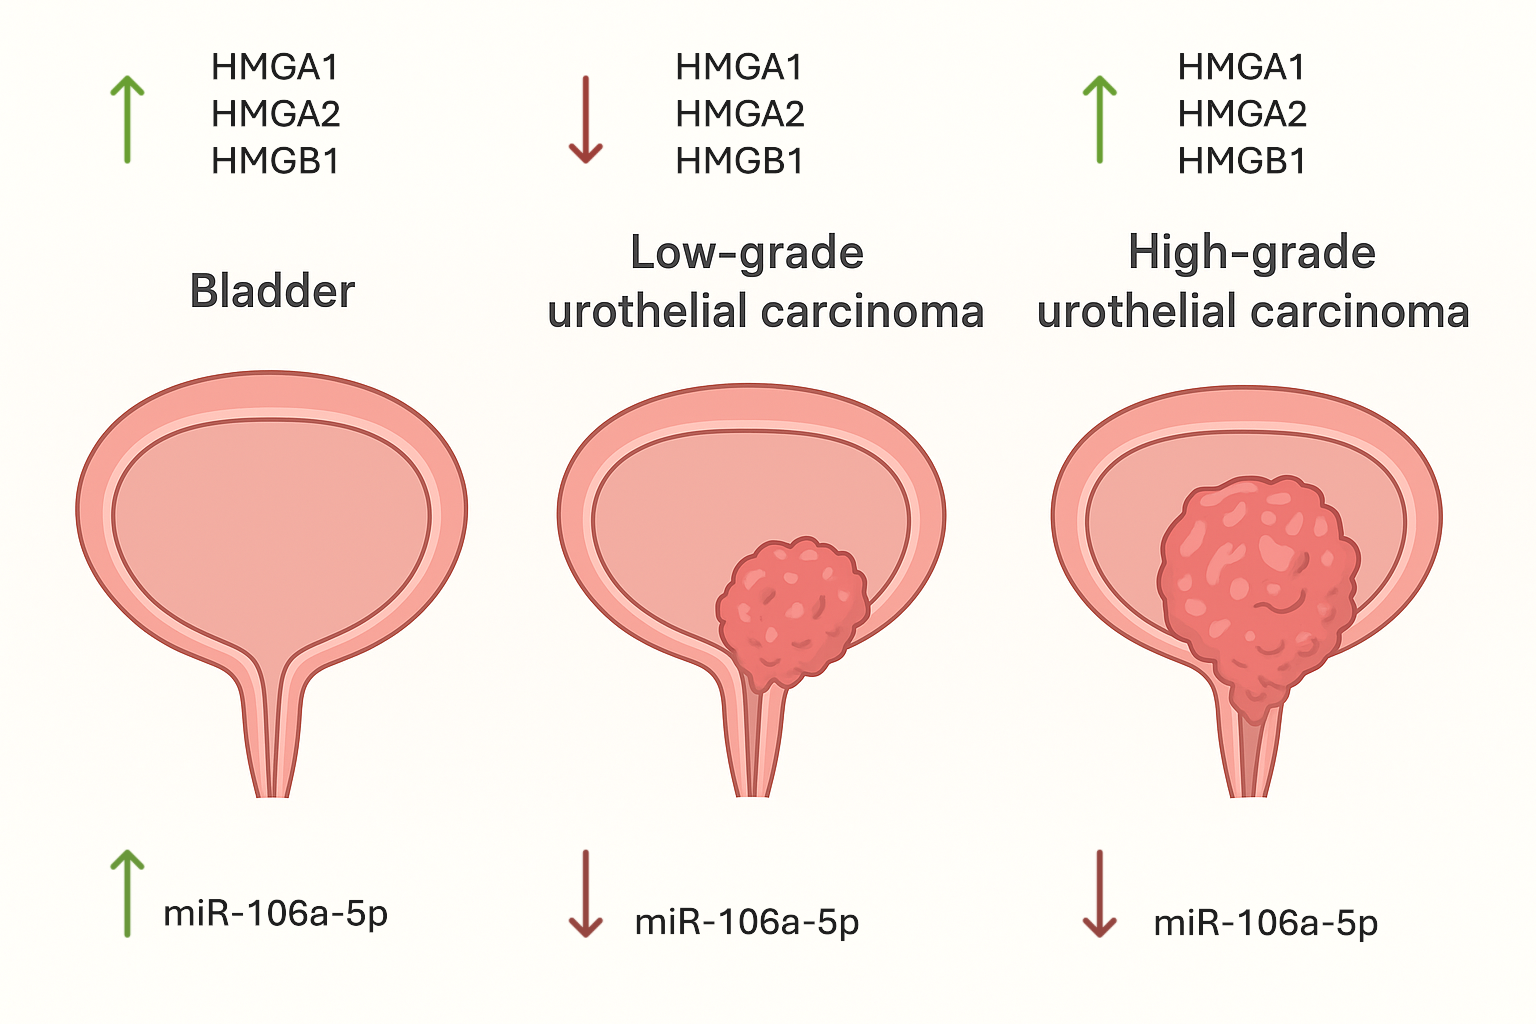
Background: Urothelial carcinoma (UC) of the bladder exhibits low- and high-grade papillary forms with distinct prognoses. High mobility group proteins (HMGA1, HMGA2, HMGB1) and miR‑106a‑5p are involved in tumor progression, but their interplay in UC remains incompletely understood. The aim of this study was to compare the expression of these parameters in low- and high-grade papillary UC. Methods: Tissue samples from 80 patients (40 low-grade and 40 high-grade) undergoing transurethral resection or cystectomy were analyzed, with control samples consisting of tumor-adjacent tissues without histopathological alterations obtained from the same patients. HMGA1, HMGA2, and HMGB1 protein expression was assessed immunohistochemically. Gene expression was quantified by real-time PCR, and miR‑106a‑5p levels were measured by droplet digital PCR. Statistical analysis was conducted using Statistica 13.3, applying one-way ANOVA with Tukey’s post hoc test and correlation analysis, with p < 0.05 considered significant. Results: Expression of HMGA1 and HMGB1 was reduced in low-grade papillary urothelial carcinoma compared to control tissues, whereas both proteins were significantly increased in high-grade lesions. HMGA2 expression was minimal in low-grade tumors but partially restored in high-grade tumors. Analysis revealed the highest levels of miR-106a-5p in normal urothelium, slightly decreaseed in low-grade tumors, and significantly reduced in high-grade carcers. Conclusions: HMG proteins and miR‑106a‑5p demonstrate distinct expression patterns in low- versus high-grade papillary UC, which correlates with tumor aggressiveness. These molecules may serve as diagnostic and prognostic biomarkers and potential therapeutic targets. Further research is needed to clarify the underlying mechanisms and validate clinical applicability.
Keywords:
urothelial carcinoma
; HMGA1
; HMGA2
; HMGB1
; miR-106a-5p
; tumor grading
; bladder cancer
1. Introduction
Urothelial carcinoma (UC) of the urinary bladder is a heterogeneous group of malignant tumors classified based on histopathological features into two major categories: low-grade and high-grade tumors. Grading is a key parameter for both prognosis and therapy guidance in this group of cancers. The pathogenesis of UC involves complex molecular mechanisms in which aberrant gene expression and alterations in cell regulatory proteins play a key role in tumor progression and metastasis [1,2,3].
Bladder cancer remains a major public health problem worldwide, with urothelial carcinoma accounting for approximately 90% of all bladder tumors. The high rate of relapse and risk of progression justify numerous attempts to develop an optimal, effective, and reproducible classification system for grading papillary urothelial tumors. The identifcation of well-validated molecular markers with prognostic and predictive properties remains a crucial step. Molecular classification of UC, integrating genomic, transcriptomic, and proteomic data, is becoming increasingly important, enabling a better understanding of tumor heterogeneity and guiding the development of targeted therapies [3,4]. In this context, investigating gene expression profiles, including chromatin-associated proteins and regulatory microRNAs, may provide valuable insights into the molecular mechanisms underlying tumor grade and tumor progression in urothelial carcinoma.
High mobility group (HMG) proteins, specifically HMGA1, HMGA2, and HMGB1, are non-histone chromatin-binding proteins involved in various cellular processes, including DNA repair, transcriptional regulation, and chromatin remodeling [5,6]. Recent studies suggest that changes in the expression of these proteins may influence the invasiveness, immunity, apoptosis, and metastatic potential of malignant tumors [7,8,9]. In urothelial carcinoma, the expression of HMGA1, HMGA2, and HMGB1 is associated with tumor aggressiveness and poor prognosis for patient [10,11,12].
In addition to HMG proteins, microRNAs (miRNAs) also play a crucial role in regulating gene expression in cancer. Thus, miR-106a-5p is associated with the regulation of key genes involved in cell cycle progression, apoptosis, and tumor metastasis [13,14]. Elevated levels of miR-106a-5p in prostate and ovarian cancer have been shown to lead to reduced expression of tumor suppressors (TIMP2, KLF6), thereby facilitating cell invasion and distant metastasis [13,15]. In breast cancer, miR-106a-5p promotes tumor progression by increasing cell resistance to oxidative stress-induced death via activation of the STAT3 pathway [16]. These results suggest that miR-106a-5p plays a key oncogenic role in many types of cancers by inhibiting the expression of tumor suppressor genes and modulating key signaling pathways.
This makes miR-106a-5p a promising candidate for cancer diagnostics and therapy. However, the limited number of studies exploring the role of miR-106a-5p in modulating HMG proteins and its impact on urothelial cancer progression highlights a significant gap in current knowledge, emphasizing the need for further in-depth investigation.
The aim of this study is to perform a comparative immunohistochemical evaluation of HMGA1, HMGA2, and HMGB1 proteins, along with miR-106a-5p analysis in high- and low-grade papillary urothelial carcinomas. Furthermore, gene expression analysis will be performed to better understand the molecular dynamics that influence the differential expression of these proteins and miRNAs depending on the tumor stage.
2. Materials and Methods
The study was conducted on tissue samples collected from patients after surgical removal of bladder tumors at the Department of Urology, Medical University of Bialystok. The study was approved by the Bioethics Committee of the Medical University of Bialystok, under the code APK.002.109.2023. All procedures were in accordance with applicable ethical guidelines and regulations. The research adhered to the principles outlined in the Declaration of Helsinki regarding research involving human participants.
The study included patients who undergoing transurethral resection of bladder tumors or radical cystectomy. Tissue samples for analysis were collected directly from the tumor during surgery. Samples for immunohistochemical analysis were fixed in 10% buffered formalin immediately after collection. For real-time PCR analysis, samples were placed in RNAlater solution and stored at -80°C. The study group consisted of 40 patients diagnosed with high-grade papillary urothelial carcinoma and 40 patients with low-grade tumors (Table 1). Control material consisted of tumor-adjacent tissues, free of histopathological changes, collected from the same patients.
2.1. Identification of HMGA1, HMGA2, and HMGB1 by Immunohistochemistry
Immunohistochemical analysis was conducted following a standardized protocol. Tissue specimens were initially fixed in 10% formalin to preserve morphology. The samples were subsequently dehydrated through a graded ethanol series, cleared in xylene, and embedded in molten paraffin wax. Once embedded, the tissue blocks were allowed to solidify before being sectioned.
Using a microtome, tissue sections approximately 4 μm thick were cut, mounted onto glass slides, and dried thoroughly. The sections underwent deparaffinization and rehydration before further processing. Primary antibodies targeting HMGA1 (Abcam ab252930, 1:600 ABCAM. Discovery Drive, Cambridge Biomedical Campus, Cambridge, CB2 0AX, UK), HMGA2 (Abcam ab207301, 1:250), and HMGB1 (ab79823, 1:400; ABCAM. Discovery Drive, Cambridge Biomedical Campus, Cambridge, CB2 0AX, UK) were diluted and applied to the tissue. Antigen retrieval was performed using Target Retrieval Solution (citrate buffer, pH 6.0; S2369; Agilent Technologies, Inc. Santa Clara, CA, USA) at 125°C. To inhibit endogenous peroxidase activity, the slides were treated with 0.3% hydrogen peroxide for 10 minutes.
After overnight incubation with the primary antibodies at 4°C, sections were treated with an HRP-conjugated secondary antibody (DAKO REAL™ EnVision™ Detection System, K5007, Agilent Technologies, Inc. Santa Clara, CA, USA) for 1 hour. Visualization of the antibody-antigen complexes was achieved using DAB chromogen. Hematoxylin QS (H-3404, Vector Laboratories) was used for nuclear counterstaining. Each step of the staining procedure was followed by rinsing the slides in Wash Buffer (S3006 Agilent Technologies, Inc. Santa Clara, CA, USA).
Antibody specificity was verified through the use of both negative and positive controls. Negative controls were prepared by omitting the primary antibody and replacing it with either diluent or a non-specific antibody of the same isotype, species, and concentration. Positive controls utilized tissues known to express the target antigen, as recommended by the antibody manufacturer. In the positive controls, staining was confined to expected structures, while background tissues remained unstained. No specific signal was observed in the negative controls.
Histological evaluation was performed using an Olympus BX43 light microscope equipped with an Olympus DP12 digital camera (Olympus Corp.). Digital images of both cancerous and normal bladder tissue were analyzed morphometrically using NIS Elements AR 3.10 software (Nikon). The staining intensity for each antibody was assessed using grayscale.
2.2. Real-Time PCR
Fresh-frozen bladder cancer specimens and matched adjacent normal tissue were collected into Eppendorf tubes containing RNA-later (Invitrogen AM7021) and stored at −80 °C. Total RNA was extracted using the Macherey-Nagel NucleoSpin® RNA kit. RNA quantity and purity (A₂₆₀/₂₈₀) were assessed using a NanoDrop 2000 (Thermo Scientific). First-strand cDNA was synthesized from total RNA using BIO-RAD’s iScript™ Advanced cDNA Synthesis Kit in a SureCycler 8800 thermal cycler (Agilent Technologies) under the following cycling conditions: 46 °C for 20 min, 95 °C for 1 min, and a final hold at 4 °C.
Quantitative real-time PCR was performed on a Stratagene Mx3005P instrument using SsoAdvanced™ Universal SYBR® Green Supermix (BIO-RAD). Gene expression assays (PrimePCR™ SYBR® Green) were employed with the following unique assay IDs: HMGA1 (human PrimePCR assay qHsaCED0004947 BIO-RAD), HMGA2 (human PrimePCR assay qHsaCED0021425 BIO-RAD) and HMGB1 (human PrimePCR assay qHsaCED0020471 BIO-RAD).
All reactions were performed in duplicate in 10 μL volumes with the following thermal profile: 95 °C for 2 min (enzyme activation), then 40 cycles of 95 °C for 5 s (denaturation) and 60 °C for 30 s (annealing/extension). Control reactions included no-RT controls, no-template controls, and melting curve analysis to verify single-product amplification.
Relative quantification of gene expression was performed using the ΔΔCt method. Gene expression levels were normalized to GAPDH and expressed relative to the control tissue.
2.3. Digital PCR
RNA extraction from urothelial carcinoma of the bladder tissues was performed using the miRNeasy Tissue/Cells Advanced Micro Kit (Qiagen, Copenhagen, Denmark, cat. no. 217684) following the manufacturer's protocol. A 4 mm³ section was excised from each tissue specimen and placed into a 1.5 ml reaction tube with 60 μl of lysis solution containing 1% β-mercaptoethanol. Tissues were homogenized using a disposable polypropylene pestle and then lysed in 700 μl of QIAzol Lysis Reagent (Qiagen, cat. no. 79306). Subsequent steps were carried out as per the manufacturer's instructions. RNA was eluted using 40 μl of RNase-free water (Qiagen, cat. no. 129112). Purity, concentration, and contamination of RNA samples were assessed using a NanoDrop spectrophotometer (Thermo Fisher Scientific, Waltham, MA, USA). Reverse transcription of RNA was performed using the miRCURY LNA RT Kit (Qiagen, cat. no. 339340). For fresh frozen urothelial carcinoma of the bladder tissues, RNA concentration was adjusted to 5 ng/μl per sample, with 2 μl added to a total reaction volume of 10 μl, including 0.5 μl of UniSp6 RNA spike-in. Digital PCR (dPCR) reactions utilized the miRCURY LNA miRNA PCR Assays kit (Qiagen, cat. no. 39306) in a 96-well plate format, analyzed on the QIAcuity One nucleic acid detection instrument (Qiagen) with QIAcuity Software Suite software (Qiagen). Reaction mixtures consisted of 4 μl 3x EvaGreen PCR Master Mix (Qiagen, cat. no. 250111), 1.2 μl miRCURY LNA PCR Assay (10x) (Qiagen, cat. no. 339306), 3 μl cDNA template (Qiagen), and 3.8 μl RNase-free water (Qiagen, cat. no. 129112), totaling 12 μl. A 96-well nanoplate with 8,500 partitions was used. The miRNA under study was miRNA-106a-5p (Qiagen, cat. no. YP00204563). The reaction mix was dispensed into standard PCR plates, and each well content was transferred to the QIAcuity Nanoplate (Qiagen). Cycling conditions included initial PCR heat activation for 2 minutes at 95˚C, followed by 40 cycles of denaturation at 95˚C for 15 s and annealing at 60˚C for 1 minute, concluding with a 5-minute cool-down at 40˚C. Raw data were analyzed using the QIAcuity Software Suite (Qiagen).
2.4. Statistical Analysis
Statistical analysis was performed using Statistica version 13.3 software. Data distribution was assessed prior to analysis. Differences between groups were evaluated using one-way analysis of variance (ANOVA), followed by Tukey’s post-hoc test for multiple comparisons. A p-value < 0.05 was considered statistically significant.
To analyze the correlation between the tested proteins, r2, β coefficient, and statistical significance (p) were calculated. The relationship between two variables was acknowledged to be statistically significant at the value of the β coefficient for which p < 0.05.
3. Results
3.1. Immunohistochemistry
Immunohistochemical Evaluation of HMGA1 in Papillary Urothelial Carcinoma of the Bladder
In control tissues, strong HMGA1 immunoreactivity was observed, localized primarily in the nuclei of urothelial epithelial cells (Figure 1A). In low-grade lesions, a marked decrease in HMGA1 immunoexpression was noted (Figure 1B). In contrast, strong, particularly nuclear, immunoreactivity for this protein was observed in high-grade tumors (Figure 1C).
Immunohistochemical Evaluation of HMGA2 in Papillary Urothelial Carcinoma of the Bladder
Very weak immunoreactivity for HMGA2 protein was demonstrated in the cytoplasm of transitional epithelial cells in control tissues (Figure 2A). In low-grade papillary urothelial carcinoma, the HMGA2 reaction was completely negative (Figure 2B). In high-grade tumors, weak but clearly visible HMGA2 immunoreactivity was observed (Figure 2C).
Immunohistochemical Evaluation of HMGB1 in Papillary Urothelial Carcinoma of the Bladder
HMGB1 protein immunoreactivity in control tissues was very strong in the nuclei of epithelial cells and some mucosal cells (Figure 3A). The weakest HMGB1 immunoreactivity was observed in the nuclei of low-grade tumor cells (Figure 3B). High-grade lesions demonstrated strong nuclear immunoreactivity (Figure 3C).
Measurement of immunohistochemical reaction intensity using computerized image analysis, confirmed by statistical evaluation, revealed reduced immunoreactivity of HMGA1, HMGA2, and HMGB1 in low-grade papillary urothelial carcinoma compared with the control group. However, in high-grade urothelial carcinoma, the immunoreactivity of the tested proteins was highest (Table 2).
As for the relationships between the tested proteins - HMGA1, HMGA2 and HMGB1 in control tissues and urothelial papillary carcinoma, mutually positive correlations were found between each protein tested. The results of the correlation between the tested proteins are presented in the Table 3.
3.2. Real-Time PCR
QRT-PCR analysis showed a significant decrease in HMGA1, HMGA2, and HMGB1 expression in low-grade papillary urothelial carcinoma compared with control tissue. In high-grade tumors, the expression of HMGA1 was markedly increased relative to the control group and was significantly higher than in the low-grade group. In contrast, HMGA2 and HMGB1 expression in high-grade tumors was not significantly different from that in the control group, but was significantly higher than that in the low-grade group (Figure 4).
3.2. Digital PCR
The droplet digital PCR analysis assessed miR-106a-5p expression in control tissue, low-grade, and high-grade papillary urothelial carcinoma. The results demonstrate:
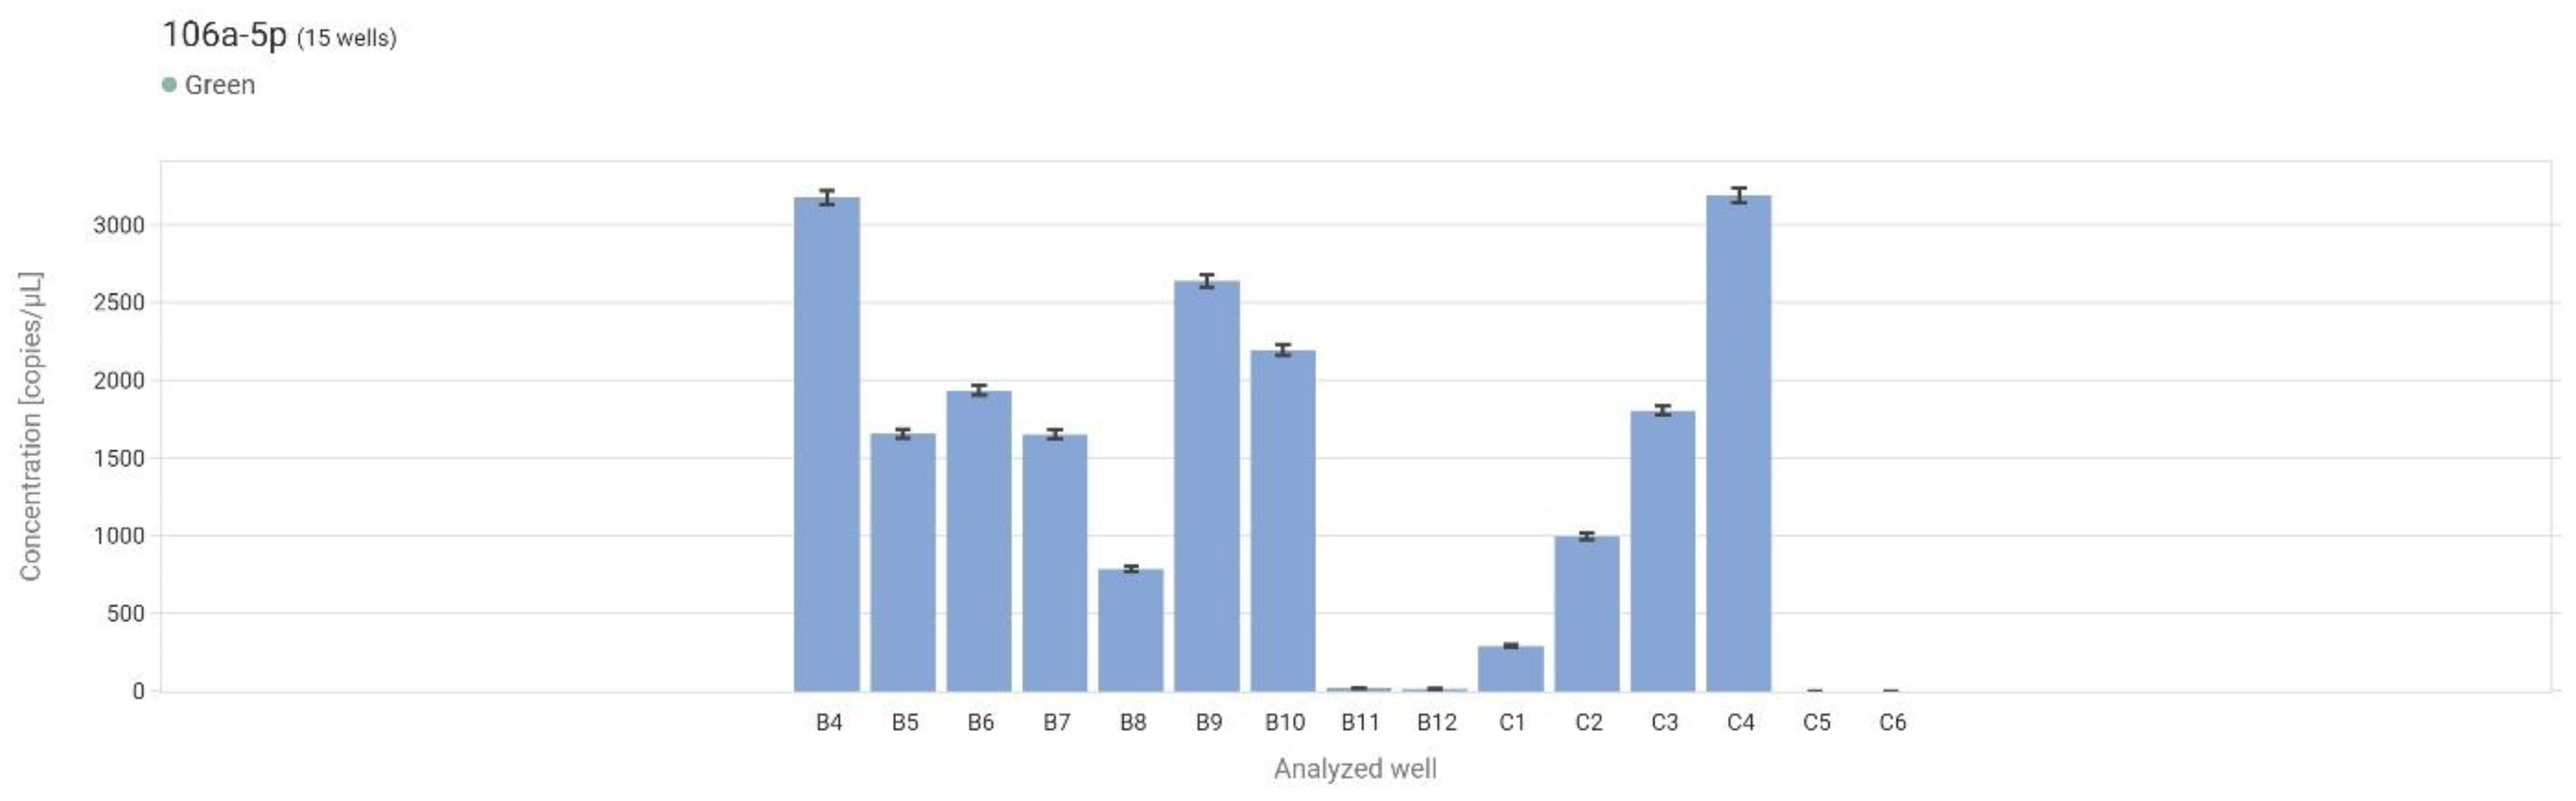
The highest mean expression was observed in non-neoplastic tissue (control) and amounted to 2103.78 copies/µL. Slightly lower expression was found in low-grade urothelial carcinoma (LG) with a mean value of 1872.63 copies/µL. A marked decrease in expression was noted in high-grade carcinoma (HG), with a mean concentration of 1217.23 copies/µL. The NTC sample confirmed the assay's specificity, with 0 copies/µL detected (Figure 5).
Figure 6.
Concentration levels (copies/μL) for each sample in the form of a bar graph. B4-B7 – control, B8-B11 – LG, B12-C4 – HG, C5-C6 – NCT.
Figure 6.
Concentration levels (copies/μL) for each sample in the form of a bar graph. B4-B7 – control, B8-B11 – LG, B12-C4 – HG, C5-C6 – NCT.
4. Discussion
Bladder cancer remains a significant clinical challenge due to its high incidence and variable biological behavior. More than 90% of human bladder cancers cases are urothelial carcinomas. The term “urothelial carcinoma” is preferred over “transitional cell carcinoma”. There are two main variants of this disease, each with distinct prognoses: low-grade and high-grade tumors. Low-grade lesions are non-invasive, pose a low risk of progression, and are usually not life-threatening. High-grade tumors exhibit a more aggressive course and, without treatment, can progress to muscle-invasive lesions. Early diagnosis and staging of cancer are crucial for effective treatment. Analysis of the expression of genes and proteins associated with pathways regulating proliferation, survival, and invasiveness may improve understanding of urothelial cancer biology.
In this study, we performed a comparative analysis of HMGA1, HMGA2, HMGB1, and miR-106a-5p expression in low and high-grade papillary urothelial carcinoma. Our results reveal that high-grade tumors are characterized by significantly increased expression of HMG proteins, along with downregulation of miR-106a-5p, which may reflect molecular mechanisms associated with tumor aggressiveness and progression.
We also demonstrated decreased HMGA1 expression in low-grade tumors compared with control tissues and increased expression in high-grade tumors. This observation is consistent with the study by Ding et al. (2014), who reported that HMGA1 is significantly upregulated in advanced bladder cancer and correlates with aggressive clinicopathological features [10]. Elevated HMGA1 levels may enhance tumor progression by modulating chromatin architecture and regulating the transcription of genes associated with cell proliferation and invasion [17,18,19].
The apparent downregulation of HMGA1 in low-grade tumors may reflect a reliance on alternative proliferative pathways in early malignant lesions. In turn, high-grade tumors appear to “reactivate” HMGA1, acting as a regulatory switch driving aggressive phenotypes. This concept echoes earlier findings by Huso et al., who described HMGA1 as a ‘molecular switch’ required for tumor progression [20]. In turn, Khazem (2024) characterizes HMGA family proteins - particularly HMGA2 - as architectural factors modulating chromatin dynamics and tumor plasticity [21].
Increased expression of HMGA1 in high-grade tumors may promote bladder cancer progression by remodeling chromatin structure and activating transcriptional programs involved in cell proliferation, migration, and invasion. HMGA1 has been described as a molecular switch for tumor progression, whose reactivation is associated with aggressive tumor phenotypes [17,18,19,20].
In the present study, HMGA2 expression showed a distinct stage-dependent pattern in papillary urothelial carcinoma. Both immunohistochemical and gene expression analyses revealed very low or undetectable HMGA2 levels in adjacent normal urothelium and in low-grade tumors. In contrast, high-grade tumors showed a significant increase in HMGA2 expression compared to low-grade lesions, but this did not exceed the levels observed in control tissue.
Our results are consistent with reports by other authors, who indicate an association of increased HMGA2 expression with invasiveness in advanced bladder cancer [11,22]. Ding et al. demonstrated elevated HMGA2 expression in bladder cancer tissues and linked it to epithelial–mesenchymal transition and aggressive tumor behavior [11]. Elevated circulating HMGA2 levels in patients with high-grade, muscle-invasive urothelial carcinoma were also demonstrated in studies by Khazem and Zetoune [22].
The reappearance of HMGA2 in high-grade tumors can be explained by the loss of certain tumor-suppressive microRNAs (miRNAs) that typically maintain its expression at low levels. One of the best-known examples is the let-7 family, which directly binds to the 3′-UTR of HMGA2 and prevents its translation; when this control is lost, HMGA2 can promote epithelial–mesenchymal transition (EMT) and tumor progression [23]. In bladder cancer, miR-485-5p has been shown to block HMGA2-driven EMT and invasion, while reduced levels of this miRNA restore HMGA2 activity and tumor aggressiveness [24]. Similar mechanisms have been reported in other cancers, for instance, the miR-302a-5p/367-3p-HMGA2 axis in endometrial carcinoma; additionally, miR-142-3p in cervical cancer, miR-219-5p and miR-154 in prostate cancer, the miR-98/HMGA2/periostin axis in laryngeal carcinoma, and several miRNAs including miR-101, miR-204-5p, miR-485-5p, and miR-150 in various tumor types [25,26].
Re-expression of HMGA2 in high-grade tumors may result from the loss of tumor-suppressive microRNA-mediated regulation and contribute to epithelial–mesenchymal transition (EMT), thereby increasing tumor invasiveness and metastatic potential. Previous studies have demonstrated the involvement of HMGA2 in EMT and the aggressive behavior of advanced urothelial carcinoma and other malignancies [11,22,24,26].
Our results demonstrated a distinct stage-dependent pattern of HMGB1 expression in papillary urothelial carcinoma. High levels HMGB1 were found in control tissues, but expression was decreased in low-grade tumors and significantly increased in high-grade lesions. These findings are consistent with literature reports indicating higher HMGB1 expression in more aggressive forms of bladder cancer. Suren et al. demonstrated significantly higher levels of HMGB1 in invasive urothelial carcinoma compared with non-invasive tumors, supporting the association between HMGB1 expression and tumor aggressiveness [28]. Furthermore, as described by other researchers, HMGB1 is a context-dependent protein and is characterized by altered expression in advanced malignancies [9,27].
Increased expression of HMGB1 observed in high-grade tumors may reflect its context-dependent role in cancer, encompassing both nuclear functions related to transcriptional regulation and extracellular signaling that promotes inflammation, invasion, and tumor progression. In urothelial carcinoma, elevated HMGB1 levels have been associated with more aggressive and invasive tumor phenotypes [9,27,28].
In the examined control tissues and in low- and high-grade papillary urothelial carcinoma, positive correlations were found between the expression of HMGA1, HMGA2, and HMGB1, suggesting their interdependent regulation and potential involvement in similar biological mechanisms in both physiological and neoplastic conditions.
Our droplet digital PCR analysis revealed the highest expression of miR-106a-5p in control tissue, a slight decrease in low-grade tumors, and a significant reduction in high-grade carcinomas, suggesting a context-dependent tumor suppressive role of miR-106a-5p in urothelial carcinoma. This observation contrasts with reports from other malignancies, such as prostate, ovarian, and breast cancer, where miR-106a-5p has been shown to function predominantly as an oncogenic miRNA, highlighting the tissue context-specific nature of miRNA function [13,14,15,16]. Although the direct targeting of miR-106a-5p to HMGA2 in bladder cancer remains unconfirmed, existing literature supports the involvement of miRNAs in the regulation of HMGA2 expression. For example, the let-7 family of miRNAs directly interacts with HMGA2 by binding to its 3′-UTR, thereby inhibiting its expression and suppressing tumor progression; disruption of this interaction can lead to increased oncogenic transformation [29]. Additionally, a comprehensive review by Hashemi et al. discusses how various miRNAs, including let-7, modulate HMGA2 expression, influencing hallmarks of cancer such as apoptosis, proliferation, EMT, invasion, and metastasis [30].
Downregulation of miR-106a-5p in high-grade tumors may indicate a context-dependent tumor-suppressive function and reflect broader dysregulation of microRNA-mediated posttranscriptional control during tumor progression. Although the direct effect of miR-106a-5p on HMGA2 in bladder cancer has not yet been confirmed, numerous evidences indicate that disruption of the miRNA network leads to increased expression of HMGA2 and promotes EMT, invasion and metastasis [23,29,30].
Although the results of this study are interesting and highlight the potential role of the analyzed markers in the progression of urothelial carcinoma, a limitation is the relatively small sample size, which may limit the generalizability of the findings to the broader patient population. Moreover, the analysis focused primarily on expression profiles, without in-depth functional studies that could better elucidate the molecular mechanisms underlying the observed associations. Future studies with larger cohorts and functional analyses are needed to confirm these findings and clarify their biological and clinical significance.
In summary, our study demonstrates distinct differences in the expression of HMGA1, HMGA2, HMGB1, and miR-106a-5p between low- and high-grade papillary urothelial carcinoma. High-grade tumors are characterized by increased expression of HMGA1 and HMGA2, along with decreased levels of miR-106a-5p, which may be associated with tumor aggressiveness and disease progression. HMGB1 exhibits a biphasic expression pattern, reflecting its dual intracellular and extracellular roles in cancer biology. Taken together, these findings suggest that HMG proteins and selected miRNAs may serve as potential biomarkers of malignancy grade and prognosis in cancer. Further research is needed to better define the underlying molecular mechanisms and to explore their potential clinical applications in diagnosis and targeted therapy.
Institutional Review Board Statement
This study was approved by the Bioethics Committee of the Medical University of Bialystok. The code for our study is APK.002.368.2023.
Informed Consent Statement
Informed consent was obtained from all subjects involved in the study.
Data Availability Statement
The data presented in this study are available on request from the corresponding author. (please specify the reason for restriction, e.g., the data are not publicly available due to privacy or ethical restrictions.).
Conflicts of Interest
The authors declare no conflicts of interest.
References
- Kirkali Z, Chan T, Manoharan M, Algaba F, Busch C, Cheng L, Kiemeney L, Kriegmair M, Montironi R, Murphy WM, Sesterhenn IA, Tachibana M, Weider J. Bladder cancer: epidemiology, staging and grading, and diagnosis. Urology. 2005 Dec;66(6 Suppl 1):4-34. PMID: 16399414. [CrossRef]
- Martinez Rodriguez RH, Buisan Rueda O, Ibarz L. Bladder cancer: Present and future. Med Clin (Barc). 2017 Nov 22;149(10):449-455. English, Spanish. Epub 2017 Jul 21. PMID: 28736063. [CrossRef]
- Dyrskjøt L, Hansel DE, Efstathiou JA, Knowles MA, Galsky MD, Teoh J, Theodorescu D. Bladder cancer. Nat Rev Dis Primers. 2023 Oct 26;9(1):58. PMID: 37884563; PMCID: PMC11218610. [CrossRef]
- Zachos I. Urothelial Carcinoma: Role of Biomarkers in Diagnosis, Prognosis and Treatment. Biomedicines. 2025 Jul 11;13(7):1696. PMID: 40722767; PMCID: PMC12292096. [CrossRef]
- Wang Y, Hu L, Zheng Y, Guo L. HMGA1 in cancer: Cancer classification by location. J Cell Mol Med. 2019 Apr;23(4):2293-2302. Epub 2019 Jan 7. PMID: 30614613; PMCID: PMC6433663. [CrossRef]
- Mansoori B, Mohammadi A, Ditzel HJ, Duijf PHG, Khaze V, Gjerstorff MF, Baradaran B. HMGA2 as a Critical Regulator in Cancer Development. Genes (Basel). 2021 Feb 13;12(2):269. PMID: 33668453; PMCID: PMC7917704. [CrossRef]
- Hashemi M, Rashidi M, Hushmandi K, Ten Hagen TLM, Salimimoghadam S, Taheriazam A, Entezari M, Falahati M. HMGA2 regulation by miRNAs in cancer: Affecting cancer hallmarks and therapy response. Pharmacol Res. 2023 Apr;190:106732. Epub 2023 Mar 15. PMID: 36931542. [CrossRef]
- Ma Q, Ye S, Liu H, Zhao Y, Zhang W. The emerging role and mechanism of HMGA2 in breast cancer. J Cancer Res Clin Oncol. 2024 May 16;150(5):259. PMID: 38753081; PMCID: PMC11098884. [CrossRef]
- Wang S, Zhang Y. HMGB1 in inflammation and cancer. J Hematol Oncol. 2020 Aug 24;13(1):116. PMID: 32831115; PMCID: PMC7443612. [CrossRef]
- Chen X, Chen S. LINC00649 promotes bladder cancer malignant progression by regulating the miR-15a-5p/HMGA1 axis. Oncol Rep. 2021 Apr;45(4):8. Epub 2021 Mar 2. PMID: 33649788; PMCID: PMC7876990. [CrossRef]
- Ding X, Wang Y, Ma X, Guo H, Yan X, Chi Q, Li J, Hou Y, Wang C. Expression of HMGA2 in bladder cancer and its association with epithelial-to-mesenchymal transition. Cell Prolif. 2014 Apr;47(2):146-51. Epub 2014 Feb 26. PMID: 24571540; PMCID: PMC6496012. [CrossRef]
- Lv L, Wei Q, Zhang J, Dong Y, Shan Z, Chang N, Zhao Y, Bian P, Yi Q. IGF2BP3 prevent HMGB1 mRNA decay in bladder cancer and development. Cell Mol Biol Lett. 2024 Mar 19;29(1):39. PMID: 38504159; PMCID: PMC10949762. [CrossRef]
- Zheng Y, Zhu K, Wang G. miR-106a-5p carried by tumor-derived extracellular vesicles promotes the invasion and metastasis of ovarian cancer by targeting KLF6. Clin Exp Metastasis. 2022 Aug;39(4):603-621. Epub 2022 Apr 21. PMID: 35449340. [CrossRef]
- Coman RA, Schitcu VH, Budisan L, Raduly L, Braicu C, Petrut B, Coman I, Berindan-Neagoe I, Al Hajjar N. Evaluation of miR-148a-3p and miR-106a-5p as Biomarkers for Prostate Cancer: Pilot Study. Genes (Basel). 2024 May 4;15(5):584. PMID: 38790213; PMCID: PMC11120777. [CrossRef]
- Lin TH, Chang SL, Khanh PM, Trang NTN, Liu SC, Tsai HC, Chang AC, Lin JY, Chen PC, Liu JF, Guo JH, Liu CL, Wu HC, Tang CH. Apelin Promotes Prostate Cancer Metastasis by Downregulating TIMP2 via Increases in miR-106a-5p Expression. Cells. 2022 Oct 19;11(20):3285. PMID: 36291151; PMCID: PMC9600532. [CrossRef]
- Zhang H, Ge Z, Wang Z, Gao Y, Wang Y, Qu X. Circular RNA RHOT1 promotes progression and inhibits ferroptosis via mir-106a-5p/STAT3 axis in breast cancer. Aging (Albany NY). 2021 Mar 3;13(6):8115-8126. Epub 2021 Mar 3. PMID: 33686957; PMCID: PMC8034942.] . [CrossRef]
- Fu F, Wang T, Wu Z, Feng Y, Wang W, Zhou S, Ma X, Wang S. HMGA1 exacerbates tumor growth through regulating the cell cycle and accelerates migration/invasion via targeting miR-221/222 in cervical cancer. Cell Death Dis. 2018 May 22;9(6):594. PMID: 29789601; PMCID: PMC5964147. [CrossRef]
- Shah SN, Cope L, Poh W, Belton A, Roy S, Talbot CC Jr, Sukumar S, Huso DL, Resar LM. HMGA1: a master regulator of tumor progression in triple-negative breast cancer cells. PLoS One. 2013 May 2;8(5):e63419. PMID: 23658826; PMCID: PMC3642138. [CrossRef]
- Li L, Kim JH, Lu W, Williams DM, Kim J, Cope L, Rampal RK, Koche RP, Xian L, Luo LZ, Vasiljevic M, Matson DR, Zhao ZJ, Rogers O, Stubbs MC, Reddy K, Romero AR, Psaila B, Spivak JL, Moliterno AR, Resar LMS. HMGA1 chromatin regulators induce transcriptional networks involved in GATA2 and proliferation during MPN progression. Blood. 2022 May 5;139(18):2797-2815. PMID: 35286385; PMCID: PMC9074401. [CrossRef]
- Huso TH, Resar LM. The high mobility group A1 molecular switch: turning on cancer - can we turn it off? Expert Opin Ther Targets. 2014 May;18(5):541-53. Epub 2014 Mar 31. PMID: 24684280; PMCID: PMC4404637. [CrossRef]
- Khazem F, Zetoune AB. Decoding high mobility group A2 protein expression regulation and implications in human cancers. Discov Oncol. 2024 Jul 31;15(1):322. PMID: 39085703; PMCID: PMC11291832. [CrossRef]
- Khazem F, Zetoune AB. Investigating the role of HMGA2 plasma level as a diagnostic marker in bladder urothelial carcinoma patients. J Cancer Res Clin Oncol. 2025 Apr 9;151(4):134. PMID: 40204943; PMCID: PMC11982150. [CrossRef]
- Mayr C, Hemann MT, Bartel DP. Disrupting the pairing between let-7 and Hmga2 enhances oncogenic transformation. Science. 2007 Mar 16;315(5818):1576-9. Epub 2007 Feb 22. PMID: 17322030; PMCID: PMC2556962. [CrossRef]
- Chen Z, Li Q, Wang S, Zhang J. miR-485-5p inhibits bladder cancer metastasis by targeting HMGA2. Int J Mol Med. 2015 Oct;36(4):1136-42. Epub 2015 Aug 3. PMID: 26239806. [CrossRef]
- Ma J, Li D, Kong FF, Yang D, Yang H, Ma XX. miR-302a-5p/367-3p-HMGA2 axis regulates malignant processes during endometrial cancer development. J Exp Clin Cancer Res. 2018 Feb 1;37(1):19. PMID: 29391048; PMCID: PMC5796297. [CrossRef]
- Ma Q, Ye S, Liu H, Zhao Y, Mao Y, Zhang W. HMGA2 promotes cancer metastasis by regulating epithelial-mesenchymal transition. Front Oncol. 2024 Feb 1;14:1320887. PMID: 38361784; PMCID: PMC10867147. [CrossRef]
- Lv G, Yang M, Gai K, Jia Q, Wang Z, Wang B, Li X. Multiple functions of HMGB1 in cancer. Front Oncol. 2024 Apr 25;14:1384109. PMID: 38725632; PMCID: PMC11079206. [CrossRef]
- Suren D, Yildirim HT, Atalay I, Sayiner A, Yildirim M, Alikanoglu AS, Sezer C. HMGB1 expression in urothelial carcinoma of the bladder. J BUON. 2018 Nov-Dec;23(6):1882-1886. PMID: 30610817.
- Lee YS, Dutta A. The tumor suppressor microRNA let-7 represses the HMGA2 oncogene. Genes Dev. 2007 May 1;21(9):1025-30. Epub 2007 Apr 16. PMID: 17437991; PMCID: PMC1855228. [CrossRef]
- Hashemi M, Rashidi M, Hushmandi K, Ten Hagen TLM, Salimimoghadam S, Taheriazam A, Entezari M, Falahati M. HMGA2 regulation by miRNAs in cancer: Affecting cancer hallmarks and therapy response. Pharmacol Res. 2023 Apr;190:106732. Epub 2023 Mar 15. PMID: 36931542. [CrossRef]
Figure 1.
Immunoidentification of HMGA1 in papillary urothelial carcinoma: (A) control, (B) low-grade, and (C) high-grade. Scale bar: 50 μm.
Figure 1.
Immunoidentification of HMGA1 in papillary urothelial carcinoma: (A) control, (B) low-grade, and (C) high-grade. Scale bar: 50 μm.
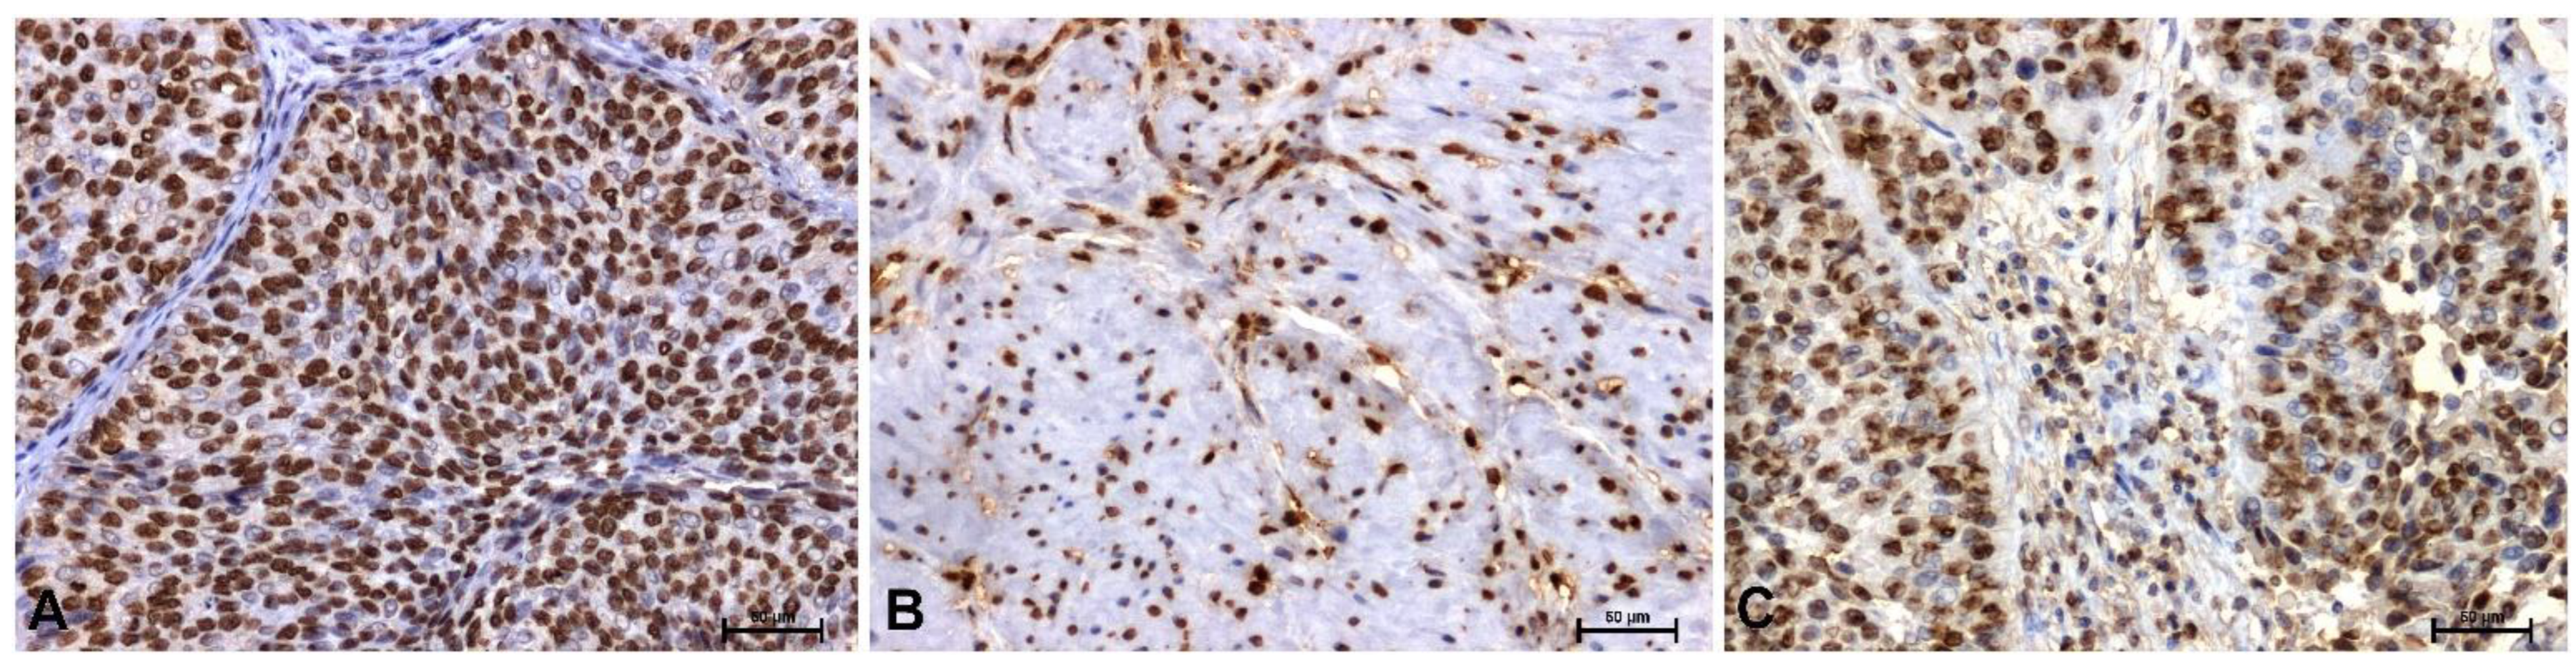
Figure 2.
Immunoidentification of HMGA2 in papillary urothelial carcinoma: (A) control, (B) low-grade, and (C) high-grade. Scale bar: 50 μm.
Figure 2.
Immunoidentification of HMGA2 in papillary urothelial carcinoma: (A) control, (B) low-grade, and (C) high-grade. Scale bar: 50 μm.
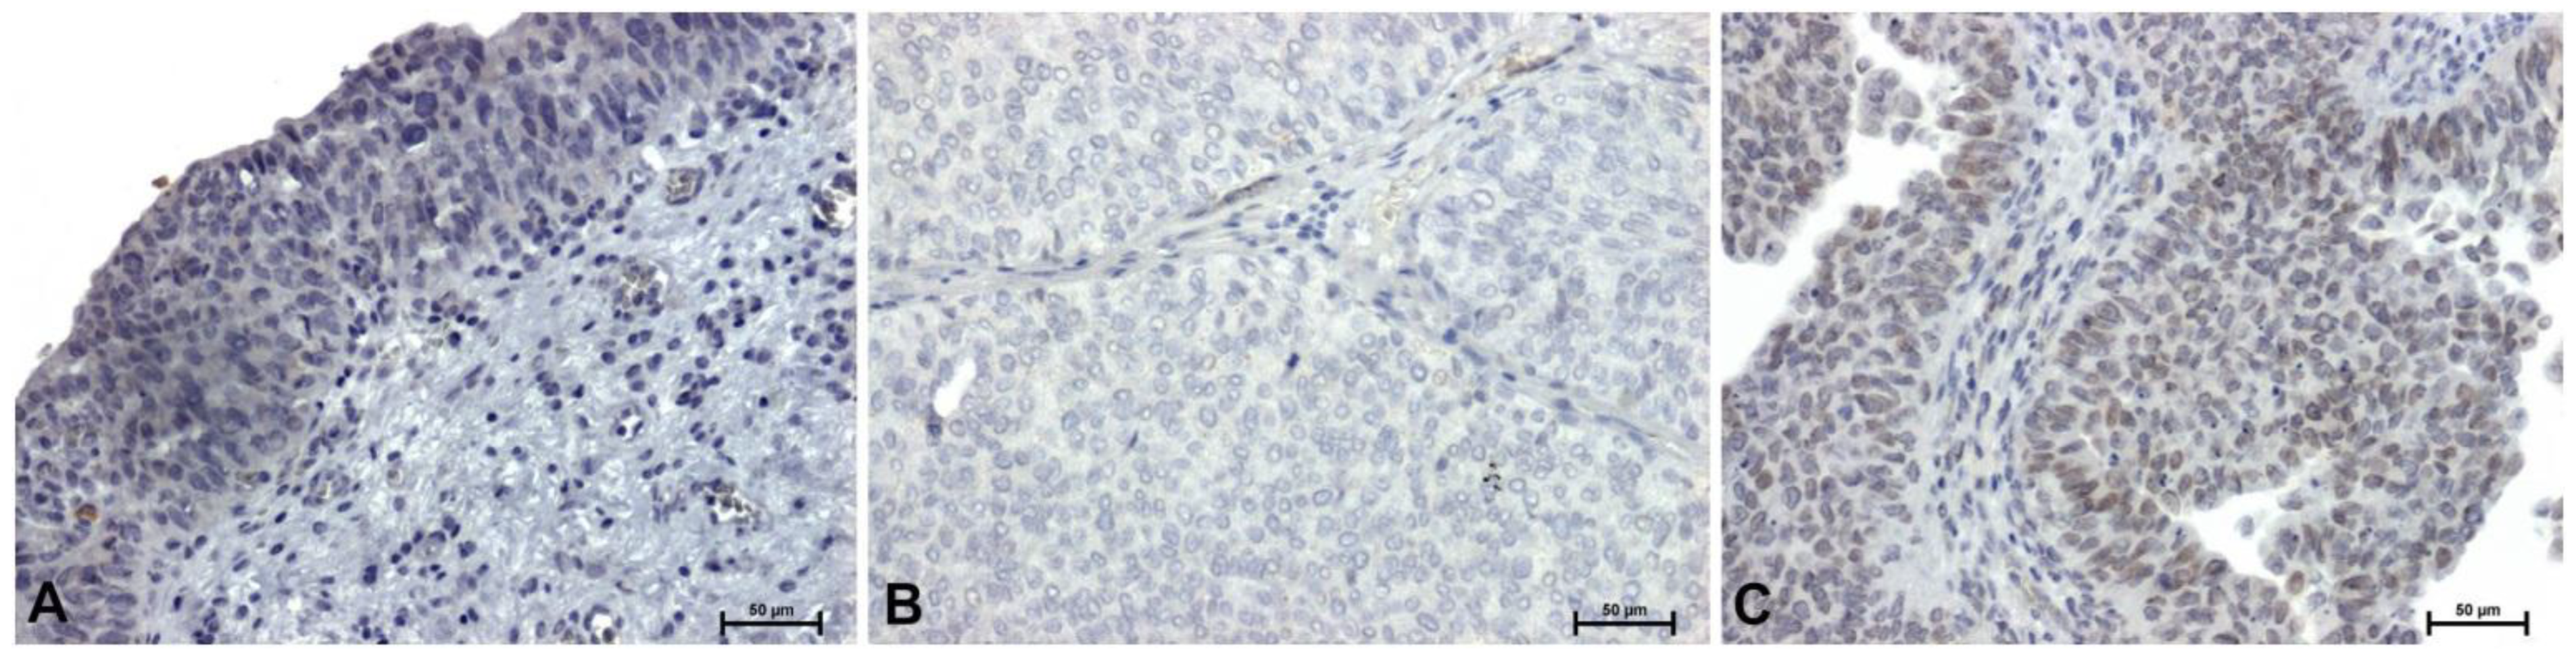
Figure 3.
Immunoidentification of HMGB1 in papillary urothelial carcinoma: (A) control, (B) low-grade, and (C) high-grade. Scale bar: 50 μm.
Figure 3.
Immunoidentification of HMGB1 in papillary urothelial carcinoma: (A) control, (B) low-grade, and (C) high-grade. Scale bar: 50 μm.
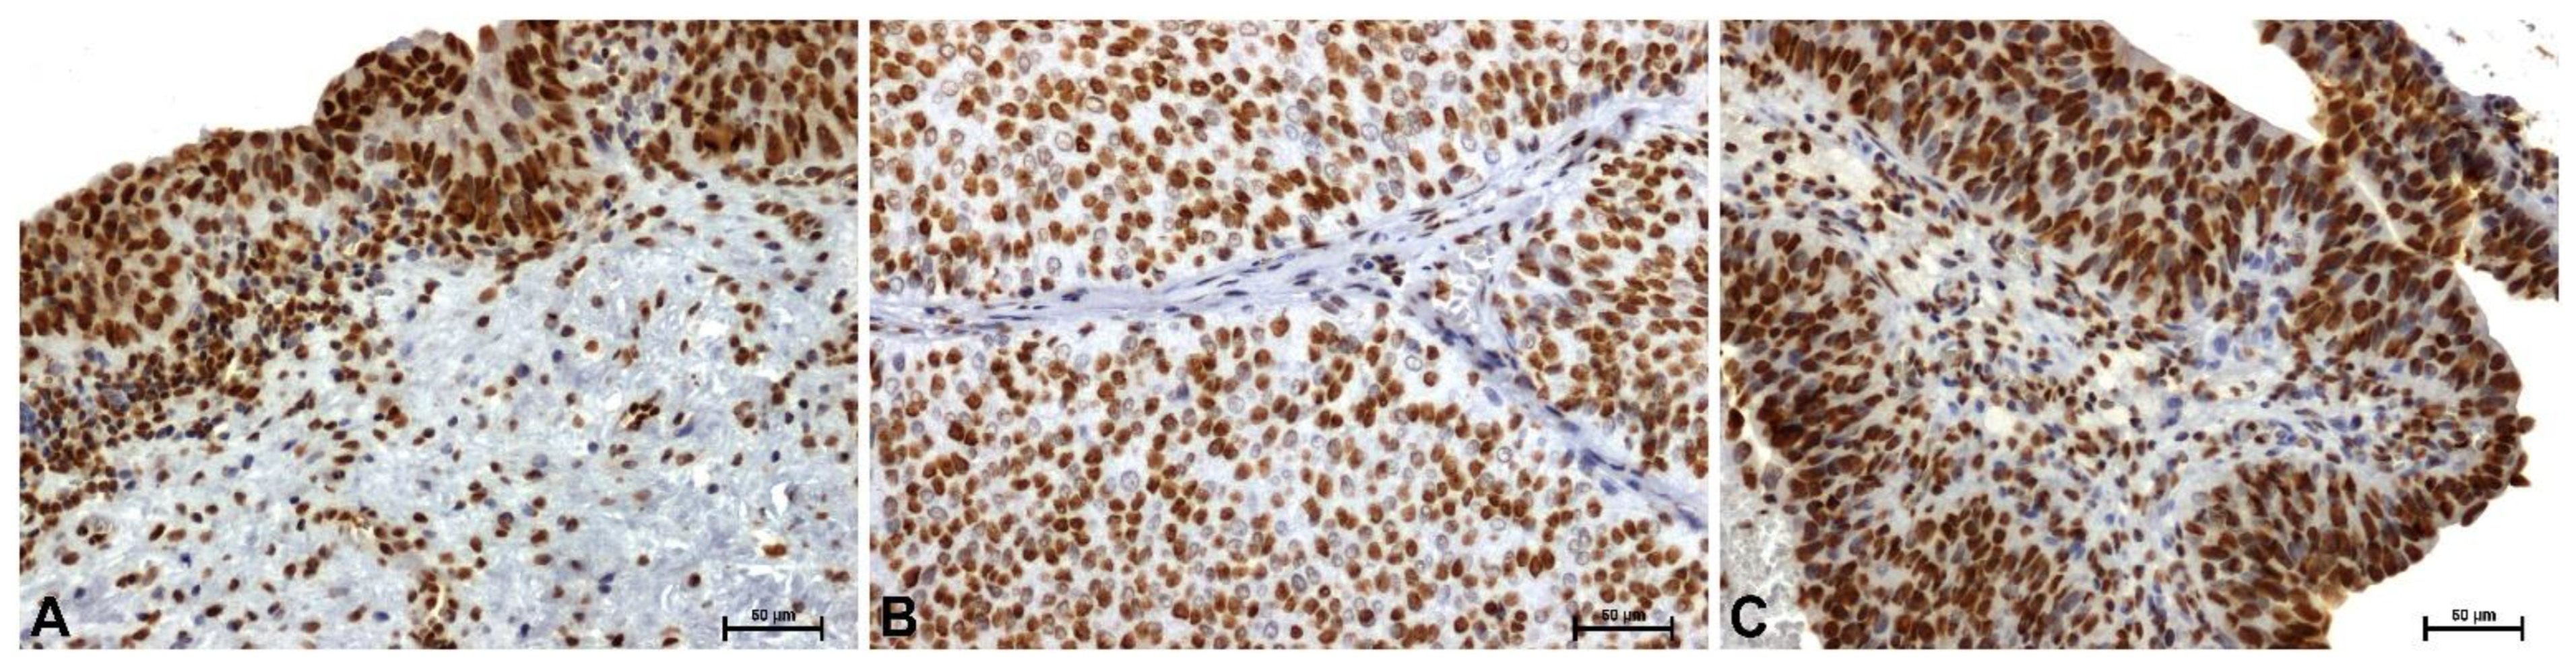
Figure 4.
Expression levels of HMGA1, HMGA2, and HMGB1 genes in control tissue, low-grade, and high-grade papillary urothelial carcinoma, measured by real-time PCR. Data are presented as mean ± SD. Asterisks (*) indicate statistically significant differences (p < 0.05) compared to the control group. Hash symbols (#) indicate statistically significant differences (p < 0.05) between the low-grade and high-grade groups.
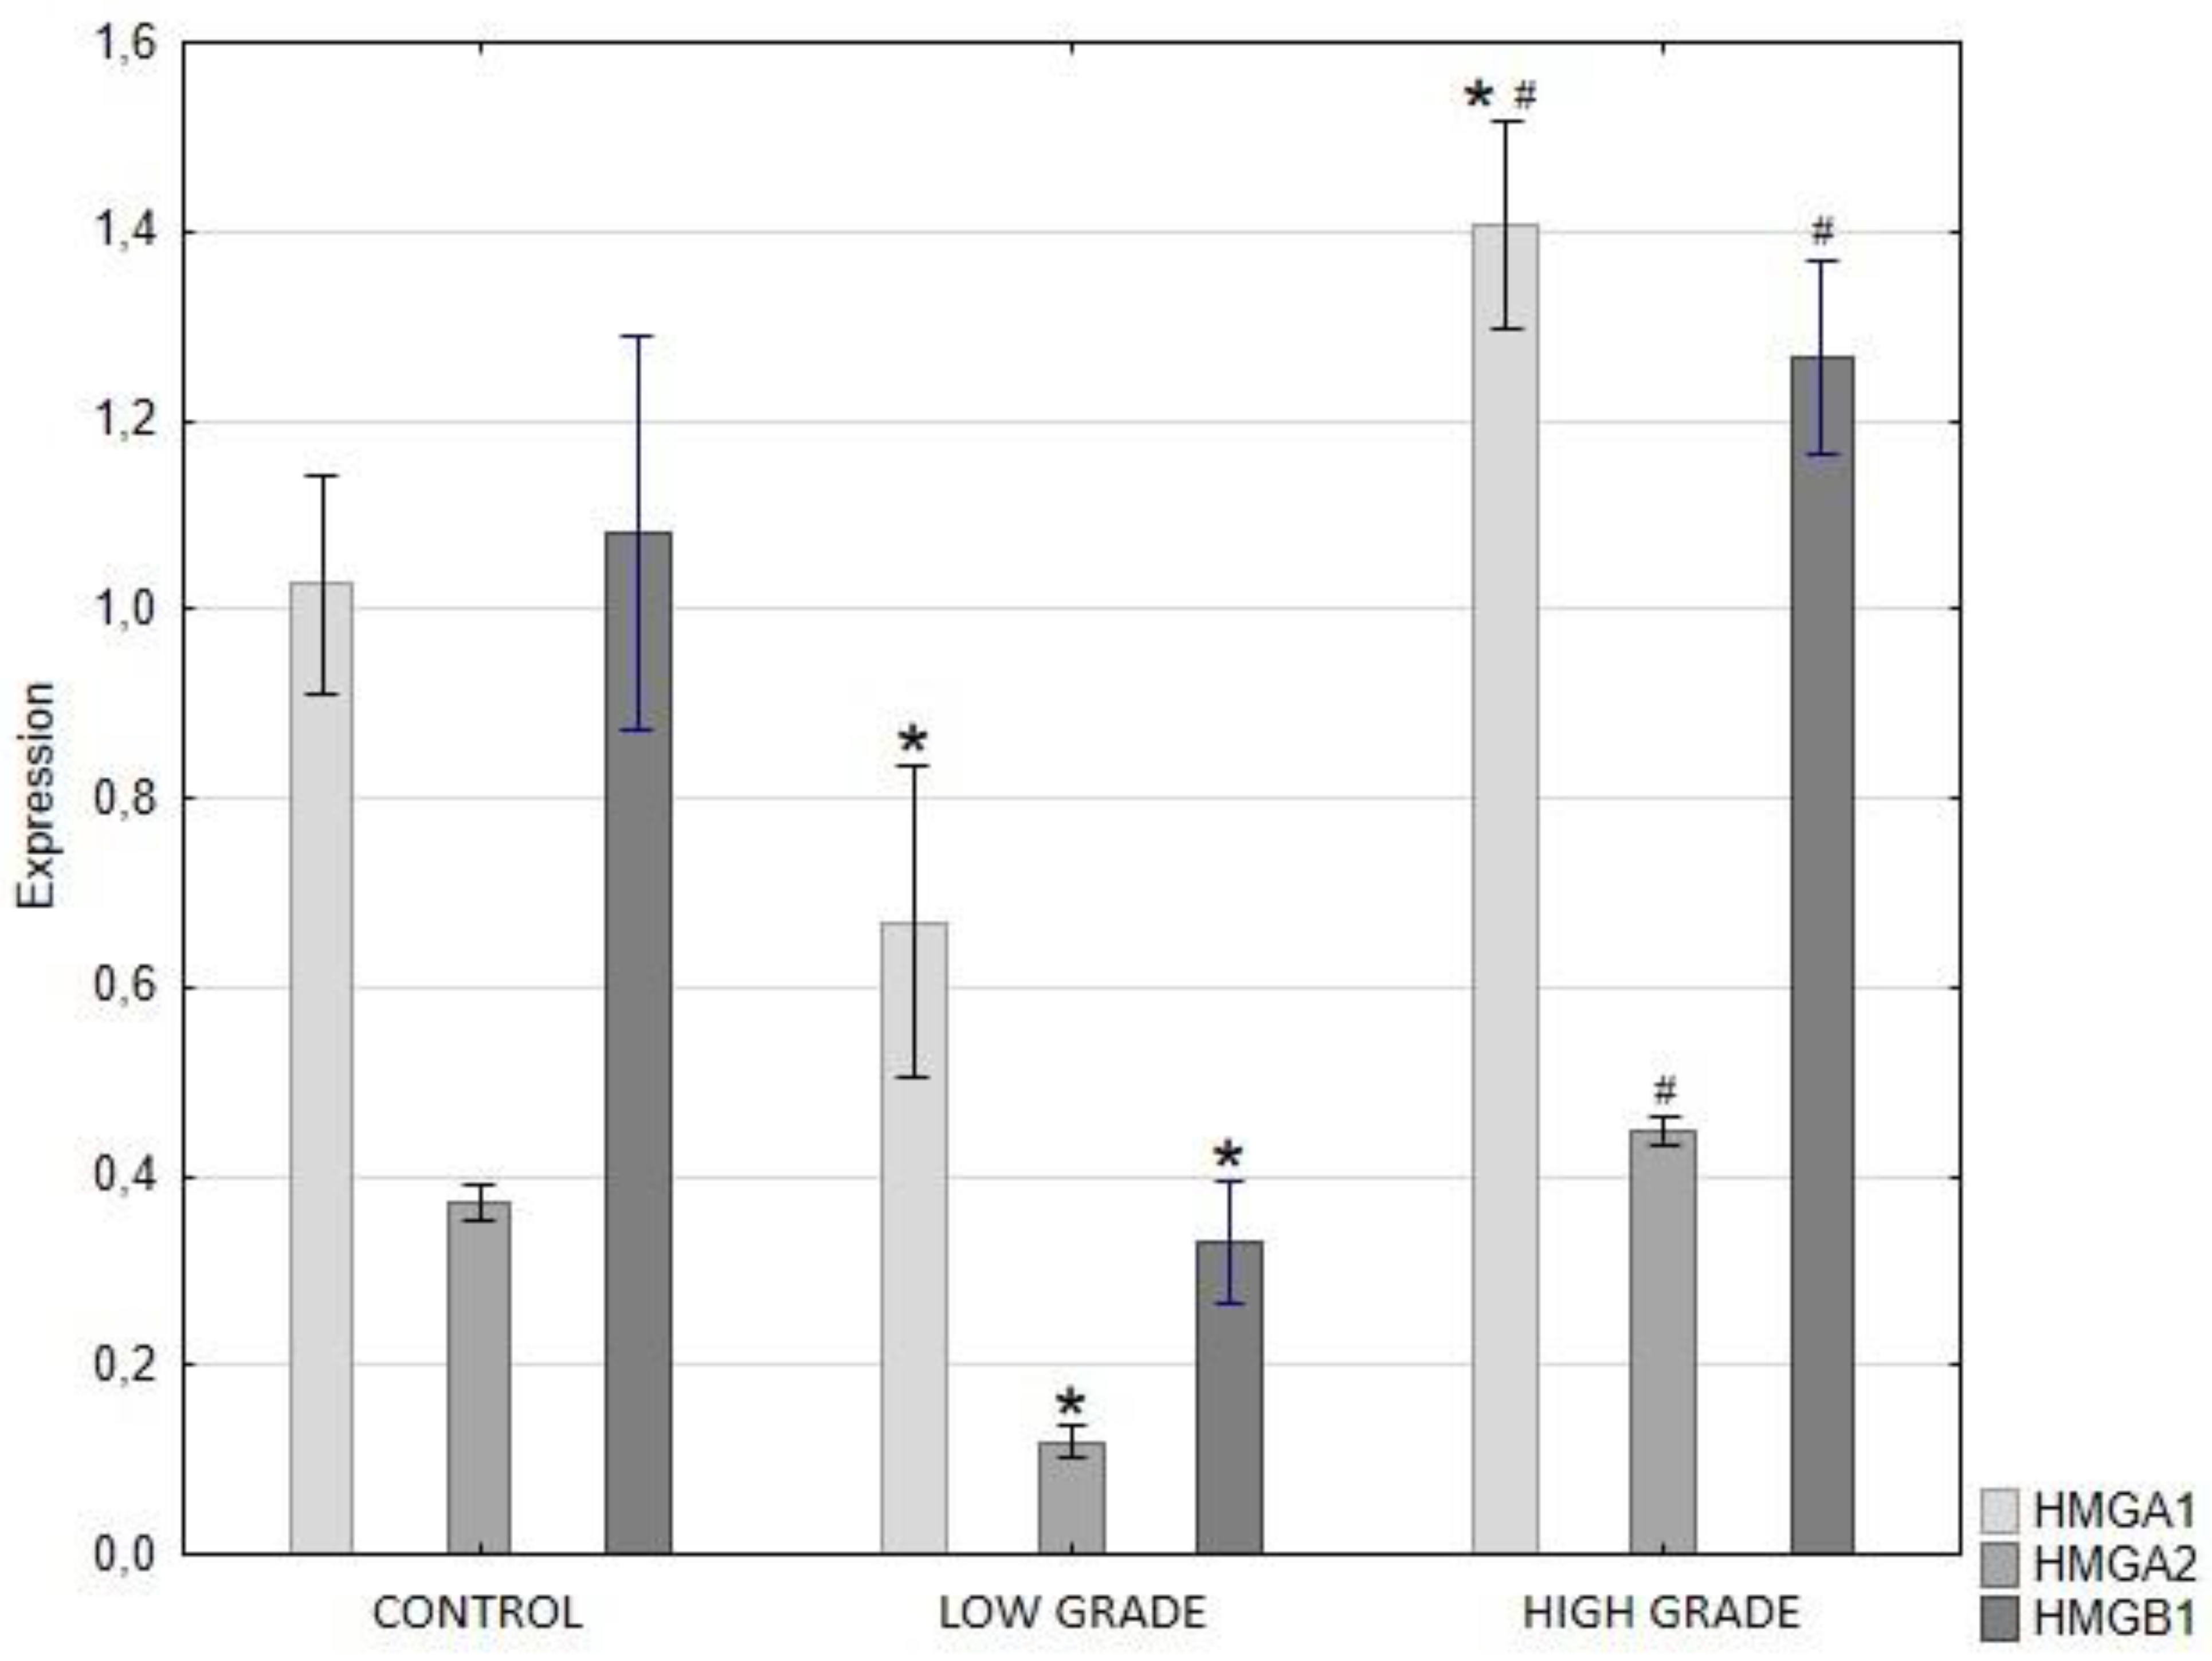
Figure 5.
Individual sample results along the X-axis, with the Y-axis indicating the fluorescence intensity associated with miRNA 106a-5p. Each dot corresponds to the signal detected from a single reaction partition—higher intensities generally suggest a positive signal (indicating likely amplification), whereas lower intensities reflect negative or background noise. B4-B7 – control, B8-B11 – LG, B12-C4 – HG, C5-C6 – NCT.
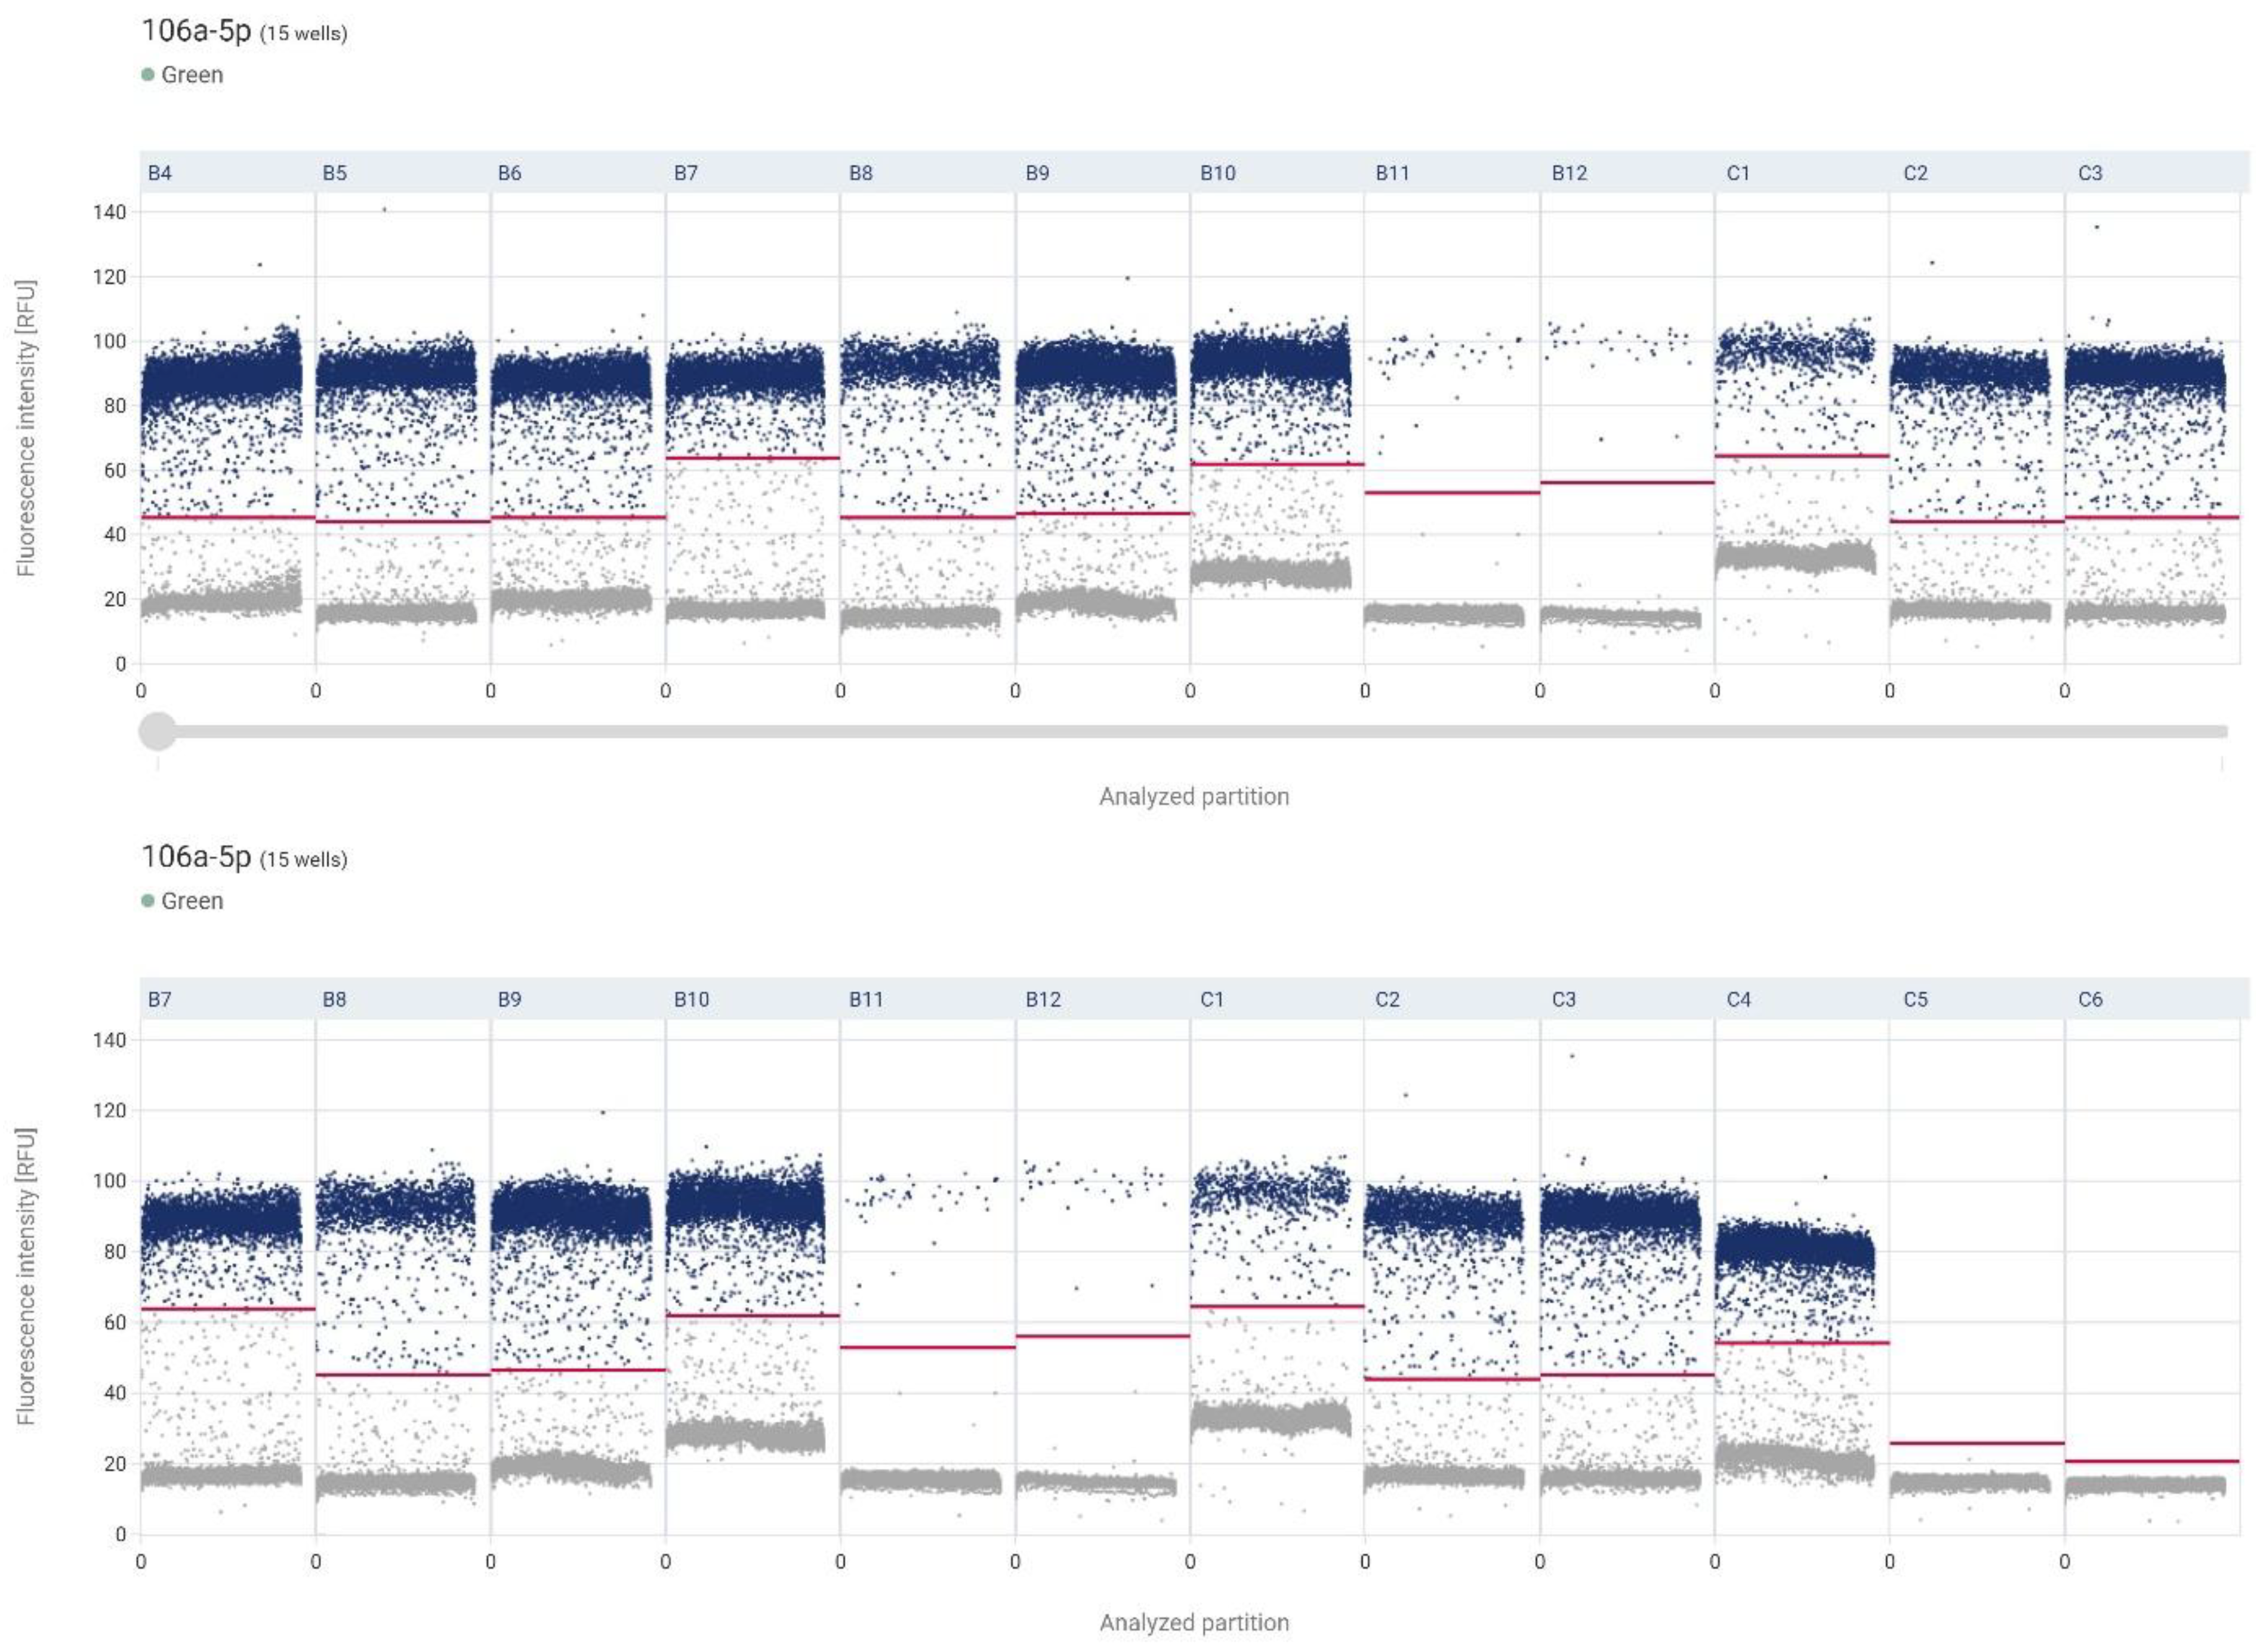

Table 1.
Patient characteristics / bladder cancer.
| Low Grade bladder cancer (non-muscle invasive) |
High Grade bladder cancer (muscle invasive) |
|
|---|---|---|
| Average age | 60.8 | 66,2 |
| ♀ | 26 | 12 |
| ♂ | 14 | 28 |
| Previous treatment > neadjuvant chemotherapy | 0 | 11 |
| Staging | pTaN0M0 – all patients | pT2N0M0 – all patients |
| Average BMI | 27,16 | 29,84 |
| Metastasis | 0 | 0 |
| Arterial hypertension | 10 | 12 |
| Diabetes type 2 | 5 | 4 |
| Atrial fibrilation | 2 | 1 |
| Hyperthyroidism | 2 | 3 |
Table 2.
The intensity of immunoreaction determining HMGA1, HMGA2 and HMGB1 in adjacent normal tissues, low- and high grade papillary urothelial carcinoma.
Table 2.
The intensity of immunoreaction determining HMGA1, HMGA2 and HMGB1 in adjacent normal tissues, low- and high grade papillary urothelial carcinoma.
| Intensity of immunohistochemical reaction in low- and high grade papillary urothelial carcinoma | |||
|---|---|---|---|
| Scale from 0 (white pixel) to 256 (black pixel) | |||
| HMGA1 | HMGA2 | HMGB1 | |
| Adjacent normal tissues |
164,75 137,63– 174,81 |
70,35 36,65– 90,93 |
173,89 159,69– 210,31 |
| Low grade papillary UC |
94,85* 79,17– 106,1 |
42,62 33,42– 58,55 |
102,13* 74,81– 144,99 |
| High grade papillary UC |
198,76**,# 172,34– 226,26 |
88,1**,# 70,05– 113,38 |
206,37**,# 216,33– 228,9 |
Data are shown as a median and minimum and maximum values for HMGA1, HMGA2 and HMGB1 in adjacent normal tissues, low- and high grade papillary urothelial carcinoma. * p < 0.05— low grade UC vs. adjacent normal tissues. ** p < 0.05— high grade UC vs. adjacent normal tissues. # p < 0.05— high grade UC vs. low grade UC.
Table 3.
Correlation analysis of HMGA1, HMGA2 and HMGB1 in control tissue and urothelial papillary carcinoma.
Table 3.
Correlation analysis of HMGA1, HMGA2 and HMGB1 in control tissue and urothelial papillary carcinoma.
| Urothelial papillary carcinoma | |||
|---|---|---|---|
| HMGA1 | HMGA2 | HMGB1 | |
| - | β = + 0.829 p = 0.00000* r2 = 0.6082 |
β = + 1.3719 p = 0.0000* r2 = 0.8159 |
HMGA1 |
| - | β = + 1.2783 p = 0.0000* r2 = 0.8003 |
HMGA2 | |
| - | HMGB1 | ||
Data shown as β coefficient, r2 and statistical significance, where * p < 0.05.
Disclaimer/Publisher’s Note: The statements, opinions and data contained in all publications are solely those of the individual author(s) and contributor(s) and not of MDPI and/or the editor(s). MDPI and/or the editor(s) disclaim responsibility for any injury to people or property resulting from any ideas, methods, instructions or products referred to in the content. |
© 2026 by the authors. Licensee MDPI, Basel, Switzerland. This article is an open access article distributed under the terms and conditions of the Creative Commons Attribution (CC BY) license (http://creativecommons.org/licenses/by/4.0/).
Copyright: This open access article is published under a Creative Commons CC BY 4.0 license, which permit the free download, distribution, and reuse, provided that the author and preprint are cited in any reuse.


