
Submitted:
23 January 2026
Posted:
23 January 2026
You are already at the latest version
Abstract
As a renewable energy source, solar energy holds significant potential for addressing future energy and environmental challenges. Concurrently, hydrogen (H2), as a clean and renewable energy carrier, has garnered substantial attention. Photoelectrocatalytic water splitting to produce H2 represents an emerging green technology for converting solar energy into hydrogen energy, which has been highly valued by researchers. The key to advancing this technology lies in identifying photoelectrode materials with high catalytic activity and stability. In this study, dendritic α-Fe was synthesized via electrodeposition, and the photoelectrocatalytic performance of α-Fe2O3@Fe was enhanced through partial oxidation. This approach effectively addressed the issue of the short carrier transport distance in α-Fe2O3. Specifically, dendritic α-Fe2O3 was partially oxidized after annealing at 300°C for 6 h. The resulting partially oxidized α-Fe2O3@Fe exhibited a photocurrent that was 2.23 times higher than that of the fully oxidized counterpart. The influence of deposition potential on the photoelectrocatalytic performance was systematically explored, and an optimal deposition potential was identified. Additionally, surface modification with Pt was employed to further improve the photocatalytic performance of α-Fe2O3. After continuous operation for 2 h, the photocurrent of the surface-modified sample decreased by only 6.5%, indicating a substantial enhancement in stability.
Keywords:
photoelectrocatalytic water splitting
; dendritic structure
; partially oxidation
; photoelectrochemical performance
1. Introduction
Worldwide energy consumption is still dominated by fossil fuels, which emit significant volumes of carbon dioxide, thereby contributing to global warming and climate change. The rise of the international economy is increasing the energy consumption. Therefore, the quest for clean and renewable energy is an important concern for human beings nowadays, which is of enormous relevance for the sustainable development of civilization[1]. Hydrogen (H2) energy is one of the most promising alternatives to fossil fuels, which not only decreases a country's dependency on fossil fuels but also considerably reduces pollution of the environment. Solar energy, being a clean and sustainable form of energy, offers significant promise for alleviating future energy challenges and environmental difficulties. The effective development of solar energy can provide sufficient energy for mankind to meet the growing global energy demand[2]. In recent years, how to efficiently convert and utilize solar energy has attracted much attention and high priority. Among the various ways of solar energy conversion, the water splitting by solar energy-driven photoelectrochemical (PEC) reaction is an effective approach to produce clean and sustainable H2 energy. Therefore, PEC technology is a potential technology to fulfill the world’s energy demand and minimize greenhouse gas emissions[3,4].
In 1972, Fujishima and Honda first reported the application of titanium dioxide (TiO2) as a photoanode in PEC water splitting under UV light illumination[5]. However, TiO2 possesses a large band gap of 3.0 eV, which restricts its utilization of solar energy to only 4% of the UV light component. Consequently, it is unable to efficiently harness solar energy for water splitting. Since then, there have been continuous efforts to develop suitable materials for fabricating photoelectrodes with both excellent and stable performance. Among the most extensively studied semiconductor photocatalysts are α-Fe2O3[6,7], ZnO[8], WO3[9,10,11], BiVO4[12], and metal-organic frameworks[13,14]. The synergistic combinations of these materials have been thoroughly investigated to enhance the efficiency of PEC water splitting. Despite these efforts, no single efficient and cost-effective semiconductor material has yet been identified that can fulfill all the necessary criteria for PEC-driven water splitting. An ideal semiconductor photoelectrode must meet several key requirements: efficient light absorption, an appropriate band gap energy, effective charge transfer, low overpotential, and superior stability.
α-Fe2O3, with a suitable band gap of 1.9–2.2 eV, can absorb up to 40% of incident sunlight, and its theoretical solar energy conversion efficiency during PEC water splitting is approximately 15.6%[6]. This suggests significant potential for converting water into hydrogen and oxygen. Moreover, α-Fe2O3 exhibits several advantageous properties, including stability in alkaline solutions, low cost, ease of availability, and environmental benignity, making it a promising candidate for PEC anode materials. However, α-Fe2O3 also has notable limitations[15,16,17]: (i) relatively low absorption coefficients, necessitating a light absorption depth of 400–500 nm to complete achieve light absorption; (ii) rapid recombination of photogenerated holes within approximately 10−12 s, with a minority carrier diffusion length of only 2–4 nm; and (iii) poor electrical conductivity of the charge carriers in α-Fe2O3 (about 10−2 cm−2 V−1 s−1). These drawbacks collectively result in a higher rate of charge carrier recombination in α-Fe2O3, which hampers the charge transfer process and ultimately leads to inferior PEC water splitting performance. Currently, significant efforts are being devoted to enhancing the performance of α-Fe2O3 photoanodes through various strategies, including morphology modulation, doping, heterojunction construction, and surface modification. For instance, Zhu et al.[18] synthesized MoOx/Fe2O3 composite photoanodes using a solvent-thermal method, with MoOx serving as a surface passivation layer. This composite achieved a photocurrent density of 3.3 mA cm−2. Wu et al.[19] designed a novel photoanode by loading Co single atoms onto g-C3N4 and forming a heterostructure with α-Fe2O3, resulting in a photocurrent density of 1.93 mA cm−2, which was 3.22 times higher than that of pristine α-Fe2O3. Zhang et al.[20] deposited FeOOH, a co-catalyst, on the surface of α-Fe2O3 to reduce the hole transport distance, thereby increasing the photoanode's photocurrent density by 86% compared to the undeposited surface. Xia et al.[21] prepared Zn/P co-doped α-Fe2O3 microconical thin film photoanodes via chemical vapor deposition. The Zn/P co-doping enhanced the charge carrier concentration in α-Fe2O3, promoting the transfer of bulk and surface carriers and subsequently improving the photocurrent density.
The photocurrent values of bare α-Fe2O3 particle films, particularly those with large dimensions such as dendritic films,[16,17] are typically very low. This is attributed to the significant resistance encountered during the transfer of charge carriers within these films. Therefore, enhancing the electrical conductivity of α-Fe2O3 can be a promising strategy to improve its PEC performance. In this study, the photoelectrochemical water splitting performance of dendritic α-Fe2O3 was significantly enhanced through partial oxidation. Specifically, the photocurrent density of dendritic α-Fe2O3@Fe, obtained via partial oxidation, was 2.23 times higher than that of dendritic α-Fe2O3 obtained through complete oxidation, as measured at 0.55 V vs. Ag/AgCl. This result demonstrates the feasibility of improving the PEC performance of dendritic α-Fe2O3 through partial oxidation. Furthermore, surface modification with Pt was employed in this study to further investigate the potential for enhancing the stability of α-Fe2O3.
2. Materials and Methods
Materials and Chemicals. Sodium sulfate (Na2SO4, 99%, Aladdin Reagent Inc, Shanghai, China), ferrous sulfate heptahydrate (FeSO4∙7H2O, analytically pure, Sinopharm Group Chemical Reagent Co., Ltd., Shanghai, China), sulfuric acid (H2SO4, analytically pure, Luoyang Chemical Reagent Factory, Luoyang, China), potassium hydroxide (KOH, / 82.0%, Tianjin Huadong Reagent Factory, Tianjin, China), chloroplatinic acid (H2PtCl6, 99.0%, Shanghai Conto Chemical Co., Shanghai, China), and ethanol (CH3CH2OH, / 99.7%, Guangdong Fine Chemicals, Guangdong, China) were used without further purification. All aqueous solutions were prepared with deionized water. The commercial indium-doped tin oxide coated glass (ITO, thickness 1.1 mm, resistance < 6 Ω, South China Xiang Science & Technology Co., Ltd., Yiyang, China) was cleaned with deionized water and ethanol in a sonication bath (Xiaomei Ultrasonic Instruments, XM-P102H, Kunshan, China) each for 10 min and dried by N2 flowing for using.
Preparation of deposition solution. An analytical balance was employed to precisely measure 1.4204 g of Na2SO4 and 1.3901 g of FeSO4·7H2O, which were subsequently introduced into a 100 mL beaker. To facilitate dissolution, 50 mL of deionized water was added to the beaker. The mixture was then subjected to continuous stirring at a rate of 500 rpm on a magnetic stirrer for a duration of 30 minutes to ensure complete dissolution of the solid components. The resulting solution was carefully transferred to a 100 mL volumetric flask and made up to the mark. The pH of the solution was meticulously adjusted to 2.5 using a 0.5 M of H2SO4 aqueous solution. This procedure yielded a deposition solution with a concentration of 0.05 M FeSO4 and 0.1 M Na2SO4 with a pH of 2.5.
Preparation of the dendritic Fe, α-Fe2O3, α-Fe2O3@Fe, and Pt-α-Fe2O3@Fe films. The electrochemical deposition was carried out in a conventional three-electrode cell system using a potentiostat CHI660e (CH Instruments, Inc., Shanghai, China). The commercial indium-doped tin oxide coated glass (ITO, 25 × 10 × 1.1 mm, resistance ≤ 6 Ω/cm2, South China Science & Technology Company Limited, Shenzhen, China) was used as working electrode. The ITO substrate was dipped into the deposition solution vertically and the deposition area was 1.0 cm2 (1 cm × 1 cm, the deposition area was fixed by tape). A platinum sheet and Ag/AgCl in saturated KCl electrode were used as counter and reference electrodes, respectively. All potentials in this work measured versus Ag/AgCl electrode. All the electrodeposition experiments were carried out at room temperature (24 ℃) without stirring or any external gas bubbling. The dendritic Fe films were deposited on ITO substrates in 5 mL deposition solution at −1.4 V vs Ag/AgCl for 300 s. The dendritic α-Fe2O3 films were obtained by annealing the Fe films under air at 500 ℃ for 2 h (heating speed 5 ℃/min) in the box furnace. The partially oxidized dendritic Fe films were obtained by controlling the calcination temperature at 300 ℃ for different time and the obtained partially oxidized Fe film was named as α-Fe2O3@Fe. For the preparation of Pt-α-Fe2O3@Fe films, the α-Fe2O3@Fe film was immerged in 1 mM H2PtCl6 for different times.
Photoelectrochemical measurements. The three-electrode PEC water-splitting device was employed to test the performance of PEC water splitting. Specifically, the electrolytic cell was a 5 cm × 5 cm × 5 cm quartz cell, with α-Fe2O3/ITO was the working electrode, the platinum sheet served as the counter electrode, and Ag/AgCl was the reference electrode, and the electrolyte solution was 40 mL of 1.0 M KOH solution. A xenon lamp (model CEL-CEL-PE-300L-3A) was employed as the light source, providing a light intensity of 1 sun (AM 1.5, 100 mW/cm2). The light intensity of the solar simulator (1 sun) was quantified using an irradiance meter. Current-voltage (I-V) curves were recorded using linear scanning voltammetry (LSV) with a scan rate of 0.01 V/s and a voltage range of −0.2 to 0.6 V. The I-V curves were obtained under dark, illuminated, and chopped light conditions (with an on/off cycle of 1 s). To investigate the photocurrent stability and response, i-t curves were recorded using chronoamperometry to generate the photoresponse profiles of the samples. The samples were evaluated at a potential of 0.55 V and a light frequency of 0.05 Hz (with a 20 s light-on/off cycle). The scan rate was 0.05 V/s, and the scan duration was 200 s.
Characterization. The crystallinity and crystal structure of the samples were characterized by X-ray diffraction (XRD, Bruker D8 Advance, Karlsruhe, Germany) using a Cu Kα source. The morphologies and elemental composition of the samples were analyzed using a scanning electron microscope (SEM, ZEISS Sigma 300, Jena, Germany). X-ray photoelectron spectroscopy (XPS, Thermo ESCALAB 250XI, Carlsbad, CA, USA) was performed using Al Kα radiation.
3. Results
3.1. Synthesis Principle of α-Fe₂O₃@Fe
The applied potential and the pH of the deposition solution are identified as critical factors influencing the properties of the final product. During the electrodeposition process in the three-electrode system as shown in Figure 1a, two competing reactions occur on the surface of the working electrode as the following Equation (1) and (2),
Hydrogen evolution: 2H+ + 2e− → H₂
Iron reduction: Fe2+ + 2e− → Fe
Depending on the experimental conditions, either reaction can dominate the deposition process. According to previous work[22], the optimum pH for this reaction is 2.47, so in this experiment, the pH of the deposition solution was controlled to be around 2.5, the composition of the deposition solution was 0.1 M Na2SO4 and 0.05 M FeSO4, and different external potentials were applied to investigate the effect of different potentials on electrodeposition.
3.2. Systematic Performance Testing and Characterization of Target Materials
In an initial exploratory study, we selected deposition potentials of −1.3 V, −1.4 V, and−1.5 V to identify the optimal condition for electrodeposition. By monitoring the deposition process and examining the surface morphology of the deposited products (as shown in Figure 1b, we observed the following trends: When the deposition potential was set at −1.3 V, the deposition rate was relatively slow. Upon completion of the deposition, only a thin, silver-colored layer of Fe was observed on the surface of the ITO glass. The amount of deposited Fe, as assessed visually, appeared insufficient, indicating that a higher deposition potential would be necessary. In contrast, when the deposition potential was increased to −1.4 V, the deposition rate accelerated significantly. After deposition, a uniform and dense Fe film was formed on the ITO glass surface. This film exhibited good adhesion, with no visible flaking. Visually, the Fe film appeared black, suggesting a more substantial deposition as the previous work[16]. When the deposition potential was set at −1.5 V, the deposition rate was further increased. However, after the formation of a uniform Fe film on the ITO surface, the film began to warp and gradually flake off as the deposition continued. By the end of the deposition, the Fe film on the ITO glass surface was non-uniform. Considering the above observations, it was concluded that −1.4 V is the optimal deposition potential for our experimental setup. This potential not only ensures a suitable deposition rate but also yields a more uniform and adherent Fe film. Therefore, −1.4 V was selected as the deposition potential for all subsequent experiments.
SEM images of the samples (Figure 2a,b) reveal that those deposited for 300 seconds exhibit a three-dimensional (3D) dendritic structure. This morphology significantly enhances the specific surface area of the material, thereby providing a greater number of active sites and facilitating the PEC water-splitting reaction. Comparison of the dendritic structures before and after annealing (Figure 2c,d) indicates minimal changes, confirming the feasibility of employing a deposition-annealing sequence to prepare dendritic α-Fe2O3. As shown in Figure 2c, flocculent structures are observed at the base of the dendrites. These structures arise from the simultaneous hydrogen evolution reaction occurring during the deposition of dendritic Fe on the working electrode surface. This reaction generates OH- ions around the electrode, which subsequently react with Fe2+ in the deposition solution to form flocculent Fe(OH)2 precipitates. A comparison of Figure 2e,f and 2g,h highlights that the dendrites of samples treated with H2PtCl6 become coarser and exhibit spherical particles on their surfaces. These particles are identified as platinum nanoparticles attached to the α-Fe2O3 surface, indicating successful surface modification. Furthermore, the energy dispersive spectrometer (EDS) analysis of the Pt-α-Fe2O3@Fe sample demonstrates that Fe, O, and Pt elements coexist and are uniformly distributed in Pt-α-Fe2O3 (Figure 3b–e). This result indicates that Pt has been uniformly dispersed on the surface of α-Fe2O3@Fe. In the element content diagram of the sample (Figure 3a), the content of Pt is 0.15 wt%. The relatively low Pt content is due to the short immersion time of α-Fe2O3@Fe in the H2PtCl6 solution. However, this outcome still successfully confirms that Pt has been loaded onto the surface of α-Fe2O3@Fe.
The obtained samples were subjected to XRD analysis to elucidate their crystalline phases as shown in Figure 4. The XRD peaks of Fe film were indexed with the JCPDS No. 87-0722. The intensity of the Fe peaks decreased significantly after annealing, with only a weak peak remaining at an annealing time of 1 h. As the annealing time increased further, the Fe peaks disappeared entirely, while the α-Fe2O3 peaks emerged. This transformation may be attributed to the formation of amorphous iron oxide, which is undetectable by XRD due to its lack of long-range crystalline order. The crystal structure of α-Fe2O3 obtained after annealing at 500°C for 2 h matches the standard card of α-Fe2O3 (JCPDS No.89-8104) with the following unit cell parameters: a = b = 5.023 Å, c = 13.078 Å, and α = β = 90°, γ = 120°. The 2θ values of 33.25° and 54.23° correspond to the (104) and (116) diffraction peaks, respectively. From the XRD patterns, it is evident that with increasing annealing time, the (104) peak initially intensified and then weakened, remaining at a relatively low intensity, while the (116) peak gradually strengthened but also remained at a lower intensity. This behavior may be due to the compositional changes induced by annealing, which likely rendered the material less crystalline. Consequently, the detected α-Fe2O3 peaks were weaker, reflecting the reduced crystallinity of the material.
During the deposition process, the pH near the working electrode increases, causing Fe2+ to react with OH-, resulting in the precipitation of Fe(OH)2. Consequently, Fe2+ remains present in the sample. Peak I in Figure 5a corresponds to the characteristic peak of Fe2+, with binding energies of Fe 2p3/2 at 710.6 eV and Fe 2p1/2 at 723.7 eV. Peak II represents the characteristic peak of Fe3+, indicating that oxidation has occurred on the sample surface, forming α-Fe2O3. The binding energies of Fe 2p3/2 and Fe 2p1/2 are 711.5 eV and 725.1 eV, respectively. Additionally, peak III corresponds to the characteristic peak of FeOOH, with binding energies of Fe 2p3/2 at 713.2 eV and Fe 2p1/2 at 726.7 eV. This matches the data reported by Zhang et al.[23] which suggests that FeOOH was generated during the deposition of the sample. Similarly, peaks I, II, and III in Figure5c,e correspond to the chemical states of Fe2+, Fe3+, and FeOOH, respectively. In Figure 5a,c,e, no singlet Fe peaks were observed in the XPS spectra of the partially oxidized samples; however, weak Fe peaks were detected in the XRD plots. This is due to the shallow probing depth of XPS, which only measures surface elements, whereas XRD, with a greater probing depth, reveals that the surface of the samples is oxidized to α-Fe2O3, while a small amount of Fe remains in the interior. Therefore, it can be suggested that the α-Fe2O3/Fe structure obtained after annealing may be a core-shell structure, as shown in Figure 5. In Figure 5b,d,f are the XPS spectra of O 1s. The XPS spectra of O 1s consist of two peaks: Peak I corresponds to the lattice oxygen of α-Fe2O3, and Peak II may originate from FeOOH or -OH groups adsorbed on the sample surface. Additionally, comparison of these three spectra reveals that the proportion of Peak I in the O 1s spectra gradually increases with the degree of oxidation. Similarly, comparison of Figure 5a,c, and 5e shows that the proportion of Fe3+ peaks increases as the degree of oxidation deepens. This suggests that the α-Fe2O3 content in the samples increases with prolonged annealing time. The peak of Pt could not be observed in the full spectrum of the sample Pt-α-Fe2O3@Fe/ITO, which is due to the small amount of Fe remaining in the sample after partial oxidation, and therefore the sample contains less Pt after H2PtCl6 immersion. Peak I in Figure 6 corresponds to the characteristic peak of Pt0, indicating that Fe displaced Pt monomers during the modification process, with binding energies of Pt 4f7/2 at 71.5 eV and Pt 4f5/2 at 74.7 eV. Peak II corresponds to the characteristic peak of Pt2+, attributed to the partial reduction of Pt4+ to Pt2+ during the immersion process. The binding energies of Pt 4f7/2 and Pt 4f5/2 are 73.6 eV and 75.7 eV, respectively. This is the same as that found by Aricò et al[24].
The same sample was used to determine the optimal oxidative annealing time. The sample was annealed at 300 °C for 1 h in a muffle furnace, then immediately removed and cooled to room temperature for PEC performance testing. Following the test, the samples were cleaned with deionized water and ethanol, and then again annealed in a muffle furnace at 300 °C for 1 h. These steps were repeated until the optimal oxidative annealing time was determined. After identifying the optimal annealing time, the samples were annealed at 500 °C for 2 h in a muffle furnace to achieve complete oxidation. The samples were then cooled to room temperature in the furnace, and then the PEC performance test was carried out to compare the improvement of the sample performance.Figure 7 illustrates the photoresponse current curves of the samples under varying annealing times. It indicates that the photoresponse current of the samples annealed at 300 °C is significantly higher than that of the fully oxidized samples, suggesting that partial oxidation is an effective strategy for improving the PEC performance of the materials. To better understand the relative magnitudes of the photoresponse currents at different annealing times, the currents at 0.55 V were recorded for various annealing durations (Figure 7a). It shows that when the annealing time interval is 1 h, the variation of the photoresponse current of the sample is more obvious, which indicates that it is reasonable to choose 300 °C as the annealing temperature.
Figure 7b shows the trend of the photoresponse current as a function of annealing time, revealing that the photoresponse current of dendritic α-Fe2O3 initially increases and then decreases with extended annealing. From 0 to 1 h, Fe was gradually oxidized to α-Fe2O3, resulting in a gradual increase in the photoresponse current of the sample. As the annealing time increased, the photoresponse current decreased, potentially due to changes in the crystallinity of α-Fe2O3. As the degree of annealing increases, α-Fe2O3 becomes amorphous, leading to an increase in the light response current of the sample. Once the annealing time exceeded a certain threshold, the crystallinity of the sample remained stable. Continuing annealing at this point led to a decrease in Fe content, resulting in reduced sample conductivity and increased e--h+ recombination, which caused the photoresponse current to decline. The changes in the structure of the sample during the annealing process are shown in Figure 8.
The sample achieved a maximum photoresponse current of 281.1 μA cm−2 at an annealing time of 6 h. This is significantly lower than the photocurrent of vertically aligned nanotubes deposited on anodized aluminum oxide (AAO) by Mao et al.[25] via electrodeposition (2.2 mA cm−2). This difference may be attributed to the longer length of the dendritic α-Fe2O3, which does not effectively absorb incident light, and the higher rate of e--h+ recombination.
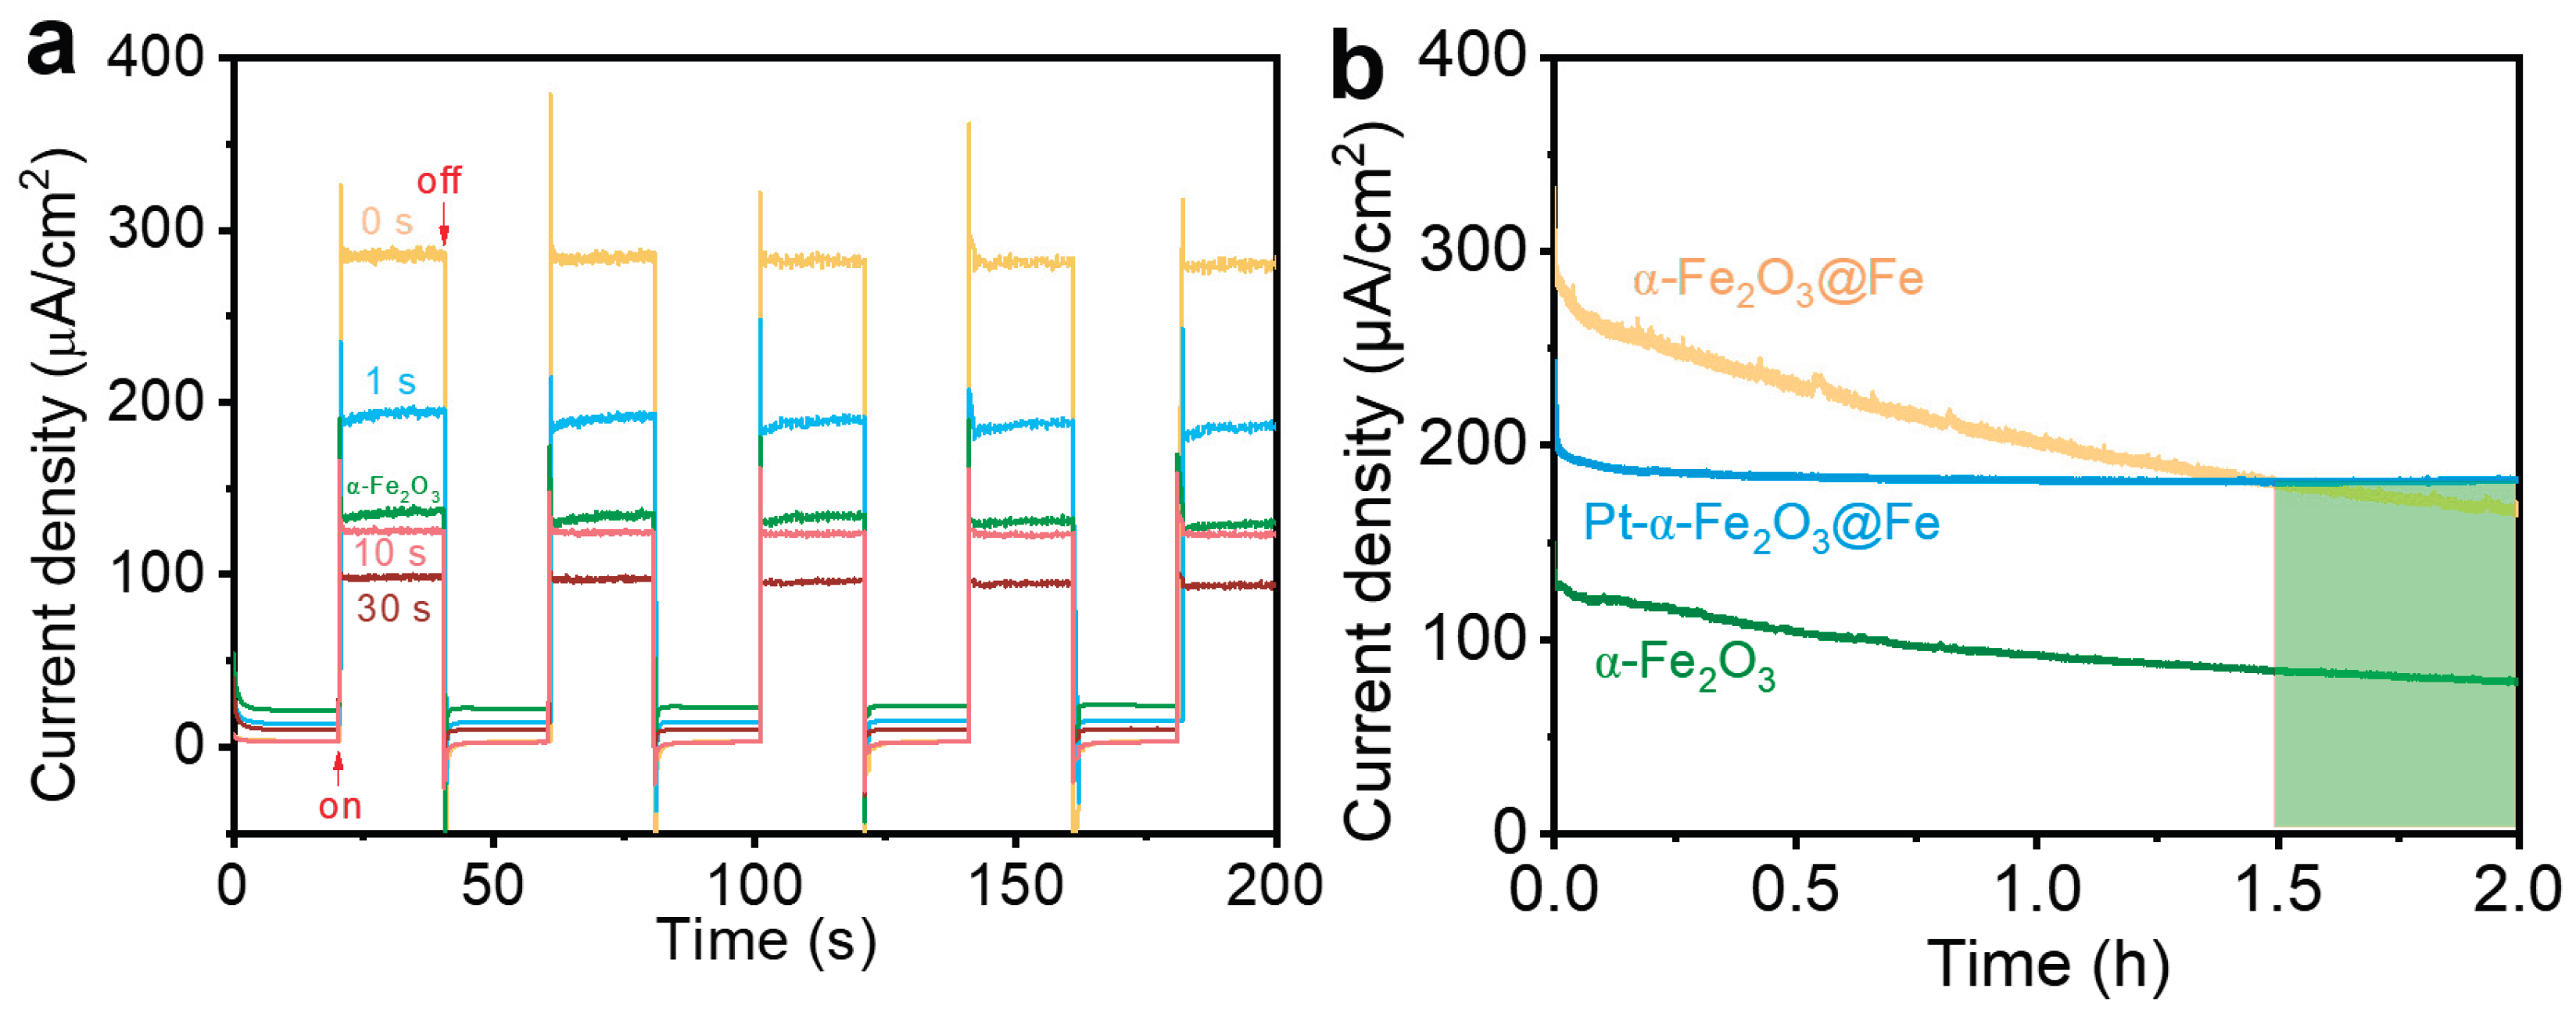
To further enhance the PEC performance of partially oxidized dendritic α-Fe2O3@Fe, we explored modifying the samples with a 1 mM H2PtCl6 solution to displace any Fe potentially present on the material's surface. The samples, annealed at 300 °C for 6 h, were immersed in H2PtCl6, rinsed with deionized water immediately after removal, and then placed in anhydrous ethanol for additional soaking.The same procedure was followed for each immersion to minimize experimental error. Photoresponse current measurements were performed at 0.55 V for the immersed samples. The test results are shown in Figure 9. The photoresponse currents of the samples treated with H2PtCl6 immersion were consistently lower than those of the unimmersed samples, and they gradually decreased with increasing immersion time. However, the photoresponse currents of samples with immersion times of 1 s and 10 s were higher than those of the fully oxidized samples, suggesting that partial oxidation combined with H2PtCl6 immersion can enhance performance.The photoresponse current of the samples gradually decreased with prolonged immersion time, becoming lower than that of the fully oxidized samples after 30 s of immersion. The decrease in the photoresponse current after H2PtCl6 immersion can be attributed to the highly acidic nature of H2PtCl6, with a pH of 1.2 for the 1 mM solution used in the experiments. This acidity may react with Fe and α-Fe2O3, reducing the amount of α-Fe2O3 and thereby decreasing the photoresponse current of the samples. Additionally, as Pt is only adhered to the surface of the sample, it may detach during testing, further affecting the photoresponse current and, consequently, the PEC performance.
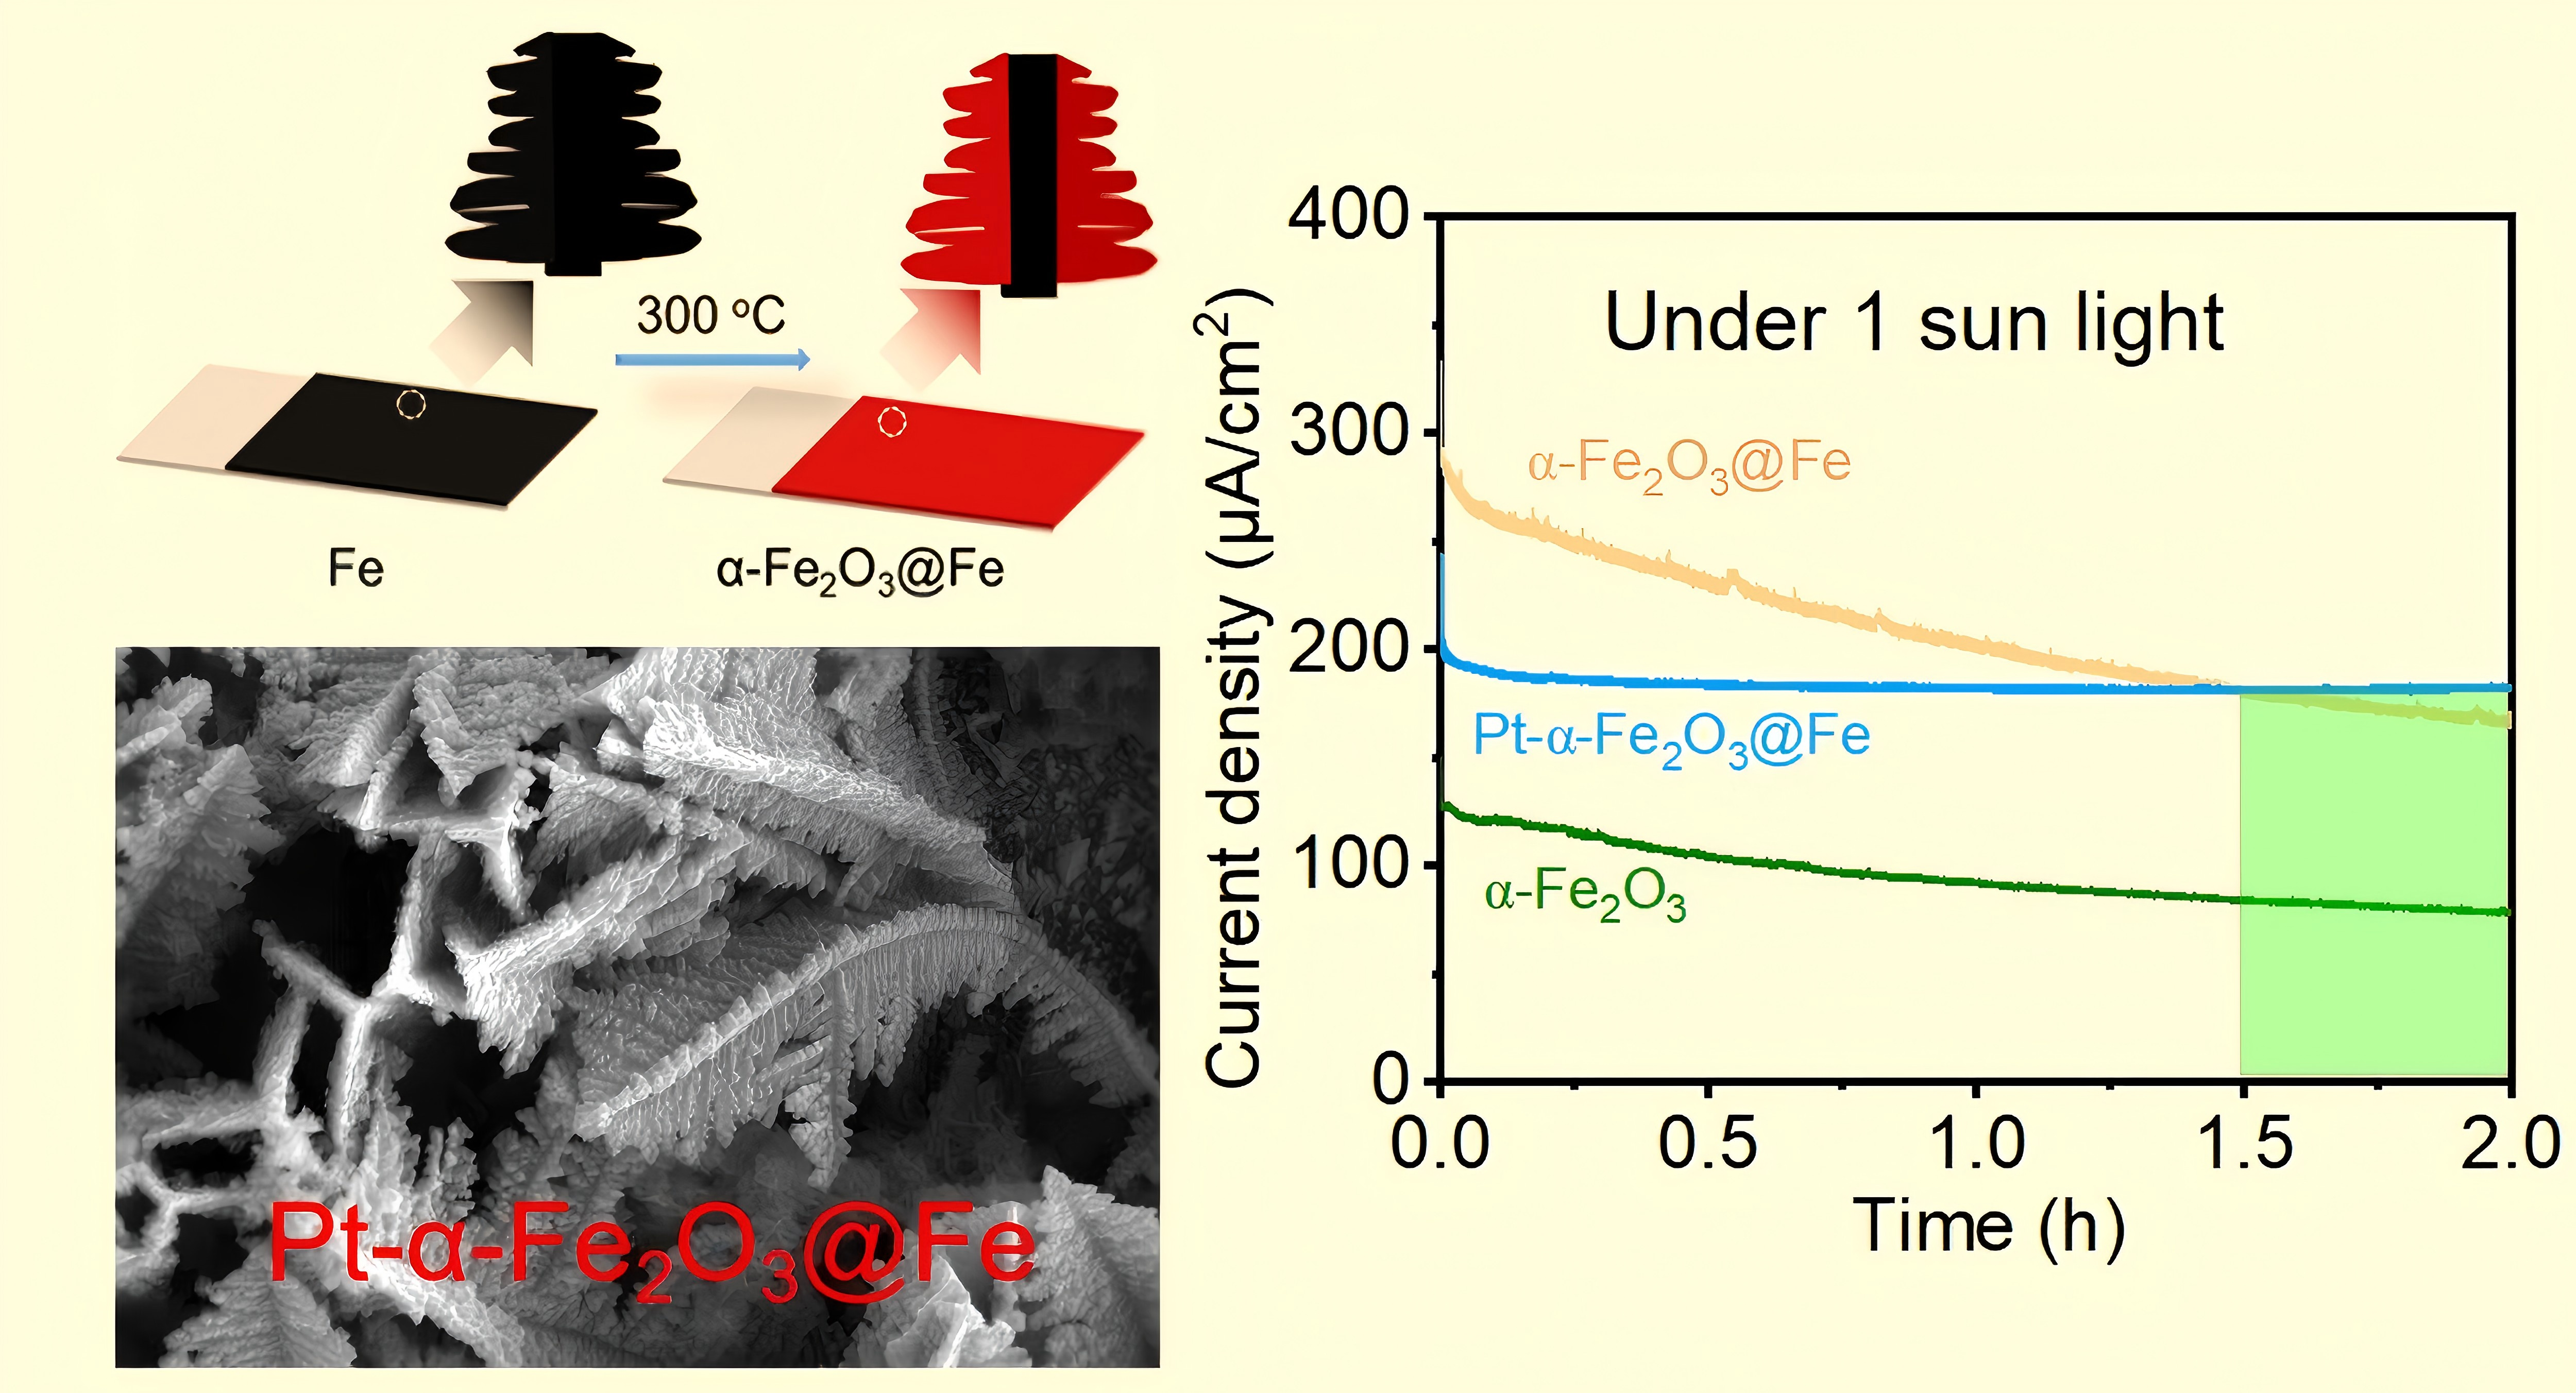
After 2 h of continuous operation, the sample treated with H2PtCl6 exhibited the best stability, while the stability of the partially oxidized and fully oxidized samples was lower. The photoresponse current of the surface-modified samples was higher than that of the fully oxidized samples, and after 1.5 h of continuous operation, the photoresponse current of the surface-modified samples was higher than that of the partially oxidized samples. These results indicate that surface modification with Pt is a feasible approach for improving the samples.
4. Conclusions
In this study, the PEC water splitting performance of dendritic α-Fe2O3 was enhanced through partial oxidation. The photoresponse current of dendritic α-Fe2O3@Fe, obtained through partial oxidation (281.1 μA cm−2), was 2.23 times higher than that of dendritic α-Fe2O3, synthesized through complete oxidation (125.8 μA cm−2), at 0.55 V vs Ag/AgCl. These results demonstrate the feasibility of enhancing the PEC performance of dendritic α-Fe2O3 through partial oxidation. Furthermore, surface modification was employed in this study to enhance the photoresponse current of α-Fe2O3. However, the high acidity of the H2PtCl6 solution used in the experiment degraded the original dendritic α-Fe2O3, leading to a decrease in photoresponse current rather than an increase, thereby reducing the PEC water-splitting performance of α-Fe2O3. Despite this, the photoresponse current of the sample remained higher than that of the fully oxidized sample for shorter immersion times. In future studies, the use of a less acidic potassium chloroplatinate solution will be explored, along with surface modification of α-Fe2O3 using Au, graphene, or other materials. While this study has limitations, it offers valuable insights for the preparation of simple PEC materials and suggests potential avenues for further improvement.
Author Contributions
Conceptualization, Y.Y.(Yingxing Yang), Y.Z. (Yihan Zheng) and J.Z. (Jinyou Zheng); methodology, Y.Y.(Yingxing Yang) and Y.Z. (Yihan Zheng); validation, Y.Y.(Yingxing Yang) and Y.Z. (Yihan Zheng); formal analysis, Y.Y.(Yingxing Yang); Y.Z. (Yihan Zheng) and M.Z. (Mengyao Zhao); investigation, Y.Y.(Yingxing Yang); Y.Z. (Yihan Zheng); and M.Z. (Mengyao Zhao); data curation, Y.Y.(Yingxing Yang) and Y.Z. (Yihan Zheng) and M.Z. (Mengyao Zhao); writing—original draft preparation, Y.Y.(Yingxing Yang) and Y.Z. (Yihan Zheng) and M.Z. (Mengyao Zhao) ; writing—review and editing, X.Y.(Xiaomei Yu), S.L. (Songjie Li) and J.Z. (Jinyou Zheng); visualization, Y.Y.(Yingxing Yang), Y.Z. (Yihan Zheng) and M.Z. (Mengyao Zhao) ; supervision, X.Y.(Xiaomei Yu), S.L. (Songjie Li) and J.Z. (Jinyou Zheng); project administration, X.Y.(Xiaomei Yu), S.L. (Songjie Li) and J.Z. (Jinyou Zheng); funding acquisition, S.L. (Songjie Li) and J.Z. (Jinyou Zheng). All authors have read and agreed to the published version of the manuscript.
Funding
This work was supported by the Training Program for Young Backbone Teachers in Higher Education Institutions of Henan Province (2025GGJS001), the China Postdoctoral Science Foundation (2024M752942), and the Key Scientific Research Projects of Higher Education Institutions in Henan Province (25B530001).
Data Availability Statement
The original contributions presented in this study are included in the article. Further inquiries can be directed to the corresponding author.
Acknowledgments
Thanks eceshi (www.eceshi.com) for the XPS test.
Conflicts of Interest
The authors declare no conflicts of interest.
References
- Megía, P.J.; Vizcaíno, A.J.; Calles, J.A.; Carrero, A. Hydrogen production technologies: from fossil fuels toward renewable sources. A mini review. Energy & Fuels 2021, 35, 16403–16415. [Google Scholar] [CrossRef]
- Walter, M.G.; Warren, E.L.; McKone, J.R.; Boettcher, S.W.; Mi, Q.; Santori, E.A.; Lewis, N.S. Solar water splitting cells. Chemical reviews 2010, 110, 6446–6473. [Google Scholar] [CrossRef] [PubMed]
- Li, S.; Xu, W.; Meng, L.; Tian, W.; Li, L. Recent progress on semiconductor heterojunction-based photoanodes for photoelectrochemical water splitting. Small Science 2022, 2, 2100112. [Google Scholar] [CrossRef]
- Hisatomi, T.; Kubota, J.; Domen, K. Recent advances in semiconductors for photocatalytic and photoelectrochemical water splitting. Chemical Society Reviews 2014, 43, 7520–7535. [Google Scholar] [CrossRef]
- Fujishima, A.; Honda, K. Electrochemical photolysis of water at a semiconductor electrode. nature 1972, 238, 37–38. [Google Scholar] [CrossRef] [PubMed]
- Najaf, Z.; Nguyen, D.L.T.; Chae, S.Y.; Joo, O.-S.; Shah, A.U.H.A.; Vo, D.-V. N.; Nguyen, V.-H.; Van Le, Q.; Rahman, G. Recent trends in development of hematite (α-Fe2O3) as an efficient photoanode for enhancement of photoelectrochemical hydrogen production by solar water splitting. International Journal of Hydrogen Energy 2021, 46, 23334–23357. [Google Scholar] [CrossRef]
- Shuwanto, H.; Abdullah, H.; Kuo, D.-H. Nanostructuring Bi-doped α-Fe2O3 thin-layer photoanode to advance the water oxidation performance. ACS Applied Energy Materials 2022, 5, 9902–9913. [Google Scholar] [CrossRef]
- Abdullah, R.; Jalil, A.; Asmadi, M.; Hassan, N.; Bahari, M.; Alhassan, M.; Izzudin, N.; Sawal, M.; Saravanan, R.; Karimi-Maleh, H. Recent advances in zinc oxide-based photoanodes for photoelectrochemical water splitting. International Journal of Hydrogen Energy 2025, 107, 183–207. [Google Scholar] [CrossRef]
- Zheng, J.Y.; Pawar, A.U.; Kim, C.W.; Kim, Y.J.; Kang, Y.S. Highly enhancing photoelectrochemical performance of facilely-fabricated Bi-induced (002)-oriented WO3 film with intermittent short-time negative polarization. Applied Catalysis B: Environmental 2018, 233, 88–98. [Google Scholar] [CrossRef]
- Yang, H.; Li, S.; Yu, S.; Yu, X.; Zhao, H.; Wang, C.; Ping, D.; Zheng, J.Y. Strategies for enhancing the stability of WO3 photoanodes for water splitting: A review. Chemical Engineering Science 2025, 302, 120894. [Google Scholar] [CrossRef]
- Yu, S.; Yu, X.; Yang, H.; Li, F.; Li, S.; Kang, Y.S.; Zheng, J.Y. Mechanism, modification and stability of tungsten oxide-based electrocatalysts for water splitting: A review. Journal of Energy Chemistry 2024, 99, 23–49. [Google Scholar] [CrossRef]
- Chen, D.; Xie, Z.; Tong, Y.; Huang, Y. Review on BiVO4-based photoanodes for photoelectrochemical water oxidation: the main influencing factors. Energy & Fuels 2022, 36, 9932–9949. [Google Scholar]
- Bavykina, A.; Kolobov, N.; Khan, I.S.; Bau, J.A.; Ramirez, A.; Gascon, J. Metal–organic frameworks in heterogeneous catalysis: recent progress, new trends, and future perspectives. Chemical reviews 2020, 120, 8468–8535. [Google Scholar] [CrossRef] [PubMed]
- Mu, F.; Dai, B.; Zhao, W.; Zhang, L.; Xu, J.; Guo, X. A review on metal-organic frameworks for photoelectrocatalytic applications. Chinese Chemical Letters 2020, 31, 1773–1781. [Google Scholar] [CrossRef]
- Kennedy, J.H.; Frese, K.W. Flatband Potentials and Donor Densities of Polycrystalline α-Fe2O3 Determined from Mott-Schottky Plots. Journal of the Electrochemical Society 1978, 125, 723. [Google Scholar] [CrossRef]
- Zheng, J.Y.; Kang, M.J.; Song, G.; Son, S.I.; Suh, S.P.; Kim, C.W.; Kang, Y.S. Morphology evolution of dendritic Fe wire array by electrodeposition, and photoelectrochemical properties of α-Fe2O3 dendritic wire array. CrystEngComm 2012, 14, 6957–6961. [Google Scholar] [CrossRef]
- Zheng, J.Y.; Son, S.I.; Van, T.K.; Kang, Y.S. Preparation of α-Fe2O3 films by electrodeposition and photodeposition of Co–Pi on them to enhance their photoelectrochemical properties. RSC Advances 2015, 5, 36307–36314. [Google Scholar] [CrossRef]
- Zhu, Y.; Zhang, L.; Ding, R.; Fu, Q.; Bi, L.L.; Zhou, X.; Yan, W.; Xia, W.; Luo, Z. A highly efficient MoOx/Fe2O3 photoanode with rich vacancies for photoelectrochemical O2 evolution from water splitting. New Journal of Chemistry 2024, 48, 1587–1595. [Google Scholar] [CrossRef]
- Wu, J.; Du, X.; Li, M.; Chen, H.; Hu, B.; Ding, H.; Wang, N.; Jin, L.; Liu, W. Enhanced photoelectrochemical water splitting performance of α-Fe2O3 photoanodes through Co-modification with Co single atoms and gC3N4. Chemical Science 2024, 15, 12973–12982. [Google Scholar] [CrossRef]
- Zhang, W.; Zhang, Y.; Miao, X.; Zhao, L.; Zhu, C. Deposition of FeOOH Layer on Ultrathin Hematite Nanoflakes to Promote Photoelectrochemical Water Splitting. Micromachines 2024, 15, 387. [Google Scholar] [CrossRef]
- Xia, W.; Zhang, R.; Chai, Z.; Pu, J.; Kang, R.; Wu, G.; Zeng, X. Synergies of Zn/P-co-doped α-Fe2O3 photoanode for improving photoelectrochemical water splitting performance. International Journal of Hydrogen Energy 2024, 59, 22–29. [Google Scholar] [CrossRef]
- Qiu, R.; Zheng, J.Y.; Cha, H.G.; Jung, M.H.; Lee, K.J.; Kang, Y.S. One-dimensional ferromagnetic dendritic iron wire array growth by facile electrochemical deposition. Nanoscale 2012, 4, 1565–1567. [Google Scholar] [CrossRef] [PubMed]
- Zhang, Z.; Gao, C.; Li, Y.; Han, W.; Fu, W.; He, Y.; Xie, E. Enhanced charge separation and transfer through Fe2O3/ITO nanowire arrays wrapped with reduced graphene oxide for water-splitting. Nano Energy 2016, 30, 892–899. [Google Scholar] [CrossRef]
- Arico, A.; Shukla, A.; Kim, H.; Park, S.; Min, M.; Antonucci, V. An XPS study on oxidation states of Pt and its alloys with Co and Cr and its relevance to electroreduction of oxygen. Applied Surface Science 2001, 172, 33–40. [Google Scholar] [CrossRef]
- Jin, H.; Zhu, J.; Hu, J.; Li, Y.; Zhang, Y.; Huang, X.; Ding, K.; Chen, W. Structural and electronic properties of tungsten trioxides: from cluster to solid surface. Theoretical Chemistry Accounts 2011, 130, 103–114. [Google Scholar] [CrossRef]
Figure 1.
(a) Schematic diagrams showing the experimental set-up. (b) The digital photographs of the electrodeposited Fe films at −1.3 V, −1.4 V, and −1.5 V vs. Ag/AgCl for 300 s with the deposition area of 1 cm × 1 cm. (c) Schematic representation of the structure of dendritic Fe and dendritic α-Fe2O3@Fe film.
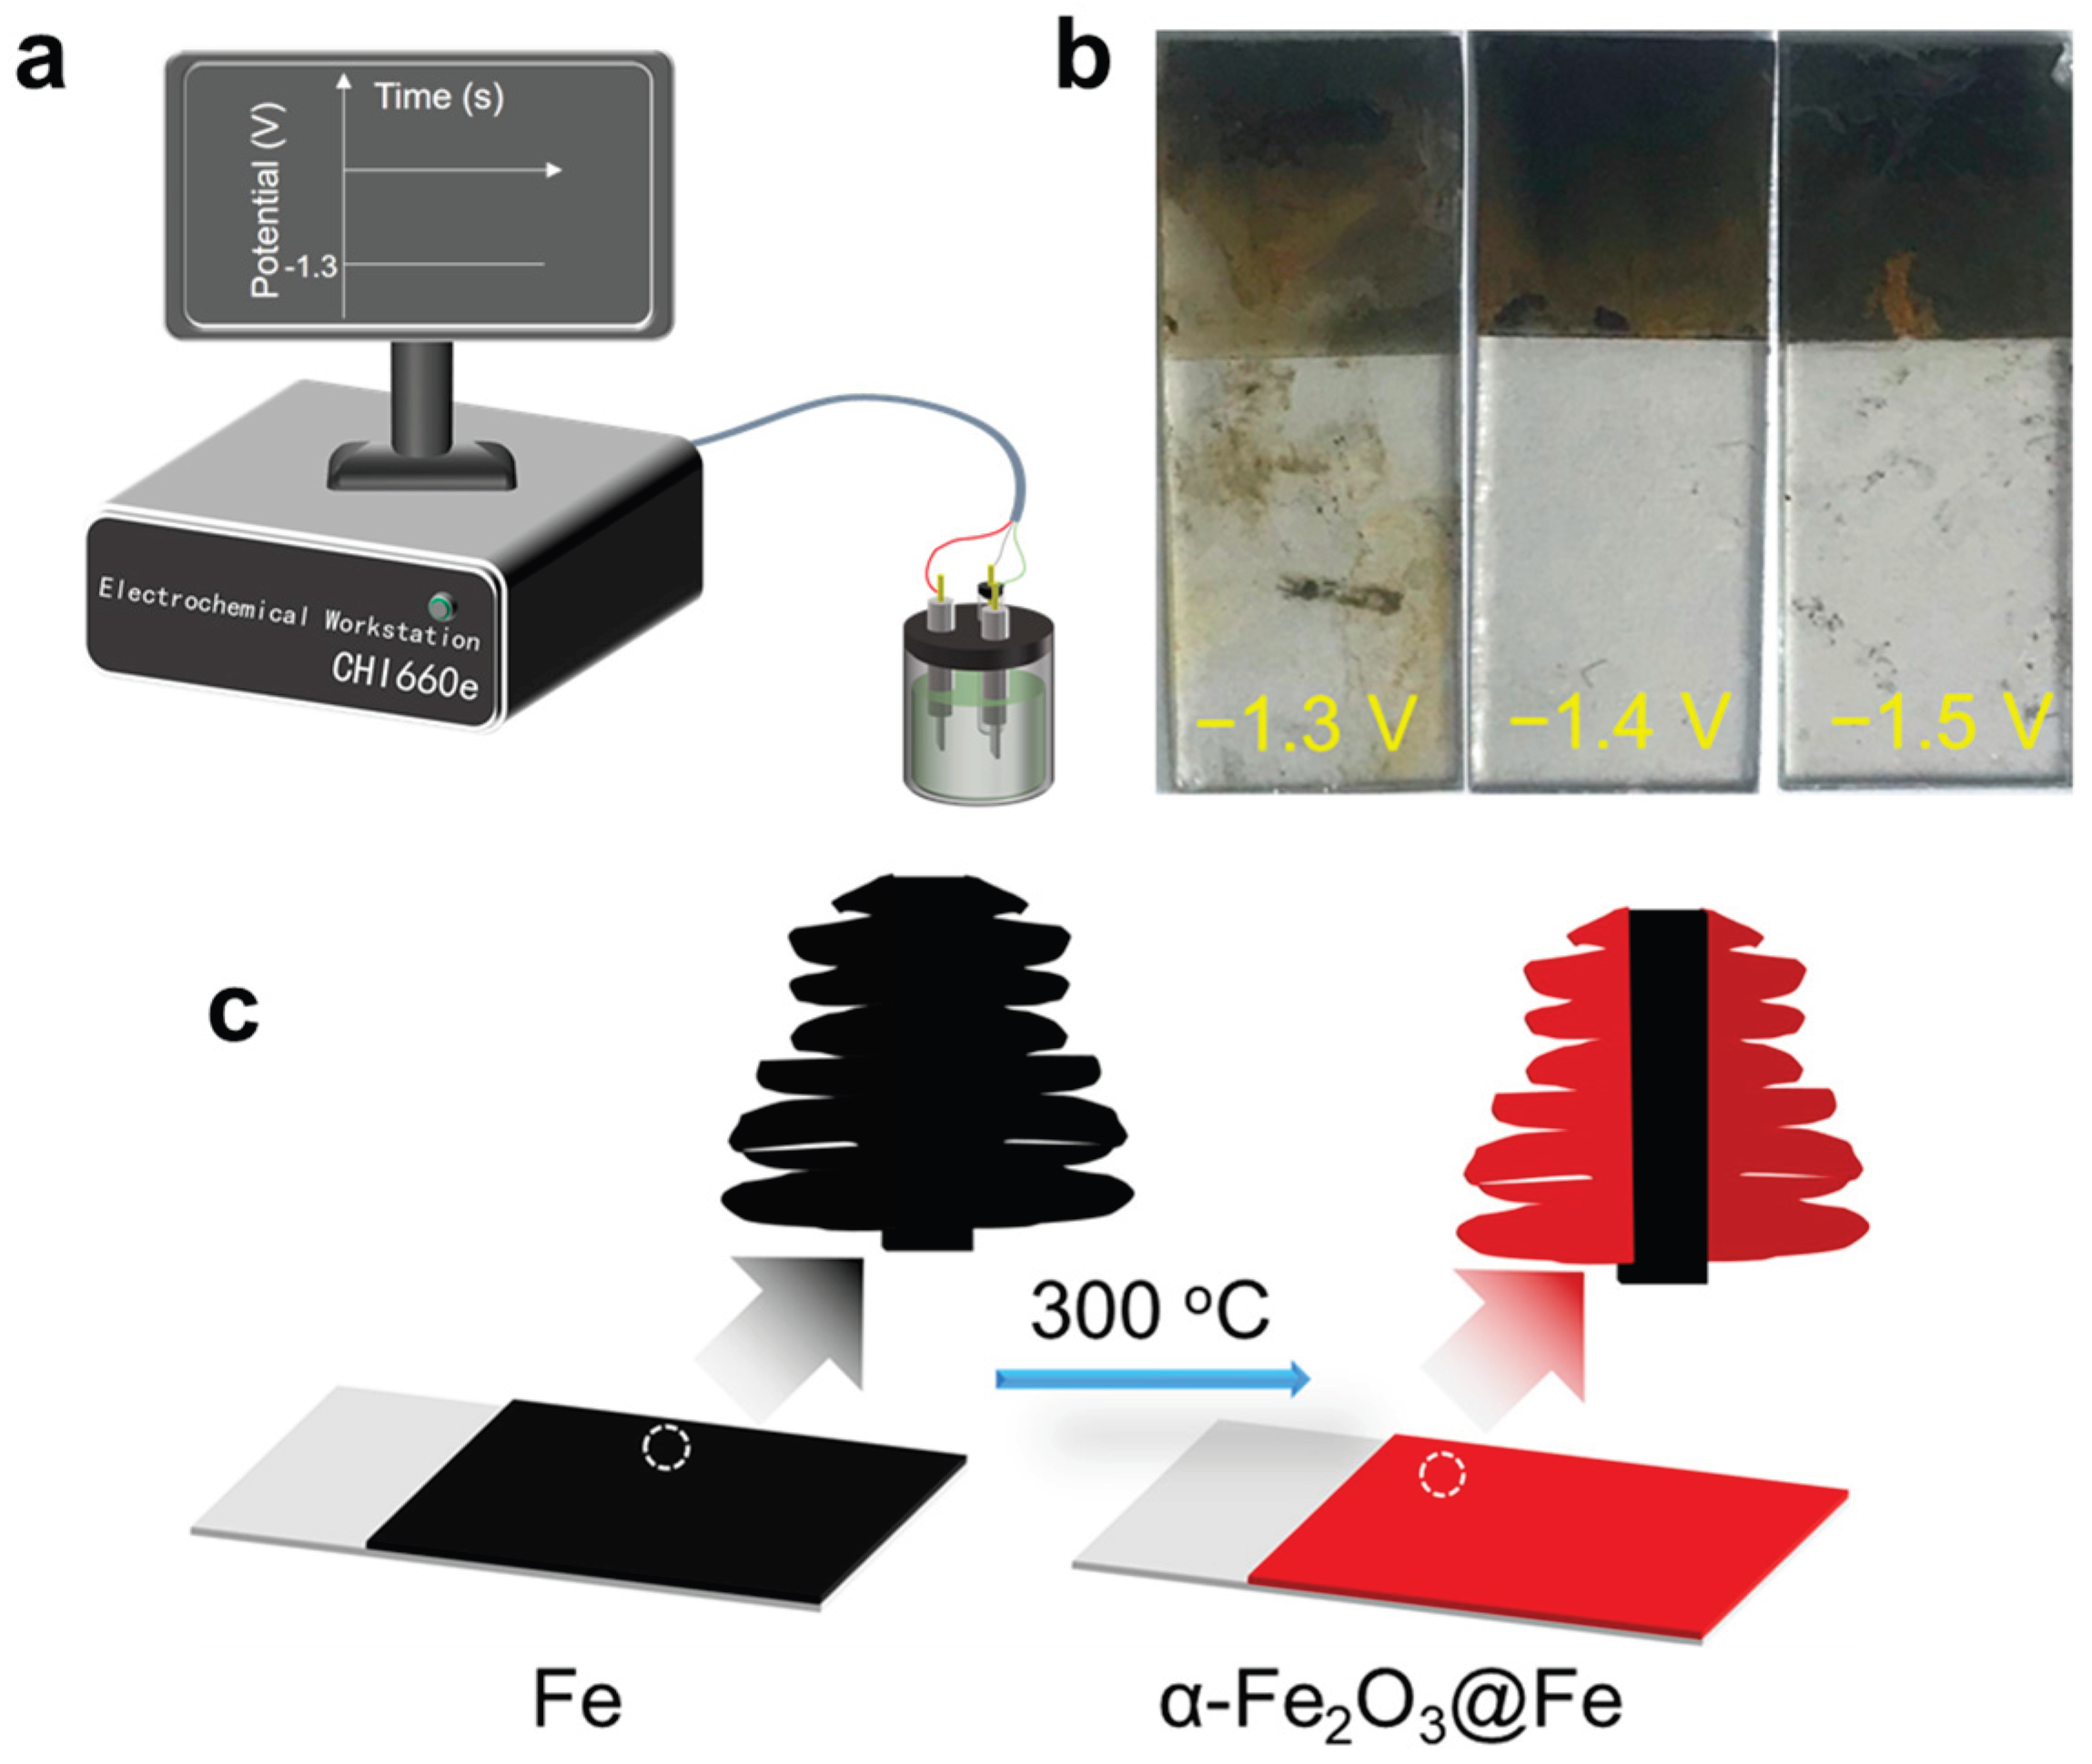
Figure 2.
SEM images of (a, b) Fe, (c, d) α-Fe2O3, (e, f) α-Fe2O3@Fe, and (g, h) Pt-α-Fe2O3@Fe samples.
Figure 2.
SEM images of (a, b) Fe, (c, d) α-Fe2O3, (e, f) α-Fe2O3@Fe, and (g, h) Pt-α-Fe2O3@Fe samples.
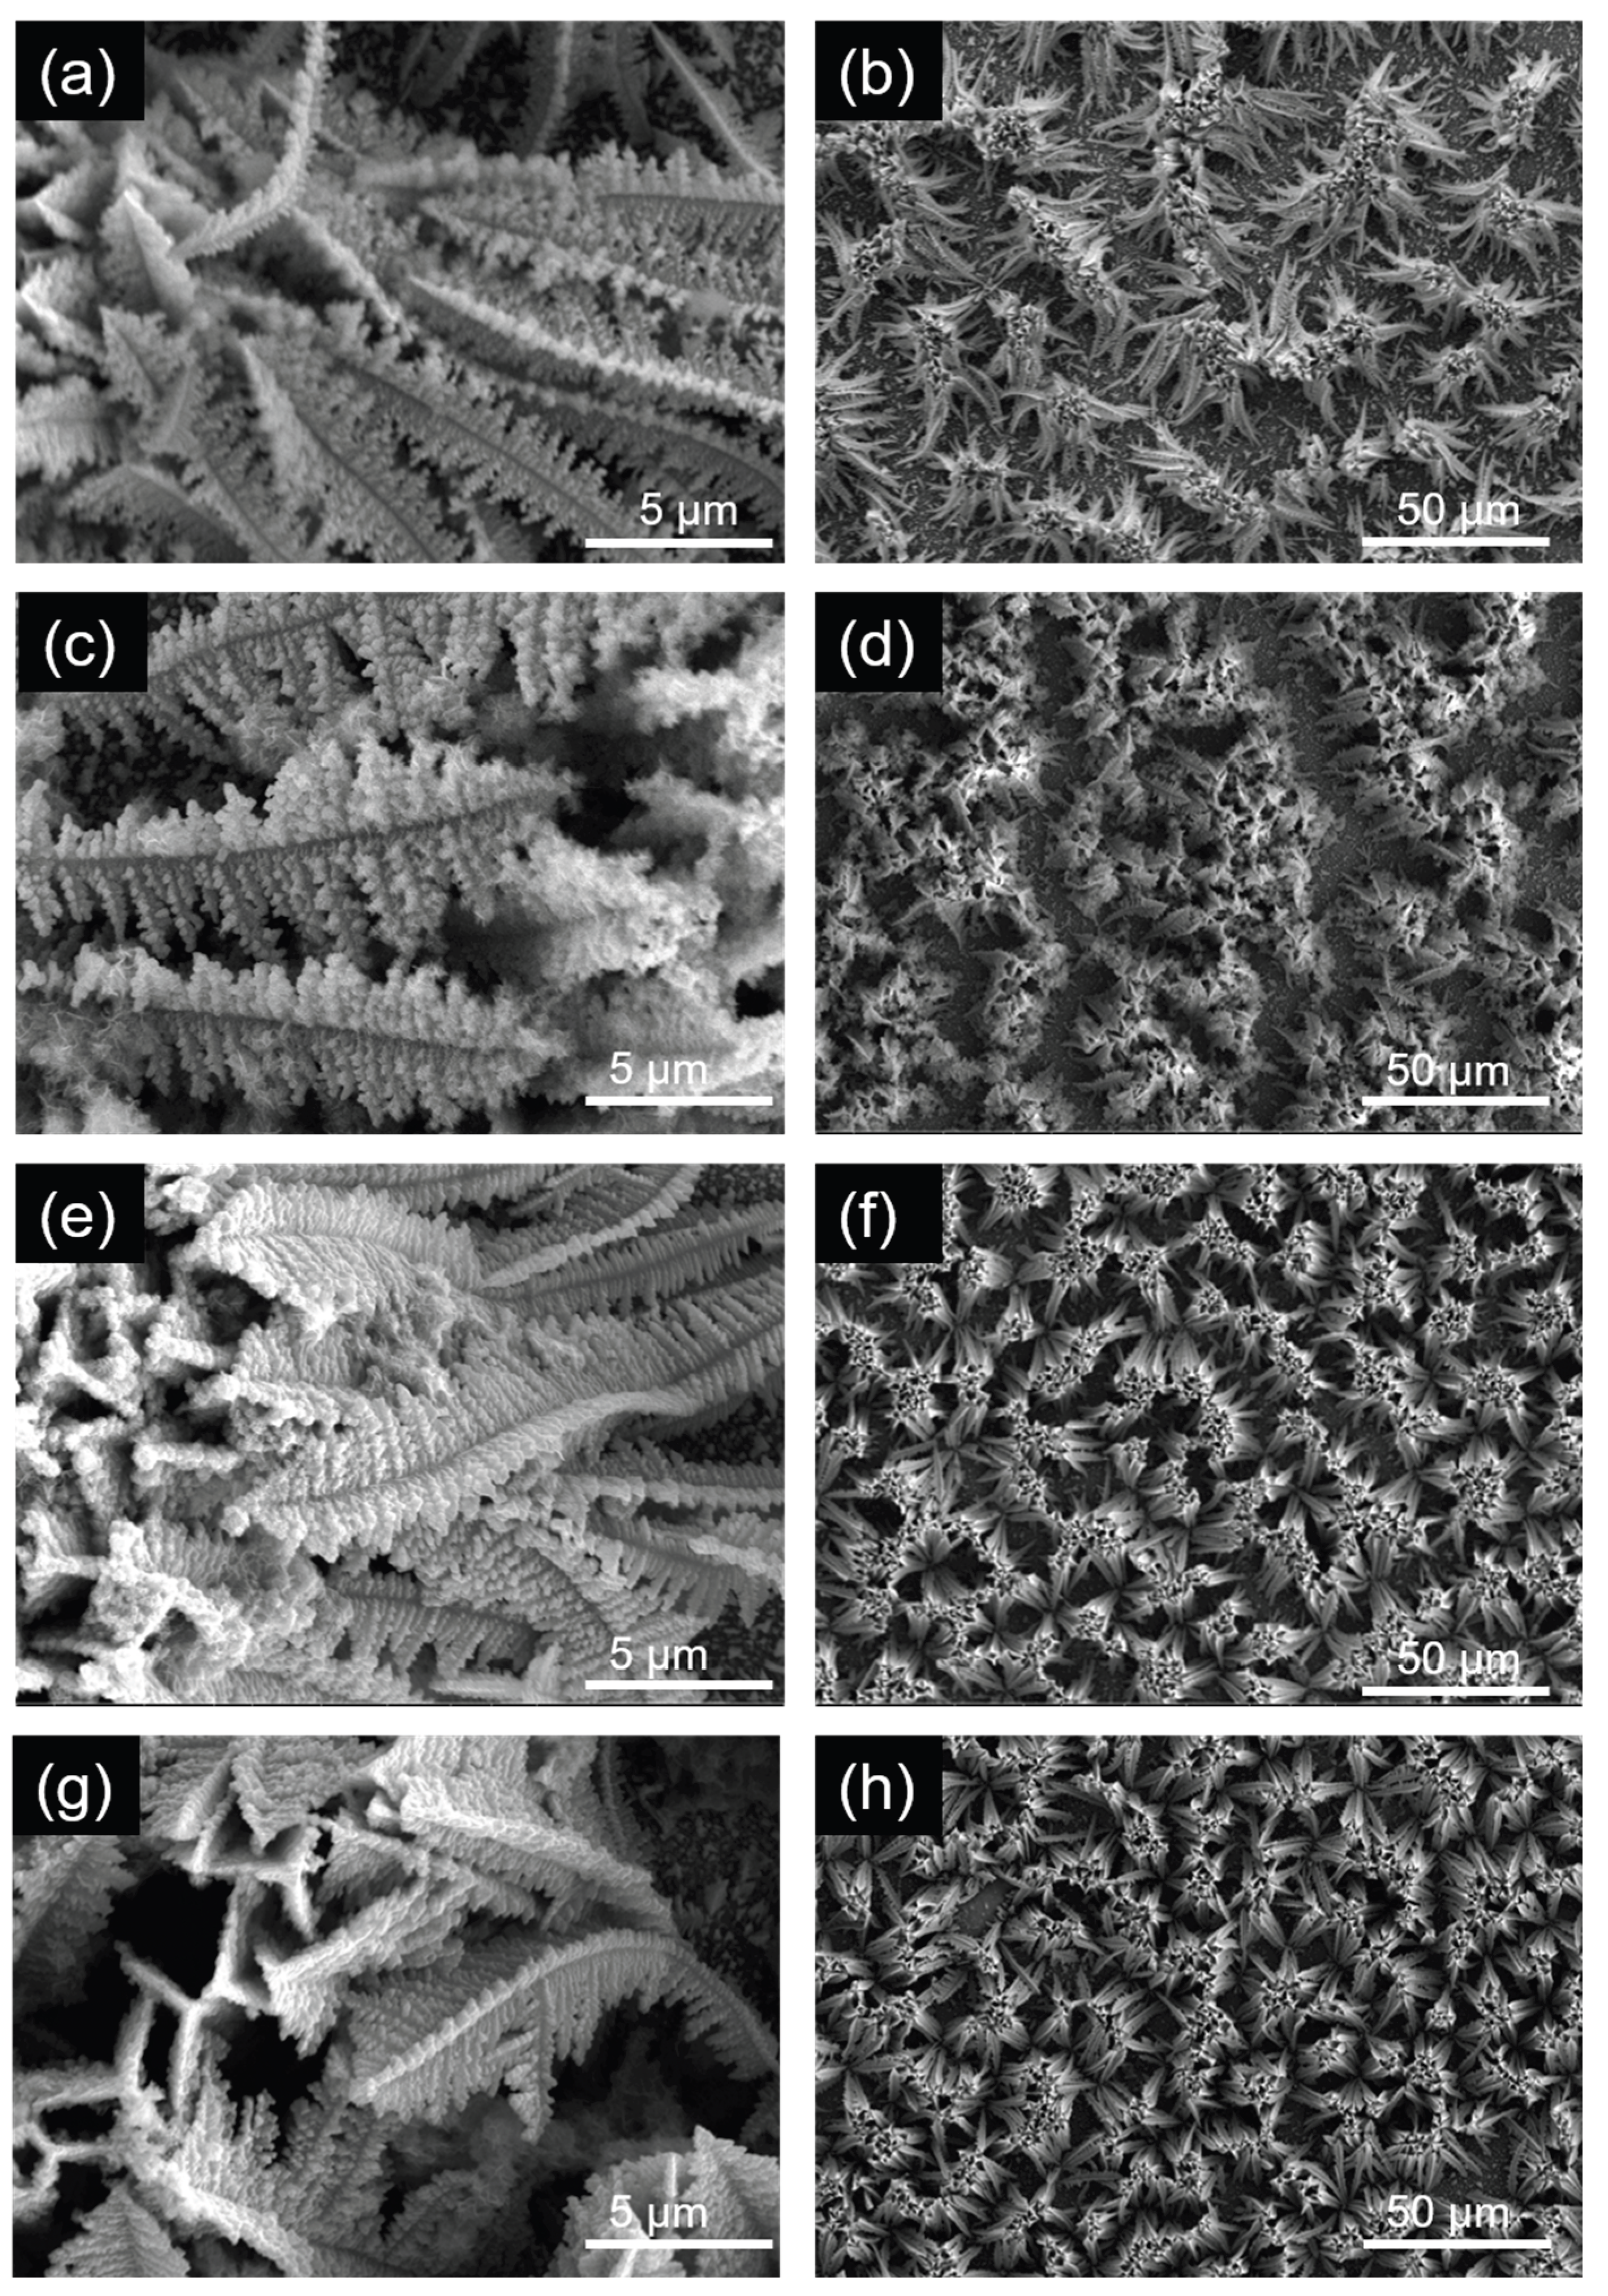
Figure 3.
(a) EDS spectrum of the Pt-α-Fe2O3@Fe sample. (b) SEM image of Pt-α-Fe2O3@Fe and corresponding EDS mapping images of (c) Fe, (d) O, and (e) Pt elements.
Figure 3.
(a) EDS spectrum of the Pt-α-Fe2O3@Fe sample. (b) SEM image of Pt-α-Fe2O3@Fe and corresponding EDS mapping images of (c) Fe, (d) O, and (e) Pt elements.
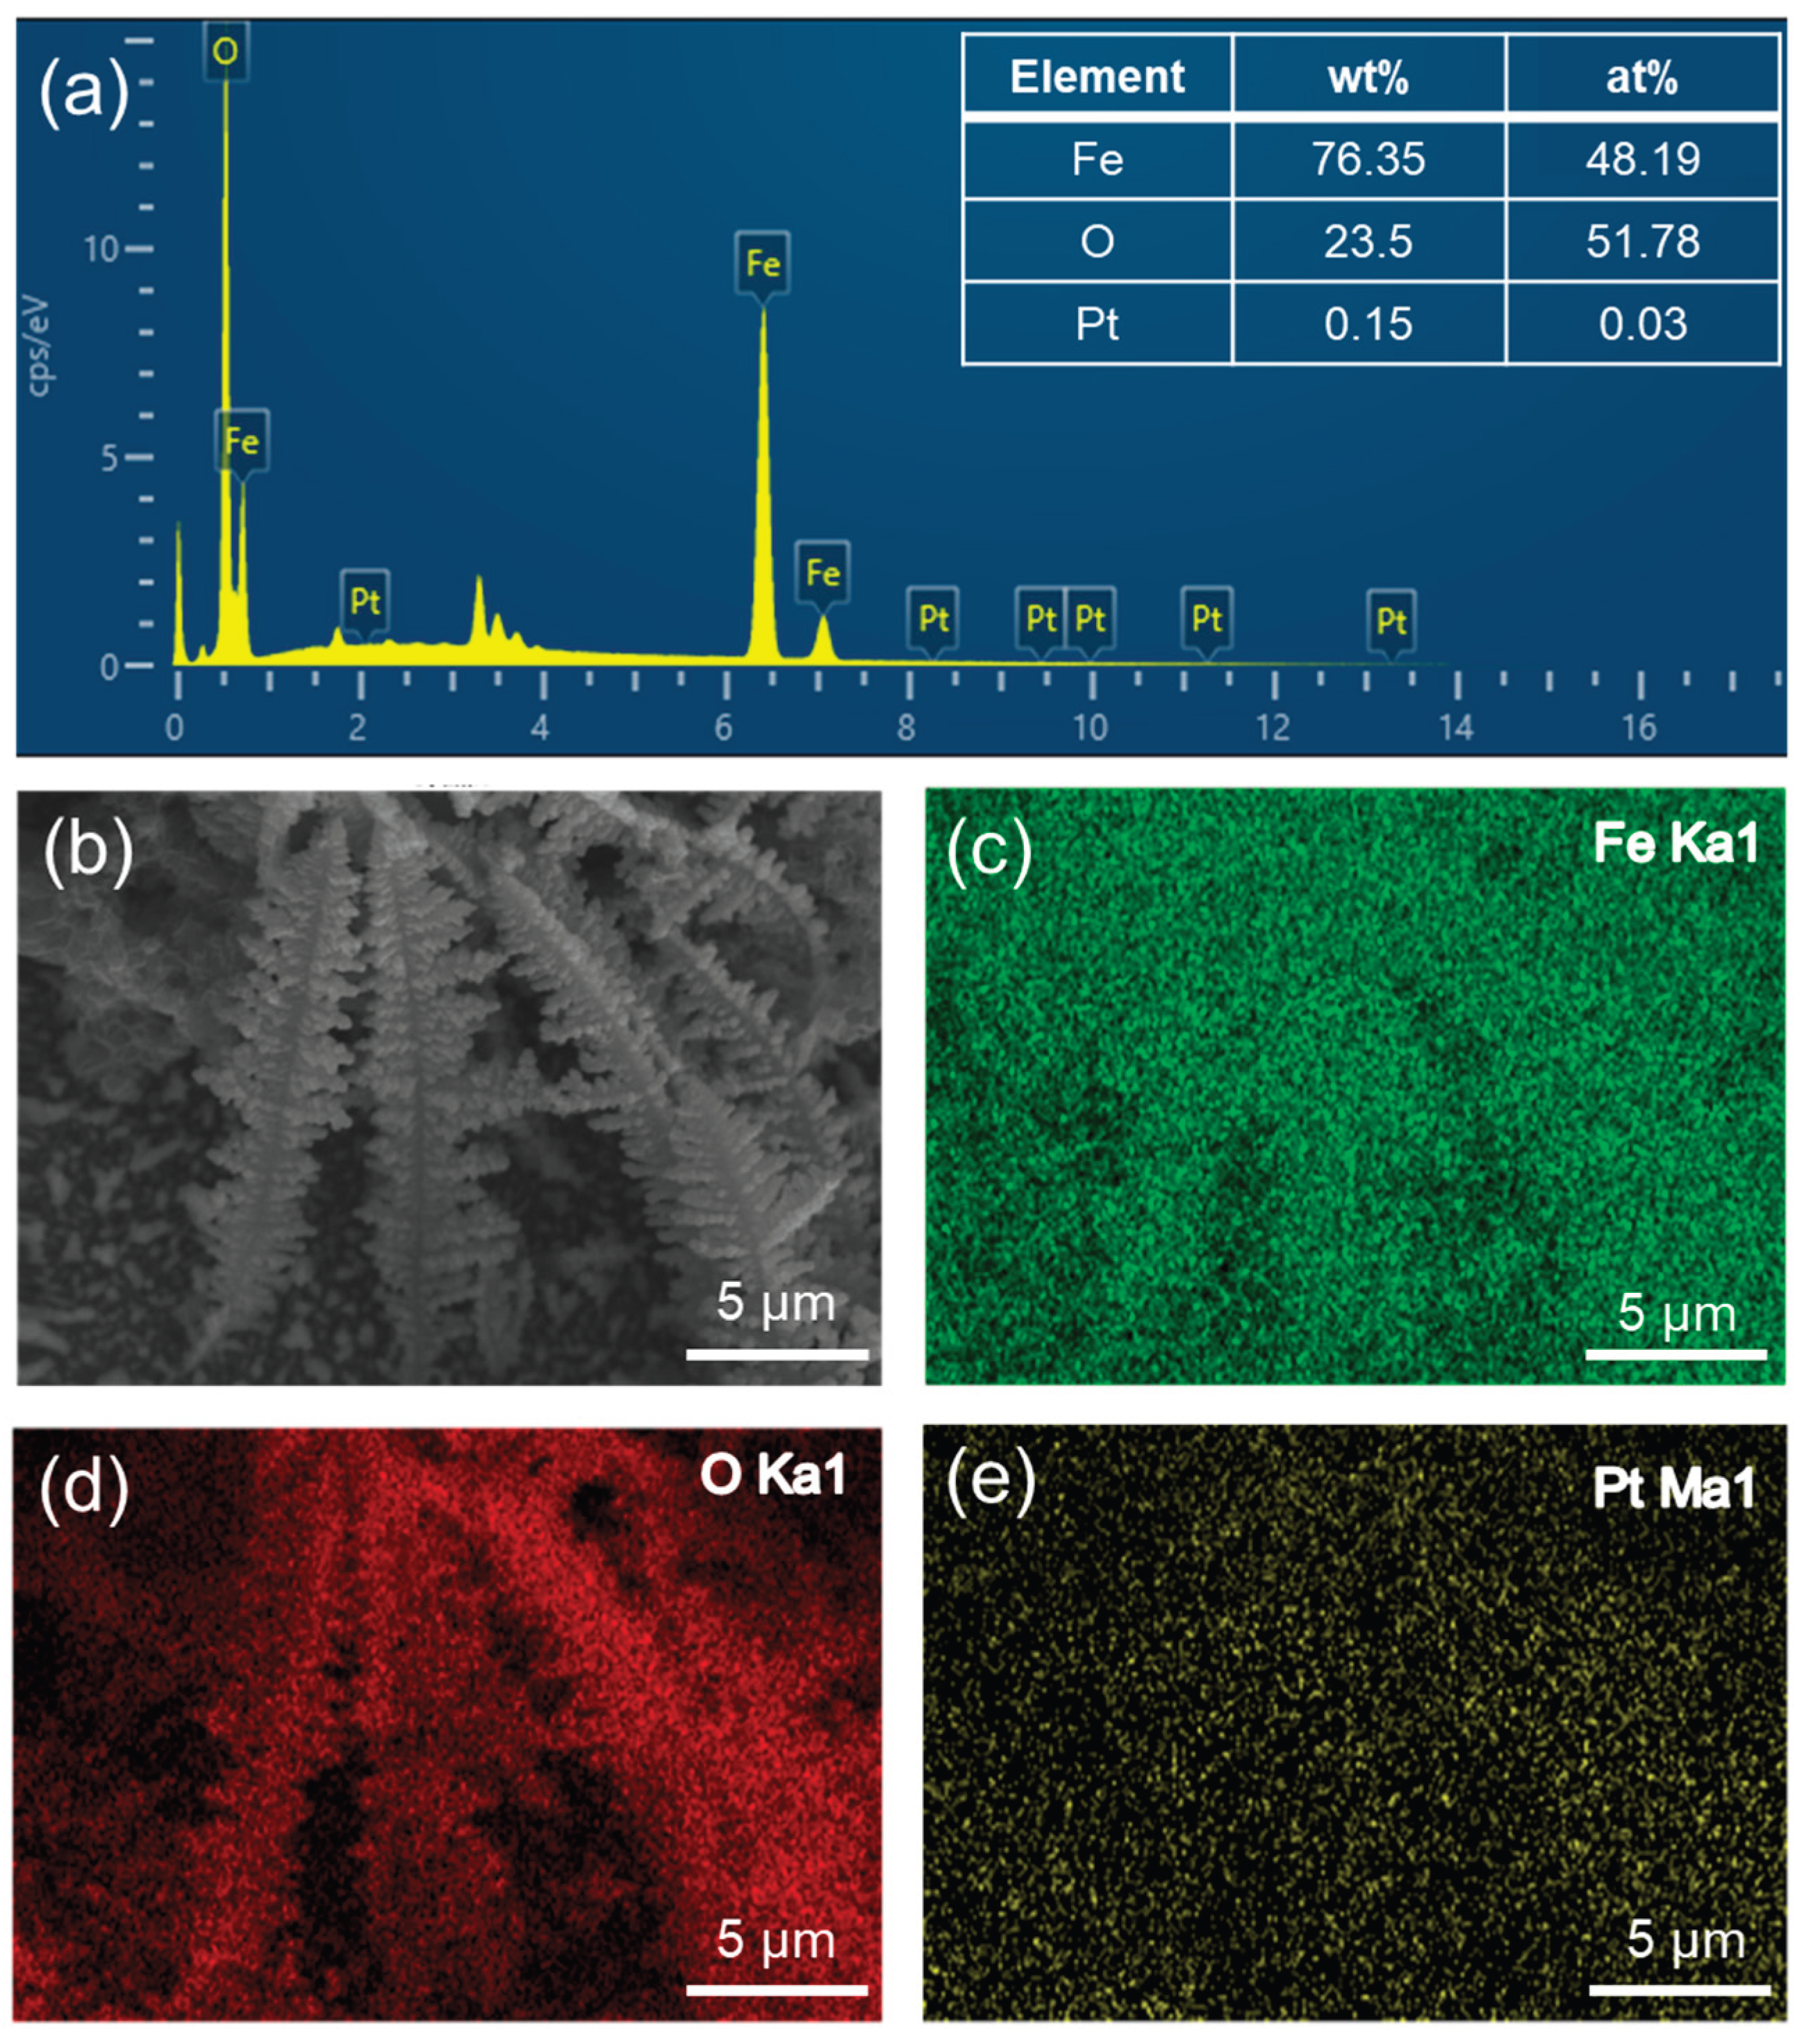
Figure 4.
(a) XRD patterns of ITO, Fe, and α-Fe2O3, (b) XRD patterns of α-Fe2O3 and Fe sample with different annealing times (0-4 h) at 300 °C.
Figure 4.
(a) XRD patterns of ITO, Fe, and α-Fe2O3, (b) XRD patterns of α-Fe2O3 and Fe sample with different annealing times (0-4 h) at 300 °C.
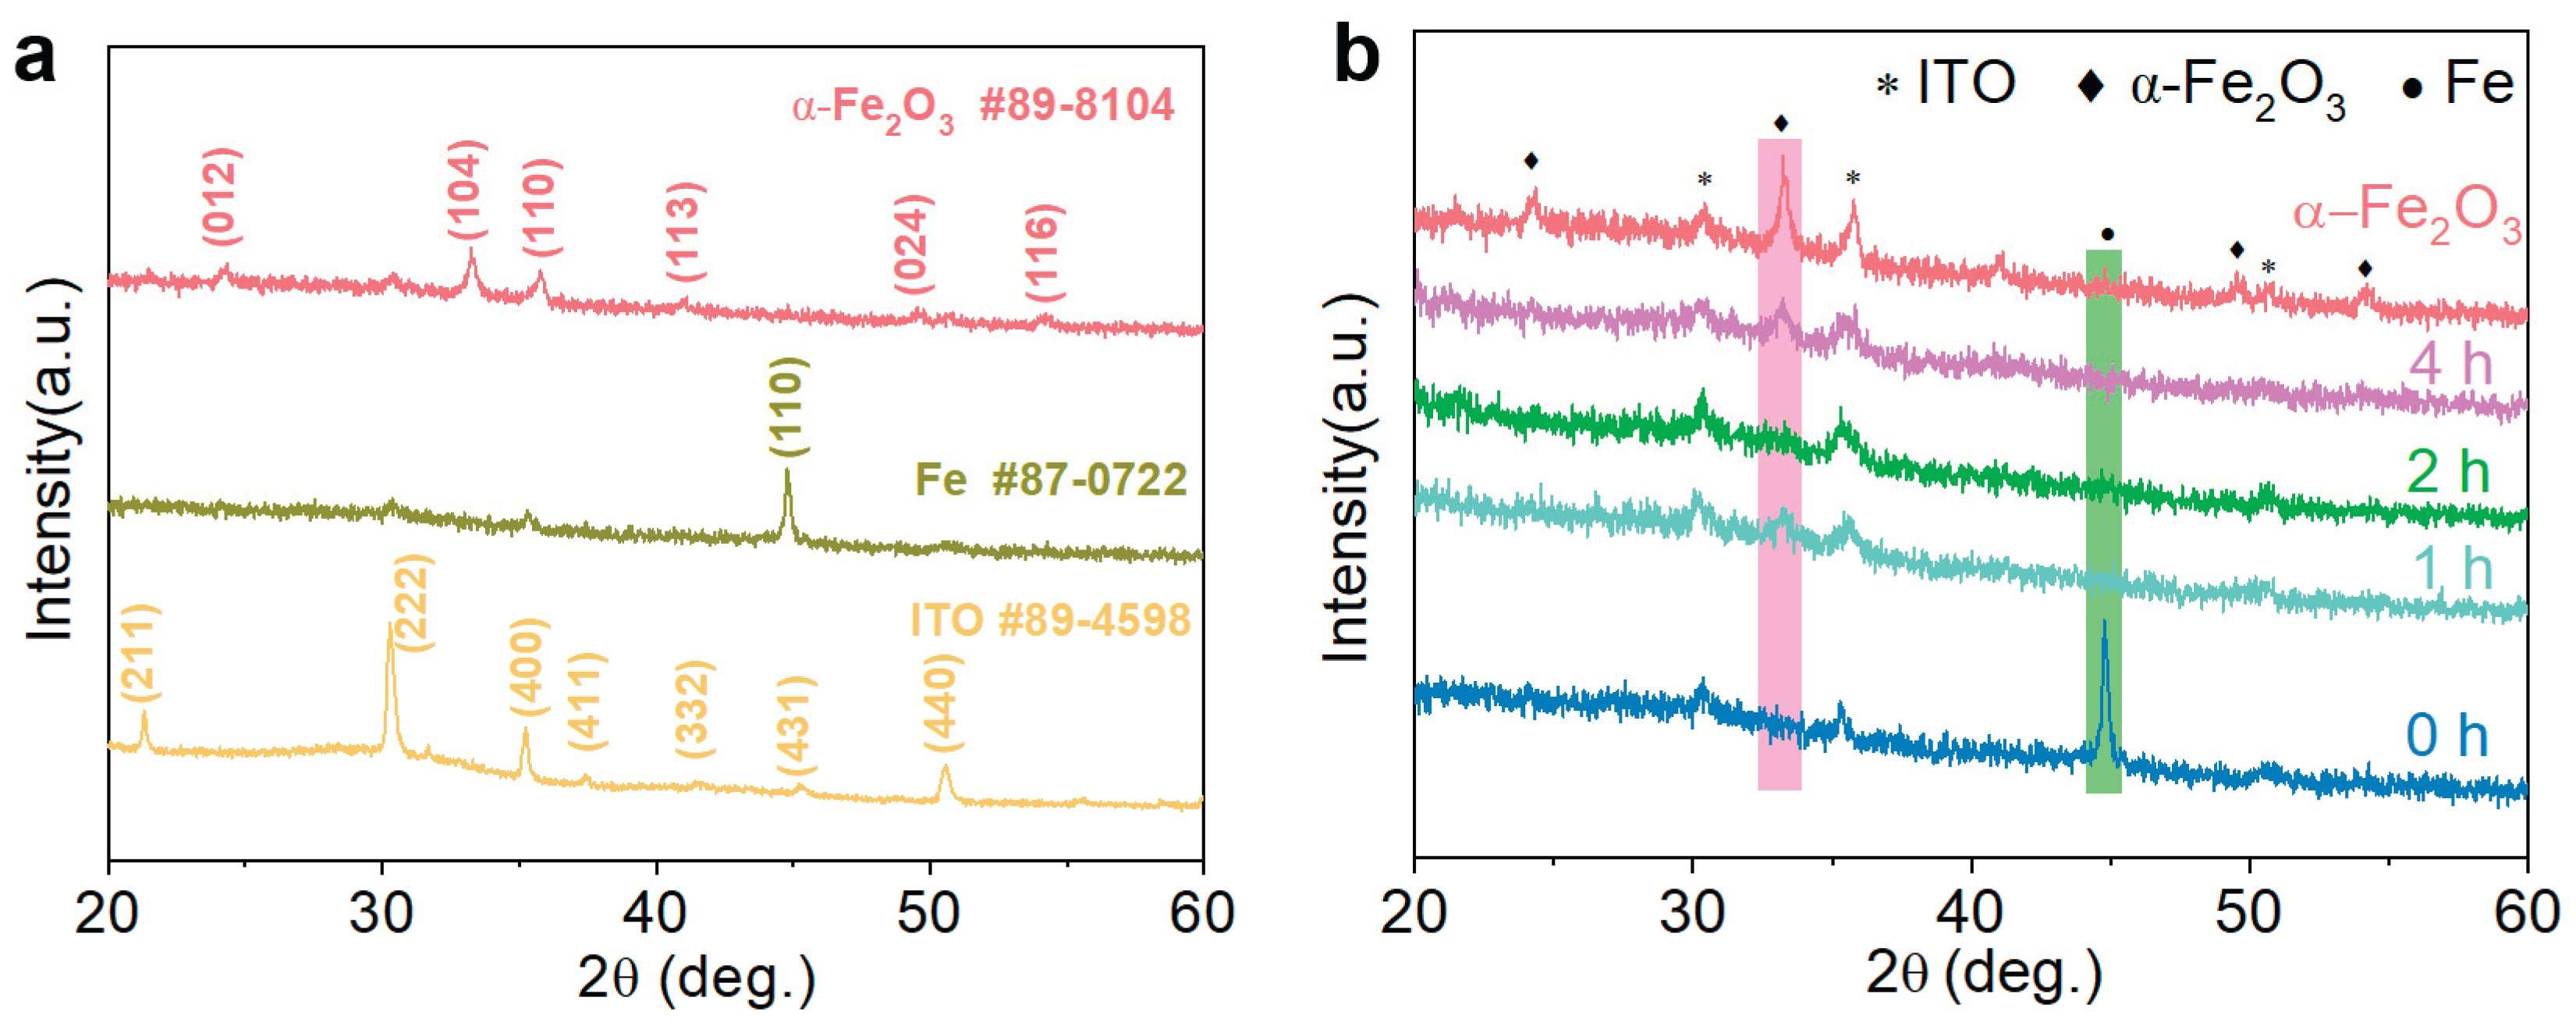
Figure 5.
XPS patterns of (a, c, e) Fe 2p and (b, d, f) O1s for α-Fe2O3@Fe obtained by annealing Fe at 300 °C for 2h, α-Fe2O3@Fe obtained by annealing Fe at 300 °C for 6h, and α-Fe2O3 obtained by annealing Fe at 500 °C for 2h, respectively.
Figure 5.
XPS patterns of (a, c, e) Fe 2p and (b, d, f) O1s for α-Fe2O3@Fe obtained by annealing Fe at 300 °C for 2h, α-Fe2O3@Fe obtained by annealing Fe at 300 °C for 6h, and α-Fe2O3 obtained by annealing Fe at 500 °C for 2h, respectively.
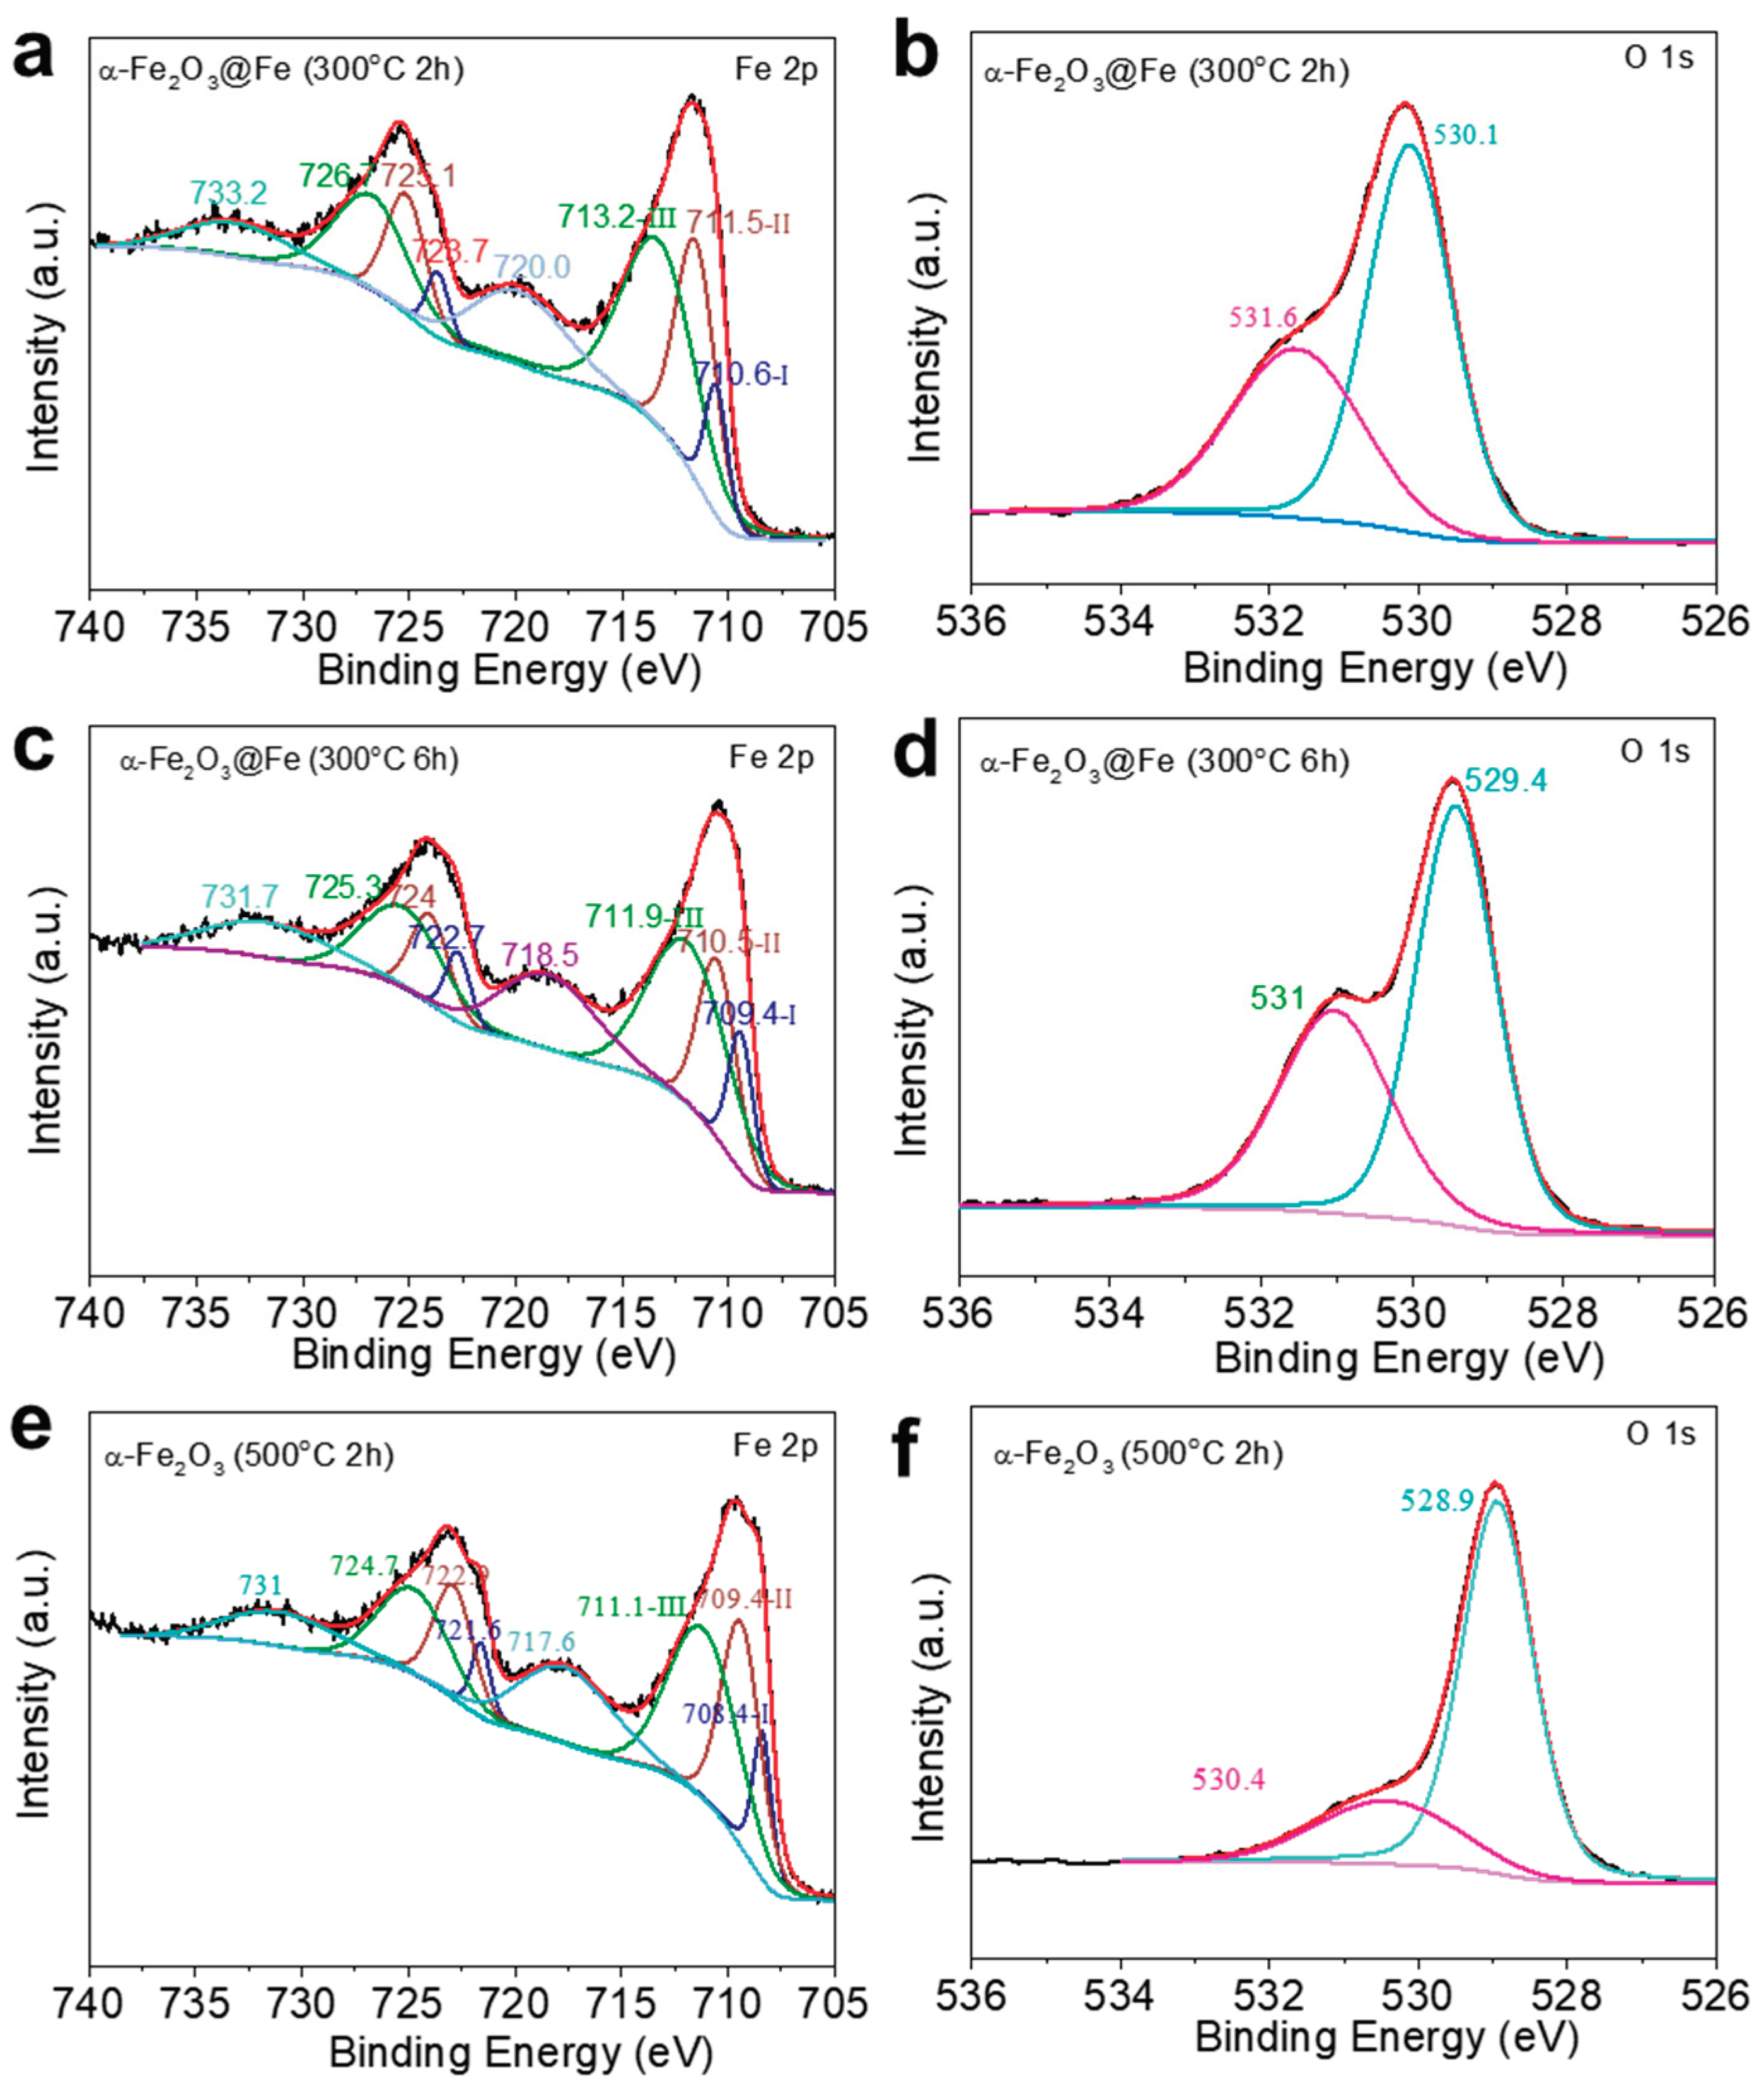
Figure 6.
XPS mapping of the Pt 4f peak of Pt-α-Fe2O3@Fe.
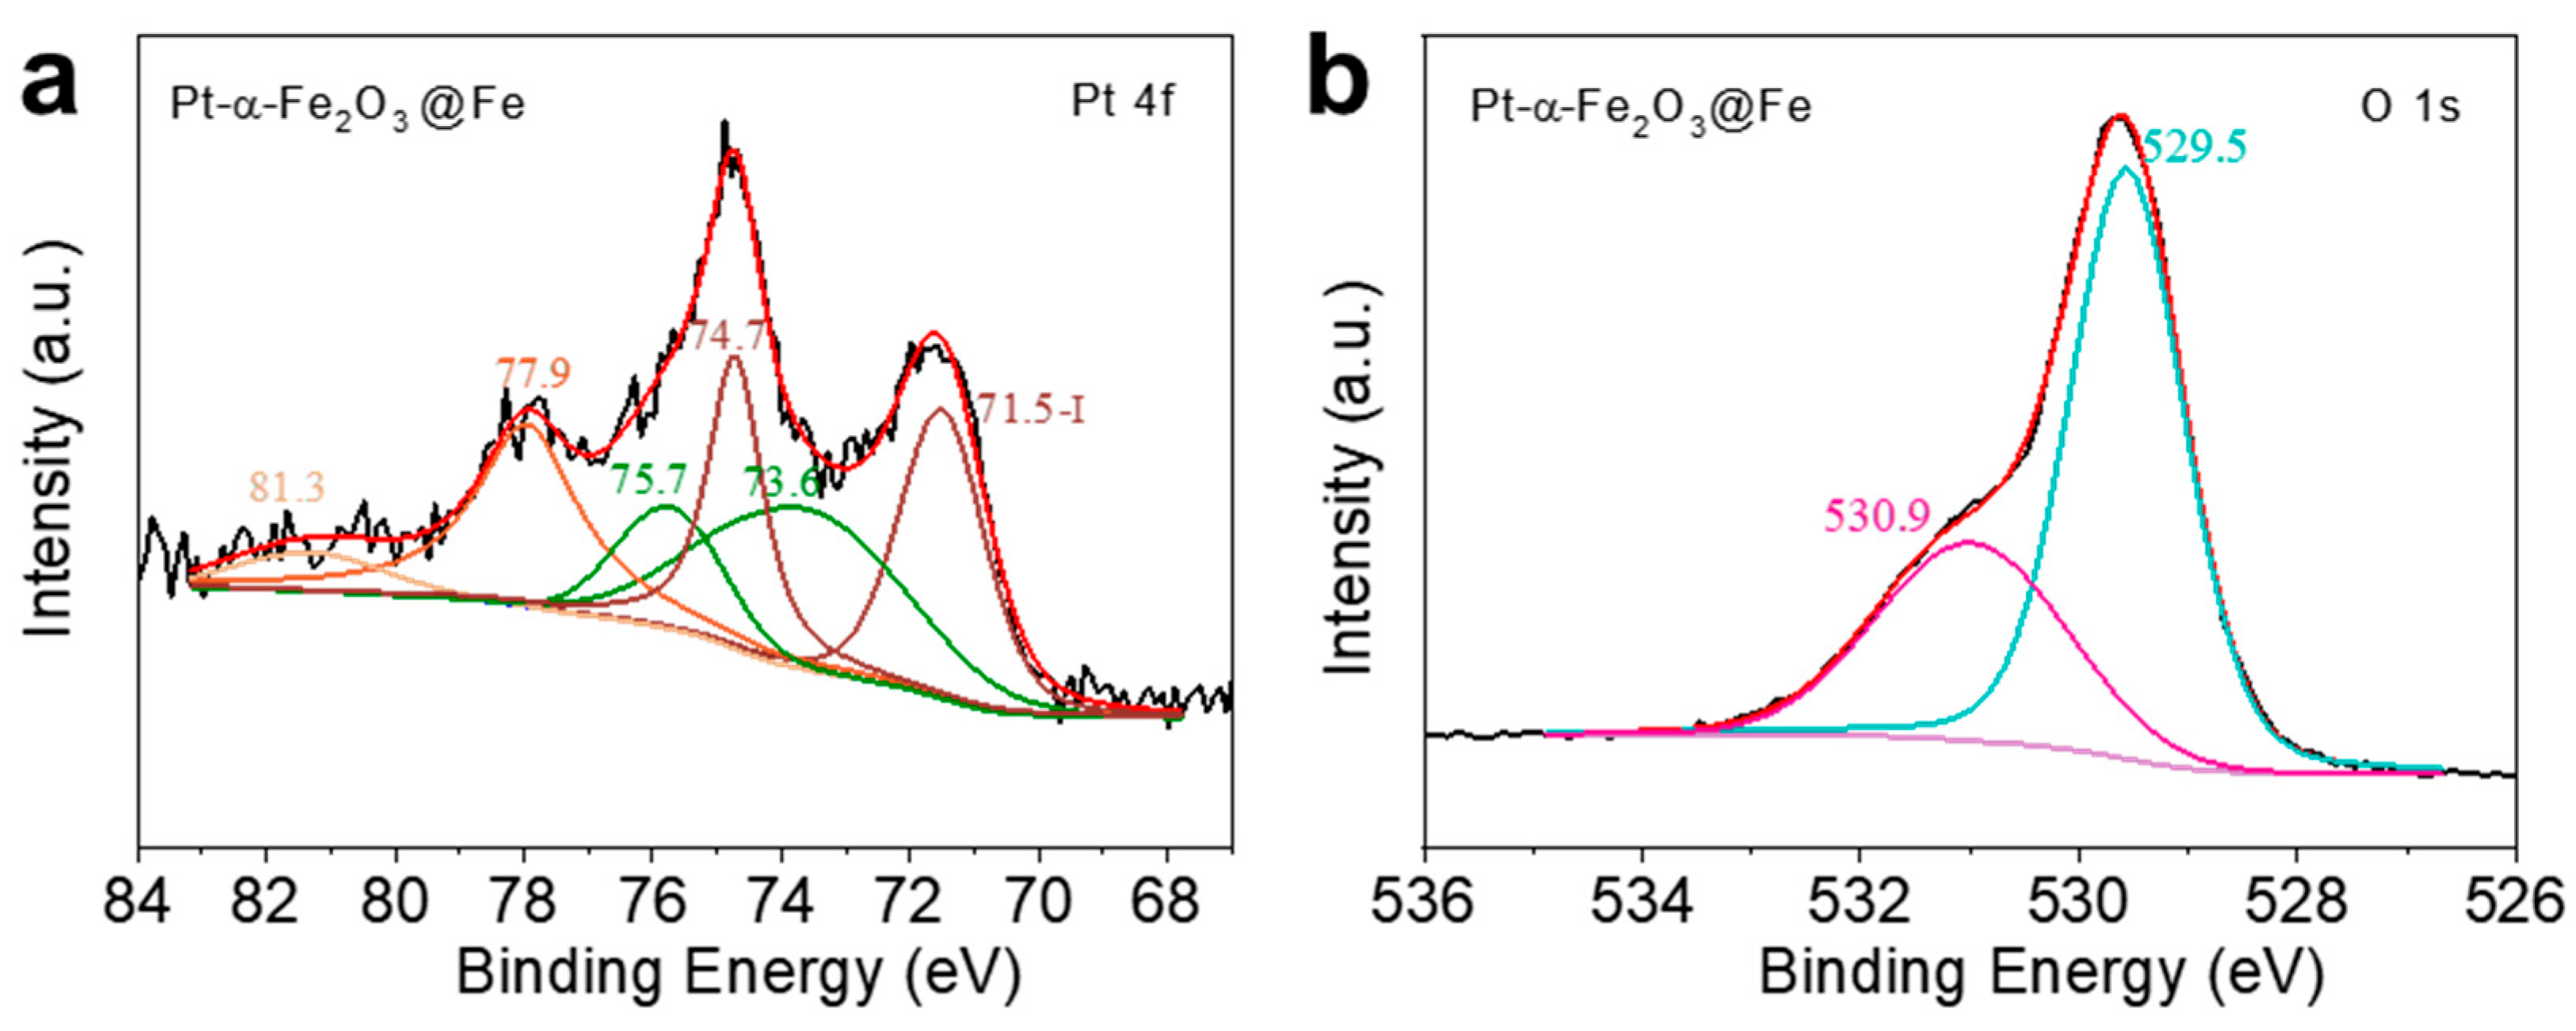
Figure 7.
(a) Light response curves of the same sample annealed at 300 °C for different times. (b) Trend of photoanode photocurrent density at different annealing times.
Figure 7.
(a) Light response curves of the same sample annealed at 300 °C for different times. (b) Trend of photoanode photocurrent density at different annealing times.

Figure 8.
Schematic diagram of the structural changes of the sample during the annealing process.
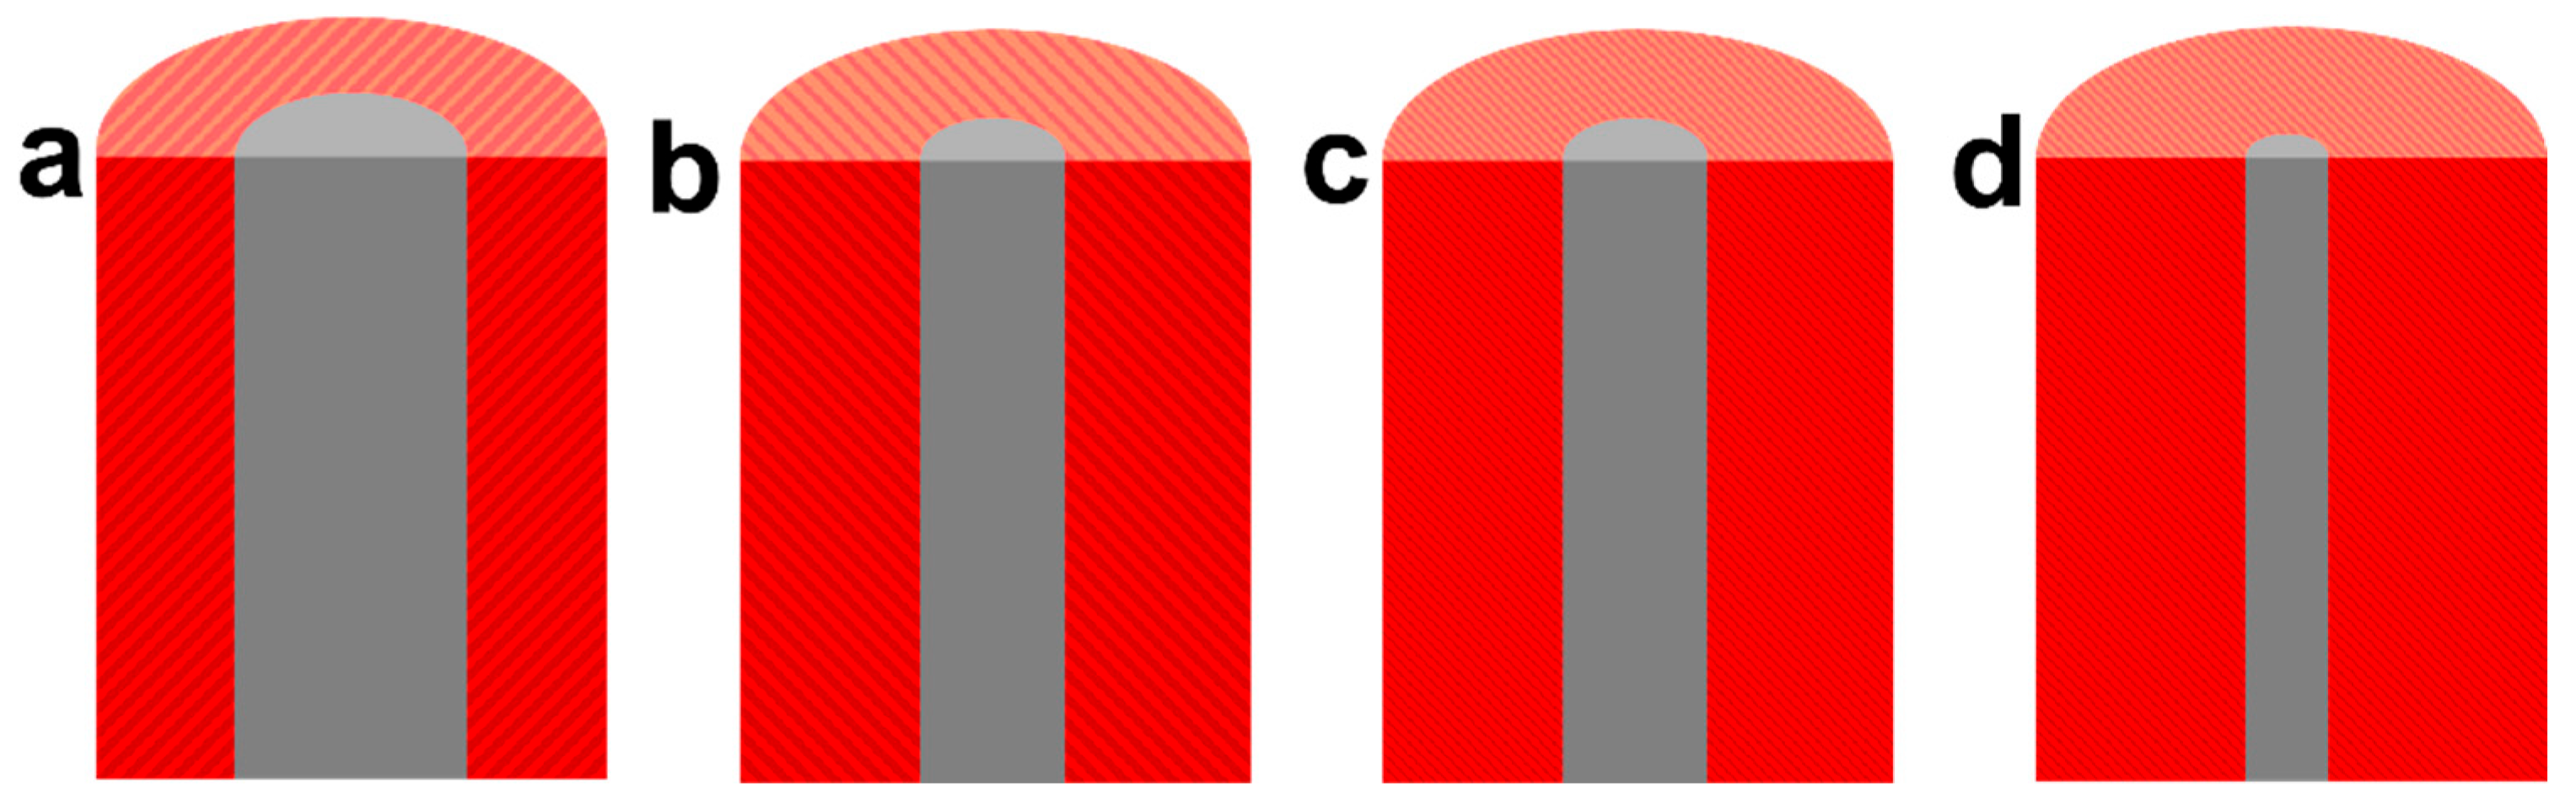
Figure 9.
(a) Photoresponse current density at 0.55 V vs Ag/AgCl of samples after immersion in H2PtCl6 solution for different times. (b) Stability test curves at 0.55 V vs Ag/AgCl under 1 sun illumination for samples.
Figure 9.
(a) Photoresponse current density at 0.55 V vs Ag/AgCl of samples after immersion in H2PtCl6 solution for different times. (b) Stability test curves at 0.55 V vs Ag/AgCl under 1 sun illumination for samples.
Disclaimer/Publisher’s Note: The statements, opinions and data contained in all publications are solely those of the individual author(s) and contributor(s) and not of MDPI and/or the editor(s). MDPI and/or the editor(s) disclaim responsibility for any injury to people or property resulting from any ideas, methods, instructions or products referred to in the content. |
© 2026 by the authors. Licensee MDPI, Basel, Switzerland. This article is an open access article distributed under the terms and conditions of the Creative Commons Attribution (CC BY) license (http://creativecommons.org/licenses/by/4.0/).
Copyright: This open access article is published under a Creative Commons CC BY 4.0 license, which permit the free download, distribution, and reuse, provided that the author and preprint are cited in any reuse.


