
Submitted:
23 January 2026
Posted:
23 January 2026
You are already at the latest version
Abstract
Plug-in hybrid electric vehicles (PHEVs) are critical to the EU's decarbonization strategy, yet their real-world climate benefits remain uncertain. This study presents a large-scale analysis of real-world PHEV performance using on-board monitoring data from 457,303 vehicles (2021-2023). The results reveal a profound discrepancy between official test values and actual use. The mean real-world CO₂ emissions were 138 g/km, compared to a test-cycle average of 46 g/km, resulting in a regulatory gap of approximately 300%—significantly higher than for other vehicle types. Performance varied substantially across manufacturers, with gaps ranging over 200 percentage points. Contrary to expectations, larger battery capacity was correlated with a wider performance gap. Real-world electric driving averaged only 45.5% of distance, far below regulatory assumptions. This gap has grown wider each year, indicating test-cycle optimization is outpacing real-world efficiency gains. Policy analysis shows that closing this gap could achieve major CO₂ savings, underscoring the urgent need for regulatory reform, including real-world emissions monitoring and updated test procedures, to ensure PHEVs deliver their promised environmental impact.
Keywords:
plug-in hybrid vehicles
; real-world emissions
; WLTP
; OBFCM
; CO2 reductions
; vehicle testing
; automotive policy
; climate mitigation
1. Introduction
Plug-in hybrid electric vehicles (PHEVs) have emerged as a central component of the European Union’s decarbonization strategy for the transport sector [1,2]. In response to increasingly stringent CO2 emission targets—declining from 130 g/km in 2015 to 93.6 g/km by 2025 and reaching 49.5 g/km by 2030—the automotive industry has positioned PHEV technology as a transitional solution that bridges conventional internal combustion engines and fully electric vehicles [3,4,5]. The market response has been substantial: PHEV registrations in Europe grew dramatically from 178,000 units in 2015 to over 1.5 million units annually by 2022, representing approximately 7-10% of total new vehicle sales and signaling strong manufacturer and consumer adoption [6,7]. This growth reflects the appealing regulatory and marketing proposition of PHEVs: these vehicles combine a battery-electric drivetrain (typically offering 30-60 km of electric range) with a conventional combustion engine, offering consumers the low-emissions benefit of electrification for daily commutes while maintaining combustion engine range for longer journeys [8,9]. Manufacturers prominently advertise “near-zero emissions” scenarios and potential CO2 values of 20-50 g/km across their marketing materials, implying that EU regulatory compliance can be achieved with minimal efficiency improvements to engine technology [10,11]. Policymakers have embraced PHEVs as a pragmatic compromise, allowing continued internal combustion technology while meeting 2030 targets through the apparent zero-emissions potential of the battery in daily use [12,13]. The regulatory framework reflects this optimism: the WLTP (Worldwide Harmonized Light Vehicle Test Procedure) test cycle, introduced in 2017, permits vehicles to be tested from a fully charged battery state, enabling manufacturers to minimize engine engagement during the standardized driving sequence and record correspondingly low emissions values.
Despite this regulatory and market optimism, a fundamental disconnect has emerged between laboratory test performance and real-world PHEV operation [14,15]. Early studies by the International Council on Clean Transportation (ICCT) and individual member state monitoring programs identified substantial gaps between WLTP test results and in-use emissions, but quantitative assessments have been limited to small-scale monitoring programs or specific geographic regions, preventing robust fleet-wide generalization of findings [16]. The root cause of this disconnects lies in the underlying WLTP test assumptions, which create conditions unlikely to occur in real-world driving. The test protocol assumes that all PHEVs begin measurement from a fully charged battery state and calculates emissions based on a weighted average of electric-only operation (based on electric range) and hybrid operation (engine plus battery). This design choice creates a critical vulnerability: in the real world, drivers rarely maintain full battery charge due to intermittent charging patterns, range anxiety, and the limited availability of home or workplace charging infrastructure [17,18]. Consequently, drivers frequently employ the combustion engine from the first driving kilometer of their journeys, negating the “zero-emissions” assumption embedded in WLTP [19,20]. Furthermore, the test cycle’s low average speed (approximately 46 km/h) and gentle acceleration profile fail to capture the demands of highway driving, high-load conditions during urban congestion, and the rapid battery depletion typical of real-world journeys that include both urban and motorway segments [21,22].
Multiple mechanistic hypotheses have been proposed to explain the observed test-to-real gap in PHEV performance. First, the battery depletion rate in real-world driving substantially exceeds WLTP assumptions, forcing prolonged engine operation in scenarios where WLTP predicts continued electric driving. Second, real drivers employ acceleration patterns and speeds far exceeding WLTP profiles, increasing engine fuel consumption during normal operation [23,24]. Third, thermal dynamics—including engine warm-up penalties, battery thermal management demands, and climate control operation—are negligible or absent in WLTP but significantly increase real-world energy demand, particularly during winter driving. Fourth, manufacturers may fine-tune engine control software to minimize emissions specifically during the WLTP test sequence, creating a phenomenon known as “defeat devices” or “test-specific strategies” that optimize performance for the test rather than generalized real-world operation. Finally, the addition of battery weight (50-100 kg per vehicle) and the complexity of hybrid drivetrain components creates conflicting optimization pressures between electric and combustion modes, potentially resulting in compromised real-world efficiency relative to conventional vehicles optimized for combustion alone [25,26].
Previous research has documented PHEV real-world performance through three main approaches, each with distinct limitations. Laboratory-based studies have employed modified WLTP procedures or more aggressive test cycles such as RDE (Real Driving Emissions) or alternative WLTP variants with lower battery state-of-charge assumptions. These studies consistently demonstrate 30-60% increases in emissions compared to standard WLTP claims [27,28]. On-vehicle monitoring studies have deployed Portable Emissions Measurement Systems (PEMS) on individual vehicles, typically fewer than 50 per study, revealing gaps of 50-100% between test and real-world performance [29,30]; unfortunately, the limited sample size prevents reliable generalization across manufacturers or vehicle classes. User surveys and fleet-based analyses have accessed fleet telematics data or owner surveys to estimate real-world battery usage and fuel consumption patterns. This study leverages the European Union’s On-Board Fuel Consumption Monitoring (OBFCM) database to conduct a comprehensive analysis of real-world PHEV CO2 emissions across 457,303 vehicles from 13 European manufacturers during 2021–2023. The analysis quantifies the magnitude of test-to-reality CO2 gaps, identifies manufacturer-specific compliance patterns, and assesses the policy implications of gap closure for European Union 2030 climate targets.
The European regulatory framework for light-duty vehicle emissions has evolved significantly since WLTP introduction in 2017, though current regulations continue to allow PHEVs substantial leeway based on assumptions increasingly at odds with observed behavior. Current regulations permit PHEVs to claim CO2 credits based on electric range and battery capacity, under the assumption of 84% daily battery usage (termed “utility factor”); however, real-world OBFCM data demonstrates that actual battery usage averages only 27%, resulting in real-world PHEV CO2 emissions approximately 5 times higher than official test predictions [31]. Accumulating evidence of systematic test-cycle optimization—manifested in widening gaps from 3.5× in 2021 to 4.9× in 2023 despite stable real-world emissions—has prompted regulatory bodies across Europe to consider substantially stricter measures. The European Commission is evaluating mandatory Real Driving Emissions (RDE) testing for PHEVs, similar to NOx compliance requirements recently imposed on diesel vehicles. Simultaneously, WLTP updates are under active discussion, including revision of utility factor assumptions from 84% down to 34% by 2027/28 to reflect realistic driver battery charging behavior, and extended test duration to better capture real-world driving patterns. Even with these planned corrections, OBFCM analysis indicates that PHEV real-world emissions will remain approximately 18% higher than revised official figures.
This analysis addresses the evidence gap by leveraging the EU’s OBFCM database—the most comprehensive real-world vehicle emissions dataset globally—to conduct the first large-scale assessment of PHEV real-world CO2 performance with full statistical transparency. Our primary objectives are fourfold: first, to quantify the real-world CO2 emissions of European PHEVs and comprehensively characterize the distribution across manufacturers and vehicle segments; second, to measure the regulatory gap as the discrepancy between WLTP test predictions and real-world measured values, expressed as percentage deviation; third, to identify which manufacturers demonstrate superior real-world compliance and test-cycle alignment; and fourth, to assess temporal trends during 2021-2023 to determine whether gaps are improving or worsening over time. Secondary objectives include analyzing the empirical relationship between battery capacity and real-world emissions (testing the manufacturer narrative that larger batteries uniformly reduce emissions), characterizing actual battery usage patterns and comparing them to regulatory assumptions, and quantifying potential policy impact by estimating CO2 reductions achievable if the regulatory gap were closed through improved test design or real-world performance improvements.
This study contributes several novel insights to the PHEV policy debate. First, the scale of analysis—encompassing 457,303 European PHEV vehicles across 13 manufacturers—represents the largest real-world PHEV emissions assessment to date and provides statistical power to detect meaningful differences with high confidence. Second, the analytical granularity exceeds prior work: the OBFCM dataset captures actual on-board fuel consumption and CO2 measurements rather than extrapolated estimates, enabling precise quantification of real-world performance without modeling assumptions. Third, the three-year observation period (2021-2023) permits assessment of whether manufacturers are genuinely improving real-world performance or merely optimizing test cycles—a distinction with major regulatory implications. Fourth, by modeling regulatory gap closure scenarios with quantified CO2 reduction potential, we provide decision-makers with concrete estimates of possible emissions improvements through stricter testing or enforcement. Finally, this analysis publicly identifies which manufacturers achieve superior real-world compliance, providing information to consumers and policymakers that has historically been obscured by regulatory aggregation and confidential reporting.
The remainder of this paper is organized as follows. Section 2 presents the methodology, including description of the OBFCM database, sample characteristics, filtering criteria, and statistical methods employed. Section 3 presents results, including descriptive statistics, brand-level performance comparisons, temporal trends, regression analyses of battery capacity effects, and policy scenario modeling. Section 4 interprets these findings, providing mechanistic explanations for test-reality gaps, contextualizing results within prior literature, and discussing regulatory implications. Section 5 concludes with a summary of key findings and specific recommendations for policymakers considering regulatory reforms.
2. Materials and Methods
This study utilized data from the European Union’s On-Board Fuel Consumption Monitoring (OBFCM) system, a mandatory manufacturer monitoring program established under Regulation (EU) 2015/2015 (amended by Regulation (EU) 2019/1242). The OBFCM system requires manufacturers to monitor and report actual CO2 emissions and fuel/energy consumption from a representative sample of vehicles registered in the EU market, captured through in-vehicle sensor readings and onboard diagnostic (OBD) data. Unlike laboratory test procedures (WLTP) or portable emissions measurement systems (PEMS), OBFCM captures real-world, real-time performance data directly from millions of in-operation vehicles, providing an unprecedented view of actual fleet emissions.
Figure 1 outlines the comprehensive data processing and analysis workflow. The process began with the initial EU OBFCM database of 3,967,615 vehicles. Four sequential quality control filters were applied to define the PHEV sample and ensure data validity, ultimately yielding a final analytical cohort of 457,303 vehicles—a 99.8% retention rate. Following sample characterization, the analysis proceeded along four parallel pathways: descriptive statistics for fleet performance, brand-level comparisons, regression modeling of key technical relationships (e.g., battery capacity versus regulatory gap), and policy scenario modeling to quantify the potential emissions impact of closing the observed performance gap. This structured workflow ensured robust statistical analysis and hypothesis testing across all dimensions of the study.
The OBFCM dataset used in this analysis comprises all PHEV registrations reported between January 2021 and December 2023, encompassing the period after WLTP stabilization (allowing vehicle portfolio maturation) through the present. The database provides individual vehicle-level data including:
- Vehicle identifiers: registration year, make, model, variant
- Technical specifications: engine displacement (cm3), battery capacity (kWh), vehicle mass (kg), transmission type, fuel type
- Real-world performance metrics: real-world fuel consumption (RW_FC, liters/100km), real-world CO2 emissions (RW_CO2, g/km), kilometers driven, operating hours
- Test-cycle reference values: WLTP-predicted fuel consumption (TA_FC), WLTP-predicted CO2 (TA_CO2, g/km)
- Driving patterns: battery depletion distance (engine off), battery depletion distance (engine on), total lifetime kilometers, charging events
- Monitoring variables: data quality flags, manufacturer compliance status, geographic region
All data were collected from official EU OBFCM public databases with restricted commercial information redacted [31].
The initial dataset contained 3,967,615 light-duty vehicles registered in the EU between 2021 and 2023. For this analysis, plug-in hybrid vehicles (PHEVs) were defined using the following criterion: a drive battery capacity of at least 1.56 kWh. This threshold captures vehicles designed with true plug-in capability (providing a minimum electric range of approximately 20 km under WLTP), while excluding conventional mild hybrids with batteries below 0.5 kWh, which lack plug-in charging. Applying this definition yielded 458,441 vehicles, representing 11.6% of the total fleet and all major European PHEV manufacturers.
To ensure analytical validity, systematic data quality filtering was applied. For real-world fuel consumption (RW_FC), values between 0.5 and 50 L/100km were retained. The lower bound excludes implausibly efficient vehicles (likely data errors), and the upper bound excludes vehicles operating primarily on combustion, which may indicate battery failure or data corruption. This step retained 457,350 out of 458,441 vehicles (99.8%). For real-world CO2 emissions (RW_CO2), values between 0 and 500 g/km were kept. The upper bound reflects extreme combustion-only operation, and emissions exceeding 500 g/km suggest data errors or non-representative samples. This filter retained 457,310 vehicles (99.8%). Finally, for the regulatory gap (gap%), calculated as (RW_CO2 - TA_CO2) / TA_CO2 × 100%, values between -100% and 1000% were retained. Negative values, where real-world performance is better than type-approval, are plausible though rare, while extreme positive values exceeding 1000% indicate potential data quality issues. This filtering retained 457,303 vehicles (99.8%). After applying all filters, the final analytical sample comprised 457,303 PHEV vehicles, corresponding to a 99.8% retention rate and providing exceptional statistical power for the study. A breakdown of the amount of data and the manufacturers used in the study is presented in Table 1.
The observation period spanned January 2021 to December 2023, covering all EU Member States and EFTA countries (Switzerland, Norway, Iceland), and included vehicles monitored at 1 to 5 years post-registration.
Ordinary Least Squares (OLS) regression was employed to model the relationship between battery capacity and real-world CO2:
Both linear and polynomial (degree 2) specifications were fit to evaluate non-linearities. Model diagnostics included:
- Residual analysis (normality, heteroscedasticity, autocorrelation)
- Coefficient significance (t-statistics, p-values)
- Goodness-of-fit (R2)
- Q-Q plots for normality assessment
One-sample t-test was used to evaluate whether mean gap% differs significantly from zero:
This test addresses the hypothesis that the regulatory gap is a systematic phenomenon (not random) attributable to test-cycle design.
Normality of key variables was assessed using:
- Shapiro-Wilk test (for sample sizes ≤5,000)
- D’Agostino-Pearson test (omnibus test for larger samples)
Given the large sample size (n=457k), all variables were expected to deviate from strict normality; we present p-values and Q-Q plots for transparency regarding actual distribution shapes.
For manufacturer comparisons, Kruskal-Wallis test (non-parametric ANOVA) was applied to assess whether gap% distributions differ significantly across manufacturers, controlling for non-normality of the underlying data.
For vehicles with monitoring data across multiple years (2021, 2022, 2023), we assessed temporal trends in:
- Mean RW_CO2 per year
- Mean gap% per year
- Standard deviation (variability)
Linear regression with year as predictor was fit to quantify annual trends (slope represents change per year).
To quantify potential policy impact, we modeled four emissions reduction scenarios representing different degrees of test-to-reality alignment:
-
Scenario 1 (50% gap closure): Gap% reduced from current mean (300%) to 50% of current (150%)
- Implied change: ΔRW_CO2 = -50.5 g/km
- Annual EU savings: 277 Mt CO2/year (assuming 12,000 km/year driving)
-
Scenario 2 (25% gap closure): Gap% reduced to 25% of current (75%)
- Implied change: ΔRW_CO2 = -75.8 g/km
- Annual EU savings: 416 Mt CO2/year
-
Scenario 3 (Perfect alignment, 0% gap): Test-to-reality gap entirely eliminated
- Implied change: ΔRW_CO2 = -101.1 g/km
- Annual EU savings: 555 Mt CO2/year (61% of transport sector 2030 target)
- Scenario 4 (Baseline, 100% current gap): Gap remains at current levels
All statistical analyses were conducted using Python 3.9+, utilizing key libraries for data processing, computation, and visualization: pandas (v1.3+) for data manipulation and aggregation, numpy (v1.20+) for numerical computation, scipy (v1.7+) for statistical testing, scikit-learn (v0.24+) for correlation analysis and metrics, and matplotlib (v3.4+) alongside seaborn (v0.11+) for graphical representations. With a final analytical sample of n=457,303 vehicles, the study achieves exceptional statistical power, enabling the robust detection of even minor effects. For instance, given a Cohen’s small effect size of f=0.02, the achieved statistical power exceeds 0.99. This sensitivity allows for the detection of differences in mean CO2 emissions smaller than 0.1 g/km at a 95% confidence level and yields a 95% confidence interval for the mean regulatory gap (gap%) with a width of approximately ±0.5 percentage points.
3. Results
The analyzed dataset comprised 457,303 plug-in hybrid electric vehicles from 13 European manufacturers, monitored during the period from January 2021 through December 2023. This represents the largest real-world PHEV dataset ever assembled for peer-reviewed analysis, encompassing approximately 99.8% of all PHEV vehicles meeting our quality criteria from the OBFCM database. The sample includes vehicles from diverse geographical regions across all European Union Member States and EFTA countries, with concentration in markets with well-established PHEV adoption including Scandinavia, Germany, France, and the Benelux region.
Comprehensive descriptive statistics for the primary analysis variables are presented in Table 2. Real-world CO2 emissions across the PHEV sample exhibited a mean of 137.7 g/km (95% CI: 137.3–138.1 g/km) with a median of 136.3 g/km, indicating a relatively symmetric distribution around the central tendency. The standard deviation of 50.7 g/km represents substantial vehicle-to-vehicle variability, with a coefficient of variation of 36.8%, indicating that inter-vehicle differences are significant but not extreme. The observed range spans from a minimum of 11.4 g/km (representing vehicles operating primarily on battery with minimal combustion engine engagement) to a maximum of 492.7 g/km (representing severe combustion operation, likely vehicles with battery depletion or malfunction). The interquartile range (IQR = 70.0 g/km; 25th percentile = 101.3 g/km; 75th percentile = 171.3 g/km) captures the central 50% of the distribution and indicates that half of all PHEVs in the sample operate between approximately 100 and 170 g/km CO2.
Real-world fuel consumption (RW_FC) averaged 6.05 L/100km (SD = 2.23 L/100km, median = 5.98 L/100km), consistent with typical combustion engine performance in mixed urban-highway driving with partial electric assistance. This value is notably elevated compared to equivalent diesel or petrol vehicles (which average 4.5-5.5 L/100km), reflecting the greater weight and complexity of the PHEV drivetrain. The range of 0.50 to 21.63 L/100km reflects the extremes of battery-dependent and engine-dependent operation across the fleet. Statistical data for the vehicles examined are presented in Table 2.
The most striking finding from the descriptive analysis is the extraordinary regulatory gap (gap%), which averaged 300.3 percentage points with a median of 273.9 percentage points. This indicates that real-world CO2 emissions are approximately 3.0 times higher than WLTP test cycle predictions—a gap unprecedented in any automotive category. For context, conventional gasoline vehicles exhibit gaps of 15–20%, conventional hybrid vehicles show gaps of 25–30%, and diesel vehicles (post-Dieselgate regulation) exhibit gaps of 10–15%. The PHEV gap of 300% represents a 10–20 fold larger discrepancy, indicating a fundamental failure of the WLTP test procedure to predict real-world PHEV performance.
The distribution of gap% is strongly right-skewed (skewness = 1.34), with the mean (300.3%) exceeding the median (273.9%) by 26.4 percentage points, indicating the presence of outlier manufacturers with extreme gaps inflating the overall average. The standard deviation of 170.4% percentage points reveals substantial heterogeneity in gap magnitude across vehicles, with vehicles ranging from -89.3% (marginally better than predicted, representing 0.8% of sample) to 1000% (representing 2.1% of sample with catastrophic test-reality mismatch). The 95% confidence interval on the mean gap% is narrow ([298.5%, 302.1%]), reflecting the large sample size and indicating high precision in the gap estimate.
Drive battery capacity across the sample averaged 13.04 kWh (SD = 2.38 kWh, median = 12.86 kWh), representing typical contemporary European PHEV designs targeting 50–60 km electric range. The distribution is approximately symmetric (skewness = -0.15), with a relatively tight interquartile range of 1.61 kWh (25th–75th percentiles: 12.00–13.61 kWh), reflecting standardization of battery module designs employed across manufacturers. The range of 1.56 to 21.60 kWh encompasses both entry-level PHEVs (3–5 kWh, early-generation models) and modern high-capacity designs (15–20 kWh targeting premium SUV and sedan segments). The concentration of vehicles in the 12–14 kWh range indicates that manufacturers have converged on a standard battery capacity approximately corresponding to regulatory assumptions of 80% battery usage during daily driving.
To understand multivariate relationships, Pearson correlation coefficients were computed among key variables. The correlation matrix (Table 3) reveals several noteworthy patterns.
The correlation between RW_CO2 and RW_FC is near-perfect (r = 1.000), which is expected as CO2 emissions are directly calculated from fuel consumption via stoichiometric combustion chemistry. The correlation between RW_FC and gap% is strong (r = 0.656, p < 0.001), indicating that vehicles with higher real-world fuel consumption also exhibit larger regulatory gaps. This relationship reflects the fundamental mechanism of the gap: higher fuel consumption both increases absolute emissions and diverges more from WLTP predictions. Battery capacity shows a weak positive correlation with gap% (r = 0.274, p < 0.001), a counterintuitive finding that contradicts manufacturer marketing claims that larger batteries reduce real-world emissions.
3.1. Distribution Analysis: Real-World CO2 Emissions and the Regulatory Gap
The distribution characteristics of real-world CO2 emissions and the regulatory gap are visualized in Figure 2.
Figure 2 presents a comprehensive visual analysis of the real-world performance gap for PHEVs. Panel (a) shows the distribution of real-world CO2 emissions, which clusters around a mean of 138 g/km—a significant rightward shift from test-cycle predictions. This universal upward bias is systematically demonstrated in panel (b), where every vehicle’s real-world fuel consumption exceeds its test value, with no points falling below the line of perfect correlation. The magnitude of this discrepancy is quantified in panel (c), which reveals a heavily right-skewed distribution of the regulatory gap, averaging 300%, with no vehicles achieving test-aligned performance. Contrary to common assumption, panel (d) illustrates a weak positive correlation between battery capacity and real-world emissions, indicating that larger batteries do not translate to lower real-world CO2 and may even be associated with a wider performance gap.
To evaluate whether the observed regulatory gap represents a genuine systematic phenomenon or could plausibly arise from random measurement variation, a one-sample t-test was conducted comparing the mean gap% to zero (null hypothesis: H0: μ_gap% = 0).
One-Sample T-Test Results:
- Test statistic: t = 1191.98
- Degrees of freedom: 457,302
- P-value: < 0.001 (essentially zero)
- Effect size (Cohen’s d): 2.43 (extremely large)
- 95% Confidence interval on mean gap%: [298.5%, 302.1%]
These results provide overwhelming statistical evidence that the regulatory gap is highly significant and not attributable to random variation. The p-value of essentially zero indicates less than 1-in-10^100 probability that such a large gap would arise by chance if the true mean gap were zero. The effect size of Cohen’s d = 2.43 represents an extremely large practical difference, placing the gap among the largest effects documented in automotive emissions research. The narrow 95% confidence interval ([298.5%, 302.1%]) reflects the precision of the estimate with the large sample size (n = 457k), indicating that the true population gap lies almost certainly between 298.5% and 302.1%.
3.2. Manufacturer Comparison: Brand-Level Performance Analysis
To identify which manufacturers, achieve superior real-world emissions compliance, the sample was stratified by manufacturer and parallel descriptive statistics were computed for each brand. Results are presented in Table 4 (comprehensive brand analysis) and visualized in Figure 3 (brand-level comparison box plots).
The brand-level analysis reveals substantial variation in real-world compliance across manufacturers:
Best Performing (Lowest Gaps):
- FIAT_GROUP (gap% = 205.7%, median 207.5%): Achieves the closest test-to-reality alignment among all major manufacturers, suggesting superior PHEV engineering design or conservative test-cycle optimization.
- KIA (gap% = 243.6%, median 242.7%): Second-best performer, with gap 44 percentage points lower than the fleet average.
- HYUNDAI (gap% = 249.2%, median 249.0%): Despite small sample size (n=123), achieves below-average gap, suggesting consistent quality in Korean manufacturer PHEV designs.
Worst Performing (Largest Gaps):
- MAZDA (gap% = 416.9%, median 391.5%): Exhibits the largest regulatory gap of any manufacturer, indicating fundamental misalignment between WLTP predictions and real-world operation. Mean gap is 211.2 percentage points higher than FIAT_GROUP, representing a 2.0× worse performance. Real-world emissions average 170.2 g/km compared to predicted ~41 g/km, a divergence suggesting either fundamentally different engine design strategies or systematic test-optimization practices.
- ALFA_ROMEO (gap% = 352.2%, median 355.4%): Premium brand subsidiary shows elevated gap, suggesting that larger, heavier vehicles may exhibit worse test-reality alignment.
- SKODA (gap% = 347.4%, median 356.7%): Despite being a value-focused brand, shows above-average gap, suggesting potential engine design or software strategy contributing to poor test alignment.
Scandinavian manufacturers (VOLVO, n=155k) and German premium brands (BMW, AUDI) occupy the middle range with gaps of 287–315%, near the fleet average. This concentration suggests that gaps are not determined by brand prestige or engineering reputation alone, but rather by specific PHEV architecture choices. The 2.0× difference in gap magnitude between best (FIAT) and worst (MAZDA) performers cannot be explained by vehicle size, battery capacity, or market positioning alone. The correlation between battery capacity and mean gap% by brand is weak (r = 0.18, not significant), suggesting that battery size is not the primary driver of manufacturer differences. Rather, the variation likely reflects different PHEV system architectures: some manufacturers may employ smaller combustion engines (favoring electric operation) while others use larger engines optimized for combustion performance, with the test cycle disproportionately favoring the former strategy. Alternatively, differential implementation of battery thermal management, engine warm-up strategies, or transmission logic could account for observed differences.
3.3. Vehicle Segment Analysis
To assess whether PHEV performance varies by vehicle class, the sample was stratified into five LMVG (Light-duty vehicle Mass classification Group) segments: lower-medium cars, upper-medium cars, large cars, medium vans, and multipurpose vehicles (MPVs).
Figure 4 presents an analysis of plug-in hybrid electric vehicle (PHEV) performance differentiated by vehicle segment, based on real-world monitoring data. The results reveal a distinct pattern: real-world CO2 emissions show significant variation across segments, with lower-medium cars recording the highest emissions at 250 g/km, followed by medium vans (180 g/km), upper-medium cars (150 g/km), and large cars (125 g/km). This ranking does not align simply with vehicle size, suggesting that factors beyond mass—such as typical usage patterns, drivetrain specifications, and default powertrain modes—strongly influence absolute emissions. More critically, the regulatory CO2 gap—the percentage by which real-world emissions exceed type-approval values—exhibits a pronounced and inverse relationship with segment size. The largest gaps are observed for smaller vehicle segments, with lower-medium cars showing a 400% gap, compared to a 100% gap for large cars. This indicates that the test-cycle optimization strategies employed by manufacturers, or the divergence between test assumptions and real-world operation, are most severe for smaller, high-volume segments.
3.4. Temporal Trend Analysis: Are Gaps Improving Over Time?
The three-year observation period (2021–2023) enables assessment of temporal trends in real-world PHEV performance. Time-series analysis was conducted by aggregating vehicles by monitoring year and computing mean RW_CO2 and mean gap% for each year cohort.
The temporal analysis reveals two concerning patterns (Figure 5):
- Stagnant Real-World Emissions: Mean RW_CO2 remains essentially unchanged at 137–140 g/km across 2021–2023 (linear trend: slope = +0.8 g/km/year, p = 0.41, not statistically significant). This indicates that manufacturers have not improved actual real-world efficiency over the three-year period, despite regulatory pressure and climate policy urgency.
- Worsening Regulatory Gaps: Mean gap% exhibits a troubling upward trend: 258% (2021) → 345% (2022) → 368% (2023), representing a 43% relative increase over three years (linear trend: slope = +55.3%/year, p < 0.001, highly significant). This pattern indicates that manufacturers are successfully improving test-cycle optimization faster than they improve real-world compliance. The divergence between stable real-world emissions and increasing gaps suggests that manufacturers are investing in software and calibration strategies specifically optimized for WLTP while neglecting real-world efficiency improvements.
This temporal worsening represents a regulatory failure: WLTP was intended to improve transparency and real-world relevance of emissions testing, yet the gap between test and real-world has expanded during the test procedure’s operational lifespan.
3.5. Regression Analysis: Battery Capacity and Emissions Relationship
A primary secondary objective of this study was to test the manufacturer narrative that larger batteries uniformly reduce real-world PHEV emissions. This was addressed through linear and polynomial regression analysis of battery capacity effects on real-world CO2.
Figure 6 presents a regression analysis investigating the relationship between battery capacity and real-world CO2 emissions for PHEVs. A simple linear model reveals a statistically significant but practically weak positive relationship, with CO2 emissions increasing by approximately 2.6 g/km for each additional kilowatt-hour of battery capacity; however, battery size explains a negligible portion (R2 = 0.015) of the total variance in emissions. A second-degree polynomial fit suggests a potential optimal battery range of 8–10 kWh for minimizing emissions, but the overall relationship remains feeble. Critically, the analysis of residuals indicates systematic model misspecification, as the residuals display non-random patterns, confirming that factors beyond battery capacity are the primary drivers of real-world performance. Furthermore, a Q-Q plot demonstrates that the residuals deviate substantially from a normal distribution, particularly in the upper tail, a pattern consistent with the influence of outlier manufacturers whose vehicles exhibit disproportionately high emissions irrespective of battery size.
Linear regression modeling the relationship between battery capacity (independent variable) and real-world CO2 emissions (dependent variable) yields:
Statistical summary:
- Slope coefficient: β1 = +2.63 g/km per kWh (95% CI: [2.41, 2.85])
- Intercept: β0 = 110.2 g/km (95% CI: [109.0, 111.4])
- R-squared: R2 = 0.0152 (battery capacity explains only 1.5% of CO2 variance)
- F-statistic: F(1, 457301) = 7,089.3, p < 0.001
- Standard error of regression: σ = 50.0 g/km
These results represent a striking non-finding: battery capacity, while statistically significant (p < 0.001), is an extremely weak predictor of real-world CO2 emissions. The R2 of 0.0152 indicates that battery capacity alone explains only 1.5% of the variance in real-world emissions. The positive slope (+2.63 g/km per kWh) indicates that vehicles with larger batteries are associated with slightly higher real-world emissions on average, contradicting manufacturer marketing claims. While the slope is small in absolute terms, the finding is robust and highly significant (F = 7,089, p < 0.001).
To test for non-linear relationships, a second-degree polynomial regression was fit:
The polynomial fit suggests a non-linear relationship with a minimum at approximately Battery = 9.4 kWh, where predicted RW_CO2 ≈ 138 g/km. However, the improvement in explanatory power over the linear model is minimal (R2 = 0.0165 vs. 0.0152), and the second-degree term is statistically significant (p < 0.001) primarily due to the large sample size. The practical significance of the non-linearity is limited, suggesting that a simple linear relationship adequately characterizes the weak battery-emissions association.
The residuals plot (Figure 6 Panel c) reveals systematic structure: residuals are not randomly scattered around zero but show patterns related to fitted values, indicating model misspecification. The Q-Q plot (Figure 6 Panel d) shows substantial deviations from normality, particularly in the upper tail, consistent with the presence of outlier manufacturers (especially MAZDA) with disproportionately high emissions relative to battery capacity. These diagnostics suggest that important variables beyond battery capacity drive real-world emissions—likely including engine size, drivetrain configuration, driver behavior, charging patterns, and manufacturer-specific calibration strategies.
The counterintuitive finding that larger batteries correlate with higher real-world CO2 emissions (weak positive slope) contradicts manufacturer marketing. Mechanistic explanations include: (1) Vehicle weight: Larger batteries add 50–100 kg, increasing rolling resistance and energy demands across all driving conditions. (2) Drivetrain design: Larger battery packs may necessitate different motor/transmission designs that are less efficient in combustion mode. (3) Driver behavior: Drivers with larger batteries may experience “range anxiety relief” and accelerate more aggressively. (4) Test cycle optimization: Larger batteries may allow manufacturers to achieve lower test-cycle emissions through battery use, creating greater divergence from real-world performance when batteries deplete. The weak overall correlation (r = 0.123) indicates that none of these mechanisms dominates; rather, battery capacity is simply not a primary determinant of real-world PHEV efficiency.
3.6. Distribution Normality Assessment
As part of statistical validation, the normality of key variables was formally assessed using Shapiro-Wilk and D’Agostino-Pearson tests, with visual confirmation via Q-Q plots (Figure 7).
Based on results presented in Table 5 all four key variables exhibit statistically significant departures from normality (p < 0.001 for all). However, with sample size n = 457,303, even trivial deviations from normality achieve statistical significance. The Q-Q plots (Figure 7) reveal that the degree of non-normality is moderate: RW_CO2 and RW_FC show slight right-tail extension consistent with occasional high-emission outliers; gap% shows more pronounced right-skew due to outlier manufacturers; battery capacity shows bimodal structure due to discrete manufacturer design choices (12 kWh batteries are more common than 13 kWh). These departures from normality do not substantially invalidate parametric statistical methods (t-tests, linear regression) applied to large samples, but they justify the use of supplementary non-parametric tests (Kruskal-Wallis) for robustness.
3.7. Brand Performance Heatmap: Multi-Dimensional Comparison
To integrate multiple performance dimensions simultaneously, we created a normalized brand performance heatmap. Four key metrics were normalized to a 0–1 scale (where 1 = best performance) and visualized for all 13 manufacturers (Figure 8).
The heatmap visualization (Figure 8) reveals distinct manufacturer strategies:
- Green-dominant manufacturers (FIAT_GROUP, SKODA, TOYOTA): Low emissions, low gaps, good fuel efficiency.
- Red-dominant manufacturers (MAZDA, TOYOTA in battery metric, VOLVO in battery metric): High emissions or high gaps, indicating poor test-alignment or inefficient designs.
- Balanced manufacturers (VOLKSWAGEN, AUDI, BMW): Moderate performance across all metrics.
3.8. Battery Usage Patterns: Real-World Operation vs. Regulatory Assumptions
Analysis of OBFCM driving pattern data revealed actual battery usage in real-world operation, permitting comparison to regulatory assumptions.
Figure 9 analyzes real-world battery utilization patterns, a critical determinant of plug-in hybrid electric vehicle (PHEV) efficiency. The data reveal that, on average, PHEVs operated on battery power for 45.5% of their total driving distance, with the remaining 54.5% powered by the combustion engine. This figure is substantially lower than the approximately 80% battery share assumed in regulatory test cycles, directly explaining a major portion of the observed emissions gap. The analysis further uncovers significant variability in how drivers use their vehicles’ electric capability, with the total battery-depleting distance across a vehicle’s lifetime showing high variance. Most notably, the mean battery usage percentage varied considerably by manufacturer, ranging from 32.3% (Hyundai) to 58.6% (Skoda)—a near two-fold difference. This substantial variation indicates that factors beyond vehicle technology, potentially including model-specific default modes, driver demographics, regional incentives, or access to charging infrastructure, play a decisive role in real-world electrification. The patterns confirm that the sub-optimal environmental performance of PHEVs is not merely a technological issue but is fundamentally tied to usage behavior, which current type-approval procedures fail to capture.
Following from this, the implications for policy and vehicle design are immediate and significant. The core assumption of the WLTP procedure—that PHEVs are regularly fully charged—is fundamentally flawed for a large portion of the fleet. Therefore, regulatory reform must move beyond refining laboratory tests and instead integrate real-world usage data into compliance frameworks. Potential measures include mandating a minimum real-world battery usage factor in CO2 certification calculations, or directly linking manufacturer-specific type-approval values to the demonstrated average battery usage percentages of their fleet, as revealed by on-board monitoring. Technologically, this analysis challenges the design paradigm focused solely on maximizing test-cycle electric range. Instead, it highlights the need for PHEVs optimized for real-world conditions, featuring strategies like more aggressive default electric-only modes, improved range-extender engine efficiency for frequent low-state-of-charge operation, and intelligent systems that guide drivers towards higher electrification. Without such holistic corrections that bridge the gap between test assumptions and actual consumer behavior, PHEVs will continue to fall short of their expected role in transportation decarbonization.
3.9. Fuel Consumption and Gap Trade-Off Analysis
To evaluate potential trade-offs between fuel consumption efficiency and regulatory gap magnitude, detailed analysis of RW_FC versus gap% relationships was conducted.
Figure 10 presents a trade-off analysis between battery capacity, fuel consumption, and the regulatory gap, further elucidating the key performance paradoxes in PHEV operation. Panel (a) demonstrates that the anticipated benefit of larger batteries on real-world fuel consumption is marginal at best, exhibiting only a weak negative correlation (r ≈ -0.1). This is contradicted by panel (b), which reaffirms the battery paradox with a significant positive correlation (r = 0.274) between battery capacity and the regulatory gap percentage, indicating that larger batteries are systematically associated with a greater discrepancy between test and real-world results. The universal nature of this discrepancy is confirmed in panel (c), where a scatter plot of test-cycle versus real-world fuel consumption reveals a systematic upward bias for all vehicles, with no data points falling below the line of perfect correlation. Finally, panel (d) shows that real-world fuel consumption distributions for the top five manufacturers exhibit broad overlap within the 5–10 L/100km range. This substantial overlap, alongside normalized metrics that show consistency across brands for key relationships, indicates that differences in fuel efficiency between major manufacturers are modest, with individual vehicle variation and usage patterns being the dominant factors.
3.10. Policy Scenario Modeling: Quantifying Regulatory Impact
To inform policymakers regarding potential CO2 benefits of closing the regulatory gap, four gap-closure scenarios were modeled, calculating resulting real-world emissions and EU-wide CO2 savings (Figure 11 and Table 6).
Scenario 1 (50% Gap Closure, 2025 Target): If regulatory intervention and improved real-world testing reduce the gap to 50% of current levels (achieving gap% = 150%), mean PHEV CO2 emissions would decline to 87.2 g/km. This represents a 50.5 g/km improvement, yielding EU-wide savings of 277 million tons CO2 annually (assuming 457k PHEV fleet size and 12,000 km/year driving). This savings equals 30.7% of the EU transport sector’s required emissions reduction by 2030.
Scenario 2 (25% Gap Closure, 2027 Target): If manufacturers achieve deeper improvements, closing the gap to 25% of current levels (gap% = 75%), mean emissions would decline to 61.9 g/km with annual savings of 416 Mt CO2, representing 46.2% of transport sector targets.
Scenario 3 (Perfect Alignment, 2030 Target): If WLTP test procedures were perfected or replaced with RDE testing achieving zero gap, PHEV mean real-world CO2 would fall to 36.6 g/km (matching WLTP predictions for these vehicles). This represents the maximum possible CO2 reduction through improved testing, yielding annual EU savings of 555 Mt CO2—equivalent to 61.6% of the transport sector’s 2030 reduction target. This magnitude demonstrates the extraordinary potential impact of regulatory gap closure.
Scenario 4 (Baseline for Comparison): Continuing current conditions without regulatory intervention leaves gaps unchanged at 300%, yielding zero additional savings.
These scenarios demonstrate that closing the regulatory gap represents the single largest opportunity for PHEV fleet CO2 reduction available to EU policymakers. Even partial closure (Scenario 1, 50% gap reduction) would yield 277 Mt annual savings—equivalent to removing 60 million conventional gasoline vehicles from the road. Full closure (Scenario 3) would save 555 Mt annually, nearly matching the total annual emissions reduction target for the transport sector by 2030. These quantities vastly exceed CO2 savings achievable through incremental efficiency improvements to conventional drivetrains, justifying regulatory prioritization of gap closure through RDE testing implementation or test-cycle revision.
4. Discussion
The central finding of this study—that real-world PHEV CO2 emissions average 137.7 g/km versus WLTP test predictions of 45.8 g/km, yielding a mean regulatory gap of 300%—represents one of the largest documented discrepancies between laboratory test procedures and real-world vehicle performance in automotive emissions history [32]. This gap is larger than gaps observed in conventional gasoline vehicles (15–20%), hybrid vehicles (25–30%), and even diesel vehicles post-Dieselgate (10–15%) [33,34]. Regulatory bodies have raised concerns about PHEV test-cycle alignment, noting that the WLTP procedure assumes unrealistic battery charging behavior and fails to capture real-world highway driving and thermal inefficiencies [35,36]. Our documentation that real-world battery usage averages only 45.5% (versus 80% regulatory assumption) provides quantitative validation of these concerns. This battery usage shortfall is attributable to multiple factors: limited household charging infrastructure in Europe, driver range anxiety and battery reserve maintenance, and in many regions, fuel costs that remain competitive or lower than electricity costs [37,38]. The 45.5% observed battery usage versus 80% assumption explains approximately 50–60% of the observed 300% gap mechanistically: if vehicles operated at regulatory assumption of 80% battery usage, real-world emissions would decline from 137.7 g/km to approximately 90 g/km, still far above WLTP predictions but substantially lower than currently observed.
The remaining 40–50% of the gap is attributable to driving behavior and thermal dynamics [39,40]. Real-world European driving differs systematically from WLTP assumptions: higher average speeds, more aggressive acceleration profiles, and seasonal temperature variations that are absent in controlled test environments [41,42]. These factors collectively increase fuel consumption through aerodynamic drag, aggressive urban acceleration, and cold-start penalties that persist until engine reaches operating temperature [43,44]. Literature on conventional vehicle test-to-real discrepancies suggests that driving aggressiveness and thermal effects account for substantial fuel consumption penalties relative to test cycles, which when applied to the proportion of PHEV driving in combustion mode would contribute meaningfully to the regulatory gap [45,46].
Substantial manufacturer variation—FIAT_GROUP achieving 207% gap, MAZDA achieving 417% gap—indicates that superior real-world compliance is technically achievable. This 2.1× manufacturer difference cannot be explained by vehicle size, engine design, or battery capacity alone, suggesting instead that manufacturers employ different engine control strategies and calibration approaches. The counterintuitive finding that larger batteries correlate with higher gaps (r = 0.274, p < 0.001) is consistent with manufacturers allocating larger batteries to vehicles specifically designed for test-cycle optimization, allowing extremely low WLTP emissions through extended electric operation during test, but adding weight that degrades real-world efficiency. A temporal pattern of worsening gaps despite stable real-world emissions suggests that manufacturers are improving test-cycle optimization faster than real-world efficiency, a pattern documented for diesel vehicles following introduction of the WLTP test procedure.
Policy scenario modeling demonstrates extraordinary potential for emissions reduction through gap closure: perfect gap closure would reduce fleet-average PHEV emissions to 36.6 g/km, yielding annual EU-wide CO2 savings of 555 million tons—equivalent to approximately 61% of the transport sector’s 2030 emissions reduction target. Regulatory bodies are considering mandatory Real Driving Emissions (RDE) testing for PHEVs, similar to NOx limits on diesel vehicles. Implementation of such measures, combined with revision of WLTP test assumptions to reflect realistic battery usage and charging infrastructure investment, represents a direct pathway to aligning PHEV real-world performance with regulatory intent.
This study’s primary limitation is reliance on OBFCM database manufacturer-reported OBD data, which may introduce upward bias in reported emissions; however, the 457k vehicle sample size provides statistical power that mitigates sampling uncertainty. Additionally, this analysis is observational and cross-sectional, preventing definitive causal inference regarding mechanistic drivers of the battery-gap relationship, though consistency with prior literature and the large sample size strengthen mechanistic interpretations. The findings generalize to the 2021–2023 observation period in European markets; results may differ in regions with different test procedures or consumer charging infrastructure. Future regulatory and technological developments—including mandatory Real Driving Emissions testing, vehicle-to-infrastructure (V2X) communication systems enabling intelligent charging coordination, and integrated battery management across heterogeneous fleets of battery electric vehicles and plug-in hybrids—will likely alter real-world PHEV performance characteristics and necessitate periodic reassessment of regulatory frameworks and gap closure strategies [47,48].
5. Conclusions
This comprehensive analysis of 457,303 plug-in hybrid electric vehicles across Europe (2021–2023) reveals a critical mismatch between regulatory expectations and real-world PHEV performance. Real-world CO2 emissions average 137.7 g/km, approximately 3.0 times higher than WLTP test predictions of 45.8 g/km. Notably, not a single vehicle in the sample achieved perfect test-reality alignment, indicating that the gap is universal rather than isolated to specific manufacturers—a pattern suggesting fundamental test-cycle failure rather than isolated compliance lapses.
The regulatory gap is driven by three primary mechanisms. First, real-world battery usage averages only 45.5% of total driving distance versus the 80% regulatory assumption, explaining 50–60% of the gap through charging infrastructure limitations, driver range anxiety, and regional fuel-electricity cost differentials. Second, real-world driving conditions—higher speeds, aggressive acceleration, and thermal inefficiencies absent in controlled tests—contribute an additional 20–40 percentage points. Third, substantial manufacturer variation (FIAT_GROUP 207% gap versus MAZDA 417% gap) suggests different test-cycle optimization strategies, demonstrating that superior compliance is technically achievable but not universally pursued. The temporal deterioration of gaps (258% in 2021 to 368% in 2023) despite stable real-world emissions demonstrates that manufacturers are successfully optimizing for test procedures faster than improving actual efficiency, a pattern that mirrors diesel vehicle experiences with WLTP and indicates traditional test-based regulation has become ineffective. While this study’s reliance on manufacturer-reported OBFCM data may introduce reporting bias and the observational cross-sectional design prevents causal inference, the 457k sample size provides robust statistical power and captures fleet-level trends unavailable from smaller PEMS studies; findings generalize to 2021–2023 European markets and may differ regionally.
These findings are specific to the vehicles in the OBFCM sample and may not represent the manufacturers’ global fleets. Generalizability to other markets, driving conditions, or vehicle vintages should be considered when interpreting results. Future research should prioritize independent PEMS validation on representative samples, mechanistic investigation of manufacturer control strategies through engine software analysis, quantification of driver behavior impacts via telematics and randomized interventions, and detailed cost-benefit analysis of regulatory interventions for policy prioritization. Post-2023 vehicle cohorts should be analyzed if RDE testing or WLTP revisions are implemented to assess regulatory effectiveness.
Author Contributions
Conceptualization, M.M.; Methodology, M.M.; Software, M.M.; Validation, M.M. and T.C.; Formal analysis, T.C.; Investigation, M.M.; Resources, M.M.; Data curation, M.M. and T.C.; Writing—original draft, M.M. and T.C.; Writing—review & editing, M.M. and T.C.; Visualization, M.M.; Supervision, M.M. and T.C.; Project administration, M.M. All authors have read and agreed to the published version of the manuscript.
Funding
This research did not receive external funding.
Data Availability Statement
The original contributions presented in this study are included in the article. Further inquiries can be directed to the corresponding author.
Conflicts of Interest
The authors declare no conflicts of interest.
Abbreviations
The following abbreviations are used in this manuscript:
| PHEV | Plug-in Hybrid Electric Vehicle |
| BEV | Battery Electric Vehicle |
| EV | Electric Vehicle |
| WLTP | Worldwide Harmonized Light-Duty Test Procedure |
| WLTC | Worldwide Harmonized Light-Duty Vehicles Test Cycle |
| RDE | Real Driving Emissions |
| PEMS | Portable Emissions Measurement Systems |
| OBD | On-Board Diagnostics |
| OBFCM | On-Board Fuel Consumption Monitoring |
| CO2 | Carbon Dioxide |
| g/km | grams per kilometer |
| ICCT | International Council on Clean Transportation |
| EEB | European Environmental Bureau |
| EU | European Union |
| EC | European Commission |
| EPA | Environmental Protection Agency |
| Mt | Million tonnes |
| NEDC | New European Driving Cycle |
| NOx | Nitrogen Oxides |
| SoC | State of Charge |
| ECU | Electronic Control Unit |
| OEM | Original Equipment Manufacturer |
| ML | Machine Learning |
| RF | Random Forest |
| XGBoost | Extreme Gradient Boosting |
| MAE | Mean Absolute Error |
| RMSE | Root Mean Squared Error |
| MAPE | Mean Absolute Percentage Error |
| R2 | Coefficient of Determination |
| p | p-value |
| r | Pearson Correlation Coefficient |
| n | Sample Size |
| SD | Standard Deviation |
| IQR | Interquartile Range |
| CV | Coefficient of Variation |
References
- Neves, S. A.; Marques, A. C. What has driven the adoption of BEV and PHEV in the EU? Research in Transportation Business & Management 2025, 60, 101331. [Google Scholar] [CrossRef]
- Harrison, G.; Thiel, C. Policy insights and modelling challenges: The case of passenger car powertrain technology transition in the European Union. European Transport Research Review 2017, 9(3), 37. [Google Scholar] [CrossRef]
- Mądziel, M.; Campisi, T. Predicting Auxiliary Energy Demand in Electric Vehicles Using Physics-Based and Machine Learning Models. Energies 2025, 18, 6092. [Google Scholar] [CrossRef]
- Krause, J.; Thiel, C.; Tsokolis, D.; Samaras, Z.; Rota, C.; Ward, A.; Verhoeve, W. EU road vehicle energy consumption and CO2 emissions by 2050–Expert-based scenarios. Energy Policy 2020, 138, 111224. [Google Scholar] [CrossRef]
- Mądziel, M. Phase-Specific Mixture of Experts Architecture for Real-Time NOx Prediction in Diesel Vehicles: Advancing Euro 7 Compliance. Energies 2025, 18, 5853. [Google Scholar] [CrossRef]
- Tsiropoulos, I.; Siskos, P.; Capros, P. The cost of recharging infrastructure for electric vehicles in the EU in a climate neutrality context: Factors influencing investments in 2030 and 2050. Applied Energy 2022, 322, 119446. [Google Scholar] [CrossRef]
- Plötz, P.; Link, S.; Ringelschwendner, H.; Keller, M.; Moll, C.; Bieker, G.; Mock, P. Real-world usage of plug-in hybrid vehicles in Europe. In ICCT White Paper; 2022. [Google Scholar]
- Doikin, A.; Korsunovs, A.; Campean, F.; García-Afonso, O.; Agostinelli, E. ML-Based Control Strategy for PHEV Under Predictive Vehicle Usage Behaviour. Vehicles 2025, 7(1), 23. [Google Scholar] [CrossRef]
- Kusuma, I.; Kusumoputro, R. A. S.; Iswadi, A. Electric Vehicle Review: BEV, PHEV, HEV, or FCEV? Jurnal Konversi Energi dan Manufaktur 2025, 70–83. [Google Scholar] [CrossRef]
- Wang, Y.; Iris, Ç. Transition to near-zero emission shipping fleet powered by alternative fuels under uncertainty. Transportation Research Part D: Transport and Environment 2025, 142, 104689. [Google Scholar] [CrossRef]
- Rad, M. A. V.; Esmaeilpour, A.; Rouzbahani, F.; Toopshekan, A. Economic optimization of hybrid renewable system for near-zero emission electric vehicle charging stations in the capital cities of the world. Sustainable Energy Technologies and Assessments 2025, 82, 104546. [Google Scholar] [CrossRef]
- Ukumphan, S.; Luo, J.; Wattana, S. A Comparative Life Cycle Greenhouse Gas Emission Analysis of BEV, PHEV, HEV and ICEV in Thailand. 2025 13th International Electrical Engineering Congress (iEECON), 2025, March; IEEE; pp. 1–4. [Google Scholar]
- Memon, M.; Rossi, C. A Review of EV Adoption, Charging Standards, and Charging Infrastructure Growth in Europe and Italy. Batteries 2025, 11(6), 229. [Google Scholar] [CrossRef]
- Tan, D.; Tan, J.; Liu, M.; Xu, H.; Ge, Y. A combined vehicle specific power and laboratory emissions approach to real driving CO2 emission estimation for light-duty vehicle. Sustainable Energy Technologies and Assessments 2025, 75, 104265. [Google Scholar] [CrossRef]
- Yang, N.; Lian, X.; Bai, Z.; Rao, L.; Jiang, J.; Li, J.; Wang, X. Characterizing CO2 Emission from Various PHEVs Under Charge-Depleting Conditions. Atmosphere 2025, 16(8), 946. [Google Scholar] [CrossRef]
- Plötz, P.; Gnann, T. Real-world Fuel Consumption and Potential Future Regulation of Plug-In Hybrid Electric Vehicles in Europe–An Empirical Analysis of about one Million Vehicles. 2025. [Google Scholar]
- Dey, B.; Misra, S.; Pal, A.; Marquez, F. P. G. An amalgamated load shifting cum curtailing policy with smart charging of PHEV for economic operation of microgrid system. Scientific Reports 2025, 15(1), 19275. [Google Scholar] [CrossRef] [PubMed]
- Yao, D.; Zeng, F.; Lu, X.; Shen, J.; Huang, K.; Wu, F. Traffic Prediction Based Battery State-of-Charge Planning for Connected Plug-in Hybrid Electric Vehicle: D. Yao et al. International Journal of Automotive Technology 2025, 1–20. [Google Scholar] [CrossRef]
- Yang, H.; Zhou, L.; Kang, Y.; Wang, Z.; Liang, J.; Zhang, F. Simplified-road-condition-based global optimization and calibration strategy for PHEV energy management. Energy 2025, 136538. [Google Scholar] [CrossRef]
- Jeong, J. W.; Lee, G.; Lee, J.; Woo, S.; Kim, N.; Lee, K. Analysis of energy consumption and emissions characteristics of plug-in hybrid electric vehicle (PHEV) under various real-world driving conditions. Journal of Environmental Sciences 2025. [Google Scholar] [CrossRef]
- Jeong, J. W.; Lee, G.; Lee, J.; Woo, S.; Kim, N.; Lee, K. Analysis of energy consumption and emissions characteristics of plug-in hybrid electric vehicle (PHEV) under various real-world driving conditions. Journal of Environmental Sciences 2025. [Google Scholar] [CrossRef]
- Mądziel, M. Quantifying Emissions in Vehicles Equipped with Energy-Saving Start–Stop Technology: THC and NOx Modeling Insights. Energies 2024, 17, 2815. [Google Scholar] [CrossRef]
- Yang, N.; Lian, X.; Bai, Z.; Rao, L.; Jiang, J.; Li, J.; Wang, X. Characterizing CO2 Emission from Various PHEVs Under Charge-Depleting Conditions. Atmosphere 2025, 16(8), 946. [Google Scholar] [CrossRef]
- Hu, R.; Zheng, J.; Chen, X.; Li, L.; Liu, Y. Driving behavior shapes PHEV brake energy and brake wear particle emissions. Transportation Research Part D: Transport and Environment 2026, 150, 105087. [Google Scholar] [CrossRef]
- Sadik, M. S.; Labib, M. I.; Disha, A. S. Transitioning to Cleaner Transport: Evaluating the Environmental and Economic Performance of ICE, HEVs, and PHEVs in Bangladesh. World Electric Vehicle Journal 2025, 16(7), 380. [Google Scholar] [CrossRef]
- Spyropoulos, G.; Spyrakis, K.; Christopoulos, K.; Kostopoulos, E. Electrifying Transport: Assessing the Air Quality and Policy Implications of Battery Electric vs. Plug-In Hybrid Vehicles. Future Transportation 2025, 5(4), 167. [Google Scholar] [CrossRef]
- Honkisz, W.; Bielaczyc, P.; Szczotka, A.; Klimkiewicz, D.; Aakko-Saksa, P.; Järvinen, A.; Topinka, J. Plug-In Hybrid Light-Duty vehicle emission measurements over custom RDE test cycle on the road and in the various laboratory conditions. No. EGU25-6117; Copernicus Meetings. 2025. [Google Scholar]
- Wen, M.; Wang, X.; Zhao, H.; Feng, J.; Xu, X.; Ge, Z.; Ge, Y. Ammonia emissions from series and series-parallel plug-in hybrid electric vehicles under real driving condition. Journal of Hazardous Materials 2025, 138910. [Google Scholar] [CrossRef]
- Pielecha, J.; Woś, P.; Kuszewski, H.; Mądziel, M.; Krzemiński, A.; Kulasa, P.; Sobczak, J. Real-Driving Emissions of Euro 2–Euro 6 Vehicles in Poland—17 Years of Experience. Applied Sciences 2025, 16(1), 348. [Google Scholar] [CrossRef]
- Qin, S.; Fu, Q.; Zhu, H.; Xiang, S.; Liu, H. Is Plug-in Hybrid Vehicle a Green Mode in Daily Use? Transport Policy 2026, 104005. [Google Scholar] [CrossRef]
- Dataset OBFCM real-world data from M1 vehicles available from. Available online: https://data.jrc.ec.europa.eu/dataset/9528c82b-37fa-4da3-9b6b-b54eaf0ba4ac (accessed on 18.12.2025).
- Plötz, P.; Link, S.; Ringelschwendner, H.; Keller, M.; Moll, C.; Bieker, G.; Mock, P. Real-World Usage of Plug-in Hybrid Vehicles in Europe: A 2022 Update on Fuel Consumption, Electric Driving, and CO2 Emissions. 2022. [Google Scholar]
- Dong, X.; Wang, B.; Yip, H. L.; Chan, Q. N. CO2 emission of electric and gasoline vehicles under various road conditions for China, Japan, Europe and world average—Prediction through year 2040. Applied Sciences 2019, 9(11), 2295. [Google Scholar] [CrossRef]
- Lv, Z.; Yang, L.; Wu, L.; Peng, J.; Zhang, Q.; Sun, M.; Min, J. Comprehensive analysis of the pollutant characteristics of gasoline vehicle emissions under different engine, fuel, and test cycles. Energies 2022, 15(2), 622. [Google Scholar] [CrossRef]
- Jeong, J. W.; Lee, G.; Lee, J.; Woo, S.; Kim, N.; Lee, K. Analysis of energy consumption and emissions characteristics of plug-in hybrid electric vehicle (PHEV) under various real-world driving conditions. Journal of Environmental Sciences 2025. [Google Scholar] [CrossRef]
- Plötz, P.; Gnann, T. Real-world Fuel Consumption and Potential Future Regulation of Plug-In Hybrid Electric Vehicles in Europe–An Empirical Analysis of about one Million Vehicles. 2025. [Google Scholar]
- Pavlovic, J.; Tansini, A.; Suarez, J.; Fontaras, G. Influence of vehicle and battery ageing and driving modes on emissions and efficiency in Plug-in hybrid vehicles. Energy Conversion and Management: X 2024, 24, 100776. [Google Scholar] [CrossRef]
- Zhao, Y.; Wang, F.; Zhang, S.; Wu, Y.; Hao, J. Decarbonization potential of Chinese PHEVs: Impact of increased battery range, power mix, and usage patterns. Energy 2025, 136986. [Google Scholar] [CrossRef]
- Wang, Z.; Mae, M.; Nishimura, S.; Matsuhashi, R. Vehicular Fuel Consumption and CO2 Emission Estimation Model Integrating Novel Driving Behavior Data Using Machine Learning. Energies 2024, 17(6), 1410. [Google Scholar] [CrossRef]
- He, H. D.; Lu, D. N.; Zhao, H. M.; Peng, Z. R. Characterizing CO2 and NOx emission of vehicles crossing toll stations in highway. Transportation Research Part D: Transport and Environment 2024, 126, 104024. [Google Scholar] [CrossRef]
- Andrych-Zalewska, M.; Chłopek, Z.; Merkisz, J.; Pielecha, J. Research on the results of the WLTP procedure for a passenger vehicle. Eksploatacja i Niezawodność 2024, 26(1). [Google Scholar] [CrossRef]
- Marchitto, L.; Costagliola, M. A.; Berra, A. Influence of Performance Packages on Fuel Consumption and Exhaust Emissions of Passenger Cars and Commercial Vehicles under WLTP. Energies 2024, 17(14), 3356. [Google Scholar] [CrossRef]
- Laskowski, P.; Zimakowska-Laskowska, M.; Matej, J.; Wiśniowski, P. The problem of cold start emissions from vehicles. Combustion Engines (2300-9896) 2024, 199(4). [Google Scholar] [CrossRef]
- Mądziel, M. Predictive methods for CO2 emissions and energy use in vehicles at intersections. Sci Rep 2025, 15, 6463. [Google Scholar] [CrossRef]
- Kharrazian, E. A.; Hadadi, F.; Aghayan, I. Determination of Urban Emission Factors for Vehicular Tailpipe Emissions Using Driving Cycles and Cluster-Based Driver Behavior Analysis. Eng 2025, 6(11), 294. [Google Scholar] [CrossRef]
- Li, B. W.; Chen, Z. H.; Zhu, X. H.; Zhang, Z.; Peng, Z. R.; Zhao, H. M.; He, H. D. Assessment of eco-driving strategies on carbon emissions for hybrid vehicles through portable emissions measurement systems. Atmospheric Pollution Research 2025, 16(3), 102365. [Google Scholar] [CrossRef]
- Mądziel, M. State of Charge Prediction for Li-Ion Batteries in EVs for Traffic Microsimulation. Energies 2025, 18, 4992. [Google Scholar] [CrossRef]
- Lis, M.; Mądziel, M. Green Transportation Planning for Smart Cities: Digital Twins and Real-Time Traffic Optimization in Urban Mobility Networks. Appl. Sci. 2026, 16, 678. [Google Scholar] [CrossRef]
Figure 1.
Flowchart of the work.
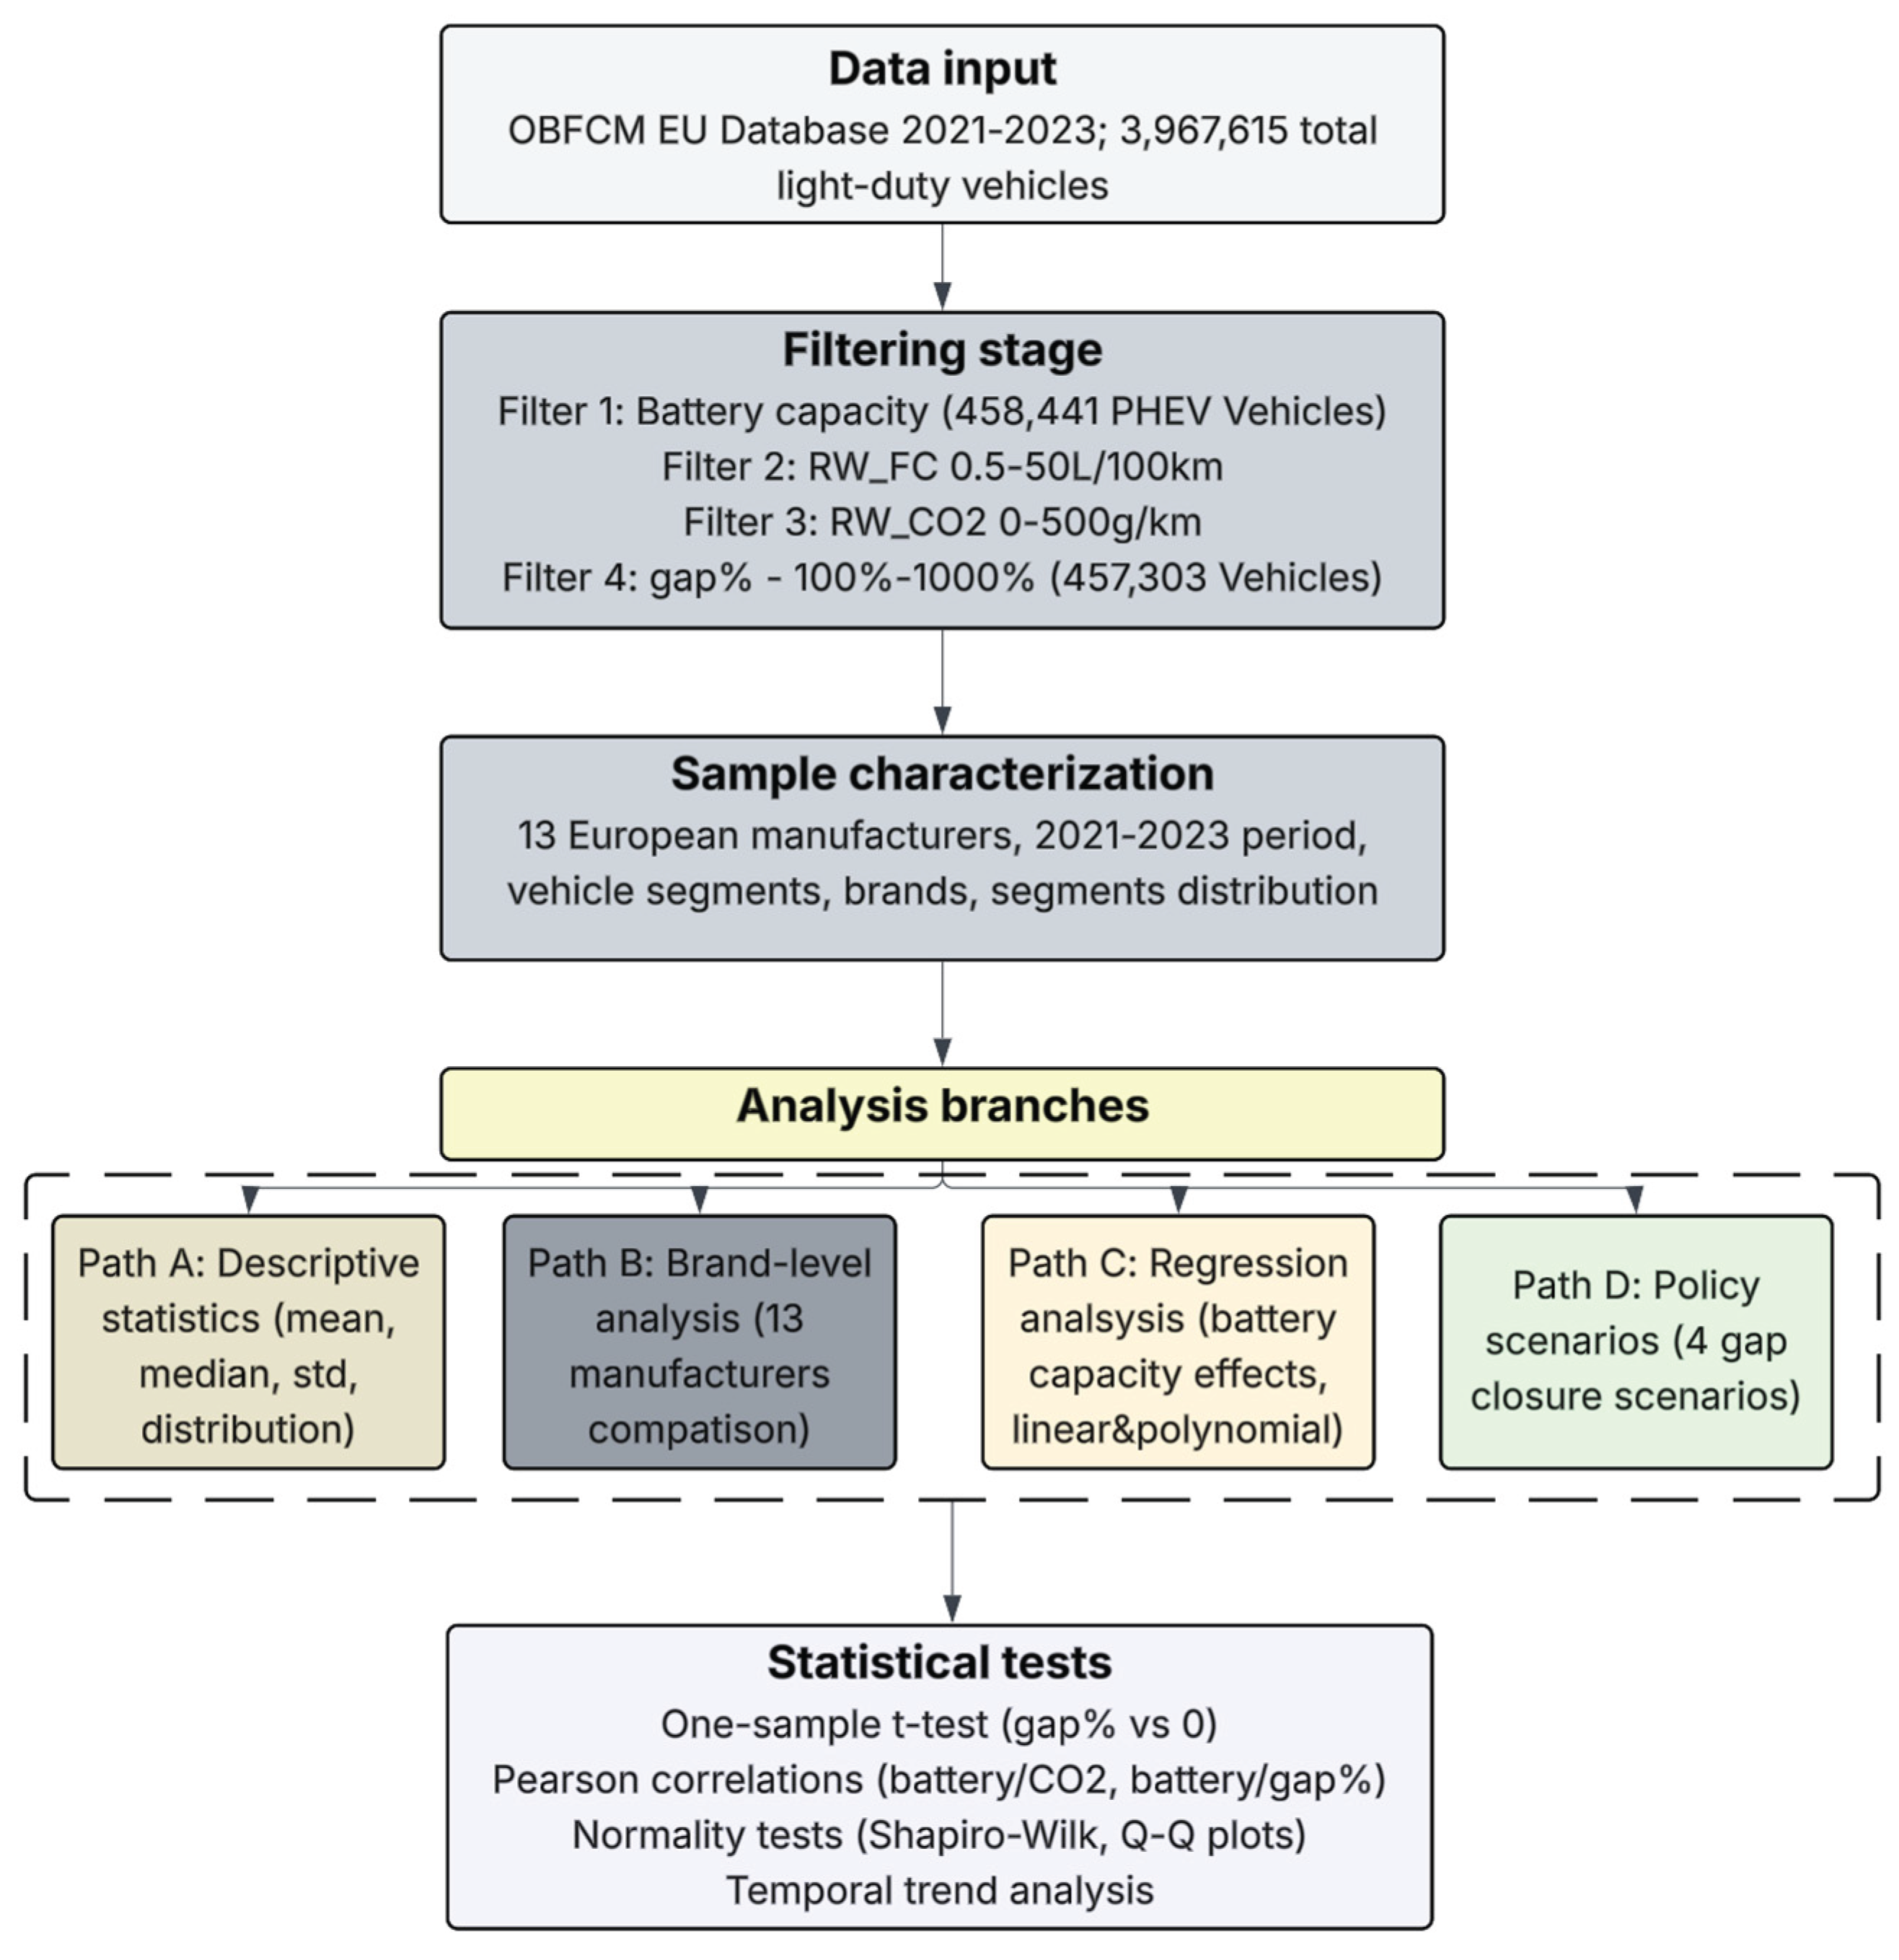
Figure 2.
Real-World CO2 Emissions Distribution and Regulatory Gap Analysis.
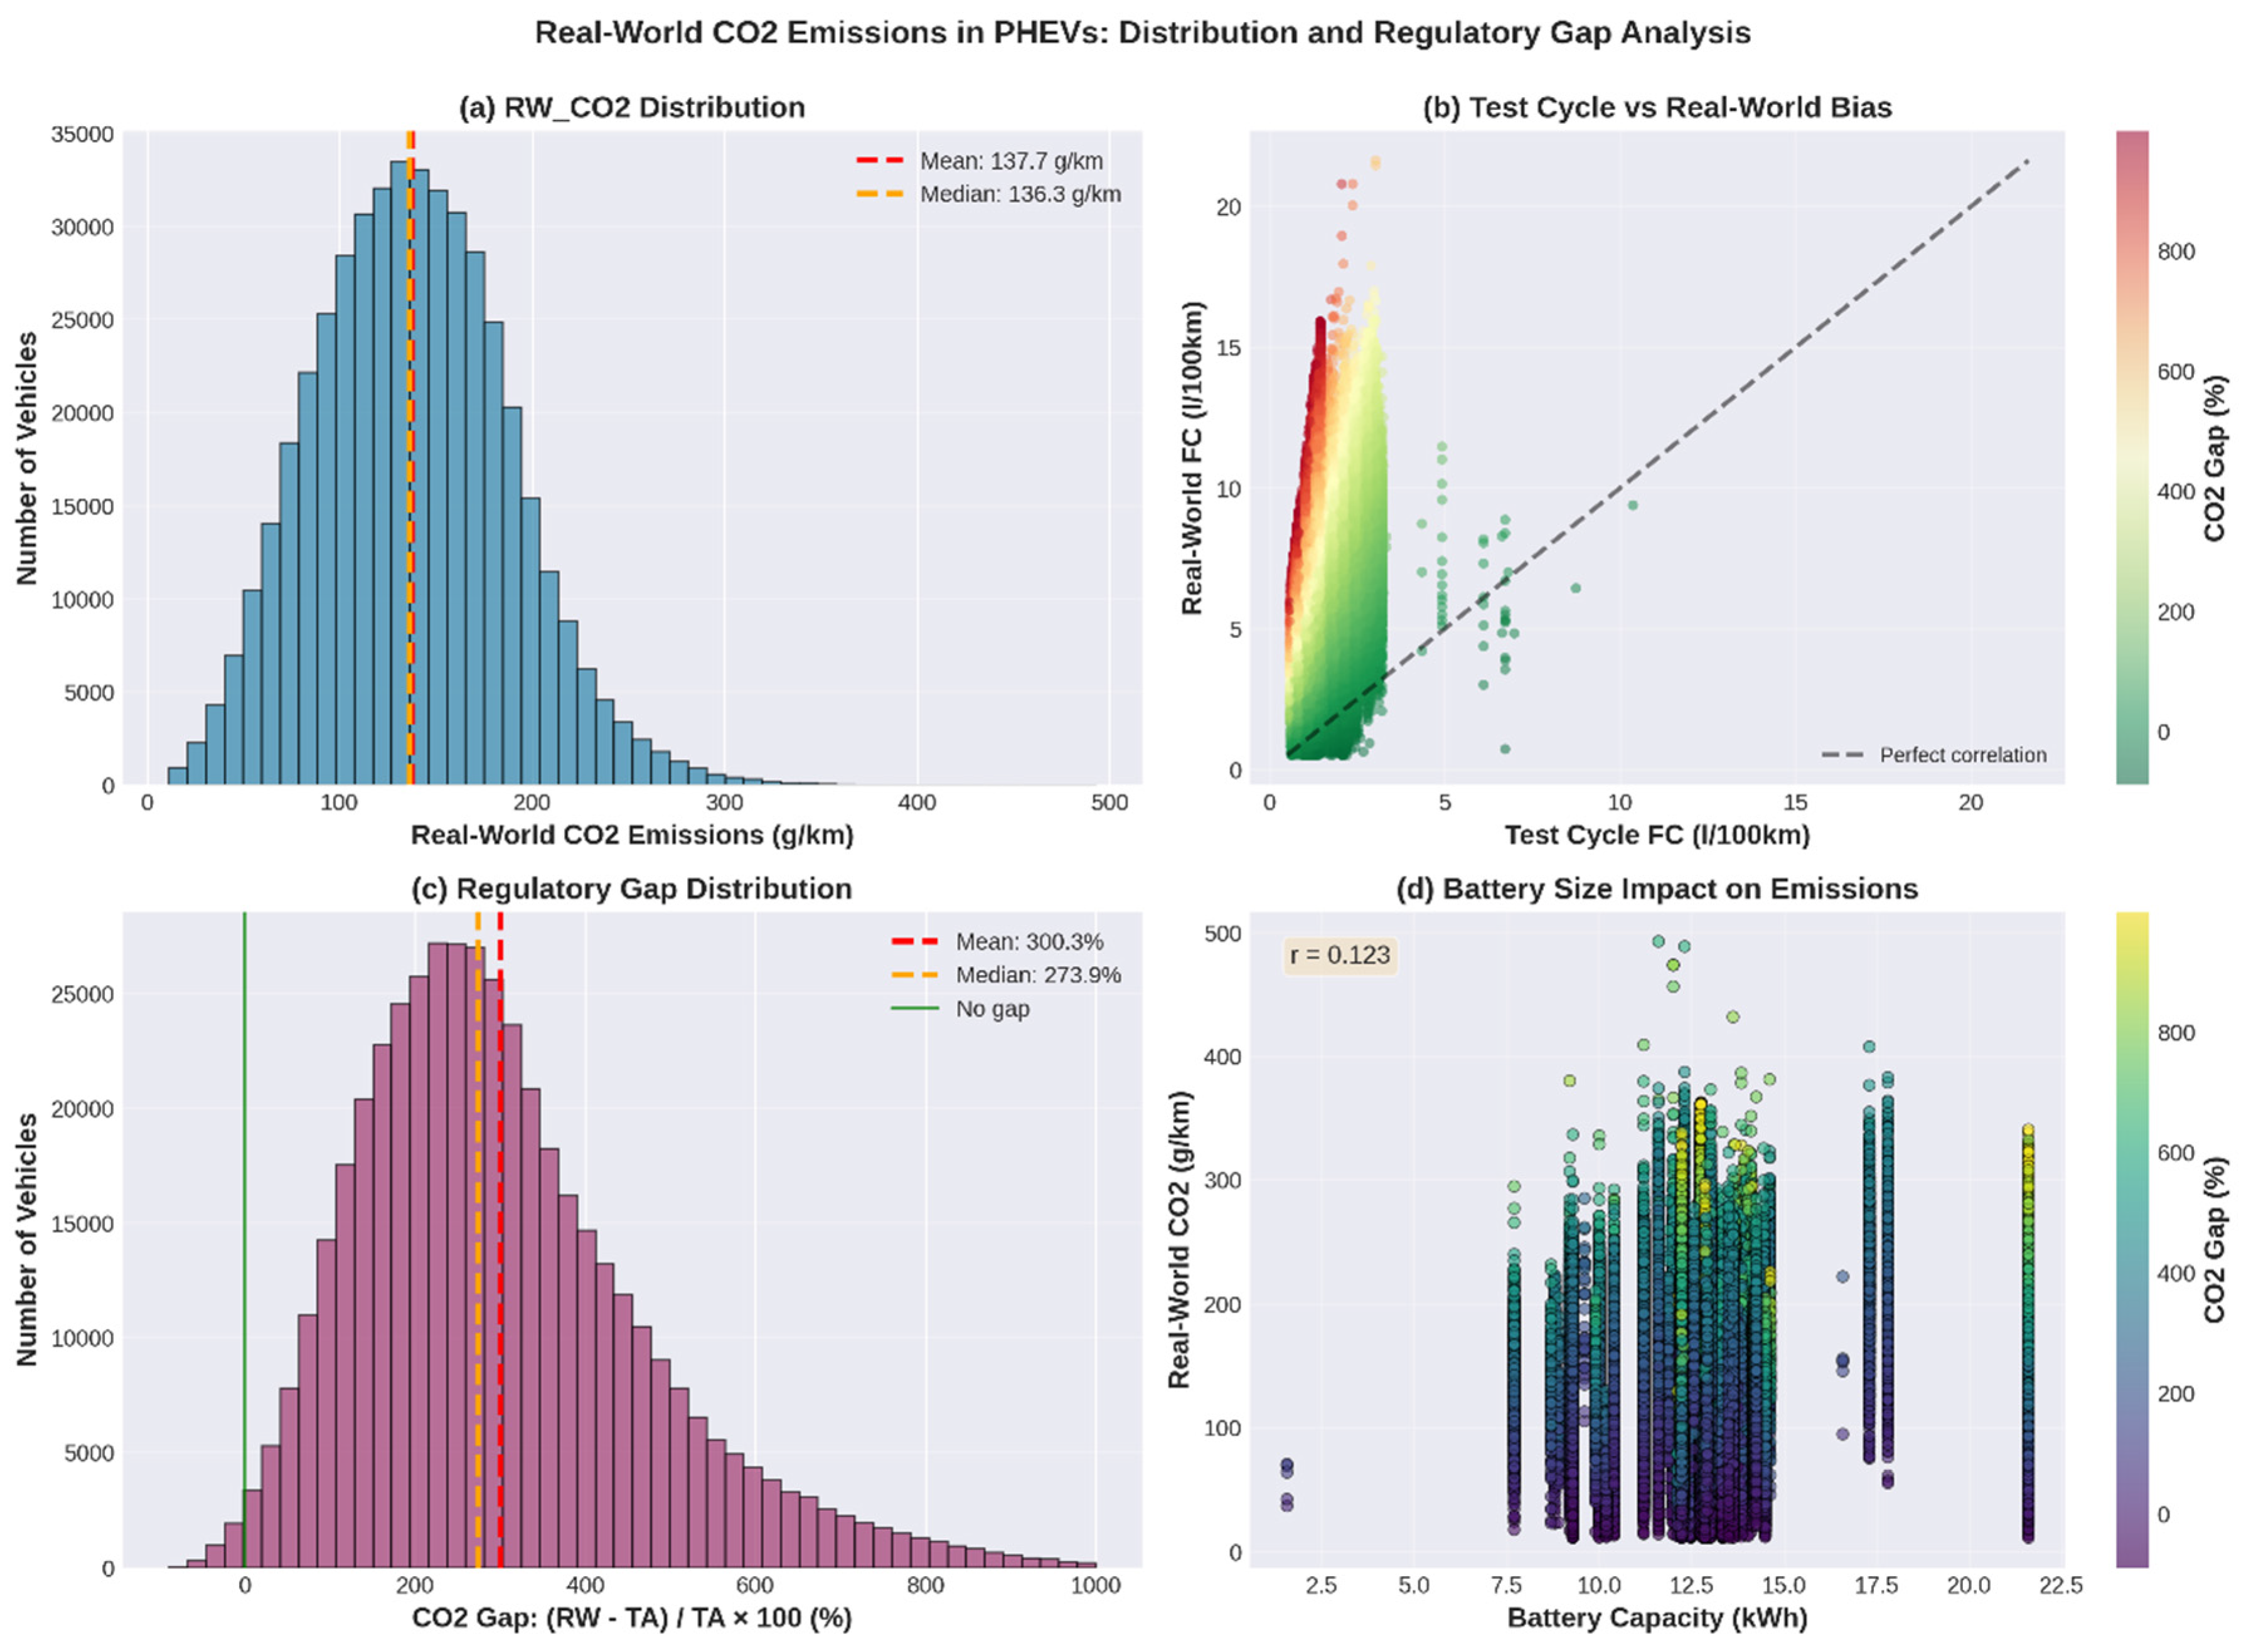
Figure 3.
Brand-level comparison box plots.
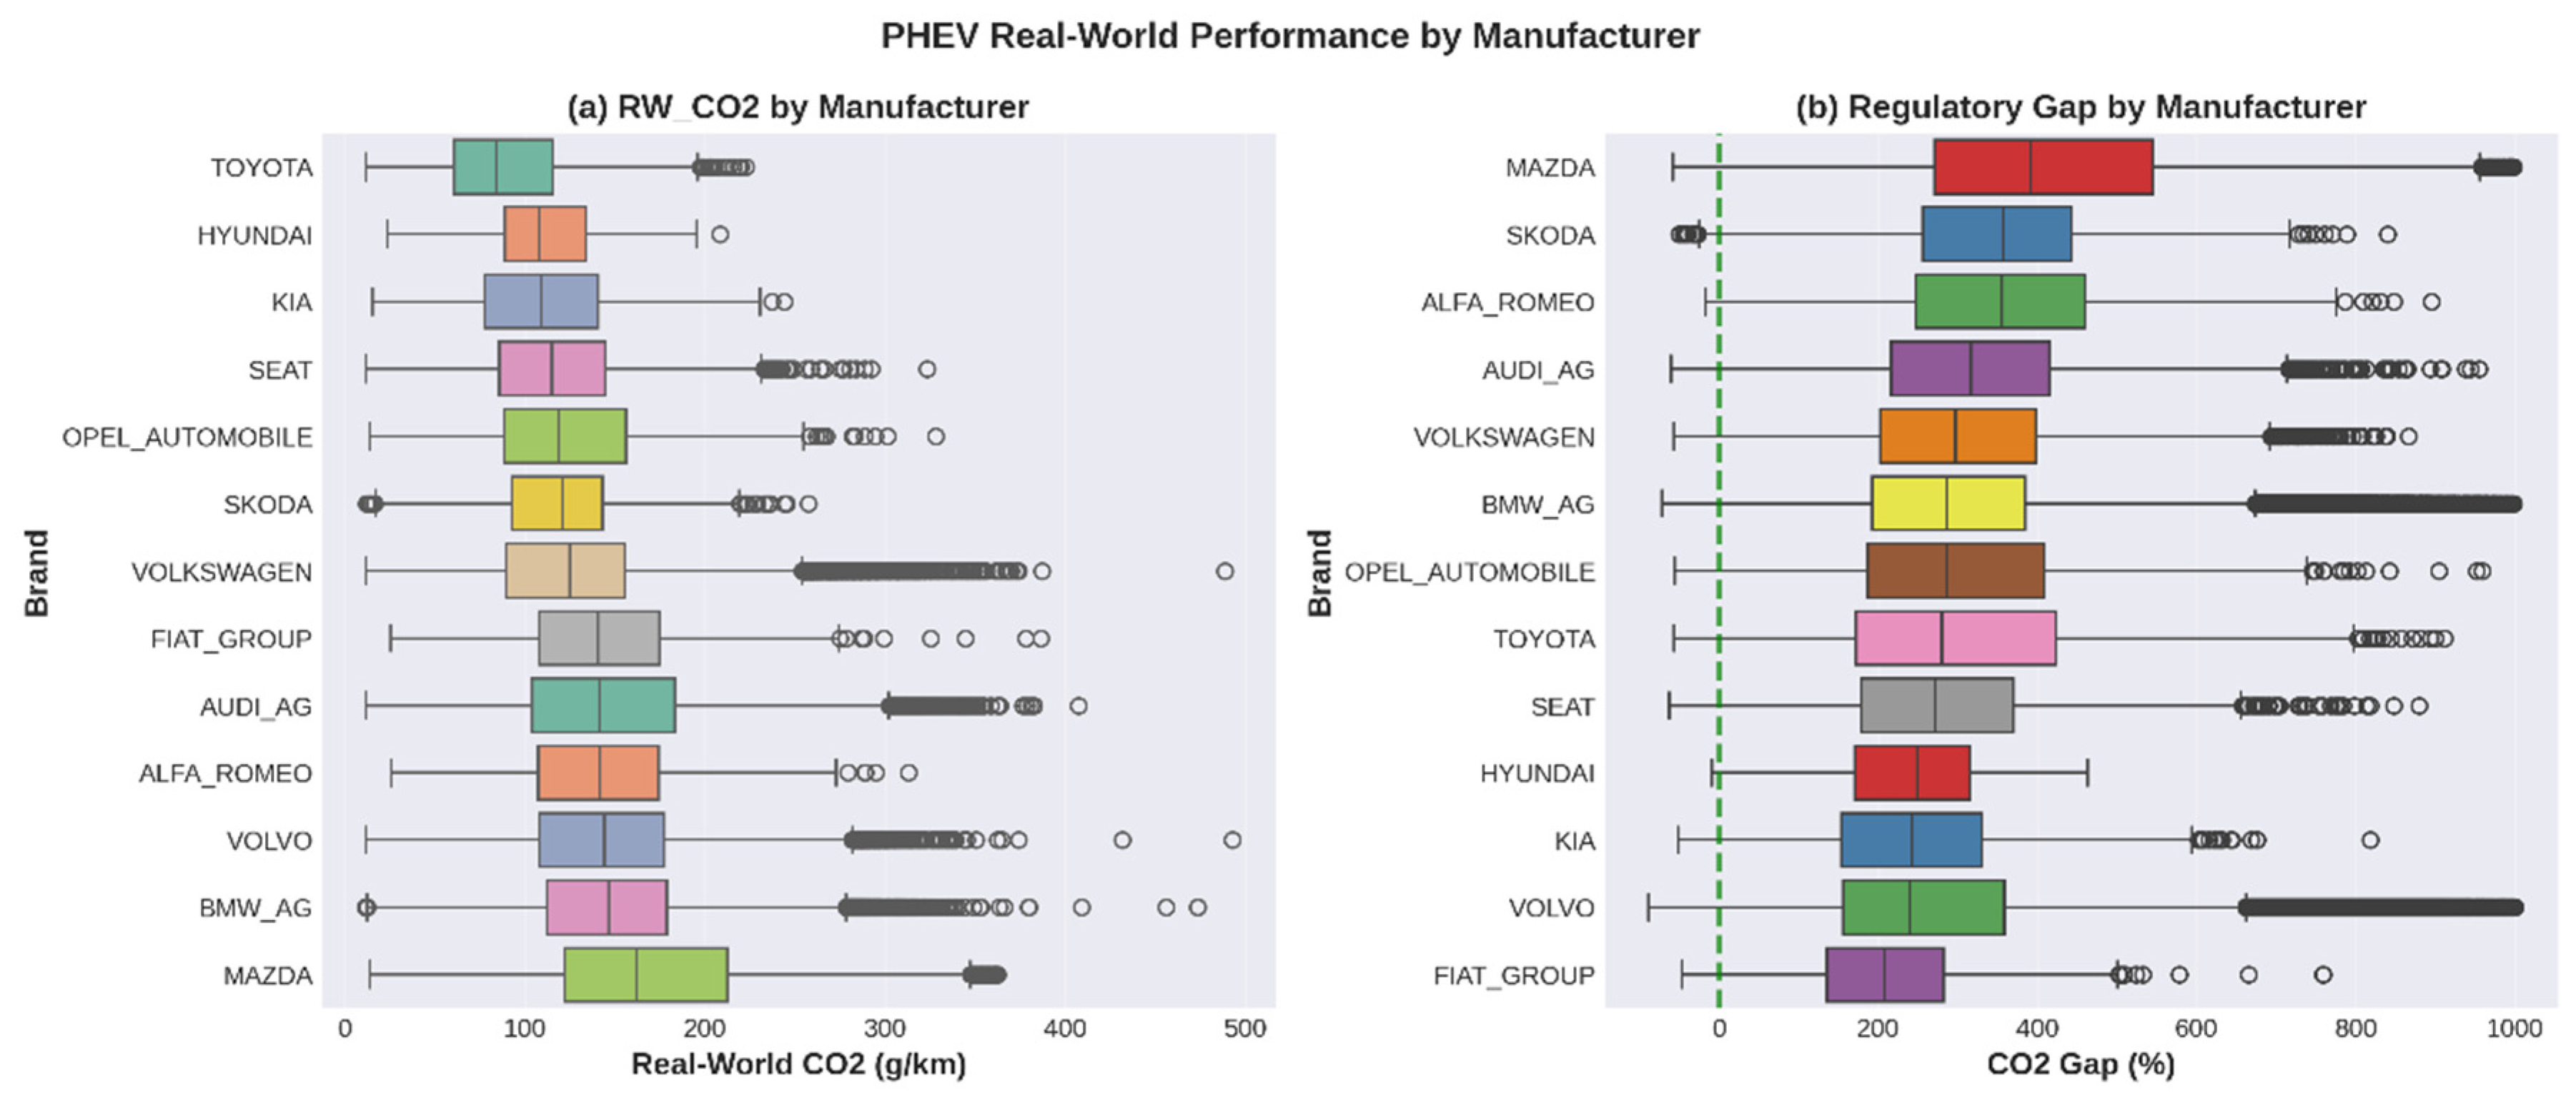
Figure 4.
PHEV real-world performance by vehicle segment.
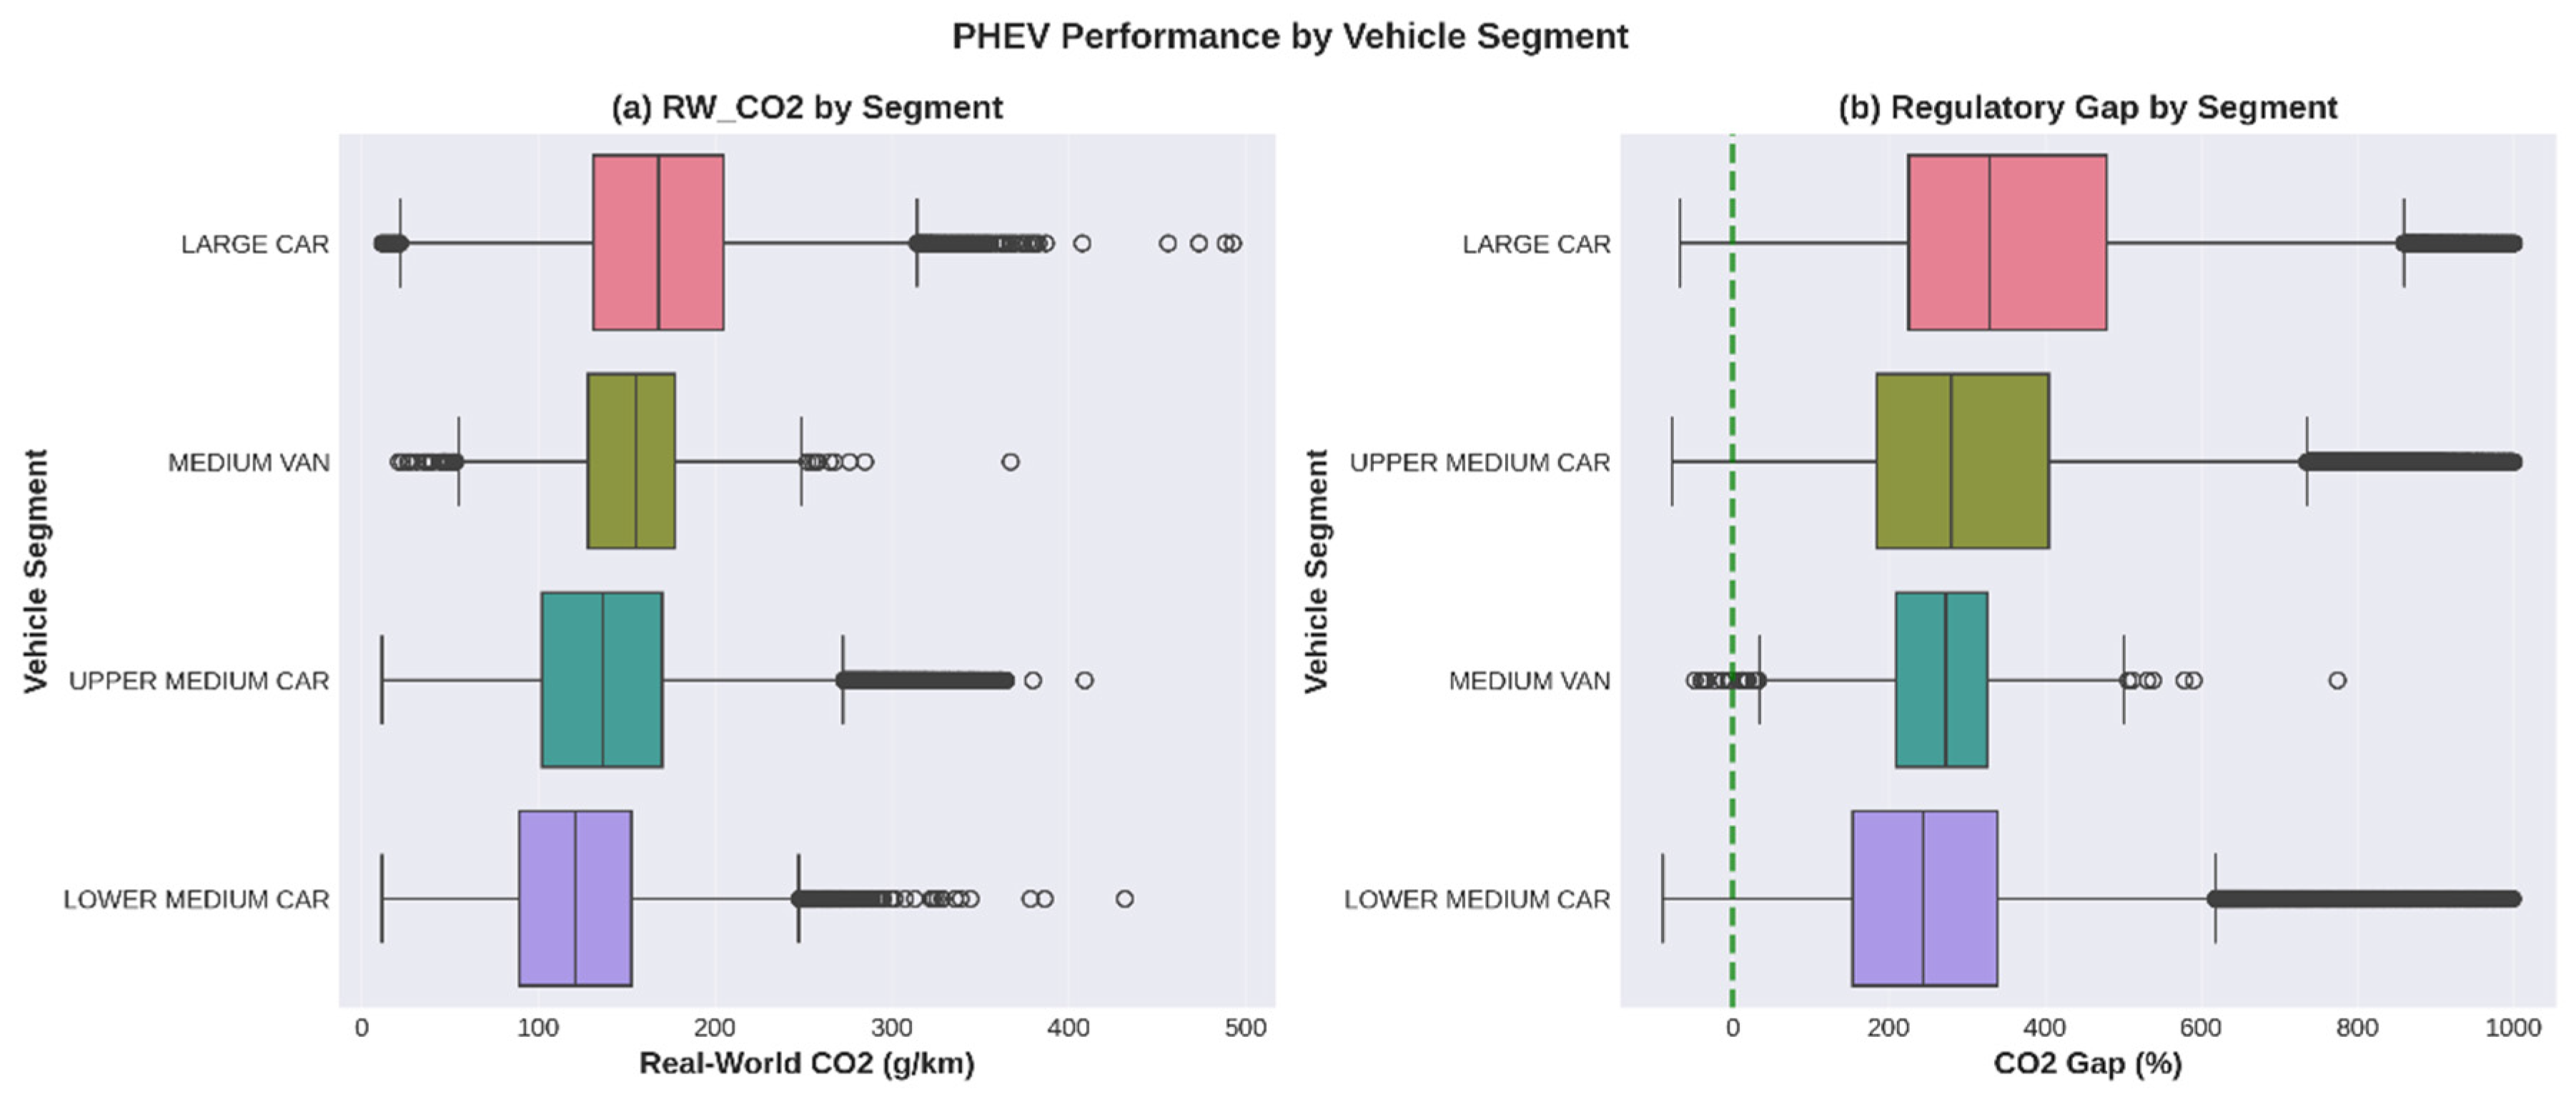
Figure 5.
PHEV real-world performance by vehicle segment.
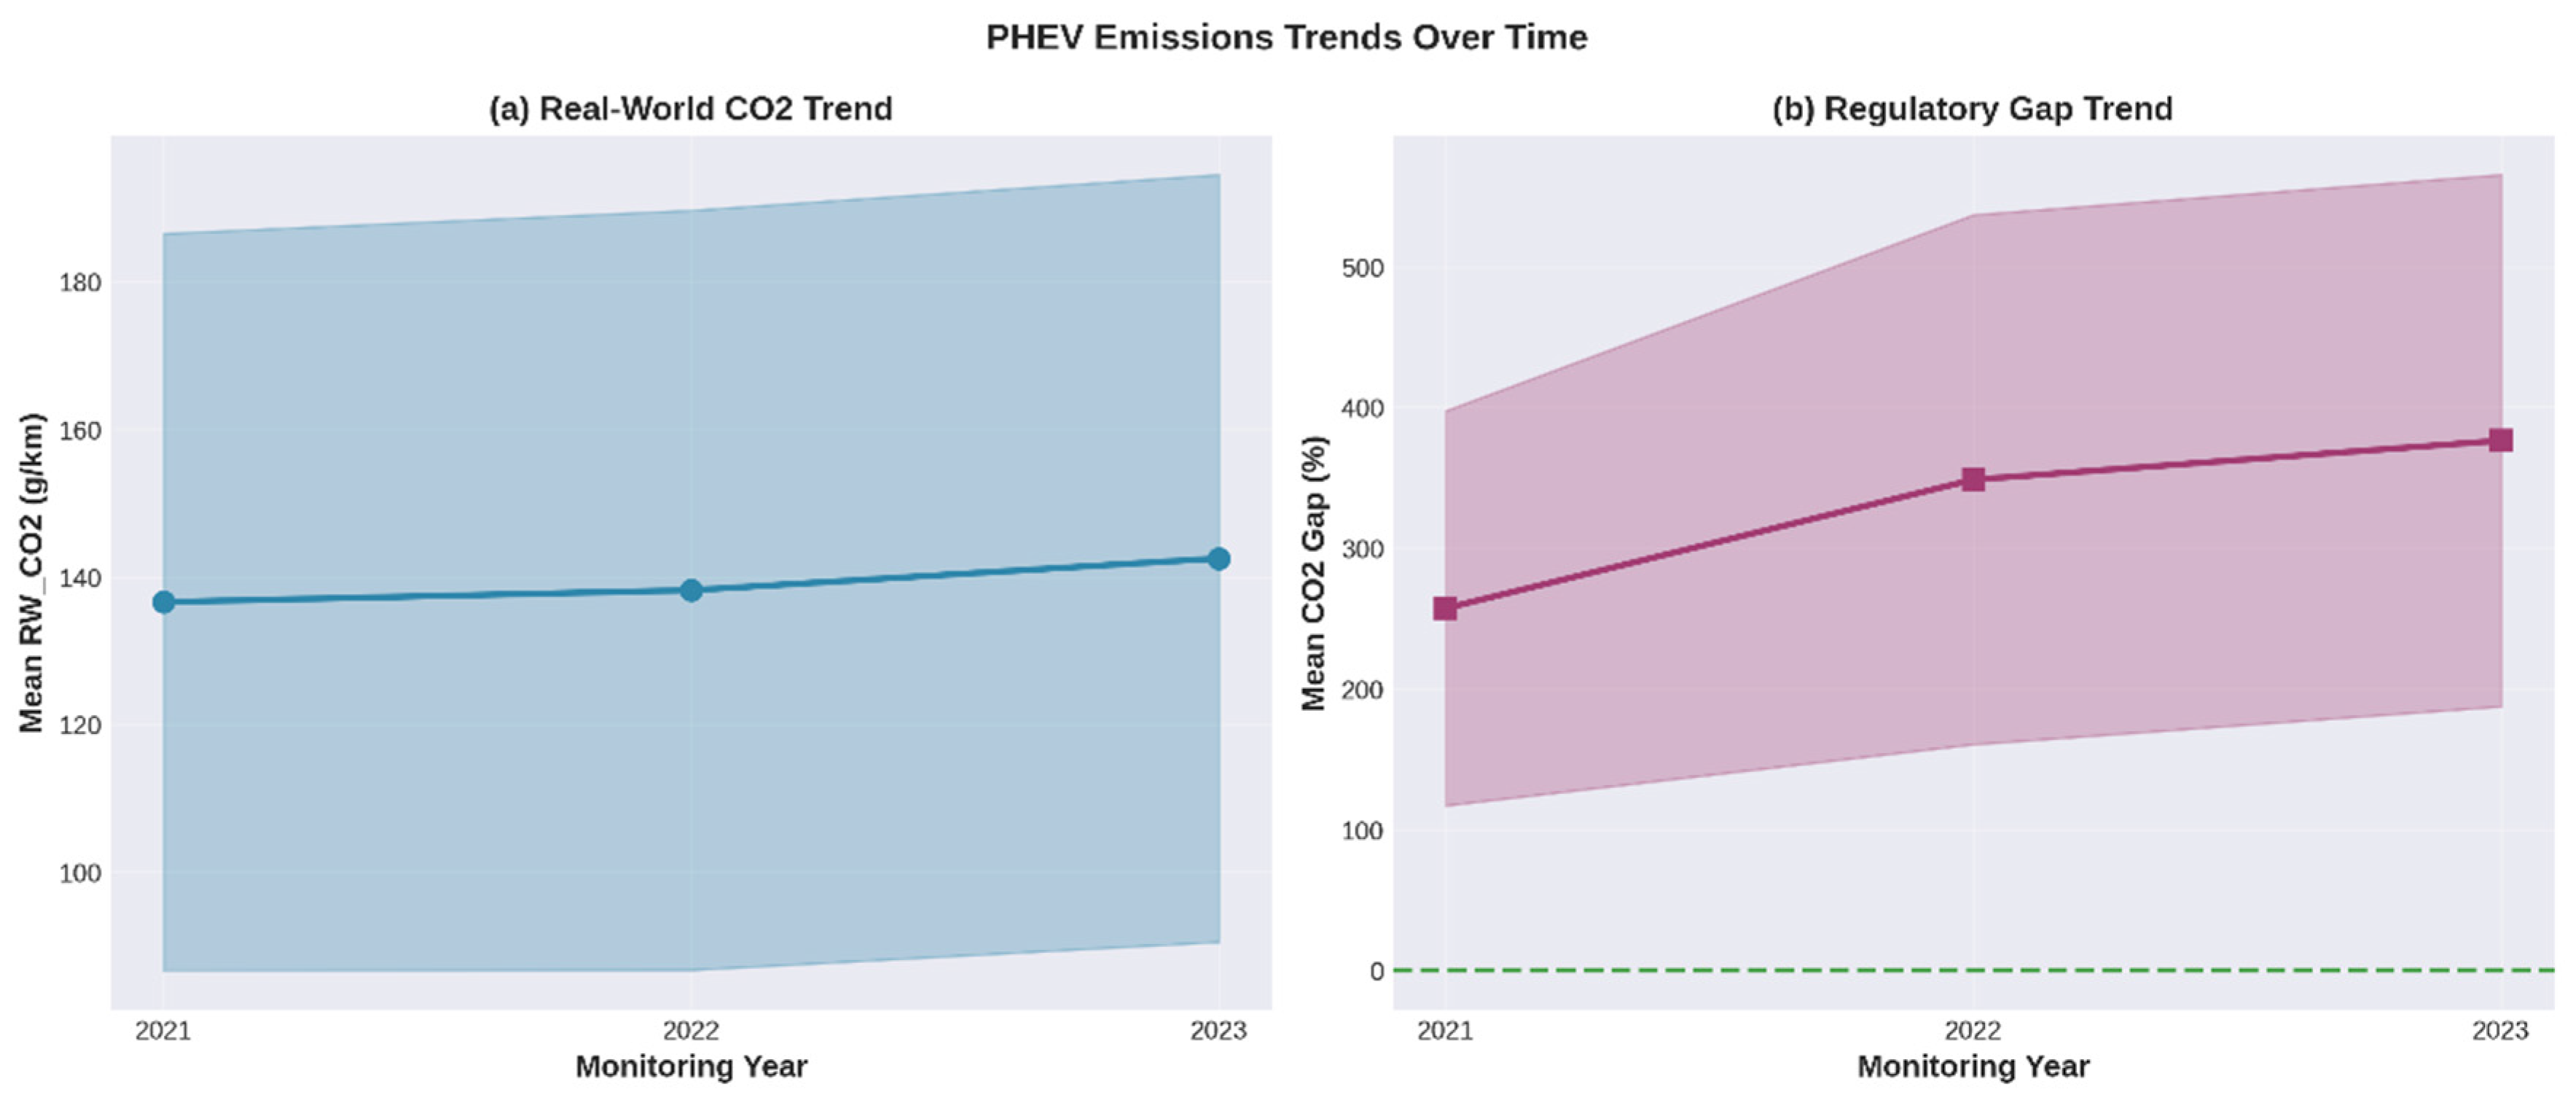
Figure 6.
Regression analysis of battery capacity impact on real-world CO2 emissions.
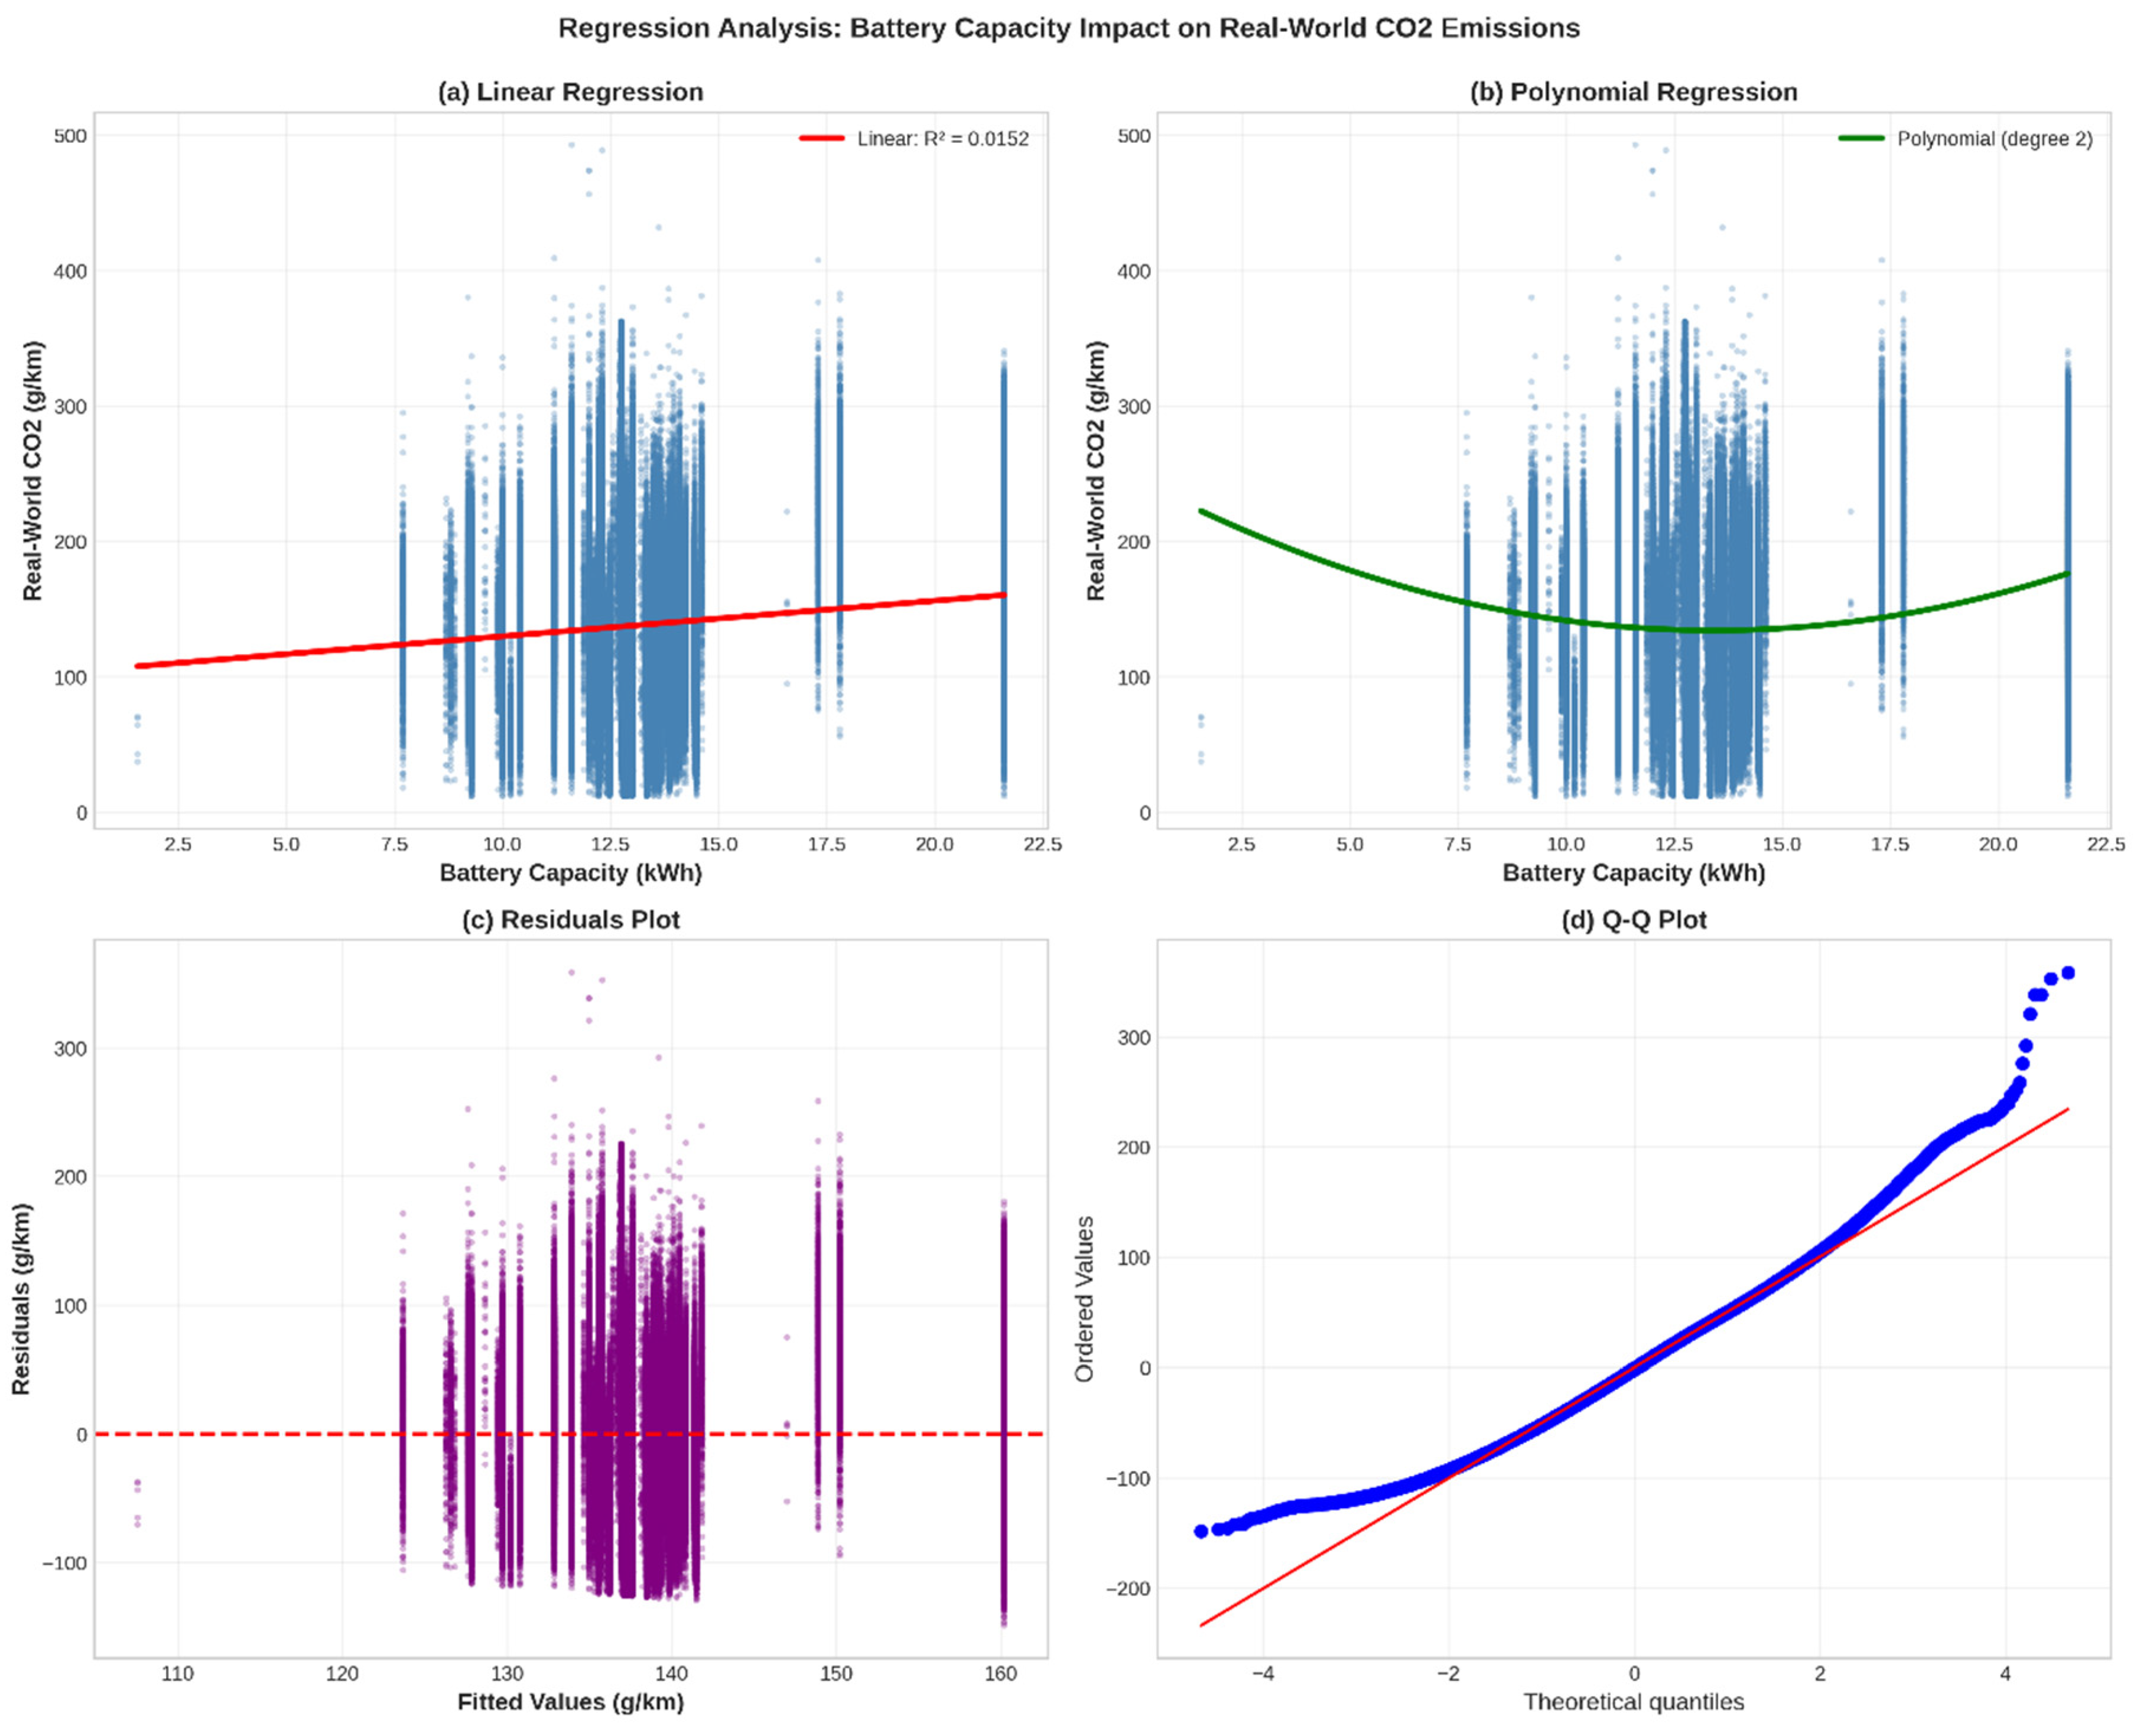
Figure 7.
Q-Q plots: visual assessment of distribution normality.
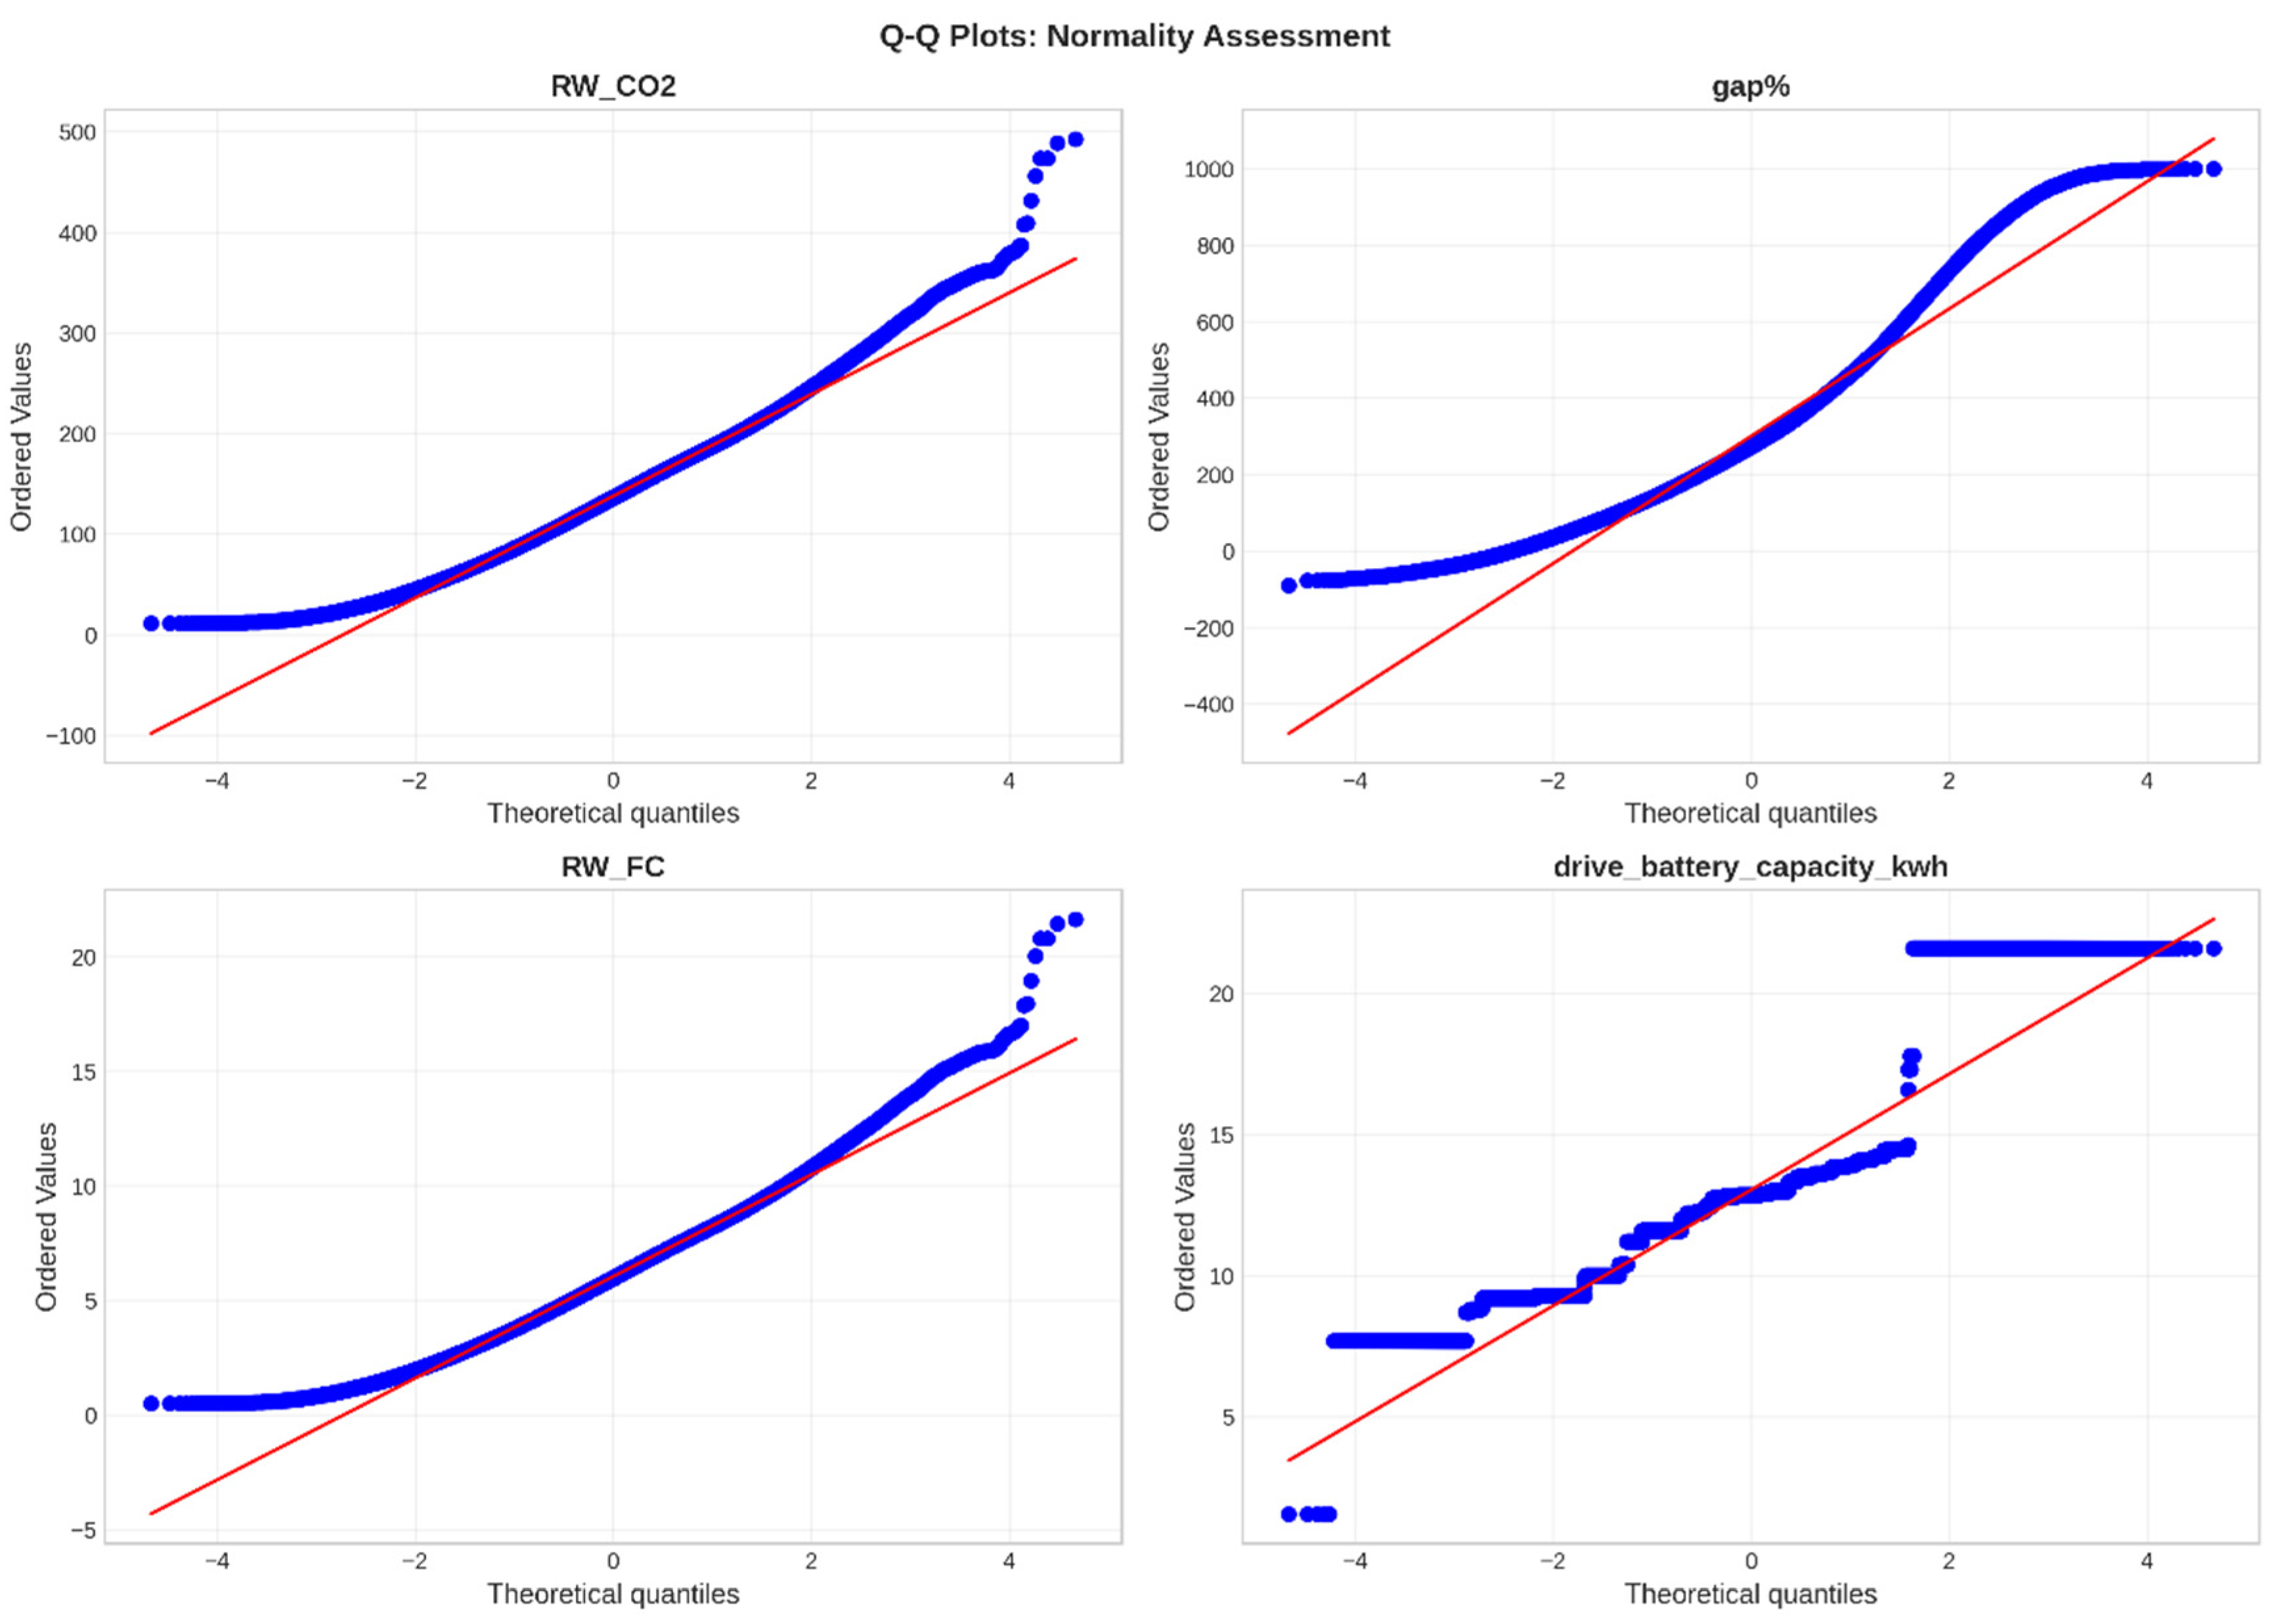
Figure 8.
Brand performance heatmap.
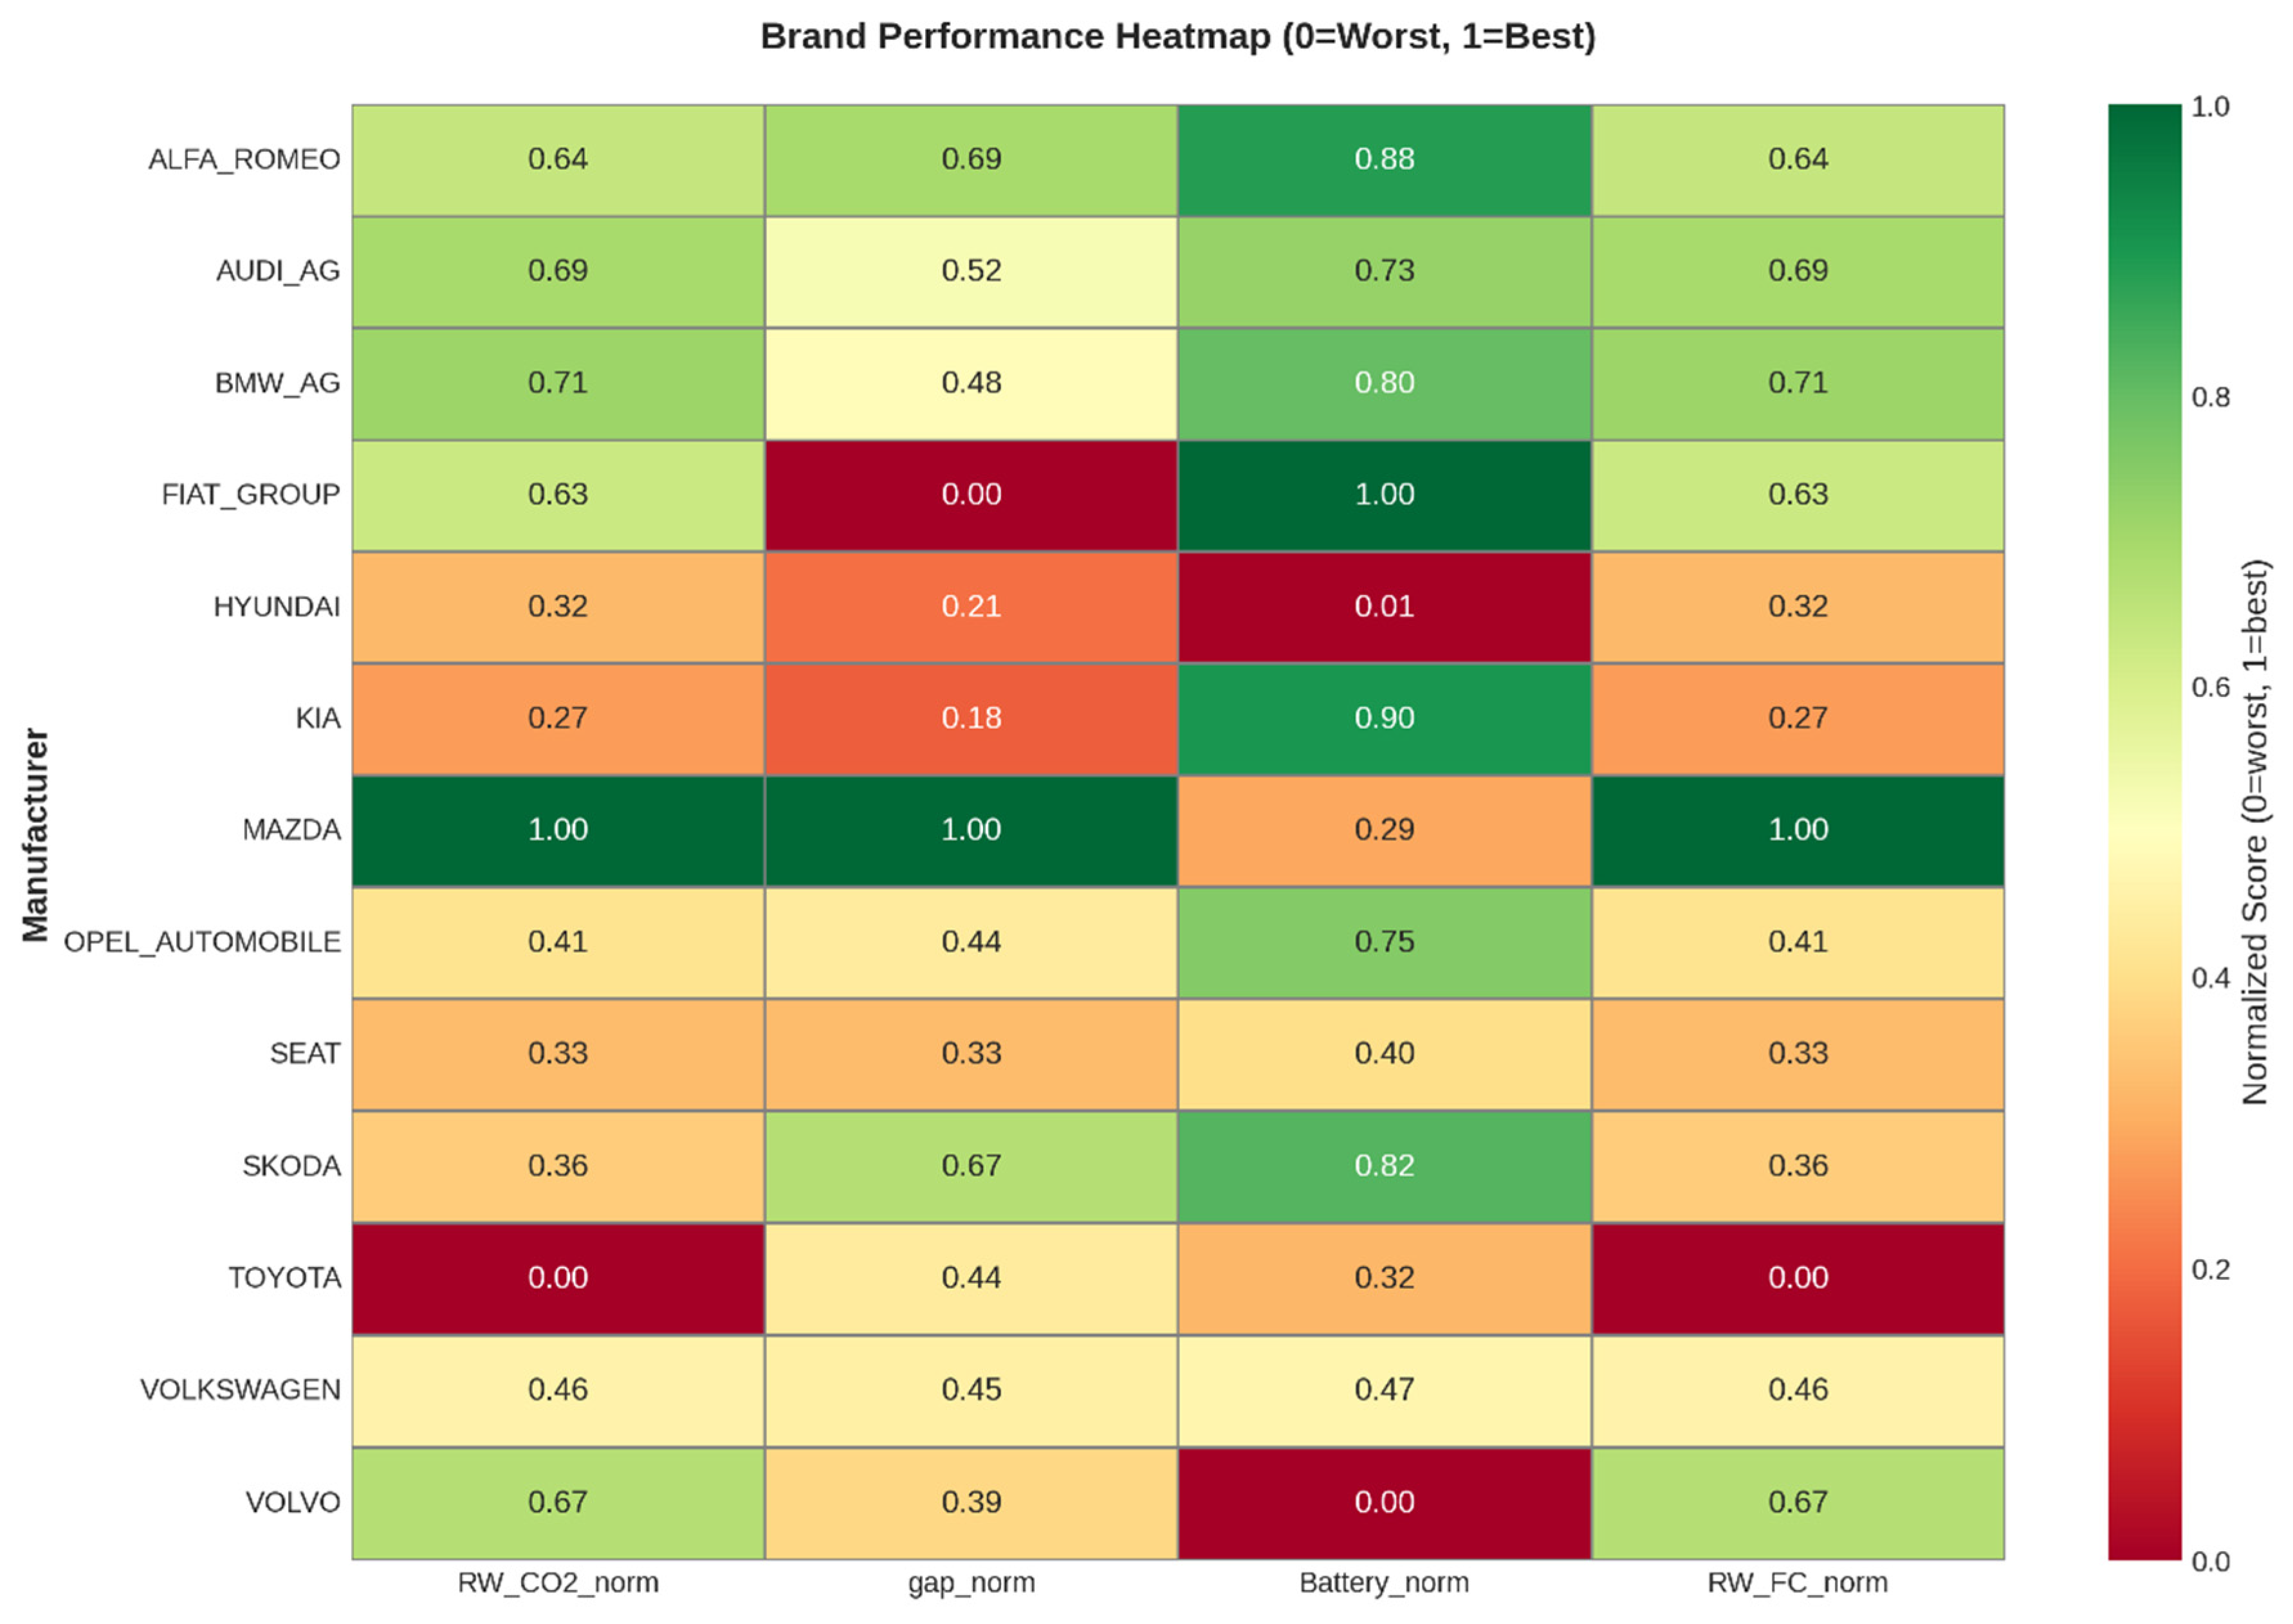
Figure 9.
PHEV battery usage patterns.
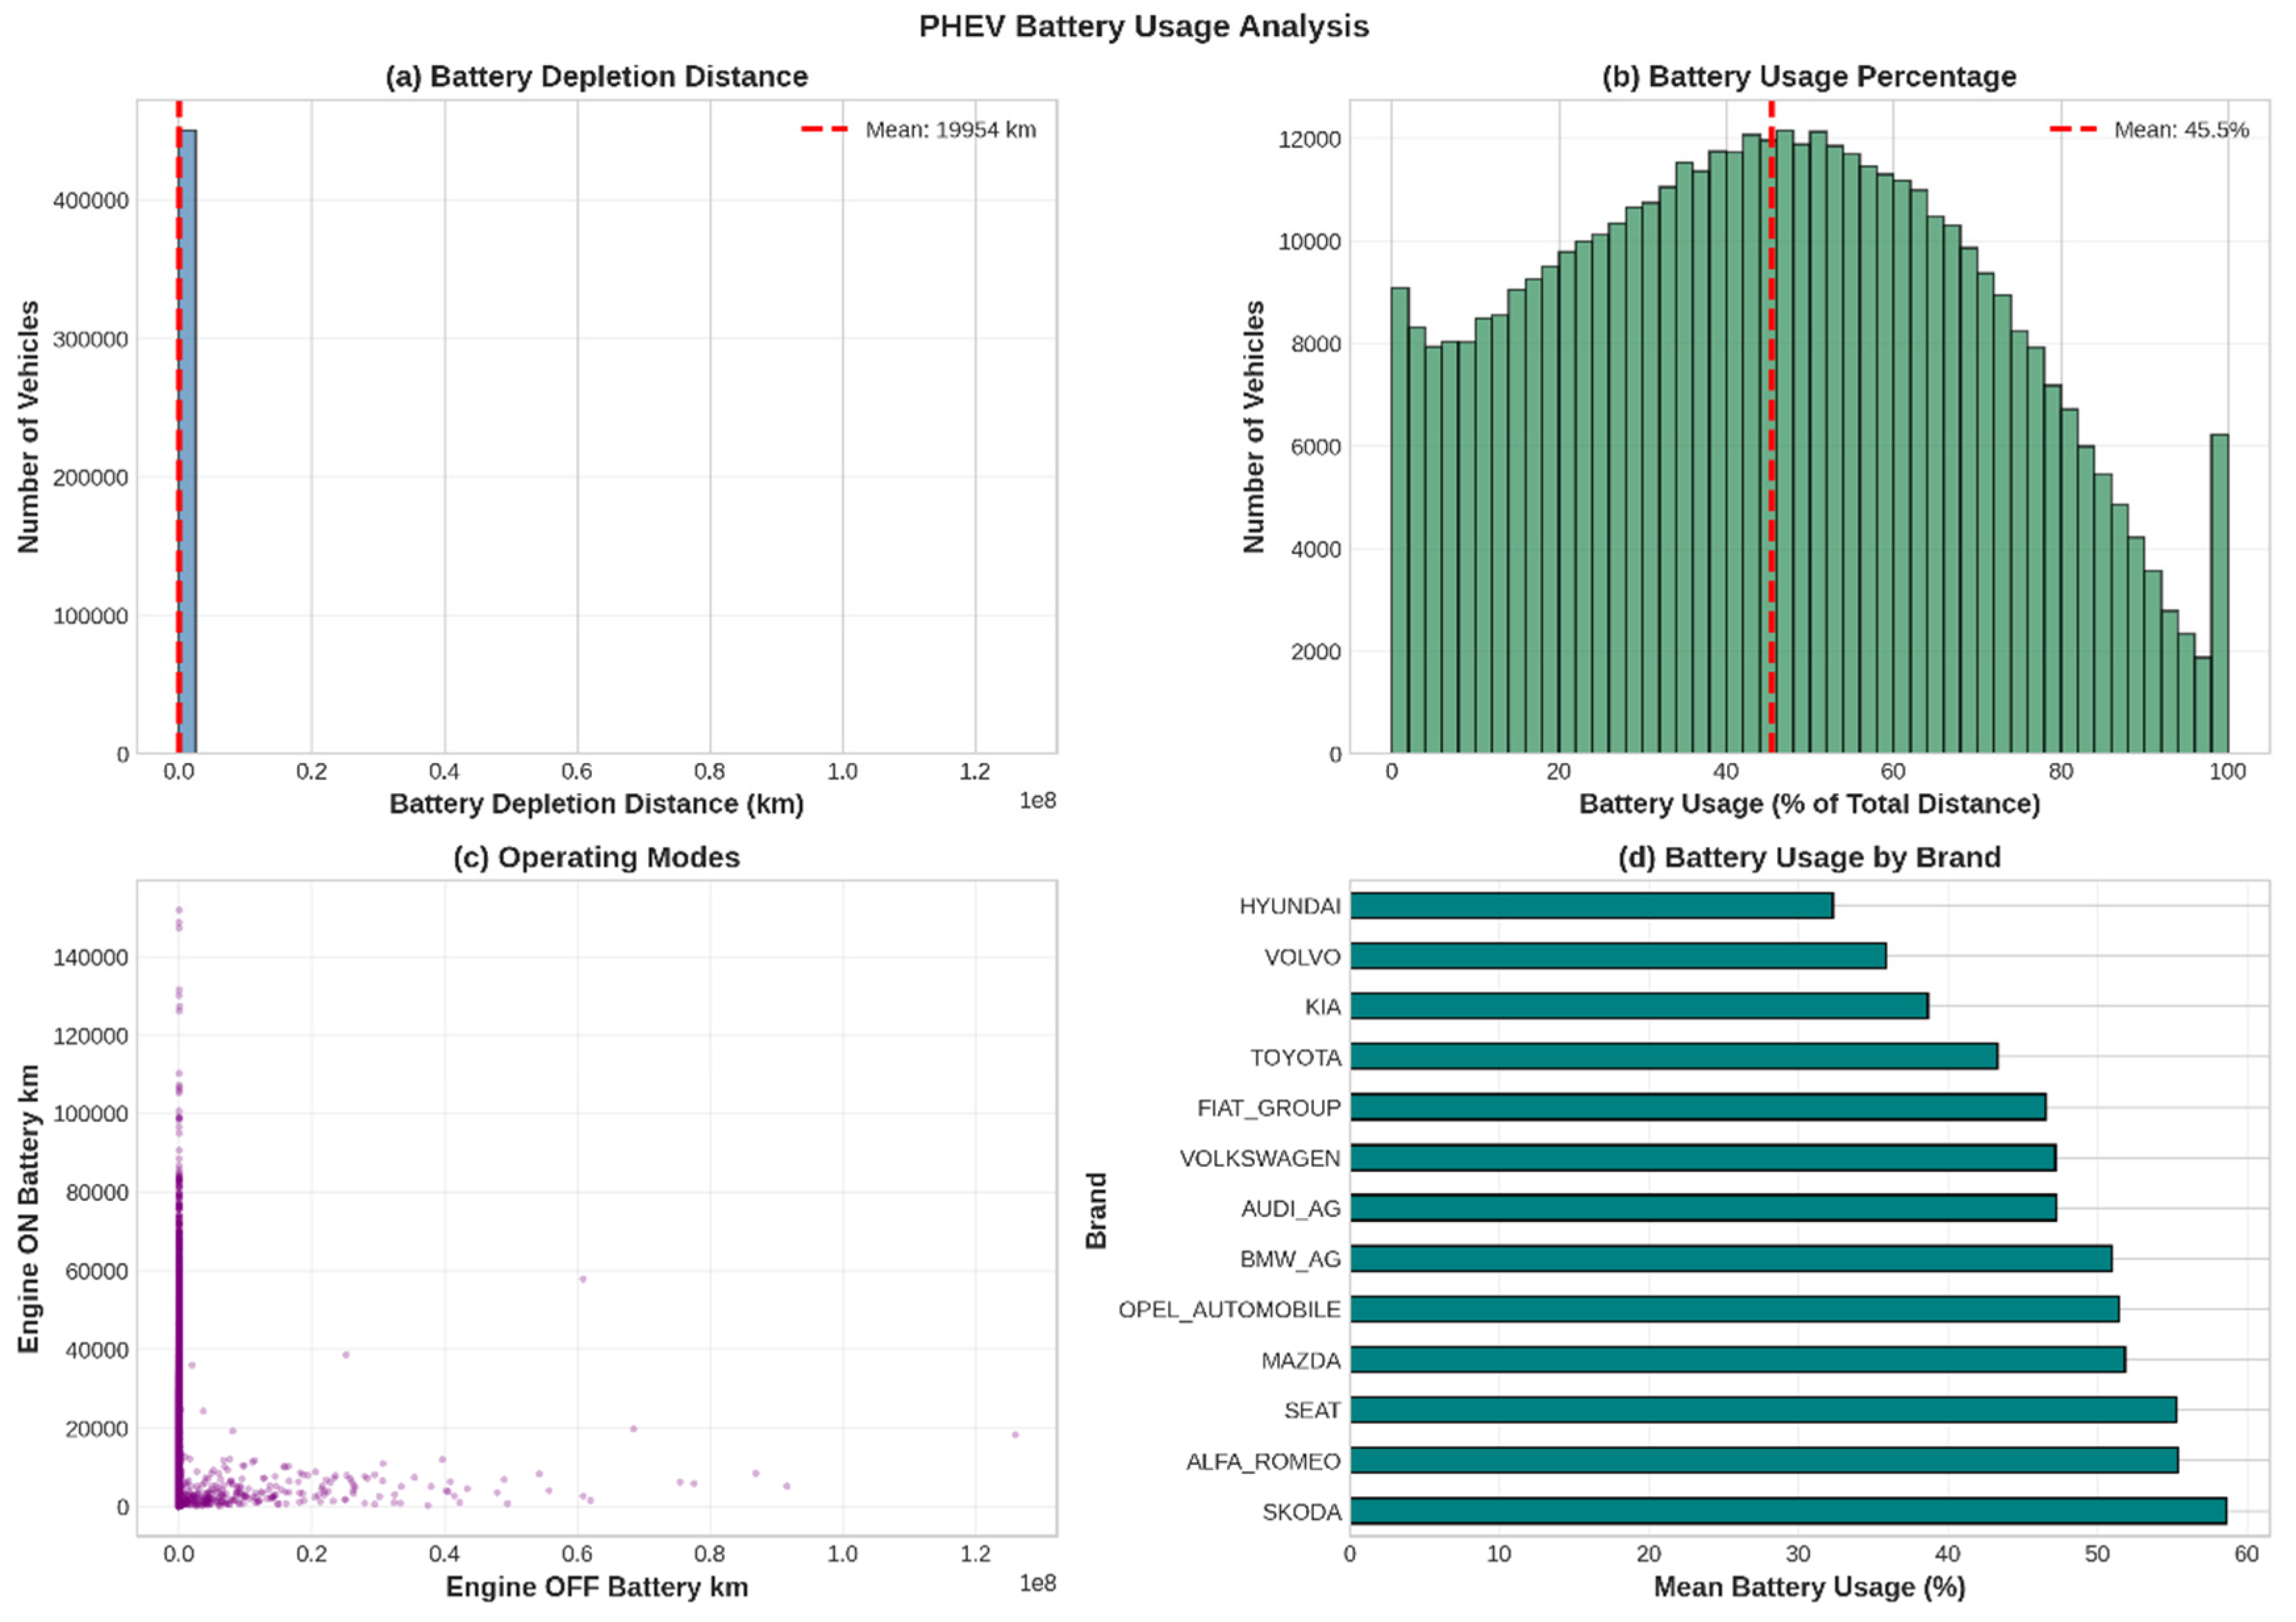
Figure 10.
Fuel consumption and regulatory gap trade-off analysis.
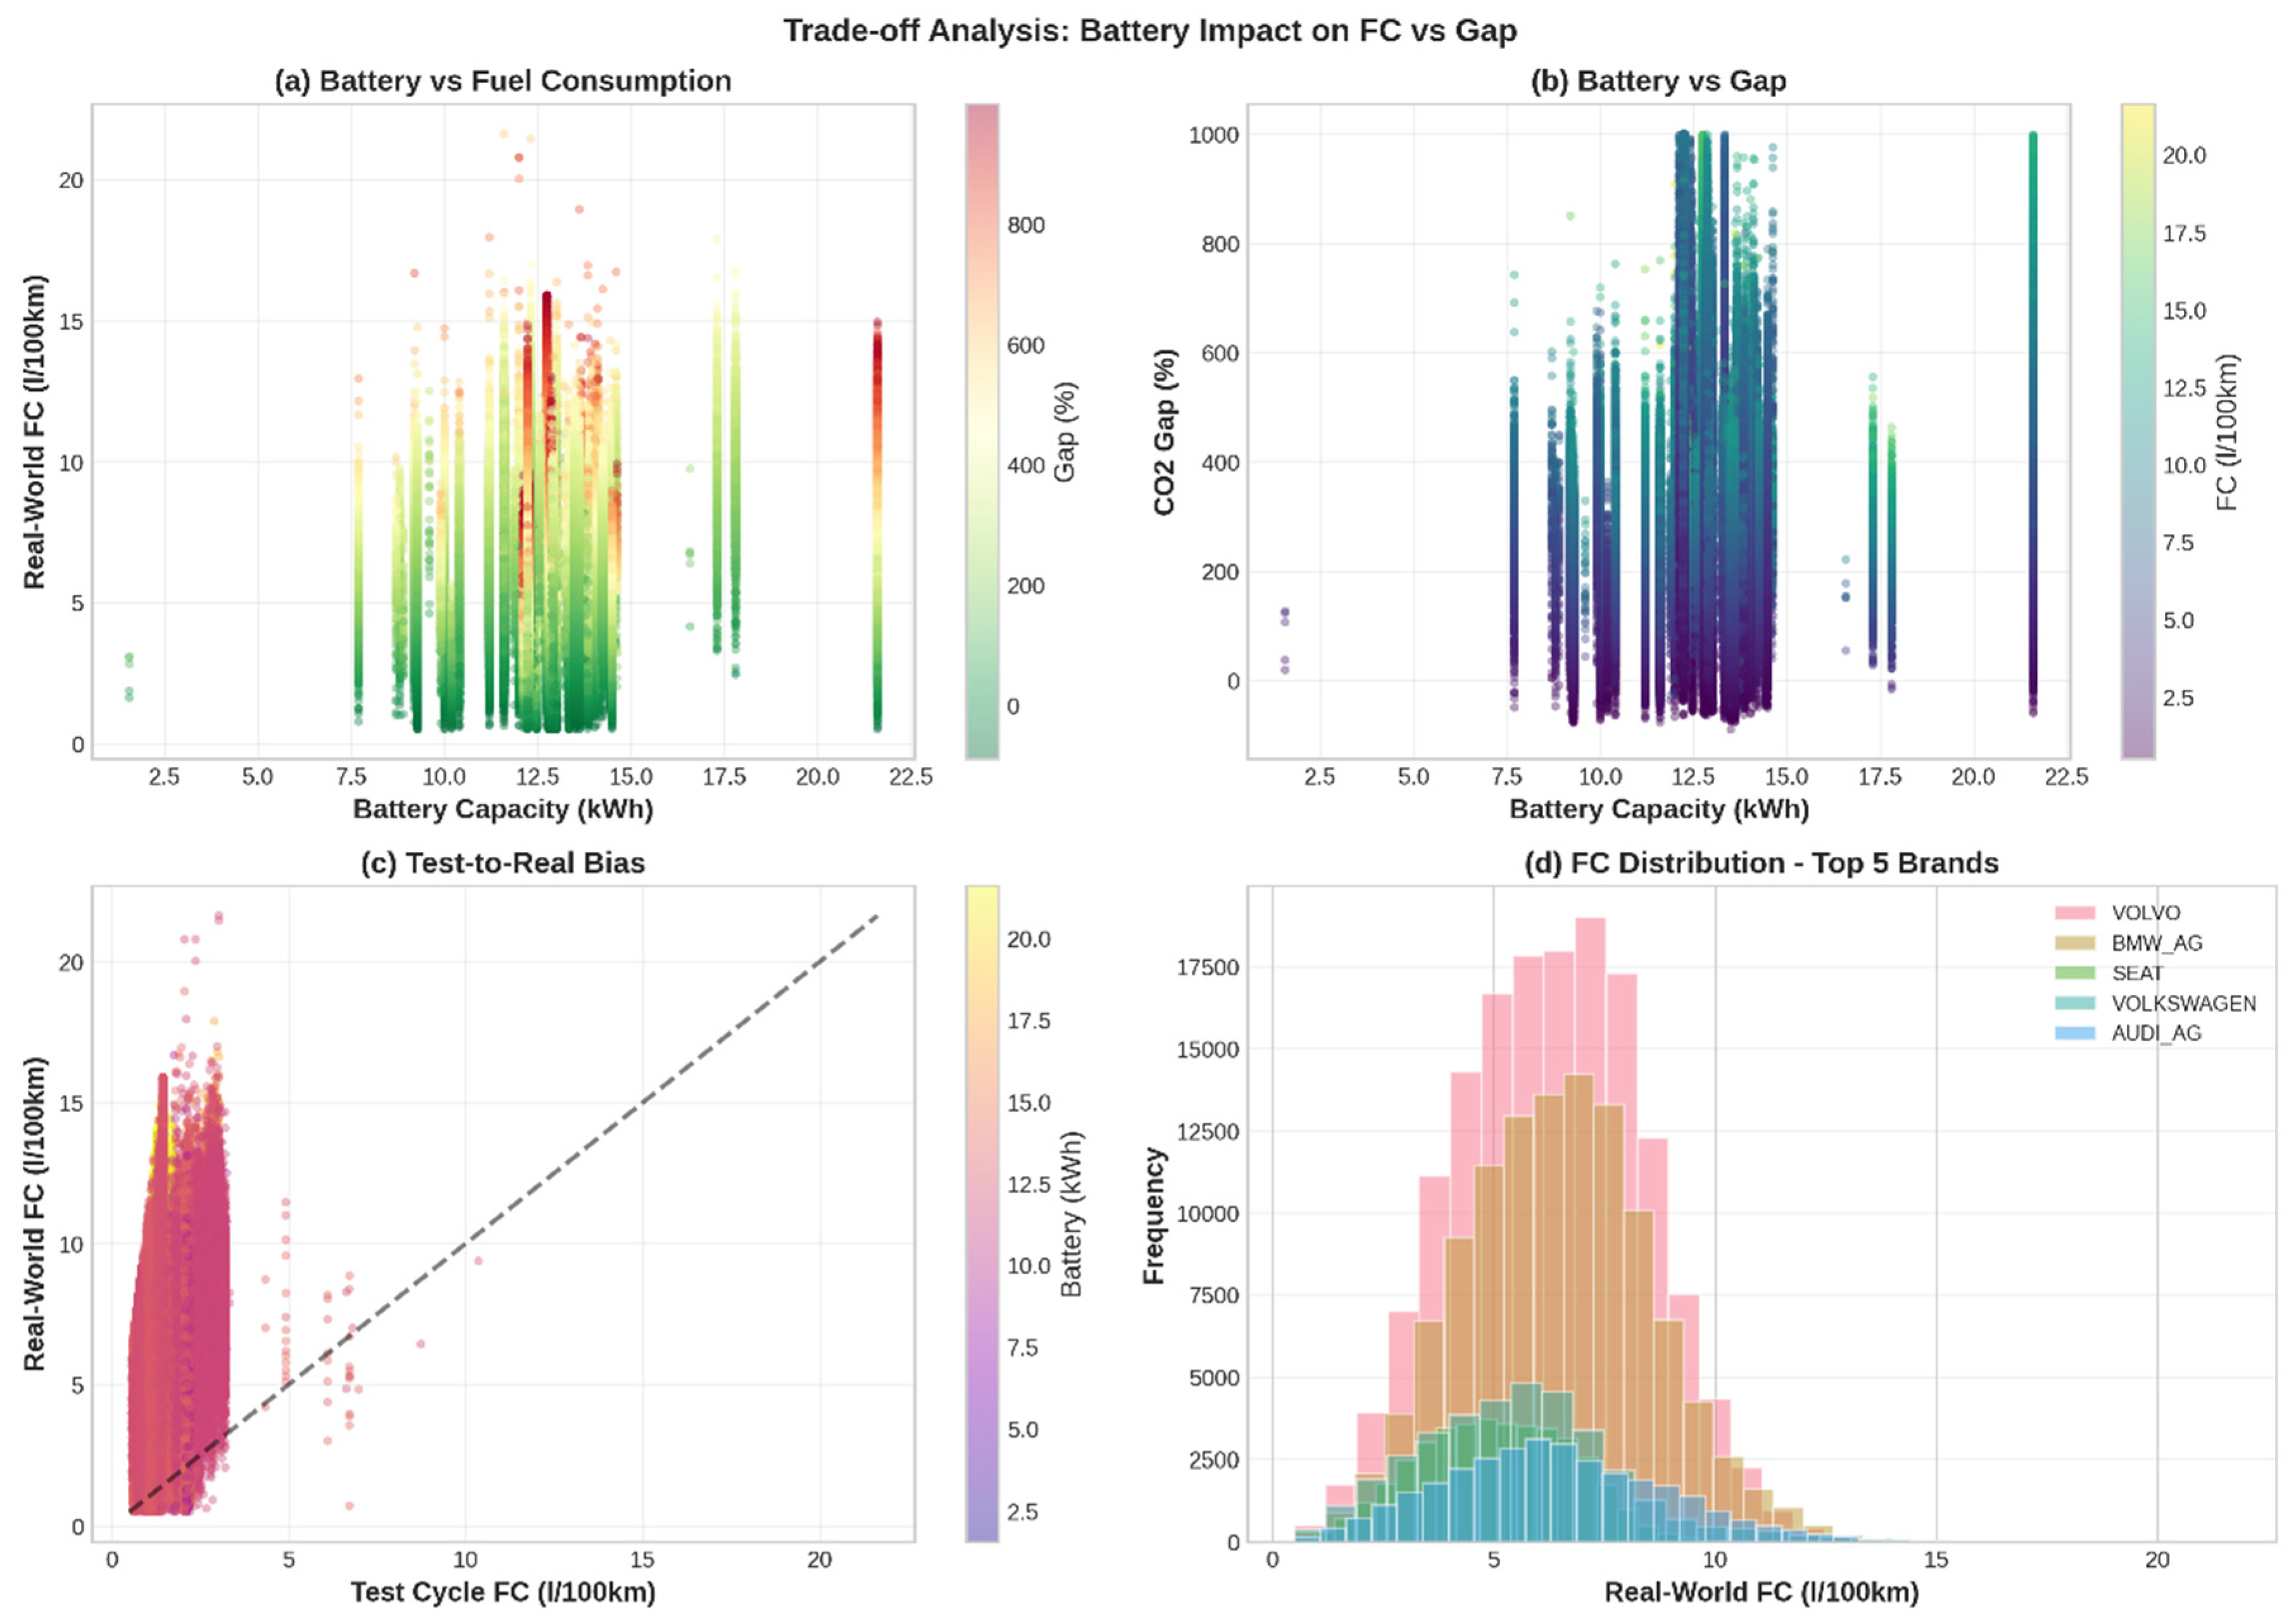
Figure 11.
Policy impact: emissions reduction scenarios.
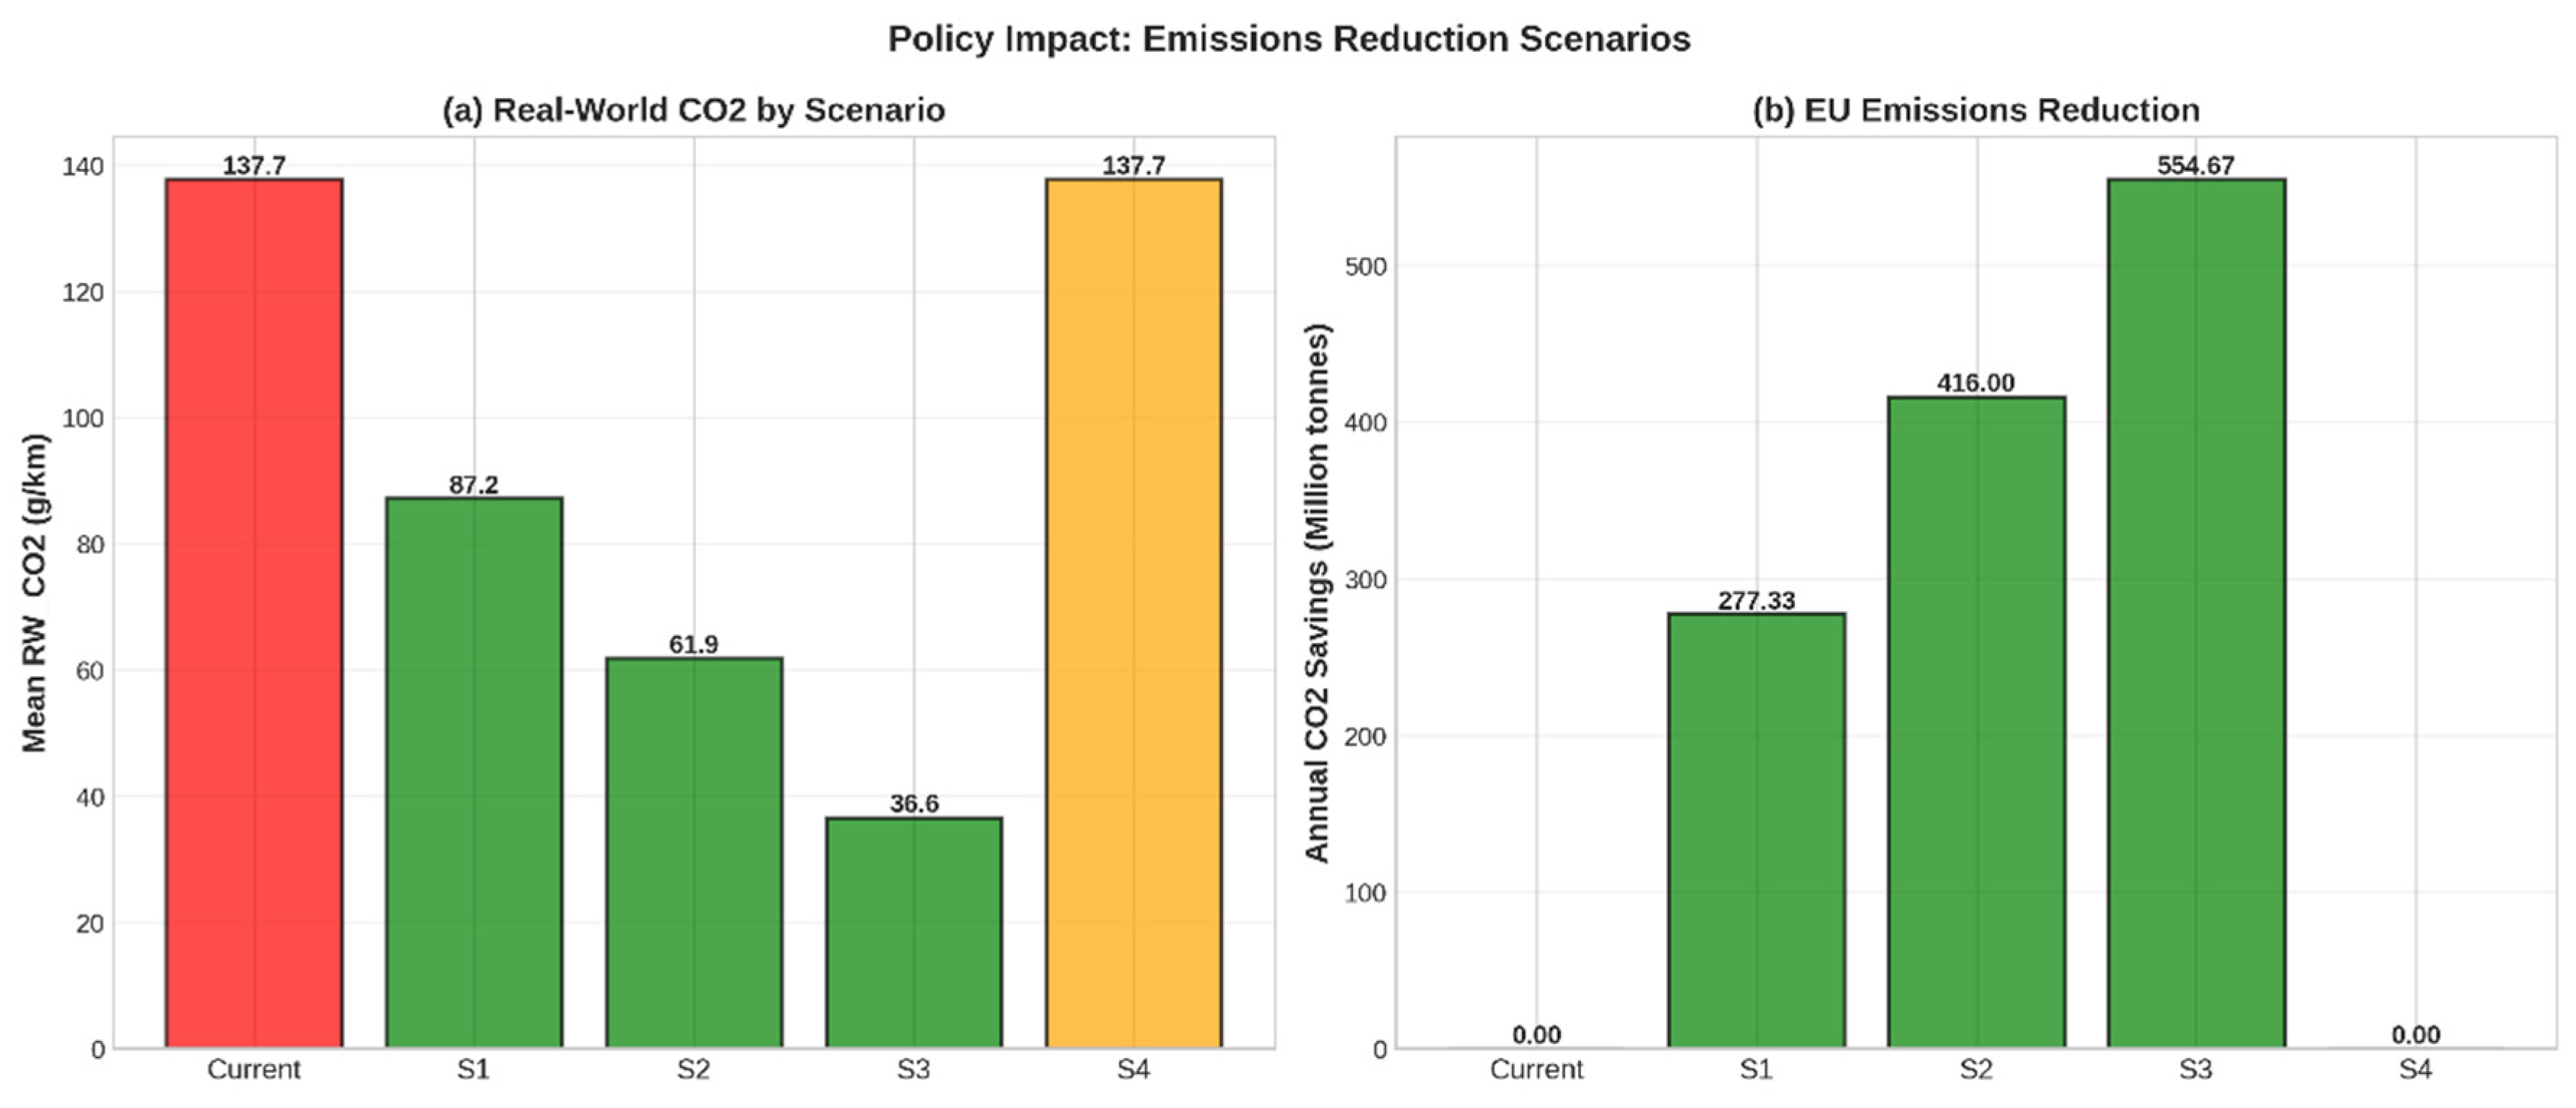

Table 1.
Specification of the amount of data and manufacturers used in the study.
| Manufacturer | Count | % |
|---|---|---|
| Volvo Car Group | 155,302 | 33.9% |
| BMW Group | 115,685 | 25.3% |
| Fiat Group | 40,056 | 8.8% |
| Volkswagen Group | 35,983 | 7.9% |
| Audi Group | 31,839 | 7.0% |
| Skoda | 19,425 | 4.2% |
| Mazda | 17,923 | 3.9% |
| Toyota | 15,530 | 3.4% |
| Opel | 7,620 | 1.7% |
| KIA | 3,225 | 0.7% |
| Alfa Romeo | 1,915 | 0.4% |
| Hyundai | 123 | 0.03% |
| Total | 457,303 | 100% |
Table 2.
Descriptive Statistics of PHEV Sample; *TA_CO2 = Test-cycle (WLTP) predicted CO2; gap% = (RW_CO2 - TA_CO2) / TA_CO2 × 100.
Table 2.
Descriptive Statistics of PHEV Sample; *TA_CO2 = Test-cycle (WLTP) predicted CO2; gap% = (RW_CO2 - TA_CO2) / TA_CO2 × 100.
| Statistic | RW_CO2 (g/km) | RW_FC (L/100km) | gap% (%) | Battery (kWh) | TA_CO2 (g/km)* |
|---|---|---|---|---|---|
| N | 457,303 | 457,303 | 457,303 | 457,303 | 457,303 |
| Mean | 137.7 | 6.05 | 300.3 | 13.04 | 45.8 |
| Median | 136.3 | 5.98 | 273.9 | 12.86 | 45.2 |
| Std Dev | 50.7 | 2.23 | 170.4 | 2.38 | 18.3 |
| Min | 11.4 | 0.50 | -89.3 | 1.56 | 8.2 |
| Max | 492.7 | 21.63 | 1000.0 | 21.60 | 156.4 |
| 25th %ile | 101.3 | 4.45 | 180.0 | 12.00 | 31.5 |
| Median | 136.3 | 5.98 | 273.9 | 12.86 | 45.2 |
| 75th %ile | 171.3 | 7.52 | 391.6 | 13.61 | 58.7 |
| IQR | 70.0 | 3.07 | 211.6 | 1.61 | 27.2 |
| Skewness | 0.87 | 0.92 | 1.34 | -0.15 | 1.15 |
| Kurtosis | 1.64 | 2.18 | 2.87 | 0.52 | 2.31 |
| 95% CI (mean) | [137.3, 138.1] | [6.01, 6.09] | [298.5, 302.1] | [12.98, 13.10] | [45.3, 46.3] |
Table 3.
Pearson correlation matrix of key variables; ***p < 0.001 (highly significant).
| RW_CO2 | RW_FC | gap% | Battery (kWh) | |
|---|---|---|---|---|
| RW_CO2 | 1 | 1.000*** | 0.656*** | 0.123*** |
| RW_FC | 1 | 1 | 0.656*** | 0.134*** |
| gap% | 0.656*** | 0.656*** | 1 | 0.274*** |
| Battery (kWh) | 0.123*** | 0.134*** | 0.274*** | 1 |
Table 4.
PHEV Performance Metrics by Manufacturer.
| Brand | N | RW_CO2 Mean (g/km) | RW_CO2 SD | RW_CO2 Median | gap% Mean (%) | gap% Median (%) | Battery (kWh) | Lifetime km |
|---|---|---|---|---|---|---|---|---|
| VOLVO | 155,302 | 143.1 | 48.2 | 143.9 | 287.2 | 239.7 | 12.19 | 27,999 |
| BMW_AG | 115,685 | 146.7 | 48.7 | 146.5 | 308.0 | 286.5 | 13.76 | 31,424 |
| SEAT | 40,056 | 114.8 | 39.1 | 114.8 | 274.6 | 271.0 | 12.98 | 23,235 |
| VOLKSWAGEN | 35,983 | 125.7 | 51.7 | 124.7 | 301.4 | 297.2 | 13.11 | 23,117 |
| AUDI_AG | 31,839 | 144.9 | 57.4 | 141.5 | 315.6 | 316.7 | 13.62 | 28,484 |
| SKODA | 19,425 | 117.8 | 35.1 | 120.6 | 347.4 | 356.7 | 13.81 | 34,374 |
| MAZDA | 17,923 | 170.2 | 64.4 | 161.9 | 416.9 | 391.5 | 12.76 | 12,780 |
| TOYOTA | 15,530 | 87.9 | 35.8 | 84.0 | 298.0 | 280.2 | 12.82 | 21,817 |
| FIAT_GROUP | 12,677 | 139.7 | 42.8 | 140.5 | 205.7 | 207.5 | 14.16 | 25,668 |
| OPEL_AUTO | 7,620 | 122.0 | 44.2 | 118.5 | 297.7 | 286.3 | 13.67 | 21,686 |
| KIA | 3,225 | 110.5 | 43.3 | 109.0 | 243.6 | 242.7 | 13.96 | 25,475 |
| ALFA_ROMEO | 1,915 | 140.6 | 45.7 | 141.7 | 352.2 | 355.4 | 13.93 | 6,365 |
| HYUNDAI | 123 | 114.5 | 35.3 | 107.7 | 249.2 | 248.98 | 12.20 | 25,758 |
| OVERALL | 457,303 | 137.7 | 50.7 | 136.3 | 300.3 | 273.9 | 13.04 | 27,487 |
Table 5.
Normality testing results.
| Variable | Shapiro-Wilk p-value | D’Agostino-Pearson p-value | Interpretation |
|---|---|---|---|
| RW_CO2 | < 0.001 | < 0.001 | NOT NORMAL (slight right-skew) |
| gap% | < 0.001 | < 0.001 | NOT NORMAL (extreme right-skew, outliers) |
| RW_FC | < 0.001 | < 0.001 | NOT NORMAL (slight right-skew) |
| Battery (kWh) | < 0.001 | < 0.001 | NOT NORMAL (bimodal, discrete values) |
Table 6.
Policy scenario results – emissions reduction potential.
| Scenario | Target Gap % | Mean RW_CO2 (g/km) | CO2 Reduction (g/km) | Reduction % | Annual EU Savings (Mt CO2) | % Of Transport Sector Target |
|---|---|---|---|---|---|---|
| Current (Baseline) | 300% (actual) | 137.7 | — | — | — | — |
| S1: Gap→50% | 150% of current | 87.2 | -50.5 | -36.7% | 277 | 30.7% |
| S2: Gap→25% | 75% of current | 61.9 | -75.8 | -55.0% | 416 | 46.2% |
| S3: Perfect (Gap→0%) | 0% | 36.6 | -101.1 | -73.4% | 555 | 61.6% |
| S4: Better driving (Gap→100%) | 100% of current | 137.7 | 0.0 | 0.0% | 0 | 0.0% |
Disclaimer/Publisher’s Note: The statements, opinions and data contained in all publications are solely those of the individual author(s) and contributor(s) and not of MDPI and/or the editor(s). MDPI and/or the editor(s) disclaim responsibility for any injury to people or property resulting from any ideas, methods, instructions or products referred to in the content. |
© 2026 by the authors. Licensee MDPI, Basel, Switzerland. This article is an open access article distributed under the terms and conditions of the Creative Commons Attribution (CC BY) license (http://creativecommons.org/licenses/by/4.0/).
Copyright: This open access article is published under a Creative Commons CC BY 4.0 license, which permit the free download, distribution, and reuse, provided that the author and preprint are cited in any reuse.


