
Submitted:
22 January 2026
Posted:
23 January 2026
You are already at the latest version
Abstract
In this work, poly(3-dodecylthiophene) (P3DDT) thin films were electrochemically synthesized using tetraethylammonium tetrafluoroborate (Et4NBF4) electrolyte. After synthesis, the films were deposited onto fluorine-doped tin oxide (FTO) substrates and subjected to optical and electrical characterizations to investigate their photophysical and electronic properties. Optical analyses were performed using ultraviolet-visible absorption spectroscopy (UV-Vis), photoluminescence spectroscopy (PL), emission ellipsometry (EE) and Raman spectroscopy. The results revealed the formation of distinct structures during the electropolymerization process, which significantly affected the optical behavior observed in the UV-Vis and PL spectra. Furthermore, the EE measurements provided insights into the impact of these structures on the polarization states of emitted and transmitted light, on energy and charge transfer mechanisms, and on the photophysical behavior of P3DDT. Variations in the degree of polarization (P), anisotropy factor (r), and asymmetry factor (g) were analyzed as a function of the emission wavelength. The results confirm the potential of P3DDT as an active layer in electroluminescent devices, as the emissive material used in the active layer consisted exclusively of this polymer.
Keywords:
electropolymerization
; emission ellipsometry
; conjugated polymers
1. Introduction
Conjugated polymers have attracted significant attention due to their semiconducting behavior and potential applications in optoelectronic devices such as organic light-emitting diodes (OLEDs), field-effect transistors, and solar cells [1,2,3,4,5]. Among these, the poly(3-alkylthiophene) (P3AT) family stands out for its processability, thermal stability, and tunable optoelectronic properties resulting from π-conjugated backbones and side-chain functionalization [6]. These materials exhibit delocalized electronic structures that enable efficient charge transport and light emission, making them promising candidates for the development of advanced organic devices.
Poly(3-dodecylthiophene) (P3DDT), a long-chain derivative of P3ATs, is of particular interest due to its ability to form thin films with high degrees of molecular order and optical anisotropy [7,8]. However, most studies involving P3DDT have focused on chemically synthesized samples, whereas investigations of films obtained via electrochemical polymerization remain limited [9]. Electrochemical synthesis offers several advantages, including fine control over film thickness and morphology, reproducibility, and the direct deposition of films onto conductive substrates. Furthermore, the nature of the supporting electrolyte used in the polymerization process plays a crucial role in determining the oxidation potential, chain growth mechanism, and the final structural and electronic characteristics of the film [10,11,12].
Despite its advantages, the impact of the supporting electrolyte on the photophysical and vibrational behavior of electrochemically synthesized P3DDT films has not been extensively investigated. A deeper understanding of how synthetic parameters influence energy gap values, polarization states of emitted light, and molecular ordering is essential for tailoring material properties for specific applications. In this context, spectroscopic techniques such as UV-Vis absorption, photoluminescence (PL), Raman spectroscopy, and emission ellipsometry (EE) provide detailed insight into the relationship between synthesis conditions and optical performance [13,14,15].
This work aims to perform a comprehensive optical and vibrational characterization of electrochemically synthesized P3DDT films using tetraethylammonium tetrafluoroborate (Et4NBF4) electrolyte. By combining PL, Raman, and EE analyses, we investigate how the number of electropolymerization cycles influence molecular organization, optical anisotropy, and photophysical behavior.
2. Experimental
In this study, P3DDT was obtained in the form of thin films deposited onto fluorine-doped tin oxide (FTO) substrates. The films were synthesized electrochemically from the 3-dodecylthiophene monomer (C16H28S) in an electrolytic solution. This solution consisted of a solvent, a supporting electrolyte, and the monomer.
For the preparation of the electrolytic solution, acetonitrile (CH3CN) was used as the solvent, combined with the 3-dodecylthiophene monomer at a concentration of 0.05 mol·L-1 and the supporting electrolyte tetraethylammonium tetrafluoroborate ((C2H5)4NBF4 or Et4NBF4) at a concentration of 0.10 mol·L-1.
The synthesis of thiophene-based polymeric thin films is commonly achieved through either chemical or electrochemical polymerization methods. In the present work, the electrochemical route was employed. This technique consists of immersing electrodes in an electrolytic solution containing the monomer, and applying a cyclic potential that initiates and controls the growth of the film. The applied potential must be equal to or greater than the oxidation potential of the monomer in order to promote polymerization via oxidative coupling and deposition of the polymer onto the working electrode.
The films were electropolymerized onto fluorine-doped tin oxide (FTO) substrates using the cyclic voltammetry (CV) technique, performed with an IVIUM COMPACTSTAT Potentiostat/Galvanostat. Film thickness was controlled by varying the number of voltammetric cycles applied to each sample. The electrochemical cell was composed of three electrodes: a platinum auxiliary electrode, a reference electrode containing deionized water saturated with potassium chloride (KCl), and the working electrode (FTO). The electrodes were immersed in an argon-purged electrolyte solution consisting of acetonitrile (CH3CN), the 3-dodecylthiophene monomer, and an inert supporting electrolyte at controlled concentration.
Figure S1 shows a typical CV curve, illustrating the electrochemical events involved in the electropolymerization process. After the electrochemical synthesis process was completed, the polymeric films were obtained, deposited onto FTO substrates. The films were characterized using standard spectroscopic techniques. These included ultraviolet-visible absorption spectroscopy (UV-Vis), photoluminescence spectroscopy (PL), Raman spectroscopy and emission ellipsometry (EE).
3. Discussion
The cyclic voltammetry (CV) synthesis of the P3DDT film was carried out through the electrochemical oxidation of monomers in aqueous solution. In this technique, monomers near the working electrode (WE) undergo oxidative coupling reactions, leading to the formation of polymer chains that are progressively deposited onto the electrode surface. The length of the polymer chains formed is limited by the saturation threshold of the growing chain. With each CV cycle, newly formed chains are deposited atop the previously polymerized layer, resulting in a progressive increase in film thickness.
Figure 1 shows the cyclic voltammogram for a P3DDT film synthesized with 10 cycles. The voltammogram reveals a difference of 0.56 V in the oxidation potential and 0.32 V in the reduction potential between the first and last cycle. This shift in potential indicates continuous film growth throughout successive cycles, leading to a thicker film [16]. As the number of electropolymerization cycles increases, multiple polymer layers are formed until the film reaches a saturation point, beyond which further chain deposition is no longer possible [17,18]. Table 1 shows the values of the potential peak as a function of the number of the cycles for P3DDT10 film.
The anodic peak potential shifts from 0.84 V (1 cycle) to 0.55 V (10 cycles), indicating that the oxidation of new monomers becomes progressively easier as the film grows. This behavior is consistent with the p-type nature of polythiophenes, upon successive oxidation cycles, the polymer layer becomes doped with positive charge carriers (polarons and bipolarons), increasing its electrical conductivity and facilitating charge transport at the interface [19,20].
From the 8th cycle onwards, this value remains almost unchanged significantly, suggesting that the process reaches a steady growth regime [21]. On the other hand, the cathodic peak shifts in the opposite direction, moving to more positive values as the number of cycles increases (from 1.25 V at 2 cycles to 1.82 V at 10 cycles). This shift reflects the increasing difficulty of dedoping in thicker and more dense films, where ion transport becomes more limited and doped states are more stabilized [22,23]. The gradual increase in the potential difference between oxidation and reduction peaks reinforces this interpretation, showing that film growth is accompanied by greater kinetic and mass transport constraints [19,22].
Figure 2(a) presents the UV-Vis absorption spectra of the film synthesized with 1 electropolymerization cycle. The main absorption band is centered around 450 nm and is attributed to the π-π* electronic transition. For films obtained with a higher number of cycles, this band remains present. Additionally, a broad absorption feature extending from ~775 to 810 nm emerges (see Figure S2). This lower-energy band is commonly associated with polaronic states, originating from the interaction between the BF4- counter-ion and the polymer backbone during the electropolymerization process [10,12,24,25,26].
Based on the UV-Vis absorption data, the optical bandgap (Eg) associated with the π-π* transition was determined using the Tauc plot method, as shown in Figure 2(b). The extracted Eg values, summarized in Table 2, are very similar among the samples and are consistent with those reported in previous studies [28,29]. In addition, the energy associated with the polaronic absorption band was estimated by applying the Tauc analysis to the low-energy absorption region, yielding a value of approximately 1.41 0.01 eV, as shown in Figure S3.
Figure 3(a) presents the normalized photoluminescence (PL) spectra of P3DDT films electropolymerized with different numbers of cycles. The excitation wavelength was set at 450 nm, in agreement with the maximum absorption band observed in Figure 2(a). All spectra exhibit broad emission profiles, which are characteristic of polythiophenes and can be attributed to the distribution of conjugation lengths and the coexistence of multiple emissive states along the polymer chains [30,31].
The PL spectra show that increasing the number of electropolymerization cycles leads to a progressive redshift of the emission maximum, indicating an increase in the effective conjugation length and enhanced interchain interactions, including π-π stacking [12]. For instance, the film synthesized with 10 cycles exhibits a broadened and red-shifted emission band centered around 600 nm, extending toward the near-infrared region. It should be noted that, for thicker films, the presence of low-energy absorption features may also contribute to self-absorption effects, partially influencing the spectral shape and the apparent redshift of the PL emission. Therefore, the observed redshift in the PL spectra with increasing cycle number is likely governed by a combination of intrinsic photophysical effects, including extended conjugation and aggregation, and extrinsic optical effects related to self-absorption.
To better understand the nature of the emission, Figure 3(b) shows the deconvolution of the PL spectra for the films obtained with 10 cycles. Gaussian fitting was used to resolve the different contributions, following approaches reported for other polymers in the P3AT family [10,14,32]. The analysis reveals four main components. The first, at ~516 nm, is associated with shorter conjugated segments, consistent with oligomeric chain length limitation [33]. The second band, centered around ~584 nm, is assigned to quinoid structures formed by the interaction of the salt with the polymer backbone as [10,34]. The third contribution, observed at ~638 nm, corresponds to pristine structures with minimal interaction from counter-ions [10,14,34]. Finally, the feature near ~680 nm is attributed to electron-phonon coupling processes, a relaxation mechanism also reported for other members of the P3AT family [24,26]. For the other films see Figure S4 in supplementary materials. Evidence of quinone structure formation is provided by Raman spectroscopy (Figure 5), where the bands at 1451 cm⁻¹ and 1461 cm⁻¹ are characteristic of bipolaron (radical dication) and polaron (radical cation) states, respectively, which are strongly present in the quinone structures formed in poly (3-alkylthiophenes) [12,33].
Table 3 summarizes the positions of all spectral contributions identified in the photoluminescence spectra of the films. All contributions appear centered at similar wavelengths regardless of the number of electropolymerization cycles, although their relative intensities vary, as shown in Figure 3(b). These intensity variations affect the overall spectral shape, leading to shifts in the emission maxima observed in the PL spectra. Additionally, a broad band centered around 680 nm is observed, which is attributed to electron-phonon interactions related to the energy dissipation pathways of excited charge carriers [24,26]. The presence of this phonon-related band is consistent with the vibrational structure identified in the UV-Vis spectra Figure S2.
Raman characterizations and adjustments of all emission spectra are presented in Figure 4. Three dominant vibrational modes are detected at 1456 cm-1, 2786 cm-1, and 2875 cm-1. The first is assigned to the Cα=Cβ symmetric stretching, whereas the other two correspond to C-H stretching modes of the -CH₂ and -CH₃ groups present in the side chains of the polymer [13,35,36,37]. All samples presented similar spectra. However, the intensity of the main peak decreased with increasing cycle numbers, reaching a plateau after four cycles. This behavior can be associated with increasing film thickness, which leads to a more compact organization of the polymer chains. Consequently, there is a relative reduction in the contribution of some vibrational modes, in addition to additional effects related to limited penetration of the exciting beam and self-extinction processes, resulting in a stabilization of the observed intensity.
The modes at 1378 and 1450 cm-1 are sensitive to the π-electron delocalization [38]. The 1456 cm-1 band includes contributions from pristine, bipolaron (radical dication), and polaron band (radical cation) at 1421, 1451, and 1461 cm-1, respectively [12], which were resolved by Gaussian fitting (Figure 5).
Figure 5.
Normalized Raman spectrum deconvolution of P3DDT10.

The analysis of the emission spectra through the Fourier transform method allows for the extraction of the Stokes parameters S0, S1, S2 and S3. These parameters are directly related to the polarization states of light and, consequently, to factors associated with the orientation of polymer chains within the samples shown in Equations 1(a)-1(d) [11,39,40].
These parameters satisfy the following relation:
This relationship provides valuable insight into the molecular ordering of the films. Although conjugated polymer films synthesized electrochemically by cyclic voltammetry typically do not exhibit long-range molecular organization [11], emission ellipsometry can detect subtle anisotropies arising from partial chain alignment, aggregation, or film thickness variations. The Stokes parameters thus serve as a powerful tool for evaluating the anisotropic optical behavior of the material and for understanding how synthesis parameters, such as the choice of supporting electrolyte and the number of electropolymerization cycles, influence film structure.
The parameter S0 is related to the total emitted light intensity; S1 represents the component linearly polarized along the horizontal or vertical axes; S2 corresponds to linear polarization at ±45° relative to the polarizer positioned before the spectrophotometer; and S3 denotes the portion of light that is circularly polarized, either right or left-handed [11].
Figure 6 shows the emission ellipsometry (EE) spectra for P3DDT films electropolymerized with 1 and 10 cycles. The results are expressed as normalized Stokes parameters (S1/S0, S2/S0 and S3/S0) as a function of wavelength, enabling investigation of the polarization characteristics of the emitted light.
In Figure 6(a), the S1/S0 curve reaches values comparable to those of thicker films but remains nearly constant across the emission range, while S2/S0 stays close to zero and S3/S0 is negligible. This constant behavior suggests that the emission arises mainly from localized states, where recombination is only weakly dependent on wavelength and energy transfer between domains is limited. A similar behavior is observed for the 2 cycle film (Figure S5(a)), indicating that in the early stages of growth interchain interactions are not yet efficient enough to promote wavelength-dependent transfer. However, from 4 cycles onward (Figure S5), S1/S0 and S2/S0 exhibit clear spectral inversions around 550-570 nm, revealing that the recombination dynamics become strongly dependent on emission energy. In the 10 cycle film Figure 6(b), this spectral dependence is even more pronounced, S1/S0 shifts from negative at shorter wavelengths to positive above ~550 nm, while S2/S0 follows the complementary behavior. Such evolution reflects the activation of interchain coupling and energy transfer pathways in thicker films, leading to recombination processes that are increasingly sensitive to the emission wavelength.
Figure 7 presents the polarization degree (P), anisotropy factor (r), and asymmetry factor (g) calculated from the Stokes parameters for the 10 cycle films. In Figure 7(a), the film exhibits a high polarization degree exceeding 30% across much of the spectral range, with a minimum near 560 nm. The anisotropy factor (r) is positive at shorter wavelengths and tapers off with increasing wavelength, suggesting strong in-plane alignment that becomes less pronounced in the red region. The asymmetry factor (g) remains near zero, indicating that circular polarization is negligible, again supporting the predominance of linear polarization, as expected for planar-aligned films [11]. The polarization, anisotropy factor and asymmetry factor are defined as:
To correlate the energy transfer process with the number of cycles, Figure 8 presents the polarization degree dependence of the three emission species (oligomers, quinones, and pristine chains) across all P3DDT samples. Where P = 1 when the light is totally polarized, 0 < P < 1 if the light is partially polarized, and P = 0 when the light is totally unpolarized [11,41].
Maximum emission polarization is observed for the P3DDT films processed with 2 cycles, suggesting an optimal structural ordering at this stage. In general, the three emissive species (oligomers, quinones, and pristine polymer chains) exhibit comparable polarization behavior in both curve profile and relative intensity as the number of cycles increases. However, the oligomer emission displays a distinct deviation from this behavior after the eighth cycle, indicating a possible alteration in molecular packing or energy transfer pathways specific to this species.
Following the method proposed by Therézio et al. and Schura et al [33,41], the photophysical processes occurring in electrochemically synthesized P3DDT for 10 cycles are summarized in Table 4. π+ 2 and π*+2 refers to HOMO and LUMO of the oligomeric chains, respectively; π+1 and π*+1 refers to HOMO and LUMO of the quinone chains, respectively; and, π and π* refers to HOMO and LUMO of the pristine chains, respectively [33].
The emission polarization dynamics, revealed by the refined S1/S0 spectrum, enable a more accurate assignment of the photophysical processes. Initially, in the 480-505 nm region, the S1/S0 curve exhibits a clear negative minimum (~-0.08), indicating that the emitted light is polarized perpendicularly to the excitation polarization. This behavior is characteristic of disordered oligomeric chains, which absorb the excitation but recombine in misaligned geometries, leading to emission redirected orthogonally.
As the emission progresses through the 505-540 nm region, S1/S0 rises sharply toward zero. This strong positive gradient reflects the transfer of excitation energy from the initial donor sites to more ordered acceptor species. The transition is interpreted as internal conversion to doped quinonic chains and possibly pristine domains. The absence of any peak structure in this region reinforces the idea of a non-radiative, highly efficient, and delocalized energy redistribution.
Between 540 and 600 nm, S1/S0 stabilizes around ~0.065, forming a distinct plateau. This region is attributed to polarized fluorescence from quinonic domains (π*+ 1 → π + 1 + hνQ), which maintains partial alignment with the excitation direction. The presence of this plateau confirms that a fraction of the transferred energy recombines radiatively in organized domains, consistent with partial planarization or ordering within the film.
Beyond 600 nm, the plateau continues with minor variations, indicating the presence of longer, pristine polymer chains and vibrationally coupled states that still exhibit measurable alignment (π* → π + hνp). These chains likely feature greater conjugation and reduced torsion, allowing retention of the excitation polarization even after vibrational relaxation.
The energy migration observed among oligomeric, quinonic, and pristine domains in electropolymerized P3DDT films can be interpreted within the model of Förster Resonance Energy Transfer (FRET) [42,43,44]. This non-radiative dipole-dipole mechanism explains the highly efficient (~93%) energy redistribution inferred from polarization-resolved emission. The overlap between the emission spectrum of the donor species (oligomers) and the absorption bands of acceptors (quinonic and pristine chains), combined with the nanoscale proximity imposed by the film morphology, satisfies the critical criteria for FRET. Moreover, the partial preservation of polarization (S1/S0 > 0) indicates a favorable orientational factor between donor and acceptor dipoles, enhancing the Förster transfer rate. The schematic energy diagram (Figure 9) illustrates this cascade transfer process, highlighting how the initial excitation energy (Ei) is channeled toward lower-energy domains (EF) before final radiative recombination. This behavior is particularly desirable in light-emitting applications.
4. Conclusions
Electropolymerized P3DDT films synthesized by cyclic voltammetry were systematically investigated through a combination of UV-Vis absorption, photoluminescence, Raman spectroscopy, and emission ellipsometry. The optical absorption revealed the characteristic π-π* transition near 450 nm and an additional broad band ~775 to 810 nm, associated with anion-polymer interactions or polaronic states. The optical gap, determined by Tauc analysis, ranged from 2.23 to 2.46 eV, consistent with values reported for polythiophenes. The photoluminescence response exhibited broad emission bands and a progressive redshift with increasing film thickness, resulting from increased conjugation length, aggregation domains and self-absorption effects. Deconvolution of PL further indicated contributions from oligomeric segments, quinoid and pristine structures, as well as electron-phonon relaxation. Raman spectroscopy confirmed these structural features, highlighting the coexistence of aromatic and charged species, while also showing intensity reduction with thicker films, consistent with chain compactation. Emission ellipsometry provided deeper insight into the recombination dynamics of the films. For the 1 and 2 cycles samples, S1/S0 and S2/S0 remained nearly constant across the emission range, indicating that the emission originated mainly from localized states with limited interchain coupling. However, from 4 cycles onward, S1/S0 and S2/S0 exhibited complementary spectral inversions around 550-570 nm, a behavior that became more pronounced at 10 cycles. This spectral dependence demonstrates that thicker films activate interchain interactions and energy transfer pathways, leading to recombination processes increasingly sensitive to emission wavelength. In all cases, S3/S0 remained negligible, confirming that the emission is confined to linear components. Overall, the results demonstrate that cyclic voltammetry enables the controlled growth of P3DDT films with tunable optical properties. The combination of extended conjugation and wavelength dependent recombination processes highlights the potential of these materials for optoelectronic applications, particularly in light-emitting devices, where controlling energy transfer mechanisms may represent a valuable strategy for device optimization.
Supplementary Materials
The following supporting information can be downloaded at the website of this paper posted on Preprints.org.
Author Contributions
Conceptualization: E.M.T.; data curation: E.C.R., A.C.K., S.S.S. and E.M.T.; formal analysis: E.C.R., A.C.K., S.S.S. and E.M.T.; funding acquisition and resources: R.J.R. and E.M.T.; investigation and validation: E.C.R., A.C.K., E.M.T., A.M. and R.J.R; methodology: A.M. and E.M.T.; project administration and supervision: R.J.R. and E.M.T.; writing —original draft: E.C.R. and A.C.K.; writing—review and editing: E.C.R., A.C.K., A.M. and E.M.T.. All authors have read and agreed to the published version of the manuscript.
Funding
This research was funded by Brazilian Development Agencies: CNPq (Process: 408449/2024-1 and 310112/2025-7), FAPESP (Process: 2025/27044-5 ).
Data Availability Statement
All data related to this study are available in this article or upon reasonable request.
Acknowledgments
The authors thank the following Brazilian Development Agencies: CNPq, INCT/INEO (Brazil), FAPEMAT and PROPeq/UFMT. The authors acknowledge that part of the data included in this manuscript were originally published as a chapter in an academic book. This article presents a revised and extended version of that work, with new interpretations and complementary analyses.
Conflicts of Interest
The authors declare no conflicts of interest.
References
- BUNDGAARD, E.; KREBS, F. Low Band Gap Polymers for Organic Photovoltaics. Solar Energy Materials and Solar Cells 2007, 91, 954–985. [Google Scholar] [CrossRef]
- Fujii, A.; Kawahara, H.; Yoshida, M.; Ohmori, Y.; Yoshino, K. Emission Enhancement in Electroluminescent Diode Utilizing Poly(3-Alkylthiophene) Doped with Oxadiazole Derivative. J Phys D Appl Phys 1995, 28, 2135–2138. [Google Scholar] [CrossRef]
- Valaski, R.; Moreira, L.M.; Micaroni, L.; Hümmelgen, I.A. The Electronic Behavior of Poly(3-Octylthiophene) Electrochemically Synthesized onto Au Substrate. Brazilian Journal of Physics 2003, 33, 392–397. [Google Scholar] [CrossRef]
- Seoul, C.; Kim, N.-H. Polymer Light-Emitting Diodes Based on Poly(3-Hexyl Thiophene). Fibers and Polymers 2000, 1, 25–31. [Google Scholar] [CrossRef]
- Liu, Y.; Xu, Y.; Zhu, D. Synthesis and Characterization of Poly(3-Alkylthiophene)s for Light-Emitting Diodes. Macromol Chem Phys 2001, 202, 1010–1015. [Google Scholar] [CrossRef]
- Wang, G.; Yuan, C.; Lu, Z.; Wei, Y. Enhancement of Organic Electroluminescent Intensity by Charge Transfer from Guest to Host. J Lumin 1996, 68, 49–54. [Google Scholar] [CrossRef]
- Yoshino, K.; Manda, Y.; Sawada, K.; Onoda, M.; Sugimoto, R. Anomalous Dependences of Luminescence of Poly(3-Alkylthiophene) on Temperature and Alkyl Chain Length. Solid State Commun 1989, 69, 143–146. [Google Scholar] [CrossRef]
- Ohmori, Y.; Uchida, M.; Muro, K.M.K.; Yoshino, K.Y.K. Visible-Light Electroluminescent Diodes Utilizing Poly(3-Alkylthiophene). Jpn J Appl Phys 1991, 30, L1938. [Google Scholar] [CrossRef]
- Roncali, J. Conjugated Poly(Thiophenes): Synthesis, Functionalization, and Applications. Chem Rev 1992, 92, 711–738. [Google Scholar] [CrossRef]
- Therézio, E.; Duarte, J.L.; Laureto, E.; Di Mauro, E.; Dias, I.; Marletta, A.; de Santana, H. Analysis of the Optical Properties of Poly(3-octylthiophene) Partially Dedoped. J Phys Org Chem 2011, 24, 640–645. [Google Scholar] [CrossRef]
- Therézio, E.M.; Franchello, F.; Dias, I.F.L.; Laureto, E.; Foschini, M.; Bottecchia, O.L.; de Santana, H.; Duarte, J.L.; Marletta, A. Emission Ellipsometry as a Tool for Optimizing the Electrosynthesis of Conjugated Polymers Thin Films. Thin Solid Films 2013, 527, 255–260. [Google Scholar] [CrossRef]
- Cervantes, T.N.M.; Bento, D.C.; Maia, E.C.R.; Fernandes, R.V.; Laureto, E.; Moore, G.J.; Louarn, G.; de Santana, H. The Influence of Different Electrolytes on the Electrical and Optical Properties of Polymer Films Electrochemically Synthesized from 3-Alkylthiophenes. Journal of Materials Science: Materials in Electronics 2014, 25, 1703–1715. [Google Scholar] [CrossRef]
- Cervantes, T.N.M.; Bento, D.C.; Maia, E.C.R.; Zaia, D.A.M.; Laureto, E.; da Silva, M.A.T.; Moore, G.J.; de Santana, H. In Situ and Ex Situ Spectroscopic Study of Poly(3-Hexylthiophene) Electrochemically Synthesized. Journal of Materials Science: Materials in Electronics 2012, 23, 1916–1921. [Google Scholar] [CrossRef]
- Rodrigues, M.; Bento, C.; Laureto, E.; Zaia, M.; Therézio, M.; Moore, G.; de, S. Spectroscopic Analysis of the Structure and Stability of Two Electrochemically Synthesized Poly(3-Alkylthiophene)s. Journal of the Serbian Chemical Society 2013, 78, 507–521. [Google Scholar] [CrossRef]
- Yoshino, K.; Hayashi, S.; Sugimoto, R. Preparation and Properties of Conducting Heterocyclic Polymer Films by Chemical Method. Jpn J Appl Phys 1984, 23, L899. [Google Scholar] [CrossRef]
- Obaid, A.Y.; El-Mossalamy, E.H.; Al-Thabaiti, S.A.; El-Hallag, I.S.; Hermas, A.A.; Asiri, A.M. Electrodeposition and Characterization of Polyaniline on Stainless Steel Surface via Cyclic, Convolutive Voltammetry and SEM in Aqueous Acidic Solutions. Int J Electrochem Sci 2014, 9, 1003–1015. [Google Scholar] [CrossRef]
- Jones, B.J.; Korzeniewski, C.; Franco, J.H.; Minteer, S.D.; Fritsch, I. Spatially Directed Functionalization by Co-Electropolymerization of Two 3,4-Ethylenedioxythiophene Derivatives on Microelectrodes within an Array. J Electrochem Soc 2020, 167, 166511. [Google Scholar] [CrossRef]
- Amaral, M.P.; Babu, R.S.; Samyn, L.M.; Barros, A.L.F. de Electrosynthesis of PolyFilm Modified Graphite Electrode and Its Application Towards Determination of Thymine. Materials Research 2025, 28. [Google Scholar] [CrossRef]
- Guiseppi-Elie, A.; Pradhan, S.R.; Wilson, A.M.; Allara, D.L.; Zhang, P.; Collins, R.W.; Kim, Y.T. Growth of Electropolymerized Polyaniline Thin Films. Chemistry of Materials 1993, 5, 1474–1480. [Google Scholar] [CrossRef]
- Gkili, C.; Deligiannakis, K.; Lappa, E.; Papoulia, C.; Sazou, D. Electrodeposition of Polyaniline on Tantalum: Redox Behavior, Morphology and Capacitive Properties. Molecules 2023, 28, 7286. [Google Scholar] [CrossRef]
- Sharma, P.S.; Pietrzyk-Le, A.; D’Souza, F.; Kutner, W. Electrochemically Synthesized Polymers in Molecular Imprinting for Chemical Sensing. Anal Bioanal Chem 2012, 402, 3177–3204. [Google Scholar] [CrossRef] [PubMed]
- Marchesi D’Alvise, T.; Sunder, S.; Hasler, R.; Moser, J.; Knoll, W.; Synatschke, C. V.; Harvey, S.; Weil, T. Preparation of Ultrathin and Degradable Polymeric Films by Electropolymerization of 3-Amino- l -tyrosine. Macromol Rapid Commun 2023, 44. [Google Scholar] [CrossRef]
- Kim, K.-G.; Kim, S.Y. Increase in Interfacial Adhesion and Electrochemical Charge Storage Capacity of Polypyrrole on Au Electrodes Using Polyethyleneimine. Sci Rep 2019, 9, 2169. [Google Scholar] [CrossRef]
- Österbacka, R.; An, C.P.; Jiang, X.M.; Vardeny, Z. V. Two-Dimensional Electronic Excitations in Self-Assembled Conjugated Polymer Nanocrystals. Science (1979) 2000, 287, 839–842. [Google Scholar] [CrossRef]
- Kobayashi, T.; Hamazaki, J.; Kunugita, H.; Ema, K.; Endo, T.; Rikukawa, M.; Sanui, K. Coexistence of Photoluminescence from Two Intrachain States in Polythiophene Films. Phys Rev B 2003, 67, 205214. [Google Scholar] [CrossRef]
- Kanemoto, K.; Sudo, T.; Akai, I.; Hashimoto, H.; Karasawa, T.; Aso, Y.; Otsubo, T. Intrachain Photoluminescence Properties of Conjugated Polymers as Revealed by Long Oligothiophenes and Polythiophenes Diluted in an Inactive Solid Matrix. Phys Rev B 2006, 73, 235203. [Google Scholar] [CrossRef]
- Tauc, J.; Grigorovici, R.; Vancu, A. Optical Properties and Electronic Structure of Amorphous Germanium. physica status solidi (b) 1966, 15, 627–637. [Google Scholar] [CrossRef]
- Garai, A.; Kuila, B.K.; Samai, S.; Roy, S.; Mukherjee, P.; Nandi, A.K. Physical and Electronic Properties in Multiwalled Carbon Nanotube–Poly(3-dodecylthiophene) Nanocomposites. J Polym Sci B Polym Phys 2009, 47, 1412–1425. [Google Scholar] [CrossRef]
- Dong, Y.; Lu, J.; Ji, S.; Lu, C. Third-Order Nonlinear Optical Properties of P3DDT–CdS Nanocomposites. Synth Met 2011, 161, 2441–2445. [Google Scholar] [CrossRef]
- Therézio, E.; Piovesan, E.; Vega, M.L.; Silva, R.; Oliveira, O.; Marletta, A. Thickness and Annealing Temperature Effects on the Optical Properties and Surface Morphology of Layer-by-Layer Poly(p-Phenyline Vinylene) plus Dodecylbenzenesulfonate Films. J Polym Sci B Polym Phys 2011, 49, 206–213. [Google Scholar] [CrossRef]
- Silva, T.H.; Barreira, S.V.P.; Moura, C.; Silva, F. Electrochemical Characterization of a Self-Assembled Polyelectrolyte Film. Portugaliae Electrochimica Acta 2003, 21, 281–292. [Google Scholar] [CrossRef]
- Rambo, E.C.; Kolbow, A.C.H.; Ramos, R.J.; Chagas, E.F.; de Santana, H.; Dalkiranis, G.G.; Marletta, A.; Therézio, E.M. Does the Substrate and a Buffer Layer Have a Greater Influence on Poly(3-Hexylthiophene) Films Deposited by the Chronocoulometry Technique? Phys Scr 2024, 99, 125967. [Google Scholar] [CrossRef]
- Schura, A.B.; Sá, S.; Silva, R.; de Santana, H.; Marletta, A.; Therézio, E. Energy Transfer Processes in Electrochemical P3HT Thin Films. Journal of Materials Science Materials in Electronics 2019. [Google Scholar] [CrossRef]
- Dalkiranis, G.G.; Therézio, E.M.; Conte, G.; Gallardo, H.; Bechtold, I.H.; Marletta, A. Emission Ellipsometry as a Tool for Luminescent Liquid Crystal Phase Transition Identification. Phys Rev E 2018, 98, 022702. [Google Scholar] [CrossRef] [PubMed]
- Louarn, G.; Trznadel, M.; Buisson, J.P.; Laska, J.; Pron, A.; Lapkowski, M.; Lefrant, S. Raman Spectroscopic Studies of Regioregular Poly(3-Alkylthiophenes). J Phys Chem 1996, 100, 12532–12539. [Google Scholar] [CrossRef]
- Baibarac, M.; Lapkowski, M.; Pron, A.; Lefrant, S.; Baltog, I. SERS Spectra of Poly(3-Hexylthiophene) in Oxidized and Unoxidized States. Journal of Raman Spectroscopy 1998, 29, 825–832. [Google Scholar] [CrossRef]
- Qu, S.; Yao, Q.; Wang, L.; Chen, Z.; Xu, K.; Zeng, H.; Shi, W.; Zhang, T.; Uher, C.; Chen, L. Highly Anisotropic P3HT Films with Enhanced Thermoelectric Performance via Organic Small Molecule Epitaxy. NPG Asia Mater 2016, 8, e292–e292. [Google Scholar] [CrossRef]
- Hussein, A.A.; Sultan, A.A.; Obeid, M.T.; Abdulnabi, A.T.; Ali, M.T. Synthesis and Characterization of Poly (3-Hexylthiophene). International Journal of Scientific Engineering and Applied Science (IJSEAS)-Volume-1, Issue-7 2015. [Google Scholar]
- Kolbow, A.C.H.; Rambo, E.C.; dos Santos, M.R.N.; Marchezi, P.E.; Nogueira, A.F.; Marletta, A.; Ramos, R.J.; Therézio, E.M. Emission Ellipsometry Study in Polymeric Interfaces Based on Poly(3-Hexylthiophene), [6,6]-Phenyl-C61-Butyric Acid Methyl Ester, and Reduced Graphene Oxide. C (Basel) 2024, 10, 83. [Google Scholar] [CrossRef]
- Schura, A.B.; Kolbow, A.C.H.; Rambo, E.C.; Dalkiranis, G.G.; do Nascimento, C.A.; Ramos, R.J.; Marletta, A.; Pereira, L.; Germino, J.C.; Therézio, E.M. Investigating the Polarized Emission of P3HT Films and the Role of GO in the Interfacial Layer. Next Materials 2025, 9, 100976. [Google Scholar] [CrossRef]
- Therézio, E.M.; Rodrigues, P.C.; Tozoni, J.R.; Marletta, A.; Akcelrud, L. Energy-Transfer Processes in Donor–Acceptor Poly(Fluorenevinylene-Alt-4,7-Dithienyl-2,1,3-Benzothiadiazole). The Journal of Physical Chemistry C 2013, 117, 13173–13180. [Google Scholar] [CrossRef]
- Förster, Th. Zwischenmolekulare Energiewanderung Und Fluoreszenz. Ann Phys 1948, 437, 55–75. [Google Scholar] [CrossRef]
- Mukherjee, A.; Bagchi, B. Förster Energy Transfer in Thin Films of Conjugated Polymers and in Solution. Journal of the Chinese Chemical Society 2006, 53, 153–160. [Google Scholar] [CrossRef]
- Gupta, V.; Bharti, V.; Kumar, M.; Chand, S.; Heeger, A.J. Polymer–Polymer Förster Resonance Energy Transfer Significantly Boosts the Power Conversion Efficiency of Bulk-Heterojunction Solar Cells. Advanced Materials 2015, 27, 4398–4404. [Google Scholar] [CrossRef] [PubMed]
Figure 1.
Cyclic voltammogram for the film with 10 cycles. The insert shows the chemical structure of the P3DDT monomer.
Figure 1.
Cyclic voltammogram for the film with 10 cycles. The insert shows the chemical structure of the P3DDT monomer.
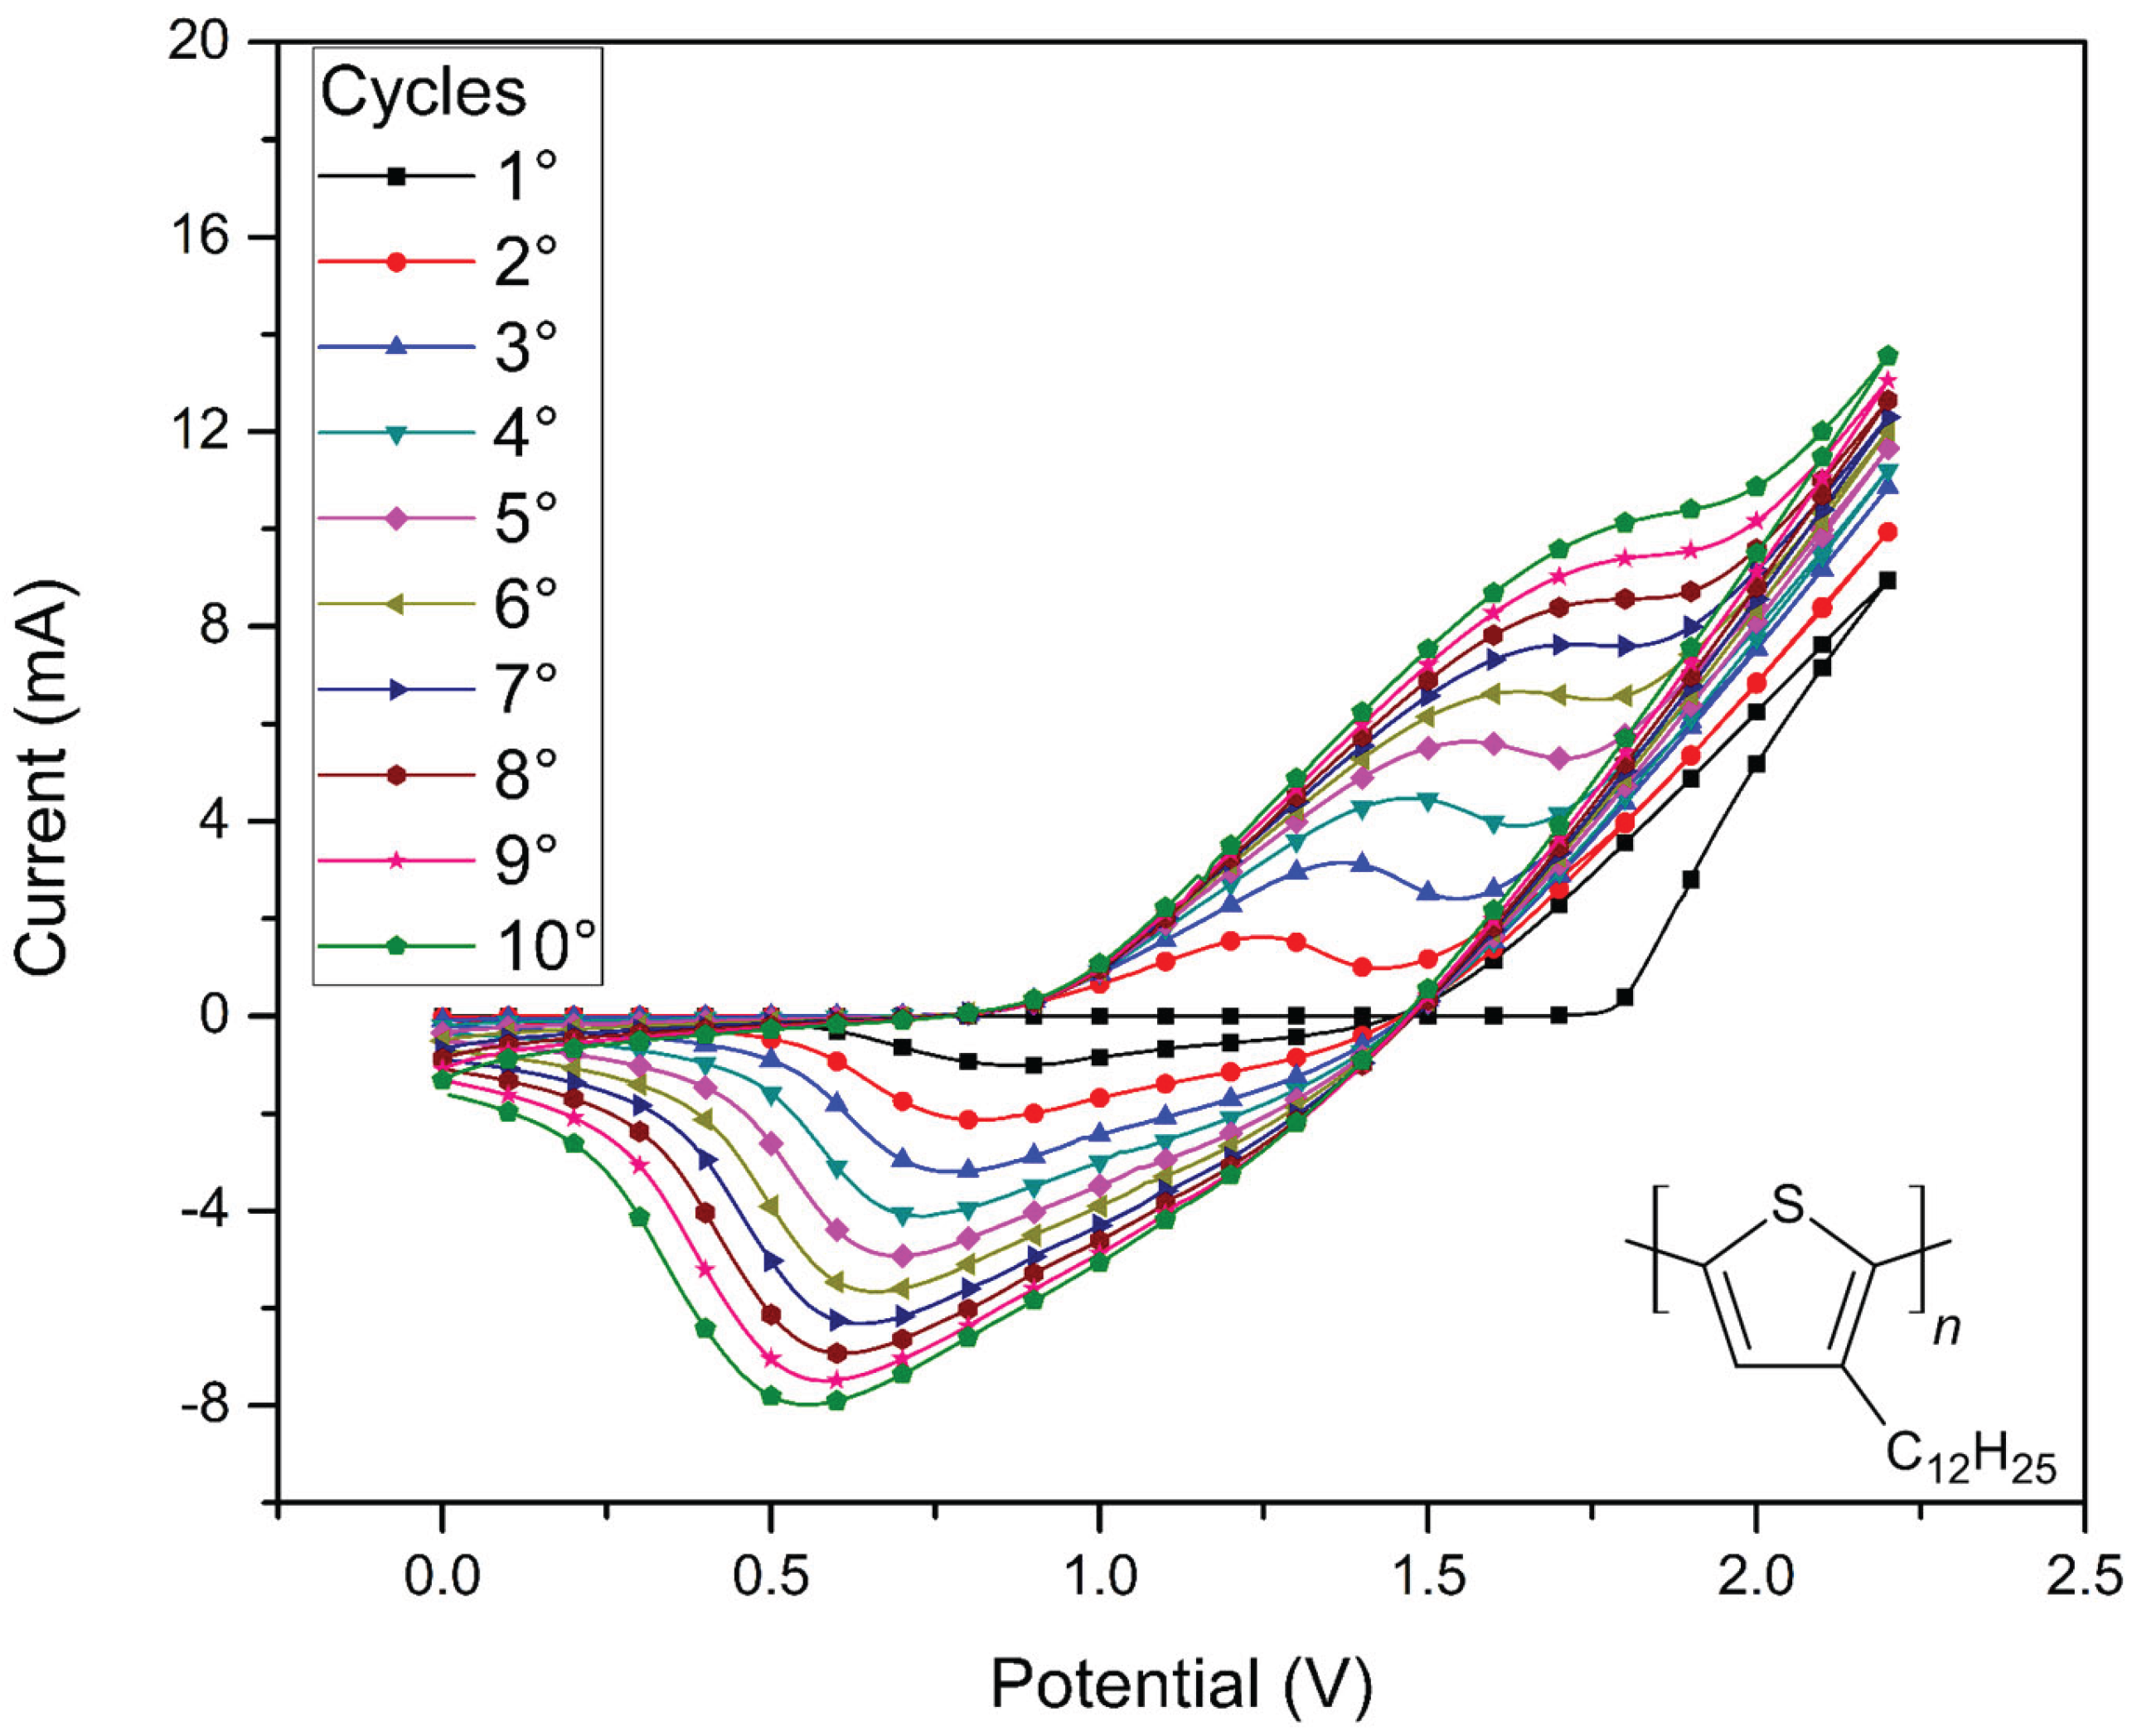
Figure 2.
(a) Absorption spectra for sample P3DDT01 and (b) Determination of the optical gap using the Tauc plot method.
Figure 2.
(a) Absorption spectra for sample P3DDT01 and (b) Determination of the optical gap using the Tauc plot method.
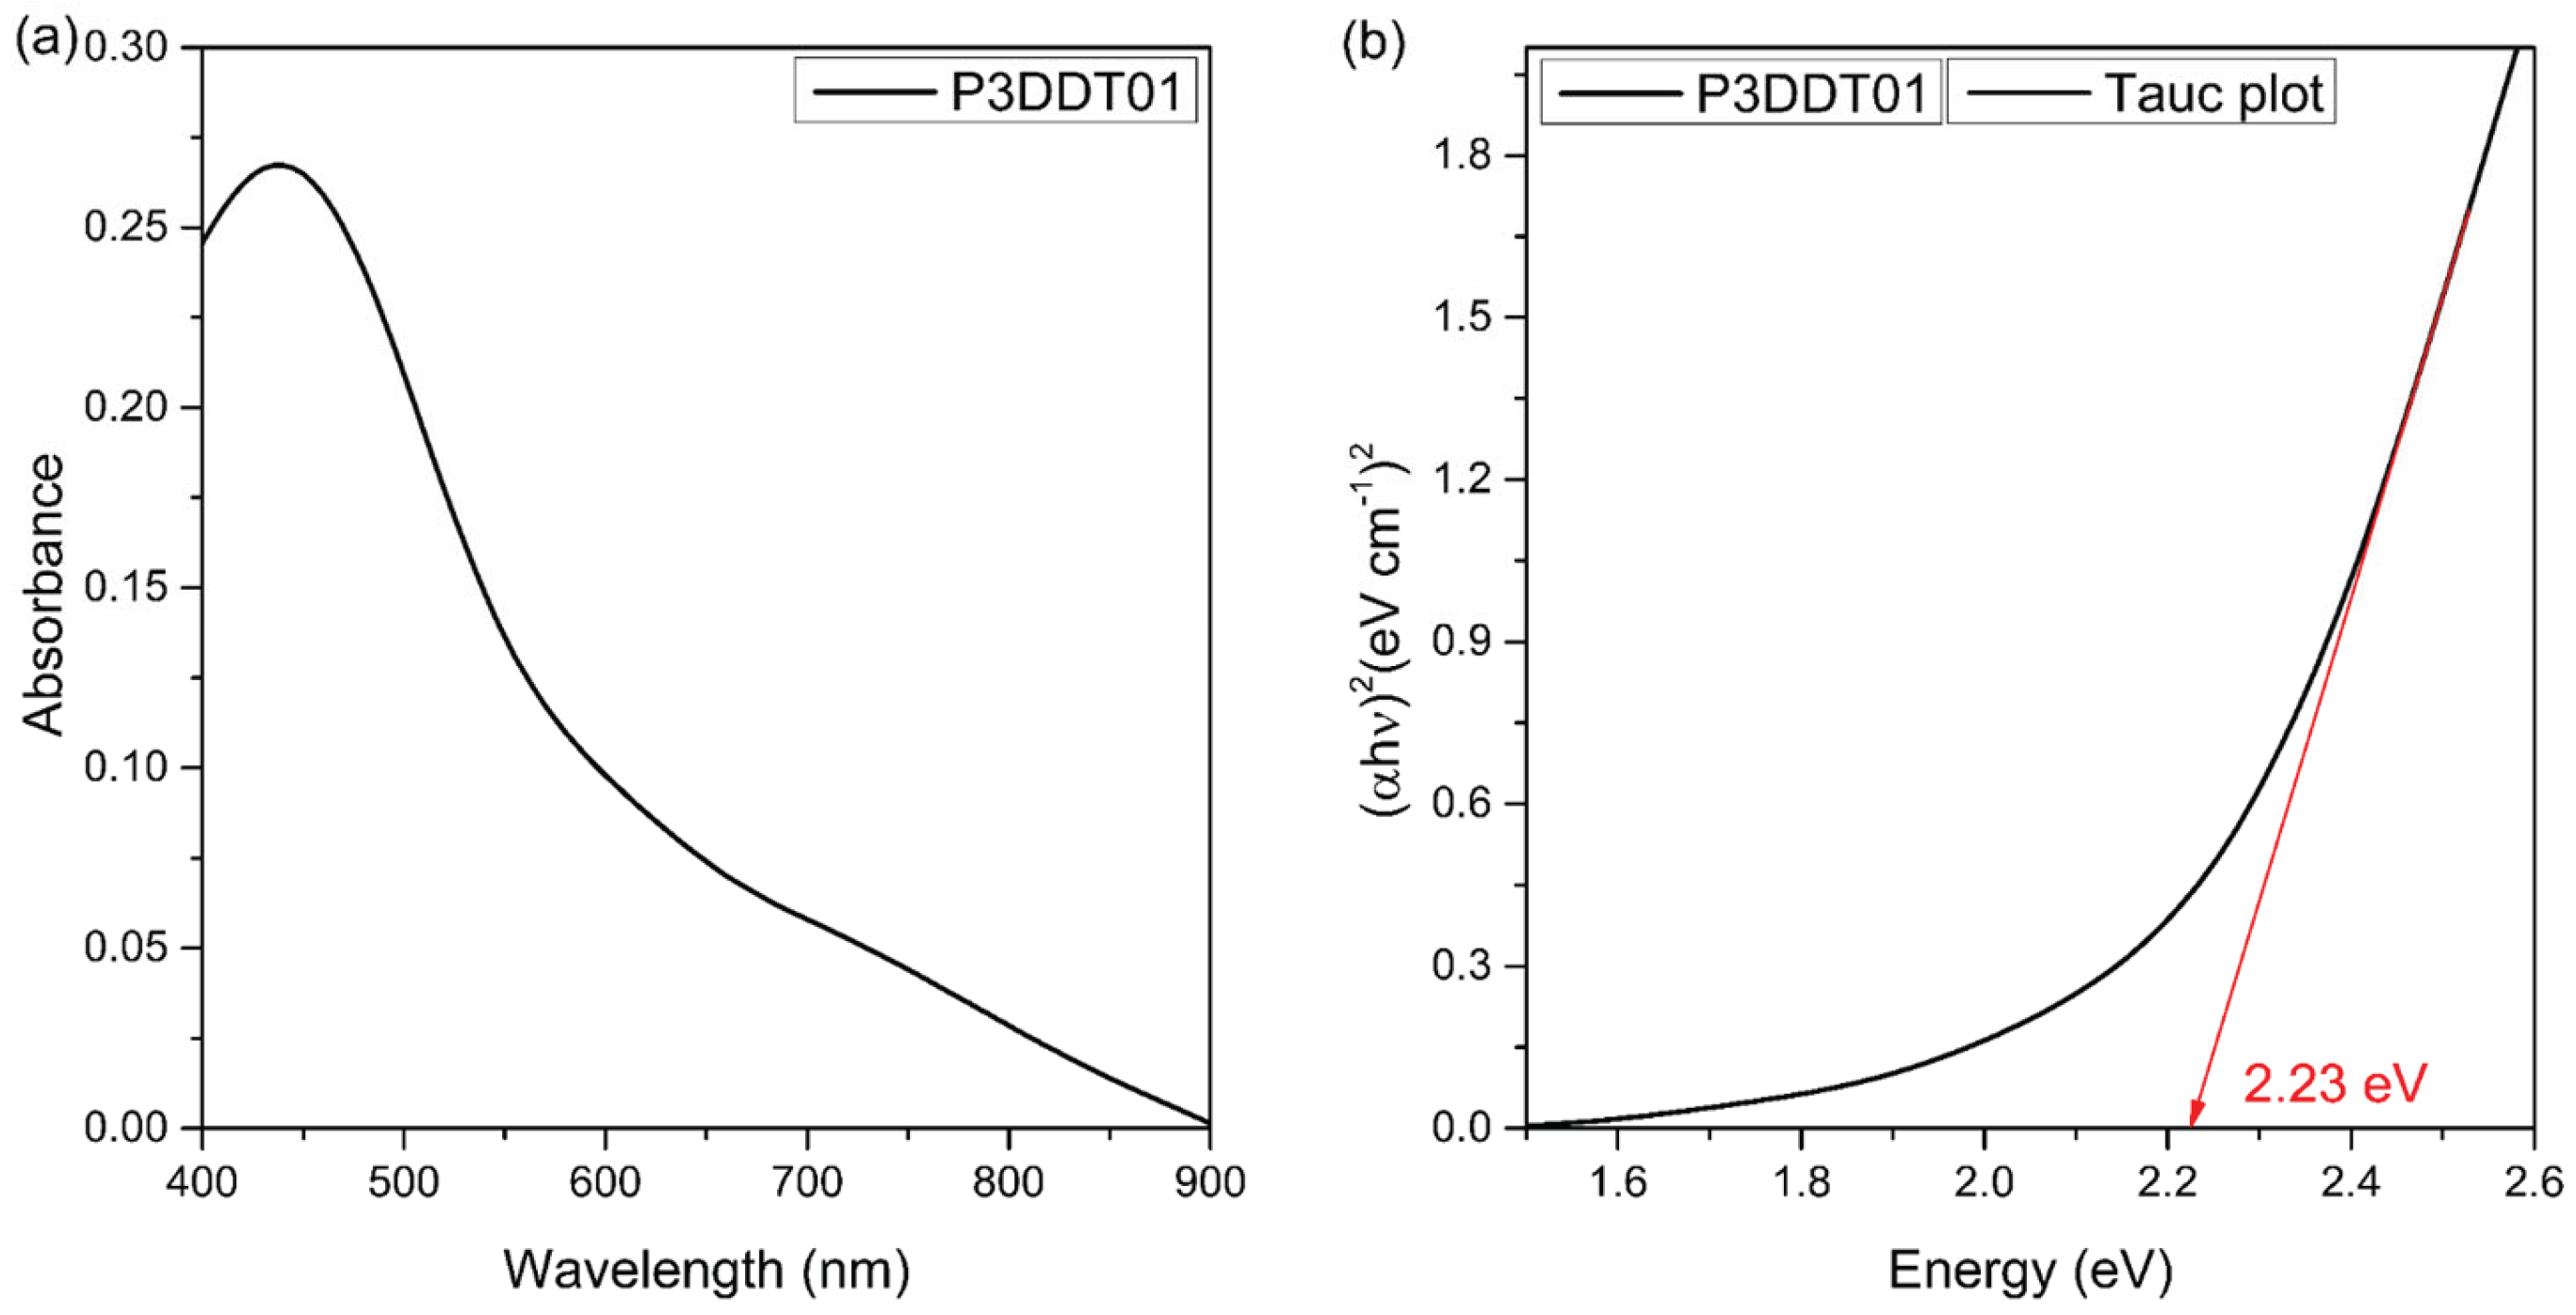
Figure 3.
(a) Normalized PL spectra of the films and (b) Gaussian deconvolution of the PL spectrum for the film P3DDT10.
Figure 3.
(a) Normalized PL spectra of the films and (b) Gaussian deconvolution of the PL spectrum for the film P3DDT10.
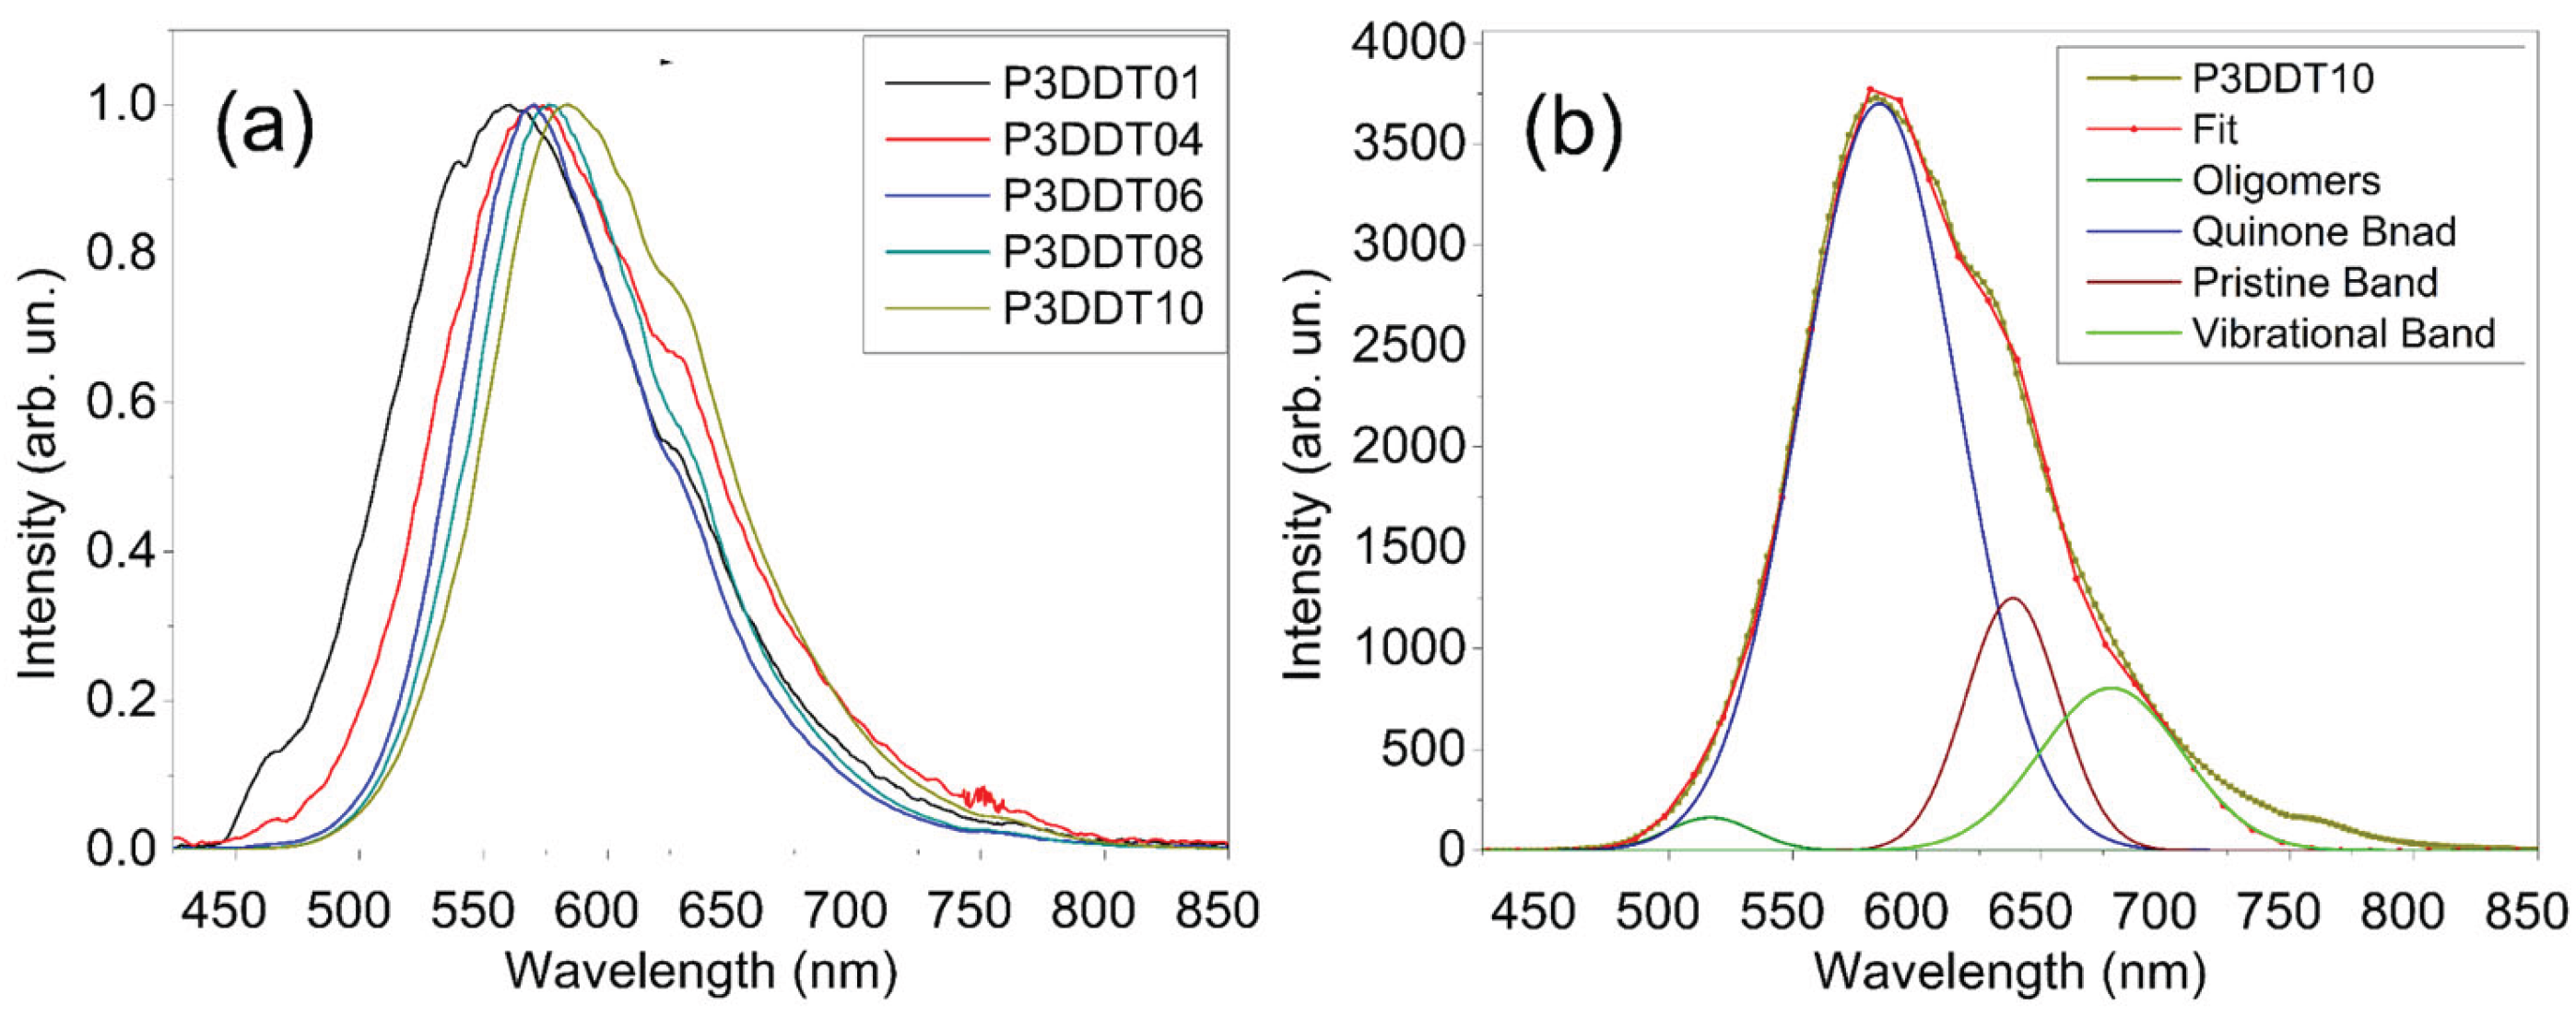
Figure 4.
Raman spectra of P3DDT films (1-10 cycles).
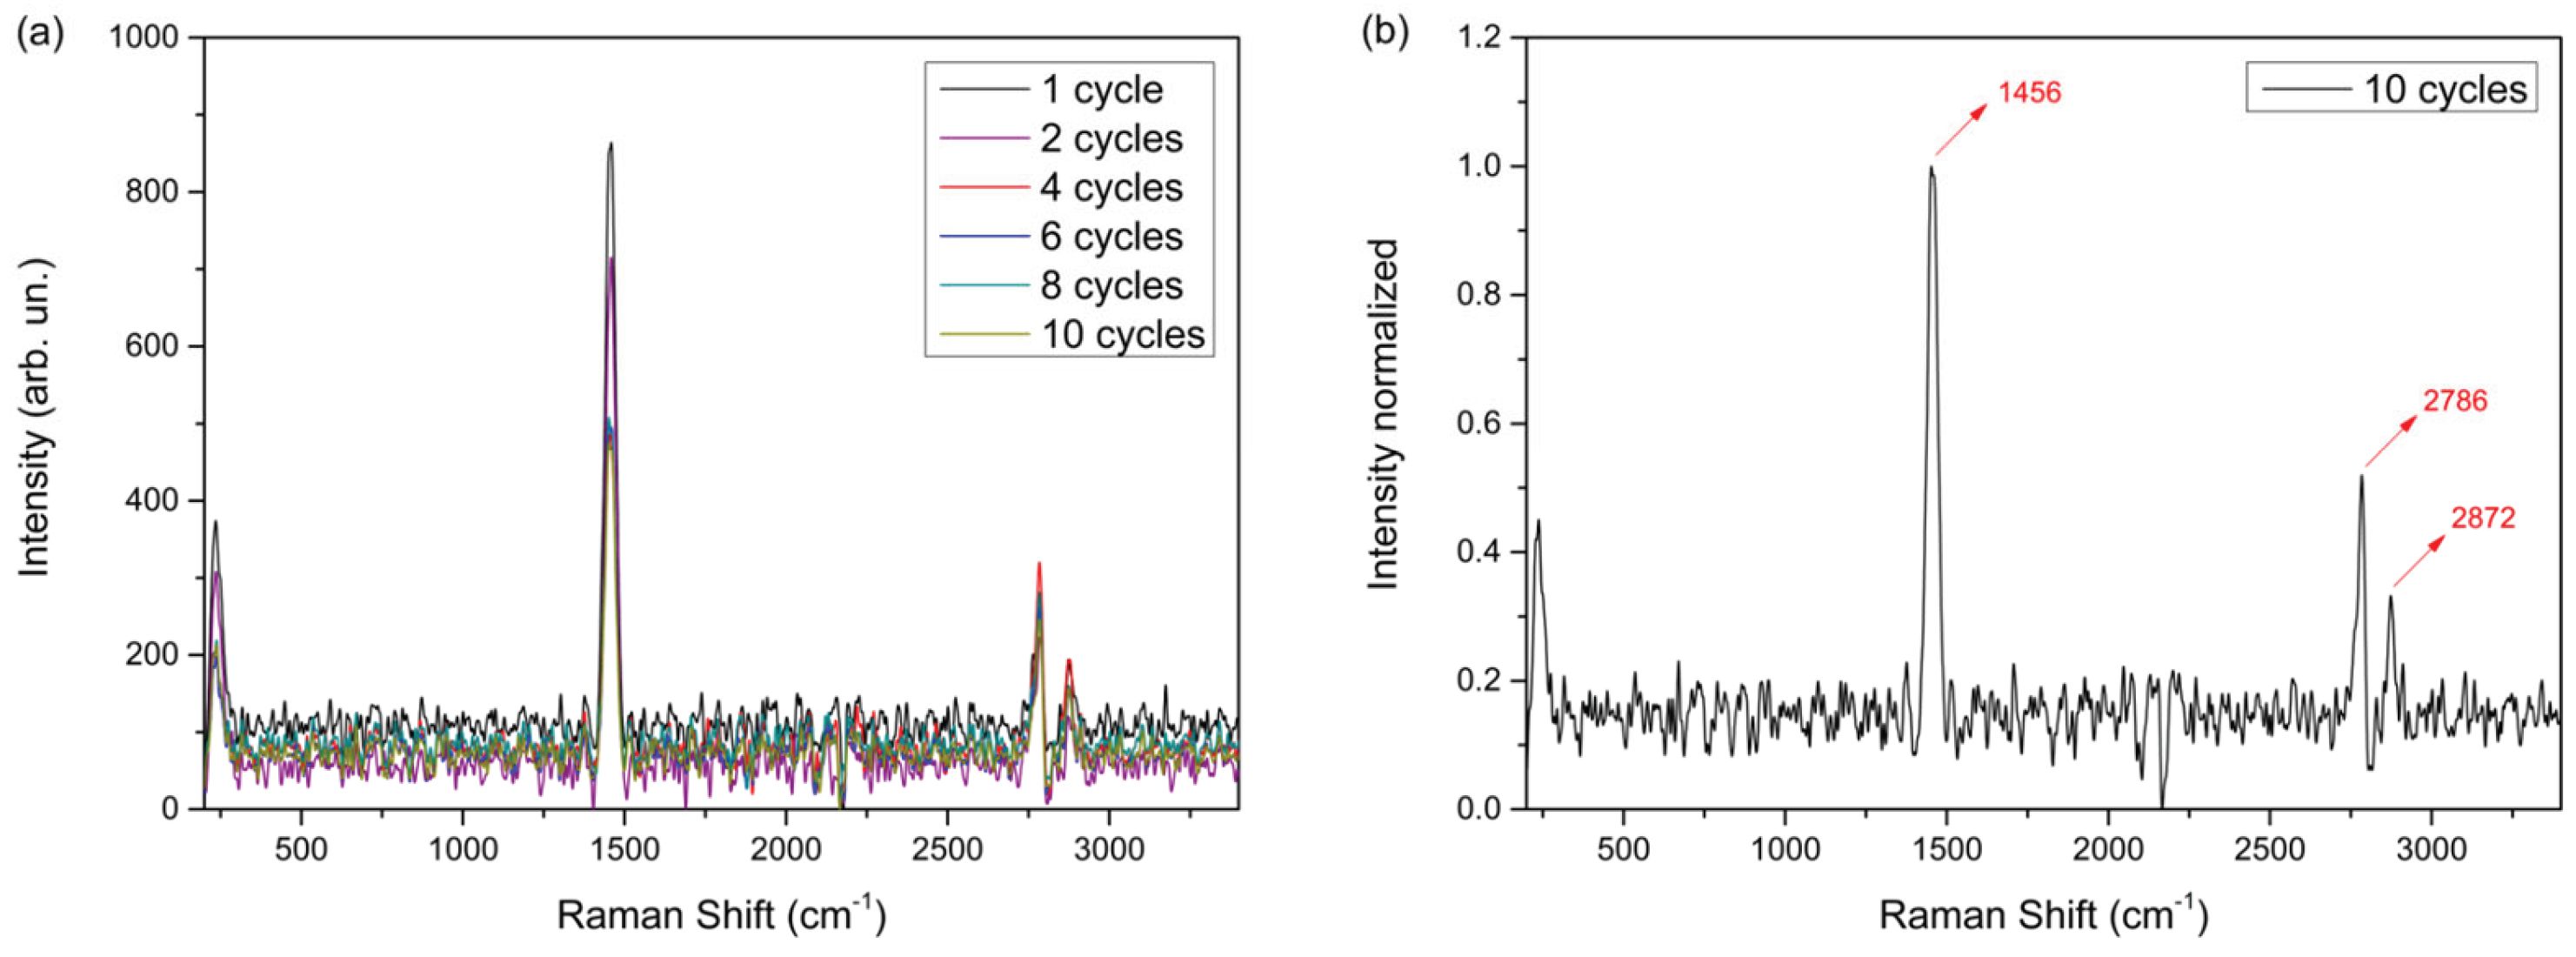
Figure 6.
EE spectra of P3DDT films (a) P3DDT01 and (b) P3DDT10.
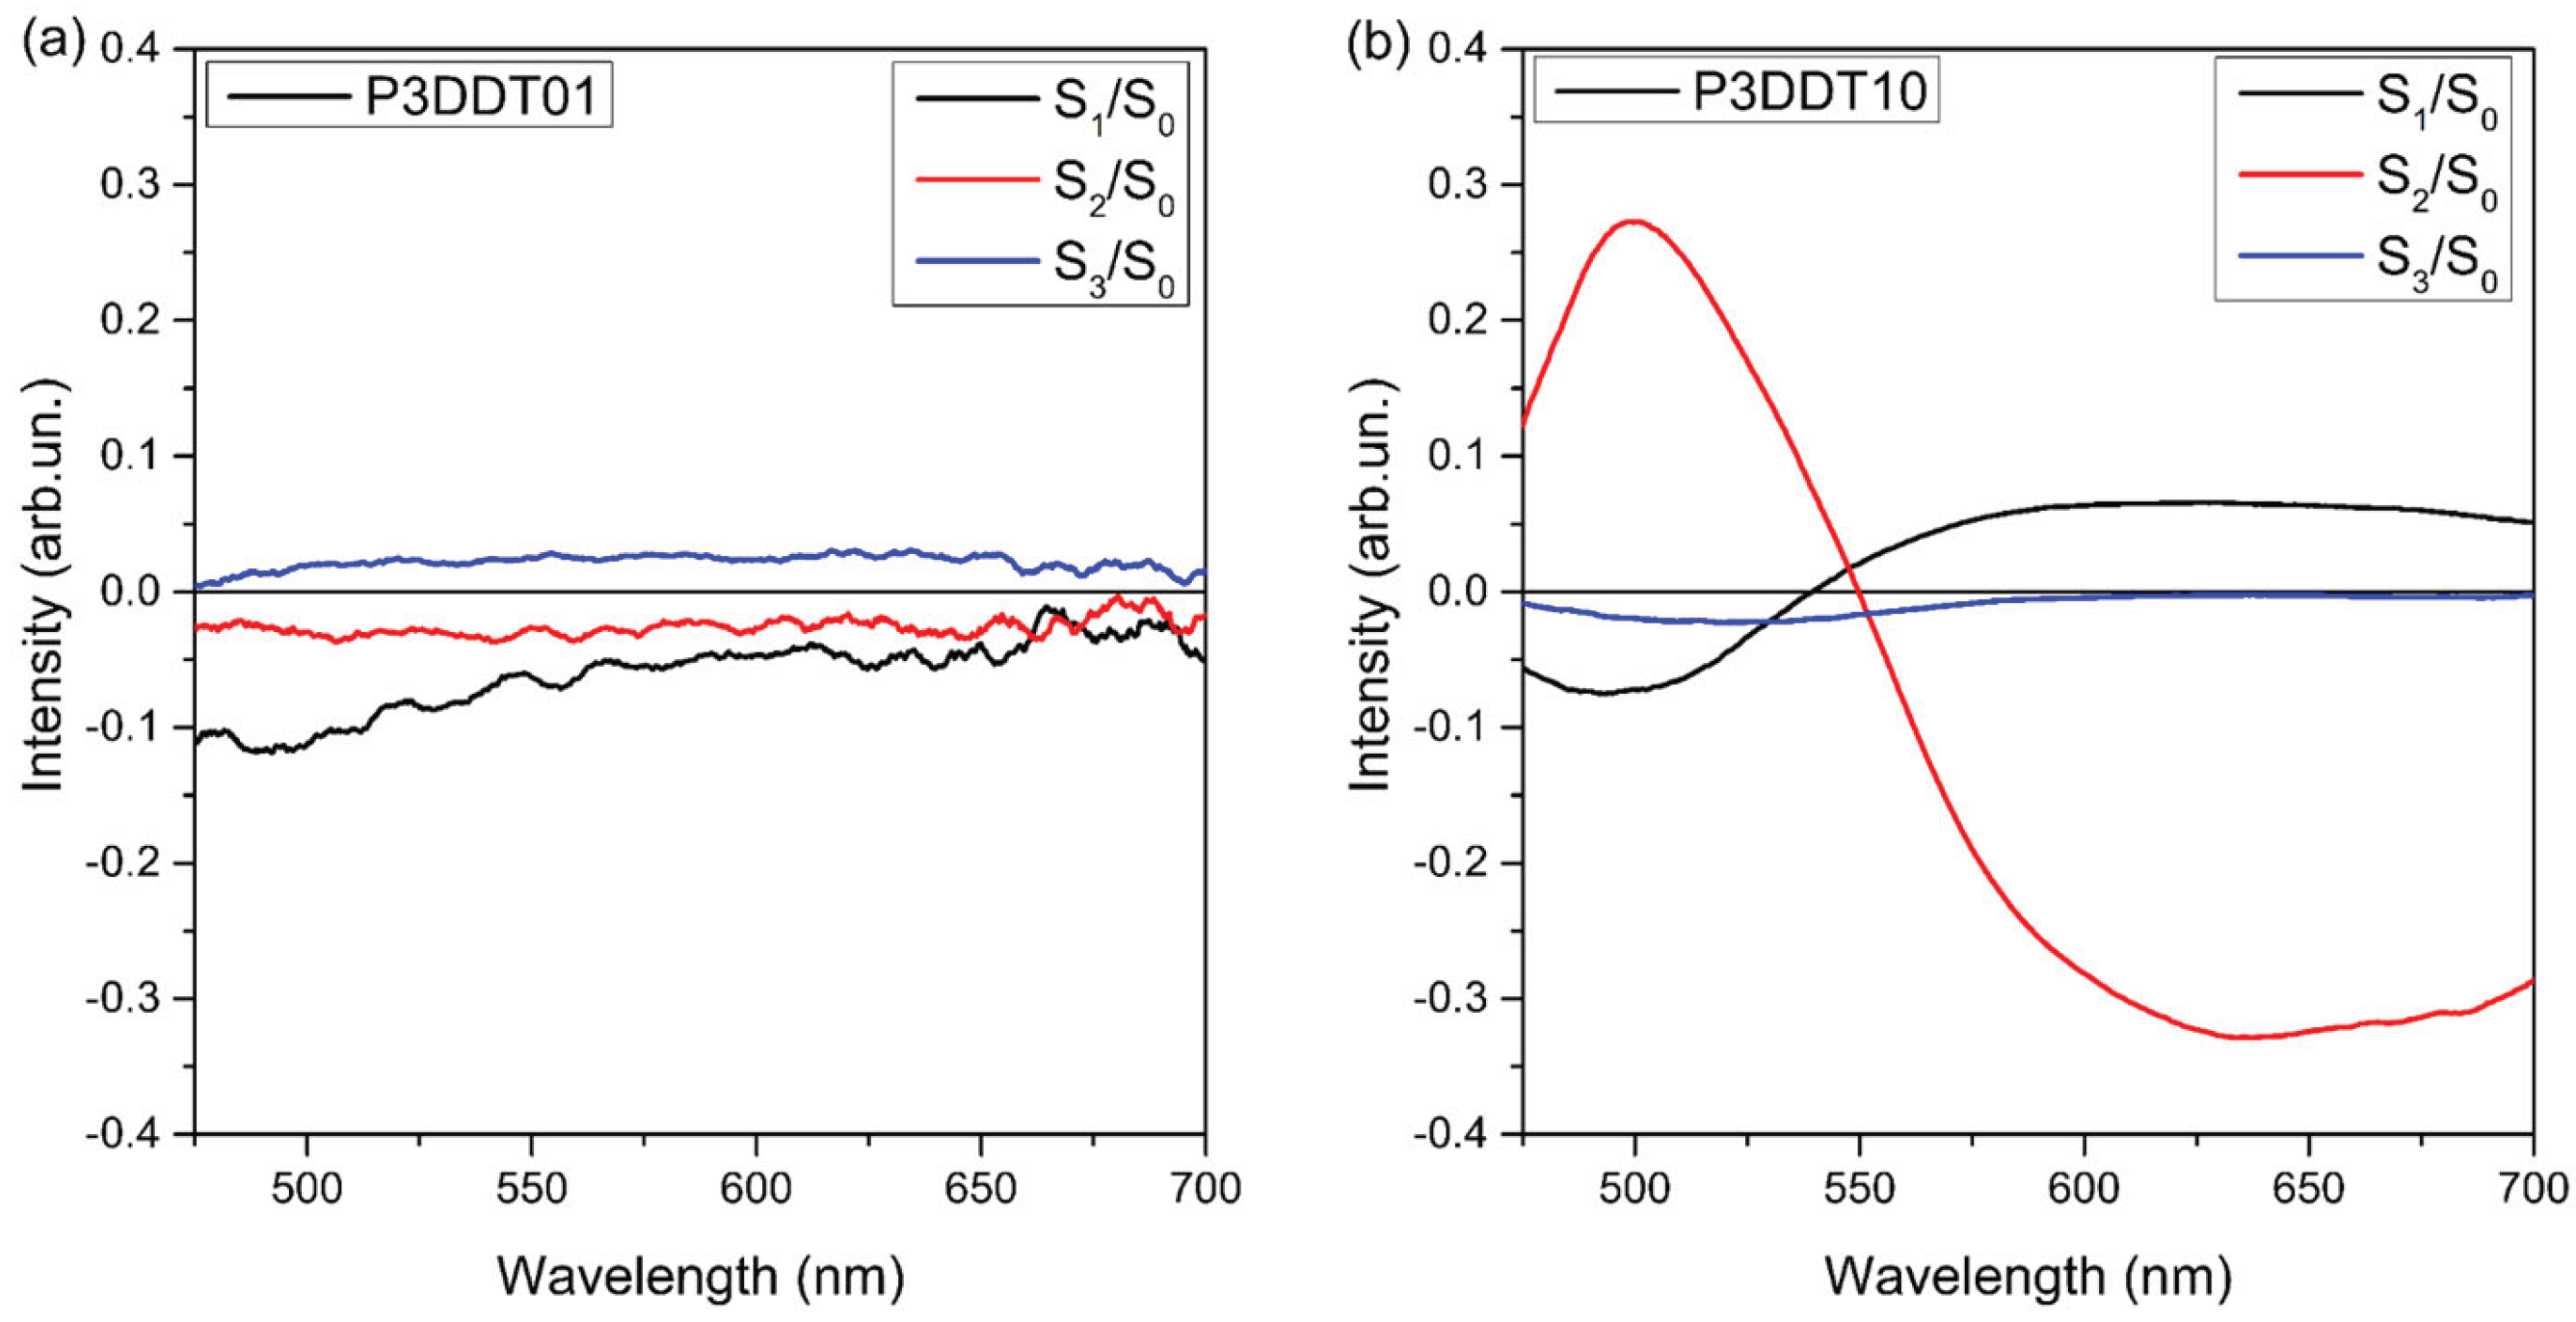
Figure 7.
Polarization degree (P), anisotropy factor (r), and asymmetry factor (g) as a function of wavelength, obtained from the Stokes parameters for P3DDT films electropolymerized with (a) 1 cycle and (b) 10 cycles.
Figure 7.
Polarization degree (P), anisotropy factor (r), and asymmetry factor (g) as a function of wavelength, obtained from the Stokes parameters for P3DDT films electropolymerized with (a) 1 cycle and (b) 10 cycles.
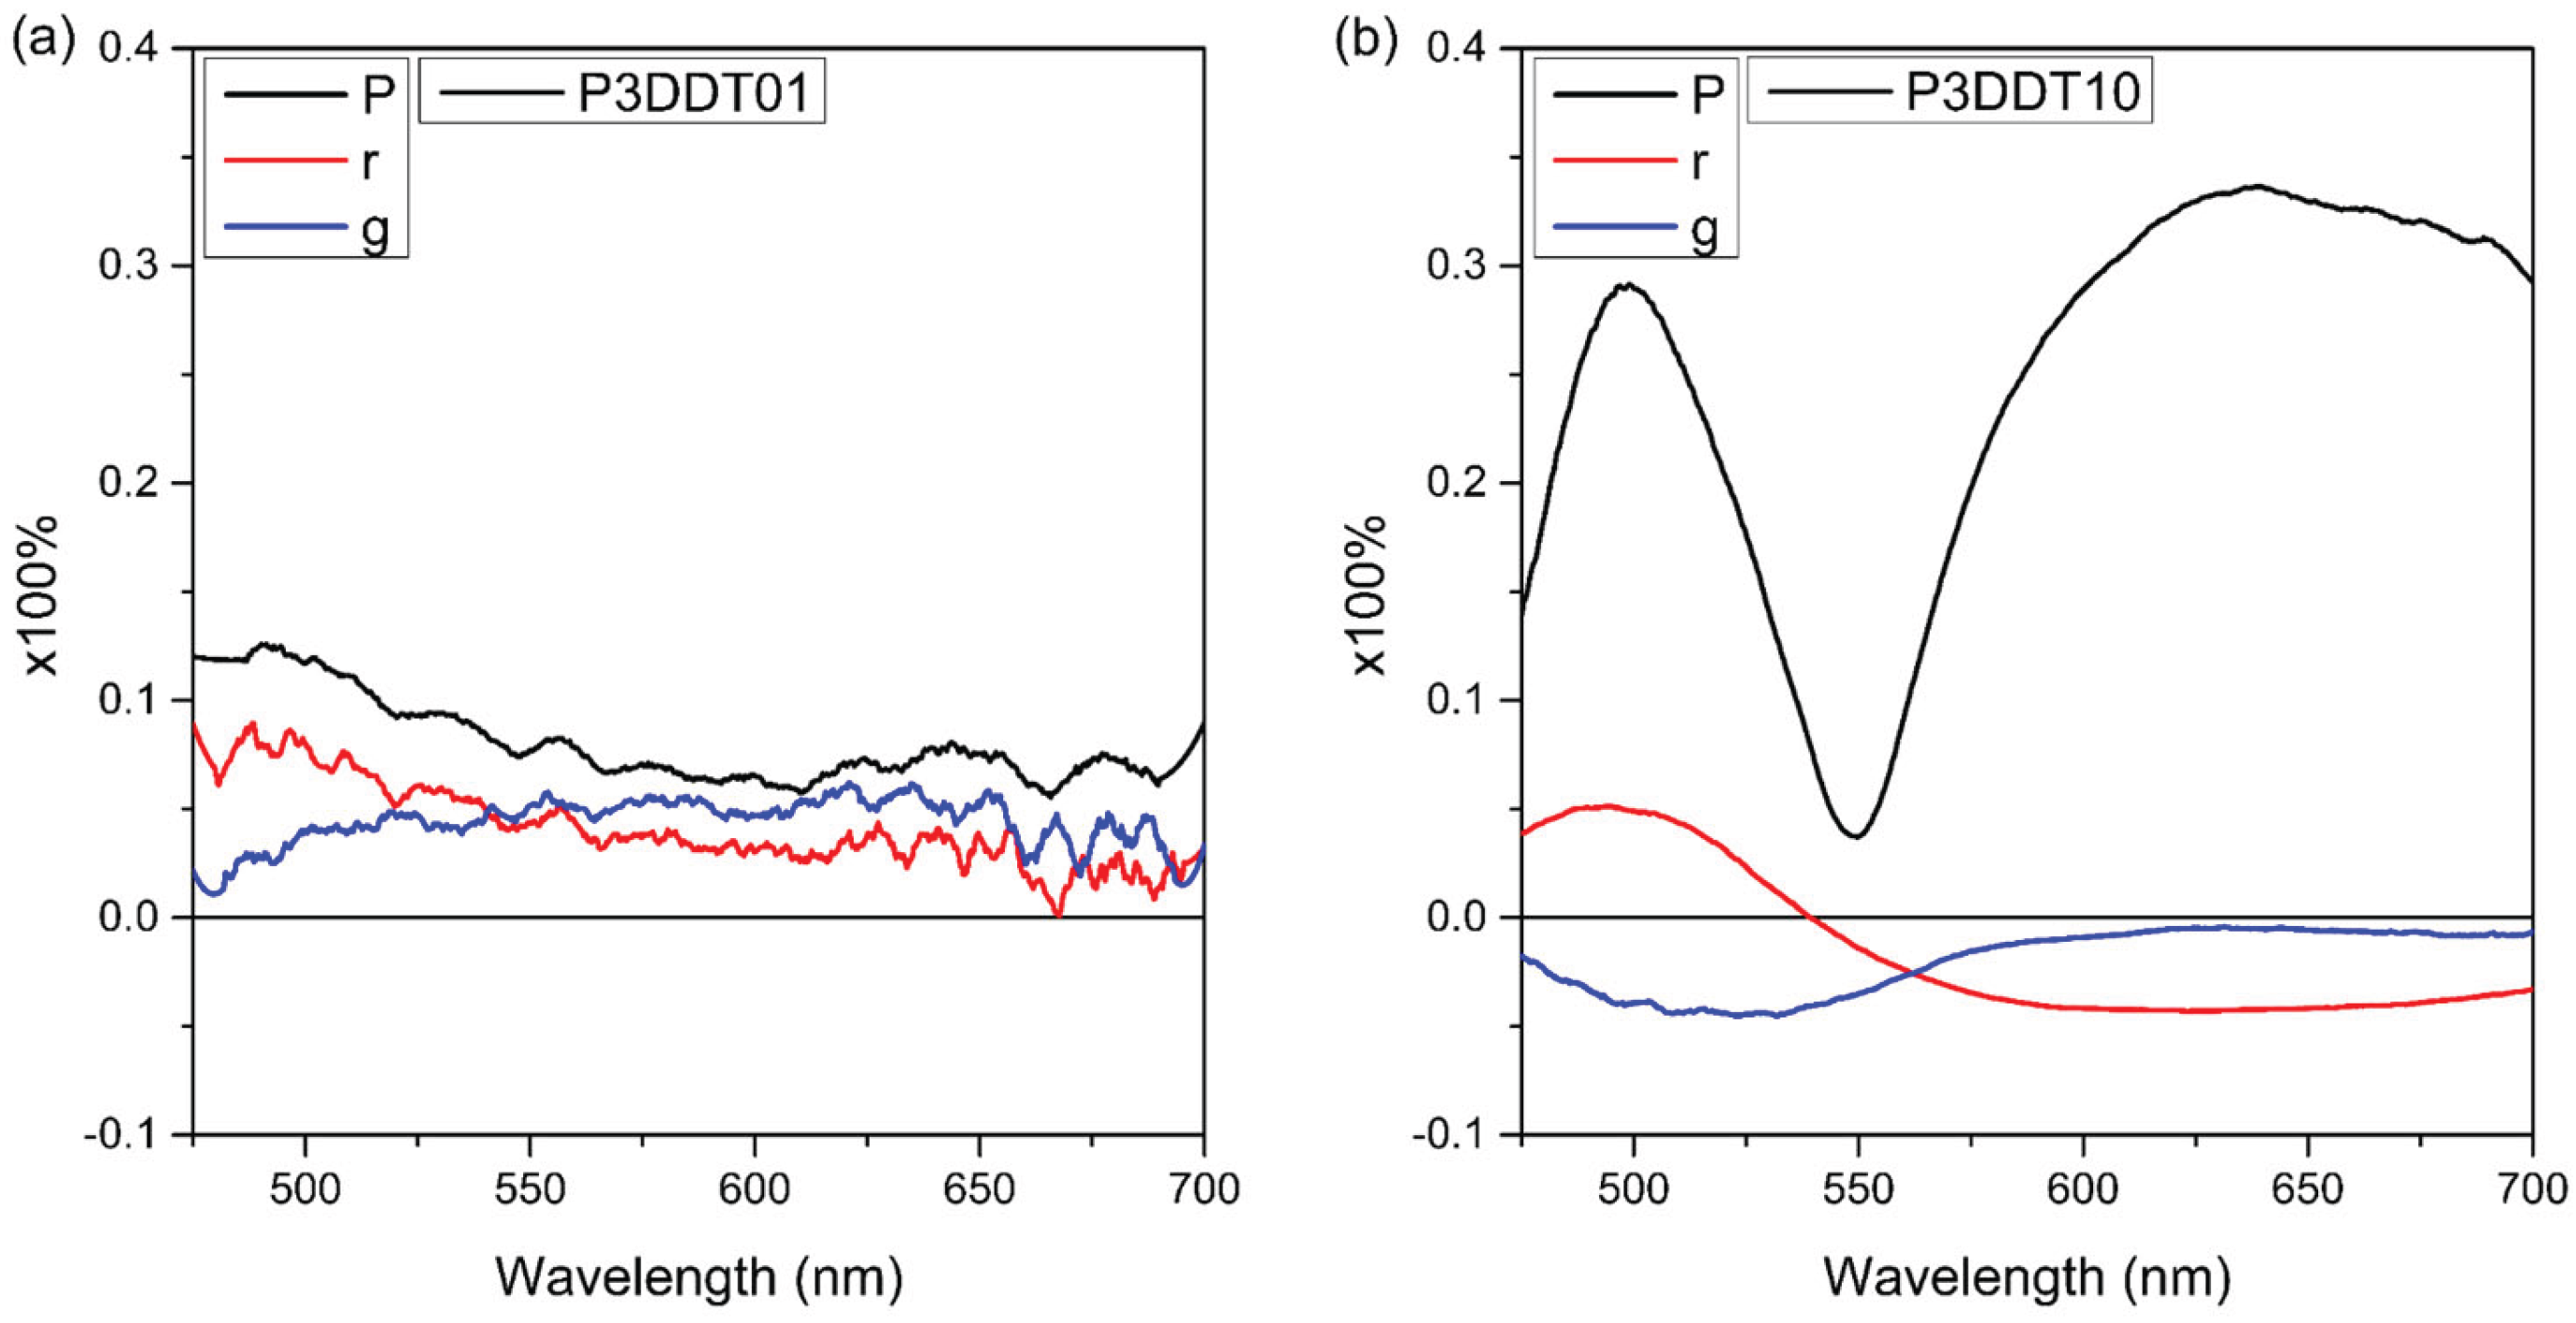
Figure 8.
Polarization degree (P) versus cycles numbers for three different species, oligomeric, quinone and pristine chains.
Figure 8.
Polarization degree (P) versus cycles numbers for three different species, oligomeric, quinone and pristine chains.
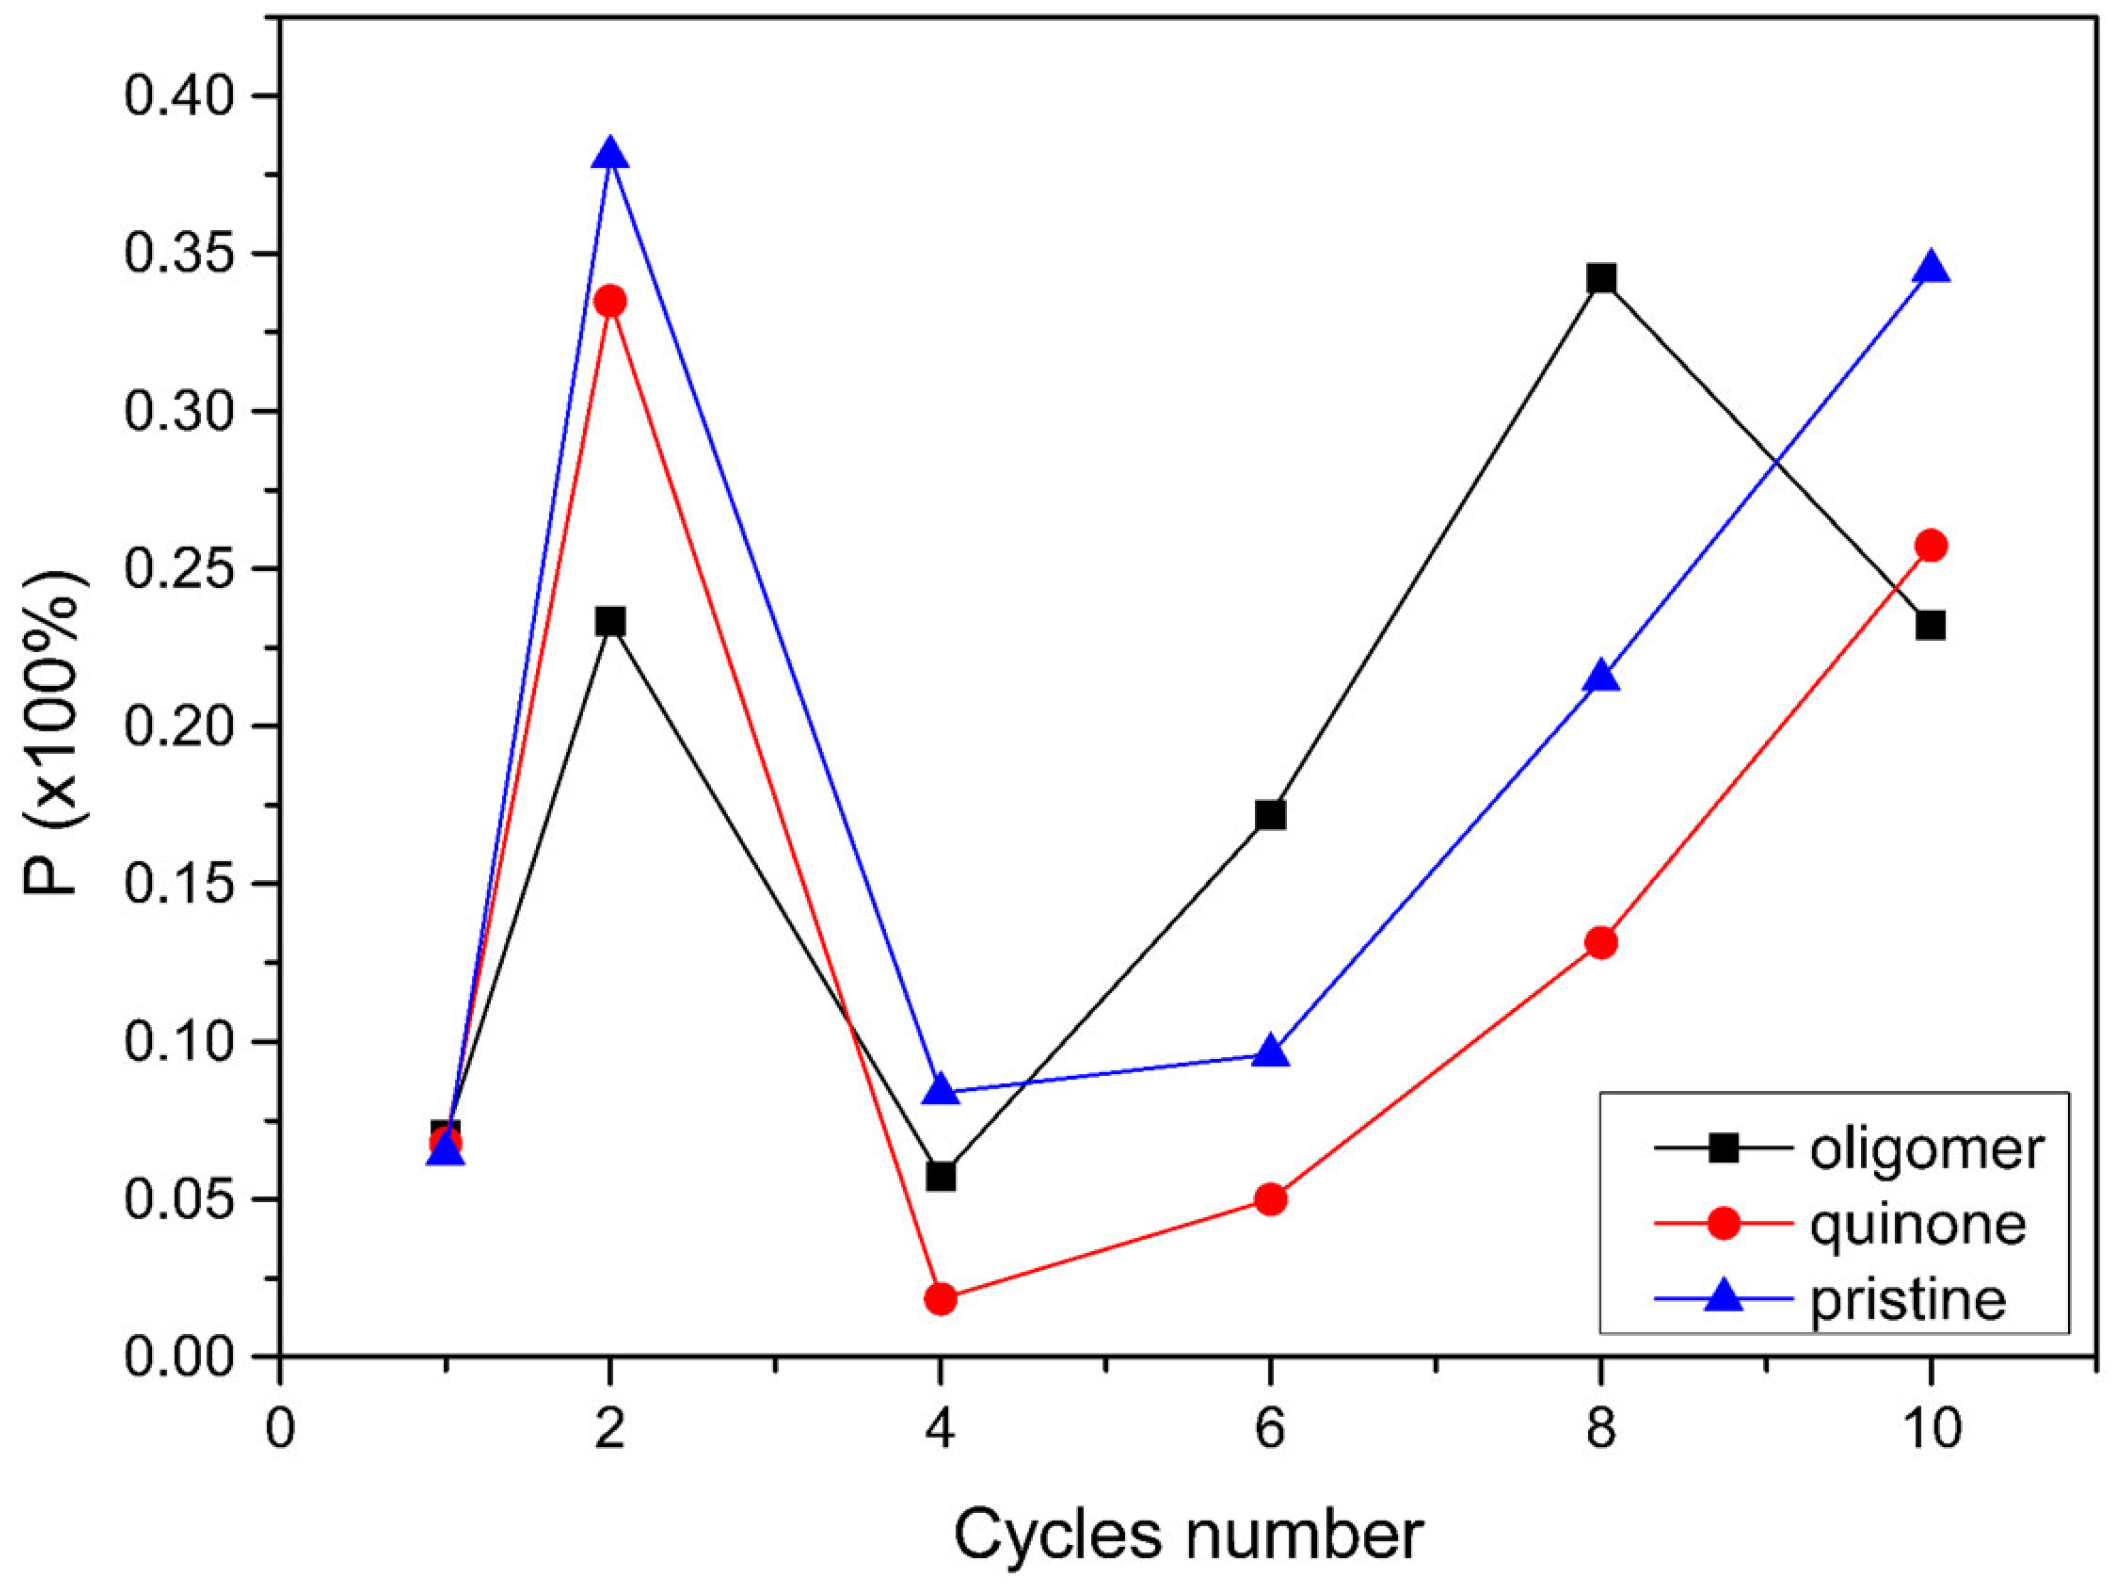
Figure 9.
Simplified schematic energy diagram for the P3DDT electrochemically synthesized.
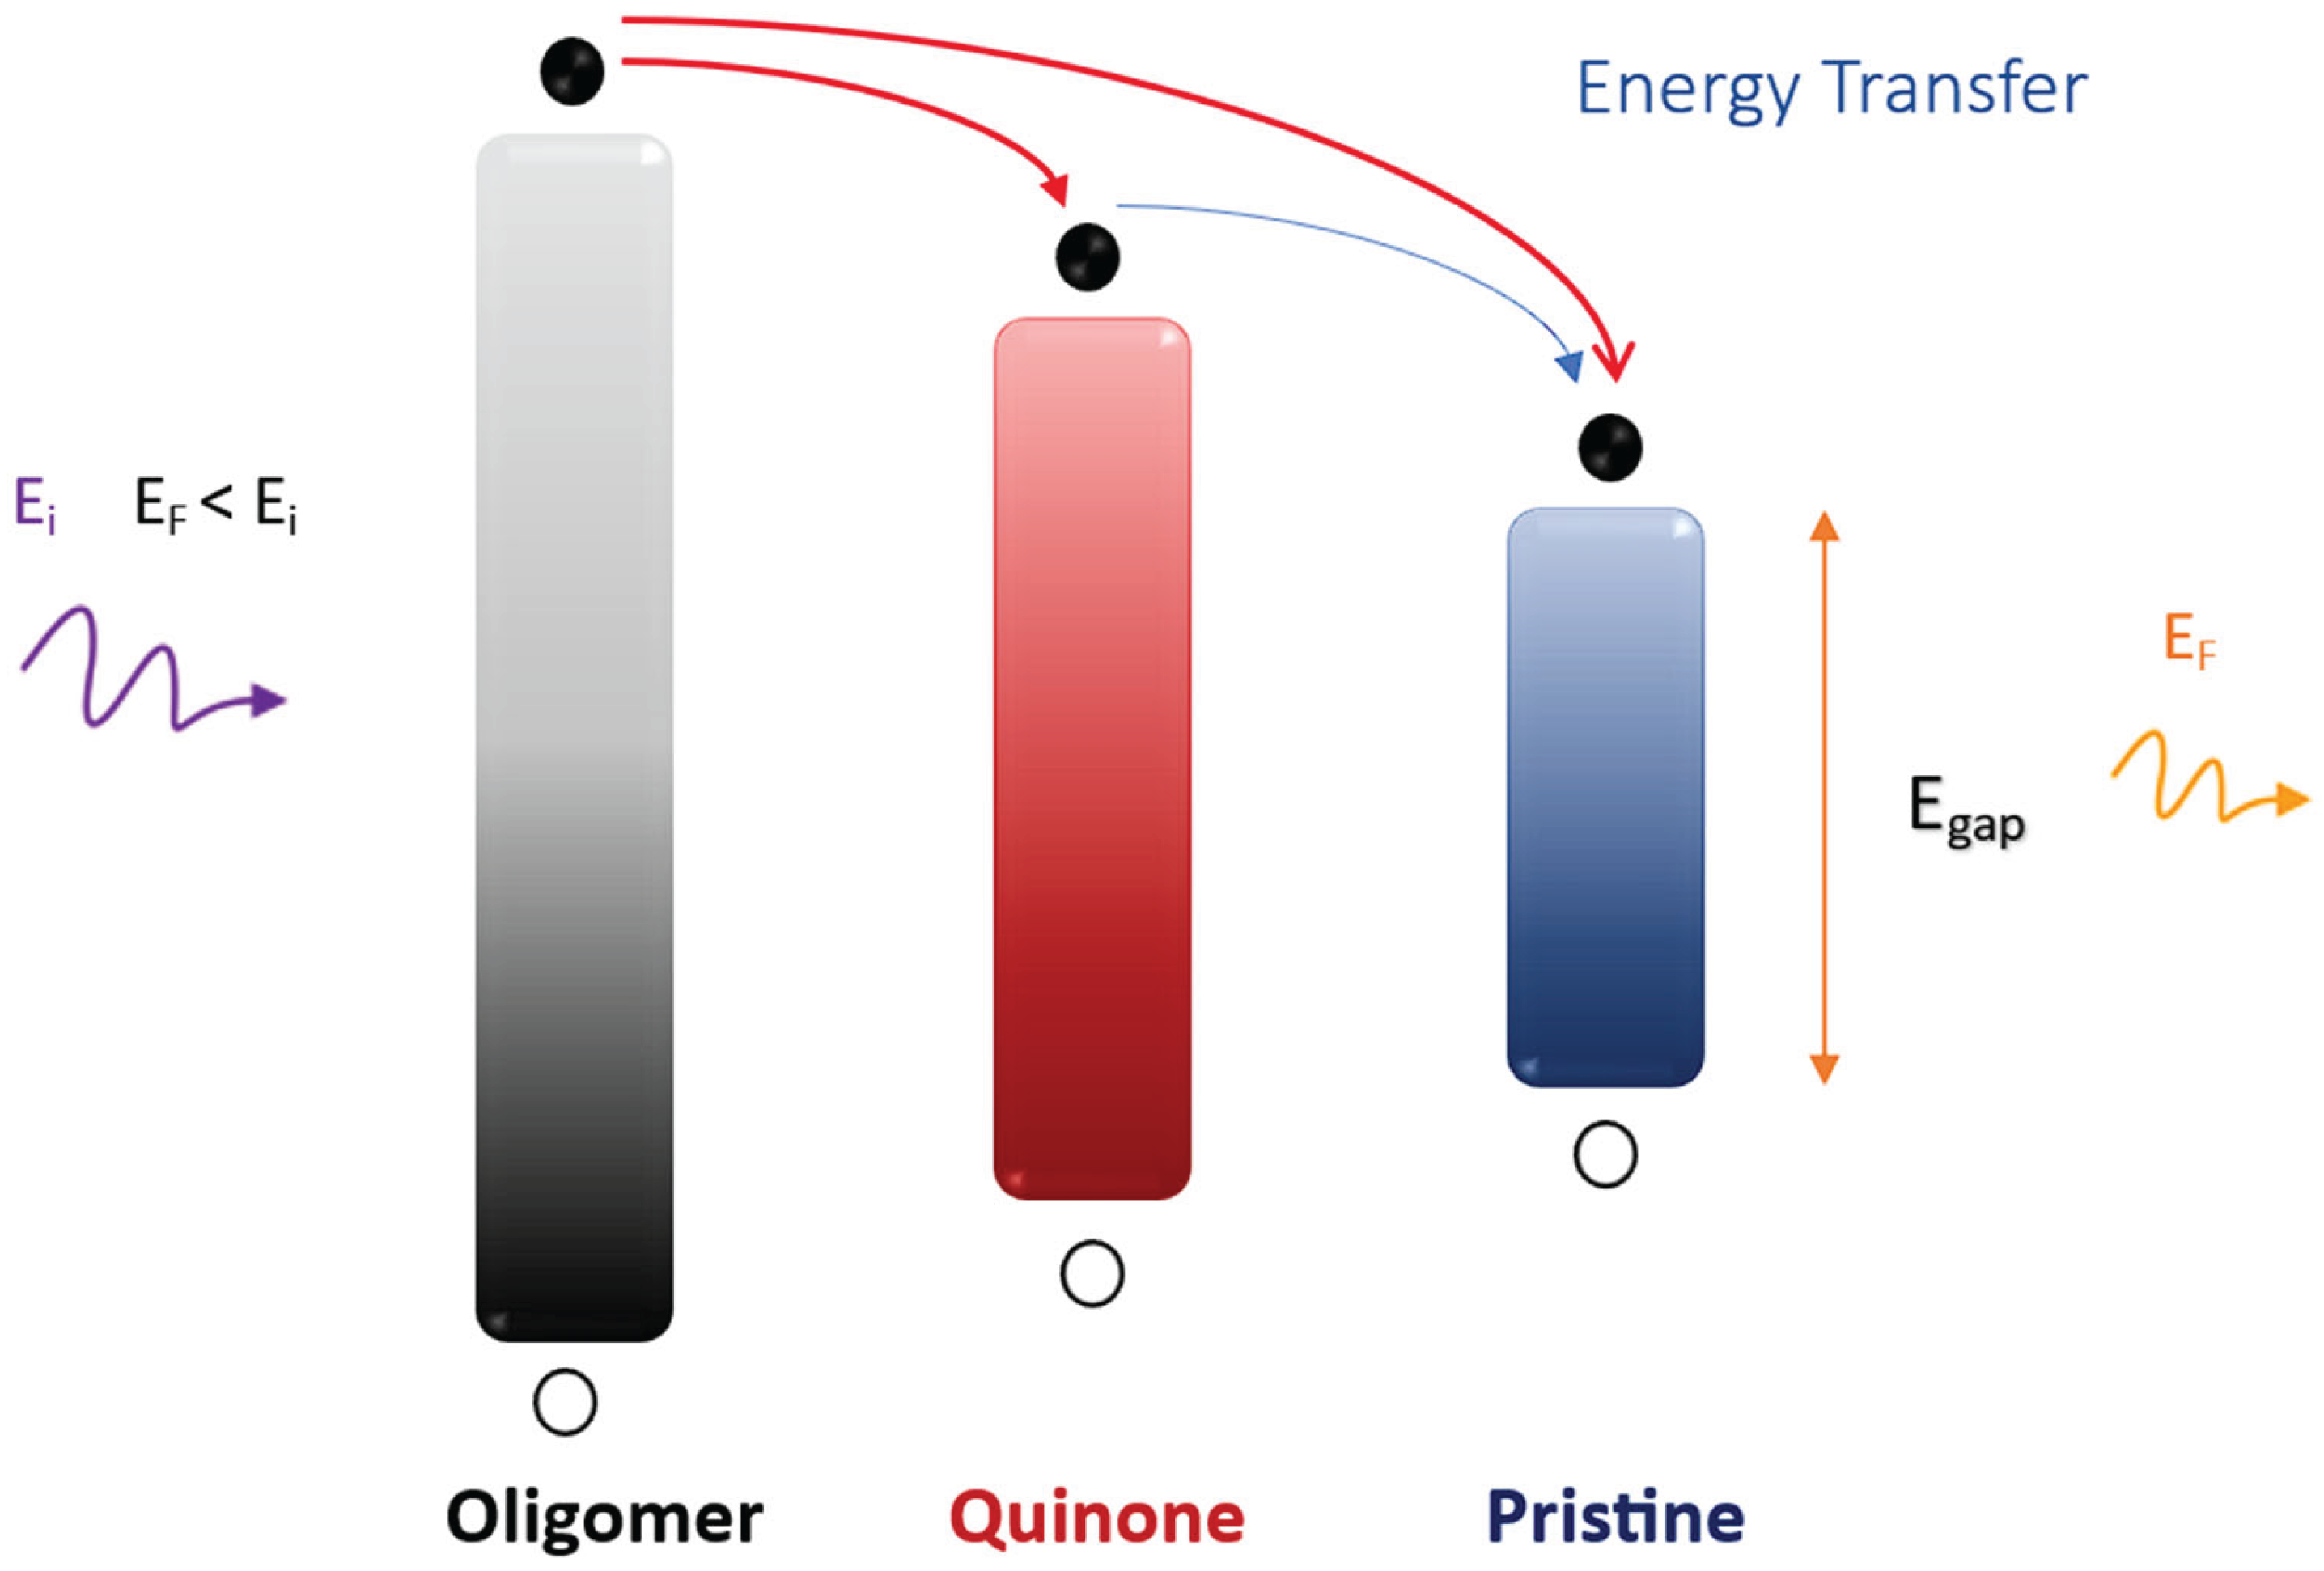

Table 1.
Cathodic and anodic ionization potentials for P3DDT10 synthesized with Et4NBF4.
| Number of cycles | Cathodic peak (V) | Anodic peak (V) |
|---|---|---|
| 1 | - | 0.84 |
| 2 | 1.25 | 0.80 |
| 4 | 1.44 | 0.70 |
| 6 | 1.62 | 0.68 |
| 8 | 1.76 | 0.55 |
| 10 | 1.82 | 0.55 |
Table 2.
Eg obtained from the Tauc plot.
| Film | Eg (eV) |
|---|---|
| P3DDT01 | 2.23 ± 0.02 |
| P3DDT02 | 2.23 ± 0.02 |
| P3DDT04 | 2.39 ± 0.02 |
| P3DDT06 | 2.46 ± 0.02 |
| P3DDT08 | 2.23 ± 0.02 |
| P3DDT10 | 2.38 ± 0.02 |
Table 3.
Representation of emission maxima from the deconvolution of PL spectra.
| Film | 1st oligomers band nm (eV) | 2nd oligomers band nm (eV) |
Quinone band nm (eV) | Pristine band nm (eV) | Vibrational replica nm (eV) |
|---|---|---|---|---|---|
| P3DDT01 | 465 (2.66) | 520 (2.38) | 568 (2.18) | 630 (1.96) | 684 (1.81) |
| P3DDT02 | 461 (2.68) | 515 (2.40) | 556 (2.22) | 610 (2.03) | 674 (1.83) |
| P3DDT04 | - | 500 (2.47) | 569 (2.17) | 638 (1.94) | 691 (1.79) |
| P3DDT06 | - | 499 (2.48) | 566 (2.19) | 625 (1.98) | 683 (1.81) |
| P3DDT08 | - | 512 (2.42) | 575 (2.15) | 632 (1.96) | 675 (1.83) |
| P3DDT10 | - | 516 (2.40) | 584 (2.12) | 638 (1.94) | 678 (1.82) |
Table 4.
Photophysical assignment of transitions probed with λex = 405 nm.
| Process | Photophysical description | Rate and assignment |
|---|---|---|
| π + 2 + hνex → π* + 2 | Oligomeric chains absorption | Excitation energy is absorbed (100%) |
| π* + 2 → π + 2 + hνo | Polarized fluorescence | 7% |
| π* + 2 → π + 2 + hνo or π* + 2 → π + 2 or π* + 2 → π* + 1 or π* + 2 → π* |
Non-polarized fluorescence; or internal conversion (oligomer) + vibrational relaxation; or Internal conversion to quinone chains; or internal conversion for pristine chains |
93% |
| π* + 1 → π + 1 + hνQ | Polarized fluorescence | 5-6% |
| π* + 1 → π + 1 + hνQ or π* + 1 → π + 1 or π* + 1 → π* |
Non-polarized fluorescence; or internal conversion (quinone chains) + vibrational relaxation; or internal conversion to pristine chains | Up to 95% |
| π* → π + hνp | Fluorescence | 6% |
| π* → π or π* → π + hνp | Internal conversion (quantum chains) + vibrational relaxation + non-polarized fluorescence | Up to 94% |
Disclaimer/Publisher’s Note: The statements, opinions and data contained in all publications are solely those of the individual author(s) and contributor(s) and not of MDPI and/or the editor(s). MDPI and/or the editor(s) disclaim responsibility for any injury to people or property resulting from any ideas, methods, instructions or products referred to in the content. |
© 2026 by the authors. Licensee MDPI, Basel, Switzerland. This article is an open access article distributed under the terms and conditions of the Creative Commons Attribution (CC BY) license (http://creativecommons.org/licenses/by/4.0/).
Copyright: This open access article is published under a Creative Commons CC BY 4.0 license, which permit the free download, distribution, and reuse, provided that the author and preprint are cited in any reuse.


