
Submitted:
22 January 2026
Posted:
22 January 2026
You are already at the latest version
Abstract
Light exposure is a primary zeitgeber for the human circadian system and plays a key role in shaping sleep–wake patterns during adolescence, a period marked by biological sensitivity and social constraints. How the temporal organization and spectral composition of daily light exposure differ between weekdays and weekends remains poorly un-derstood. Eighteen adolescents (15–17 years) were monitored for seven days using wrist actigraphy with integrated light sensors. Sleep parameters, nonparametric circadian rhythm indices, and time-resolved profiles of ambient and spectral (blue, green, and red) light exposure were analyzed. Repeated-measures ANOVA tested the effects of time of day and day type. Total sleep time and time in bed were longer on weekdays than on weekends (p < 0.05), while sleep latency and WASO did not differ. Circadian indices indicated preserved rhythmic organization. Light exposure showed a robust diurnal profile, with higher spectral irradiance on weekends (p < 0.001), especially in the morning and early afternoon. Significant time × day-type interactions were observed across all spectral bands (p < 0.001), indicating systematic reshaping of daily light profiles. Ado-lescents exhibit weekday–weekend differences in the temporal and spectral organization of light exposure, affecting the amplitude and shape of overall daily profiles.
Keywords:
adolescents
; light exposure
; circadian rhythms
1. Introduction
The Ambient light plays a central role in the temporal organization of human biological rhythms, influencing not only visual processes but also a wide range of non-visual responses, including the regulation of the sleep–wake cycle, melatonin secretion, and levels of alertness [1,2]. Light detection and processing by the retina involve multiple classes of photoreceptors, including rods and cones, which mediate classical visual functions, as well as intrinsically photosensitive retinal ganglion cells (ipRGCs), which play a fundamental role in circadian synchronization [3,4].
ipRGCs express melanopsin and exhibit greater spectral sensitivity to short wavelengths, particularly in the range of 460–490 nm, constituting the primary pathway for transmitting photic information to the suprachiasmatic nucleus (SCN) of the hypothalamus, the main circadian pacemaker in mammals [2,3]. Activation of these pathways is directly associated with melatonin suppression, circadian phase shifting, and the modulation of wakefulness, making light exposure a critical determinant of sleep quality and regularity, traditionally recognized as the principal photic zeitgeber of the circadian system [5,6].
Recent advances in the chronobiology of light have emphasized the need to characterize light exposure using standardized metrics that account for the spectral sensitivity of different retinal photopigments. In this context, the International Commission on Illumination (CIE) proposed the CIE S 026:2018 standard, which defines α-opic spectral weighting functions and metrics such as melanopic equivalent daylight illuminance (melanopic EDI), now widely recommended for the assessment of non-visual circadian responses to light [7]. Complementarily, the guidelines of the Expert Network on Light Intervention and Neurophysiology (ENLIGHT) provide specific recommendations for the reporting and interpretation of light exposure in human field studies [7].
During adolescence, maturational changes in the circadian and homeostatic sleep systems interact with social and academic demands that frequently impose early wake times and irregular patterns of light exposure. In the Brazilian school context, morning classes typically begin between 7:00 and 7:30 a.m. and end around 12:00 or 12:30 p.m., whereas afternoon classes usually run from approximately 1:00 p.m. to 6:00 p.m. In full-time school schedules, the school day often starts at 7:00 a.m. and extends until 4:00 or even 6:00 p.m., intensifying early wake times and prolonged periods of continuous wakefulness. This scenario may exacerbate the misalignment between adolescents’ biological rhythms and social demands, particularly when combined with low daytime light exposure and residual exposure to light at night [8,9,10]. Observational evidence indicates that patterns characterized by reduced daytime light exposure and residual nocturnal light exposure are associated with shorter sleep duration, longer sleep onset latency, and poorer sleep efficiency in this age group [9,10].
Moreover, systematic differences between weekdays and weekends have been widely described as a marker of circadian misalignment, often referred to as social jetlag, reflecting shifts in sleep timing, wake times, and ambient light exposure [4]. Biological factors, such as sex, may further modulate light sensitivity and sleep organization during adolescence, due to hormonal differences and pubertal stage [10].
Although the literature has consistently demonstrated that light exposure influences sleep and circadian regulation in adolescents, most studies have focused on global measures of light intensity or on restricted time windows, often without considering the temporal organization of exposure across the 24-hour cycle. In addition, relatively few investigations have systematically contrasted weekdays and weekends, despite these contexts representing distinct social and behavioral time regimes during adolescence.
In light of these gaps, the present study aimed to characterize diurnal profiles of ambient and spectral light exposure, interpreted as relative indicators of integrated irradiance, and to examine their relationship with sleep parameters, explicitly contrasting weekdays and weekends. By emphasizing the temporal organization of light exposure, this study seeks to provide a more ecologically valid understanding of how social time modulates light environments that are relevant to circadian health in adolescents.
2. Results
2.1. Sleep Parameters and Behavioral Context
All participants reported using electronic devices throughout the day, including smartphones, laptops, and televisions. Eighty-six percent (86%) reported having a television and/or computer in the bedroom, indicating broad availability of these devices in the sleep environment. In addition, 100% of participants reported smartphone use close to sleep periods, including before bedtime, during nighttime awakenings, and upon waking in the morning. Based on self-report, total daily screen time showed substantial interindividual variability, averaging approximately 2 to 3 hours per day. All participants also reported using electronic alarms to wake up on weekdays. Regarding subjective sleep quality, approximately 22% rated their sleep as fair or poor, whereas about 78% rated it as good or very good.
As shown in Table 1, significant differences between weekdays (DS) and weekends (FDS) were observed in sleep duration parameters. Time in bed was significantly longer on weekdays than on weekends (t(30) = 2.10, p = 0.045), with a moderate effect size (d = 0.74). Similarly, total sleep time was significantly greater on weekdays (t(30) = 2.55, p = 0.016), corresponding to a moderate-to-large effect (d = 0.90). In contrast, sleep onset latency (p = 0.347) and wake after sleep onset (WASO) (p = 0.743) did not differ significantly between day types.
Complementarily, the nonparametric indices, calculated based on weekdays, indicated preservation of basal circadian organization. Interdaily stability (IS) showed a mean value of 0.44 (SD = 0.11; 95% CI = 0.43–0.46), reflecting moderate regularity of the daily pattern across days. Intradaily variability (IV) presented a mean of 0.69 (SD = 0.18; 95% CI = 0.68–0.71), indicating moderate intradaily fragmentation.
With respect to the temporal distribution of activity and rest, the most active 10-hour block (M10) exhibited high mean values (M = 3687.24; SD = 1137.26), with an average onset at 08:22 h, indicating consolidation of daytime wakefulness under strong social synchronization. Conversely, the least active 5-hour block (L5) showed low mean values (M = 434.19; SD = 242.65), with an average onset at 04:04 h, reflecting relatively consolidated nocturnal rest.
Relative amplitude (RA) was high (M = 0.86; SD = 0.05; 95% CI = 0.82–0.90), indicating a strong contrast between daytime activity and nighttime rest. Taken together, these findings suggest that, despite quantitative differences in sleep duration between weekdays and weekends, the sleep–wake rhythm remained relatively stable, organized, and functionally differentiated in a context of strong social synchronization.
2.2. Temperature
As illustrated in Figure 1, both external and internal temperatures exhibited a consistent diurnal pattern across the 24-hour cycle, with systematic differences between weekdays and weekends.
Regarding external temperature, a significant main effect of time of day was observed (F(11, 11045) = 733.04; p < 0.001; η²p = 0.422), indicating a robust diurnal pattern. A significant interaction between time of day and day type (weekdays vs. weekends) was also detected (F(11, 11045) = 123.27; p < 0.001; η²p = 0.109), suggesting that the temporal organization of external temperature differed systematically between weekly contexts. In both conditions, temperature peaks occurred in the late evening (22:00–24:00), consistent with local environmental thermal inertia, whereas minimum values were observed in the early morning hours (06:00–10:00).
Overall, mean external temperature was slightly but significantly higher on weekends compared to weekdays (mean difference = 0.13 °C; F(1, 11055) = 27.18; p < 0.001; η²p = 0.002), with a small effect size.
Similarly, internal temperature showed a significant main effect of time of day (F(11, 11045) = 638.55; p < 0.001; η²p = 0.389), as well as a significant interaction between time of day and day type (F(11, 11045) = 117.18; p < 0.001; η²p = 0.105), indicating distinct temporal profiles between weekdays and weekends. In both contexts, higher internal temperatures were recorded during the late evening (22:00–24:00), whereas lower values occurred in the early morning (06:00–10:00).
Mean internal temperature was also slightly higher on weekends (mean difference = 0.09 °C; F(1, 11055) = 11.84; p = 0.001; η²p = 0.001), again with a small effect size. Comparatively, external temperature exhibited greater diurnal amplitude, whereas internal temperature followed a similar temporal organization but with attenuated fluctuations.
2.3. Integrated Ambient Light Irradiance
The mixed-design analysis of variance revealed a robust temporal modulation of ambient light exposure across the 24-hour cycle, as well as significant differences as a function of day type (Figure 2). Ambient light exposure exhibited a well-defined diurnal profile, with minimal values during the late night and early morning hours (00:00–06:00) and peak values concentrated between 08:00 and 16:00, characterizing a high-amplitude daily pattern.
A significant main effect of time was observed (V = 0.422; F(11, 5506) = 365.71; p < 0.001; η²p = 0.422), indicating marked variation across the 12 two-hour time windows. A significant main effect of day type was also detected (F(1, 5516) = 140.10; p < 0.001; η²p = 0.025), with higher mean ambient light exposure on weekends (138.15 ± 4.67) compared to weekdays (72.90 ± 2.93).
Importantly, these global differences were time-of-day dependent. In the early morning (06:00–08:00), exposure was slightly higher on weekdays (DS = 39.99; FDS = 32.71). In contrast, during the 08:00–10:00 interval, a marked inversion was observed, with substantially higher exposure on weekends (DS = 186.20; FDS = 435.27), corresponding to an absolute difference of +249.06 units and a FDS/DS ratio of 2.34, representing the main window of temporal discrepancy between day types.
In the early evening (18:00–20:00), exposure again became higher on weekdays (DS = 3.76; FDS = 2.25; FDS/DS ratio = 0.60), indicating greater persistence of light exposure after sunset on school days. Consistently, a significant interaction between time and day type was observed (V = 0.074; F(11, 5506) = 39.81; p < 0.001; η²p = 0.074), demonstrating that the temporal profile of ambient light exposure differed systematically between weekdays and weekends.
2.4. Blue Light Irradiance (BL)
Blue light exposure was virtually absent during the late night and early morning hours (00:00–06:00) in both day types, increasing sharply from the morning onward (06:00–08:00). This increase occurred in both conditions, but with a steeper and earlier rise on weekends. Peak exposure was concentrated between 08:00 and 16:00, with consistently higher and more sustained levels on weekends, particularly in the 08:00–10:00, 10:00–12:00, and 14:00–16:00 intervals. During the late afternoon and night (18:00–24:00), exposure returned to residual levels in both contexts, although punctual differences persisted (Table 2).
Multivariate analyses revealed a strong main effect of time (V = 0.399; F(11, 4939) = 297.58; p < 0.001; η²p = 0.399), as well as a significant time × day type interaction (V = 0.066; F(11, 4939) = 31.61; p < 0.001; η²p = 0.066). Mauchly’s test indicated violation of sphericity (p < 0.001), and the Greenhouse–Geisser correction was therefore applied (ε = 0.319). Under this correction, significant effects of time (F(3.50, 17,341.74) = 185.55; p < 0.001; η²p = 0.036) and of the time × day type interaction (F(3.50, 17,341.74) = 22.28; p < 0.001; η²p = 0.004) were maintained.
Polynomial contrasts indicated that temporal variation in blue light exposure was predominantly explained by nonlinear components, with a robust quadratic effect (F(1, 4949) = 1,165.86; p < 0.001; η²p = 0.191), as well as significant higher-order components, evidencing a complex temporal structure across the 24-hour cycle.
2.5. Green Light Irradiance (GL)
Green light exposure exhibited a well-defined diurnal temporal profile, with minimal values during the late night, a progressive increase throughout the morning, and a marked reduction during the night. The largest differences between weekdays and weekends were concentrated in the morning period (06:00–12:00), with substantially higher exposure on weekends, particularly after 08:00. During the afternoon (12:00–18:00), exposure remained elevated in both contexts, but was consistently higher on weekends. At night (18:00–24:00), levels returned to residual values, with small-magnitude diferences (Table 2).
Multivariate tests revealed a robust main effect of time (V = 0.434; F(11, 5467) = 380.69; p < 0.001; η²p = 0.434), as well as a significant time × day type interaction (V = 0.078; F(11, 5467) = 41.84; p < 0.001; η²p = 0.078). Given the violation of sphericity (p < 0.001), univariate tests were interpreted using the Greenhouse–Geisser correction (ε = 0.347), which preserved the significance of both the main effect of time (F(3.81, 20,887.02) = 244.26; p < 0.001; η²p = 0.043) and the time × day type interaction (F(3.81, 20,887.02) = 36.19; p < 0.001; η²p = 0.007).
At the between-subjects level, mean exposure was higher on weekends (FDS = 68.88 vs. DS = 36.21; Δ = 32.66; p < 0.001). Polynomial contrasts indicated the predominance of nonlinear components, with a strong contribution of the quadratic term (η²p = 0.223), suggesting differences in both the shape and amplitude of the diurnal profile between day types. Parameter estimates by time interval indicated that differences between weekdays and weekends were predominantly concentrated during the daytime, especially between 08:00 and 14:00, with higher green light exposure on weekends, whereas nighttime differences were of smaller magnitude and variable direction.
2.6. Red Light Irradiance (RL)
Red light exposure exhibited a well-defined diurnal temporal profile, with near-zero values during the late night and early morning (00:00–06:00), followed by a sharp increase from the morning onward, reaching peak levels between 08:00 and 16:00. Multivariate tests confirmed a robust main effect of time (V = 0.407; F(11, 5349) = 334.31; p < 0.001; η²p = 0.407), as well as a significant time × day type interaction (V = 0.069; F(11, 5349) = 35.82; p < 0.001; η²p = 0.069).
Violation of sphericity (p < 0.001) motivated the use of the Greenhouse–Geisser correction (ε = 0.325), under which significant effects of time (F(3.58, 19,166.05) = 184.95; p < 0.001; η²p = 0.033) and of the time × day type interaction (F(3.58, 19,166.05) = 23.43; p < 0.001; η²p = 0.004) were preserved. At the between-subjects level, mean red light exposure was higher on weekends (DS = 23.61 vs. FDS = 42.88; Δ = 19.27; F(1, 5359) = 104.11; p < 0.001; η²p = 0.019).
Polynomial contrasts indicated a predominance of nonlinear components, with marked contributions of the quadratic (η²p = 0.181) and fourth-order (η²p = 0.153) terms, suggesting differences in both the shape and amplitude of the diurnal profile between weekdays and weekends. Descriptively, discrepancies were concentrated during the daytime, particularly between 08:00 and 12:00, whereas during the night (18:00–24:00) exposure returned to residual levels in both day types (Table 2).
3. Discussion
3.1. Spectral Profile and Temporal Organization of Daily Light Exposure
Parameter estimates by time interval consistently showed that differences between weekdays and weekends in blue, green, and red light exposure were strongly time-of-day dependent, concentrating predominantly during the daytime, especially between 08:00 and 14:00. This pattern is consistent with classical models of human chronobiology, according to which the circadian system is primarily entrained by the environmental light–dark contrast, but its daily expression is strongly modulated by social time and behavioral routines [3,13,14]. Contemporary clinical guidelines and reviews further emphasize that everyday light exposure should be understood as an active environmental determinant of sleep–wake temporal organization, with direct implications for the risk of functional circadian misalignment, particularly in contexts of high social constraint [15,16].
The higher light exposure observed on weekends suggests that social time primarily modulates the amplitude and shape of the daily exposure profile, rather than promoting a simple phase shift along chronological time. This finding converges with ambulatory studies showing that adolescents and young adults exhibit lower exposure to natural daylight on weekdays and higher daytime exposure on free days, reflecting restrictions imposed by school and academic routines [17]. Thus, reduced effective daytime light exposure in enclosed school environments, when combined with residual light exposure in the early evening, may diminish the functional contrast between day and night, increasing vulnerability to phase delay in adolescents, even in the absence of detectable structural circadian disorganization [18,19].
In this context, schools should be recognized as central modulators of daytime light exposure, especially during the morning, which represents the time window of greatest chronobiological efficacy of light. Classrooms with ample access to natural daylight favor greater exposure to short- and medium-wavelength light, particularly in the blue range (460–500 nm), which is associated with stronger melanopic activation and enhanced morning circadian entrainment [5,13].
3.2. Rest–Activity Rhythm, Circadian Stability, and Intradaily Variability
Despite quantitative differences in sleep duration between weekdays and weekends, nonparametric indices indicated preservation of basal circadian organization. Moderate values of interdaily stability and intradaily variability, combined with relatively high amplitude, are compatible with a functionally differentiated sleep–wake rhythm, characterized by consolidated daytime wakefulness (high M10) and relatively preserved nocturnal rest (low L5). This pattern is consistent with normative descriptions of rest–activity rhythms in adolescent populations under strong social synchronization, in which intradaily fragmentation predominantly reflects intra-day behavioral heterogeneity rather than primary instability of the central circadian oscillator [4,14].
From a clinical perspective, international guidelines emphasize that quantitative changes in sleep, when not accompanied by a loss of rhythmic stability, should be interpreted as temporal and behavioral adjustments rather than as circadian sleep–wake rhythm disorders [15].
The methodological decision to compute nonparametric indices based exclusively on weekdays is supported by these recommendations, as such metrics rely on multiple consecutive days for reliable estimation. Very short time windows, such as isolated weekends, tend to inflate variance and reduce interpretative validity, particularly in adolescents, whose behavior shows high contextual variability [4]. In this sense, the relative preservation of nonparametric parameters observed in this study suggests that the identified pattern reflects a functional adaptation to predictable social constraints rather than a primary circadian disorganization.
3.3. Evening and Nighttime Light Exposure, Circadian Sensitivity, and Phase Delay
Although the largest spectral differences occurred during the daytime, the pattern observed in the early evening (approximately between 18:00 and 22:00) has chronobiological relevance disproportionate to its absolute magnitude. Experimental evidence shows that this interval corresponds to a phase of heightened circadian sensitivity to light, as described by phase response curves, in which nocturnal light exposure produces robust phase delays [20].
Experimental and observational studies indicate that even moderate light exposure, when combining sufficient duration and short-wavelength or broadband spectral components, can suppress melatonin secretion and delay sleep onset, with particularly pronounced effects in adolescents [18,21].
In this context, accumulating evidence suggests that adolescence represents a specific window of circadian vulnerability, in which the physiological delay of the biological clock interacts with increased sensitivity to evening and nighttime light. Recent reviews indicate that exposure to artificial light at night is associated not only with sleep disturbances but also with changes in alertness, cognitive functioning, and emotional regulation, particularly in young populations exposed to intense social demands—such as those reflected in the self-reported electronic device use in the present sample [16,19].
Thus, even small-magnitude differences in early evening light exposure, such as those observed on weekdays, may act cumulatively across the week, promoting progressive delays in sleep onset and chronic restriction of total sleep time, without necessarily producing detectable circadian disorganization in nonparametric indices.
3.4. Spectral Composition, Social Time, and Implications for Adolescent Sleep Health
Although blue light is recognized as the primary chronobiologically active stimulus, the present results show that the temporal profiles of green and red light closely track the pattern of blue light throughout the day. This finding reinforces the notion that, in real-world ecological environments, light exposure occurs as a composite spectral stimulus rather than as isolated wavelengths.
Recent evidence indicates that circadian responses to light depend on the interaction between intensity, spectrum, and duration of exposure, with nonlinear temporal dynamics [18].
From a social time perspective, these findings directly engage with the literature linking school organization and adolescent sleep health. Systematic reviews have shown that early school start times are associated with shorter sleep duration, poorer sustained attention, and greater daytime sleepiness, even when circadian rhythms remain structurally organized [15,19].
The coexistence of reduced effective daytime light exposure on weekdays, increased light exposure on weekends, and frequent nighttime use of light-emitting devices creates an environment conducive to misalignment between biological time and social time. Accordingly, the present data support the need for integrated approaches that simultaneously consider school schedules, daytime light exposure, and nighttime light control, particularly in full-time schooling contexts.
3.5. Ambient Temperature, Thermoregulation, and Sleep–Wake Transitions
In addition to light exposure, the external and internal temperature profiles observed in this study provide a relevant physiological context for sleep–wake organization. The presence of a robust diurnal temperature pattern, with higher values in the late night and minima in the early morning, is consistent with the literature describing the close interaction between thermoregulation and sleep.
Physiological evidence shows that sleep onset typically occurs during the descending phase of core body temperature, accompanied by increased peripheral vasodilation and elevation of distal skin temperature, whereas awakening is associated with the opposite process [22,23].
A recent actigraphy-based study with integrated thermal sensors demonstrated that wrist temperature increases systematically before and after sleep onset and decreases sharply after awakening, regardless of ambient temperature, constituting a robust physiological marker of sleep–wake transitions under ecological conditions [24].
In this sense, the small but systematic differences between weekdays and weekends in ambient thermal profiles observed in this study may act as contextual modulators of thermal comfort and heat dissipation, interacting with light exposure and social time to influence sleep timing without necessarily producing detectable changes in global circadian stability.
These findings reinforce the importance of jointly considering light and temperature as integrated environmental signals in the regulation of adolescent sleep, particularly in full-time schooling contexts with high social predictability.
3.6. Interpretation in Light of Pittendrigh’s Generalizations
The findings of the present study can be interpreted in light of Pittendrigh’s classical generalizations, according to which circadian rhythms are intrinsically stable endogenous systems whose free-running period (τ) approximates, but does not exactly match, 24 hours, requiring continuous synchronization by environmental cues [25,26].
Within this framework, the absence of global shifts in the sleep–wake rhythm between weekdays and weekends, concomitant with modulation of the shape and amplitude of light exposure profiles, suggests preservation of central oscillator organization, with variations occurring primarily in the daily expression of the rhythm.
This interpretation is reinforced by the relative stability of nonparametric indices, consistent with the notion that biological clocks maintain temporal regularity even under predictable environmental fluctuations. The observed patterns are therefore more consistent with functional adjustments mediated by social synchronizers than with primary circadian instability.
The results also support the idea that circadian clocks are open systems whose phase is modulated by environmental synchronizers, with light playing a central role. The concentration of light exposure differences within windows of higher functional relevance—especially in the early evening—is compatible with the concept of phase response curves, according to which the chronobiological impact of light critically depends on the timing of exposure.
Thus, modest variations in evening and nighttime light exposure may produce cumulative effects across the week, promoting progressive phase delays without compromising global rhythmic stability.
Complementarily, the observed thermal profiles suggest that temperature acts as a contextual modulator of sleep–wake transitions, influencing thermal comfort and heat dissipation without inducing detectable changes in basal circadian stability [22,23]. This preservation of temporal organization despite environmental fluctuations is consistent with Pittendrigh’s principle of compensation and robustness, reinforcing the view that light and temperature should be interpreted as integrated environmental signals.
Finally, in line with Pittendrigh’s framework, the identified patterns suggest a regime of functional adaptation to predictable social constraints rather than primary circadian disorganization. This perspective shifts interpretation from a rhythm disorder model to a cumulative temporal adjustment model, with direct implications for environmental interventions in school contexts.
3.7. Limitations and Future Directions
Despite the robustness of the temporal and spectral analyses, this study has limitations that should be considered when interpreting the findings. First, light exposure was characterized using broad spectral bands, which did not allow direct estimation of standardized α-opic metrics, such as melanopic equivalent daylight illuminance (melanopic EDI), as recommended by the CIE S 026:2018 and ENLIGHT guidelines [7].
Accordingly, inferences about circadian impact should be understood as indirect and based on the temporal and spectral organization of exposure rather than on direct measures of effective melanopic dose—a limitation widely recognized in field studies using actigraphy and portable light sensors [14,27]. Nevertheless, approaches based on temporal exposure profiles have been considered valid for ecological inferences about circadian entrainment and sleep–wake behavior in young populations [28].
Additionally, the observational design of the study precludes causal inferences between light exposure and sleep outcomes, although the observed patterns are consistent with the existing chronobiological and clinical literature demonstrating time-, duration-, and spectrum-dependent effects of light on the human circadian system [15,16,21].
Experimental and clinical evidence indicates that light acts both through circadian mechanisms (via modulation of phase and rhythmic amplitude) and through direct effects on alertness, attention, and homeostatic sleep pressure, reinforcing the need for caution in causal interpretation of observational findings [3].
A specific methodological point concerns the nonparametric indices (IV, IS, L5, M10, and RA), which were calculated exclusively based on weekdays. This decision is supported by the fact that these metrics rely on stable estimates of regularity and fragmentation across multiple consecutive days. Methodological guidelines and validation studies in actigraphy indicate that nonparametric indices show greater stability and validity when derived from longer time series under relatively consistent routines [29].
Thus, restricting these indices to weekdays—characterized by a greater number of observed days and stronger social synchronization—prioritizes internal validity and comparability of basal circadian organization parameters [10].
Finally, future studies should integrate calibrated spectral measurements, α-opic metrics, and direct physiological markers such as salivary melatonin or objective phase estimates, as recommended by recent reviews and clinical chronobiology guidelines [21,27].
Longitudinal designs and intervention studies exploring environmental modifications—including school lighting strategies, nighttime light-emitting device control, and adjustments to academic schedules—may further contribute to a more translational understanding of how light exposure modulation affects adolescent sleep health, particularly in full-time schooling contexts with high temporal pressure [9,28].
4. Materials and Methods
4.1. Participants
Eighteen adolescents aged 15 to 17 years participated in the study. All were regularly enrolled in a public full-time high school (08:00 a.m. to 5:30 p.m.) and followed a similar school routine, with classes starting around 8:00 a.m. The study was approved by the Research Ethics Committee of the Universidade do Estado de Minas Gerais (CAAE: 69328623.8.0000.5115). Legal guardians provided written informed consent, and all adolescents gave written assent.
4.2. Study
Data collection was conducted in the city of Divinópolis, Minas Gerais (20°S, 44°W), located in a medium-sized urban area in southeastern Brazil. The region exhibits moderate seasonal variation in photoperiod, with a mean daily daylight duration of approximately 8.1 hours during the data collection period, corresponding to the autumn–winter season (May to July 2025). During this period, diurnal temperature variation was observed, with an average temperature of approximately 16 °C in the morning and 26 °C in the afternoon. The reduced photoperiod limited the availability of natural light in the early morning hours, particularly on weekdays.
During school days, adolescents spent most of their time indoors. Exposure to natural light occurred mainly during school breaks, lasting approximately 30 minutes in the morning and 30 minutes in the afternoon, as well as during brief daily commuting periods. Some classrooms lacked windows and consisted of enclosed environments with continuous artificial lighting and air-conditioning, substantially restricting the entry of natural daylight during academic activities.
4.3. Study Design and Procedure
This was an observational field study. Participants were continuously monitored using actigraphy for seven consecutive days (168 hours), including five weekdays and two weekend days. This period was considered sufficient to capture typical variability between school routines and non-school days, in accordance with the recommendations of the Brazilian Consensus on Actigraphy [11].
The device was worn on the non-dominant wrist throughout the entire recording period, enabling continuous monitoring of activity–rest patterns and ambient light exposure across the 24-hour cycle. Participants were instructed to maintain their habitual sleep–wake routines, with no experimental manipulation. Data collection occurred during a regular school term, outside of examination weeks or atypical school events.
4.4. Instruments
4.4.1. Sociodemographic Questionnaire
A structured sociodemographic questionnaire was specifically developed for the present study to characterize the participants’ profiles. The instrument included items related to age, sex, school grade, school schedule, daily routine, use of electronic devices, physical activity, general sleep habits, and self-reported health conditions. These data were used for sample description and to support exploratory and statistical control analyses.
4.4.2. ActTrust Actigraph
Objective sleep–wake parameters and ambient light exposure were recorded using an ActTrust® actigraph (Condor Instruments, São Paulo, Brazil). The device allows continuous recording of motor activity, skin temperature, and ambient light exposure. Motor activity was recorded via a triaxial accelerometer, whereas light exposure was measured using an integrated spectral sensor capable of estimating photopic illuminance based on the combination of multiple spectral channels.
Data were sampled at 60-second intervals, allowing continuous 24-hour monitoring, including during sleep. The device also includes an off-wrist detection sensor, which was used for data quality control. Data extraction and processing were performed using ActStudio software, following the manufacturer’s specifications.
4.4.3. Outcome Measures
Sleep and Circadian Parameters: Actigraphic recordings were used to derive objective sleep parameters and nonparametric indices of circadian organization. Sleep variables included total sleep time, sleep onset latency, wake after sleep onset, number of awakenings, and sleep efficiency.
Nonparametric rest–activity rhythm parameters (interdaily stability [IS], intradaily variability [IV], least active 5 h [L5], and most active 10 h [M10]) were calculated exclusively based on weekdays. This decision was made because these metrics require sufficiently long and stable time series to reliably estimate circadian regularity and fragmentation. Since the weekend period comprised only two consecutive days, their isolated inclusion would not meet the methodological assumptions of these measures and could introduce bias into the estimation of rhythmic indices [11].
Temperature: Ambient temperature was continuously recorded using the thermal sensor integrated into the actigraph, with sampling synchronized to light exposure measurements. This variable was included to characterize the environmental context and to control for potential thermal influences on sleep patterns and circadian organization. Temperature was not treated as a primary outcome of the study [11].
Light Exposure: Light exposure was continuously recorded using a multichannel spectral sensor integrated into the actigraph, allowing simultaneous collection of total ambient light exposure and relative irradiance in different spectral bands (red, green, and blue). Total ambient light exposure was used as a global indicator of light intensity, whereas spectral bands were analyzed separately to characterize the spectral profile of exposure throughout the day.
For analytical purposes, data were aggregated into time windows across the 24-hour cycle (morning, afternoon, and evening), enabling the assessment of temporal exposure patterns and within-subject comparisons between weekdays and weekends [11].
Spectral bands were analyzed based on band-specific integrated irradiance (mW/m²), used as a relative indicator of the spectral composition of light exposure [12]. It is important to note that the device does not provide a continuous spectrum nor allow direct conversion of measurements into standardized photometric or α-opic metrics, such as those defined by the CIE S 026/E:2018 (e.g., absolute α-opic irradiances or photopic illuminance in lux) [7]. Nevertheless, data interpretation was informed by its conceptual principles, particularly the functional relevance of blue light as the main spectral component associated with the activation of intrinsically photosensitive retinal ganglion cells (ipRGCs), which are involved in circadian regulation and non-visual light responses [3]. Accordingly, spectral analyses were interpreted in relative terms, as indicators of the functional profile of daily light exposure rather than as absolute measures of α-opic stimulation.
4.5. Statistical Analyses
The effects of day type (weekdays vs. weekends) and time of day on light exposure were evaluated using a two-factor repeated-measures analysis of variance (ANOVA), with both factors treated as within-subject variables. Given the rhythmic nature of chronobiological variables, polynomial contrasts were specified for the time factor to identify linear and nonlinear trends across the 24-hour cycle.
Time of day was represented by 12 temporal points distributed across the 24-hour period. Initially, descriptive statistics (mean, standard deviation, minimum, and maximum) were computed for each time interval, stratified by day type. Subsequently, repeated-measures ANOVA was conducted to test: (a) the main effect of time, (b) the main effect of day type, and (c) the time × day type interaction, assessing whether temporal patterns of light exposure differed between weekdays and weekends.
The assumption of sphericity was evaluated using Mauchly’s test, and when violated, degrees of freedom were corrected using the Greenhouse–Geisser adjustment. When significant main effects or interactions were observed, post hoc analyses were conducted to explore specific differences between day types, with Bonferroni correction applied to control for Type I error. Effect sizes were estimated using partial eta squared (η²p), allowing interpretation of the magnitude of observed effects. All analyses were performed using SPSS software (version 24.0).
5. Conclusions
In adolescents enrolled in full-time schooling regimes, the temporal organization of light exposure constitutes a key element at the interface between biological time and social time. The findings of the present study indicate that systematic differences between weekdays and weekends emerge predominantly in the shape and amplitude of diurnal and early evening light exposure profiles, rather than as global shifts in the sleep–wake rhythm. This pattern suggests that social time operates as a continuous environmental modulator, capable of altering the everyday light context without necessarily compromising basal circadian stability.
Author Contributions
Conceptualization, M.J.O.A. and T.F.B.O.; methodology, M.J.O.A., E.F.L.S. and G.M.; software, E.F.L.S. and L.R.D.; validation, M.J.O.A., T.F.B.O. and F.D.R.; formal analysis, E.F.L.S. and G.M.; investigation, E.F.L.S., G.M., F.D.R., L.M.G.R., M.F.O. and C.F.C.C.M.B.; resources, M.J.O.A.; data curation, E.F.L.S. and G.M.; writing—original draft preparation, E.F.L.S. and M.J.O.A.; writing—review and editing, all authors; visualization, L.T.L. and L.R.D.; supervision, M.J.O.A.; project administration, M.J.O.A.; funding acquisition, M.J.O.A. All authors have read and agreed to the published version of the manuscript.
Funding
This research was funded by the Minas Gerais Research Foundation (FAPEMIG), grant number APQ-04870-24. The APC was funded by FAPEMIG.
Institutional Review Board Statement
The study was approved by the Research Ethics Committee of the Universidade do Estado de Minas Gerais (CAAE: 69328623.8.0000.5115).
Informed Consent Statement
Informed consent was obtained from all subjects involved in the study.
Data Availability Statement
The raw data supporting the conclusions of this article will be made available by the authors on request.
Acknowledgments
During the preparation of this manuscript, the authors used ChatGPT (OpenAI, GPT-5.2) for the purposes of reference formatting, grammatical correction, and adaptation of the text to the journal’s editorial guidelines. The authors have reviewed and edited the output and take full responsibility for the content of this publication.
Conflicts of Interest
The authors declare no conflicts of interest.
References
- Do, M.T.; Yau, K.W. Intrinsically photosensitive retinal ganglion cells. Physiol. Rev. 2010, 90, 1547–1581. [Google Scholar] [CrossRef]
- Mure, L.S. Intrinsically photosensitive retinal ganglion cells of the human retina. Front. Neurol. 2021, 12, 636330. [Google Scholar] [CrossRef]
- Hannibal, J.; Hindersson, P.; Ostergaard, J.; Georg, B.; Heegaard, S.; Larsen, P.J.; Fahrenkrug, J. Melanopsin is expressed in PACAP-containing retinal ganglion cells of the human retinohypothalamic tract. Invest. Ophthalmol. Vis. Sci. 2004, 45, 4202–4209. [Google Scholar] [CrossRef]
- Schmidt, T.M.; Chen, S.K.; Hattar, S. Intrinsically photosensitive retinal ganglion cells: Many subtypes, diverse functions. Trends Neurosci. 2011, 34, 572–580. [Google Scholar] [CrossRef]
- Brainard, G.C.; Hanifin, J.P.; Greeson, J.M.; Byrne, B.; Glickman, G.; Gerner, E.; Rollag, M.D. Action spectrum for melatonin regulation in humans: Evidence for a novel circadian photoreceptor. J. Neurosci. 2001, 21, 6405–6412. [Google Scholar] [CrossRef]
- Van Diepen, R.M.; Cohen, M.X.; Denys, D.; Mazaheri, A. Attention and temporal expectations modulate power, not phase, of ongoing alpha oscillations. J. Cogn. Neurosci. 2015, 27, 1573–1586. [Google Scholar] [CrossRef] [PubMed]
- International Commission on Illumination (CIE). CIE S 026/E:2018—CIE System for Metrology of Optical Radiation for ipRGC-Influenced Responses to Light; CIE: Vienna, Austria, 2018. [Google Scholar] [CrossRef]
- Higuchi, S. Light at night and circadian rhythms: From the perspective of physiological anthropology research. J. Physiol. Anthropol. 2024, 43, 32. [Google Scholar] [CrossRef]
- Beute, F.; Aries, M.B.C. The importance of residential dusk and dawn light exposure for sleep quality, health, and well-being. Sleep Med. Rev. 2023, 63, 101865. [Google Scholar] [CrossRef]
- Ricketts, E.J.; Joyce, D.S.; Rissman, A.J.; Burgess, H.J.; Colwell, C.S.; Lack, L.C.; Gradisar, M. Electric lighting, adolescent sleep and circadian outcomes, and recommendations for improving light health. Sleep Med. Rev. 2022, 64, 101667. [Google Scholar] [CrossRef] [PubMed]
- Pedrazzoli, M.; Gonçalves, B. (Coords.) Consenso Brasileiro de Actigrafia; Segmento Farma Editores: São Paulo, SP, BR, 2021. ISBN 978-65-992059-6-5. (sem DOI).
- Spitschan, M. Time-varying light exposure in chronobiology and sleep research experiments. Front. Neurol. 2021, 12, 654158. [Google Scholar] [CrossRef] [PubMed]
- Goulet, G.; Mongrain, V.; Desrosiers, C.; Paquet, J.; Dumont, M. Daily light exposure in morning-type and evening-type individuals. J. Biol. Rhythms 2007, 22, 151–158. [Google Scholar] [CrossRef]
- Vitaterna, M.H.; Takahashi, J.S.; Turek, F.W. Overview of circadian rhythms. Cold Spring Harb. Symp. Quant. Biol. 2001, 66, 73–82. [Google Scholar] [CrossRef]
- Auger, R.R.; Burgess, H.J.; Emens, J.S.; Deriy, L.V.; Thomas, S.M.; Sharkey, K.M. Clinical practice guideline for the treatment of intrinsic circadian rhythm sleep–wake disorders. Chronobiol. Int. 2011, 28, 609–631. [Google Scholar] [CrossRef]
- Lee, H.-J. Unraveling the significance of circadian rhythms for health. Chronobiol. Med. 2022, 4, 141–142. [Google Scholar] [CrossRef]
- Van der Maren, S.; Moderie, C.; Duclos, C.; Paquet, J.; Dumont, M. Daily profiles of light exposure and evening use of light-emitting devices in young adults with delayed sleep schedule. Chronobiol. Int. 2018, 35, 1385–1399. [Google Scholar] [CrossRef] [PubMed]
- Nagare, R.; Plitnick, B.; Figueiro, M.G. Nocturnal melatonin suppression in adolescents and adults for different levels, spectra, and durations of light exposure. J. Biol. Rhythms 2019, 34, 178–191. [Google Scholar] [CrossRef] [PubMed]
- Ha, M.; Kim, Y.; Lee, H.-J. Artificial light at night and its impact on cognitive function: A review. Chronobiol. Med. 2023, 5, 14–20. [Google Scholar] [CrossRef]
- Khalsa, S.B.S.; Jewett, M.E.; Cajochen, C.; Czeisler, C.A. A phase response curve to single bright light pulses in human subjects. J. Physiol. 2003, 549, 945–952. [Google Scholar] [CrossRef]
- Cain, S.W.; Dennison, C.F.; Zeitzer, J.M.; Guzik, A.M.; Khalsa, S.B.S.; Santhi, N.; Schoen, M.W.; Czeisler, C.A.; Duffy, J.F. Sex differences in phase angle of entrainment and melatonin amplitude in humans. J. Biol. Rhythms 2010, 25, 288–296. [Google Scholar] [CrossRef]
- Kräuchi, K. The thermophysiological cascade leading to sleep initiation in relation to phase of entrainment. Sleep Med. Rev. 2007, 11, 439–451. [Google Scholar] [CrossRef]
- Van Someren, E.J.W. Mechanisms and functions of coupling between sleep and temperature rhythms. In Prog. Brain Res.; Elsevier: Amsterdam, NL, 2006; Volume 153, pp. 309–324. [Google Scholar] [CrossRef]
- Rodrigues Neto, C.; Carvalho, F.; Grassi-Kassisse, D.; Caumo, W.; Silva, A.X.; Crispim, C.A.; Pedrazzoli, M. Wrist temperature as a sleep marker in actigraphy. Chronobiol. Int. 2025; in press. [Google Scholar] [CrossRef] [PubMed]
- Pittendrigh, C.S. Circadian rhythms and the circadian organization of living systems. Cold Spring Harb. Symp. Quant. Biol. 1960, 25, 159–184. [Google Scholar] [CrossRef] [PubMed]
- Pittendrigh, C.S. Temporal organization: Reflections of a Darwinian clock-watcher. Annu. Rev. Physiol. 1993, 55, 16–54. [Google Scholar] [CrossRef]
- Tähkämö, L.; Partonen, T.; Pesonen, A.-K. Systematic review of light exposure impact on human circadian rhythm. Chronobiol. Int. 2018, 35, 151–169. [Google Scholar] [CrossRef]
- Alfonsi, V.; Palmizio, R.; Rubino, A.; Scarpelli, S.; Gorgoni, M.; D’Atri, A.; Pazzaglia, M.; Ferrara, M.; Giuliano, S.; De Gennaro, L. The association between school start time and sleep duration, sustained attention, and academic performance. Nat. Sci. Sleep 2020, 12, 1161–1172. [Google Scholar] [CrossRef]
- Geoffroy, P.A. The light of hope in antidepressant strategies. Chronobiol. Med. 2020, 2, 57–60. [Google Scholar] [CrossRef]
Figure 1.
Diurnal profiles of external (left panel) and internal (right panel) temperature across a 24-h cycle on weekdays (DS) and weekends (FDS). Values represent mean temperature for each 2-h time bin.
Figure 1.
Diurnal profiles of external (left panel) and internal (right panel) temperature across a 24-h cycle on weekdays (DS) and weekends (FDS). Values represent mean temperature for each 2-h time bin.
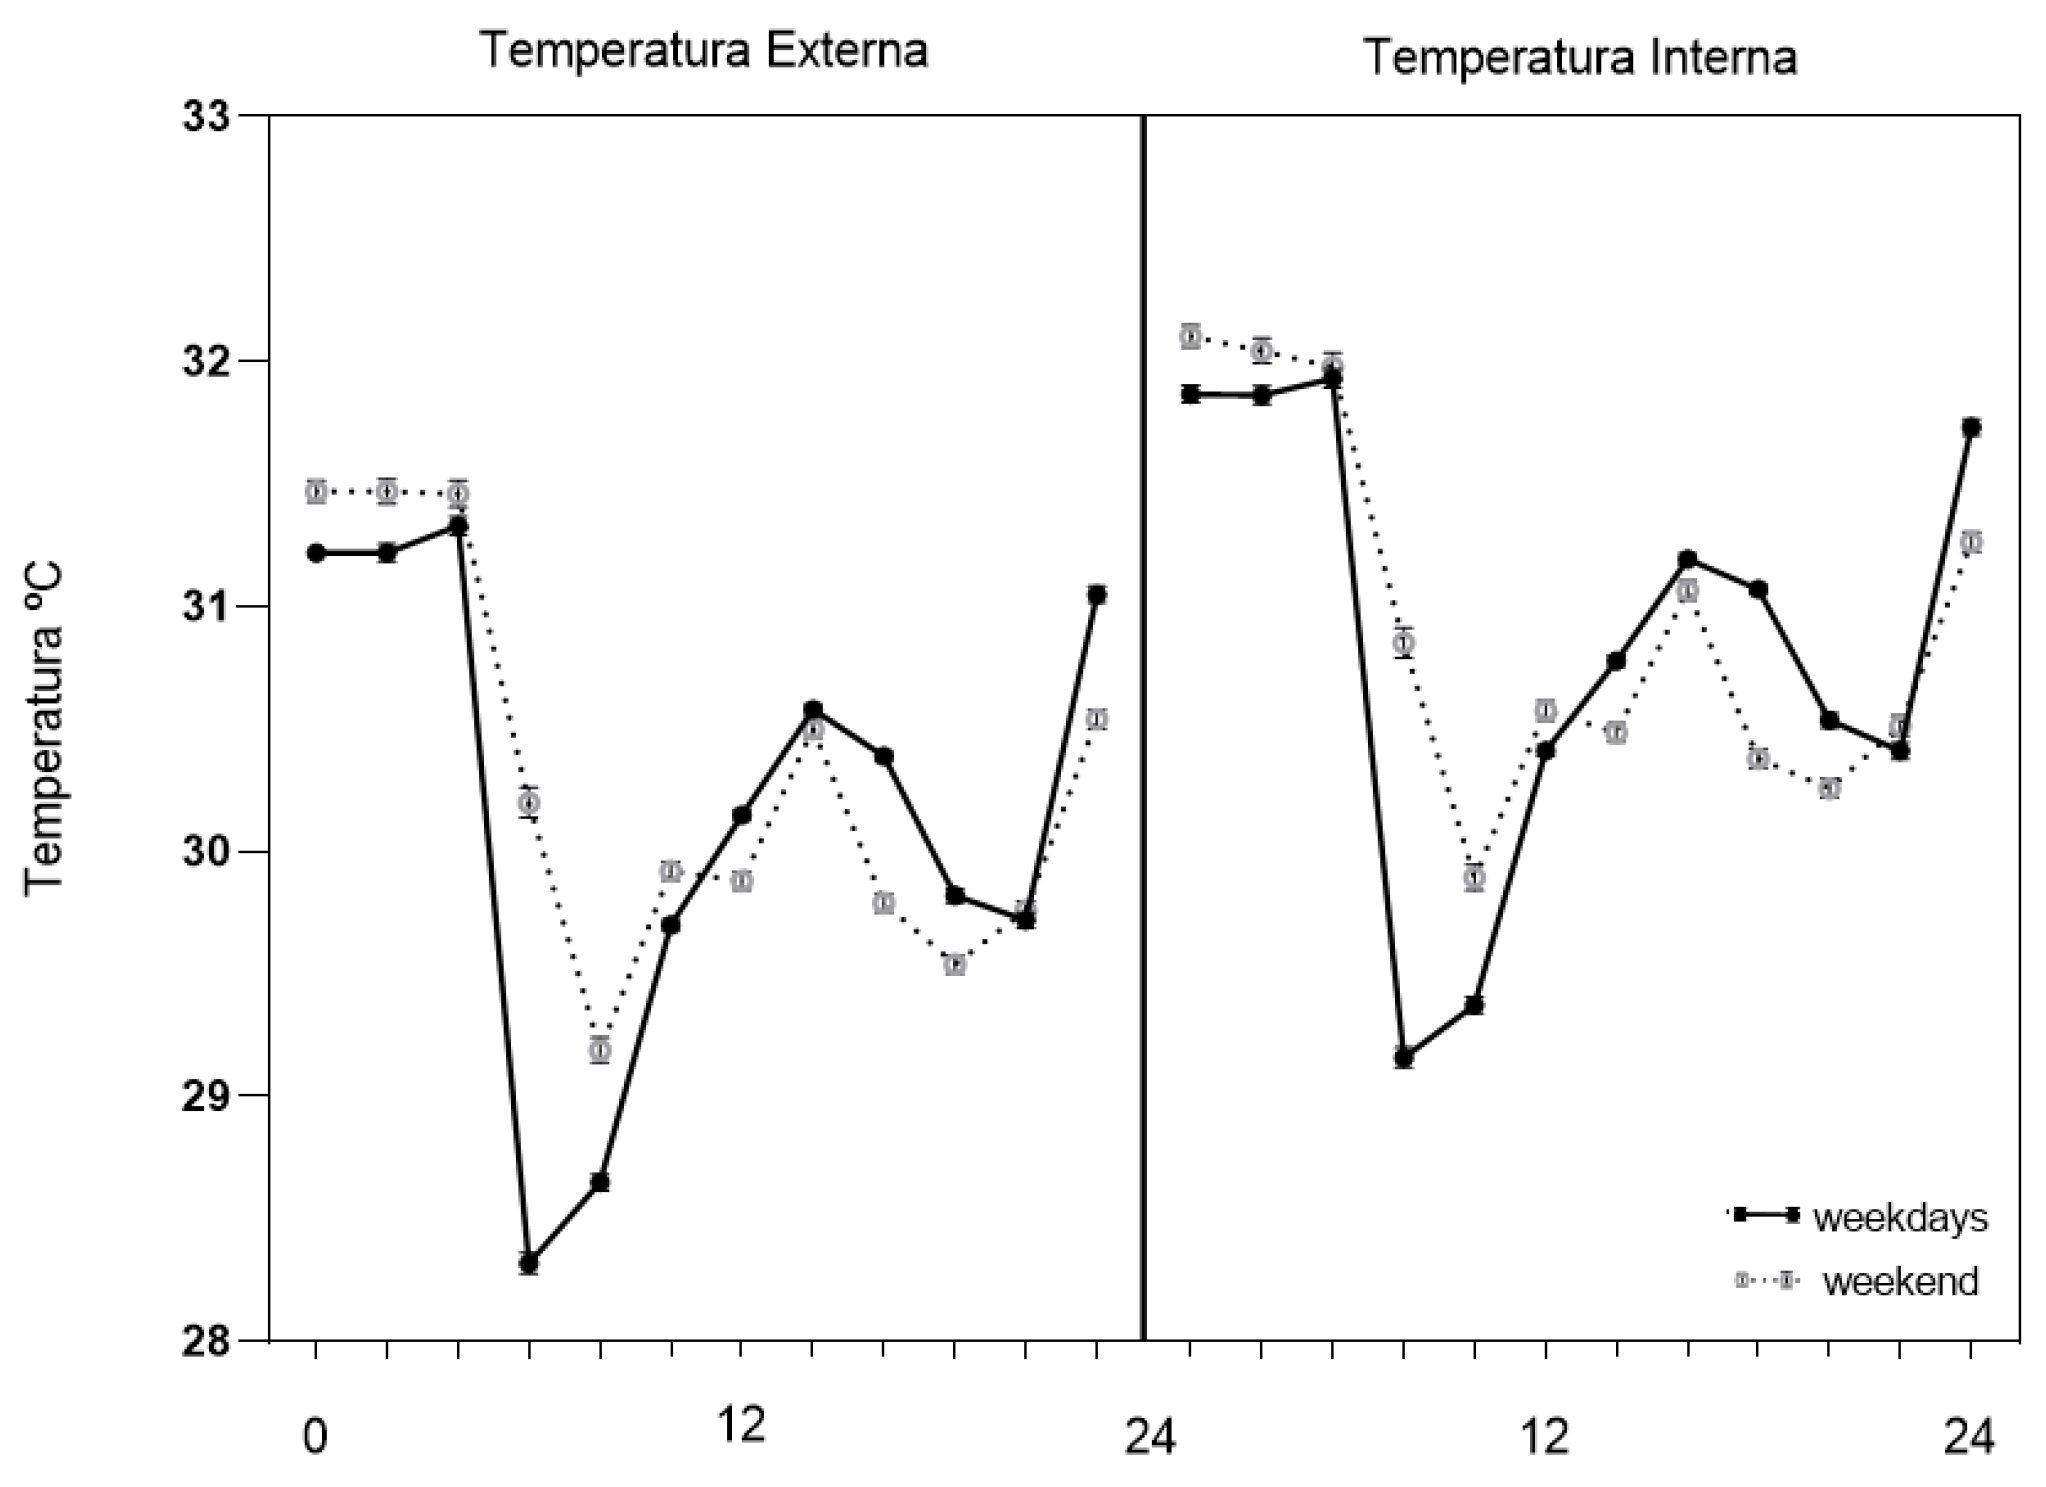
Figure 2.
Daily profile of ambient light exposure expressed as integrated irradiance (mW/m²) across the 24-h cycle. Solid lines represent weekdays, dashed lines represent weekends, and the dotted line represents the overall daily profile. Values are plotted on a logarithmic scale and represent mean ± standard error of the mean (SD).
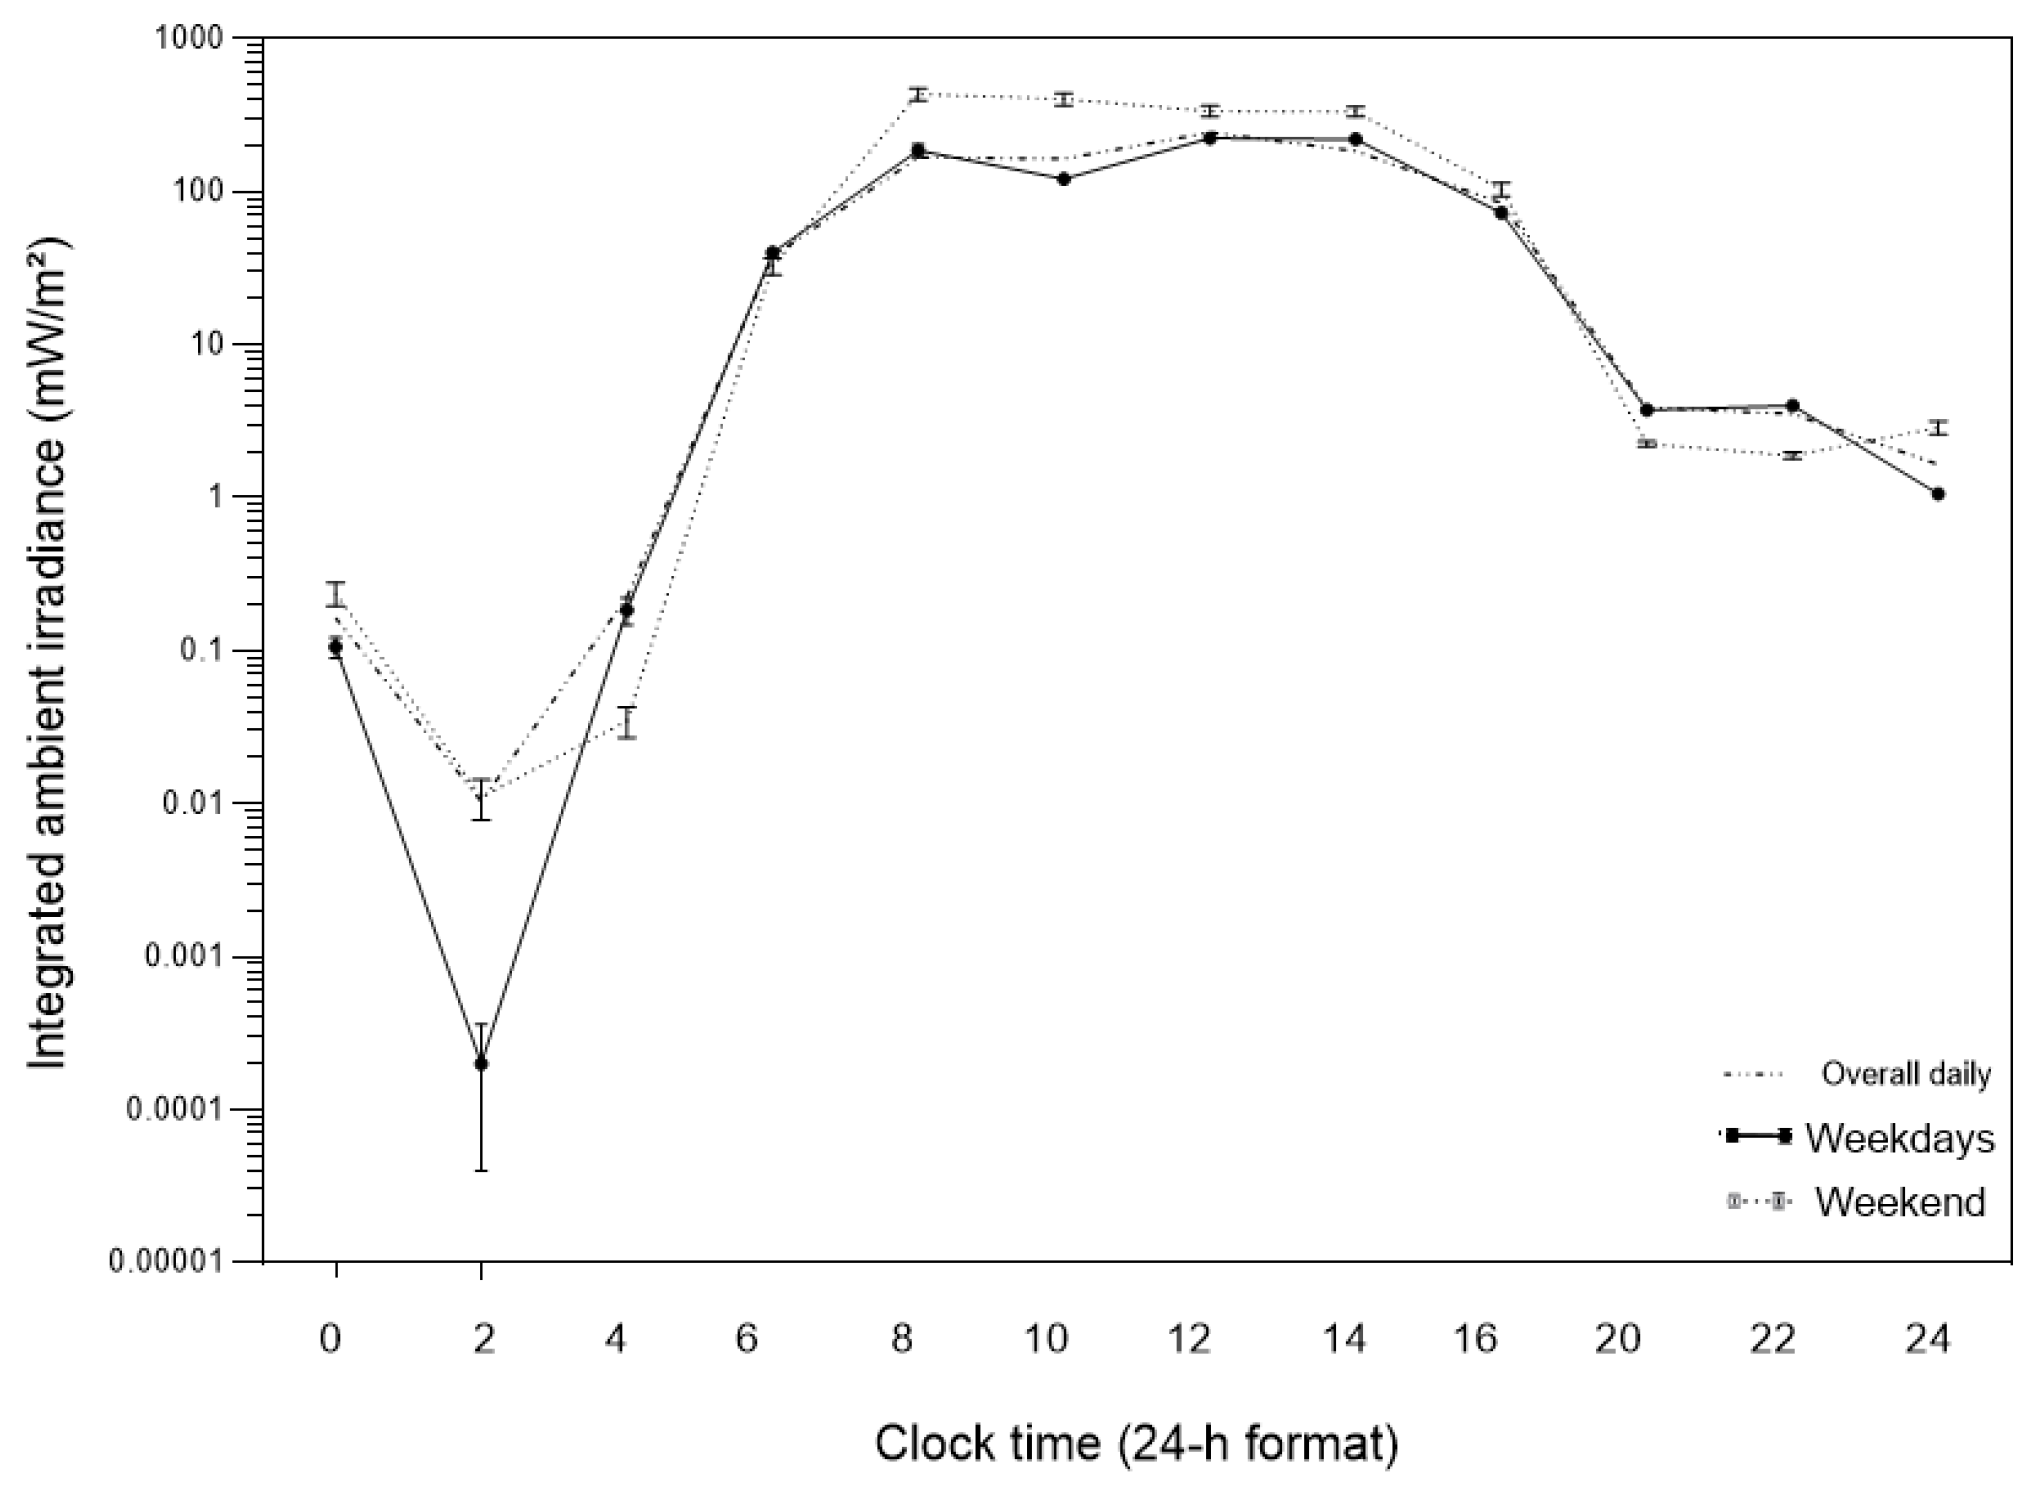

Table 1.
Comparison between weekdays (DS) and weekends (FDS in sleep parameters.
| Variable | Group | Mean (min) | Standard Error | 95% CI |
t (df = 30) |
p | Cohen’s d |
|---|---|---|---|---|---|---|---|
| Total time in bed | DS | 504.75 | 11.48 | 481.70–526.68 | 2.096 | 0.045* | 0.74 |
| FDS | 467.57 | 13.52 | 442.40–492.79 | ||||
| Total sleep time | DS | 452.00 | 13.75 | 425.74–478.95 | 2.551 | 0.016* | 0.90 |
| FDS | 398.86 | 15.66 | 370.78–428.78 | ||||
| Sleep latency | DS | 3.80 | 0.48 | 2.85–4.79 | 0.956 | 0.347 | 0.34 |
| FDS | 3.18 | 0.43 | 2.40–4.04 | ||||
| WASO (min) | DS | 52.27 | 5.05 | 43.14–62.14 | −0.331 | 0.743 | −0.12 |
| FDS | 55.63 | 8.82 | 39.83–73.54 |
Note: DS = weekdays; FDS = weekends; p < 0.05.
Table 2.
Parameter estimates of light exposure, expressed as integrated irradiance (mW/m²), by time interval and spectral band (DS − FDS).
Table 2.
Parameter estimates of light exposure, expressed as integrated irradiance (mW/m²), by time interval and spectral band (DS − FDS).
| Intervale (h) | BL B [IC 95%] |
p | η²p | GL B [IC 95%] |
p | η²p | RL B [IC 95%] |
p | η²p |
|---|---|---|---|---|---|---|---|---|---|
| 00:00–02:00 | −0,066 [−0,103; −0,029] | <0,001 | 0,005 | −0,079 [−0,121; −0,038] | <0,001 | 0,003 | −0,031 [−0,052; −0,010] | <0,01 | 0,002 |
| 02:00–04:00 | −0,003 [−0,004; −0,002] | <0,001 | 0,005 | −0,007 [−0,009; −0,004] | <0,001 | 0,006 | −0,003 [−0,004; −0,002] | <0,001 | 0,005 |
| 04:00–06:00 | +0,035 [−0,030; 0,101] | ns | 0,001 | +0,089 [0,020; 0,158] | 0,012 | 0,001 | +0,041 [0,010; 0,072] | <0,01 | 0,001 |
| 06:00–08:00 | +2,334 [−0,980; 5,649] | ns | 0,001 | +3,608 [−1,039; 8,256] | 0,128 | 0,001 | +1,927 [−1,058; 4,912] | ns | 0,000 |
| 08:00–10:00 | −85,890 [−120,2; −51,6] | <0,001 | 0,006 | −122,542 [−157,124; −87,961] | <0,001 | 0,009 | −80,317 [−107,0; −53,6] | <0,001 | 0,006 |
| 10:00–12:00 | −81,140 [−110,4; −51,9] | <0,001 | 0,012 | −137,618 [−162,801; −112,435] | <0,001 | 0,021 | −75,127 [−92,5; −57,7] | <0,001 | 0,013 |
| 12:00–14:00 | −35,155 [−58,9; −11,4] | <0,001 | 0,002 | −61,388 [−85,374; −37,402] | <0,001 | 0,005 | −36,445 [−53,3; −19,6] | <0,001 | 0,003 |
| 14:00–16:00 | −51,757 [−77,3; −26,2] | <0,001 | 0,004 | −58,656 [−87,425; −29,887] | <0,001 | 0,003 | −32,315 [−54,0; −10,6] | <0,01 | 0,002 |
| 16:00–18:00 | −11,799 [−19,8; −3,8] | <0,01 | 0,002 | −16,252 [−25,973; −6,530] | 0,001 | 0,002 | −9,628 [−16,1; −3,1] | <0,01 | 0,002 |
| 18:00–20:00 | +0,438 [0,212; 0,664] | <0,001 | 0,007 | +0,778 [0,537; 1,019] | <0,001 | 0,007 | +0,417 [0,293; 0,541] | <0,001 | 0,008 |
| 20:00–22:00 | +0,565 [0,331; 0,799] | <0,001 | 0,14 | +1,181 [0,955; 1,407] | <0,001 | 0,019 | +0,688 [0,564; 0,811] | <0,001 | 0,022 |
| 22:00–24:00 | −0,597 [−0,811; −0,383] | <0,001 | 0,16 | −1,075 [−1,303; −0,847] | <0,001 | 0,015 | −0,487 [−0,597; −0,378] | <0,001 | 0,014 |
Note: B represents the estimated difference between weekdays (DS) and weekends (FDS) (DS − FDS). Negative values indicate greater exposure on weekends, whereas positive values indicate greater exposure on weekdays. CI = 95% confidence interval. ns = not significant (p ≥ 0.05). Partial eta squared (η²p) corresponds to the effect size and will be reported for all spectral bands after consolidation of the estimates.
Disclaimer/Publisher’s Note: The statements, opinions and data contained in all publications are solely those of the individual author(s) and contributor(s) and not of MDPI and/or the editor(s). MDPI and/or the editor(s) disclaim responsibility for any injury to people or property resulting from any ideas, methods, instructions or products referred to in the content. |
© 2026 by the authors. Licensee MDPI, Basel, Switzerland. This article is an open access article distributed under the terms and conditions of the Creative Commons Attribution (CC BY) license (http://creativecommons.org/licenses/by/4.0/).
Copyright: This open access article is published under a Creative Commons CC BY 4.0 license, which permit the free download, distribution, and reuse, provided that the author and preprint are cited in any reuse.


