
Submitted:
16 October 2025
Posted:
17 October 2025
You are already at the latest version
Abstract
This study investigated the association of circadian light exposure (LE), blue light exposure (BLE), sleep, and physical activity (PA) with hematological markers in 85 young adults (18–25 years) living at a high latitude. Participants underwent 7-day monitoring with actigraphy and RGB sensors, alongside morning blood sampling for hemoglobin (HGB), hematocrit (HCT), mean corpuscular hemoglobin (MCH), and variability in red blood cell distribution width (RDW-CV). Univariate analyses revealed that the normalized BLE amplitude (NA BLE) positively correlated with HGB (r = 0.369, p = 0.001) and MCH (r = 0.378, p < 0.001). A later BLE acrophase negatively correlated with lower HGB (r = –0.322, p = 0.003), and MCH (r = –0.272, p = 0.013), but positively with larger RDW-CV (r = 0.291, p = 0.008). A later PA acrophase associated with lower MCH and larger RDW-CV, while a later bedtime correlated with lower HGB and MCH. Multivariate regressions (adjusted for sex/age) confirmed that a larger NA BLE predicted higher HGB (β = 0.206, p = 0.037) and MCH (β = 0.377, p < 0.001), and that an earlier BLE acrophase predicted higher MCH (β = –0.304, p = 0.008) and smaller RDW-CV (β = 0.316, p = 0.006). These findings highlight that advantageous circadian patterns of BLE and activity are linked to a favorable hematological status.
Keywords:
hemoglobin
; mean corpuscular hemoglobin (MCH)
; anemia
; circadian
; light hygiene
; actigraphy
; blue light exposure
1. Introduction
Anemia remains a significant global health challenge, with wide-ranging impacts on morbidity and quality of life [1]. Hematological variables such as hemoglobin (HGB), hematocrit (HCT), and mean corpuscular hemoglobin (MCH) serve as critical biomarkers for assessing erythropoietic function and oxygen transport capacity. While aging, lifestyle factors and environmental cues—including sleep patterns and light exposure—are well recognized to influence multiple physiological domains such as mood regulation, cognitive performance, metabolism, eating behavior, and immune function, there is a notable paucity of research investigating the relationship between light exposure, circadian light hygiene, and hematological variables or anemia-related markers. Anemia prevalence frequently diverges from iron deficiency trends [2], implicating inflammation and other micronutrient deficiencies as key contributors to hemoglobin variability, potentially modulated by circadian disruptions from light exposure. Circadian rhythms, primarily entrained by light, orchestrate numerous biological processes, yet their potential role in modulating erythropoiesis and red blood cell indices remains underexplored in human populations. Circadian regulation of hematopoiesis has been demonstrated in animal models, where hematopoietic stem cells exhibit oscillatory release influenced by sympathetic nervous system innervation [3,4]. Intriguingly, human red blood cells (RBCs), despite lacking nuclei and transcriptional machinery, exhibit cell-autonomous circadian oscillations sustained by non-transcriptional mechanisms such as peroxiredoxin redox cycles [5]. Recent advances have further elucidated RBC circadian physiology; for example, Beale et al. [6] employed dielectrophoresis to characterize daily rhythms in RBC membrane electrophysiology, while Beale et al. [7] developed a novel biochemical assay revealing daily hemoglobin oxidation rhythms in RBCs that correlate with core body temperature cycles and nitric oxide signaling, suggesting a functional role for RBC circadian rhythms in thermoregulation. These findings underscore the physiological relevance of circadian timing mechanisms within erythrocytes and support the hypothesis that circadian light exposure could influence hematopoietic variables. To address this gap, the present study examined associations between objectively measured circadian light exposure—quantified by seven-day actigraphy with blue light exposure (BLE) metrics—and hematological variables in a cohort of 85 healthy young adults. Participants were recruited during a single autumn month in Tyumen, Russia, and provided a morning blood sample for complete blood count analyses.
2. Materials and Methods
2.1. Study Participants
Eighty-five young adult medical students from Tyumen, Russia (mean age ± SD: 19.30 ± 1.51 years; 23 men; 62 women), provided seven-day actigraphy data during the same autumn month. Participants were screened upon admission and those with serious chronic or acute diseases were not included. Additionally, individuals engaged in shift-work, night work, or who had crossed more than two time zones within the month prior to the study were excluded.
2.2. Actigraphy
Actigraphy data were collected using the ActTrust 2 device worn on the non-dominant wrist for seven consecutive days between October 24 and November 20, 2023. Measurements included motor activity (Proportional Integrative Mode, PIM), wrist skin temperature, light intensity, and blue light intensity, recorded at one-minute intervals. Parameters calculated for physical activity (PA), light exposure (LE), and blue light exposure (BLE) included the MESOR (Midline Estimating Statistic Of Rhythm), 24-hour amplitude and acrophase (timing of overall high values recurring each day). Non-parametric indices for PA and BLE included the most active/exposed 10-hour period (M10) and the least active/exposed 5-hour period (L5) and the time of their onset, as well as the inter-daily stability (consistency across days), intra-daily variability (within-day fragmentation), and relative amplitude (RA), which was calculated as (M10 – L5) / (M10 + L5) for both PA and BLE. Sleep parameters, such as bedtime, wake time, total sleep time, sleep efficiency, and wake after sleep onset (WASO) were also derived using the ActStudio software based on established algorithms. BLE is irradiance (µW·cm⁻²) in the short wavelength range as measured by the Blue channel of the Condor Actrust2. The Normalized Amplitude of Blue Light Exposure (NA BLE) is defined as the ratio of the 24-hour amplitude of the cosine curve fitted to BLE data to its MESOR, calculated as previously described [8,9,10]. This metric standardizes the dynamic range of blue light exposure relative to its average value, accounting for individual differences and thereby minimizing inter-individual variability.
2.3. Complete Blood Count
Fasting blood samples were collected just before actigraphy recordings. A complete blood count (CBC) was performed, which included the determination of the absolute and relative numbers of red blood cell count (RBC) and associated variables: HGB, HCT, MCH, mean corpuscular volume (MCV), mean corpuscular hemoglobin concentration (MCHC), and red cell distribution width coefficient of variability (RDW-CV). Blood collection was performed in the morning between 8:00 and 9:00 in the University laboratory. Prior to sampling, the venipuncture site (antecubital fossa) was disinfected with two alcohol swabs. Blood was drawn by venipuncture into vacuum tubes and allowed to clot at room temperature for one minute. Samples were centrifuged at 3,000 rpm for 10 minutes, 15 minutes after collection. The serum was then removed from the clot using a pipette with a disposable tip, transferred to clean tubes, and stored at 4 °C until analysis. Leukocyte populations were differentiated using a Sysmex XN–1000 hematology analyzer (Japan) with adapted reagents, employing fluorescent flow cytometry technology.
2.4. Morningness–Eveningness Questionnaire (MEQ)
The Morningness–Eveningness Questionnaire (MEQ) [11], a 19-item self-report tool, was administered to participants to assess chronotype. Scores ranged from 16 to 86, with higher values indicating a morning type and lower values indicating an evening type.
2.5. Data Analysis
Statistical analyses were performed using STATISTICA 6, Office Libre Calc and SPSS 23.0. The associations between actigraphy measures and CBC data were evaluated using linear regression analyses. Multiple regression models, incorporating sex and age were also implemented. The significance threshold for all statistical tests was set at α = 0.05. To account for multiple comparisons, the Benjamini–Hochberg False Discovery Rate (FDR) correction was applied, with a critical FDR value of 0.1. Potential multi-collinearity among variables in the models was evaluated using Variance Inflation Factors (VIF).
3. Results
3.1. Study Participants
General demographic and red blood cells hematological characteristics of young adults are described in Table 1.
3.2. Univariate Associations Between Circadian Parameters and Hematological Variables
Table 2 presents linear regression coefficients for associations of circadian parameters (PA, light exposure: LE and BLE), sleep metrics, and chronotype score with hematological variables. Significant associations, adjusted for multiple comparisons using the Benjamini–Hochberg False Discovery Rate (FDR) at a threshold of 0.1, are indicated by an asterisk. Among PA measures, an earlier acrophase was significantly associated with higher MCH (r = –0.274, p = 0.012) and smaller RDW-CV (r = 0.226, p = 0.040). An earlier M10 Onset also demonstrated a significant association with a smaller RDW-CV (r = 0.243, p = 0.027). No other significant associations were observed between PA and hematological variables after correction for multiple testing. BLE parameters showed several significant correlations with hematological variables. Specifically, an earlier BLE acrophase was significantly associated with higher HGB (r = –0.322, p = 0.003), HCT (r = –0.255, p = 0.020), MCH (r = –0.272, p = 0.013), and a smaller RDW-CV (r = 0.291, p = 0.008). A larger BLE amplitude and higher MESOR were also significantly associated with higher HGB and HCT. A larger NA of BLE exhibited most solid associations with higher HGB (r = 0.369, p = 0.001) and MCH (r = 0.378, p < 0.001). Sleep timing variables also revealed significant correlations: an earlier bedtime correlated with higher HGB (r = –0.225, p = 0.041) and MCH (r = –0.314, p = 0.004). Other sleep parameters, including wake time, total sleep duration, and sleep efficiency did not show statistically significant associations with hematological variables. The MEQ score indicative of chronotype also was not significantly associated with the hematological variables examined.
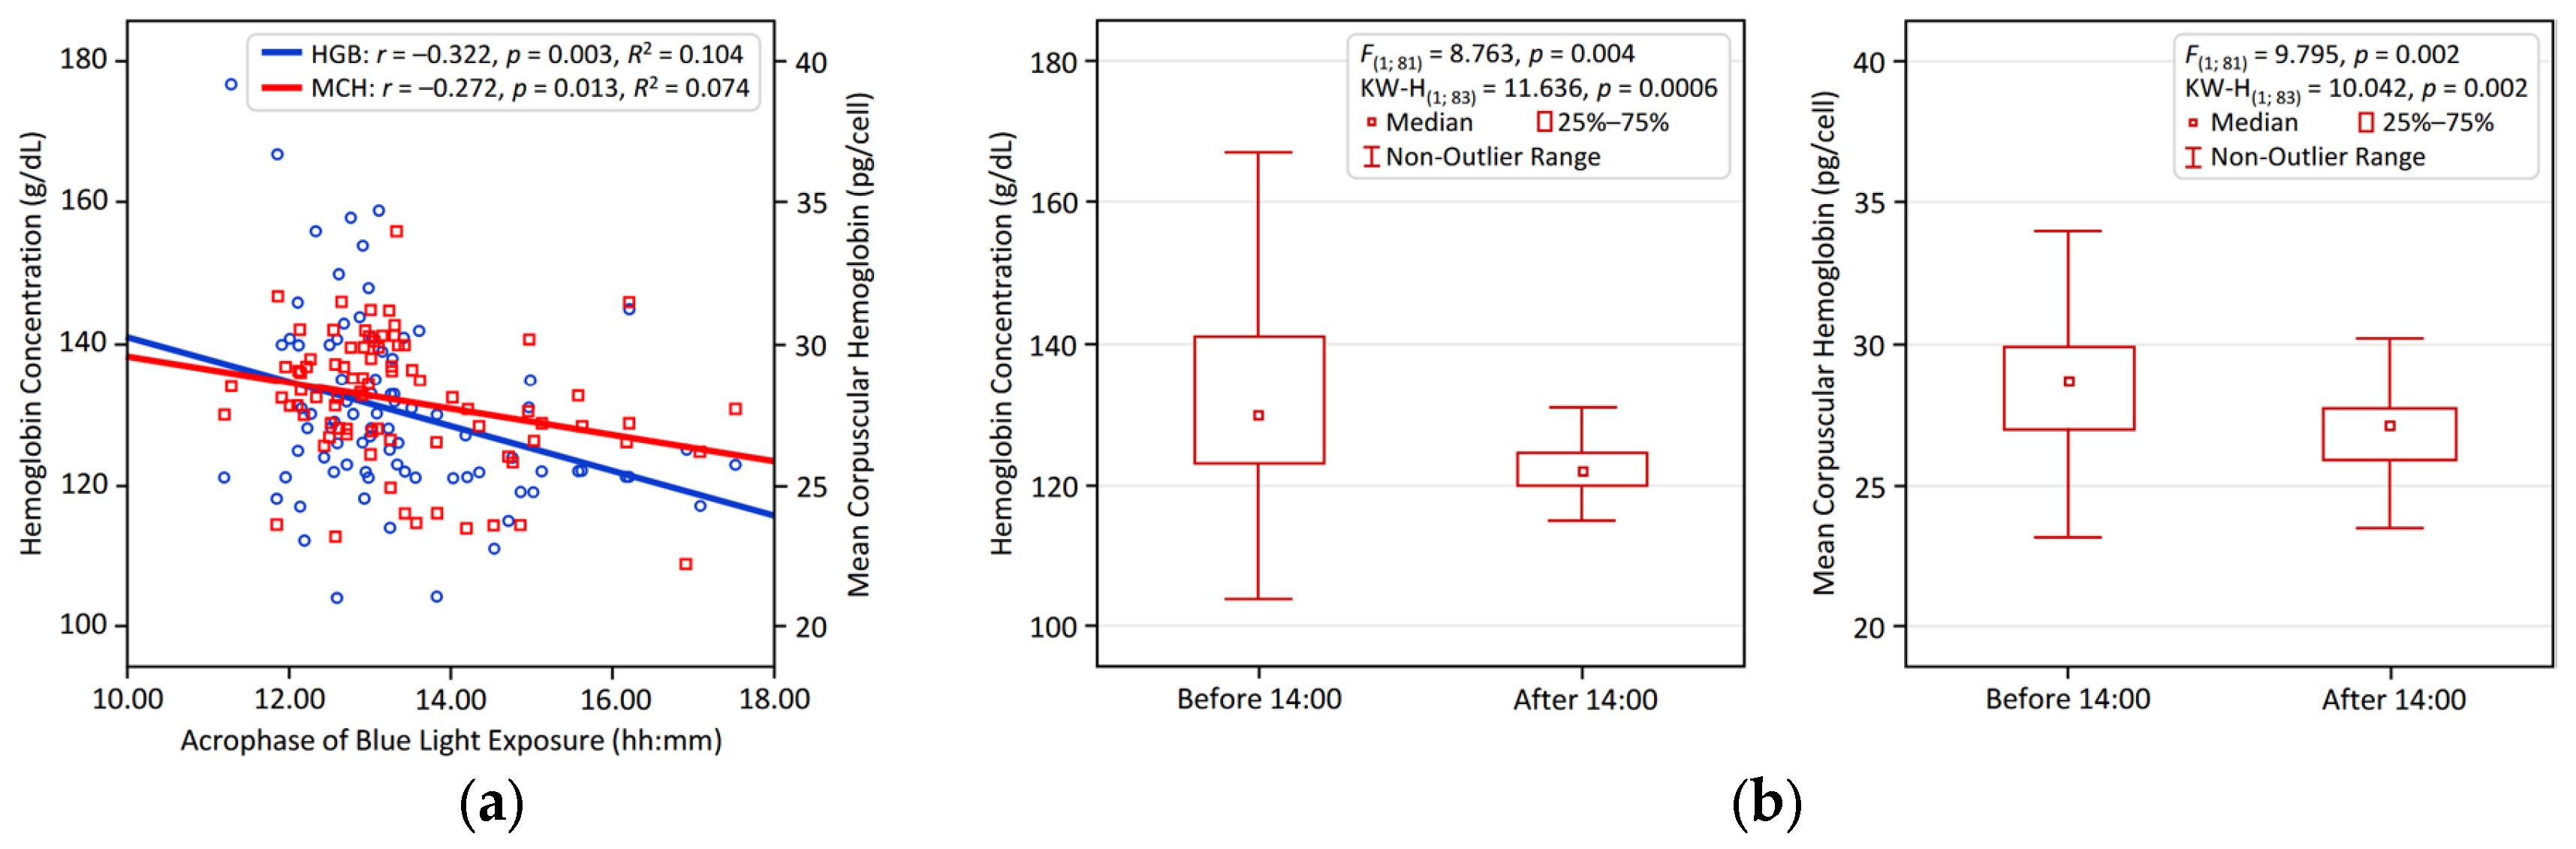
Figure 1 and Figure 2 visualize the significant associations identified between circadian LE patterns and hematological variables in young adults. Figure 1 illustrates the positive relationship of NA BLE with HGB and MCH, presented through linear regression analyses (Figure 1a) and comparative bar plots depicting participants with NA BLE > 1 vs. < 1 (Figure 1b). Figure 2 shows that an earlier BLE acrophase is significantly linked to higher HGB and MCH, supported by regression analysis (Figure 2a) and comparative bar plots illustrating participants with a BLE acrophase occurring before vs. after 14:00 (Figure 2b).

Table 2.
Correlations between circadian parameters and hematological variables 1.
| RBC | HGB | HCT | MCV | MCH | MCHC | RDW-CV | |
| Physical activity | |||||||
| MESOR | 0.098 | –0.024 | 0.024 | –0.081 | –0.137 | –0.023 | 0.088 |
| 24-h Amplitude | 0.190 | 0.176 | 0.146 | –0.079 | 0.010 | –0.007 | 0.051 |
| 24-h Acrophase | 0.088 | –0.153 | –0.086 | –0.069 | –0.274* | –0.024 | 0.226 |
| IV | 0.042 | 0.012 | 0.039 | 0.096 | –0.063 | 0.043 | 0.012 |
| IS | 0.111 | 0.116 | 0.120 | –0.021 | 0.013 | –0.135 | –0.104 |
| M10 | 0.132 | 0.052 | 0.055 | –0.142 | –0.094 | 0.023 | 0.076 |
| M10 Onset | 0.151 | –0.029 | 0.022 | –0.112 | –0.190 | –0.052 | 0.243 |
| L5 | –0.044 | –0.197 | –0.150 | –0.014 | –0.180 | –0.087 | 0.048 |
| L5 Onset | 0.069 | 0.005 | –0.011 | –0.093 | –0.058 | 0.039 | –0.051 |
| Relative Amplitude | 0.064 | 0.183 | 0.138 | –0.033 | 0.129 | 0.098 | –0.024 |
| Light Exposure (LE) / Blue Light Exposure (BLE) | |||||||
| LE MESOR | 0.161 | 0.189 | 0.199 | 0.118 | 0.030 | 0.084 | –0.049 |
| LE Amplitude | 0.128 | 0.248 | 0.234 | 0.157 | 0.137 | 0.084 | –0.084 |
| LE Acrophase | –0.071 | –0.312* | –0.223 | –0.128 | –0.280* | –0.038 | 0.212 |
| BLE MESOR | 0.163 | 0.223 | 0.216 | 0.121 | 0.070 | 0.094 | –0.078 |
| BLE Amplitude | 0.155 | 0.279* | 0.253 | 0.143 | 0.148 | 0.095 | –0.114 |
| BLE Acrophase | –0.093 | –0.322* | –0.255 | –0.126 | –0.272* | –0.029 | 0.291* |
| BLE M10 | 0.155 | 0.244 | 0.223 | 0.122 | 0.103 | 0.105 | –0.089 |
| BLE M10 Onset | 0.029 | –0.162 | –0.111 | –0.229 | –0.202 | –0.001 | 0.077 |
| BLE L5 | 0.202 | 0.069 | 0.089 | –0.041 | –0.153 | –0.010 | 0.035 |
| BLE L5 Onset | 0.006 | –0.202 | –0.126 | –0.020 | –0.229 | –0.121 | 0.112 |
| BLE NA | 0.047 | 0.369* | 0.259 | 0.175 | 0.378* | 0.037 | –0.172 |
| Sleep | |||||||
| Bedtime | 0.045 | –0.225 | –0.154 | –0.133 | –0.314* | –0.063 | 0.184 |
| Wake time | 0.107 | –0.078 | 0.011 | –0.029 | –0.212 | –0.030 | 0.214 |
| Time in bed | 0.058 | 0.091 | 0.105 | 0.043 | 0.037 | 0.014 | 0.056 |
| Total sleep | 0.072 | 0.108 | 0.108 | 0.037 | 0.044 | 0.009 | 0.030 |
| Sleep efficacy | 0.055 | 0.056 | 0.004 | –0.004 | 0.017 | –0.046 | –0.095 |
| WASO | –0.056 | –0.056 | 0.008 | 0.030 | –0.024 | 0.028 | 0.138 |
| Chronotype Morningness-Eveningness Questionnaire (MEQ) Score | |||||||
| MEQ Score | –0.020 | 0.051 | 0.010 | 0.074 | 0.100 | –0.032 | –0.047 |
1 Linear regression coefficients are listed. RBC – red blood cell count, HGB – hemoglobin (amount of oxygen-carrying protein in blood), HCT – hematocrit (percentage of blood volume made up by RBCs), MCV – mean corpuscular volume (average size of red blood cells), MCH – mean corpuscular hemoglobin (average amount of hemoglobin per red blood cell), MCHC – mean corpuscular hemoglobin concentration (average concentration of hemoglobin in RBCs), RDW-CV – red cell distribution width coefficient of variation (variation in red blood cell size). MESOR – midline estimating statistic of rhythm, a rhythm-adjusted mean, M10 – 10 hours of highest values, L5 – 5 hours of lowest values, IV – intra–daily variability, IS – inter-daily stability, NA BLE – normalized amplitude of blue light exposure, WASO – wake after sleep onset; significant associations are in bold. Asterisk (*) indicates statistical significance after Benjamini–Hochberg’s correction for multiple comparisons at false detection rate, FDR = 0.1.
Figure 1.
Larger normalized blue light exposure amplitude (NA BLE) is linked to higher hemoglobin and MCH in young adults. (a) Linear regression results for NA BLE and Hemoglobin and MCH; (b) group differences in hemoglobin and MCH comparing large (> 1) vs. small (< 1) NA BLE.
Figure 1.
Larger normalized blue light exposure amplitude (NA BLE) is linked to higher hemoglobin and MCH in young adults. (a) Linear regression results for NA BLE and Hemoglobin and MCH; (b) group differences in hemoglobin and MCH comparing large (> 1) vs. small (< 1) NA BLE.
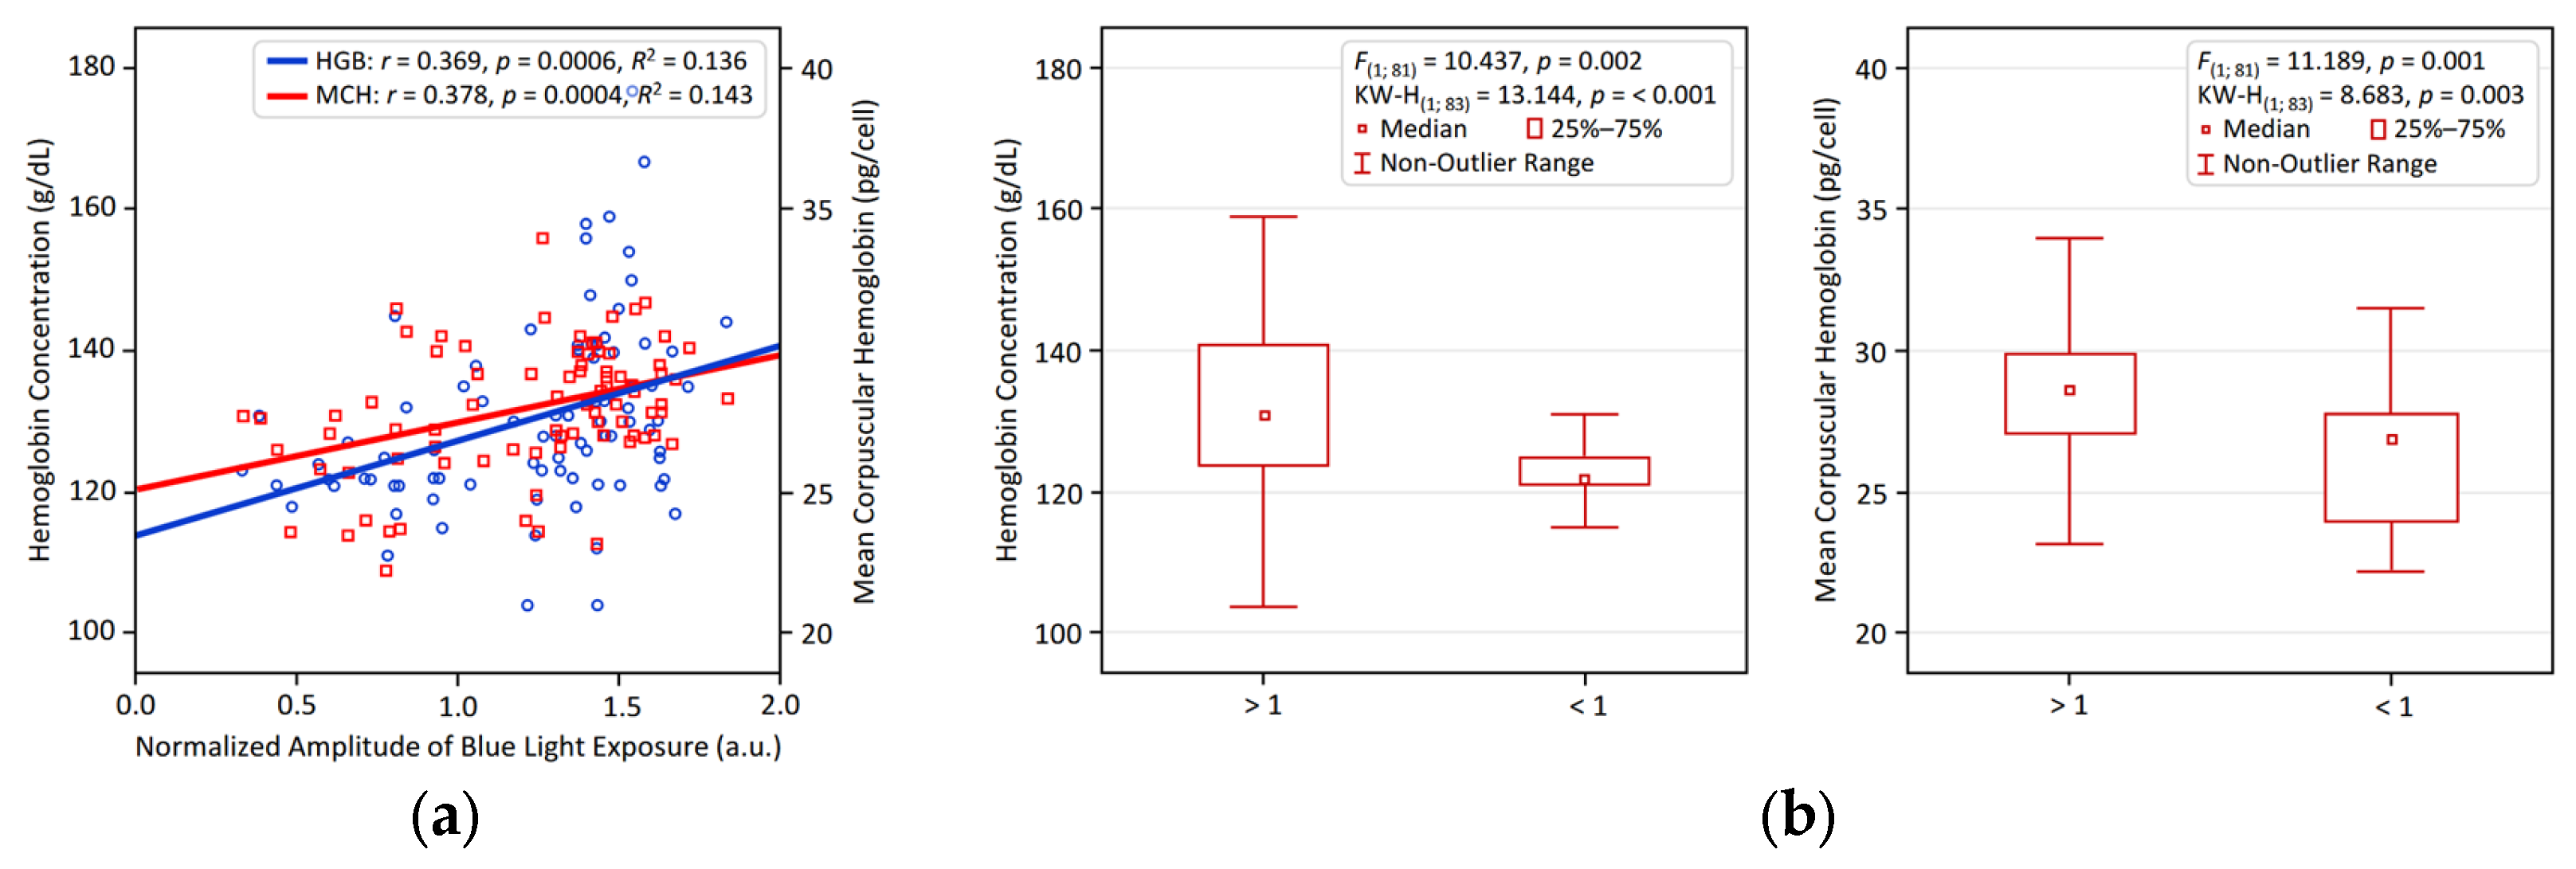
Figure 2.
Earlier acrophase of blue light exposure (BLE) is linked to higher hemoglobin and MCH in young adults: (a) linear regression results for BLE acrophase vs. HGB and MC; (b) group differences in HGB and MCH comparing BLE acrophase before vs. after 14:00.
Figure 2.
Earlier acrophase of blue light exposure (BLE) is linked to higher hemoglobin and MCH in young adults: (a) linear regression results for BLE acrophase vs. HGB and MC; (b) group differences in HGB and MCH comparing BLE acrophase before vs. after 14:00.
3.3. Multivariate Associations Between Circadian Parameters and Hematological Variables
Significant circadian predictors, post-correction for multiple testing, were included in a multiple regression model with sex and age as covariates. Whereas no circadian predictors were found for RBC, HCT, MCV, or MCHC, multiple regression analyses, adjusted for sex and age, revealed significant associations of hematological variables with specific circadian light exposure and sleep parameters (Table 3, Figure 3). While the 24-h acrophases of LE and BLE were not significantly associated with HGB after covariate adjustment, this finding reflects the confounding influence of sex, where males exhibited both higher HGB: 141.5 ± 14.5 vs. 125.7 ± 8.0, p < 0.001, and superior circadian light hygiene (larger NA BLE: 1.43 ± 0.27 vs. 1.16 ± 0.36, p = 0.003, and earlier BLE acrophase: 12:48 ± 0:51 vs. 13:39 ± 1:26, p = 0.008). Notably, NA BLE still demonstrated a positive association with HGB (β = 0.206, 95% CI: 0.012, 0.400, p = 0.037, partial η² = 0.054), suggesting a subtle independent contribution of 24-h changes in light intensity exposure (Table 3, Figure 3).
Remarkably, several circadian parameters emerged as significant predictors of MCH independently of sex and age, neither of which impacted MCH in the adjusted models (Figure 3). NA BLE was positively associated with MCH (β = 0.377, 95% CI: 0.159, 0.595, p < 0.001, partial η² = 0.130), as was the 24-h acrophase of BLE (β = –0.304, 95% CI: –0.526, –0.082, p = 0.008, partial η ² = 0.086). Furthermore, bedtime (β = –0.257, 95% CI: –0.467, –0.047, p = 0.017, partial η ² = 0.066) and the 24-h acrophase of PA (β = –0.224, 95% CI: –0.431, –0.016, p = 0.035, partial η ² = 0.052) also showed significant positive associations with MCH. An earlier acrophase of BLE was significantly associated with a smaller RDW-CV (β = 0.316, 95% CI [0.093, 0.539], p = 0.006, partial η ² = 0.092), indicating greater uniformity in red blood cell size.
Finally, we examined the stability of our main findings by accounting for various co-factors (Supplemental Table S1). Adjusting for physical activity, light exposure mean characteristics, and chronotype did not meaningfully change the associations between the normalized amplitude or timing of BLE and the hematological variables (HGB, MCH, RDW-CV). It suggests that results are consistent irrespective of mean values of PA, LE, or chronotype score, reflecting the robust predictive power of circadian light hygiene.
Figure 3.
Associations between actigraphy-derived circadian and sleep metrics with hemoglobin. Each predictor was entered into a multivariable regression model individually, with adjustments made sequentially for sex and age. The figure displays standardized beta coefficients (β) and their 95% confidence intervals (CIs) for each association. The order of predictors presented reflects their relative contribution as indicated by partial eta-squared (η²) values. The vertical line denotes the significance threshold (p < 0.05). Predictors with statistically significant associations (p < 0.05) are indicated by red bars. Abbreviations: RDW: Red Cell Distribution Width – CV; MCH: Mean Corpuscular Hemoglobin; HGB: Hemoglobin.
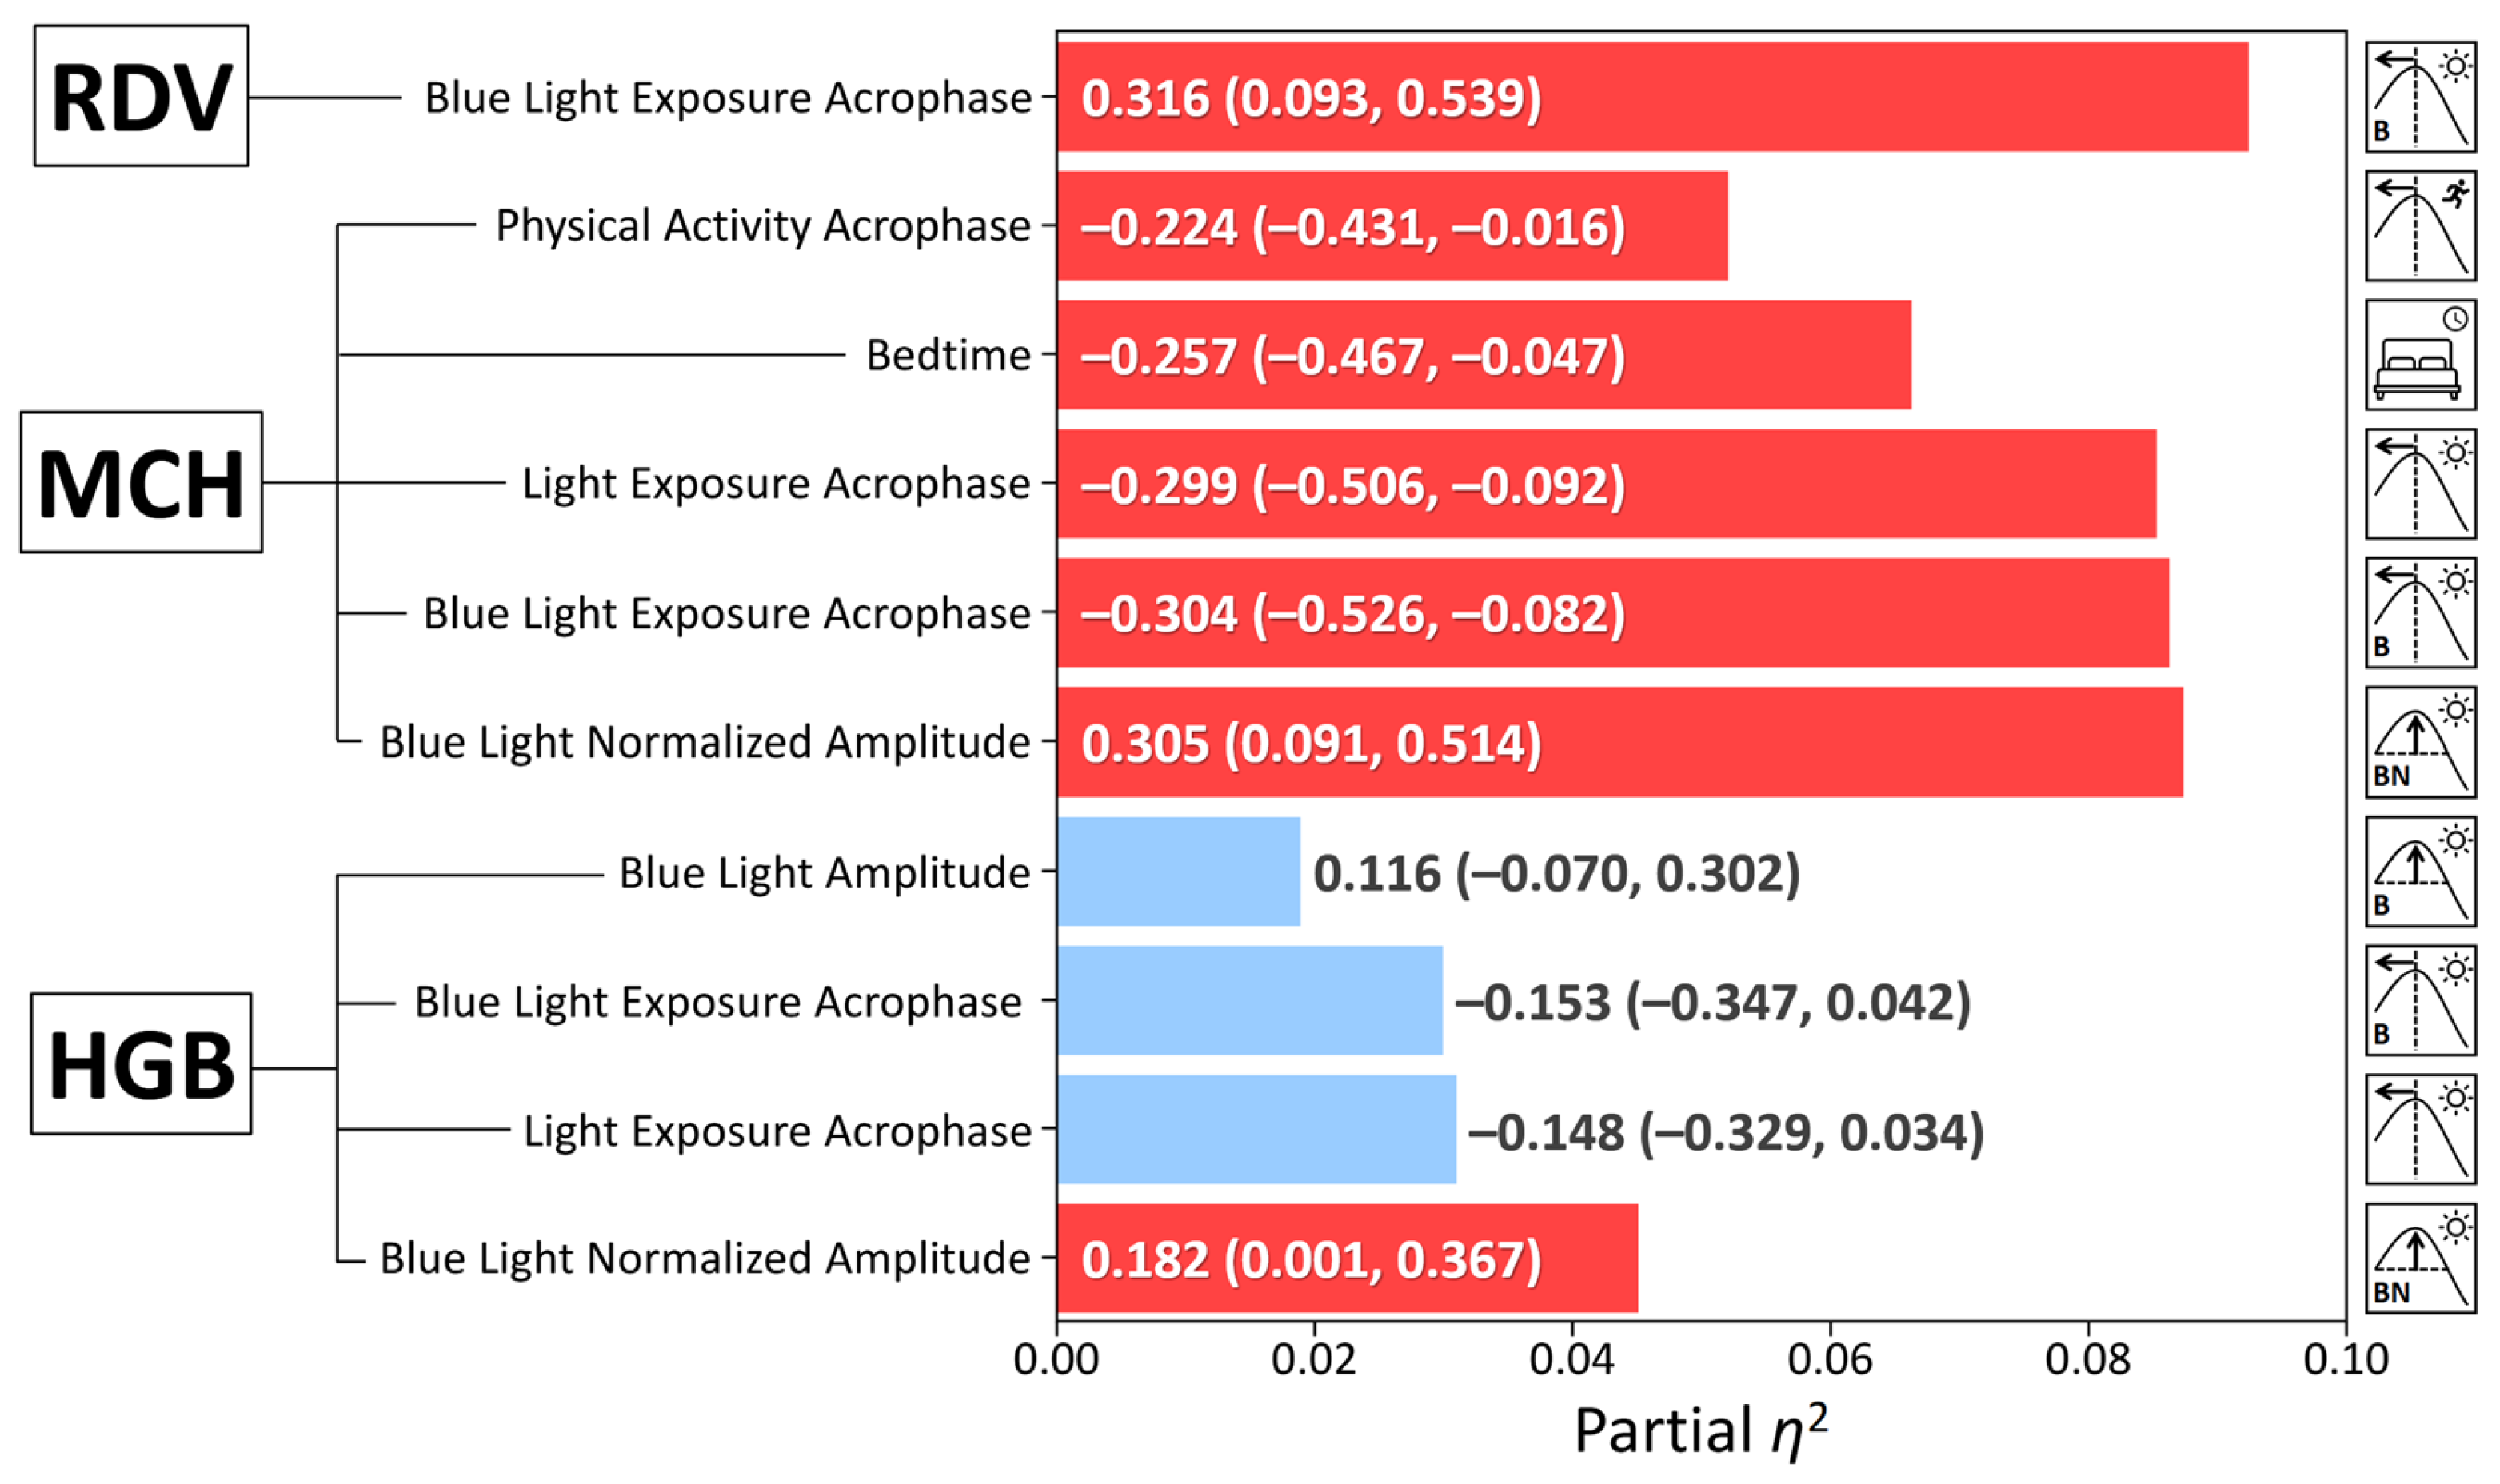
Table 3.
Comparative effects of the strongest actigraphy-based predictors, sex, and age on hematological variables.
Table 3.
Comparative effects of the strongest actigraphy-based predictors, sex, and age on hematological variables.
| Dependent Variable | Predictor | β (95% CI) | p-value | Partial η² |
|---|---|---|---|---|
| Hemoglobin | Sex | –0.491(–0.683, –0.299) | <0.001 | 0.247 |
| BLE NA | 0.206(0.012, 0.400) | 0.037 | 0.054 | |
| Age | 0.028 (–0.154, 0.209) | 0.763 | 0.001 | |
| Mean Corpuscular Hemoglobin | BLE NA | 0.377(0.159, 0.595) | < 0.001 | 0.130 |
| Age | –0.174 (–0.378, 0.032) | 0.096 | 0.035 | |
| Sex | 0.060 (–0.156, 0.277) | 0.580 | 0.004 | |
| Red Cell Distribution Width – CV | BLE Acrophase | 0.316(0.093, 0.539) | 0.006 | 0.092 |
| Age | 0.205 (–0.005, 0.416) | 0.055 | 0.046 | |
| Sex | 0.023 (–0.245, 0.199) | 0.839 | < 0.001 |
1 β: Standardized beta coefficient from Parameter Estimates. 95% CI: Confidence intervals are rounded to 3 decimal places for brevity; p-value: from Univariate Tests (F-test p-values). Partial η²: Effect size from Univariate Tests, indicating the proportion of variance accounted for by each factor.
4. Discussion
This study revealed significant associations between circadian light hygiene and key hematological variables in healthy young adults. A larger BLE NA was independently linked to higher HGB and MCH, while a later BLE acrophase correlated with lower HGB, HCT, and MCH, alongside larger RDW-CV. A later PA acrophase and a later habitual bedtime were also associated with a lower MCH. These findings suggest that circadian light patterns may modulate hematopoiesis, particularly through effects on erythrocytic indices, independently of sex for MCH and RDW-CV.
Our previous research at high latitudes found that seasonal changes in circadian light hygiene are associated with changes in morning cortisol [12], morning lipids [12,13,14], and clock gene (NR1D1) expression [14] that are coupled to changes in melatonin phase and amplitude [12]. Notably, the 24-hour mean melatonin concentration remained relatively stable despite substantial changes in ambient light patterns [12]. However, since these variables exhibit circadian rhythmicity, single morning measurements preclude differentiation between associations with overall 24-hour means vs. changes in phase. In this context, it is pertinent that in contrast to HGB and HCT, which demonstrate pronounced 24-hour rhythms [15], MCH and RDW display minimal 24-hour variation. For instance, Sennels et al. [15] reported negligible amplitudes for MCH (0.27% relative amplitude) and RDW (0.16% relative amplitude) in healthy males, with no significant circadian rhythm (p > 0.5). Similarly, Hilderink et al. [16] found small within-subject biological variation for MCH (CVI = 0.8%) and RDW (CVI = 0.37%), indicating stability across time points. This result suggests that the observed associations between circadian light exposure and MCH or RDW-CV cannot be attributed to the modulation of their endogenous rhythms, as these variables do not fluctuate significantly over the 24-hour day. However, it cannot be excluded that circadian light hygiene may influence the acrophase of HGB and/or HCT, which show pronounced 24-hour patterns (e.g., HGB amplitude = 3.28% in [15]). Furthermore, these findings imply that light may exert non-circadian effects on MCH, potentially through pathways independent of any rhythmic modulation, warranting further mechanistic studies. The observed associations between circadian light hygiene and MCH, despite MCH’s minimal intrinsic circadian rhythmicity, suggest a role for indirect photic modulation rather than direct phase-shifting of MCH itself. Light’s potent chronobiotic influence likely optimizes the upstream regulatory mechanisms of erythropoiesis. Specifically, robust light cues, such as a large NA BLE and an earlier BLE acrophase may entrain circadian rhythms of key metabolic regulators like NR1D1 [14,17]. Critically, NR1D1 functions as a heme receptor, directly sensing intracellular heme concentrations to coordinate circadian rhythms with metabolic processes, including those involved in heme synthesis and turnover [18,19]. NR1D1 also can get feedback from dietary iron [20]. Given that MCH reflects hemoglobin content, and heme is a fundamental component of hemoglobin, NR1D1’s direct interaction with heme positions it as a key modulator of red blood cell maturation. Furthermore, the secondary associations of MCH with bedtime and the acrophase of physical activity, which are themselves strongly modulated by circadian light exposure, support the hypothesis that light patterns indirectly influence MCH by synchronizing broader circadian physiology underpinning hematopoiesis, with NR1D1 acting as a central sensor of metabolic state within this network.
For mechanistic context, it has been previously established that mouse hematopoietic stem cells (HSCs) and their progenitors exhibit robust circadian rhythms, with peak activity occurring approximately 5 hours after light onset [3]. These rhythms are regulated by sympathetic nervous system–mediated noradrenaline secretion, which modulates CXCL12 expression in the bone marrow niche. Importantly, unlike humans, mice are nocturnal and their resting period occurs during the daylight phase when HSC release peaks. This neurally-driven circadian release of HSCs may promote stem cell niche regeneration and tissue homeostasis. Our findings suggest that in humans, circadian light patterns could similarly influence hematopoiesis via adrenergic pathways, potentially accounting for the observed associations between BLE and erythrocytic variables such as MCH. Furthermore, the amount of brain iron regulates circadian rhythms by modulating PER1 expression and clock genes like Clock and Bmal1. Iron deficiency enhances locomotor activity and iron overload inhibits it [21]. This relation provides further insight into how iron homeostasis may interact with circadian factors in hematopoiesis.
The present findings carry important clinical implications within the broader context of anemia. Anemia, characterized by diminished hemoglobin and impaired oxygen delivery, contributes substantially to the global disease burden. Our study suggests that circadian light hygiene—through its entrainment of endogenous rhythms—may represent a modifiable environmental factor influencing erythropoietic variables. Notably, the exclusive association of blue light exposure metrics with MCH, a key indicator of red blood cell hemoglobin content, underscores a potential mechanistic link between circadian photic input and red blood cell quality. Given the scarcity of prior research in this domain, these results highlight the need to consider circadian light exposure as a novel factor in hematological health. It is particularly relevant for populations at risk of circadian disruption, such as shift workers or individuals residing at extreme latitudes, who may be more susceptible to anemia. In line with this line of thought, Alves et al. [22] demonstrated that poor sleep quality among firefighters, a shift-work profession prone to circadian disruption, correlates negatively with hematological variables (e.g., RBC, HGB, HCT), potentially inhibiting erythropoiesis even within reference ranges. Future longitudinal and interventional studies are essential to elucidate causality and evaluate whether optimizing circadian light hygiene could serve as a non-pharmacological strategy to mitigate anemia risk and improve erythropoietic status. In a related vein, Zhu et al. (2025) [23] found that hemoglobin levels exhibit a nonlinear U-shaped association with respiratory infection risk, modified by chronotype, which underscores the broader implications of circadian disruptions on hematological health and infection susceptibility as highlighted in this discussion on light hygiene’s effects on erythropoiesis.
Physical activity exhibits a complex relationship with hematological markers of anemia, potentially enhancing erythropoiesis while risking hemolysis or iron depletion, yet none of the reviewed studies consider the timing of exercise relative to circadian rhythms. Hu and Lin [24] note that exercise can increase hemoglobin and red cell mass via stimulated erythropoiesis, offering benefits for anemia management despite controversial results. Caimi et al. [25] found that trained athletes have improved red blood cell deformability and elevated MCV and MCHC, although a higher VO2max correlates with lower MCH and MCHC. Mairbäurl [26] describes “sports anemia” in athletes as dilutional hematocrit decline due to plasma expansion that is offset by an increased total red cell mass and hemolysis favoring younger, more flexible cells. Wouthuyzen–Bakker and van Assen [27] highlight exercise-induced iron deficiency anemia in females from iron losses. Cichoń–Woźniak et al. [28] observed in trained male rowers that baseline ferritin concentrations influence post-exercise iron responses: lower ferritin participants (< 75 µg/L) showed transient iron increases followed by declines, while higher ferritin participants (> 75 µg/L) exhibited only decreases, suggesting that baseline iron stores modulate acute iron regulation without altering hepcidin or interleukin-6. Nam et al. [29] indirectly support the protective role of exercise against depression in anemic individuals. These findings suggest that physical activity modulates erythropoiesis variably, with circadian timing unexplored, potentially interacting with light-entrained hematopoiesis, as our study on circadian light exposure shows.
The strong association of larger NA BLE and earlier BLE acrophase with higher MCH and lower RDW-CV suggests a significant role for robust circadian entrainment in hematopoiesis. Given the minimal 24-hour variability of MCH and RDW-CV, these findings likely reflect indirect, long-term influences on erythropoiesis. We propose that pronounced daily fluctuations in light intensity (large NA BLE) and an earlier timing of the BLE peak act as potent chronobiological cues, and favorize the circadian clock’s synchronization in the bone marrow. This precise timing may enhance iron homeostasis and promote more uniform erythroid differentiation and hemoglobinization, thereby increasing hemoglobin content per cell (higher MCH) and fostering greater consistency in RBC size (smaller RDW-CV).
Study Strengths: A key strength of this investigation is the study’s homogeneous cohort, with participants examined at the same location in Tyumen, Russia, over a single autumn month, thus minimizing environmental biases from variable light exposure. Additionally, the use of the normalized amplitude (NA) of BLE accounts for inter-individual variability in light exposure, providing a more precise measure of circadian light hygiene and enhancing the reliability of associations with hematological variables. Notably, even when incorporating mean and amplitude of PA, mean LE, or chronotype score as potential confounders, the significant associations between blue light exposure (amplitude and timing) and hematological variables (HGB, MCH, RDW-CV) persisted, indicating that circadian light hygiene exerts an independent influence.
Study Limitations: Circadian light hygiene, however, is heavily dependent on the photic environment, and the results may not generalize to other seasons or latitudes where daylight patterns differ markedly from those in our study. The lack of an effect of age on most studied variables in our study may be attributed to the narrow age range of the participants. As a result, the findings may not be generalizable to other age groups. Future studies should explore these associations across diverse environmental contexts to verify our findings’ applicability. Additionally, the cross-sectional design precludes causal inferences, and longitudinal research is needed to elucidate temporal relationships.
5. Conclusions
Overall, this research demonstrates that specific circadian light exposure patterns are independently associated with key hematological variables. Larger NA BLE and earlier BLE acrophase were significantly linked to higher MCH and smaller RDW-CV, even after accounting for sex and age. While the association with HGB was modulated by sex, NA BLE maintained a modest independent link. These results highlight the critical role of circadian light hygiene in shaping hematological health, particularly for MCH and RDW-CV, and indicate that light exposure influences hematopoiesis through both sex-independent and potentially sex-mediated pathways.
Supplementary Materials
The following supporting information can be downloaded at Preprints.org, Table S1: Main Sex and Age-Adjusted Circadian Light Hygiene Predictors of Hematological Variables corrected sequentially for co-factors of physical activity 24-h mean, physical activity 24-h amplitude, mean 24-h light exposure, light exposure M10 LE, and chronotype score (MEQ).
Author Contributions
D.G. and Y.B. designed the study. D.G., S.K., O.S., G.C. and D.W. developed the methods. Y.B., A.S, and D.G collected data. D.G., S.K., G.C., Y.B., M.T., L.A., and D.W. analyzed and interpreted the data. D.G., S.K., L.A., G.C. and D.W. prepared the manuscript. D.G. acquired funding. D.G., Y.B., and M.T supervised the project. All authors have read and agreed to the published version of the manuscript.
Funding
The study was supported by the West-Siberian Science and Education Center, Government of Tyumen District, Decree of 20 November 2020, No. 928–rp. The funding organization had no role in the design or conduct of this research. The author(s) have no proprietary or commercial interest in any materials discussed in this article
Institutional Review Board Statement
The study was conducted in accordance with the Declaration of Helsinki, and approved by the Ethics Committee of Tyumen Medical University (Protocol No. 115, June 30, 2023).
Informed Consent Statement
Written informed consents have been obtained from the patients to publish this paper.
Data Availability Statement
The datasets generated and analyzed during the current study are not publicly available due to privacy reasons but are available from the corresponding author on reasonable request.
Acknowledgments
We are grateful to all participants of this study and the medical personnel.
Conflicts of Interest
The authors declare no conflicts of interest.
References
- Chaparro, C.M.; Suchdev, P.S. Anemia epidemiology, pathophysiology, and etiology in low- and middle-income countries. Ann N Y Acad Sci 2019, 1450, 15–31. [CrossRef]
- De la Cruz-Góngora, V.; Villalpando, S.; Shamah-Levy, T. Overview of trends in anemia and iron deficiency in the Mexican population from 1999 to 2018-19. Food Nutr Bull 2024, 45, 57–64. [CrossRef]
- Méndez-Ferrer, S.; Lucas, D.; Battista, M.; Frenette, P.S. Haematopoietic stem cell release is regulated by circadian oscillations. Nature 2008, 452, 442–447. [CrossRef]
- Laerum, O.D. The haematopoietic system. In Chronobiology and Chronomedicine: From Molecular and Cellular Mechanisms to Whole Body Interdigitating Networks; Cornelissen, G., Hirota, T., Eds.; Royal Society of Chemistry: 2024; pp. 304–322.
- O’Neill, J.S.; Reddy, A.B. Circadian clocks in human red blood cells. Nature 2011, 469, 498–503. [CrossRef]
- Beale, A.D.; Labeed, F.H.; Kitcatt, S.J.; O’Neill, J.S. Detecting circadian rhythms in human red blood cells by dielectrophoresis. Methods Mol Biol 2022, 2482, 255–264. [CrossRef]
- Beale, A.D.; Hayter, E.A.; Crosby, P.; Valekunja, U.K.; Edgar, R.S.; Chesham, J.E.; Maywood, E.S.; Labeed, F.H.; Reddy, A.B.; Wright, K.P. Jr; Lilley, K.S.; Bechtold, D.A.; Hastings, M.H.; O’Neill, J.S. Mechanisms and physiological function of daily haemoglobin oxidation rhythms in red blood cells. EMBO J 2023, 42, e114164. [CrossRef]
- Gubin, D.; Weinert, D.; Stefani, O.; Otsuka, K.; Borisenkov, M.; Cornelissen, G. Wearables in chronomedicine and interpretation of circadian health. Diagnostics (Basel) 2025, 15, 327. [CrossRef]
- Gubin, D.; Stefani, O.; Cornelissen, G. Light hygiene for circadian health: a molecular perspective. Front Biosci (Landmark Ed) 2025, 30, 39097. [CrossRef]
- Gubin, D.; Boldyreva, J.; Stefani, O.; Kolomeichuk, S.; Danilova, L.; Shigabaeva, A.; Cornelissen, G.; Weinert, D. Higher vulnerability to poor circadian light hygiene in individuals with a history of COVID-19. Chronobiol Int 2025, 42, 133–146. [CrossRef]
- Horne, J.A.; Ostberg, O. A self-assessment questionnaire to determine morningness-eveningness in human circadian rhythms. Int J Chronobiol. 1976, 4, 97–110.
- Gubin, D.; Danilenko, K.; Stefani, O.; Kolomeichuk, S.; Markov, A.; Petrov, I.; Voronin, K.; Mezhakova, M.; Borisenkov, M.; Shigabaeva, A.; Yuzhakova, N.; Lobkina, S.; Petrova, J.; Malyugina, O.; Weinert, D.; Cornelissen, G. Light environment of Arctic solstices is coupled with melatonin phase-amplitude changes and decline of metabolic health. J Pineal Res 2025a, 77, e70023. [CrossRef]
- Gubin, D.; Kolomeichuk, S.; Danilenko, K.; Stefani, O.; Markov, A.; Petrov, I.; Voronin, K.; Mezhakova, M.; Borisenkov, M.; Shigabaeva, A.; Boldyreva, J.; Petrova, J.; Alkhimova, L.; Weinert, D.; Cornelissen, G. Timing and amplitude of light exposure, not photoperiod, predict blood lipids in Arctic residents: a circadian light hypothesis. Biology (Basel) 2025D, 14, 799. [CrossRef]
- Gubin, D.; Kolomeichuk, S.; Danilenko, K.; Stefani, O.; Markov, A.; Petrov, I.; Voronin, K.; Mezhakova, M.; Borisenkov, M.; Shigabaeva, A.; Boldyreva, J.; Petrova, J.; Weinert, D.; Cornelissen, G. Light exposure, physical activity, and indigeneity modulate seasonal variation in NR1D1 (REV-ERBα) expression. Biology (Basel) 2025, 14, 231. [CrossRef]
- Sennels, H.P.; Jørgensen, H.L.; Hansen, A.L.; Goetze, J.P.; Fahrenkrug, J. Diurnal variation of hematology parameters in healthy young males: the Bispebjerg study of diurnal variations. Scand J Clin Lab Invest 2011, 71, 532–541. [CrossRef]
- Hilderink, J.M.; Klinkenberg, L.J.J.; Aakre, K.M.; de Wit, N.C.J.; Henskens, Y.M.C.; van der Linden, N.; Bekers, O.; Rennenberg, R.J.M.W.; Koopmans, R.P.; Meex, S.J.R. Within-day biological variation and hour-to-hour reference change values for hematological parameters. Clin Chem Lab Med 2017, 55, 1013–1024. [CrossRef]
- Ikeda, R.; Tsuchiya, Y.; Koike, N.; Umemura, Y.; Inokawa, H.; Ono, R.; Inoue, M.; Sasawaki, Y.; Grieten, T.; Okubo, N.; Ikoma, K.; Fujiwara, H.; Kubo, T.; Yagita, K. REV-ERBα and REV-ERBβ function as key factors regulating mammalian circadian output. Sci Rep 2019, 9, 10171. [CrossRef]
- Raghuram, S.; Stayrook, K.R.; Huang, P.; Rogers, P.M.; Nosie, A.K.; McClure, D.B.; Burris, L.L.; Khorasanizadeh, S.; Burris, T.P.; Rastinejad, F. Identification of heme as the ligand for the orphan nuclear receptors REV-ERBalpha and REV-ERBbeta. Nat Struct Mol Biol 2007, 14, 1207–1213. [CrossRef]
- Yin, L.; Wu, N.; Lazar, M.A. Nuclear receptor Rev-erbalpha: a heme receptor that coordinates circadian rhythm and metabolism. Nucl Recept Signal 2010, 8, e001. [CrossRef]
- Simcox, J.A.; Mitchell, T.C.; Gao, Y.; Just, S.F.; Cooksey, R.; Cox, J.; Ajioka, R.; Jones, D.; Lee, S.H.; King, D.; Huang, J.; McClain, D.A. Dietary iron controls circadian hepatic glucose metabolism through heme synthesis. Diabetes 2015, 64, 1108–1119. [CrossRef]
- Wu, Q.; Ren, Q.; Wang, X.; Bai, H.; Tian, D.; Gao, G.; Wang, F.; Yu, P.; Chang, Y.Z. Cellular iron depletion enhances behavioral rhythm by limiting brain Per1 expression in mice. CNS Neurosci Ther 2024, 30, e14592. [CrossRef]
- Alves, S.; Silva, F.; Esteves, F.; Costa, S.; Slezakova, K.; Alves, M.; Pereira, M.; Teixeira, J.; Morais, S.; Fernandes, A.; Queiroga, F.; Vaz, J. The impact of sleep on haematological parameters in firefighters. Clocks Sleep 2024, 6, 291–311. [CrossRef]
- Zhu, Y.; Chen, Q.; Wang, M.; Qian, H.; Song, Q.; Liu, B. Sleep behaviors modify the association between hemoglobin concentration and respiratory infection: a prospective cohort analysis. Front. Physiol. 2025, 16, 1638819. [CrossRef]
- Hu, M.; Lin, W. Effects of exercise training on red blood cell production: implications for anemia. Acta Haematol 2012, 127, 156–164. [CrossRef]
- Caimi, G.; Carlisi, M.; Presti, R.L. Red blood cell distribution width, erythrocyte indices, and elongation index at baseline in a group of trained subjects. J Clin Med 2023, 13, 151. [CrossRef]
- Mairbäurl, H. Red blood cells in sports: effects of exercise and training on oxygen supply by red blood cells. Front Physiol 2013, 4, 332. [CrossRef]
- Wouthuyzen-Bakker, M.; van Assen, S. Exercise-induced anaemia: a forgotten cause of iron deficiency anaemia in young adults. Br J Gen Pract 2015, 65, 268–269. [CrossRef]
- Cichoń-Woźniak, J.; Dziewiecka, H.; Ostapiuk-Karolczuk, J.; Kasperska, A.; Gruszka, W.; Basta, P.; Skarpańska-Stejnborn, A. Effect of baseline ferritin levels on post-exercise iron metabolism in male elite youth rowers. Sci Rep 2025, 15, 23440. [CrossRef]
- Nam, H.K.; Park, J.; Cho, S.I. Association between depression, anemia and physical activity using isotemporal substitution analysis. BMC Public Health 2023, 23, 2236. [CrossRef]
Table 1.
Demographic characteristics and red blood cell characteristics of study participants.
| Variable | Mean ± Standard Deviation |
|---|---|
| Age (years) | 19.30 ± 1.51 |
| Body mass index (BMI) | 21.76 ± 3.72 |
| Sex (male/female) | 23/62 |
| Red blood cells (RBC) (10¹²/L) | 4.68 ± 0.42 |
| Hemoglobin concentration (HGB) (g/dL) | 130.3 ± 12.9 |
| Hematocrit (HCT) (%) | 40.15 ± 3.52 |
| Mean corpuscular hemoglobin (MCH) (pg/cell) | 27.99 ± 2.22 |
| Mean corpuscular volume (MCV) (fL) | 85.01 ± 9.87 |
| Mean corpuscular hemoglobin concentration (MCHC) (g/D) | 321.9 ± 33.7 |
| Red cell distribution width – CV (RDW-CV) (%) | 13.12 ± 1.21 |
Disclaimer/Publisher’s Note: The statements, opinions and data contained in all publications are solely those of the individual author(s) and contributor(s) and not of MDPI and/or the editor(s). MDPI and/or the editor(s) disclaim responsibility for any injury to people or property resulting from any ideas, methods, instructions or products referred to in the content. |
© 2025 by the authors. Licensee MDPI, Basel, Switzerland. This article is an open access article distributed under the terms and conditions of the Creative Commons Attribution (CC BY) license (http://creativecommons.org/licenses/by/4.0/).
Copyright: This open access article is published under a Creative Commons CC BY 4.0 license, which permit the free download, distribution, and reuse, provided that the author and preprint are cited in any reuse.


