
Submitted:
22 January 2026
Posted:
22 January 2026
You are already at the latest version
Abstract
The rising global prevalence of obesity and related disorders, including metabolic syn-drome (MetS) and type 2 diabetes (T2DM), highlights the need to better understand the mechanisms underlying these conditions, particularly host–microbiota interactions. While the gut microbiota has been extensively studied, the role of the oral microbiota and its interaction with human salivary proteins remains poorly explored. This study investigated the integrated human salivary proteome and bacterial metaproteome in Brazilian individuals spanning different metabolic states: normal weight, overweight, obesity, MetS, and T2DM. Saliva samples were analyzed using mass spectrome-try-based proteomics to identify differential protein profiles. The results revealed sig-nificant downregulation of the human proteins MYSM1 and GAD65 in obesity, MetS, and T2DM, with negative correlations to BMI, suggesting compromised an-ti-inflammatory functions. In contrast, carbonic anhydrase VI (CA6) was markedly upregulated and positively correlated with systolic blood pressure and glucose levels, indicating an acidic and inflammatory oral environment. In the bacterial metaprote-ome, TrxC-2, UMPK, and RsmH were significantly increased in metabolically com-promised groups and positively associated with anthropometric and insulin resistance markers, reflecting microbial adaptations to oxidative stress and enhanced virulence. Interactome analysis revealed negative correlations between bacterial proteins and MYSM1/GAD65, alongside positive associations with CA6, suggesting a feedback loop between oral dysbiosis and host metabolic dysfunction. These findings highlight the oral cavity as a key site of host–microbiota interaction in metabolic diseases and iden-tify potential biomarkers and therapeutic targets.
Keywords:
salivary proteomics
; metabolic disorders
; host–microbiota
; interactions
; obesity and diabetes
1. Introduction
Obesity is a chronic disorder, classified as a noncommunicable disease (NCD) by the WHO, characterized by an abnormal accumulation of adipose tissue, resulting in a series of responses mediated by the secretions of adipokines from this endocrine organ [1]. Generally, it presents as a multifactorial disease, influenced by a complex interplay of genetic, environmental, and behavioral factors [2]. A hallmark of obesity is its association with chronic low-grade inflammation, which plays a pivotal role in the development and progression of numerous comorbidities, including cardiovascular diseases, metabolic syndrome (MetS), type 2 diabetes mellitus (T2DM), and dysbiosis [3,4,5].
Recent global estimates indicate that over 1 billion individuals are living with obesity, including 880 million adults and 159 million children [2]. In Brazil, the prevalence of overweight and obesity reached 37% and 31%, respectively, among adults in 2024 [6]. This escalating trend poses a significant burden on healthcare systems worldwide, particularly in low- and middle-income countries such as Brazil, where the rise in obesity is closely linked to the increasing incidence of MetS, T2DM, and oral dysbiosis [7]. Metabolic Syndrome is a cluster of interrelated risk factors that elevate the likelihood of cardiovascular diseases, type 2 diabetes mellitus and stroke [8] (Hamooya, et al., 2025). According to the National Cholesterol Education Program Adult Treatment Panel III (NCEP ATP III) criteria [9], MetS is defined by the presence of at least three of the following components: hypertriglyceridemia, reduced high-density lipoprotein (HDL) cholesterol, elevated waist circumference, hypertension, and hyperglycemia. Insulin resistance or T2DM may also be included as diagnostic criteria [10,11]. Globally, the prevalence of MetS was estimated at 12.5% in 2021 [12]. In Brazil, a study by De Siqueira Valadares [13] reported a concerning prevalence of 31% for MetS over the past decade (2011–2021), based on the NCEP ATP III criteria.
Obesity is widely recognized as a metabolic disorder characterized by impaired lipid, protein, and carbohydrate metabolism, resulting from insufficient insulin secretion by pancreatic β-cells, insulin resistance, or a combination of both [14]. Insulin resistance is manifested by reduced responsiveness of insulin-sensitive organs and tissues, resulting in decreased sensitivity to the hormone. In this context, the relationship between inflammatory conditions and insulin resistance has been extensively studied [15]. According to the International Diabetes Federation (IDF) Atlas [16], approximately 537 million adults were living with T2DM worldwide in 2021, with 75% residing in low- and middle-income countries. The same year witnessed 6.7 million deaths attributable to diabetes (IDF, 2021). In Brazil, 15.7 million adults were diagnosed with T2DM in 2021, positioning the country as the sixth highest in the global ranking of diabetes prevalence.
Emerging evidence suggests that alterations in microbial composition are associated with various autoimmune and inflammatory conditions, including metabolic diseases. Among these, obesity, T2DM, and MetS are the most prevalent disorders characterized by metabolic dysregulation and concomitant oral microbiota dysbiosis [17,18]. In this mutualistic host-microorganism relationship, microbiomes arise as environments shaped by complex interactions between the genetic potential of hundreds of trillions of microorganisms and host tissues. Metaproteomics has emerged as a powerful tool to explore not only microbial diversity and abundance but also the intricate interactions between the microbiota and the host proteome, including signal transduction pathways and metabolic networks [19]. Functional analyses of microbial protein profiles offer promising avenues for identifying novel diagnostic biomarkers and therapeutic targets for metabolic diseases. Recent studies have demonstrated significant alterations in the salivary proteome of individuals with these conditions, including dysregulation of human proteins such as cobalamin transporter, profilin-1, alpha-2-macroglobulin, and ceruloplasmin, as well as bacterial proteins like amylase-binding protein, lipoprotein TmpC, Efem/EfeO family lipoprotein AbpA, and copper-containing nitrite reductase [20,21].The escalating global and regional prevalence of obesity, T2DM, and MetS underscores the urgent need for accurate and predictive diagnostic tools [16,22]. Considering salivary fluid, the host-microbe signaling underlying these metabolic disorders remains underexplored [21]. Then, an integrated analysis of human and bacterial proteins in the saliva of healthy individuals and those with obesity, T2DM, and MetS could provide valuable insights into the complex mechanisms of host-microbiota interactions and their role in the development and progression of T2DM and MetS. This study aims to identify alterations in the human and bacterial oral metaproteome associated with increased body mass index (BMI), obesity and its comorbidities. By analyzing the interactome between the human proteome and oral bacterial metaproteome, we seek to identify potential protein biomarkers and pathways linked to elevated BMI, MetS, and T2DM.
2. Materials and Methods
Experimental Design
The study population comprised Brazilian adults aged 18 years or older, recruited from the state of Rio de Janeiro. Data collection was conducted in a clinical laboratory at the Afya-Unigranrio University, located in Duque de Caxias, Rio de Janeiro, where saliva samples, anthropometric measurements, and biochemical tests were obtained in the morning following a 12-hour fasting period.
Healthy individuals were stratified into three groups based on body mass index (BMI): normal weight (NW; n = 29; BMI ≥ 18.5 kg/m2 and ≤24.9 kg/m2), overweight (OW; n = 25; BMI ≥ 25 kg/m2 and ≤29.9 kg/m2), and obese (OB; n = 15; BMI ≥ 30 kg/m2). Additionally, the study included individuals diagnosed with metabolic syndrome (MetS; n = 23) and type 2 diabetes mellitus (T2DM; n = 11). Participants in the T2DM group had been previously diagnosed with the condition; thus, this study did not perform any diagnostic assessments for T2DM. The study protocol was approved by the Ethics in Human Research Committee of Unigranrio, RJ, Brazil (approval number 3,402,791). All participants provided written informed consent prior to enrollment, and the study was conducted in compliance with the ethical principles outlined in the 1964 Declaration of Helsinki and its subsequent amendments.
Clinical Evaluation
Clinical assessments were carried out as previously described. The evaluation encompassed anthropometric measurements, including body mass index (BMI), height, weight, waist circumference, hip circumference, and waist-to-hip ratio (WHR), as well as blood pressure assessment and laboratory blood analyses. BMI was determined by dividing body weight (kg) by the square of height (m2). Waist and hip circumferences, along with WHR, were measured using a standard clinical measuring tape. Blood pressure was assessed using the oscillometric method (OMRON 7320; São Paulo, SP, Brazil), following [23]. Biochemical analyses including cholesterol, HDL, LDL, insulin, glucose and triglycerides were performed according to Da Silva, et al., 2025. The homeostasis model assessment of insulin resistance (HOMA-IR) and β-cell function (HOMA-β) were calculated following previously established methods [24,25].
Saliva Collection
Saliva samples were collected after a 12-hour fasting period and 1 hour without liquid intake, as described in Da Silva et al., 2022 [26]. Saliva solution was collected into sterile tubes, and immediately mixed with 1 mM phenylmethylsulfonyl fluoride (PMSF; Sigma-Aldrich, St. Louis, MO, USA), 1 mM ethylenediamine tetraacetic acid (EDTA), and 1 mM protease inhibitor cocktail (Sigma-Aldrich) to prevent protein degradation [27,28].
Saliva samples were processed according to previously established protocols [28], with modifications. After centrifugation, the supernatant was concentrated using an Amicon Ultra Centrifugal Filters 3kDa (Sigma-Aldrich) and were stored at −80 °C to ensure sample integrity until further processing.
Protein Processing for Mass Spectrometry
All samples were processed uniformly using the following protocol. Protein quantification was performed using the Bradford assay, with absorbance measured on an Epoch Microplate Spectrophotometer (BioTek, Highland Park, USA). A calibration curve was generated using bovine serum albumin (BSA; Bio-Rad Laboratories Inc., Hercules, CA, USA) as the standard [29].
In this study, a sample pooling strategy was employed for proteome analysis as described in Ferreira da Silva et al., 2024. Samples were grouped based on BMI, type 2 diabetes mellitus (T2DM) and metabolic syndrome (MeS) condition, forming the following categories: normal weight (n = 29), overweight (n = 25), obese (n = 15), MeS (n = 23), and T2DM (n = 11). To optimize equipment utilization and enhance the representativeness of the studied population, these five main groups were further subdivided using a randomized approach, resulting in the following subgroups: normal weight 1 (n = 13), normal weight 2 (n = 13), and normal weight 3 (n = 13); overweight 1 (n = 12), overweight 2 (n = 12), and overweight 3 (n = 11); obese 1 (n = 5), obese 2 (n = 5), and obese 3 (n = 5); MeS 1 (n = 11), MeS 2 (n = 11), and MeS 3 (n = 11); T2DM 1 (n = 3), T2DM 2 (n = 3), T2DM 3 (n = 3), and T2DM 4 (n = 2). This stratification was designed to balance the distribution of key clinical characteristics across subgroups, thereby improving the generalizability of findings and minimizing potential biases
Each pooled salivary proteome was subjected to trypsin digestion by using a shotgun method [30]. Briefly, 50 µg of each sample were denatured with 8 M urea (1:1 ratio), followed by reduction with 5 mM dithiothreitol (DTT) for 25 minutes at 56 °C. Alkylation was performed using 14 mM iodoacetamide for 30 minutes at room temperature in the dark. The urea concentration was diluted to 1.6 M with 60 mM ammonium bicarbonate, and 1 mM calcium chloride was added to the samples. Trypsin digestion was carried out using sequencing-grade modified trypsin (Promega, Madison, WI, USA) at an enzyme-to-substrate ratio of 1:50. The reactions were incubated for 16 hours at 37 °C and terminated by adding 0.4% formic acid. To remove urea and other impurities, digested samples were purified using Oasis HLB 1cc columns (Waters Corporation, Milford, MA, USA).
Mass Spectrometry Analysis
All pooled peptide samples were analyzed as previously established protocols [20,25,28,31]. They were subjected to direct injection into the mass spectrometer, processed sequentially for normalization, and analyzed in triplicate for quantitative assessment. Following proteomic data acquisition from saliva samples, a rigorous statistical analysis was conducted to identify significant variations in protein abundance across experimental groups. To enhance data reliability and mitigate technical variability, all three analytical replicates for each subgroup were included in the final analysis. In total, 48 samples were subjected to statistical evaluation, yielding a comprehensive dataset for robust statistical inference.
Tryptic peptidomes were analyzed using a nanoUPLC system coupled to an electrospray quadrupole time-of-flight mass spectrometer (ESI-Q-TOF Synapt HDMS G1; Waters Corporation). Chromatographic separation was performed using a two-phase system: mobile phase A consisted of 0.1% formic acid in water (v/v), while mobile phase B contained 0.1% formic acid in acetonitrile (v/v). Sample desalting was carried out on a nanoACQUITY UPLC Symmetry C18 Trap Column (5 µm, 20 mm, and 180 µm) at a flow rate of 5 µL/min for 3 min. Peptide separation was achieved using a nanoACQUITY UPLC HSS T3 reversed-phase column (1.8 µm, 100 mm, and 100 µm) with a constant flow rate of 0.6 µL/min. The applied linear gradient was as follows: 7%–40% mobile phase B from 0 to 19.9 min, 40%–85% B from 19.9 to 23.9 min, 85% B maintained for an additional 4 min, followed by column reequilibration to initial conditions from 27.9 to 29.9 min, with an additional 7 min rinsing step.
Mass spectrometry was performed using a positive nano-electrospray ionization (nanoESI+) source in MSe mode, employing data-independent acquisition with parallel fragmentation of all precursor ions and alternating acquisition at low and high energy. At low energy, continuum spectra were recorded within a mass range of 50–2000 Da, with a scan time of 0.8 s. Instrument parameters included a source temperature of 80 °C, a desolvation temperature of 100 °C, a sampling cone voltage of 35 V, a capillary voltage of 3.0 kV, and a constant collision energy of 6 V. Under high-energy conditions, all parameters remained unchanged except for the collision energy, which was ramped from 15 to 55 V throughout the scan. The mass spectrometer was calibrated using a 300 fmol/µL solution of human (Glu1)-fibrinopeptide B (Waters Corporation), which served as a reference standard and was injected at a flow rate of 0.2 µL/min every 30 s. The acquired mass spectra were calibrated against the doubly charged precursor ion of (Glu1)-fibrinopeptide B (785.8426 Da) to ensure high mass accuracy [23] [Da Silva et al., 2023]. To prevent protein modifications such as carbamylation of lysines and N-terminal residues, temperatures above 60 °C were avoided [32,33,34].
Statistical Analysis
The distribution of the data was assessed using the Kolmogorov–Smirnov normality test. Significant differences between groups were evaluated using the t-test and chi-squared test, implemented in SPSS Statistics 22 (IBM Brazil, São Paulo, Brazil).
Mass spectrometry (MS) data were processed and searched against the UNIPROT database, which contains 20,379 human proteins, including revised and unrevised polypeptides and isoforms (https://www.uniprot.org/), using the Progenesis QI 4.06 software (Waters). To identify bacterial proteins, MS data were also searched against a database of eight bacterial phyla (Actinobacteria, Bacteroidetes, Chloroflexi, Chlamydiae, Fusobacteria, Firmicutes, Synergistetes, and Spirochaetes) from UNIPROT. Nontryptic peptides were excluded based on filter criteria. Peptide identification was performed using the following parameters: minimum of 3 fragment ion matches per peptide, 7 fragment ion matches per protein, and 1 peptide match per protein. One missed trypsin cleavage was allowed, with carbamidomethylation of cysteines as a fixed modification and oxidation of methionine as a variable modification [28]. To prevent protein modifications such as carbamylation of lysines and N-terminal residues, temperatures above 60 °C were avoided [32,33,34]. Polypeptides were considered identified only if they matched at least one unique and specific peptide from the experimental data. Protein abundance was estimated based on the average abundance of the three most intense tryptic peptides [32,34]. Identifications were classified as valid if detected in at least two analytical replicates, with a false discovery rate (FDR) of <1% across all data. Quantitative analysis was performed on proteins identified in at least half of the samples, technical replicates, within each group.
Quantitative variances were assessed using ANOVA in the MetaboAnalyst 6.0 platform (https://www.metaboanalyst.ca/home.xhtml), with a significance threshold of p ≤ 0.05. Partial least squares-discriminant analysis (PLS-DA) and Pattern Hunter (PH) were employed to evaluate group differences. Pearson’s correlation analysis was performed using PH, with correlations classified as moderate (0.5–0.7), high (0.7–0.9), or very high (0.9–1.0) [35]. Protein-clinical data correlations were visualized using the corrplot package (version 0.92) [36]. To identify key features differentiating groups, two multivariate classification algorithms were applied: PLS-DA, used to calculate the variable importance in projection (VIP) score, and Random Forest (RF). The VIP score quantifies the contribution of each variable to the PLS-DA model, with scores ≥ 1 considered significant [37]. RF, a machine learning algorithm, was used to rank protein features based on their relevance for sample classification [38], and to provide predictive insights into disease risk based on patient characteristics [39,40]. The reliability of RF results was confirmed using receiver operating characteristic (ROC) curves, confusion matrices, and error rates, generated for both human and bacterial proteins using the mixOmics package (version 6.26) [41].
3. Results
3.1. Demographic and Clinical Evaluation
As described in Ferreira da Silva, 2024, analysis of clinical parameters revealed significant changes associated with increasing BMI and the presence of MetS and T2DM (Supplementary Table S1). A notable increase in systolic blood pressure was observed in the overweight group. Interestingly, insulin levels significantly differed between control groups (NW, OW) and MetS, but not in relation to the T2DM.
3.2. Metaproteome Profiling of Saliva
The human and bacterial salivary proteomes were analyzed using quantitative mass spectrometry (LC-ESI Q/TOF) with a gel-independent approach. This method enabled the identification of 66 human polypeptides (Supplementary Table S2), of which 35 exhibited differential abundances across the study groups. One hundred and twenty one bacterial polypeptides were identified (Supplementary Table S3), with 55 showing differential expression when comparing all groups. Following a significant ANOVA result, pairwise comparisons of protein abundances between groups were conducted using a post hoc Tukey’s HSD test (Supplementary Tables S2 and S3).
The taxonomic classification of the 55 differentially expressed bacterial proteins revealed a predominance of members from the phyla Firmicutes (12 proteins), Chloroflexi (11), Fusobacteria (10), and Chlamydiae and Actinobacteria (7 each). At a finer taxonomic level, the most represented orders were Fusobacteriales and Bacillales (10 proteins each), followed by Chloroflexales (8) and Chlamydiales (7), reflecting the dynamic composition of taxa typically associated with mucosal environments and host–microbiota interactions [42,43] (Supplementary Table S4). In terms of expression patterns, Firmicutes exhibited eight upregulated and four downregulated proteins, Chloroflexi showed seven downregulated and four upregulated, Fusobacteria had seven upregulated and three downregulated, and Chlamydiae displayed six upregulated and one downregulated protein. Consistently, at the order level, Fusobacteriales presented seven upregulated and three downregulated proteins, Bacillales had six upregulated and four downregulated, Chloroflexales exhibited six downregulated and two upregulated, and Chlamydiales showed six upregulated and one downregulated, reinforcing the heterogeneous regulation among bacterial taxa under the studied condition.
Human and bacterial proteins were analyzed to assess their relevance in differentiating between study groups and to identify potential biological markers for MetS and T2DM. A Random Forest (RF) algorithm was employed to generate a variable importance plot highlighting the top 10 proteins (Figure 1A,B; Supplementary Tables S5 and S6), which were identified as having the most significant impact on predicting increased body mass index (BMI) and the presence of MetS and T2DM. Additionally, Variable Importance in Projection (VIP) Score analysis was conducted to identify the key classifying proteins among the studied groups (Supplementary Figures S1 and S2).
The prediction model generated by RF demonstrated higher accuracy in classifying the study groups compared to the VIP Score analysis (Supplementary Tables S7 and S8). To further validate the accuracy of the RF model, receiver operating characteristic (ROC) curves were constructed (Supplementary Figures S3 and S4), and confusion matrices along with error rates were generated for both human and bacterial proteins (Supplementary Tables S9 and S10).
The top 10 human and bacterial proteins selected by RF were used to create partial least squares-discriminant analysis (PLS-DA) plots (Figure 2A,B). Given human salivary proteins there was an effective distinction of the normal weight and overweight groups from the other three group. In contrast, the obese, MetS, and T2DM groups exhibited substantial overlap, indicating a higher degree of similarity in their salivary proteomes. Bacterial protein profiles also demonstrated a strong capacity to differentiate the study groups, with some overlap observed between the normal weight and overweight groups, as well as between the T2DM and MetS groups. Notably, OW samples showed specific data composition in terms of bacterial proteins in saliva.
3.3. Integrative Analysis of Clinical and Metaproteome Data
For analysis of interactions between the bacterial and human proteomes, as well as between the metaproteome and clinical data, the mixOmics and corplot packages were utilized. The corplot package was employed to assess correlations between human and bacterial proteins with clinical data (Supplementary Figures S6 and S7).
Among human proteins, Kallikrein-1 (Supplementary Table S12) and Carbonic anhydrase 6 exhibited strong and direct correlations with systolic blood pressure and fasting glucose levels. Conversely, Deubiquitinase MYSM1 and Glutamate decarboxylase 2 displayed negative correlations with body mass, BMI, waist circumference, hip circumference, waist-to-hip ratio (WHR), systolic blood pressure, and diastolic blood pressure. Deubiquitinase MYSM1 was negatively correlated with insulin levels, HOMA-β, and HOMA-IR.
In bacterial proteins, Thioredoxin C-2 (Supplementary Table S13), Hydroxylamine reductase, Ribosomal RNA small subunit methyltransferase H, and Uridylate kinase demonstrated positive correlations with BMI, waist circumference, hip circumference, and WHR. Furthermore, Ribosomal RNA small subunit methyltransferase H and Uridylate kinase were positively correlated with HOMA-IR and negatively correlated with HDL levels.
The investigation of human and bacterial proteins correlation, and their potential impact on individual health, revealed significant interactions among them. Specifically, the bacterial Thioredoxin C-2, Hydroxylamine reductase, Ribosomal RNA small subunit methyltransferase H and Uridylate kinase exhibited a strong negative correlation with the human protein Deubiquitinase MYSM1 and a moderate negative correlation with Glutamate decarboxylase 2 (Figure 3). In contrast, the human protein Carbonic anhydrase 6 (Supplementary Table S14) demonstrated a positive correlation with the aforementioned bacterial proteins (Thioredoxin C-2, Hydroxylamine reductase, Ribosomal RNA small subunit methyltransferase H, and Uridylate kinase).
The 10 human and bacterial proteins selected by RF were analyzed using the Hunter Pattern method. Pearson’s correlation analysis was conducted via PH to assess the relationships between these proteins and increased BMI, as well as the presence of T2DM and MetS. The results for human proteins are presented in Supplementary Figure S5 and Supplementary Table S11, while bacterial protein correlations are shown in Supplementary Figure S6 and Supplementary Table S11. Among the identified human proteins, Deubiquitinase MYSM1, Carbonic Anhydrase 6, and Glutamate Decarboxylase 2 exhibited significant correlations with increased BMI and the presence of MetS and T2DM. Similarly, the bacterial proteins Uridylate Kinase, Aspartate 1-Decarboxylase, and the Bifunctional NAD(P)H-Hydrate Repair Enzyme Nnr demonstrated significant correlations with high BMI and the studied diseases.
4. Discussion
In this study, we aimed to perform an integrative analysis of the human and bacterial proteins in the saliva supernatant metaproteome from Brazilian volunteers, an approach that has been little explored in the literature, particularly within the context of the oral cavity. This approach allowed us to identify significant relationships between human and bacterial proteins during increased BMI and the presence of MetS and T2DM conditions. Furthermore, our findings are consistent with previous salivary proteomics studies, which have reported protein alterations associated with increased BMI and the presence of MetS and T2DM [20,21,26].
Among the differentially expressed bacterial proteins, twelve were identified as belonging to the phylum Firmicutes, which includes the order Bacillales. In a study conducted in an Iraqi population with normal, overweight, and obese categories, Firmicutes were found to be significantly more abundant in the oral microbiome as BMI increased [44]. Conversely, a study conducted with a Rio de Janeiro population, comparing individuals across BMI categories and with metabolic syndrome (MetS), observed a decrease in the relative abundance of Firmicutes from 33.7% in the control group to 30.4% in the MetS group [45]. Although the second study did not reveal statistically significant differences, the contrasting outcomes observed may reflect the multifactorial nature of the oral microbiota, which is strongly influenced by metabolic disorders, geographic location, dietary habits, and the host’s physiological status. Notably, proteins assigned to the phylum Firmicutes, particularly those from the order Bacillales, exhibited a general trend toward increased expression, including the superoxide dismutase [Mn/Fe] (Q9F326) from Staphylococcus, that was assigned as a important component to diffrentiiate diseased groups and was higher in these last groups. It suggests that members of this taxon may play an active role in modulating oral microbial dynamics under the studied conditions.
The phylum Chloroflexi presented eleven differentially expressed proteins, with eight assigned to the order Chloroflexales. Notably, a previous study of the subgingival microbiome in Chilean patients identified Chloroflexi in both healthy individuals and those with chronic periodontitis, showing a higher relative abundance in diseased subjects [46]. This observation supports the potential involvement of Chloroflexi in oral inflammatory processes, although their specific contribution to the pathogenesis of periodontal disease remains to be elucidated. In the present analysis, most Chloroflexi proteins exhibited decreased expression. However, three of the upregulated proteins were pointed in the top 10 RF biological markers for MetS and T2DM, and specially Ribosomal RNA small subunit methyltransferase H, that correlated positively with BMI and disease status.
The phylum Fusobacteria, represented primarily by the order Fusobacteriales, was identified among the differentially expressed bacterial proteins in our analysis. Within this group, Fusobacterium nucleatum is particularly notable for its role as a key bridging organism in oral biofilms, mediating intergeneric coaggregation between obligate anaerobes and oxygen-tolerant species, thereby facilitating biofilm maturation and stability [47,48]. Beyond its local effects, F. nucleatum has been implicated in the pathogenesis of systemic conditions, including cardiovascular disease, cancer, inflammatory bowel disease, respiratory infections, Alzheimer’s disease, and rheumatoid arthritis [49]. Recent studies have also reported an increased abundance of the Fusobacterium genus in individuals with metabolic syndrome [17,45]. Consistent with these findings, our results revealed that most Fusobacteria proteins were upregulated in association with weight gain and the presence of MetS and T2DM, suggesting a potential link between the metabolic state of the host and the functional activity of Fusobacteria in the oral microbiome.
Combining overall, our results revealed some positive and negative correlations between human and bacterial proteins with clinical data, providing insights about host-oral microbiome interaction during these pathological processes of obesity (Figure 4).
The deubiquitinase protein MYSM1 is a metalloprotease with critical roles in hematopoietic stem cells, lymphocytes, repair of DNA damage, mature blood cells and protective role against excessive inflammation and autoimmune reactions [50,51]. MYSM1 has also been shown to exhibit a protective effect against colorectal cancer. In mice, the deletion of MYSM1 resulted in a higher mortality rate following viral infections, while treatment with MYSM1 demonstrated the ability to suppress pro-inflammatory cytokines [51,52]. Despite scarce literature linking MYSM1 to metabolic disorders, our data reveal a robust inverse association between MYSM1 levels and both BMI and disease status. MYSM1 abundance declined by more than 1.7-fold in obese individuals and by over 2-fold in subjects with MetS and T2DM (Figure 4 and Figure 5) compared to normal-weight controls (NW). Additionally, MYSM1 exhibited a strong negative correlation with waist circumference and waist-to-hip ratio (Supplementary Tables S11 and S12). Furthermore, MYSM1 showed significant negative correlations with Thioredoxin C-2, Hydroxylamine reductase, Ribosomal RNA small subunit methyltransferase H, and Uridylate kinase. Although the role of MYSM1 in bacterial modulation remains poorly understood, our findings reveal a strong negative correlation between MYSM1 and bacterial proteins associated with oxidative stress resistance. This suggests that MYSM1 may play a regulatory role in some members of the salivary microbiota.
Glutamate decarboxylase (GAD65) is an enzyme expressed in neurons and pancreatic beta cells, where it catalyzes the conversion of glutamate to γ-aminobutyric acid (GABA) [53]. GABA is synthesized not only by pancreatic β cells but also by immune cells and intestinal bacteria, having broad physiological relevance [54]. Within the pancreas, GABA produced by GAD65 plays a crucial role in modulating islet function, including the suppression of glucagon secretion by α cells and the promotion of β cell survival [55]. GAD65 is also implicated in the pathogenesis of type 1 diabetes mellitus (T1DM), as it is a major autoantigen targeted by the immune system in this condition [56]. In patients with T1DM, the presence of autoantibodies against GAD65 is a hallmark of the autoimmune destruction of β cells [57,58]. While the role of GAD65 in T1DM is well-established, its relationship with other metabolic diseases, such as obesity, MetS and T2D, remains poorly understood. In this study, GAD65 levels were significantly reduced (Figure 4 and Figure 5) in these three groups (by more than 2.5-fold decrease in obese, MetS and T2DM) compared to normal-weight and overweight individuals (Supplementary Table S11). Additionally, GAD65 exhibited negative correlations with body mass, systolic and diastolic blood pressure, HOMA-IR, waist-to-hip ratio, and waist and hip circumference (Supplementary Table S12). The reduction in GAD65 levels in individuals with high BMI, MetS, and T2DM, along with its inverse associations with clinical and anthropometric obesity parameters, suggest that GAD65 may play a protective role against the development of these metabolic diseases and underscores the need for further research to elucidate the mechanisms linking GAD65 to these conditions.
Carbonic anhydrases (CAs) are metalloenzymes classified as a superfamily comprising eight families to date, including two cytosolic forms, four membrane-bound, one mitochondrial, and one secreted form, carbonic anhydrase VI [59]. CAs are involved in proton generation by catalyzing the reversible hydration of carbon dioxide (CO2 + H2O ⇌ H+ + HCO3−), with increased CA expression being associated with higher concentrations of H+ and HCO3− ions, leading to local extracellular acidosis [60]. Studies have reported an inverse correlation between the intensity of inflammation, as seen in rheumatoid arthritis, and pH levels, implicating CAs in several inflammatory processes [60]. Obesity, MetS, and T2DM are metabolic diseases closely linked to chronic low-grade inflammation [61]. Lamy et al. [62] observed elevated levels of CA 6 in individuals with morbid obesity compared to both normal-weight individuals and obese individuals who underwent bariatric surgery. In our study, CA 6 levels were more than 1.5 times higher in obesity (Figure 4 and Figure 5) compared to the normal-weight group, and more than 2 times higher in the MetS and T2DM groups. Elevated CA 6 levels are strongly and directly correlated with systolic blood pressure, blood glucose, and HOMA-IR (Supplementary Table S12), and showed positive correlations with bacterial proteins such as hydroxylamine reductase, RsmH, and uridylate kinase. These findings indicate that CA 6 overexpression in the oral cavity may promote an acidic and inflammatory microenvironment, thereby contributing to the progression of these metabolic diseases, and this protein probably may serve as a key link between the microbiota, inflammation, and host metabolism, with potential utility as a biomarker or therapeutic target.
Alterations in the microbiota, or dysbiosis, are routinely observed in metabolic diseases such as obesity, MetS, and T2DM [17,45]. Although the literature primarily focuses on changes in the diversity and abundance of the oral microbiota, studies on the metaproteome have gained prominence for their ability to elucidate interactions between the microbiota and the host [21]. In this work, several bacterial proteins, including Thioredoxin C-2, Hydroxylamine reductase, Ribosomal RNA small subunit methyltransferase H, and Uridylate kinase presented strong and inverse correlation with human proteins GAD65 and MYSM1 levels.
Uridylate kinase (also known as uridine monophosphate kinase, UMPK) is an evolutionarily conserved enzyme that catalyzes the reversible phosphorylation of UMP to UDP and subsequently to UTP [63]. The resulting UTP is critical for the synthesis of UDP-N-acetylmuramic acid, peptidoglycan, and RNA [63]. Recent studies have highlighted UMPK’s role in virulence and biofilm production, directly influencing the relationship between the microbiota and its host. Notably, 4-methoxy-1-methyl-2-oxopyridine-3-carbamide (MMOXC), a ricinin derivative, exhibits anti-biofilm properties by inhibiting UMPK, thereby disrupting cell wall formation, RNA biosynthesis, and protein maturation [63,64]. Emeka et al. [65] reported that UMPK expression was elevated nearly twofold in biofilms. In our study, UMPK expression showed a strong positive correlation with weight gain (Figure 4 and Figure 5) and the presence of metabolic diseases (Supplementary Table S11), with a greater than twofold increase from the normal-weight (NW) group to the MetS and T2DM. UMPK also showed a strong and positive correlation with waist and moderate with mass, BMI, diastolic blood pressure and HOMA.IR. These findings suggest that elevated BMI and metabolic diseases conditions may facilitate bacterial colonization and maybe enhance the virulence of certain species, influencing the dynamics between the oral microbiome and host immune responses.
Ribosomal RNA small subunit methyltransferase H (RsmH, also known as MraW) is a bacterial S-adenosylmethionine–dependent methyltransferase that specifically methylates cytosine 1402 (C1402) of 16S rRNA, a modification essential for fine-tuning the ribosomal decoding center and ensuring high-fidelity and efficient translation [66,67]. Beyond rRNA, rsmH can methylate DNA, thereby modulating expression of genes involved in motility and other cellular processes [67]. In Staphylococcus aureus, RsmH enhances resistance to oxidative stress crucial for surviving to host immune attacks. Zou et al. [68] showed that an rsmH knockout reduces gentamicin tolerance by over tenfold in vitro. In Escherichia coli, rsmH also contributes to virulence by regulating flagellar synthesis and intestinal colonization [67]. In our study, rsmH abundance rose more than threefold in individuals with metabolic syndrome (MetS) and type 2 diabetes (T2DM) and over twofold (Figure 4 and Figure 5) in obese subjects versus normal-weight controls, correlating positively with BMI and disease status (Supplementary Table S11). It also showed positive associations with waist circumference, waist-to-hip ratio, diastolic blood pressure, fasting insulin, and HOMA-IR, while correlating negatively with deubiquitinase MYSM1 and glutamate decarboxylase 2 and positively with carbonic anhydrase 6 (Supplementary Table S14). These results suggest that rsmH’s role in enhancing bacterial virulence and oxidative-stress tolerance may drive oral microbiome dysbiosis, linked to obesity, MetS, and T2DM, and associated chronic inflammation, potentially involving carbonic anhydrase 6 pathways.
The thioredoxin system is a critical antioxidant defense mechanism conserved across diverse organisms, from bacteria to mammals [69]. Comprising thioredoxin (Trx), thioredoxin reductase (TrxR/TrxB), and nicotinamide adenine dinucleotide phosphate (NADPH), this system regulates cellular redox homeostasis. Thioredoxin, including isoforms such as thioredoxin-A (TrxA) and thioredoxin-C (TrxC), is a 12-kDa thiol-disulfide oxidoreductase with multifaceted roles. These include reducing protein disulfides, modulating key regulators of motility, enhancing pathogen adhesion to epithelial cells, and influencing virulence factors [70]. Beyond its enzymatic functions, the thioredoxin system is integral to DNA synthesis, gene transcription, cell growth, apoptosis, and protection against oxidative stress [71]. Recent studies highlight its pivotal role in stress resistance, motility, and microbial virulence, underscoring its relevance in both physiological and pathological contexts [72]. In our study, Thioredoxin C-2 (TrxC-2) was significantly upregulated in obese, MetS, and T2DM groups compared to normal-weight and overweight controls (Figure 4 and Figure 5). Specifically, TrxC-2 levels in the obese group were over three times higher than in NW and OW individuals, while in the MetS and T2DM groups, levels were approximately doubled. Additionally, TrxC-2 exhibited a moderate positive correlation with carbonic anhydrase 6. Conversely, TrxC-2 showed a moderate negative correlation with glutamic acid decarboxylase 65 (Gad65) and a strong negative correlation with deubiquitinase MYSM1. The moderate positive correlations observed between TrxC-2 and body mass index (BMI), waist circumference, hip circumference, waist-to-hip ratio (WHR), diastolic blood pressure, and insulin levels further indicate that TrxC-2 upregulation may be linked to metabolic dysregulation and insulin resistance, hallmarks of obesity, MetS, and T2DM. These findings suggest a potential compensatory response to heightened oxidative stress associated with obesity and metabolic disorders, consistent with the thioredoxin system’s role in mitigating reactive oxygen species (ROS) accumulation [73].
5. Conclusions
Our integrated analysis of the human salivary proteome and bacterial metaproteome in Brazilian individuals with normal weight, overweight, obesity, MetS, and T2DM reveals a complex host–microbiota interplay that contributes to oral dysbiosis, chronic inflammation, and metabolic dysfunction. Human proteins MYSM1 and GAD65 were significantly downregulated in obese, MetS, and T2DM groups, showing strong negative correlations with BMI, waist circumference, waist-to-hip ratio, and HOMA-IR. These findings suggest impaired anti-inflammatory and endocrine functions that exacerbate glucose dysregulation. In contrast, salivary CA6 levels were markedly elevated, positively correlating with systolic blood pressure, glucose, and HOMA-IR, and indicating a role in fostering an acidic, inflammatory oral environment linked to chronic low-grade inflammation.
In the bacterial metaproteome, TrxC-2, UMPK, and RsmH were significantly upregulated in individuals with obesity, MetS, and T2DM, correlating positively with anthropometric and metabolic parameters. These bacterial proteins are associated with oxidative stress response, biofilm formation, and enhanced RNA biosynthesis, reflecting microbial adaptation and increased virulence. Notably, TrxC-2, UMPK, and RsmH exhibited strong negative correlations with MYSM1 and GAD65, but positive correlations with CA6, suggesting a vicious cycle wherein microbial oxidative stress and virulence amplify host inflammation and metabolic dysfunction, while reduced host protective proteins perpetuate dysbiosis.
Collectively, these findings highlight critical molecular interactions between human and microbial proteins that may drive the pathogenesis of obesity, MetS, and T2DM. By elucidating this host–microbiota feedback loop, our study positions MYSM1, GAD65, CA6, TrxC-2, UMPK, and RsmH as potential salivary biomarkers or therapeutic targets. Future research should focus on delineating the mechanistic pathways underlying these interactions and evaluating microbiota-modulating strategies to mitigate metabolic complications.
Supplementary Materials
The following supporting information can be downloaded at the website of this paper posted on Preprints.org, Figure S1–S6; Table S1–S13.
Author Contributions
For research articles with several authors, a short paragraph specifying their individual contributions must be provided. The following statements should be used “Conceptualization, X.X. and Y.Y.; methodology, X.X.; software, X.X.; validation, X.X., Y.Y. and Z.Z.; formal analysis, X.X.; investigation, X.X.; resources, X.X.; data curation, X.X.; writing—original draft preparation, X.X.; writing—review and editing, X.X.; visualization, X.X.; supervision, X.X.; project administration, X.X.; funding acquisition, Y.Y. All authors have read and agreed to the published version of the manuscript.” Please turn to the CRediT taxonomy for the term explanation. Authorship must be limited to those who have contributed substantially to the work reported.
Funding
This research was funded by FAPERJ.
Institutional Review Board Statement
The study was conducted in accordance with the Declaration of Helsinki, and approved by the Institutional Review Board (or Ethics Committee) of Unigranrio (approval number 3,402,791)
Informed Consent Statement
Informed consent was obtained from all subjects involved in the study.
Data Availability Statement
The mass spectrometry raw data can be accessed in PRIDE with the dataset identifier. PXD040442 (https://www.ebi.ac.uk/pride/).
Acknowledgments
We are grateful for all volunteers that participated of this study and the National Institute of Metrology, Quality and Technology (Inmetro) for the support in MS analysis. This work was supported by the funding agencie FAPERJ for financial resources and grants.
Conflicts of Interest
The authors declare no conflicts of interest.
References
- Blüher, M. Obesity: Global epidemiology and pathogenesis. Nat. Rev. Endocrinol. 2019, 15, 288–298. [Google Scholar] [CrossRef]
- World Health Organization (WHO). Obesity and Overweight. 2024. Available online: https://www.who.int/news-room/fact-sheets/detail/obesity-and-overweight (accessed on 10 February 2025).
- Aron-Wisnewsky, J.; Prifti, E.; Belda, E.; Ichou, F.; Kayser, B.D.; Dao, M.C.; Verger, E.O.; Hedjazi, L.; Bouillot, J.-L.; Chevallier, J.-M.; et al. Major microbiota dysbiosis in severe obesity: Fate after bariatric surgery. Gut 2019, 68, 70–82. [Google Scholar] [CrossRef]
- Lopez-Jimenez, F.; Almahmeed, W.; Bays, H.; Cuevas, A.; Di Angelantonio, E.; le Roux, C.W.; Sattar, N.; Sun, M.C.; Wittert, G.; Pinto, F.J.; et al. Obesity and cardiovascular disease: Mechanistic insights and management strategies. A joint position paper by the World Heart Federation and World Obesity Federation. Eur. J. Prev. Cardiol. 2022, 29, 2218–2237. [Google Scholar] [CrossRef] [PubMed]
- Sun, M.; da Silva, M.; Bjørge, T.; Fritz, J.; Mboya, I.B.; Jerkeman, M.; Stattin, P.; Wahlström, J.; Michaëlsson, K.; van Guelpen, B.; et al. Body mass index and risk of over 100 cancer forms and subtypes in 4.1 million individuals in Sweden: The Obesity and Disease Development Sweden (ODDS) pooled cohort study. Lancet Reg. Health Eur. 2024, 45, 101034. [Google Scholar] [CrossRef]
- NCD Risk Factor Collaboration (NCD-RisC). Worldwide trends in underweight and obesity from 1990 to 2022: A pooled analysis of 3663 population-representative studies with 222 million children, adolescents, and adults. Lancet 2024, 403, 1027–1050. [Google Scholar] [CrossRef]
- Moreira, P.V.L.; Neta, A.d.C.P.d.A.; Ferreira, F.E.L.L.; de Araújo, J.M.; Rodrigues, R.E.d.A.; de Lima, R.L.F.C.; Vianna, R.P.d.T.; Neto, J.M.d.S.; O’flaherty, M. Predicting the prevalence of type 2 diabetes in Brazil: A modeling study. Front. Public Health 2024, 12, 1275167. [Google Scholar] [CrossRef]
- Hamooya, B.M.; Siame, L.; Muchaili, L.; Masenga, S.K.; Kirabo, A. Metabolic syndrome: Epidemiology, mechanisms, and current therapeutic approaches. Front. Nutr. 2025, 12, 1661603. [Google Scholar] [CrossRef] [PubMed]
- Expert Panel on Detection, Evaluation, and Treatment of High Blood Cholesterol in Adults. Executive Summary of The Third Report of The National Cholesterol Education Program (NCEP) Expert Panel on Detection, Evaluation, and Treatment of High Blood Cholesterol in Adults (Adult Treatment Panel III). JAMA 2001, 285, 2486–2497. [CrossRef]
- Reaven, G. Role of insulin resistance in human disease. Diabetes 1988, 37, 1595–1607. [Google Scholar] [CrossRef]
- Robberecht, H.; Bruyne, T.D.; Hermans, N. Biomarkers of the metabolic syndrome: Influence of selected foodstuffs, containing bioactive components. Phytochem. Rev. 2018, 17, 351–377. [Google Scholar] [CrossRef]
- Noubiap, J.J.; Nansseu, J.R.; Lontchi-Yimagou, E.; Nkeck, J.R.; Nyaga, U.F.; Ngouo, A.T.; Tounouga, D.N.; Tianyi, F.-L.; Foka, A.J.; Ndoadoumgue, A.L.; et al. Geographic Distribution of Metabolic Syndrome and Its Components in the General Adult Population: A Meta-Analysis of Global Data From 28 Million Individuals. Diabetes Res. Clin. Pract. 2022, 188, 109924. [Google Scholar] [CrossRef]
- de Siqueira Valadares, L.T.; de Souza, L.S.B.; Salgado Júnior, V.A.; de Freitas Bonomo, L.; de Macedo, L.R.; Silva, M. Prevalence of Metabolic Syndrome in Brazilian Adults in the Last 10 Years: A Systematic Review and Meta-Analysis. BMC Public Health 2022, 22, 327. [Google Scholar] [CrossRef] [PubMed]
- Defronzo, R.A. Banting Lecture. From the triumvirate to the ominous octet: A new paradigm for the treatment of type 2 diabetes mellitus. Diabetes 2009, 58, 773–795. [Google Scholar]
- Szablewski, L. Changes in Cells Associated with Insulin Resistance. Int. J. Mol. Sci. 2024, 25, 2397. [Google Scholar] [CrossRef] [PubMed]
- International Diabetes Federation. IDF Diabetes Atlas, 10th ed.; International Diabetes Federation: Brussels, Belgium, 2021; Available online: https://diabetesatlas.org/idfawp/resourcefiles/2021/07/IDF_Atlas_10th_Edition_2021.pdf.
- Prince, Y.; Davison, G.M.; Davids, S.F.G.; Erasmus, R.T.; Kengne, A.P.; Graham, L.M.; Raghubeer, S.; Matsha, T.E. The Relationship between the Oral Microbiota and Metabolic Syndrome. Biomedicines 2023, 11, 3. [Google Scholar] [CrossRef]
- da Silva, C.V.F.; da Silva, C.J.F.; Cataldi, T.R.; Labate, C.A.; Sade, Y.B.; Scapin, S.M.N.; Thompson, F.L.; Thompson, C.; Silva-Boghossian, C.M.D.; de Oliveira Santos, E. Proteomic and Metabolomic Interplay in the Regulation of Energy Metabolism During Obesity and Metabolic Syndrome. Diabetes Metab. Res. Rev. 2025, 41, e70090. [Google Scholar] [CrossRef] [PubMed]
- Erickson, A.R.; Cantarel, B.L.; Lamendella, R.; Darzi, Y.; Mongodin, E.F.; Pan, C.; Shah, M.; Halfvarson, J.; Tysk, C.; Henrissat, B.; et al. Integrated Metagenomics/Metaproteomics Reveals Human Host-Microbiota Signatures of Crohn’s Disease. PLoS ONE 2012, 7, e49138. [Google Scholar] [CrossRef]
- Ferreira da Silva, C.V.; da Silva, C.J.F.; Bacila Sade, Y.; Naressi Scapin, S.M.; Thompson, F.L.; Thompson, C.; da Silva-Boghossian, C.M.; de Oliveira Santos, E. Prospecting Specific Protein Patterns for High Body Mass Index (BMI), Metabolic Syndrome and Type 2 Diabetes in Saliva and Blood Plasma From a Brazilian Population. Proteom. Clin. Appl. 2024, e202300238. [Google Scholar]
- Samodova, D.; Stankevic, E.; Søndergaard, M.S.; Hu, N.; Ahluwalia, T.S.; Witte, D.R.; Belstrøm, D.; Lubberding, A.F.; Jagtap, P.D.; Hansen, T.; et al. Salivary proteomics and metaproteomics identifies distinct molecular and taxonomic signatures of type-2 diabetes. Microbiome 2025, 13, 5. [Google Scholar] [CrossRef]
- Ricardo, S.J.; Araujo, M.Y.C.; dos Santos, L.L.; Romanzini, M.; Fernandes, R.A.; Turi-Lynch, B.C.; Codogno, J.S. Burden of metabolic syndrome on primary healthcare costs among older adults: A cross-sectional study. Sao Paulo Med. J. 2024, 142, e2023215. [Google Scholar] [CrossRef]
- Liu, J.; Li, Y.; Li, J.; Zheng, D.; Liu, C. Sources of Automatic Office Blood Pressure Measurement Error: A Systematic Review. Physiol. Meas. 2022, 43. [Google Scholar] [CrossRef]
- Geloneze, B.; Vasques, A.C.J.; Stabe, C.F.C.; Pareja, J.C.; de Lima Rosado, L.E.F.P.; De Queiroz, E.C.; Tambascia, M.A. HOMA1-IR and HOMA2-IR Indexes in Identifying Insulin Resistance and Metabolic Syndrome: Brazilian Metabolic Syndrome Study (BRAMS). Arq. Bras. Endocrinol. Metabol. 2009, 53, 281–287. [Google Scholar]
- Gong, R.; Liu, Y.; Luo, G.; Yang, L. Dietary Magnesium Intake Affects the Vitamin D Effects on HOMA-Beta and Risk of Pancreatic beta-Cell Dysfunction: A Cross-Sectional Study. Front. Nutr. 2022, 9, 84974. [Google Scholar] [CrossRef]
- da Silva, C.V.F.; Sade, Y.B.; Scapin, S.M.N.; Leite, P.E.C.; da Silva-Boghossian, C.M.; de Oliveira Santos, E. Relevance of Obesity and Overweight to Salivary and Plasma Proteomes of Human Young Adults From Brazil. Braz. J. Dev. 2022, 8, 13981–14001. [Google Scholar] [CrossRef]
- de Santos, E.O.; Alves, N., Jr.; Dias, G.M.; Mazotto, A.M.; Vermelho, A.; Vora, G.J.; Wilson, B.; Beltran, V.H.; Bourne, D.G.; Le Roux, F.; et al. Genomic and Proteomic Analyses of the Coral Pathogen Vibrio Coralliilyticus Reveal a Diverse Virulence Repertoire. ISME J. 2011, 5, 1471–1483. [Google Scholar] [CrossRef] [PubMed]
- da Silva, C.V.F.; Bacila Sade, Y.; Naressi Scapin, S.M.; da Silva-Boghossian, C.M.; de Oliveira Santos, E. Comparative Proteomics of Saliva of Healthy and Gingivitis Individuals From Rio de Janeiro. Proteom. Clin. Appl. 2023, 17, e2200098. [Google Scholar]
- Bradford, M.M. A Rapid and Sensitive Method for the Quantitation of Microgram Quantities of Protein Utilizing the Principle of Protein-dye Binding. Anal. Biochem. 1976, 72, 248–254. [Google Scholar] [CrossRef] [PubMed]
- Carnielli, C.M.; Macedo, C.C.S.; De Rossi, T.; Granato, D.C.; Rivera, C.; Domingues, R.R.; Pauletti, B.A.; Yokoo, S.; Heberle, H.; Busso-Lopes, A.F.; et al. Combining Discovery and Targeted Proteomics Reveals a Prognostic Signature in Oral Cancer. Nat. Commun. 2018, 9, 3598. [Google Scholar] [CrossRef]
- Halder, A.; Biswas, D.; Chauhan, A.; Saha, A.; Auromahima, S.; Yadav, D.; Nissa, M.U.; Iyer, G.; Parihari, S.; Sharma, G.; et al. A Large-Scale Targeted Proteomics of Serum and Tissue Shows the Utility of Classifying High Grade and Low Grade Meningioma Tumors. Clin. Proteom. 2023, 20, 41. [Google Scholar] [CrossRef] [PubMed]
- Silva, J.C.; Gorenstein, M.V.; Li, G.Z.; Vissers, J.P.; Geromanos, S.J. Absolute Quantification of Proteins by LC-MSE: A Virtue of Parallel MS Acquisition. Mol. Cell. Proteom. 2006, 5, 144–156. [Google Scholar]
- Villén, J.; Gygi, S.P. The SCX/IMAC Enrichment Approach for Global Phosphorylation Analysis by Mass Spectrometry. Nat. Protoc. 2008, 3, 1630–1638. [Google Scholar] [CrossRef]
- Ahrné, E.; Molzahn, L.; Glatter, T.; Schmidt, A. Critical Assessment of Proteome-Wide Label-Free Absolute Abundance Estimation Strategies. Proteomics 2013, 13, 2567–2578. [Google Scholar] [CrossRef]
- Hinkle, D.E.; Wiersma, W.; Jurs, S.G. Applied Statistics for the Behavioral Sciences, 5th ed.; Houghton Mifflin: Boston, MA, USA, 2003; p. 756. [Google Scholar]
- Wei, T.; Simko, V. R Package ‘corrplot’: Visualization of a Correlation Matrix, 2021.
- Stoessel, D.; Stellmann, J.-P.; Willing, A.; Behrens, B.; Rosenkranz, S.C.; Hodecker, S.C.; Stürner, K.H.; Reinhardt, S.; Fleischer, S.; Deuschle, C.; et al. Metabolomic Profiles for Primary Progressive Multiple Sclerosis Stratification and Disease Course Monitoring. Front. Hum. Neurosci. 2018, 12, 226. [Google Scholar] [CrossRef]
- Breiman, L. Random Forests. Mach. Learn. 2001, 45, 5–32. [Google Scholar] [CrossRef]
- Sun, T.H.; Wang, C.-C.; Wu, Y.-L.; Hsu, K.-C.; Lee, T.-H. Machine Learning Approaches for Biomarker Discovery to Predict Large-Artery Atherosclerosis. Sci. Rep. 2023, 13, 15139. [Google Scholar] [CrossRef]
- Alladio, E.; Trapani, F.; Castellino, L.; Massano, M.; Di Corcia, D.; Salomone, A.; Berrino, E.; Ponzone, R.; Marchiò, C.; Sapino, A.; et al. Enhancing Breast Cancer Screening With Urinary Biomarkers and Random Forest Supervised Classification: A Comprehensive Investigation. J. Pharm. Biomed. Anal. 2024, 244, 116113. [Google Scholar] [CrossRef]
- Rohart, F.; Gautier, B.; Singh, A.; Lê Cao, K.-A. mixOmics: An R Package for ‘omics Feature Selection and Multiple Data Integration. PLoS Comput. Biol. 2017, 13, e1005752. [Google Scholar] [CrossRef] [PubMed]
- Sedghi, L.; DiMassa, V.; Harrington, A.; Lynch, S.V.; Kapila, Y.L. The oral microbiome: Role of key organisms and complex networks in oral health and disease. Periodontology 2000 2021, 87, 107–131. [Google Scholar] [CrossRef] [PubMed]
- Ghaouas, S.; Chala, S. The Oral Bacteriome. Microbiol. Res. 2025, 16, 194. [Google Scholar] [CrossRef]
- Qadir, R.M.; Assafi, M.S. The association between body mass index and the oral Firmicutes and Bacteroidetes profiles of healthy individuals. Malays. Fam. Physician 2021, 16, 36. [Google Scholar] [CrossRef]
- da Silva, C.J.F.; Silva, C.V.F.D.; Cardoso, A.M.; de Oliveira Santos, E. Exploring clinical parameters and salivary microbiome profiles associated with metabolic syndrome in a population of Rio de Janeiro, Brazil. Arch. Oral Biol. 2025, 175, 106251. [Google Scholar] [CrossRef]
- Abusleme, L.; Dupuy, A.K.; Dutzan, N.; Silva, N.; Burleson, J.A.; Strausbaugh, L.D.; Gamonal, J.; Diaz, P.I. The subgingival microbiome in health and periodontitis and its relationship with community biomass and inflammation. ISME J. 2013, 7, 1016. [Google Scholar] [CrossRef]
- Bradshaw, D.J.; Marsh, P.D.; Watson, G.K.; Allison, C. Role of Fusobacterium nucleatum and Coaggregation in Anaerobe Survival in Planktonic and Biofilm Oral Microbial Communities during Aeration. Infect. Immun. 1998, 66, 4729–4732. [Google Scholar] [CrossRef]
- Rajasekaran, J.J.; Krishnamurthy, H.K.; Bosco, J.; Jayaraman, V.; Krishna, K.; Wang, T.; Bei, K. Oral Microbiome: A Review of Its Impact on Oral and Systemic Health. Microorganisms 2024, 12, 1797. [Google Scholar] [CrossRef]
- Fan, Z.; Tang, P.; Li, C.; Yang, Q.; Xu, Y.; Su, C.; Li, L. Fusobacterium nucleatum and its associated systemic diseases: Epidemiologic studies and possible mechanisms. J. Oral Microbiol. 2022, 15, 2145729. [Google Scholar] [CrossRef]
- Panda, S.; Gekara, N.O. The deubiquitinase MYSM1 dampens NOD2-mediated inflammation and tissue damage by inactivating the RIP2 complex. Nat. Commun. 2018, 9, 4654. [Google Scholar] [CrossRef]
- Tian, M.; Liu, W.; Zhang, Q.; Huang, Y.; Li, W.; Wang, W.; Zhao, P.; Huang, S.; Song, Y.; Shereen, M.A.; et al. MYSM1 Represses Innate Immunity and Autoimmunity through Suppressing the cGAS-STING Pathway. Cell Rep. 2020, 33, 108297. [Google Scholar] [CrossRef]
- Chen, X.; Wang, W.; Li, Y.; Huo, Y.; Zhang, H.; Feng, F.; Xi, W.; Zhang, T.; Gao, J.; Yang, F.; et al. MYSM1 inhibits human colorectal cancer tumorigenesis by activating miR-200 family members/CDH1 and blocking PI3K/AKT signaling. J. Exp. Clin. Cancer Res. 2021, 40, 341. [Google Scholar] [CrossRef] [PubMed]
- Elding Larsson, H.; Lundgren, M.; Jonsdottir, B.; Cuthbertson, D.; Krischer, J.; DiAPREV-IT Study Group. Safety and efficacy of autoantigen-specific therapy with 2 doses of alum-formulated glutamate decarboxylase in children with multiple islet autoantibodies and risk for type 1 diabetes: A randomized clinical trial. Pediatr. Diabetes 2018, 19, 410–419. [Google Scholar] [CrossRef] [PubMed]
- Heath, K.E.; Feduska, J.M.; Taylor, J.P.; Houp, J.A.; Botta, D.; Lund, F.E.; Mick, G.J.; McGwin, G.; McCormick, K.L.; Tse, H.M. GABA and Combined GABA with GAD65-Alum Treatment Alters Th1 Cytokine Responses of PBMCs from Children with Recent-Onset Type 1 Diabetes. Biomedicines 2023, 11, 1948. [Google Scholar] [CrossRef] [PubMed]
- Martin, A.; Mick, G.J.; Choat, H.M.; Lunsford, A.A.; Tse, H.M.; McGwin, G.G.; McCormick, K.L. A randomized trial of oral gamma aminobutyric acid (GABA) or the combination of GABA with glutamic acid decarboxylase (GAD) on pancreatic islet endocrine function in children with newly diagnosed type 1 diabetes. Nat. Commun. 2022, 13, 7928. [Google Scholar] [CrossRef] [PubMed]
- Hampe, C.S.; Maitland, M.E.; Gilliam, L.K.; Phan, T.-H.T.; Sweet, I.R.; Radtke, J.R.; Bota, V.; Ransom, B.R.; Hirsch, I.B. High titers of autoantibodies to glutamate decarboxylase in type 1 diabetes patients: Epitope analysis and inhibition of enzyme activity. Endocr. Pract. 2013, 19, 663–668. [Google Scholar] [CrossRef] [PubMed]
- Choat, H.M.; Martin, A.; Mick, G.J.; Heath, K.E.; Tse, H.M.; McGwin, G., Jr.; McCormick, K.L. Effect of gamma aminobutyric acid (GABA) or GABA with glutamic acid decarboxylase (GAD) on the progression of type 1 diabetes mellitus in children: Trial design and methodology. Contemp. Clin. Trials 2019, 82, 93–100. [Google Scholar] [CrossRef] [PubMed]
- Louraki, M.; Katsalouli, M.; Kanaka-Gantenbein, C.; Kafassi, N.; Critselis, E.; Kallinikou, D.; Tsentidis, C.; Karavanaki, K. The prevalence of early subclinical somatic neuropathy in children and adolescents with Type 1 diabetes mellitus and its association with the persistence of autoantibodies to glutamic acid decarboxylase (GAD) and islet antigen-2 (IA-2). Diabetes Res. Clin. Pract. 2016, 117, 82–90. [Google Scholar] [CrossRef]
- Nocentini, A.; Supuran, C.T.; Capasso, C. An overview on the recently discovered iota-carbonic anhydrases. J. Enzym. Inhib. Med. Chem. 2021, 36, 1988–1995. [Google Scholar] [CrossRef]
- Waleed, A.; Rashed, M.; Nocentini, A.; Bonardi, A.; Abd-Alhaseeb, M.M.; Al-Rashood, S.T.; Veerakanellore, G.B.; Majrashi, T.A.; Elkaeed, E.B.; Elgendy, B.; et al. Identification of new 4-(6-oxopyridazin-1- yl) benzenesulfonamides as multi-target anti-inflammatory agents targeting carbonic anhydrase, COX-2 and 5-LOX enzymes: Synthesis, biological evaluations and modelling insights. J. Enzym. Inhib. Med. Chem. 2023, 38, 2201407. [Google Scholar]
- Rohm, T.V.; Meier, D.T.; Olefsky, J.M.; Donath, M.Y. Inflammation in obesity, diabetes, and related disorders. Immunity 2022, 55, 31–55. [Google Scholar] [CrossRef]
- Lamy, E.; Simões, C.; Rodrigues, L.; Costa, A.R.; Vitorino, R.; Amado, F.; Antunes, C.; do Carmo, I. Changes in the salivary protein profile of morbidly obese women either previously subjected to bariatric surgery or not. J. Physiol. Biochem. 2015, 71, 691–702. [Google Scholar] [CrossRef]
- Suthi, S.; Gopi, D.; Chaudhary, A.; Sarma, P.V.G.K. The Therapeutic Potential of 4-Methoxy-1-methyl-2-oxopyridine-3-carbamide (MMOXC) Derived from Ricinine on Macrophage Cell Lines Infected with Methicillin-Resistant Strains of Staphylococcus aureus. Appl. Biochem. Biotechnol. 2023, 195, 2843–2862. [Google Scholar] [CrossRef]
- Swarupa, V.; Chaudhury, A.; Krishna Sarma, P.V. Effect of 4-methoxy 1-methyl 2-oxopyridine 3-carbamide on Staphylococcus aureus by inhibiting UDP-MurNAc-pentapeptide, peptidyl deformylase and uridine monophosphate kinase. J. Appl. Microbiol. 2017, 122, 663–675. [Google Scholar] [CrossRef]
- Emeka, P.M.; Badger-Emeka, L.I.; Thirugnanasambantham, K. Virtual Screening and Meta-Analysis Approach Identifies Factors for Inversion Stimulation (Fis) and Other Genes Responsible for Biofilm Production in Pseudomonas aeruginosa: A Corneal Pathogen. Curr. Issues Mol. Biol. 2024, 46, 12931–12950. [Google Scholar] [CrossRef]
- Zhao, M.; Zhang, H.; Liu, G.; Wang, L.; Wang, J.; Gao, Z.; Dong, Y.; Zhang, L.; Gong, Y. Structural Insights into the Methylation of C1402 in 16S rRNA by Methyltransferase RsmI. PLoS ONE 2016, 11, e0163816. [Google Scholar] [CrossRef]
- Xu, X.; Zhang, H.; Huang, Y.; Zhang, Y.; Wu, C.; Gao, P.; Teng, Z.; Luo, X.; Peng, X.; Wang, X.; et al. Beyond a Ribosomal RNA Methyltransferase, the Wider Role of MraW in DNA Methylation, Motility and Colonization in Escherichia coli O157:H7. Front. Microbiol. 2019, 10, 2520. [Google Scholar] [CrossRef]
- Zou, J.; Zhang, W.; Zhang, H.; Zhang, X.D.; Peng, B.; Zheng, J. Studies on aminoglycoside susceptibility identify a novel function of KsgA to secure translational fidelity during antibiotic stress. Antimicrob. Agents Chemother. 2018, 62, e00853-18. [Google Scholar] [CrossRef]
- Ren, X.; Zou, L.; Lu, J.; Holmgren, A. Selenocysteine in mammalian thioredoxin reductase and application of ebselen as a therapeutic. Free Radic. Biol. Med. 2018, 127, 238–247. [Google Scholar] [CrossRef]
- May, H.C.; Yu, J.-J.; Zhang, H.; Wang, Y.; Cap, A.P.; Chambers, J.P.; Guentzel, M.N.; Arulanandam, B.P. Thioredoxin-A is a virulence factor and mediator of the type IV pilus system in Acinetobacter baumannii. PLoS ONE 2019, 14, e0218505. [Google Scholar] [CrossRef] [PubMed]
- Balsera, M.; Buchanan, B.B. Evolution of the thioredoxin system as a step enabling adaptation to oxidative stress. Free Radic. Biol. Med. 2019, 140, 28–35. [Google Scholar] [CrossRef]
- He, J.; Liu, S.; Fang, Q.; Gu, H.; Hu, Y. The Thioredoxin System in Edwardsiella piscicida Contributes to Oxidative Stress Tolerance, Motility, and Virulence. Microorganisms 2023, 11, 827. [Google Scholar] [CrossRef] [PubMed]
- Lee, S.; Kim, S.M.; Lee, R.T. Thioredoxin and thioredoxin target proteins: From molecular mechanisms to functional significance. Antioxid. Redox Signal. 2013, 18, 1165–1207. [Google Scholar] [CrossRef] [PubMed]
Figure 1.
Random Forest (RF) Analysis of Top 10 Human and Bacterial Proteins. Heatmaps, combined with the RF models, visually illustrate the relative expression levels of each feature across the study groups. Panel (a) displays the Mean Decrease in Accuracy (MDA) plot for human proteins, highlighting the most influential features for group separation. Similarly, panel (b) presents the MDA plot for bacterial protein profiles. The accession codes for the identified proteins are provided in Supplementary Table S1 (human proteins) and Supplementary Table S2 (bacterial proteins). Proteins name: Q9HC52(Chromobox protein homolog 8), P04264(Keratin, type II cytoskeletal 1), Q5VVJ2(Deubiquitinase MYSM1), P0408 (Cystatin-B), P01037(Cystatin-SN), P23280(Carbonic anhydrase 6), Q9Y2G2(Caspase recruitment domain-containing protein 8), Q05329(Glutamate decarboxylase 2), P06870(Kallikrein-1), P07737(Profilin-1), D1BAA5(Bifunctional NAD(P)H-hydrate repair enzyme Nnr (Nicotinamide nucleotide repair protein), A5UZS9(Ribosomal RNA(small subunit methyltransferase H), P07887Thioredoxin C-2), Q8RF94(Shikimate kinase), A1R525(Polyribonucleotide nucleotidyltransferase), Q9F326(Superoxide dismutase [Mn/Fe]), Q8R6G5(Uridylate kinase), A9AWD5((+)-kolavenyl diphosphate synthase), B0SBX0(Aspartate 1-decarboxylase) and A6LCQ4(Hydroxylamine reductase). The study groups are defined as follows: NW (Group 1), OW (Group 2), OB (Group 3), MetS (Group 4), and T2DM (Group 5).
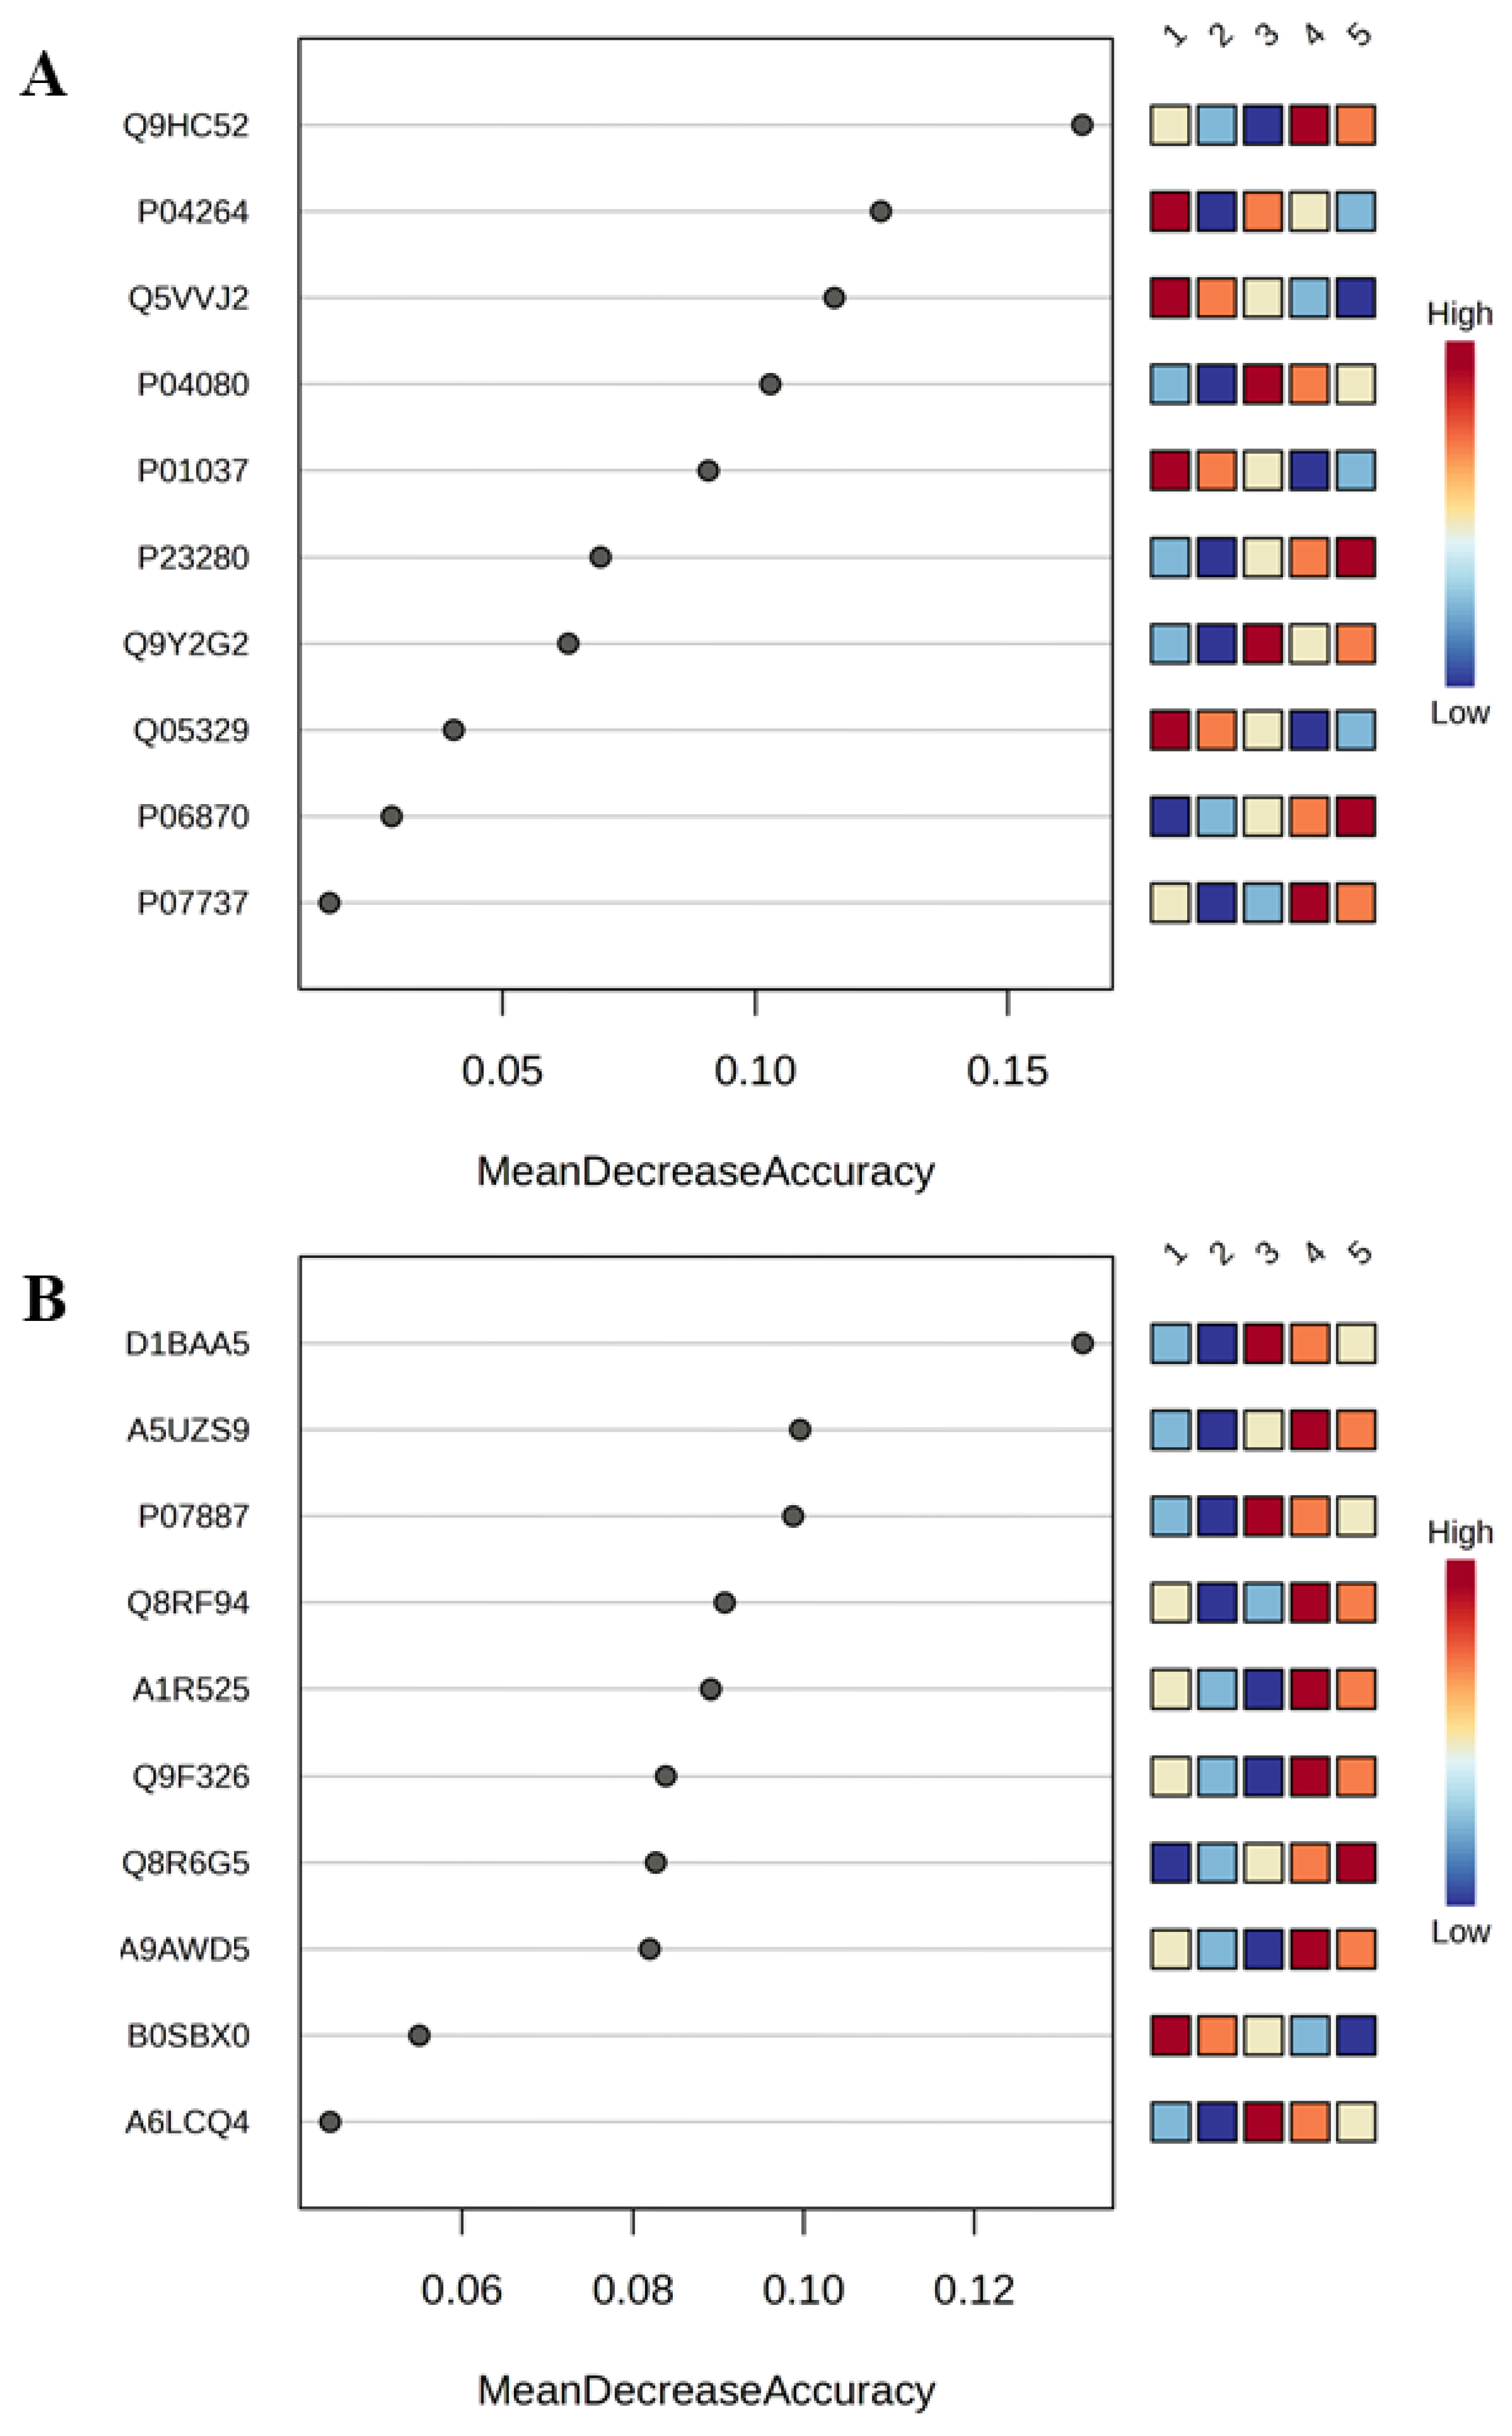
Figure 2.
PLS-DA Score Plots. The Partial Least Squares Discriminant Analysis (PLS-DA) score plots demonstrate distinct separations between study groups based on (A) human protein profiles (Q2 = 0.75; R2 = 0.68; Accuracy = 0.59 with 2 components) and (B) bacterial protein profiles (Q2 = 0.66; R2 = 0.60; Accuracy = 0.69 with 2 components). The study groups are defined as follows: NW (Group 1), OW (Group 2), OB (Group 3), MetS (Group 4), and T2DM (Group 5).
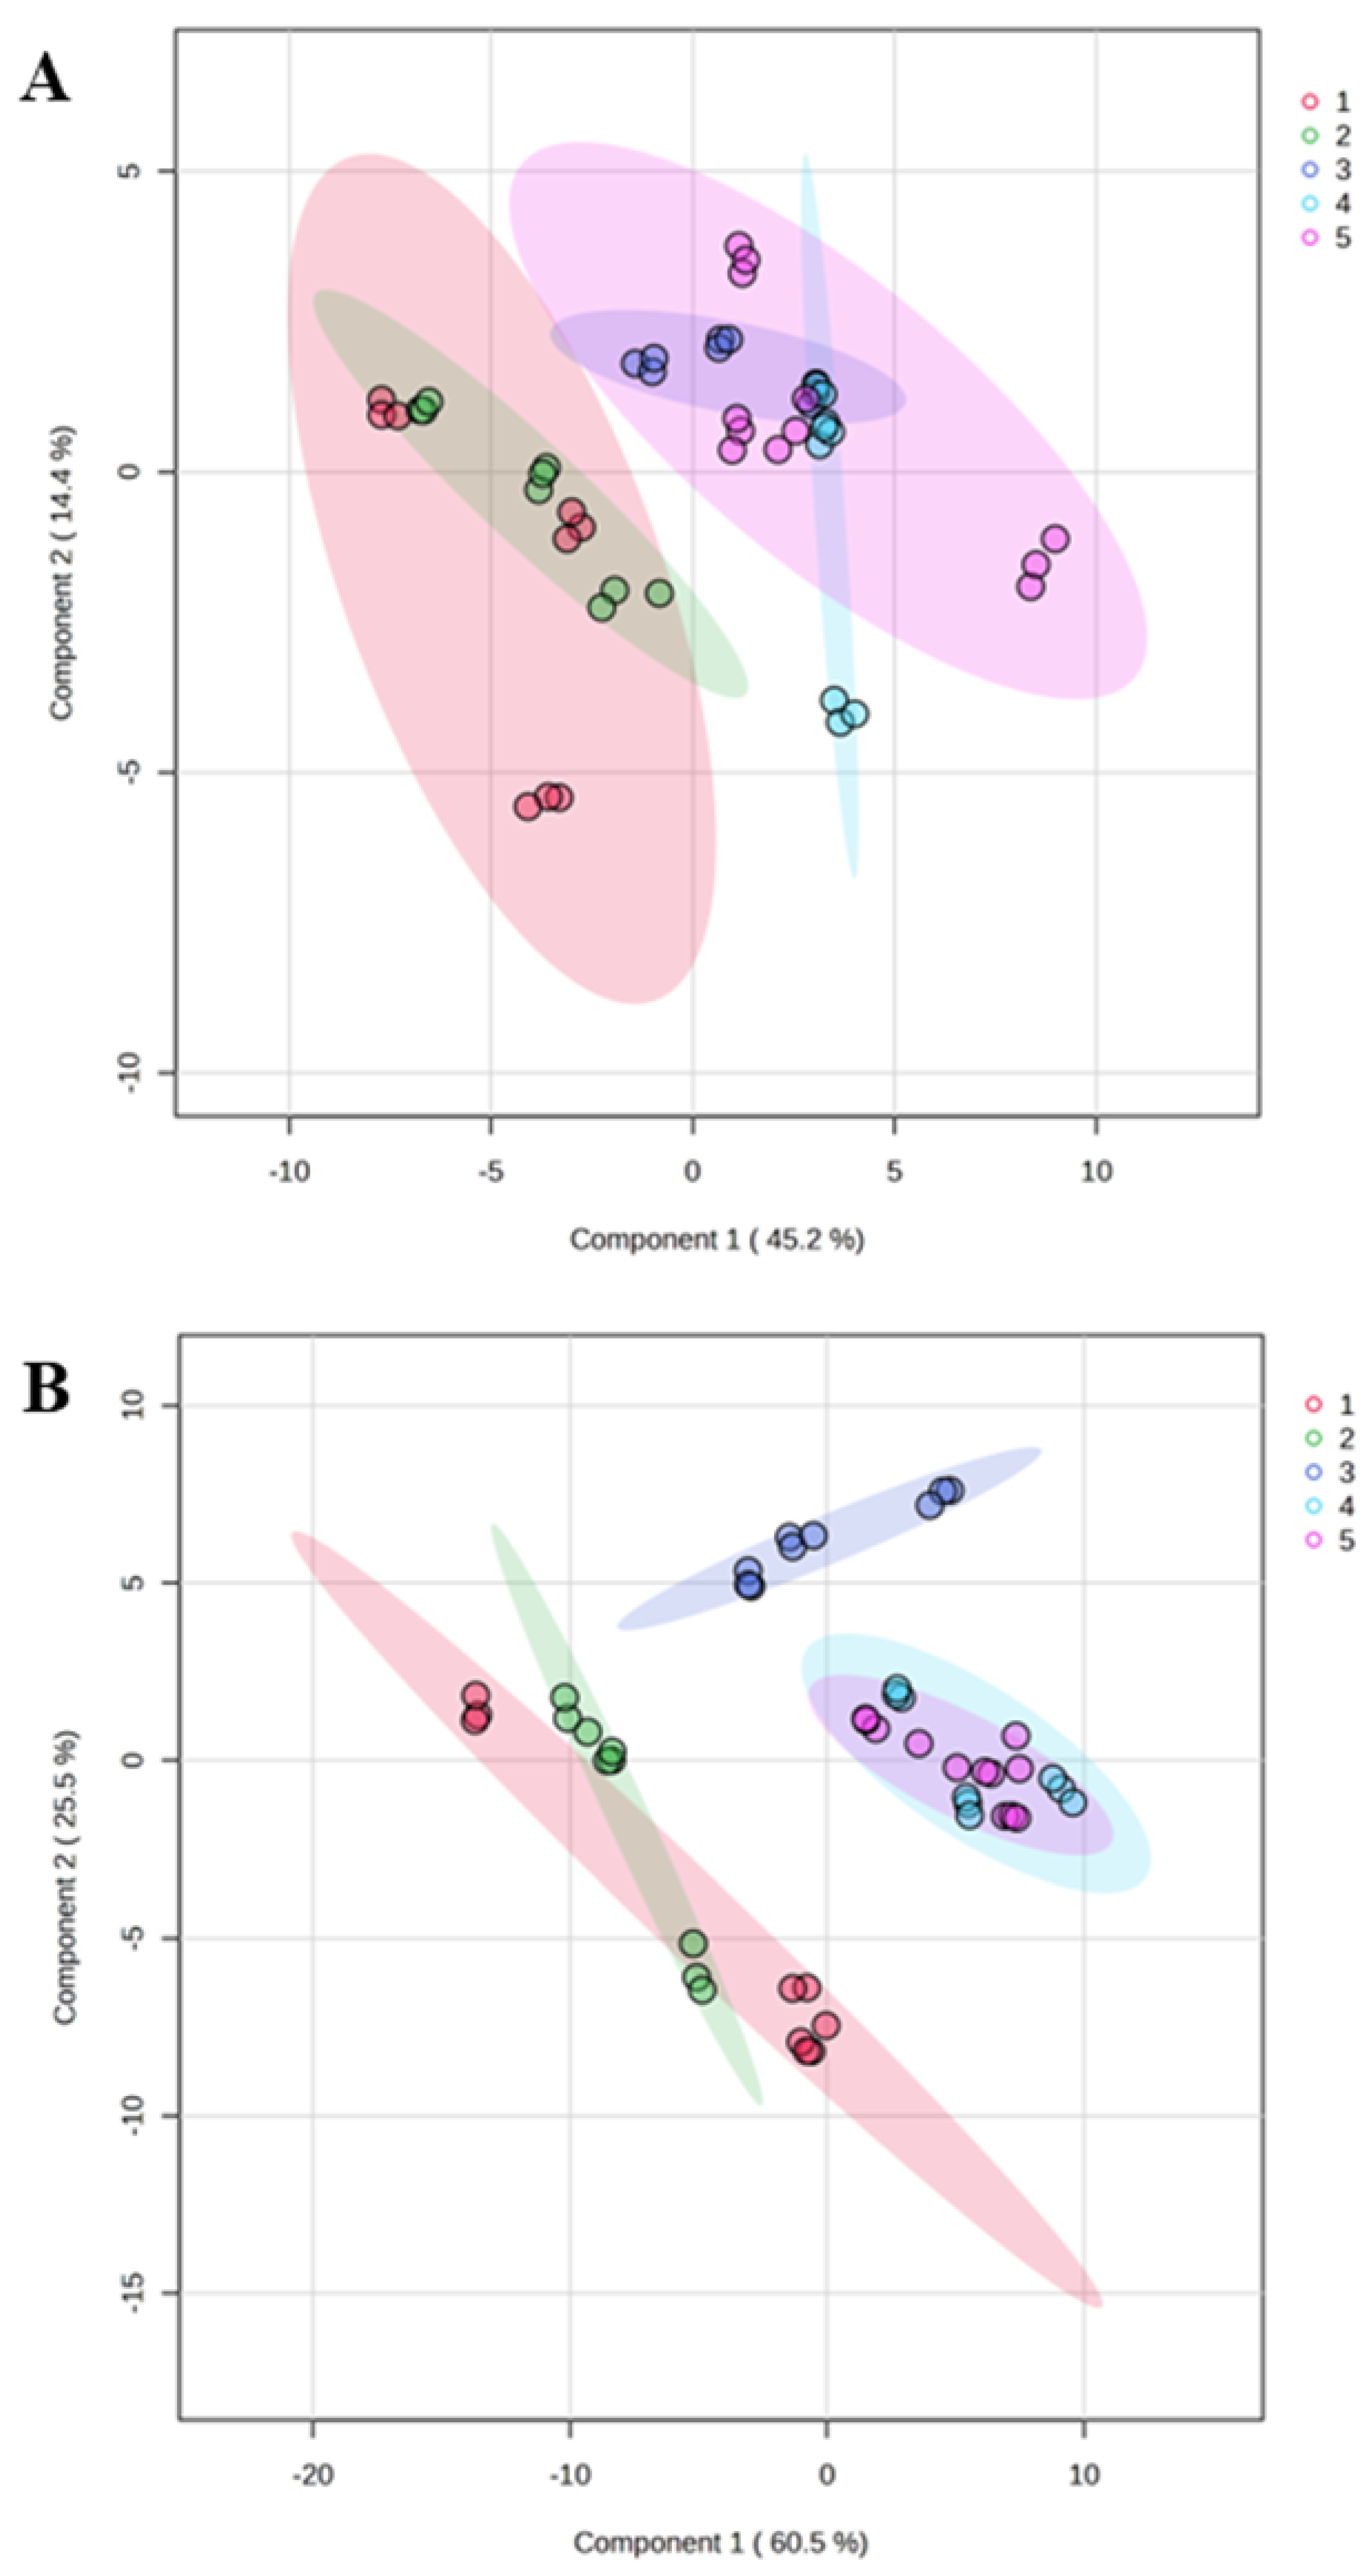
Figure 3.
The figure illustrates the interactome analysis between the top 10 human and bacterial proteins. The Circos plot visually represents the interactions between human and bacterial proteins, with green lines indicating positive correlations and black lines denoting negative correlations. Proteins name:Q9HC52(Chromobox protein homolog 8), P04264(Keratin, type II cytoskeletal 1), Q5VVJ2(Deubiquitinase MYSM1), P0408(Cystatin-B), P01037(Cystatin-SN), P23280(Carbonic anhydrase 6), Q9Y2G2(Caspase recruitment domain-containing protein 8), Q05329(Glutamate decarboxylase 2), P06870(Kallikrein-1), P07737(Profilin-1), D1BAA5(Bifunctional NAD(P)H-hydrate repair enzyme Nnr (Nicotinamide nucleotide repair protein), A5UZS9(Ribosomal RNA(small subunit methyltransferase H), P07887Thioredoxin C-2), Q8RF94(Shikimate kinase), A1R525(Polyribonucleotide nucleotidyltransferase), Q9F326(Superoxide dismutase [Mn/Fe]), Q8R6G5(Uridylate kinase), A9AWD5 ((+)-kolavenyl diphosphate synthase), B0SBX0(Aspartate 1-decarboxylase) and A6LCQ4(Hydroxylamine reductase).
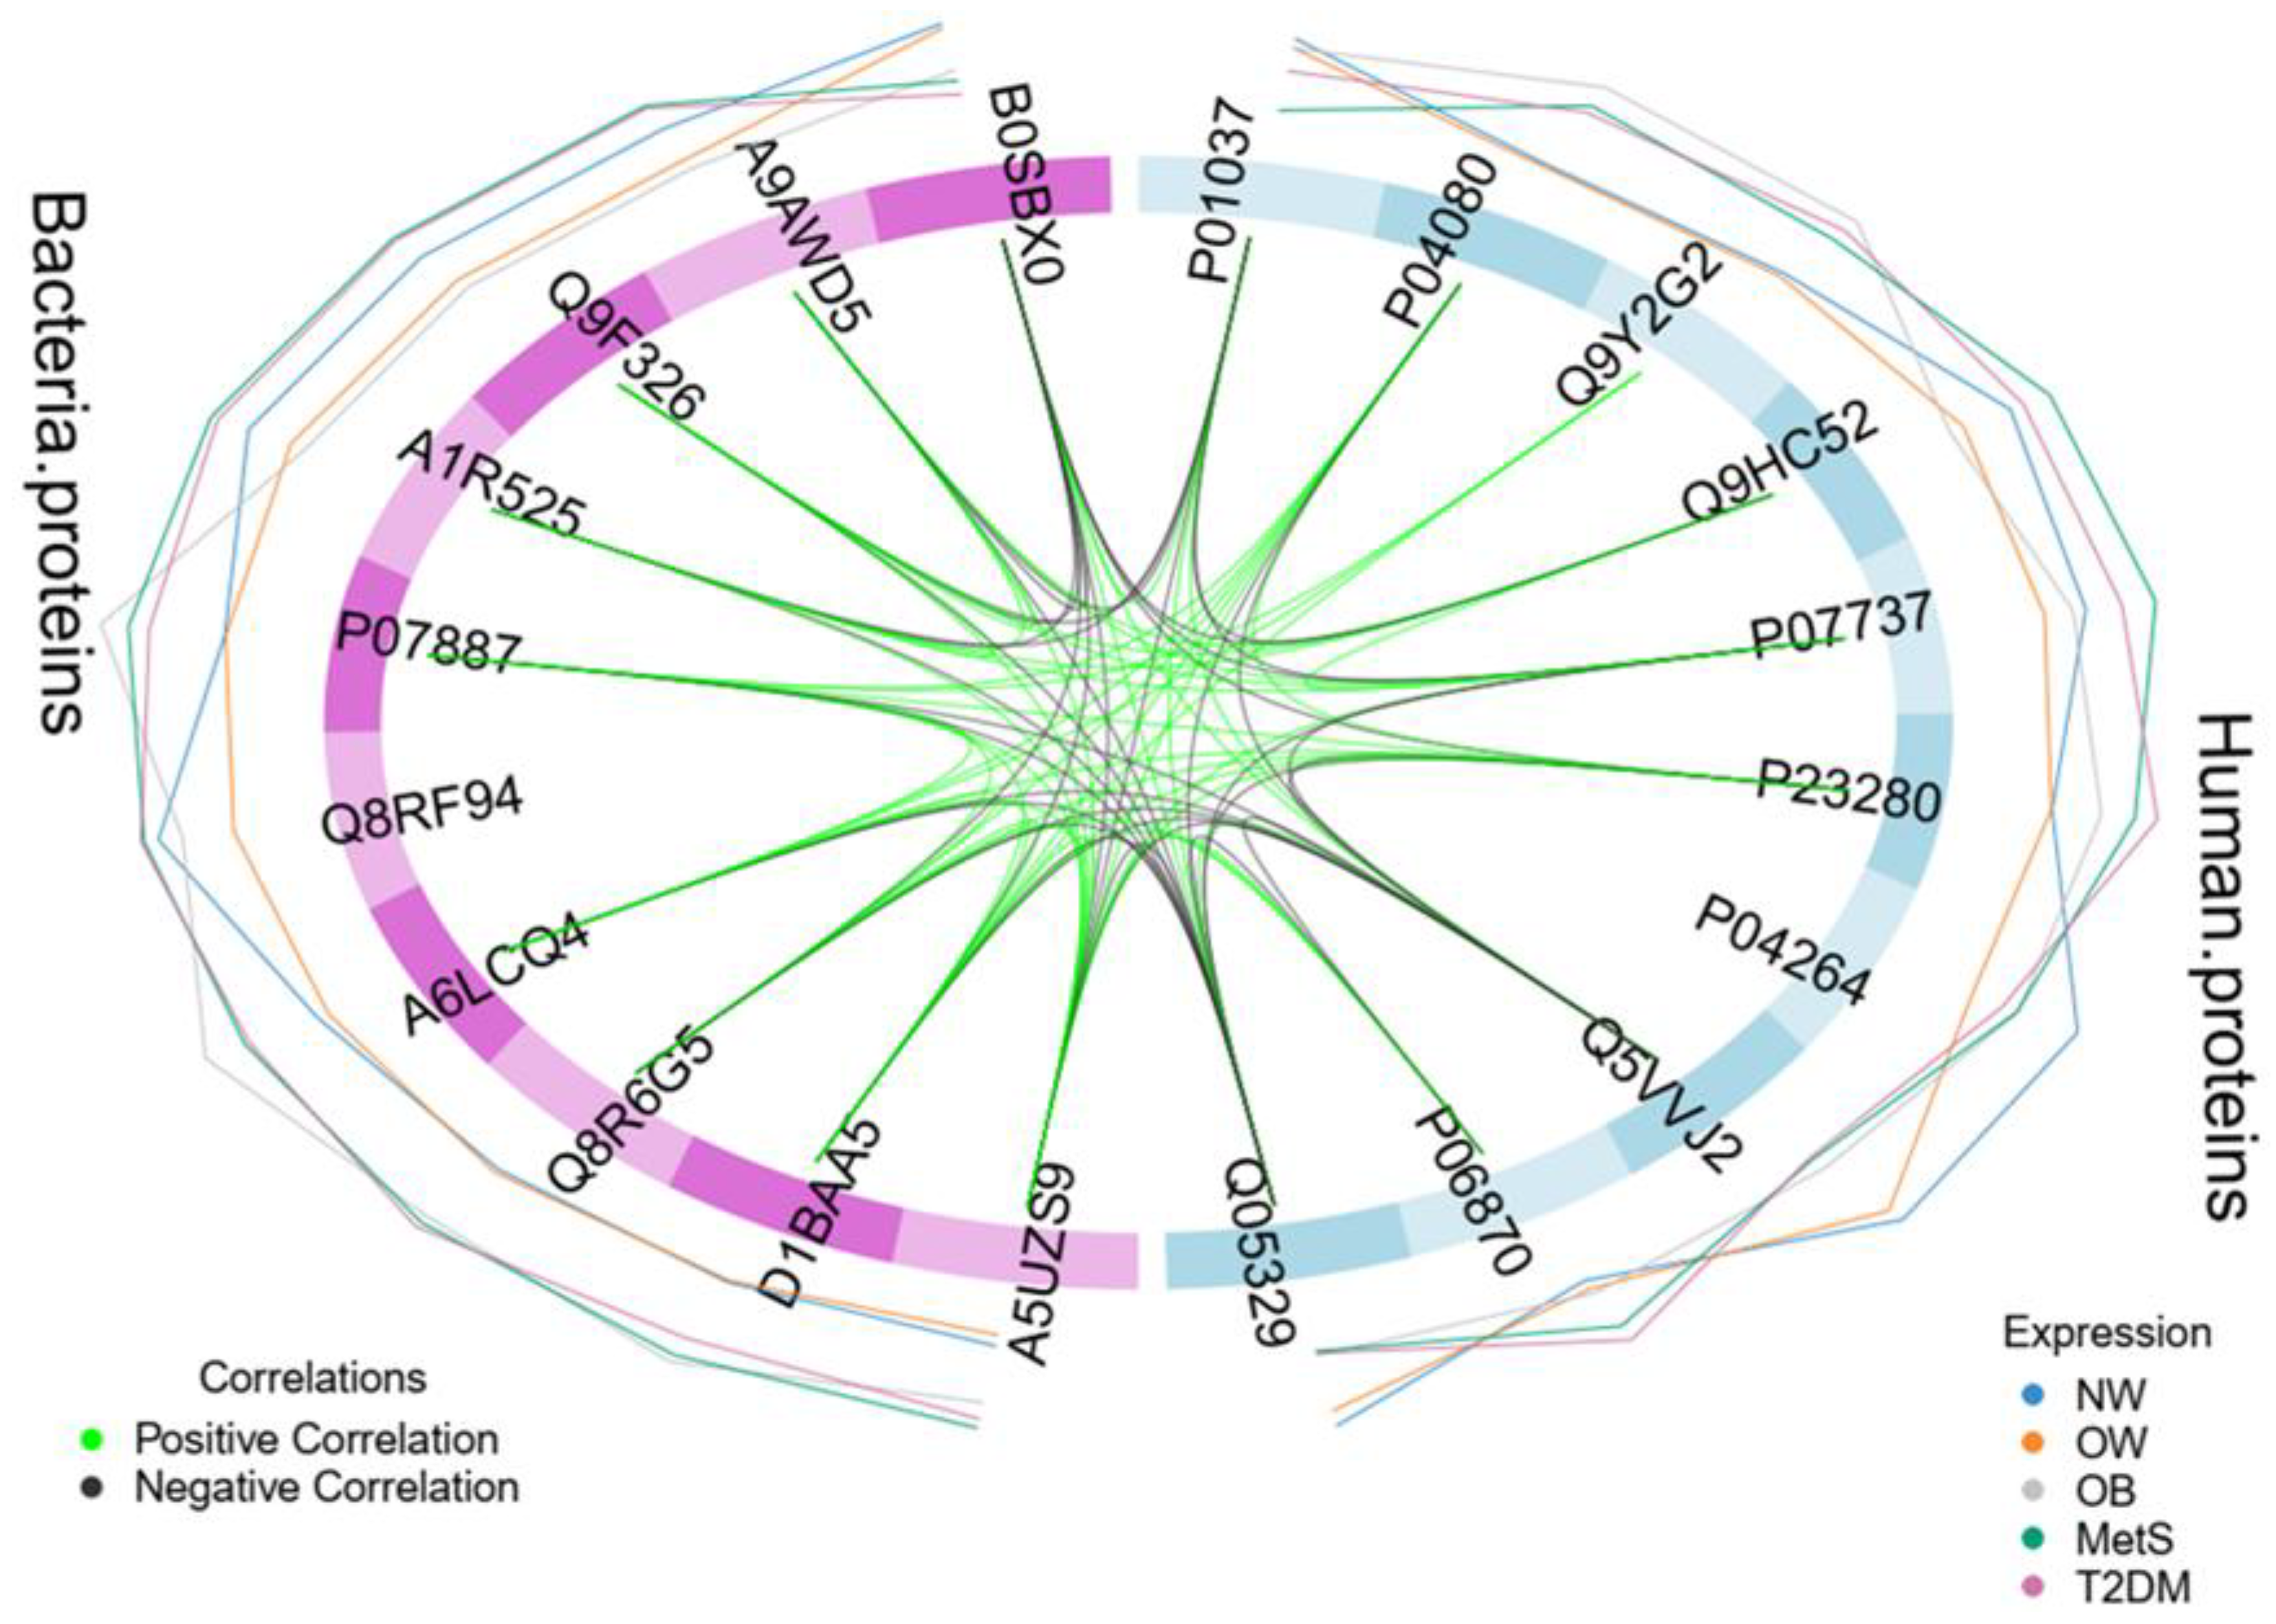
Figure 4.
Interaction between Human and Bacterial Proteins Associated with Metabolic Disorders. The diagram illustrates the functional synergy between human (MYSM1, GAD65) and bacterial (TrxC-2, UMPK, RsmH) proteins, highlighting the CA6 protein as the intersection point. Decreased human proteins are associated with glycemic dysfunction and inflammation, while increased bacterial proteins contribute to oxidative stress and microbial virulence. The mutual interaction, mediated by an acidic environment, promotes chronic inflammation and is correlated with increased insulin resistance (HOMA-IR).
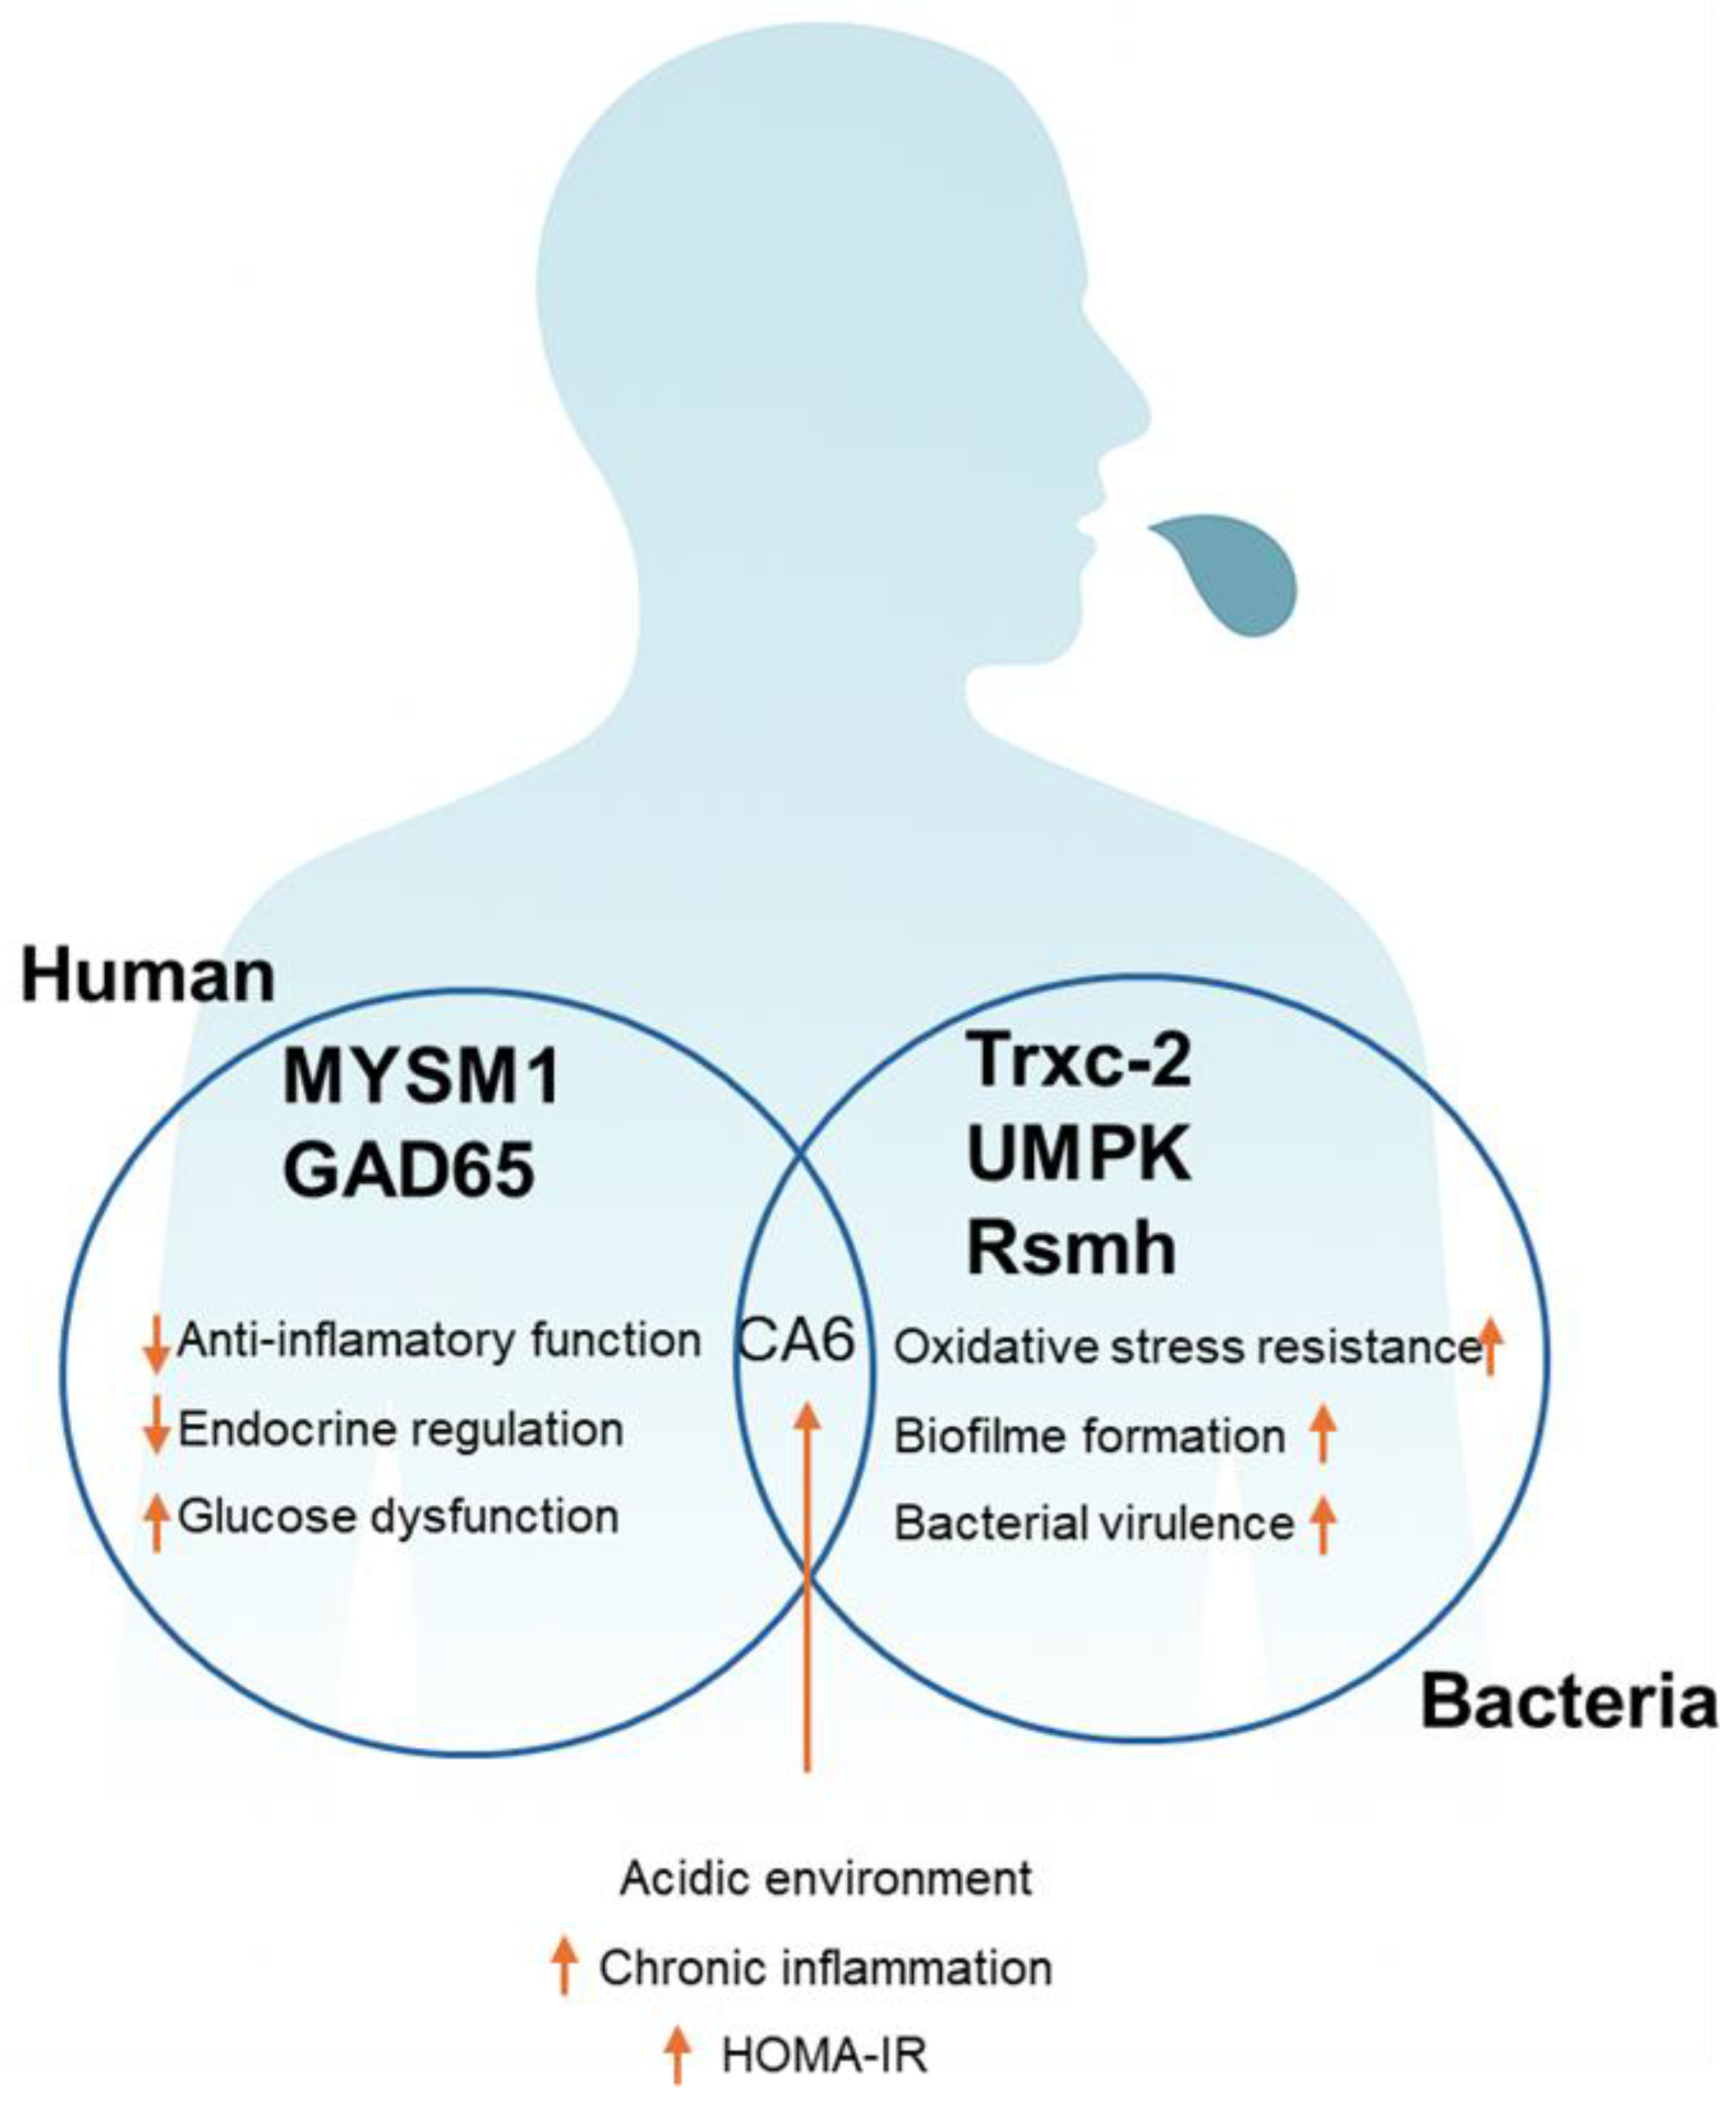
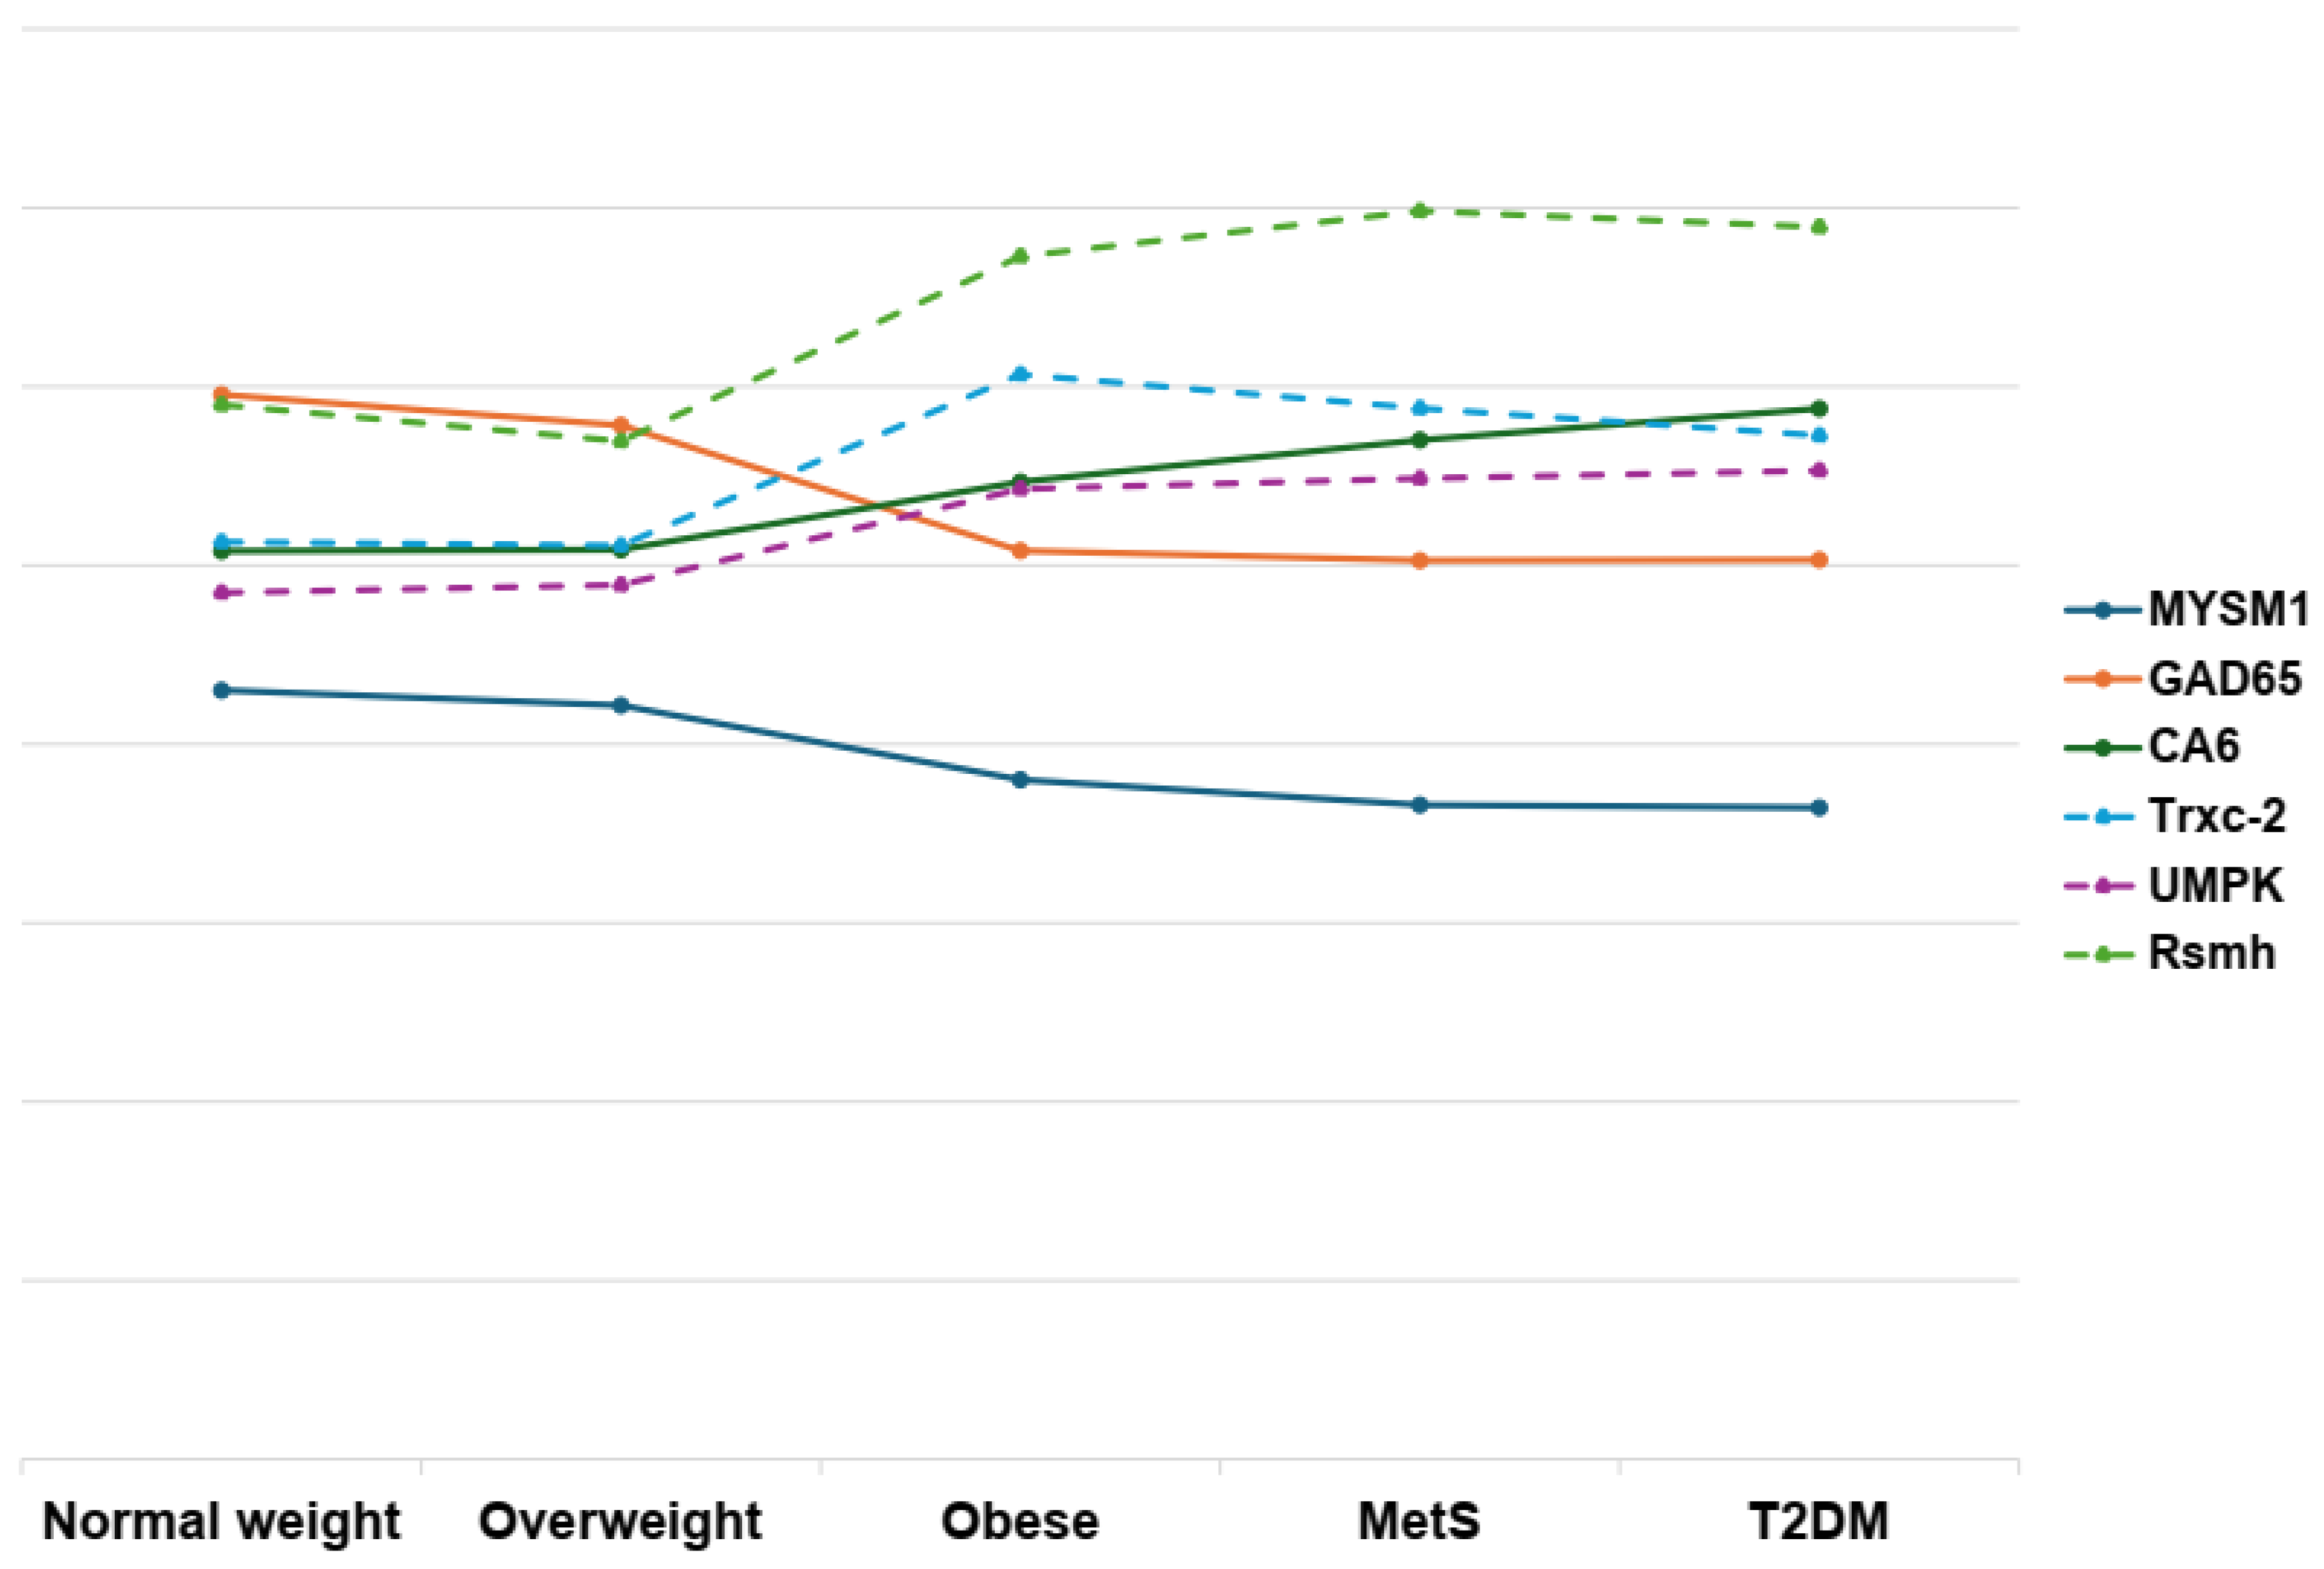
Figure 5.
This diagram depicts the intricate network of interactions between human (solid lines) and bacterial (dashed lines) proteins, and how these connections relate to obesity, metabolic syndrome, and type 2 diabetes. The visualization underscores the multifactorial nature of these conditions, highlighting the potential roles and interdependencies of diverse protein profiles. All values were logarithmically transformed to improve comparability and facilitate visualization across variables measured in different units.
Disclaimer/Publisher’s Note: The statements, opinions and data contained in all publications are solely those of the individual author(s) and contributor(s) and not of MDPI and/or the editor(s). MDPI and/or the editor(s) disclaim responsibility for any injury to people or property resulting from any ideas, methods, instructions or products referred to in the content. |
© 2026 by the authors. Licensee MDPI, Basel, Switzerland. This article is an open access article distributed under the terms and conditions of the Creative Commons Attribution (CC BY) license (http://creativecommons.org/licenses/by/4.0/).
Copyright: This open access article is published under a Creative Commons CC BY 4.0 license, which permit the free download, distribution, and reuse, provided that the author and preprint are cited in any reuse.


