
Submitted:
15 January 2026
Posted:
23 January 2026
You are already at the latest version
Abstract
This paper introduces a data-driven anomaly detection framework designed to enhance the safety and reliability of lithium-ion battery packs deployed in large-scale electric transport systems. Leveraging principal component analysis (PCA) and cumulative sum (CUSUM) control charts, the method monitors mean-based residuals of voltage and temperature across cell groups to detect early-stage faults such as internal short circuits, sensor failures, and thermal irregularities. Experimental validation using real-world data from a battery-electric locomotive demonstrates the system’s ability to identify anomalies with deviations as low as 4mV and 0.15°C while maintaining a falsepositive rate below 3%. The approach reduces detection time by 56% and missed anomalies by 60% compared to conventional thresholding methods. By integrating real-time fault diagnosis into battery management systems, this work contributes directly to the advancement of safe, durable, and sustainable battery manufacturing and energy storage deployment in heavy-duty electric mobility.
Keywords:
anomaly detection
; battery safety
; principal component analysis
; lithium-ion batteries
; fault diagnosis
; electric transport
; CUSUM control chart
; thermal monitoring
1. Introduction
The most used energy storage system in electric vehicles, grid storage systems, and heavy-duty transport is lithium-ion battery batteries on account of their high energy density, long cycle life and decreasing cost. Safety issues are a critical hurdle to wide deployment, especially in the case of heavy-duty ones such as electric locomotives, buses, and ships. Incidents of thermal runaway, which can be caused by an internal short circuit, overcharging, manufacturing defect, can cause catastrophic failures with more economic and safety consequences. To prevent the propagation of fault and timely maintenance, the early detection of anomalous behavior is, therefore, critical. It also ensures operational reliability in demanding transport environments.
Conventional fault detection techniques commonly used in battery systems are model-based fault detection methods that use an electrochemical or equivalent circuit model. Despite being effective in controlled settings, they struggle in real-life scenarios owing to variations between cells, their aging effect, and variations in environment. Techniques that rely on models come with massive computational demands when applied to large battery packs containing hundreds or thousands of cells. Therefore, real-time implementation is very challenging in practice. In addition to this, various techniques out there today are designed to detect certain fault types and may not perform when multiple fault anomalies happen concurrently or when fault signatures change over time.
Using data-driven methods to reconfigure cells could prove to be a potential solution. These methods use the statistical relationships that exist between the various measurements taken from a cell to detect deviations from normal operation without requiring extensive physical model details. Principal component analysis is one of the powerful data-driven techniques for dimensionality reduction and anomaly detection in multivariate systems. PCA converts the correlated measurement into uncorrelated principal components and helps to efficiently monitor the system health using residuals. Methods based on principal component analysis, when used together with techniques of statistical process control like cumulative sum control charts, can detect subtle anomalies that simple thresholding may overlook.
This study proposes comprehensive anomaly detection framework that employs CUSUM monitoring for a mean value based on residuals. More specifically, researchers’ technique employs CUSUM monitoring for both voltage and temperature signals (PCA). The method proposed mitigates drawbacks of existing methods in handling anomalies occurring at the same time, adapting to events such as balancing of cells, and detection, and localization. A battery– electric locomotive is used for experimental validation, a realistic large scale application with high safety requirements. The framework is assessed against the classical direct thresholding techniques for a number of fault types; internal short circuit, sensor fault, and thermal fault.
The contributions of this work are threefold: first, we develop a robust PCA-CUSUM framework that operates on mean-based residuals to reduce sensitivity to aging and environmental variations; second, we provide extensive experimental validation using real-world data from heavy-duty transport applications; third, we demonstrate significant performance improvements over conventional methods in terms of detection time, false negative rate, and missed anomaly rate. The remainder of this paper is organized as follows: Section 2 reviews related work in battery fault detection; Section 4 presents the proposed methodology; Section 5 describes the experimental setup and data collection; Section 6 presents and analyzes the results; Section 7 discusses implementation considerations and limitations; and Section 8 concludes with future research directions.
2. Related Work
The advancement of fault detection in complex systems has been significantly propelled by data-driven methodologies across diverse domains, from cloud computing to ecological studies. Our work on PCA-enhanced residual monitoring for lithium-ion battery systems intersects with several key research streams that leverage statistical learning, anomaly detection, and system resilience.
In the realm of system resilience and predictive management, Baral’s work on anticipatory autonomic management for poly-cloud environments [1] shares a foundational principle with our approach: the use of anomaly detection and trend forecasting to preempt failures. While Baral focuses on infrastructure telemetry to predict resource exhaustion, we apply a similar predictive philosophy to electrochemical systems, using voltage and temperature residuals to forecast battery faults before they lead to thermal runaway. Both frameworks emphasize reducing incident resolution time through early detection.
The integration of continuous covariates into statistical models is another area of parallel innovation. Baral’s methodology for integrating spatially continuous environmental data into Hidden Markov Models (HMMs) for animal behavior [2] tackles a challenge analogous to our handling of non-stationary operational data. His use of kriging for spatial interpolation mirrors our use of mean-based residuals and PCA to transform raw, variable-laden signals into stationary, analyzable forms suitable for statistical process control.
Research on efficient data structures and system generators underpins the computational feasibility of real-time monitoring. Maheshwari’s work on dynamic comparison-based dictionaries with a working-set property [3] emphasizes minimizing operational comparisons, a concern mirrored in our design of a low-complexity PCA-CUSUM framework for embedded Battery Management Systems (BMS). Similarly, Nimmalapudi’s development of RD-Gen for generating realistic Directed Acyclic Graphs (DAGs) in real-time systems [4] highlights the importance of tailored data generation for system validation, akin to our use of synthetic, model-informed anomaly injection to rigorously test our detection framework.
The field of machine learning for offline policy learning and system optimization offers complementary techniques. Panda’s work on leveraging generative models for offline reinforcement learning [5] addresses distribution shift—a challenge also present in battery systems where aging changes the data distribution. His diffusion-based prior to constrain policy updates is conceptually similar to our use of PCA to define a "normal operation" subspace, constraining fault detection to significant deviations from learned correlations. Furthermore, Panda’s research on optimizing Kafka data stream partitioning for real-time performance [6] directly relates to the data pipeline efficiency required for our real-time residual monitoring and CUSUM calculation.
Benchmarking and reproducibility are critical for validating any data-driven system. Singh’s workload-driven analysis of networked filesystems [7] and his advocacy for "reproducibility by construction" [8] underscore the necessity of rigorous, transparent evaluation. Our work adheres to this principle by employing comprehensive performance metrics (DT, FPR, FNR, TTR) and using controlled synthetic fault injection, ensuring our claims of improved detection time and accuracy are verifiable and benchmarked against a baseline method.
In applied machine learning, Jain’s comparative evaluation of traditional models for environmental sound classification [9] demonstrates the effective use of feature extraction (e.g., MFCCs) and model selection—a process analogous to our feature engineering via residual generation and our choice of PCA over other multivariate techniques. Rajput’s work on interpretable AI for 3D point cloud segmentation [10] and monocular distance estimation [11] highlights the push towards efficient, explainable models in safety-critical applications, a goal shared by our PCA-CUSUM framework which offers more interpretable fault signatures than black-box deep learning models.
Finally, broader perspectives on AI reliability and scalable data processing inform our work’s context. Ugandhar’s empirical investigation into the replicability of ML research [12] cautions against over-reliance on non-reproducible complex models, justifying our choice of a well-established, statistically sound PCA method. Nagamani’s study on scaling reasoning for long-context understanding in AI [13] explores model limitations with extended sequences, relevant to our system’s need to process continuous, lengthy time-series data. Arora’s compiler-enhanced language for scalable data workflows [14] speaks to the infrastructure needed to deploy frameworks like ours at scale, while Paul’s work on enhancing recommendation systems with interpretable latent factors [15] aligns with our goal of not just detecting but also localizing faults, moving from a black-box alert to an actionable diagnosis.
Our proposed PCA-CUSUM framework synthesizes insights from these diverse fields, applying robust statistical monitoring and dimensionality reduction specifically to the critical challenge of fault detection in multi-cell battery systems, a domain where early, accurate, and interpretable detection is paramount for safety and sustainability.
3. Discussion and Integration with Broader Data-Driven Systems
The proposed PCA-CUSUM framework does not exist in isolation; it is a specific instance of a broader paradigm shift towards data-driven, anticipatory management of complex systems. Its development, implementation, and evaluation resonate with several overarching themes in contemporary computing and engineering research, as evidenced by the related literature.
Synergy with Proactive System Management Paradigms: Our framework embodies the "anticipatory autonomic management" philosophy outlined by Baral [1]. By moving from threshold-based reaction to residual-based statistical monitoring, we enable the BMS to anticipate faults like internal short circuits, much like cloud systems can anticipate resource exhaustion. The graduated response logic in our framework—where mild thermal anomalies trigger increased cooling and severe ones trigger shutdown—mirrors the "graduated automation remediation" advocated for cloud environments. This cross-domain parallel suggests a unifying principle: complex systems, whether cyber or cyber-physical, benefit immensely from transitioning from reactive to predictive-operational models based on continuous telemetry analysis.
Validation Through Synthetic Data and Reproducible Benchmarks: The use of synthetic anomaly generation in our experimental validation is a methodological cornerstone that aligns with the emphasis on rigorous benchmarking and reproducibility championed by Singh [8] and exemplified by tools like RD-Gen for system testing [4]. Generating controlled, realistic fault signatures allows for a comprehensive sensitivity analysis (e.g., detection time vs. anomaly magnitude) that would be ethically and practically impossible with only physical fault tests. This approach provides a reproducible benchmark for comparing detection algorithms, a practice crucial for advancing the field, as underscored by Jain’s model comparisons in sound classification [9].
Navigating the Trade-off Between Complexity and Interpretability: Our choice of PCA over more complex deep learning models was deliberate, prioritizing interpretability and computational efficiency for embedded deployment. This decision finds support in Rajput’s work on lightweight, interpretable AI for point clouds [10] and echoes the concerns raised by Ugandhar regarding the replicability challenges of complex ML models [12]. The PCA model’s parameters (principal components) and the CUSUM statistics offer engineers tangible insights into the "health" of cell relationships. This contrasts with the "black-box" nature of many deep learning fault detectors, facilitating easier integration with diagnostic procedures and building greater trust—a critical factor for safety-critical systems in transport.
Scalability and Integration into Larger Data Workflows: The practical implementation considerations (computational complexity, sensor quality) discussed in Section VI.A-B highlight that the algorithm is designed for real-time embedded use. However, for fleet-level analytics or prognostic health management, its outputs become valuable data streams. This aligns with Arora’s vision of compiler-enhanced languages for scalable data workflows [14]. Our framework’s fault alerts and localization data could feed into larger-scale data pipelines for fleet operators, enabling cross-vehicle trend analysis and predictive maintenance scheduling. Furthermore, the optimization of data handling—a focus of Panda’s work on stream partitioning [6]—is implicitly addressed in our group-based processing, which reduces the data dimensionality (n cells per group) before applying PCA, making the stream manageable for real-time processing.
Future Directions: Hybridization and Cross-Domain Learning: The limitations and future work section points towards hybrid models and prognostic applications. This direction is well-supported by adjacent research. For instance, hybridizing our data-driven PCA model with physical battery models could create a more robust system, similar to how Paul enhanced recommendation systems by bridging latent factors with explicit tags [15]. Furthermore, the prognostic extension of predicting Remaining Useful Life (RUL) after fault detection could leverage techniques from offline RL, as explored by Panda [5], where a policy learns optimal maintenance actions from historical fault evolution data. The challenge of long-context understanding in AI models, as studied by Nagamani [13], is directly relevant to this prognostic goal, which requires models to reason over long sequences of temporal degradation data.
In conclusion, the PCA-CUSUM framework for battery fault detection is a compelling application of established and emerging data science principles to a critical engineering problem. Its development is informed by, and contributes to, broader discussions on proactive system management, reproducible benchmarking, interpretable AI, scalable data processing, and hybrid modeling. By successfully detecting subtle voltage and temperature deviations in a real-world locomotive battery pack, it demonstrates the tangible benefits of integrating robust statistical monitoring into the core of sustainable transport infrastructure.
4. Methodology
The technique uses groups of similar cells in a battery pack for anomaly detection. The grouping process takes advantage of the similarities of cells that undergo the same loading, thermal and aging conditions[16]. Cells that are electrically, thermally and chemically similar are arranged in series-parallel configurations. This occurs within the same module or within nearby spatial locations. The method involves residual generation, principal component analysis and statistical monitoring.
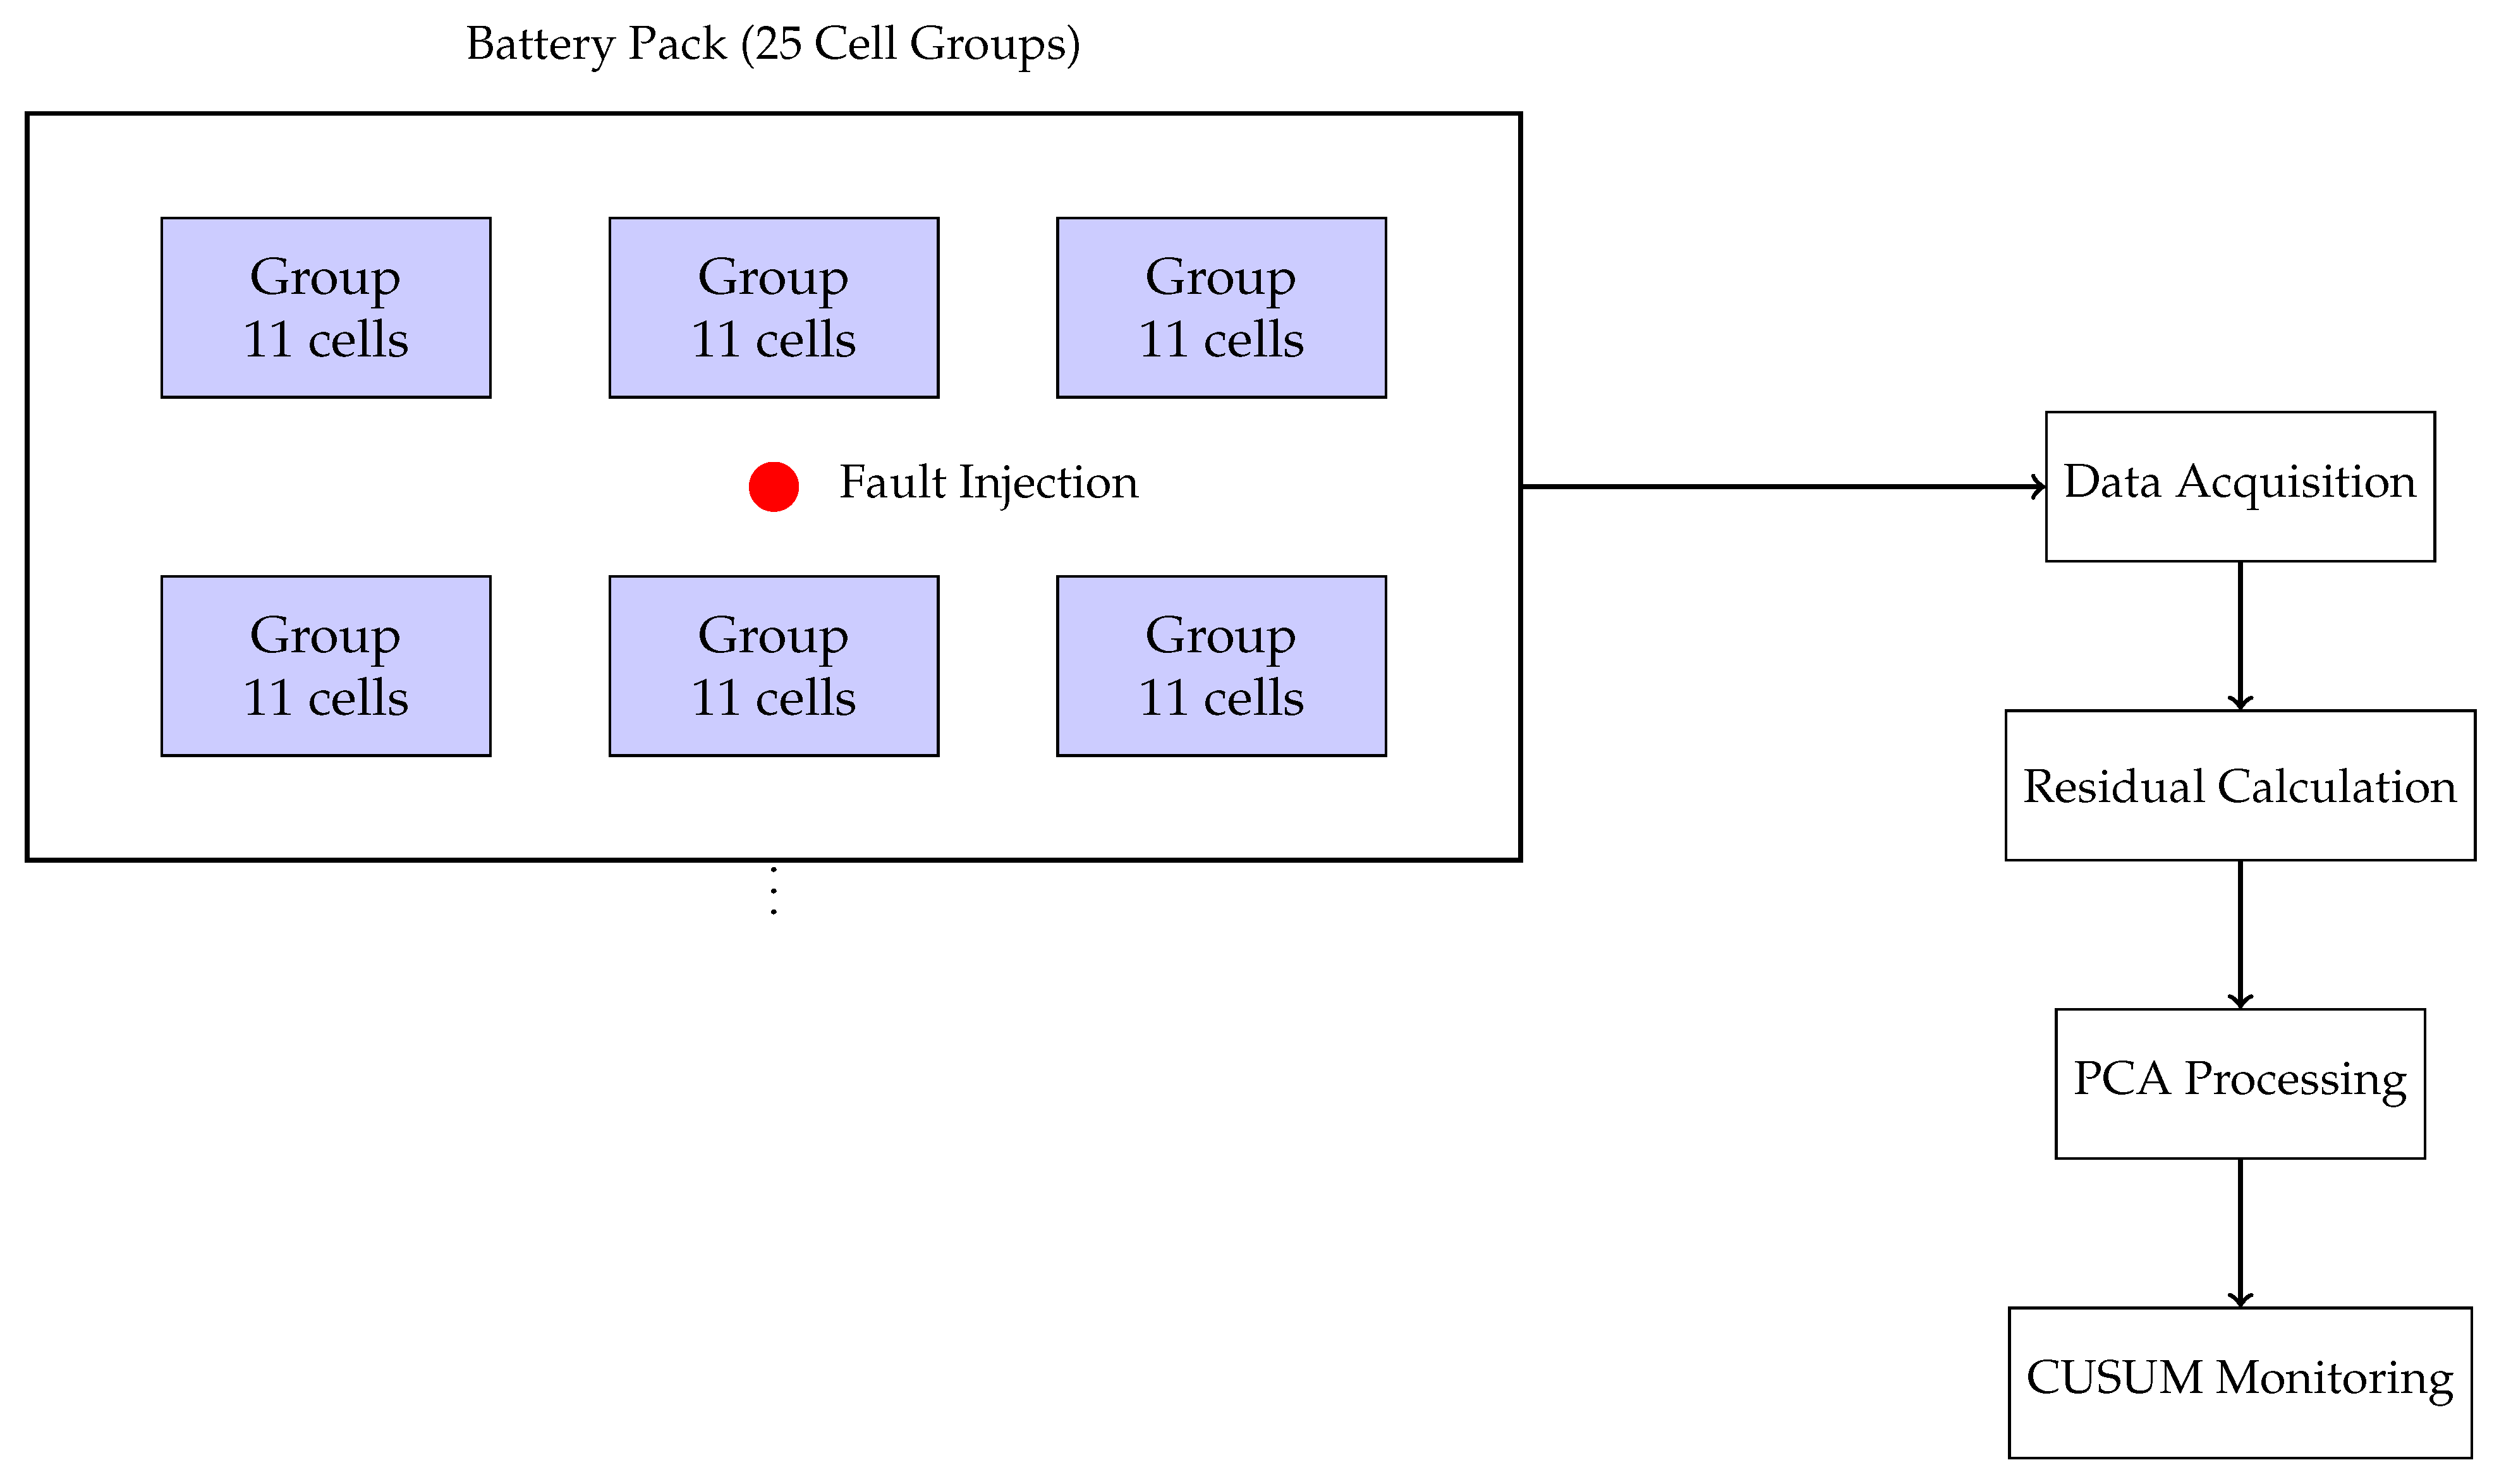
Figure 1.
Schematic representation of battery pack organization and fault detection data flow. The pack consists of 25 cell groups, each containing 11 cells. Faults can be injected at specific locations, and data flows through acquisition, residual calculation, PCA processing, and CUSUM monitoring stages.
4.1. Residual Generation
Mean-based residuals are calculated for both voltage and temperature measurements to convert non-stationary operational data into stationary signals suitable for statistical monitoring. For a cell group containing n cells, the residual for cell i at time t is computed as:
where at time t, is the voltage (or temperature) measurement of cell i and is the group mean. This method removes common-mode variations affecting all cells in the group, such as load current deviations or ambient temperature fluctuations[17], but continues to preserve deviations associated with individual cells.
The residual generation method has many benefits compared to the model-based method. To begin with, it does not require detailed battery models and parameter estimation. Additionally, it naturally handles aging effects since degradation within a cell group is the same over time. As the moving average calculation, it adapts to changing operating conditions. Nonetheless, it is assumed that cells in a group behave similarly in a nominal sense, which needs to be confirmed.
4.2. Principal Component Analysis
Principal component analysis transforms the multivariate residual signals into a lower-dimensional space where anomalies become more detectable[18]. The PCA model is trained using k samples of anomaly-free residuals arranged in a data matrix . Singular value decomposition is applied to decompose the matrix:
where contains the left singular vectors (principal components), is a diagonal matrix of singular values, and contains the right singular vectors.
The number of principal components p is selected to capture a predetermined percentage of the total variance in the training data, typically 90%. The truncated matrix contains the first p principal components. During online operation, new residual vectors are normalized using the mean and standard deviation from the training data to compute Z-scores:
The normalized residuals are then projected into the principal subspace and reconstructed:
The reconstruction error, representing the deviation from normal operating conditions, is quantified using the root mean square error:
4.3. CUSUM Monitoring
To check whether the process deviates from normal operation for a longer period, the cumulative sum control chart checks . The CUSUM algorithm adds positive deviations to the target value. Hence, it is sensitive to small, instantaneous shifts. For a sequence of reconstruction errors , the upper CUSUM statistic is computed as:
where is the average of during normal operation and K is a reference value usually set at , with being the standard deviation of during normal operation. When the value of exceeds a control limit H (here ) an anomaly is detected.
Benefits of CUSUM chart for a battery anomaly detection. This has knowledge of past changes, helping in recognition and identification of gradual faults. This notes that it is sensitive enough so that it responds to minor changes but is also not influenced on transients[19]. The algorithm runs efficiently on a microcontroller with only simple calculations which can be implemented in real time. Separate CUSUM monitors are maintained for the residual voltage and the residual temperature allowing the detection of their abnormalities independently.
5. Experimental Setup and Data Collection
An experimental work with Wabtec FLXDrive battery-electric locomotive data was done to validate the proposed framework. Battery systems are put through their paces in this real-world application, with large pack sizes, high-power demands and enhanced safety requirements. This section describes the experimental setup, data collection process, and synthetic anomaly generation methods.
5.1. Battery System Configuration
The constituent materials for the battery pack are 825 lithium-ion NMC cells with 275S-3P configuration which is 275 series strings of 3 parallel cells. Every parallel group is considered a single equivalent cell with total capacity and averaged electrical characteristics. Cells capable of delivering nominal capacity of 37 Ah under specific voltage and temperature ranges. This pack consists of 25 cell groups (11 series connected equivalent cells per group) that operate in similar thermal conditions and electrical load patterns[20].
At sampling frequency of 1 Hz, every cell samples the voltage and temperature measurements using high-precision sensors with noise lower than 0.4 mV for the voltage and 0.03°C for the temperature. The entire pack is measured for current so a positive value refers to discharge and a negative to charge. Furthermore, in addition to the above, the ambient temperature and cooling fan status is recorded per cell group. The passive balancing measures of the battery management system use 100 shunt resistors that are connected across battery cells.
Figure 2.
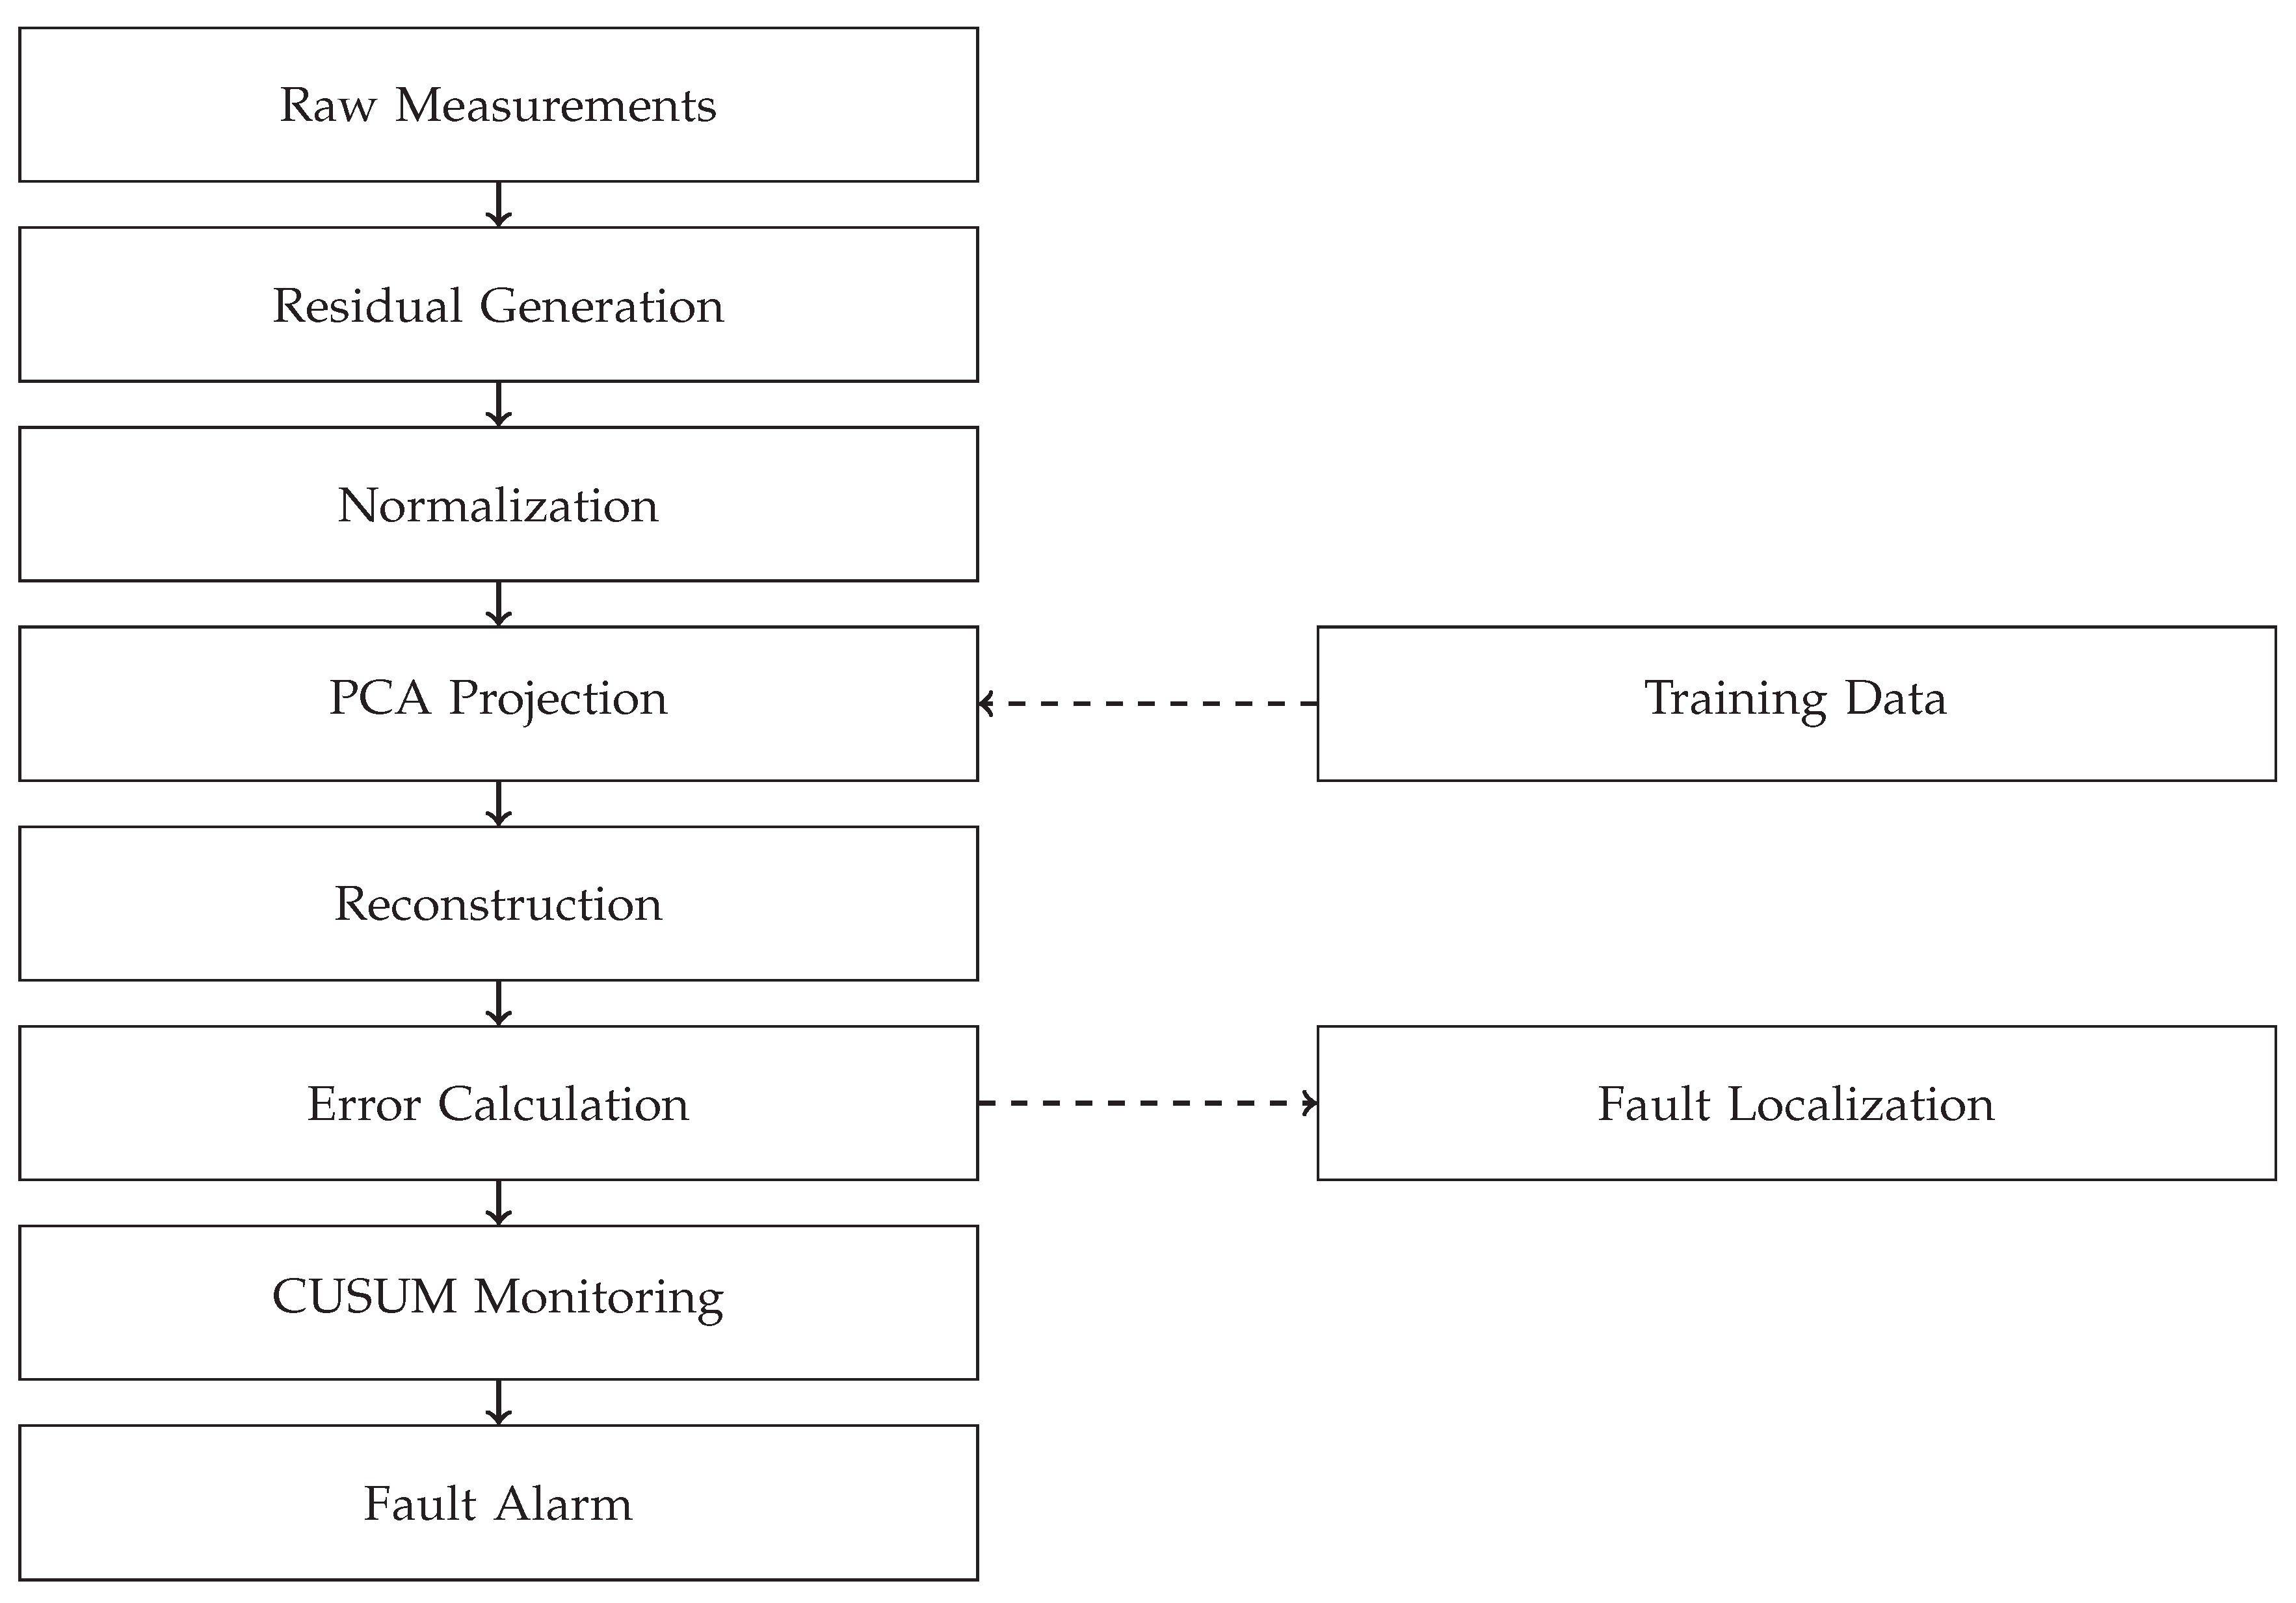
Block diagram of the proposed PCA-CUSUM anomaly detection framework. The process flow includes residual generation, normalization, PCA projection and reconstruction, error calculation, and CUSUM monitoring. Dashed lines indicate auxiliary processes for training and fault localization.
Figure 2.
Block diagram of the proposed PCA-CUSUM anomaly detection framework. The process flow includes residual generation, normalization, PCA projection and reconstruction, error calculation, and CUSUM monitoring. Dashed lines indicate auxiliary processes for training and fault localization.
5.2. Data Collection
Normal locomotive operating conditions were chosen for experimental data collection, including variable loading conditions, charge-discharge cycles, and ambient conditions. The PCA models were trained and baseline statistics established on data spanning a 24-hour period of healthy operation. A test period of an additional 24 hours was used to evaluate detection. Datasets used in the training and test sets were chosen to represent normal operation and, importantly, were separated in time to prevent one set containing data from any instance in the other set.
The nominal data showed typical patterns, such as: voltage variations corresponding to current load, the temperature rising during high-power operation, and slow cooling under no-load conditions. The difference in voltage between cells of the lithium-ion battery is typically below 50 mV and that in temperature is below 2°C while under similar loading conditions. The naturally occurring variations served to build up the baseline.
5.3. Synthetic Anomaly Generation
The injection of known anomalies in a nominal dataset to evaluate the performance of the data is called as controlled performance evaluation. The analysis considers five types of faults which represent common failure modes in battery systems, including internal short circuits, voltage dropouts, air-flow restrictions, loose voltage sense leads, and loose temperature sense leads. To evaluate the detection sensitivity, each type of anomaly was injected at various magnitudes using realistic physical features.
The internal short circuits were simulated using Thevenin equivalent circuits with varying short circuit resistances. As resistance was increased, voltage dropouts simulated connection failures. Air-flow anomalies lowered the convective cooling coefficients in thermal models. The loose sense leads used the bias terms that added noise to models which were poor sensors. The anomaly magnitudes varied from 0 (no anomaly) to 1 (severe anomaly), with values in between representing worse and worse.
Through nominal experimental measurements and using model-based anomaly signatures, synthetic anomalous data was generated using a hybrid experimental-model approach. The technique saved noise properties and variations from the experimental data while allowing injection of faults in a controlled way. Anomalies were initiated at pre-specified times with a pre-specified duration to label ground truth for timing and duration detection[21].
5.4. Performance Metrics
To get a comprehensive evaluation of the proposed anomaly detection framework, we used six performance metrics which are detection time (DT), recovery time (RT), false negative rate (FNR), false positive rate (FPR), missed anomaly rate (MAR), and true tracing rate (TTR). Delay between initiation and diagnosis of anomaly is detection time. The system reset speed is measured by the recovery time. The false negative rate is the percentage of times that an active anomaly is not detected. False positive rate indicates how often a normal operation is incorrectly flagged as anomalous. This anomaly is defined as the ratio of injected anomalies that are not detected. The true tracing rate evaluates the accuracy of fault localization to cells.
These indicators represent a comprehensive evaluation of a detector’s capacity to detect true anomalies (sensitivity) and to avoid false positives (specificity). The metrics also account for practical aspects like detection delay and localization accuracy that matter in real-world implementation as timely response and precise diagnosis enable successful mitigation actions.
6. Results and Analysis
Using artificial anomalies and authentic balancing events, the suggested PCA-CUSUM framework was assessed under different fault types and severities. A baseline direct thresholding method applies CUSUM monitoring directly to mean-based residuals without PCA processing against which a comparison has been made. The section provides the results and analysis on the detection performance, timing characteristics, and localization accuracy.
6.1. Detection Performance Across Fault Types
Table 1 summarizes the average performance metrics for the five anomaly types across all tested severity levels. The PCA strategy had better performance than the direct one for all metrics except recovery time, where the direct method had a little faster reset due to the lower level of historical accumulation in the CUSUM statistics. In the case of short circuiting inside the internal, the PCA technique brings down the time for detection from 280 minutes to 102 minutes or 63% and the false negative rate decreases from 47% to 8%. Fault detection times were reduced by amounts of 56% to 85% for other faults as well.
The PCA method effectively detected air-flow anomalies with a false negative rate of less than 5% for mild anomalies. This finding indicates that the method is responsive to the thermal anomalies that usually precede larger thermal events. Both approaches detected loose sense lead anomalies quickly due to the obvious change in residuals. However, the false negative rate is lower in PCA as it better distinguishes anomalies from normal variation.
Overall, the PCA method reduced missed detections by 60% compared to the direct method, with the missed anomaly rate showing particularly dramatic improvement. For voltage irregularities over 4 mV and temperature irregularities over 0.15°C, no missed detection when using PCA method. The minimum detectable deviation under a certain sensor quality and marked operating condition is a practical measure of the minimum sensitivity of our system.
6.2. Detection Time vs. Anomaly Magnitude
The detection times for both methods decreased with greater anomaly severity, as larger deviations are easier to detect. Nonetheless, PCA method was tremendously quicker across all levels of severity, especially when level of anomaly is mild and deviation is subtle. For a 0.2 magnitude (20% of maximum severity) anomaly, the PCA method detected faults in approximately 180 minutes, whereas the direct method did so after 400 minutes.
The enhancement in detection time comes from PCA’s capability of intensifying slight alterations in cell-to-cell relationship. Even though the individual residual deviations might be small, the signature detectable in the principal components is more so. This amplification effect is especially useful for early detection of faults, as timely interventions can stop deterioration to worse states. The memory of the CUSUM chart gives it extra sensitivity to gradual changes, accumulating small but persistent shifts that would be disregarded by threshold-based methods.
Both methods detected severe anomalies (magnitude > 0.8) within minutes, although the PCA method had a consistent advantage. Detection times in the direct method for similar magnitude anomalies were more dispersed because the direct method was sensitive to instantaneous measurements. The PCA method performed more consistently, with detection times clustering closer to the trend line, indicating better robustness to measurement noise and operational variations.
6.3. False Positive and False Negative Analysis
Based on 24 hours of nominal data from all 25 cell groups, the false-positive rate was assessed. The direct method had a 1.9% average FPR, while PCA had a greater FPR of 2.9%. The PCA method’s increase in catching these z-scores comes at a slight increase of 0.013 in false alarms. This means that sensitivity is increased by calculation but results in a loss of specificity. Either of the rates is acceptable for practical purposes especially in the case of battery monitoring which is safety-critical. This is because missing detection is more dangerous than false-alarm.
The rates of false negatives showed more dramatic variations between methods. FNR rate is below 10% for all types of anomaly not including voltage dropouts, which is 17%. Four of the five anomalies experienced a direct method FNR larger than 25%, with internal short circuiting reaching 47%. The improved performance of PCA method traces back to its multivariate nature. Unlike methods that consider only individual cells’ deviations, PCA utilizes a matrix of deviation measurements that considers intercellular structures. When a single cell starts to misbehave, it changes its relationship with other cells in characteristic ways which can be captured by PCA, even when the absolute deviation is small.
The false negative rates associated with the anomalies behaved as we predict with larger anomalies yielding lower FNR. While the FNR of the PCA method remains at a reasonable level even for a mild anomaly, the FNR of the direct method increases rapidly as the magnitude of the anomaly decreases. This trait is vital in early alarm systems where recognizing incipient, low-severity faults allows one to carry out preventive maintenance before conditions worsen.
6.4. Fault Localization Accuracy
True tracing rate assesses how accurately the exact anomalous cell is identified after detection of a fault. The TTR of PCA method is over 90% for each anomaly type, while the air-flow anomaly has TTR as high as 96%. Localization accuracy was comparatively low for the direct method, at 76% to 81% for all anomaly types. The PCA incoporates the analysis of reconstruction error to determine which cell plays the biggest role in abnormality.
The accuracy of anomaly localization was strongly dependent on its magnitude in relation to the reference. For voltage anomalies over 7 mV and temperature anomalies over 0.3°C, TTR of over 95% is achieved using PCA method. As one fell below the said thresholds, the localization became uncertain. Nonetheless, detection was still possible, even if exactly localizing the problematic cell was not feasible. Group-level detection was still possible.
The localization mechanism leverages the reconstruction error vector to find the cell with the maximum absolute error, which is then classified as anomalous. This method is efficient when appropriate for single-cell faults nevertheless it can lead to confusion if multiple cells develop simultaneous faults. In these cases, the method usually finds the most severely affected cell, and this is often enough to start diagnostic testing, which can then find the other affected cells.
6.5. Cell Balancing Events
The challenge of anomaly detection is brought about through cell balancing as cells purposefully create a voltage difference. When balancing, the shunt resistors discharge cells with a higher SOC, lowering their voltages which resemble a fault conditions. The suggested framework proposes independent treatment of the voltage and temperature residual, along with dynamic retraining methods.
On average, temperature residuals enabled detection of the occurrence of an experimental module balancing event (which affected all the cells in a group) within 14 minutes. However, voltage-based detection failed because of identical balancing signatures across the cells in the group. The temperatures of the cells were different from each other, due to heat transfer. Temperature differences of the cell were detected using PCA. Using voltage residuals, single-cell balancing events were found in 4 minutes as the voltage of the affected cell differed from the bulk.
The analysis of principal components, pre, during, and post balancing has shown significant voltage relationship shifts, which have resulted in the voltage PCA models’ retraining after balancing events. The relationship to temperature changed less dramatically so could use existing ones. This difference arises from the fact that balancing affects electrical characteristics (it changes the ratio of SOC/voltage) but does not affect the electrothermal properties of the cell itself.
Using post-balancing data, the retraining process modifies the PCA models and CUSUM parameters to the new nominal state. The system is retrained automatically when it recognizes the finishing of balancing-in to maintain its effectiveness. This adaptable functionality preserves the sensitivity of detecting imperfections while avoiding false alarms generated by deliberate functional operations.
7. Discussion and Implementation Considerations
The experimental results show the ability of PCA-CUSUM framework to detect battery anomalies, but there are many practical issues need to be careful with implementation in a real-life scenario. This part talks about the computational requirements, sensor quality dependencies, integration with battery management systems, and current limitations.
7.1. Computational Requirements
The framework suggested will be used in real time on an embedded system having less capacity. For each monitored variable, at each time step, the residual calculation involves n minor subtractions, and one division. The complexity of the PCA projection corresponding to a matrix multiplication , with n the number of cells per group and p the number of principal components (generally 1-3). At each time step only a few operations have to be performed.
Either offline or during initialization, the computations for training, which require the use of a singular value decomposition of the training data matrix, cost , where, as before, k stands for the number of training samples. Using standard parameters like and a frequency of for 24 hour at 1Hz will complete the learning in minutes on a modern embedded processor. Retraining after balancing events requires smaller datasets (post-balancing nominal operation) and takes place infrequently to reduce computational efforts.
The memory requirements are reasonable as it only needs to store the training statistics (, ), the principal components () and the CUSUM parameters (, , K, H). The algorithm can be run using fixed-point arithmetic for better efficiency, although floating-point allows for more numerical robustness for PCA. Essentially, it ensures implementation on conventional battery management system hardware without specialized processors.
7.2. Sensor Quality Dependencies
Sensors and data acquisition characteristics inherently limits detection sensitivity. The experimental system used sensors with a noise of voltage lower than 0.4 mV and temperature lower than 0.03 °C, which can detect changes of 4 mV and 0.15 °C, respectively. Systems with lower quality sensors would need higher detection thresholds to maintain acceptable false alarm rates and would be less sensitive to small anomalies.
On the basis of the statistics generated from the training data, the parameters of the CUSUM control chart are tuned so that they automatically adapt to the sensor noise characteristics. Higher levels of noise make bigger, which causes H and K to be larger. This adaptation has the same false-positive rate but a greater minimum detectable deviation. As the sensor noise doubles, so would the minimum deviation detectable, which is relatively linear.
The placement of sensors and synchronization of measurements should be taken into consideration in a practical implementation. To minimize differences in voltage noise and introduce a delay, voltage sense lines should have a similar length and routing. Temperature sensors must be in good thermal contact with cell surfaces and placed uniformly across cells. Synchronization is critical to prevent phase differences between the cells for PCA’s correlation analysis. These elements guarantee that detected anomalies are true cell states and not measurement artifacts.
7.3. Integration with Battery Management Systems
The framework of anomaly detection complements the already existing battery management functions. The system works with state estimation, charge control and thermal management modules for extra safety monitoring. Several points of integration may consist of data exchange, events coordination and faults response. Specifically, sharing measurements and states, coordinating balancing and charging, and reacting to faults by sending alarms, derating or shutting down.
When an anomaly occurs, the response of the system should vary according to grading and type. Thermal anomalies that are mild may lead to increased cooling efforts or reduction in power limits. Voltage differences may trigger diagnostics or cause cell isolation. Whenever severe or escalating anomalies occur alarms must be activated and safe shutdown procedures initiated. The ability to localize allows for message responses to be targeted so that messages are less impactful on the overall system functionality.
The framework enables prognostic applications through monitoring of anomaly evolution over time. A gradual increase in CUSUM statistics or in reconstruction errors can be indicative of deterioration and allow for scheduling of maintenance. By examining historical anomaly data, we could identify patterns and correlations with operational conditions and support root-cause analysis and design improvements.
7.4. Limitations and Future Improvements
There are several limitations of the current approach to suggest future directions for research. This method assumes the cell types in a group have similar nominal behavior. This assumption may not hold for packs which are highly heterogeneous or after they have significantly aged divergently. This limitation may be overcome by adaptive grouping strategies or individual cell modelling. The framework only handles voltage and temperature at the moment; adding measurements like impedance or pressure could help with detection.
Although synthetic anomaly generation appears quiet realistic, it cannot capture all actual fault characteristics. In particular, it cannot capture complex multi-fault scenarios or interactions between different failure modes. Verifying detection performance with physical fault experiments would strengthen confidence. The strategy for retraining after balancing requires nominal post-balancing data, but this is not available in all operating conditions.
Future work may involve the online adaptation of PCA models to gradual aging changes, hybridization with physical models, or their extension to prognostic applications that would predict the RUL after fault detection. The system could potentially be scaled-up to network-level monitoring across multiple battery packs in fleet-like applications using cross-pack comparisons for sensitivity gain.
In spite of these limitations, the PCA-CUSUM framework significantly improves battery anomaly detection in terms of sensitivity, robustness, and practical implementability over existing methods. The real-world data gathered from electric locomotive applications confirms the suitability of experimental validation for potential deployment in arduous transport environments, where the safety of the battery is critical.
8. Conclusions
This study has presented deep and comprehensive PCA CUSUM based anomaly detection the LI-ion battery system specifically for large-scale electric transport. By means of mean-based residuals and principal component analysis, it detects any deviation in the cell to cell relationship, while cumulative sum control charts provide robust statistical monitoring. Using data from a battery-electric locomotive for experimental validation led to performance improvements over conventional thresholding. The results yielded detection times that were 56% faster, 60% fewer missed anomalies, and a 42% reduction in false negatives. The false positive rates stayed below 3%.
The framework successfully detects multiple fault types including internal short circuits, sensor failures and thermal anomalies. The system can detect a 4 mV variation in voltage and a 0.15 °C variation in temperature with good-quality sensors. The method addresses practical challenges like cell balancing interventions via adaptive retraining approaches, while accurate fault localization enables effective remedial maintenance responses. Efforts have been made to ensure real-world deployment by addressing implementation requirements like computation, sensor and deployment options.
This research work facilitates the development of safe and reliable battery system for sustainable transport application. Early fault detection is imperative to mitigate potential catastrophic failure, and to enable predictive maintenance. The framework enables the fulfilment of economic and environmental targets of electrified transportation by enhancing operational safety with data-driven anomaly detection and existing battery management. Future work will include adapting the model for updating with multiple faults and prognostics for assessing battery health.
References
- Baral, Pramesh. Anticipatory autonomic management of poly-cloud environments: A machine intelligence paradigm. TechRxiv 2025. [Google Scholar] [CrossRef] [PubMed]
- Baral, Pramesh. Integrating spatially continuous environmental covariates into HMMs for animal behavior via kriging. TechRxiv 2025. [Google Scholar] [CrossRef] [PubMed]
- Maheshwari, Harsh. Efficient dynamic comparison-based dictionaries with working-set property: A new approach. 2025 International Conference on Innovative Trends in Information Technology (ICITIIT); pp. pages 1–4, 2025. [CrossRef]
- Kireet, Prem; Nimmalapudi, Chowdary. Development of RD-Gen: A random directed acyclic graph generator for multi-rate real-time systems. 2025 Global Conference in Emerging Technology (GINOTECH); pp. pages 1–10, 2025. [CrossRef]
- Panda, Sibaram Prasad. Leveraging generative models for efficient policy learning in offline reinforcement learning. 2025 IEEE XXXII International Conference on Electronics, Electrical Engineering and Computing (INTERCON); pp. pages 1–6, 2025. [CrossRef]
- Panda, Sibaram Prasad. Optimizing data stream partitioning to improve real-time performance in distributed messaging. 2025 IEEE International Conference on Artificial Intelligence in Engineering and Technology (IICAIET); pp. pages 185–190, 2025. [CrossRef]
- Singh, Pankaj. Workload-driven perspectives on networked filesystems: Benchmarking NFS/SMB and version-level trade-offs. International Journal of Advanced Research and Interdisciplinary Scientific Endeavours 2025, 3(4), 975–981. [Google Scholar] [CrossRef]
- Singh, Pankaj. Reproducibility by construction: Open algorithms, public benchmarks, and cloud-native artifact pipelines. International Journal of Advanced Research and Interdisciplinary Scientific Endeavours 3(6), 1091–1103, 2025. [CrossRef]
- Jain, D. Evaluating traditional machine learning models for environmental sound classification. Zenodo 2025. [Google Scholar] [CrossRef]
- Rajput, Sourabh. Interpretable AI for 3D structural recognition: A lightweight approach to point cloud segmentation. [CrossRef] [PubMed]
- Rajput, Sourabh. AI-powered distance estimation for autonomous systems: A monocular vision approach. [CrossRef] [PubMed]
- Ugandhar, Bhargavi. An empirical investigation of replicability in machine learning research. Journal of Data Analysis and Artificial Intelligence 2025, 4(3). [Google Scholar] [CrossRef]
- Nagamani, Nagajayant. Scaling reasoning in AI: Challenges of long-context understanding in emerging models. Research and Reviews: Advancement in Robotics 2025, 9(1), 21–30. [Google Scholar] [CrossRef]
- Arora, Himanshu. Compiler-enhanced language for scalable data workflows. Preprints 2025. [Google Scholar] [CrossRef]
- Paul, Vishal. Bridging latent factors and tags: Enhancing recommendation systems. 2024 International Conference on Communication, Computing, Smart Materials and Devices (ICCCSMD), 2024; pp. pages 1–7. [Google Scholar] [CrossRef]
- Zhao, J.; Feng, X.; Tran, M. K.; Fowler, M.; Ouyang, M.; Burke, A. F. Battery safety: Fault diagnosis from laboratory to real world. Journal of Power Sources 2024, 598(234111), 234111. [Google Scholar] [CrossRef]
- Chen, K.; Lin, N.; Li, X.; Huang, S.; Xu, Y.; Wang, Z. A novel fusion model for enhanced fault diagnosis in lithium-ion batteries for electric vehicle safety. Journal of Energy Storage 135, 118050, 2025. [CrossRef]
- Polat, K.; Daldal, N.; Zaib, M.; Arabacı, B. Enhancing the safety and reliability of electric vehicles through effective battery fault diagnosis: A systematic review. Computers and Electrical Engineering 129, 110831, 2026. [CrossRef]
- Sun, Z.; Wang, Z.; Liu, P.; Qin, Z.; Chen, Y.; Han, Y.; Bauer, P. An online data-driven fault diagnosis and thermal runaway early warning for electric vehicle batteries. IEEE Transactions on Power Electronics 2022, 37(10), 12636–12646. [Google Scholar] [CrossRef]
- Zhang, J.; Wang, Y.; Jiang, B.; He, H.; Huang, S.; Wang, C.; Ouyang, M. Realistic fault detection of li-ion battery via dynamical deep learning. Nature Communications 2023, 14(1), 5940. [Google Scholar] [CrossRef] [PubMed]
- ElJarray, O.; Dai, H.; Chen, Z.; Raja, S. V.; Li, B.; Cao, S.; Zhang, G. Ensuring battery safety in electric vehicles: Challenges, developments, and future perspectives. Small 2025, page 2503406. [Google Scholar] [CrossRef] [PubMed]

Table 1.
Performance comparison between direct thresholding and PCA-CUSUM methods across five anomaly types
Table 1.
Performance comparison between direct thresholding and PCA-CUSUM methods across five anomaly types
| Anomaly Type | Method | DT (min) | RT (min) | FNR (%) | MAR (%) | TTR (%) |
|---|---|---|---|---|---|---|
| Internal Short Circuit | Direct | 280 | – | 47 | 33 | 78 |
| PCA | 102 | – | 8 | 8 | 94 | |
| Air-Flow Restriction | Direct | 31 | – | 26 | 19 | 81 |
| PCA | 4.6 | – | 2 | 4 | 96 | |
| Loose Temp Sense | Direct | 0.7 | 47 | 16 | 31 | 79 |
| PCA | 0.2 | 57 | 3 | 6 | 95 | |
| Loose Voltage Sense | Direct | 1.6 | 74 | 36 | 26 | 76 |
| PCA | 0.72 | 52 | 9 | 17 | 92 | |
| Voltage Dropout | Direct | 320 | – | 42 | 35 | 77 |
| PCA | 52 | – | 17 | 26 | 91 | |
| Average | Direct | 126.7 | 60.5 | 33.4 | 28.8 | 78.2 |
| PCA | 31.9 | 54.5 | 7.8 | 12.2 | 93.6 |
Disclaimer/Publisher’s Note: The statements, opinions and data contained in all publications are solely those of the individual author(s) and contributor(s) and not of MDPI and/or the editor(s). MDPI and/or the editor(s) disclaim responsibility for any injury to people or property resulting from any ideas, methods, instructions or products referred to in the content. |
© 2026 by the authors. Licensee MDPI, Basel, Switzerland. This article is an open access article distributed under the terms and conditions of the Creative Commons Attribution (CC BY) license (http://creativecommons.org/licenses/by/4.0/).
Copyright: This open access article is published under a Creative Commons CC BY 4.0 license, which permit the free download, distribution, and reuse, provided that the author and preprint are cited in any reuse.


