Submitted:
21 January 2026
Posted:
22 January 2026
You are already at the latest version
Abstract
In this study the photocatalytic activity as a function of effective irradiance, photocatalytic quantum yield and reactant coverage was thoroughly assessed for the proper photoreactor (PhR) selection. PhR selection is a preponderant stage for photocatalytic processes, which has been an aspect not studied in detail in various scientific investigations. The emitted wavelength and effective irradiance of several PhRs, equipped with fluorescent and light emitting diodes (LEDs) lamps, were tested in the photodegradation of methylene blue (MB) in solid phase using AgTiC. Among all tested PhRs the one equipped with the low-pressure Hg lamp enhanced the photodegradation of MB. The above is due to the Hg lamp emitted UV-type radiation, which promotes the simultaneous photoactivation of the TiO2 and the surface plasmon resonance phenomenon of the Ag nanoparticles. Based on this study, it was determined that high values of effective irradiance promoted photocata-lytic activity because of the greater amount of photogenerated species [e-/h+]. Also, the ef-fective irradiance on the proper photocatalytic material slows down the recombination rate of the [e-/h+]. A kinetic photocatalytic model (KPM) was proposed to the description of photocatalytic reactions as a function of the effective irradiance, photocatalytic quantum yield and reactant coverage considering photocatalytic pseudo steady state according to the reactant equilibrium coverage (Langmuir isotherm) and the transfer processes of the photoinduced charge carrier species.

Keywords:
photoreactor
; photocatalytic activity
; irradiance
; AgTiO2 nanocatalyst
; methylene blue degradation
; kinetic photocatalytic model
1. Introduction
Photocatalysis is a cutting-edge research topic since toxic polluting compounds such as dyes, recalcitrant organic compounds, pharmaceuticals, herbicides, among others can be removed from wastewater using this technology [1,2,3,4]. The photocatalytic process can be described in three stages: (1) The semiconductor material (photocatalyst) is exposed to an irradiation source (photons). (2) If the incident energy of the photons is equal or greater than the bandgap (Eg) of the photocatalyst, photogeneration of charge carrier species happens. That is, electrons [e-] from the valence band are photoemitted to the conduction band and consequently, holes [h+] are generated in the valence band. (3) The charge carrier species are distributed to the surface of the photocatalyst by interfacial electron transfer processes to carry out the corresponding redox reactions to generate reactive oxygen species (ROS), which oxidize the toxic polluting compounds in a non-selective manner [5,6,7,8,9]. TiO2 is a semiconductor material widely used in photocatalytic processes due to characteristics such as chemical and photochemical stability, low toxicity, wide availability and affordable costs [10,11]. However, the TiO2 can only be photoactivated using high energy photons, which corresponds to the ultraviolet (UV) spectrum, due to the moderate Eg value of TiO2 (~ 3.2 eV). Therefore, to reach photocatalytic activity under visible (vis) irradiation, TiO2 should be doped or used to form composite materials with the aim of reducing the Eg value and therefore achieve the photoactivation of TiO2 using low-energy photons. Among these strategies, the incorporation of plasmonic metal nanoparticles (NPs) into TiO2 allows the absorption of photons from the visible spectrum [12,13]. It has been reported that plasmonic Au and Ag NPs incorporated into TiO2 promote the absorption of low-energy photons due to the localized surface plasmon resonance (LSPR) phenomenon, if the photon wavelength is slightly larger than the size of the plasmonic NPs [14,15].
In a similar sense, the proper assessment of photocatalytic processes is determinant for the adequate synthesis of photocatalytic materials, as well as for the design of processes that involve photocatalytic or photo-assisted ways such as the degradation of pollutants, H2 production or the synthesis of specific compounds. Thus, a photochemical reactor (PhR) is a crucial component to the photocatalytic processes assessment, since this one has together the irradiation source (fluorescent lamps or light emitting diodes), the photocatalyst and the reactants or required materials for the photocatalytic processes [16]. The choice of specific radiation (UV or vis) must be made to promote the photoactivation of the photocatalysts to the generation of the charge carrier species [e-/h+], as well as for the selection of the geometrical space to provide adequate and uniform lighting to the reaction system [17,18,19]. It is important to note that the walls of the vessel, where the photocatalytic reaction is carried out, must be transparent to the radiation used for the photoactivation of the photocatalyst. The irradiance is another critical parameter to the proper PhR design or selection. The irradiance (also named photon flux) indicates the energy per unit area, that is the energy of the incident photons on the catalysts surface. The irradiance is expressed in watts per square meter, this magnitude represents the power density at which photons arrive at the surface, considering the individual energies of the incident photons [20].
Also, for liquid photocatalytic reactions non-homogeneous distribution of the incident light can happen due to the opacity and turbidity of the liquid medium. Therefore, photocatalytic reactions carried out in liquid phase could be carried out unsatisfactorily. In addition, the nature of the liquid medium could promote or hinder the photocatalytic reactions, since the penetration of the radiation to the surface of the photocatalytic material cannot be reached properly [16,21]. Therefore, the selection of the liquid phase (solvent) is another important parameter to the design of photocatalytic processes due to the selected solvent will have a potential impact on the pathway of the incident light. Thus, the recombination rate of the photogenerated charge carrier species [e-/h+] can be increased or slowed, diminishing or promoting the photocatalytic activity, respectively [7]. In addition, the solid photocatalytic materials are difficult to separate from the liquid phase, mainly nanomaterials, at the end of the reaction [22,23].
The aim of this study is to evaluate several photoreactors, equipped with different radiation sources, to determine the optimal wavelength and irradiance to promote the photocatalytic activity and therefore, to select appropriately a photoreactor. For this, the photocatalytic reaction used in this work was carried out in solid phase to avoid non-homogeneity distribution of the light. Thus, methylene blue (MB) impregnated on Ag-TiO2 NPs supported on cotton fabric (AgTiC) was exposed to different photoreactor configurations to assess the photodegradation of MB. The photocatalytic activity was discussed based on the characterization results and kinetic analysis. Then, a kinetic photocatalytic model was proposed to relate the optical and electronic parameters of the photocatalyst with the photocatalytic activity.
2. Materials and Methods
Commercial indiolino fabric (100% cotton, 175 g/m2) was used as support. Titanium butoxide (97%), terbutanol (99%), acetic acid (99.7%), AgNO3 (99%), KOH (99%), NaBH4 (99%) and MB (95%) were provided by Merck and were used without further purification. TiO2 anatase (analytical grade) and Degussa P25 (TiO2 anatase/TiO2 rutile, 80%/20%) were used as references.
2.1. Synthesis of AgTiC
Cotton fabrics were initially functionalized with KOH solution (1 M) at room temperature under stirring for 10 min, according to [24]. Subsequently, the functionalized fabrics were washed with distilled water and dried. The anchoring of Ag and TiO2 NPs on the fabric was carried out by successive impregnation as was reported in previous work [25]. Briefly, the functionalized cotton fabrics were dipped into an aqueous solution of AgNO3 (0.02 M). After, the fabrics were dried at 90°C and then immersed in a NaBH4 solution for the reduction of the surface Ag+ ions to Ag0 NPs. Followed by the reduction process, the cotton fabric with anchored Ag NPs was washed with distilled water and dried at 90°C. TiO2 was incorporated on fabrics by hydrothermal synthesis as was reported by [26]. Then, cotton fabrics were immersed in a mixture of titanium butoxide (1 wt.%), terbutanol and acetic acid (90/10 wt.%) for 12 h under continuous stirring and at room temperature. Follow, the treated fabrics were dried and subjected to hydrothermal treatment in an autoclave at 110°C for 3 h. The obtained nanomaterial was dried at 50°C and it was labeled as AgTiC.
2.2. Physicochemical Characterization of the AgTiC Photocatalyst
The morphology of the AgTiC was analyzed by scanning electron microscopy (SEM) using a JEOL JSM-5900 LV microscope coupled with energy dispersive X-ray spectroscopy probe (EDS). The structure and particle size were analyzed by transmission electron microscopy (TEM) with a JEOL LEM-2010 microscope. The bandgap of the samples was determined by UV-vis diffuse reflectance spectroscopy (DRS) using a Perking Elmer Lambda 365. The photoluminescence quantum yield and the recombination rate of electron-hole pair [e-/h+] was evaluated by photoluminescence spectroscopy (PL) using a Jasco FP-8550 adapted with an integration sphere (ISF-134).
2.3. Photocatalytic Test
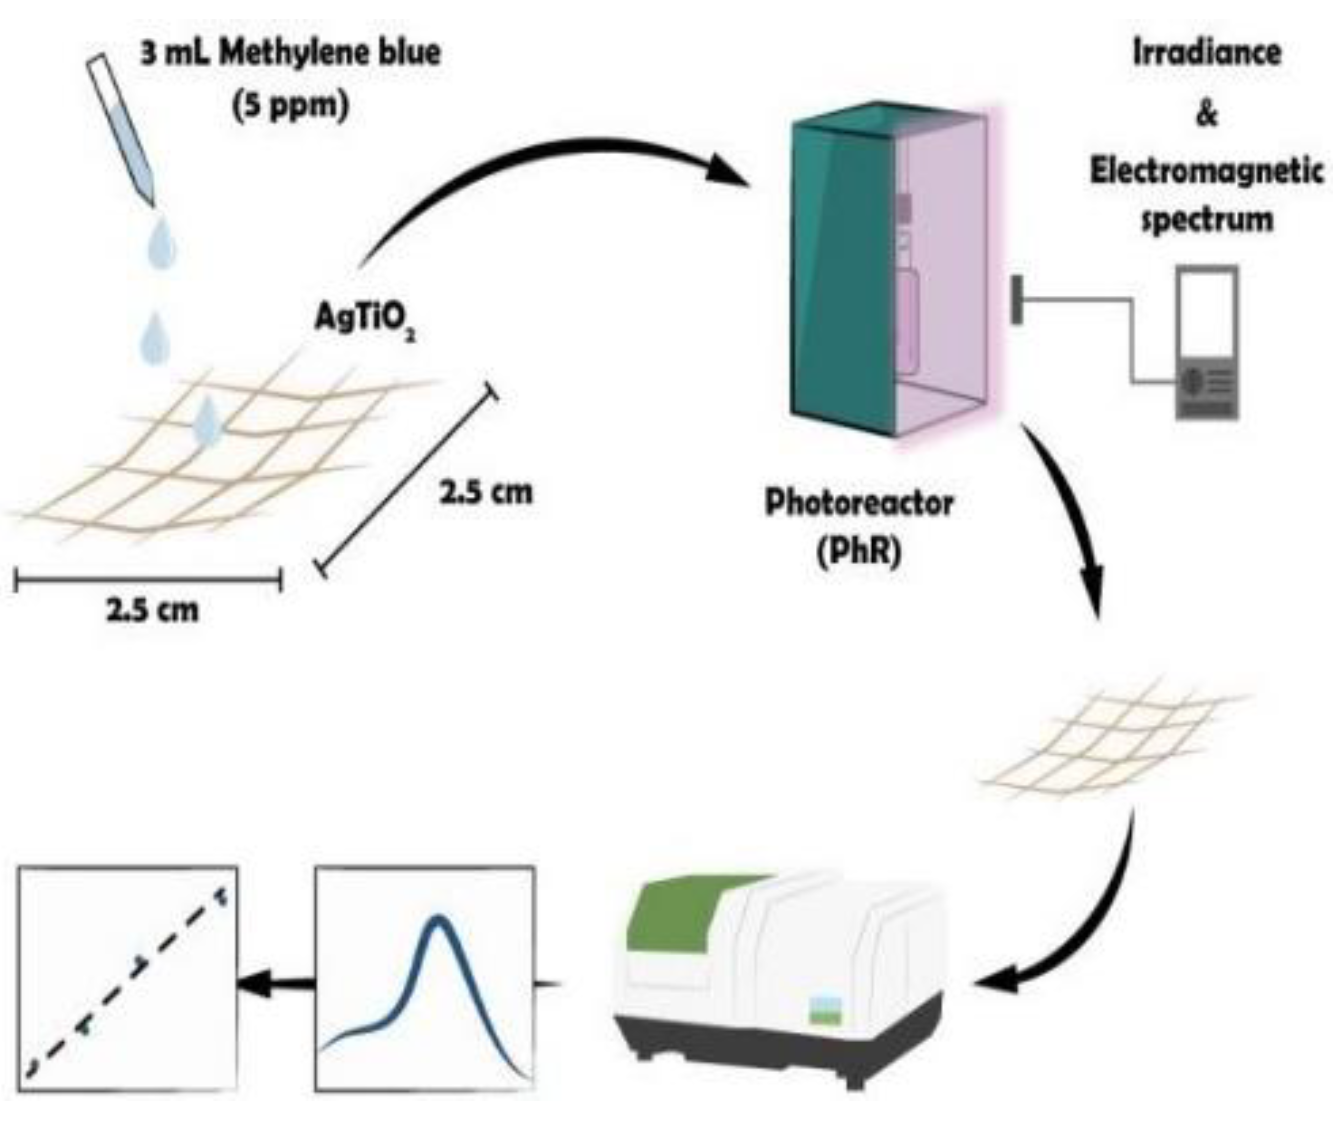
The photocatalytic activity of AgTiC was evaluated for the MB degradation in solid phase. For this, 3 mL of a MB solution (5 ppm) were impregnated on AgTiC squares of 2.5 cm x 2.5 cm. Then, the squares were exposed to radiation sources (UV and vis) within the photoreactor (Diagram 1). The solid samples were analyzed by UV-vis diffuse reflectance spectroscopy for solids (UV-vis DRS), at reaction times of 0, 15, 30, 60 and 90 min. The MB degradation and kinetic analysis was determined by the comparison of the initial concentration of MB (C0) at t = 0 min regarding to the concentration of MB at the reaction times sampled (C).
Diagram 1.
Experimental procedure for the analysis of the photodegradation of MB using AgTiC.
2.4. Characterization of Photoreactors
The photoreactors (PhRs) were equipped with a variety of irradiation sources such as low-pressure Hg lamp, UV-A type radiation lamp (T5 lamp), industrial LED luminaire lamp, greenhouse full-spectrum LED lamp and blue-radiation LED lamp. The photoreactors were labeled according to the equipped lamp and their characteristic technical parameters and specifications are shown in Table 1. PhR-Hg, equipped with fluorescent lamp, irradiate photons due to the interaction of electric current with Hg vapor. Meanwhile, PhR-T5, PhR-I, PhR-G and PhR-B, equipped with diode lamps, emitted photons due to the interaction of electric current with semiconductor diodes. The power consumed by the PhRs is a function of the wavelength and the emitted irradiance. Also, the geometrical space of the PhRs is important to determine the quantity and arrangement of the lamps. For example, tubular bulbs will only illuminate uniformly from the front of the lamp. Otherwise, if the sample is somewhat far from the front, it will be necessary to place more lamps for adequate illumination of the sample. Meanwhile, integrated diodes in a rectangular array could allow for a greater range of illumination, which could imply the use of few diodes. For the PhR-Hg the irradiance was switched by supplying different voltages. While the irradiance for PhR-T5, PhR-I, PhR-B and PhR-G were modified changing the position of the reaction system at different heights regarding to the irradiation source. The photocatalytic reactions were carried out under UV and vis radiation, and for comparative purposes solar radiation (winter in Mexico City) was also used. The emitted wavelength and the irradiance were recorded by an LMS-6000C and C-800 SEKONIC spectrometer. Additionally, spot irradiance measurements were recorded using a digital UV photometer (UV340B) and a wide-range lux meter (EA30-EXTECH) for UV (UVA+UVB) and visible wavelengths, respectively.
3. Results and Discussion
This section presents the characterization results, the electro-optical properties of the AgTiC and the emitted wavelength and irradiance of the radiation sources of the different PhRs used. Kinetic photocatalytic model was proposed considering the reactant equilibrium coverage (Langmuir isotherm), the pseudo photocatalytic steady state and the transfer processes of the photoinduced charge carrier species. Finally, the photocatalytic activity results for the degradation of MB are discussed and linked to the parameters above mentioned.
3.1. Scanning Electron Microscopy (SEM) and Transmission Electron Microscopy (TEM) Results
Figure 1 shows the SEM and TEM micrographs of AgTiC. The presence of NPs on the fabric is observed in the SEM micrograph, indicating successful synthesis of the TiO2 and Ag. The EDS elemental analysis (not shown) revealed an average Ti and Ag loading of 1.36 and 1.38 wt.%, respectively. The TEM micrograph shows quasi-spherical particles, dark and light. Which showed the presence of metallic Ag NPs by the largest and darkest particles in the micrograph, while the smallest and lightest particles correspond to TiO2 NPs. The particle size calculated by ImageJ software indicates an average value for Ag and TiO2 (anatase) NPs of 21 nm and 9.6 nm, respectively.
3.2. UV-vis Diffuse Reflectance Spectroscopy (UV-vis-DRS), Photoluminescence Spectroscopy (PL) and UV-vis Spectroscopy (UV-vis) of AgTiC
The bandgap energy (Eg) of the AgTiC was determined using the Kubelka-Munk function and the Tauc plot, assuming an indirect electronic transition from the valence band to the conduction band. The Eg value determined was 3.55 eV, therefore the minimum required wavelength for the photoactivation of AgTiC is ~ 360 nm. Whereas Eg values of reference materials were 3.2 eV and 3.0 eV for TiO2-anatase and Degussa P25, respectively. The increase of the Eg value for AgTiC is attributed to the smaller size of TiO2 NPs (9.6 nm) into the nanocomposite compared to the size of the TiO2 particles in bulk TiO2-anatase (> 50 nm) or Degussa P25 (~ 25 nm) [27]. It is important to note that although the Eg value indicates that AgTiC should be photoactivated by high-energy photons, from the UV spectrum, the presence of the nanoplasmomic Ag NPs could promote the absorption of lower-energy photons from vis radiation (> 400 nm) due to the localized surface plasmon resonance phenomenon (LSRP). According to [28], the Ag NPs promote the electron flow from the nanoplasmonic NPs towards the conduction band of the TiO2. Which should enhance photocatalytic activity due to charge carrier species remaining on the surface of the photocatalyst, in a Z-type scheme as has been reported for several semiconductors in photocatalytic processes.
The fluorescence 3D excitation-emission matrix for AgTiC indicated that at excitation wavelength (λex) of 350 nm, the intensity of the emitted fluorescence (λem) at 442 nm was maximal [25]. The emitted band at 442 nm is attributed to the excitonic emission from TiO2 due to vacancies on the surface [29]. Therefore, it is to be assumed that the optimal wavelength for the photoactivation of the AgTiC nanocomposite should be at 350 nm, which corresponds to high-energy photons from UV spectrum, as has also been suggested by the determined Eg value.
Since fluorescence radiation is due to the fall of electrons from the conduction band to the valence band, the intensity of the emitted fluorescence band at 442 nm can be used to determinate the [e-/h+] recombination rate. Therefore, a higher intensity of the band at 442 nm indicates greater electron recombination, and conversely, a lower band intensity indicates a slower recombination rate. It can be observed in Figure 2 the fluorescence band of AgTiC at 442 nm. For comparison purposes fluorescence band at 442 nm of reference compounds such as bare cotton and TiO2/cotton are also shown. The intensity of the band at 442 nm of AgTiC was lower than reference compounds, which suggests that recombination rate of [e-/h+] of AgTiC was very low.
Based on the results, AgTiC promoted better separation of the charge carrier species [e-/h+], boosting the charge carrier migration towards the material surface for the interfacial electron transfer processes to the generation of the reactive oxygen species (ROS). Therefore, it is presumed that simultaneous incorporation of NPs (Ag and TiO2) on the cotton fabrics promotes the greater predominance of charge carrier species on the surface of the nanocomposite.
Figure 3 shows the UV-vis spectrum of AgTiC, which presents absorption of photons from 200 to 650 nm. The absorption at 442 nm corresponds to the wavelength of the maximal phosphorescence emission (see Figure 2). The absorption at wavelengths corresponding to visible spectrum is attributed to the incorporation of Ag NPs, which extended the absorption of lower-energy photons. Therefore, AgTiC can be used as visible light-activated photocatalyst. Four intervals can be observed in Figure 3 to identify the type of irradiation required to the activation of AgTiC: UVC (200-280 nm), UVB (280-320 nm), UVA (320-400 nm) and visible (> 400 nm).
3.3. Determination of the Photoluminescence Quantum Yield (ϕpl) of AgTiC
It is important to note that generated charge carrier species could get three possible phenomena: 1) radiative recombination, 2) non-radiative recombination or 3) separation and charge species transfer. Radiative recombination phenomena are due to the relaxation processes of the [e-/h+], where [e-] from the conduction band fall to the valence band and occupy the [h+] sites. Non-radiative recombination phenomena refer to the [e-] in the conduction band that fall from a higher-energy electronic state to a lower-energy electronic state within the conduction band, the energy is lost as heat. Separation and charge species transfer refers to [e-/h+] species that are maintained on the surface of the semiconductor material and therefore, are involved in photocatalytic processes.
In this sense, the efficiency of the photocatalytic processes can be estimated by the photocatalytic quantum yield (Φpc), which can be interpreted as a parameter that indicates the number of charge carrier species directly involved in the photocatalytic process with respect to the total number of irradiated photons. Complementarily, the Φpc can be estimated by means of the photoluminescence quantum yield (ϕpl), which can be interpreted as the counterpart parameter. Photoluminescence quantum yield (ϕpl) is a parameter of semiconductor materials that quantify the capacity of the material to emit photons after this one is irradiated with photons that exceed the corresponding wavelength to its Eg. ϕpl is defined as the ratio of emitted photons respect to the absorbed photons [30,31]. The Φpc can be estimated by the consideration of the ϕpl and the non-radiative recombination processes [6]. Therefore, the intensity of the emitted fluorescence band at 350 nm (see Figure 2) can be used to estimate the ϕpl. Which can be determined by the comparison of the emitted fluorescence intensities at 350 nm of the AgTiC and the excitation light, where the last one corresponds to the total reflected light as phosphorescence (as reference).
A high value of ϕpl indicates that significant amount of photogenerated [e-/h+] recombine through radiative processes, releasing energy as light by fluorescence or phosphorescence phenomena. Conversely, low ϕpl could be interpreted as charge carrier species probably involved in photocatalytic processes. Therefore, desirable photocatalytic materials must have lower ϕpl values. Which suggests that radiative recombination phenomena are minimized and most likely separation and transport of charge carrier species to the photocatalyst surface happens. The ϕpl determined for AgTiC was 0.0175 meanwhile for TiO2/cotton was 0.21. Then, AgTiC absorbs more photons than TiO2/cotton, decreasing radiative recombination processes. Which suggests that photocatalytic activity should be better due to the greater amount of photogenerated charge carrier species on the surface on the photocatalytic material.
3.4. Irradiance and Emission Spectra of the Photoreactors (PhRs)
Figure 4 shows the irradiance (W/m2) as a function of the radiation wavelength for the tested PhRs. Figure 4a shows the irradiance for the PhR-T5 and it can be observed emission of UV-A radiation and low contribution of visible radiation (400-420 nm). The total irradiance recorded from 306-425 nm was 25.10 W/m2. The visible radiation (corresponding to violet color) represents less than 10% of the total emission spectrum, therefore PhR-T5 was classified as a source of UV-A radiation. Then, shorter wavelengths (more energetic) of the emitted UV-A radiation from PhR-T5 surpasses the wavelength required by the Eg of TiO2 but larger wavelengths could not activate the LSPR of Ag NPs, although it is important to note that irradiance value determined was quite low. PhR-B (Figure 4b) shows emissions in 400-500 nm, and the maximal emission was at ~450 nm. The total irradiance was 2360.44 W/m2. Despite the greater irradiance value, the minimum wavelength required for the photoactivation of AgTiC is not achieved with PhR-B. However, the irradiated photons in this interval could activate the LSPR of Ag NPs.
The PhR-Hg (Figure 4c) emitted radiation from UV (200-400 nm) and visible (> 400 nm) spectrum, the photons emitted from the visible spectrum correspond to a significant part of the blue spectrum. The total irradiance corresponding to the UV radiation (200-400 nm) was 41.10 W/m2 meanwhile the visible radiation at 400-500 nm generates a total irradiance of 60.20 W/m2. The total irradiance at wavelengths greater than 500 nm was 125.52 W/m2. According to previous sections, the photons with wavelengths below 360 nm could photoactivate the AgTiC. Although it is likely that photons with greater wavelengths than 360 nm could photoactivate the LSPR of Ag NPs, which should trigger the photocatalytic activity of the AgTiC.
The spectrum of PhR-I (see Figure 4d) shown emission from 420 to 780 nm, corresponding to visible spectrum. The total irradiance in 400-500 nm was 25.17 W/m2. Meanwhile, the irradiance increased to 35.86 W/m2 at wavelengths from 500 to 700 nm. Low irradiances were obtained by PhR-G (see Figure 4e). Since, total irradiance of 1.25 W/m2 at 420-500 nm was recorded, although a slight increase of the total irradiance (5.71 W/m2) was observed at 500-700 nm. The emission spectra of PhR-I and PhR-G (Figure 4d and Figure 4e) confirm that these radiation sources do not emit UV-radiation and provide only visible radiation. For these last irradiation sources, it is likely that the photons emitted between 420 and 500 nm could provide the necessary energy to activate the LSPR of Ag NPs in AgTiC. For comparison purposes, the irradiance for the solar radiation (winter in Mexico City) is shown in Figure 4f. The irradiances determined were significantly greater than other radiation sources used in this study. The total irradiance was 30.50 W/m2 in 200-400 nm, and a higher value was recorded (59.70 W/m2) in 400 to 500 nm. However, a significantly higher total irradiance of 163.20 W/m2 was observed at wavelengths greater than 500 nm. It is important to note that photoactivation of AgTiC (or LSPR) cannot be achieved if the specific wavelength value that establishes the Eg is not fulfilled, despite high irradiance values.
All PhRs tested emitted UV and visible radiation, however the irradiances recorded were different. The UV irradiance trend among the tested PhRs was solar radiation > PhR-Hg > PhR-T5 > PhR-I > PhR-G. Meanwhile, the visible irradiance trend of the PhRs was PhR-B > solar radiation > PhR-Hg > PhR-I > PhR-G > PhR-T5. The UV irradiance of PhR-Hg was 2-fold, 33-fold and 1.6-fold greater than UV irradiance for PhR-I, PhR-G and PhR-T5, respectively. In similar sense, visible irradiance of PhR-Hg was 3.5-fold and 22-fold greater than visible irradiance for PhR-I and PhR-G, respectively. It is important to note that visible irradiation was not significant using PhR-T5. Also, the visible irradiance for solar radiation was higher than others radiation sources.
Based on the above results, the selected PhRs for the photocatalytic degradation of MB were those with high irradiance, mainly in the UV spectrum. Thus, the PhR-Hg and PhR-T5 were used as radiation sources for the assessment of photocatalytic activity using AgTiC. In Table 2 the irradiances are reported as total values for the corresponding UV and visible intervals as established in Figure 4. The irradiance of the PhR-Hg was adjusted by switching the supplied voltage (75 or 90 V), while the PhR-T5 was placed at different heights with respect to the reaction system. The recorded irradiance from the PhRs is shown for UV and visible irradiation at the corresponding photoreactor setups. Irradiance of PhR-Hg was significatively greater than those for the PhR-T5, for both types of radiation.
3.5. Kinetic Photocatalytic Model (KPM)
A model that encompasses all aspects involved in the overall photocatalytic process is required for the kinetic description of the photocatalytic reactions. According to [32,33,34] the photocatalytic reaction rate must consider two fundamental aspects. The first one involves considering the heterogeneous reaction on the photocatalyst surface. The second one involves considering the optical and electronic processes that take place throughout the irradiation process. The photocatalytic reaction rate could be defined according to the photoinduced charge carrier transfer processes [35,36] as:
Where θA corresponds to the occupied surface fraction of the adsorbed reactant A, Φpc is the photocatalytic quantum efficiency and I is the irradiance. It is important to note that θA parameter involves the reactant equilibrium coverage in the same sense as Langmuir isotherm. However, for photocatalytic reactions the θA parameter is not the same as Langmuir stated.
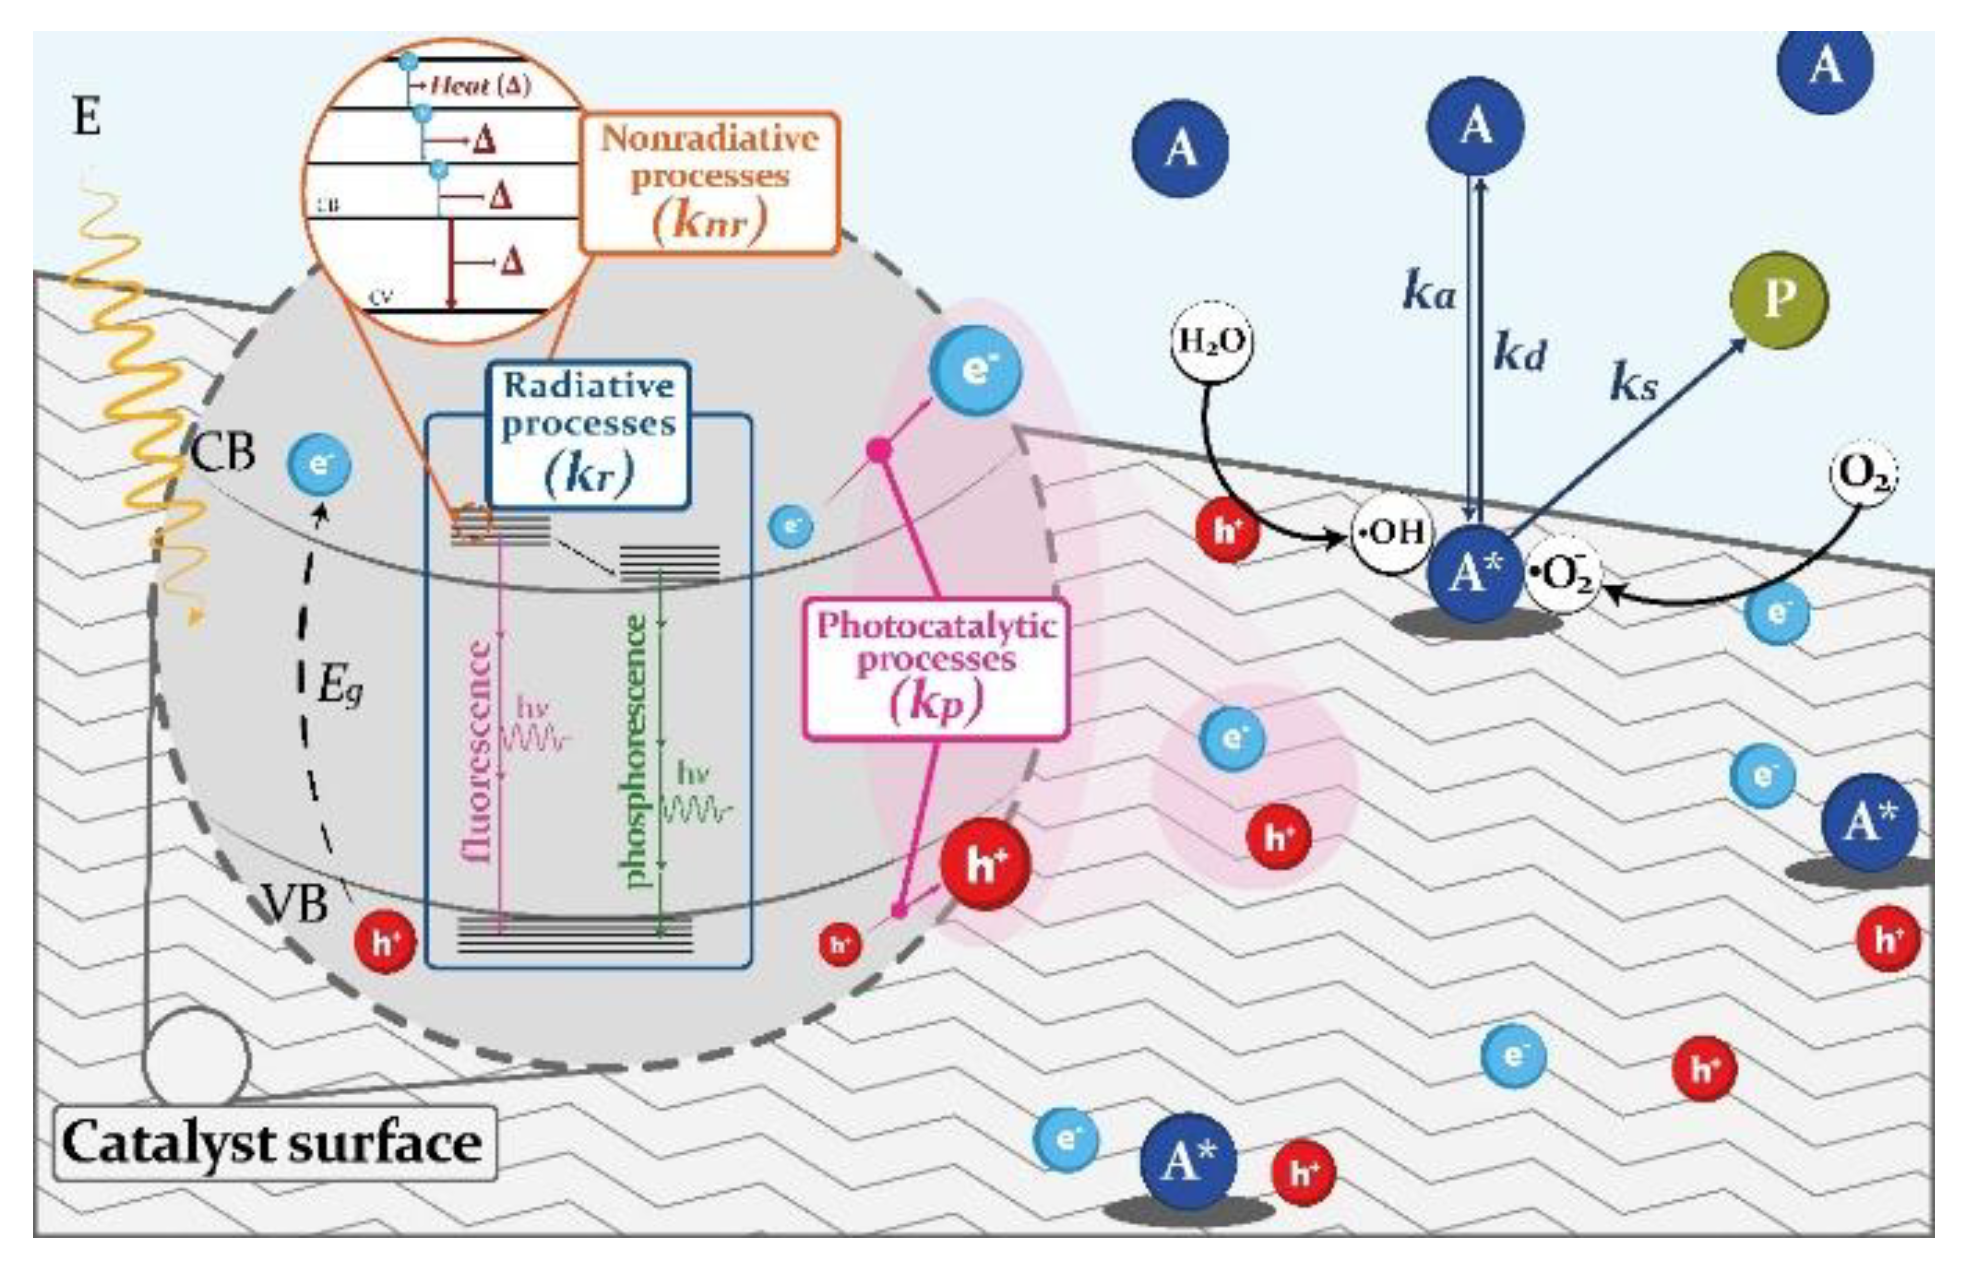
Diagram 2 shows the schematic representation of the photocatalytic process, also showing the recombination pathways of the charge carrier species.
Diagram 2.
Schematic representation of the kinetic photocatalytic model.
According to Diagram 2, reactant A must be absorbed on the photocatalytic surface, according to step 1:
Where * is the adsorption site and A* corresponds to the adsorbed reactant A. According to [33] photocatalytic reactions involve the generation of reactive intermediates such as free electrons [e-], holes [h+] and hydroxyl radicals [•OH -]. The adsorption-desorption equilibrium of reactant A could not be reached due to the reactivity of the A* with [•OH-] adsorbed on the surface. Thus, the slow step (single reactant adsorption) stated in the Langmuir-Hinshelwood model (LHM) is not fulfilled in photocatalysis, and a pseudo photocatalytic steady state approach must be utilized in the kinetic equation for reactant and surface radicals. This model assumes that reaction of adsorbed reactant with surface [•OH-] occurs, according to step 2:
Where ks refers to the surface reaction constant between adsorbed reactant A (A*) and the surface [•OH -].
Therefore, the surface reaction rate must be as follows:
In consequence, for a pseudo photocatalytic steady state reactant coverage is:
Where, K0 corresponds to the adsorption equilibrium constant of reactant A, which is a function on the irradiance intensity and the absorbed concentration of [•OH -]. This pseudo photocatalytic steady state model is mathematically analogous to the LHM, but with adsorption constants conceptually different.
It can be observed in Diagram 2 a zoomed-in view of a volume-element of photocatalytic surface, after the irradiation process. The optical and electronic processes, due to the irradiation process on the photocatalytic material, can be described as charge transfer processes [34]. The diagram shows the classification of the charge carrier transfer processes as radiative, non-radiative and photocatalytic processes. To clarify, it is important to note that in an irradiation process, the emitted photons with a wavelength greater than or equal to that the required by the Eg of the photocatalyst promote the generation of the pair [e-/h+]. Radiative processes refer to the recombination of the charge carrier species, where the [e-] into the conduction band (CB) fall to the valence band (VB) and therefore, the [h+] are occupied. The radiative processes are characterized by the radiative optical constant (kr). In radiative processes the phenomena of fluorescence and phosphorescence could happen. Fluorescence implies that [e-] falls from the singlet state in the CB to the singlet state in the VB, meanwhile in the phosphorescence the [e-] falls from the triplet state in the CB to the singlet state in the VB.
In the non-radiative processes, the charge carrier species do not recombine, that is the [e-] in the CB do not fall to the VB. The [e-] held in the CB could transfer energy as heat in an energy decay processes within the CB. These non-radiative processes are characterized by the non-radiative optical constant (knr). If the [e-] does not transfer energy as heat, the charge carriers are kept on the surface of the photocatalytic material, and the generation of reactive oxygen species (ROS) occurs. Thus, [e-/h+] pairs that do not recombine are the charge carrier species involved in the photocatalytic degradation of the adsorbed reactants. These charge carrier transfer processes are characterized by the photocatalytic optical constant (kp). The intrinsic electro-optic processes can be quantified by the photocatalytic quantum efficiency (Φpc). This characteristic parameter of the semiconductor materials allows the evaluation of the effectiveness of a photocatalyst for the generation of charge carrier species [e-/h+] that are maintained on the surface of the material, through non-recombination processes. Therefore, Φpc indirectly assesses the effective generation of charge carrier species, which could very likely be involved in the improvement of the photocatalytic activity.
The intrinsic optical and electronic processes are triggered by the irradiance (I) intensity on the photocatalyst. That is, high irradiance values promote photocatalytic activity more than low irradiance values, as stated [33]. Where the irradiance must be raised to an exponent that refers to the magnitude of the irradiance on the catalyst. The value of this exponent being less than one when irradiance is low. Demonstrating a significant dependence of the photocatalytic activity with the irradiance. In this sense, in the present work the effective irradiance (Ie) can be defined as the flux of photons with energy equal or higher than the Eg of the semiconductor material, which is necessary to generate the [e-/h+] pairs. That is, Ie must correspond to the minimum wavelength of the incident photons, which photoactivates the semiconductor material. Thus, in this work is proposed the kinetic photocatalytic model (KPM), which encompasses the surface reaction contributions (equations 1 to 6), the concurrent electronic and optical processes and the effective irradiance dependence, as follows:
3.6. Photocatalytic Activity Results for MB Degradation
Photocatalytic activities were determined using PhR-Hg, PhR-T5 and PhR-B since these photoreactor configurations reached an effective irradiance to activate the photocatalyst. It is important to note that photoactivation of the LSPR phenomenon can be achieved under these PhRs, contributing to the photocatalytic activity. Figure 5 shows the UV-vis DRS spectra of MB as a function of the wavelength. It can be observed the photodegradation of MB after 90 min using the PhR-Hg at 75 V, where an irradiance of 41.10 W/m2 was used.
It can be observed in Figure 5 that under PhR-Hg at 75 V (41.10 W/m2), the photoactivation of the AgTiC was achieved since the adsorption band of MB (λmax = 672 nm) decreases with the reaction time. MB was degraded almost 88 % after 90 min under PhR-Hg. Similar results were obtained by PhR-T5 and solar radiation for MB degradation. With PhR-B the MB degradation reached was near to 33%. For comparison purposes, the MB degradation was carried out on bare cotton fabrics in PhRs tested. The degradation of MB by photolysis was less than 5% at 90 min, as has also been reported by [37]. The photocatalytic efficiency under the different PhRs can be directly correlated with the irradiance profiles shown in Figure 4. For PhR-T5 the emitted radiation was mainly UV-A, therefore the wavelength was enough for the photoactivation of AgTiC. Which allows the generation of the [e-/h+] pair from TiO2, although the LSPR effect will not occur under this radiation source because its emitted wavelength was not enough for the LSPR photoactivation. According to Figure 4 PhR-B cannot photoactivate AgTiC due to the low-energy emitted wavelength at 450 nm. In this sense, PhR-Hg and solar radiation can achieve photoactivation of AgTiC and LSPR phenomena, more than other PhRs used in this study.
3.7. Pseudo First Order Kinetic Photocatalytic Model (PFO-KPM)
Since the photocatalytic degradation of MB using AgTiC was carried out in solid phase, the adsorption-desorption equilibrium of reactant A is not carried out. Then, the KPM can be simplified as pseudo first order kinetic photocatalytic model (PFO-KPM) as follows:
Where k=K0(Φpc)(Ieβ). If K0CA ≪ 1, then:
Thus k, the pseudo first order kinetic constant, can be determined as the scope of the of the following equation:
Figure 6 shows the photocatalytic activity of the AgTiC represented as pseudo-first order kinetic constant and the characteristic degradation time (τ), which is the reciprocal of k. Therefore, lower τ implies higher MB degradation and therefore, higher photocatalytic activity. Figure 6a shows the τ0 as a function of the total irradiance for PhR-Hg and PhR-T5, solar radiation was included for comparison. The total irradiance used is shown inside the bars. Where, for these photocatalytic tests, total irradiance refers to the sum of the UV and visible irradiance reported in Table 2, for each PhR configuration.
The photocatalytic results obtained with PhR-B (k = 0.0047 min-1, τ = 212.77 min) were excluded from the comparison due to their low relative photocatalytic activity. Therefore, despite high irradiance of PhR-B in the blue region of the visible spectrum (2360.44 W/m2) the LSPR phenomenon from Ag NPs could not be activated by the low-energy wavelength. In this sense, the photocatalytic activity with PhR-Hg and solar radiation was greater than with PhR-B. In Figure 6a two irradiances are shown for PhR-Hg, 101 W/m2 with 75 V and 143 W/m2 for 90 V. For PhR-T5 three irradiances are shown, 7.25 W/m2 at 11.5 cm, 9.50 W/m2 at 4.5 cm and 25.10 W/m2 at 0 cm. For all PhRs, the irradiated wavelengths were from 200 to 500 nm, being able to photoactivate AgTiC with the highest energy wavelengths
According to the results shown in Figure 6a, it is observed that higher irradiance values promoted better photocatalytic activity. That is, for PhR-Hg the irradiance of 143 W/m2 enhanced the photocatalytic activity regarding to the photocatalytic activity obtained under the irradiance of 101 W/m2. The same trend was observed for the photocatalytic activities obtained with different PhR-T5 configurations. Based on the τ indicated in Figure 6a, MB was degraded more effectively with PhR-Hg at 143 W/m2, meanwhile the less effective PhR configuration was PhR-T5 at 7.25 W/m2. That is, higher irradiance from PhR-Hg enhanced the photocatalytic MB degradation significatively regarding to lowest irradiance from PhR-T5. It is important to note that solar radiation inefficiently degraded the MB, due to the low-energy photons contained in the UV spectrum of this radiation source.
Figure 6b shows k values with PhR-Hg, PhR-T5 and for solar irradiation as a function of the total irradiance. The comparison of the highest tested irradiance for PhR-Hg (143 W/m2, at 90 V) with the lowest tested irradiance for PhR-T5 (7.25 W/m2 at 11.5 cm), indicated that irradiance was near to 20-times higher for PhR-Hg. The corresponding k values for PhR-Hg (143 W/m2, at 90 V) and PhR-T5 (7.25 W/m2 at 11.5 cm) were 0.033 and 0.0036 min-1, respectively. Which involves an improvement of the photocatalytic activity by almost 10-times for the PhR providing highest irradiance. That is, the photocatalytic activity was enhanced 10-times when the irradiance increased 20-times. It is important to note that tested PhRs emitted photons with different wavelengths, with the photons corresponding to the effective irradiance being those that enhanced the photocatalytic activity, as observed for PhR-Hg. These results highlight that photocatalytic activity is a function of the magnitude (intensity) of the irradiance as well as the wavelength emitted by the PhR.
3.8. Photocatalytic Activity as a Function of the Effective Irradiance
The relationship of the photocatalytic activity regarding the irradiance could be determined based on the photocatalytic activity results (section 3.5 and 3.5.1) and the KPM discussed in section 3.4. According to Figure 6 photocatalytic activity was enhanced at higher irradiances and when the wavelength irradiated is equal or lower than that required by the Eg of AgTiC. According to the Tauc plot analysis the Eg of the AgTiC was 3.55 eV. Therefore, the required wavelength for the photoactivation of AgTiC should be equal to or lower than 360 nm. Thus, it is imperative to identify the specific wavelengths to activate the photocatalyst and therefore assess in a proper way photocatalytic activity as a function of the irradiance. In this sense, the PhR-Hg (Figure 4c) emitted radiation from 200 nm to 780 nm. Thus, only the UV irradiance, equal to or lower than 360 nm, is suitable to photoactivate AgTiC. As mentioned previously, this specific irradiance at adequate wavelength is named the effective irradiance (Ie). Also, for PhR-Hg, it is very likely that photons from 400–500 nm could activate the LSPR from Ag NPs. Conversely, the photons from visible spectrum between 500-780 nm are not significantly absorbed by AgTiC and, therefore, do not contribute to the photocatalytic process.
The photocatalytic activity as a function of the irradiance should be determined and this relationship must be considered in the KPM. As well as it is important consider the I_e instead of total irradiance. To this, experimental photocatalytic data (for PhR-Hg and PhR-T5) were fitted considering the effective irradiance to determine the dependence of the photocatalytic activity with the irradiance, as follows:
From equation (9)
Thus:
Figure 7 shows the plot of ln(k) vs ln(Ie) for the photocatalytic tests carried out. It can be observed photocatalytic results under UV and UV+visible irradiation. For the UV irradiation tests the β coefficient, determined as the slope of the linear equation, was 0.99 (R2 = 0.93). This suggests that irradiance intensity with wavelength equal or lower than the required according to the Eg of AgTiC has a direct function with photocatalytic activity. For comparison purposes the photocatalytic activity under UV+visible irradiation was carried out considering the region equal or lower than 500 nm. It is important to note that visible radiation could only activate the LSPR of small fraction of the Ag NPs. The analysis of the data ln(k) vs ln(Ie) under UV+visible irradiance indicated a β of 0.61 (R2 = 0.90). This value of β suggests the presence of intrinsic inefficiencies for the absorption of incident photons, both for the photoactivation of TiO2 and Ag NPs, as had been previously assumed. The above results indicate that the type of radiation was preponderant to the photoactivation of the AgTiC, and therefore for the enhancement of the photocatalytic activity for the MB degradation.
Therefore, a representative kinetic correlation for the description of the photoactivity of AgTiC must consider only the fraction of UV irradiance (Ie), which is effective for the photoactivation. Then, it can be stated that high effective irradiance values are directly proportional to photocatalytic activity. It is important to note that experimental photocatalytic data obtained were fitted well with the equation (9). Where pseudo first order photocatalytic kinetic model and β=1 was considered, as follows:
4. Conclusions
The photocatalytic activity as a function of the effective irradiance, photocatalytic quantum yield and reactant coverage was assessed and kinetic analysis for methylene blue (MB) degradation was carried out for the proposal of kinetic photocatalytic model (KPM). The solid state photocatalytic MB degradation was performed using AgTiC. Among all photoreactors, those equipped with T5 and Hg lamps mainly emitted UV radiation, which photoactivate the nanocomposite. It was stated the effective irradiance as the specific wavelength for the photoactivation of the nanocomposite. With which the photocatalytic activity is promoted due to the photogeneration of charge carrier species [e-/h+]. Also, it was suggested that the photocatalytic activity was triggered by the LSPR phenomenon of the Ag nanoparticles, improving the photodegradation of MB. It was determined that high values of effective irradiance promoted proportionally photocatalytic activity. KPM was developed considering the assumptions of the pseudo steady state photocatalytic model and the optical and electronic processes of the charge carrier species. This study highlights the importance of carefully selecting the effective irradiance of PhRs, as well as high irradiance values, for proper evaluation of the photocatalytic activities.
Author Contributions
Conceptualization, L.C-C. and M.A.A.-A.; methodology, L.C.-C., M.A.A.-A., and U.C.-A.; validation, L.C.-C., M.A.A.-A. and U.C.-A.; formal analysis, L.C.-C., M.A.A.-A. and U.C.-A.; investigation, L.C.-C., M.A.A.-A. and U.C.-A.; resources, L.C.-C. and M.A.A.-A.; data curation, M.A.A.-A., and U.C.-A.; writing—original draft preparation, L.C.-C., M.A.A.-A. and U.C.-A.; writing—review and editing, L.C.-C., and M.A.A.-A.; supervision, L.C.-C. and M.A.A.-A.; project administration, L.C.-C. and M.A.A.-A.; funding acquisition, L.C.-C. and M.A.A.-A. All authors have read and agreed to the published version of the manuscript.
Funding
This research was funded by SUPPORT PROGRAM FOR RESEARCH AND TECHNOLOGICAL INNOVATION PROJECTS (PAPIIT-DGAPA) OF UNAM, grant number IV100124 and IN102523 and The APC was funded by IA105125 by PAPIIT-DGAPA-UNAM.
Data Availability Statement
The data presented in this study are available on request from the corresponding author.
Acknowledgments
U. Chacon-Argaez acknowledged CONAHCYT-SECIHTI support (No. 814300).
Conflicts of Interest
The authors declare no conflicts of interest.
Abbreviations
The following abbreviations are used in this manuscript:
| ka | Adsorption constant of reactant A |
| AgTiC | Ag-TiO2 NPs supported on cotton fabric |
| Eg | Band gap energy |
| τ | Characteristic degradation time |
| Concentration of the reactant A in fluid phase | |
| CB | Conduction band |
| kd | Desorption constant of reactant A |
| EDS | Energy dispersive X-ray spectroscopy probe |
| [e-/h+] | Electron and hole photogenerated pair |
| Ie | Effective irradiance |
| λem | Fluorescence emission wavelength |
| λex | Fluorescence excitation wavelength |
| I | Irradiance |
| KPM | Kinetic photocatalytic model |
| LHM | Langmuir-Hinshelwood model |
| LED | Light emitting diodes |
| LSRP | Localized surface plasmon resonance phenomenon |
| MB | Methylene blue |
| NPs | Nanoparticles |
| knr | Non-radiative optical constant |
| Occupied surface fraction of the adsorbed reactant A | |
| Photocatalytic adsorption-desorption equilibrium constant of reactant A | |
| φpl | Photoluminescence quantum yield |
| Photocatalytic quantum yield | |
| PL | Photoluminescence spectroscopy |
| PhR | Photoreactor |
| PhR-Hg | Photoreactor equipped with Low pressure Hg lamp |
| PhR-T5 | Photoreactor equipped with UV-A type radiation-T5 lamp |
| PhR-I | Photoreactor equipped with Industrial LED luminaire lamp |
| PhR-G | Photoreactor equipped with Greenhouse Full-spectrum LED lamp |
| PhR-B | Photoreactor equipped with Blue-radiation LED lamp |
| Photocatalytic pseudo first order kinetic constant | |
| PFO-KPM | Pseudo first order kinetic photocatalytic model |
| kr | Radiative optical constant |
| Rate of degradation of reactant A over time | |
| rA | Reaction rate of molecule A |
| ROS | Reactive oxygen species |
| SEM | Scanning electron microscopy |
| ks | Surface reaction constant of reactant A |
| t | Time |
| TEM | Transmission electron microscopy |
| UV | Ultraviolet radiation |
| UVC | Ultraviolet type-C radiation |
| UVB | Ultraviolet type-B radiation |
| UVA | Ultraviolet type-A radiation |
| UV-vis-DRS | UV-vis diffuse reflectance spectroscopy |
| UV-vis | UV-vis spectroscopy |
| VB | Valence band |
| Vis | Visible radiation |
References
- Mishra, S.; Sundaram, B. A review of the photocatalysis process used for wastewater treatment. Mater. Today: Proc 2024, 102, 393–409. [Google Scholar] [CrossRef]
- Kumari, H.; Sonia, Suman; Ranga, R.; Chahal, S.; Devi, S; Sharma, S.; Kumar, S.; Kumar, P.; Kumar, S.; Kumar, A.; Parmar, R. A review on photocatalysis used for wastewater treatment: dye degradation. Water Air Soil Pollut 2023, 234(6). [Google Scholar] [CrossRef] [PubMed]
- Puentes-Morales, C.; Pedroza-Camacho, L. D.; Mateus-Maldonado, J. F.; Lores-Acosta, J. C.; Pedroza-Cubides, M. C.; Ramirez-Rodríguez, J.; Salcedo-Reyes, J. C.; Díaz-Ariza, L. A.; Pedroza-Rodríguez, A. M. Biological and photocatalytic treatment at pilot plant scale of synthetic coloured wastewater produced in university teaching laboratories. RMIQ 2021, 20(2), 521–539. [Google Scholar] [CrossRef]
- Luna-Sánchez, R. A.; Zermeno-Resendiz, B. B.; Moctezuma, E.; Contreras-Bermúdez, R. E.; Leyva, E.; López-Barragán, M. A. Photodegradation of omeprazole in aqueous solution using TiO2 as catalyst. RMIQ 2013, 12(1), 85–95. 289. Available online: https://www.scielo.org.mx/pdf/rmiq/v12n1/v12n1a9.pdf.
- Kisch, H.; Bahnemann, D. Best practice in photocatalysis: comparing rates or apparent quantum yields? JPCL 2015, 6(10), 1907–1910. [Google Scholar] [CrossRef]
- Bloh, J. Z. A Holistic Approach to Model the Kinetics of Photocatalytic Reactions. Front. Chem 2019, 7(128). [Google Scholar] [CrossRef]
- Guo, Q.; Zhou, C.; Ma, Z.; Ren, Z.; Fan, H.; Yang, X. 11 - Fundamental Processes in Surface Photocatalysis on TiO2. In Heterogeneous photocatalysis: From Fundamentals to Green Applications (2016); Colmenares, J.C., Xu, Y.J., Eds.; Springer: New York; Volume 335, pp. Pp. 361–416. [CrossRef]
- Kisch, H. Semiconductor photocatalysis for chemoselective radical coupling reactions. Acc. Chem. Res 2017, 50(4), 1002–1010. [Google Scholar] [CrossRef]
- H. Semiconductor photocatalysis - mechanistic and synthetic aspects. ACIE 2013, 52(3), 812–847. [Google Scholar] [CrossRef]
- Farbod, M.; Khademalrasool, M. Synthesis of TiO2 nanoparticles by a combined sol-gel ball milling method and investigation of nanoparticle size effect on their photocatalytic activities. Powder Technol (2011) 214(3), 344–348. [CrossRef]
- Franking, R. A.; Landis, E. C.; Hamers, R. J. Highly stable molecular layers on nanocrystalline anatase TiO2 through photochemical grafting. Langmuir 2009, 25(18), 10676–10684. [Google Scholar] [CrossRef]
- Yerli-Soylu, N.; Akturk, A.; Kabak, Ö.; Erol-Taygun, M.; Karbancioglu-Guler, F.; Küçükbayrak, S. TiO2 nanocomposite ceramics doped with silver nanoparticles for the photocatalytic degradation of methylene blue and antibacterial activity against Escherichia coli. Eng. Sci. Technol. Int. J 2022, 35, 101175. [Google Scholar] [CrossRef]
- Li, W.; Li, B.; Meng, M.; Cui, Y.; Wu, Y.; Zhang, Y.; Dong, H.; Feng, Y. Bimetallic Au/Ag decorated TiO2 nanocomposite membrane for enhanced photocatalytic degradation of tetracycline and bactericidal efficiency. Appl. Surf. Sci 2019, 487, 1008–1017. [Google Scholar] [CrossRef]
- Ahlawat, M.; Mittal, D.; Govind Rao, V. Plasmon-induced hot-hole generation and extraction at nano-heterointerfaces for photocatalysis. Commun. Mater (2021) 2(1), 114. [CrossRef]
- Chacon-Argaez, U.; Alvarez-Amparán, M. A.; Cedeño-Caero, L. Performance of V–Fe based catalysts on the oxidation of dibenzothiophenes. Chemosphere 2024, 362, 142791. [Google Scholar] [CrossRef]
- Mazierski, P.; Bajorowicz, B.; Grabowska, E.; Zaleska-Medynska, A. 7 - Photoreactor Design Aspects and Modeling of Light. In Heterogeneous photocatalysis: From Fundamentals to Green Applications; Colmenares, J.C., Xu, Y.J., Eds.; Springer: New York, 2016; Volume 335, pp. Pp. 211–248. [Google Scholar] [CrossRef]
- Khademalrasool, M.; Farbod, M.; Talebzadeh, M. D. The improvement of photocatalytic processes: Design of a photoreactor using high-power LEDs. Sci.: Adv. Mater. Devices 2016, 1(3), 382–387. [Google Scholar] [CrossRef]
- Subagio, D. P.; Srinivasan, M.; Lim, M.; Lim, T. T. Photocatalytic degradation of bisphenol-A by nitrogen-doped TiO2 hollow sphere in a vis-LED photoreactor. Appl. Catal. B: Environ 2010, 95(3-4), 414–422. [Google Scholar] [CrossRef]
- Nishio, J.; Tokumura, M.; Znad, H. T.; Kawase, Y. Photocatalytic decolorization of azo-dye with zinc oxide powder in an external UV light irradiation slurry photoreactor. Hazard. Mater (2006) 138(1), 106–115. [CrossRef]
- Landsberg, J.; Sands, P. Chapter 2 -Weather and energy balance. In Terrestrial Ecology, (book series); Elsevier, 2011; Vol 4, pp. Pp. 13–48. [Google Scholar] [CrossRef]
- Silva, D. B.; Buttiglieri, G.; Babić, T.; Ćurković, L.; Babić, S. Impact of UV-LED photoreactor design on the degradation of contaminants of emerging concern. Process Saf. Environ. Prot 2021, 153, 94–106. [Google Scholar] [CrossRef]
- Brüninghoff, R.; Wenderich, K.; Korterik, J. P.; Mei, B. T.; Mul, G.; Huijser, A. Time-dependent photoluminescence of nanostructured anatase TiO2 and the role of bulk and surface processes. Phys. Chem. C 2019, 123(43), 26653–26661. [Google Scholar] [CrossRef]
- Knorr, F. J.; Mercado, C. C.; McHale, J. L. Trap-state distributions and carrier transport in pure and mixed-phase TiO2: influence of contacting solvent and interphasial electron transfer. Phys. Chem. C 2008, 112(33), 12786–12794. [Google Scholar] [CrossRef]
- Dong, B. H.; Hinestroza, J. P. Metal nanoparticles on natural cellulose fibers: electrostatic assembly and in situ synthesis. ACS Appl. Mater. Interfaces 2009, 1(4), 797–803. [Google Scholar] [CrossRef] [PubMed]
- Chacon-Argaez, U.; Cedeño-Caero, L.; Cadena-Nava, R. D.; Ramirez-Acosta, K.; Moyado, S. F.; Sánchez-López, P.; Alonso Núñez, G. Photocatalytic Activity and Biocide Properties of Ag–TiO2 Composites on Cotton Fabrics. Materials (2023) 16(13), 4513. [CrossRef] [PubMed]
- Alvarez-Amparán, M. A.; Martínez-Cornejo, V.; Cedeño-Caero, L.; Hernandez-Hernandez, K. A.; Cadena-Nava, R. D.; Alonso-Núñez, G.; Moyado, S. F. Characterization and photocatalytic activity of TiO2 nanoparticles on cotton fabrics, for antibacterial masks. Appl. Nanosci 2022, 12(12), 4019–4032. [Google Scholar] [CrossRef] [PubMed]
- Reddy, K. M.; Manorama, S. V.; Reddy, A. R. Bandgap studies on anatase titanium dioxide nanoparticles. Mater. Chem. Phys 2003, 78(1), 239–245. [Google Scholar] [CrossRef]
- Chen, K.; Feng, X.; Tian, H.; Li, Y.; Xie, K.; Hu, R.; Cai, Y.; Gu, H. Silver-decorated titanium dioxide nanotube arrays with improved photocatalytic activity for visible light irradiation. Mater. Res 2014, 29(11), 1302–1308. [Google Scholar] [CrossRef]
- Saha, A.; Moya, A.; Kahnt, A.; Iglesias, D.; Marchesan, S.; Wannemacher, R.; Prato, M.; Vilatela, J. J.; Guldi, D. M. Interfacial charge transfer in functionalized multi-walled carbon nanotube@TiO2 nanofibres. Nanoscale 2017, 9(23), 7911–7921. [Google Scholar] [CrossRef]
- Lindsey, J. S.; Taniguchi, M.; Bocian, D. F.; Holten, D. The fluorescence quantum yield parameter in Förster resonance energy transfer (FRET)—Meaning, misperception, and molecular design. CPR 2021, 2, 011302. [Google Scholar] [CrossRef]
- Lasa, H.; Serrano, B.; Salaices, M. Photocatalytic Reaction Engineering, 1st edition; Springer: New York, 2005. [Google Scholar] [CrossRef]
- Molinari, R.; Argurio, P.; Bellardita, M.; Palmisano. 3.5 Photocatalytic processes in membrane reactors. In Comprehensive Membrane Science and Engineering (Second Edition); Drioli, E., Giorno, L., Fontananova, E., Eds.; Elsevier, 2017; pp. Pp. 101–138. [Google Scholar] [CrossRef]
- Ollis, D. F. Kinetics of liquid phase photocatalyzed reactions: an illuminating approach. Phys. Chem. B 2005, 109(6), 2439–2444. [Google Scholar] [CrossRef]
- Ohtani, B. Chapter 10 - Photocatalysis by inorganic solid materials: Revisiting its definition, concepts, and experimental procedures. In Advances in Inorganic Chemistry; van Eldik, R., Stochel, G., Eds.; Academic Press, 2011; Volume 63, pp. Pp. 395–430. [Google Scholar] [CrossRef]
- Tran, H. D.; Nguyen, D. Q.; Do, P. T.; Tran, U. N. Kinetics of photocatalytic degradation of organic compounds: a mini-review and new approach. RSC Adv (2023) 13(25), 16915–16925. [CrossRef]
- Asenjo, N. G.; Santamaría, R.; Blanco, C.; Granda, M.; Álvarez, P.; Menéndez, R. Correct use of the Langmuir–Hinshelwood equation for proving the absence of a synergy effect in the photocatalytic degradation of phenol on a suspended mixture of titania and activated carbon. Carbon 2013, 55, 62–69. [Google Scholar] [CrossRef]
- Sáenz-Trevizo, A.; Pizá-Ruiz, P.; Chávez-Flores, D.; Ogaz-Parada, J.; Amézaga-Madrid, P.; Vega-Ríos, A.; Miki-Yoshida, M. On the discoloration of methylene blue by visible light. J. Fluoresc 2019, 29, 15–25. [Google Scholar] [CrossRef]
Figure 1.
(a) SEM and (b) TEM micrographs of AgTiC.
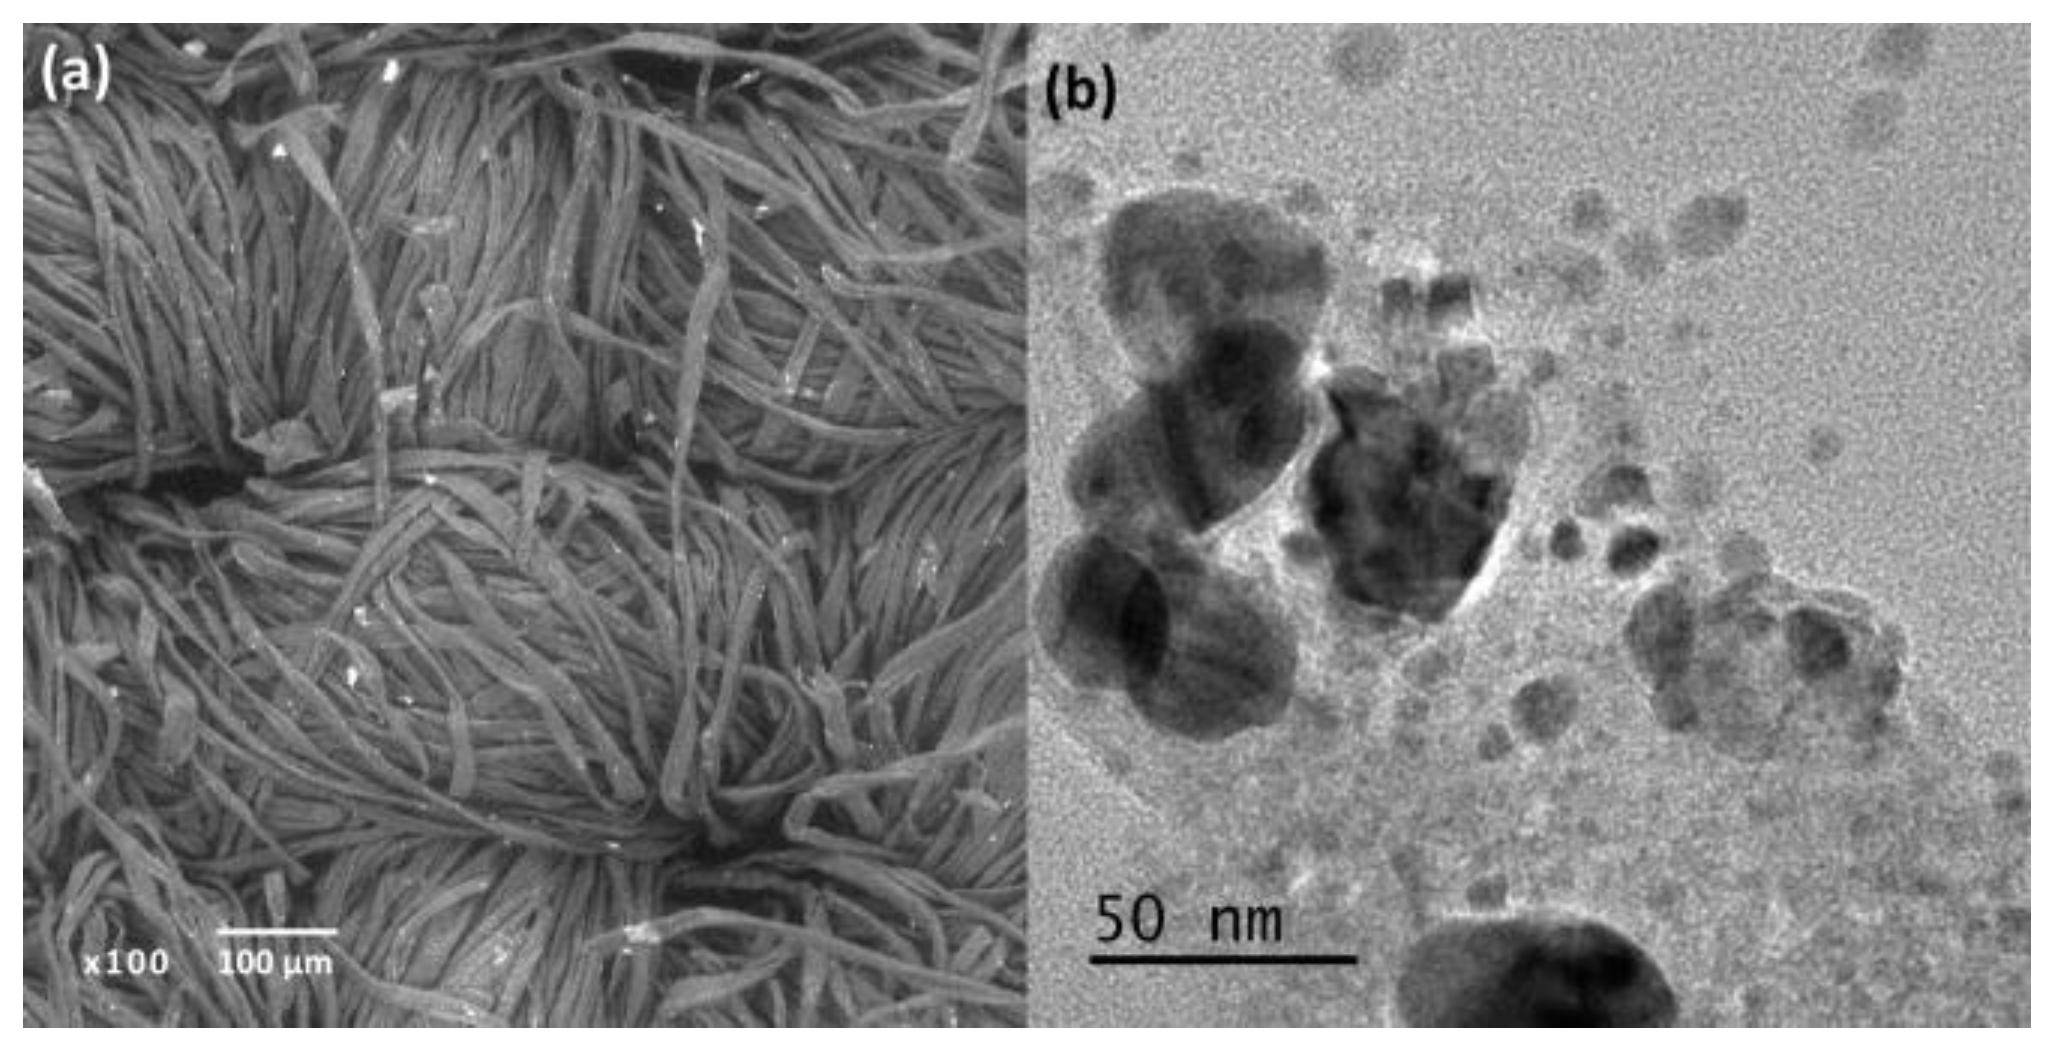
Figure 2.
Emission fluorescence spectra of AgTiC, cotton and TiO2/cotton.
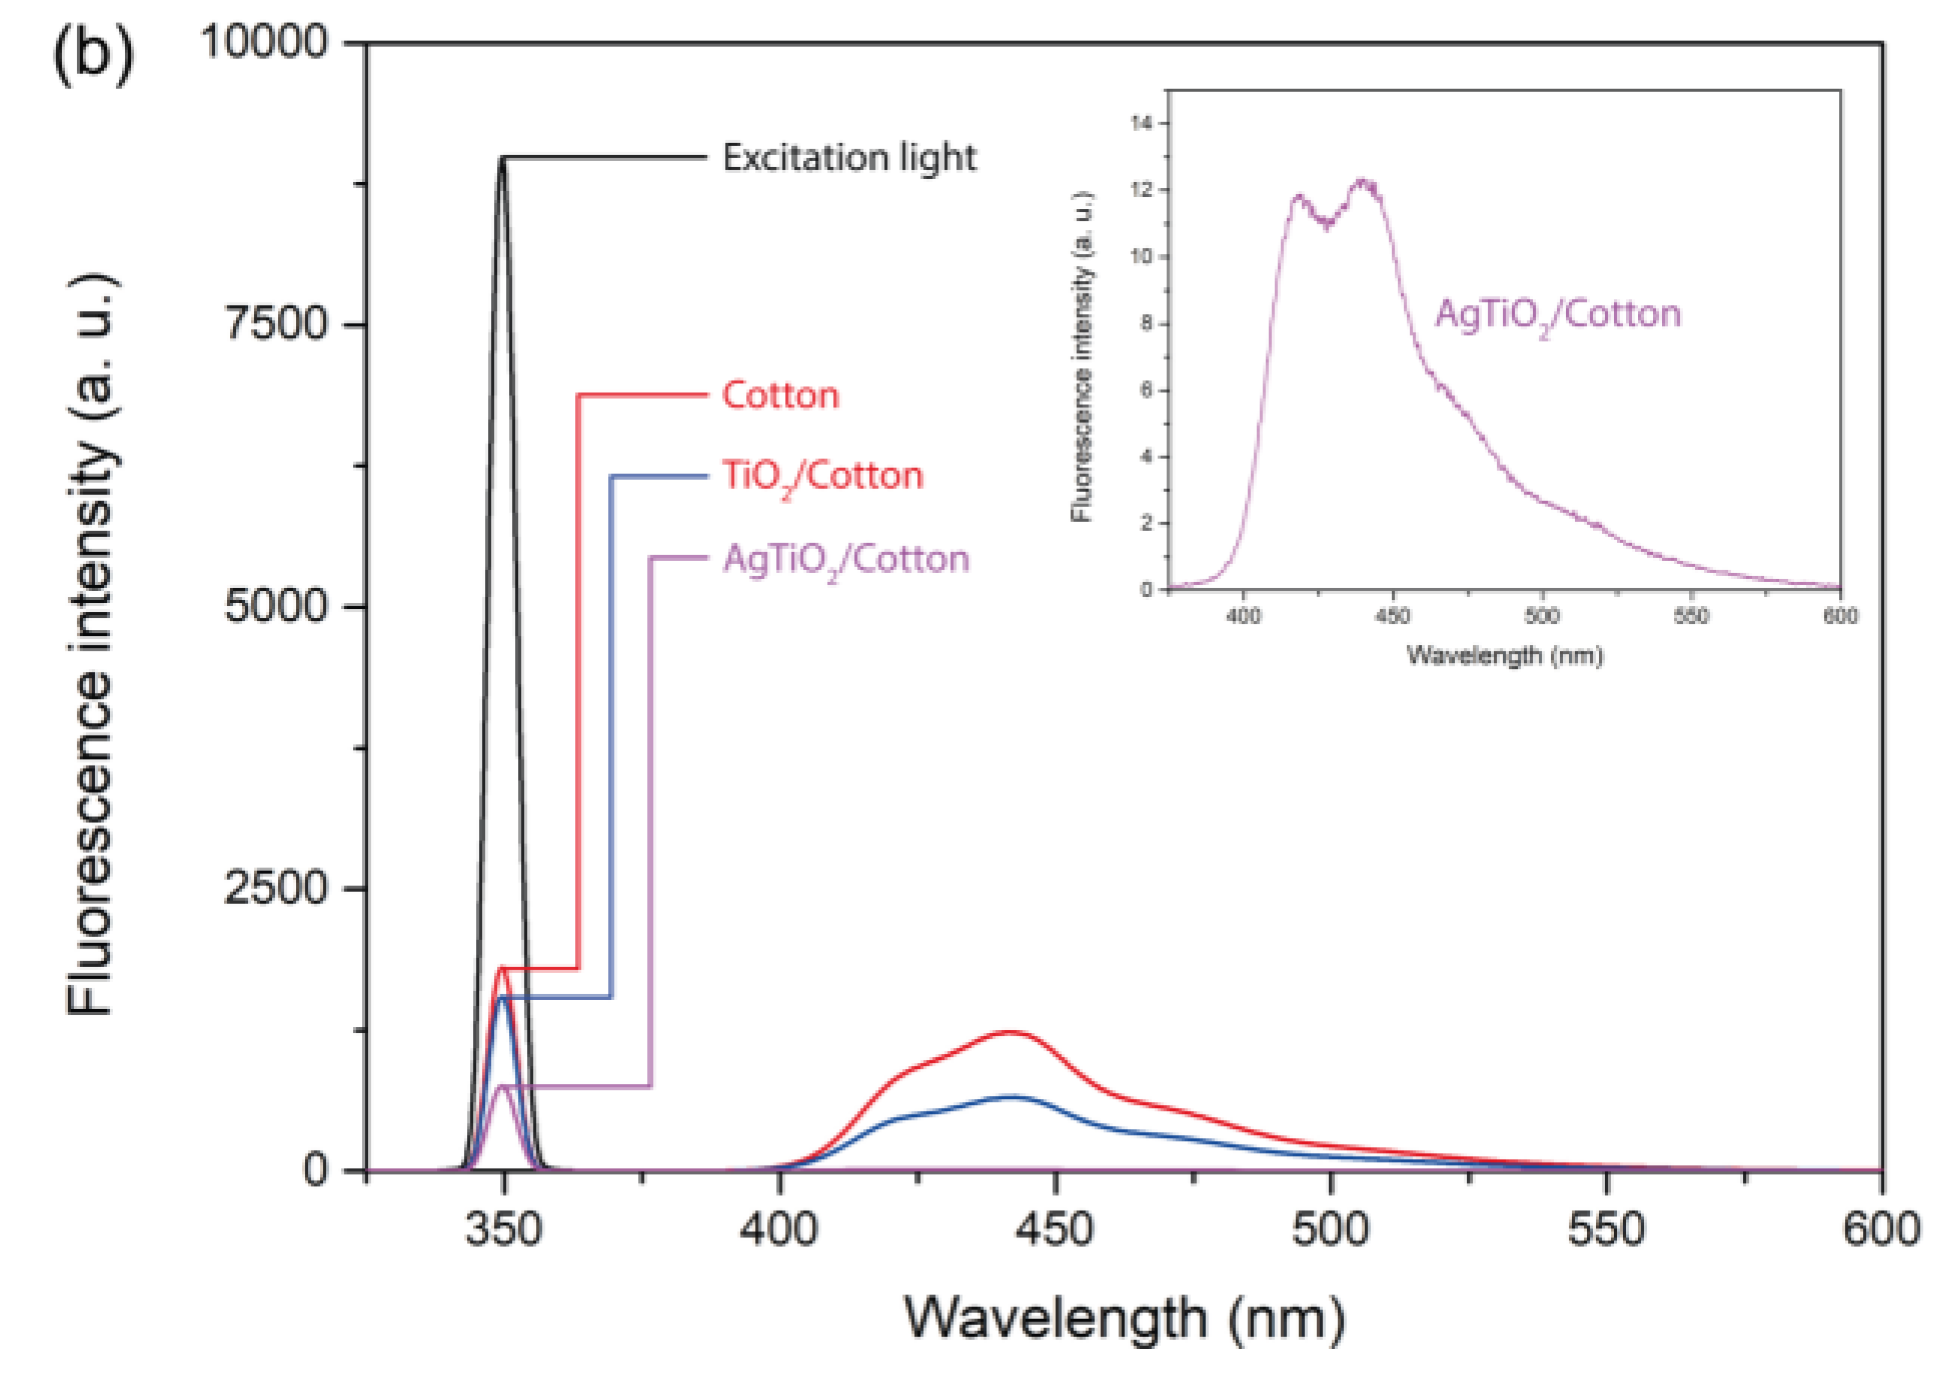
Figure 3.
UV-vis spectrum of AgTiC.
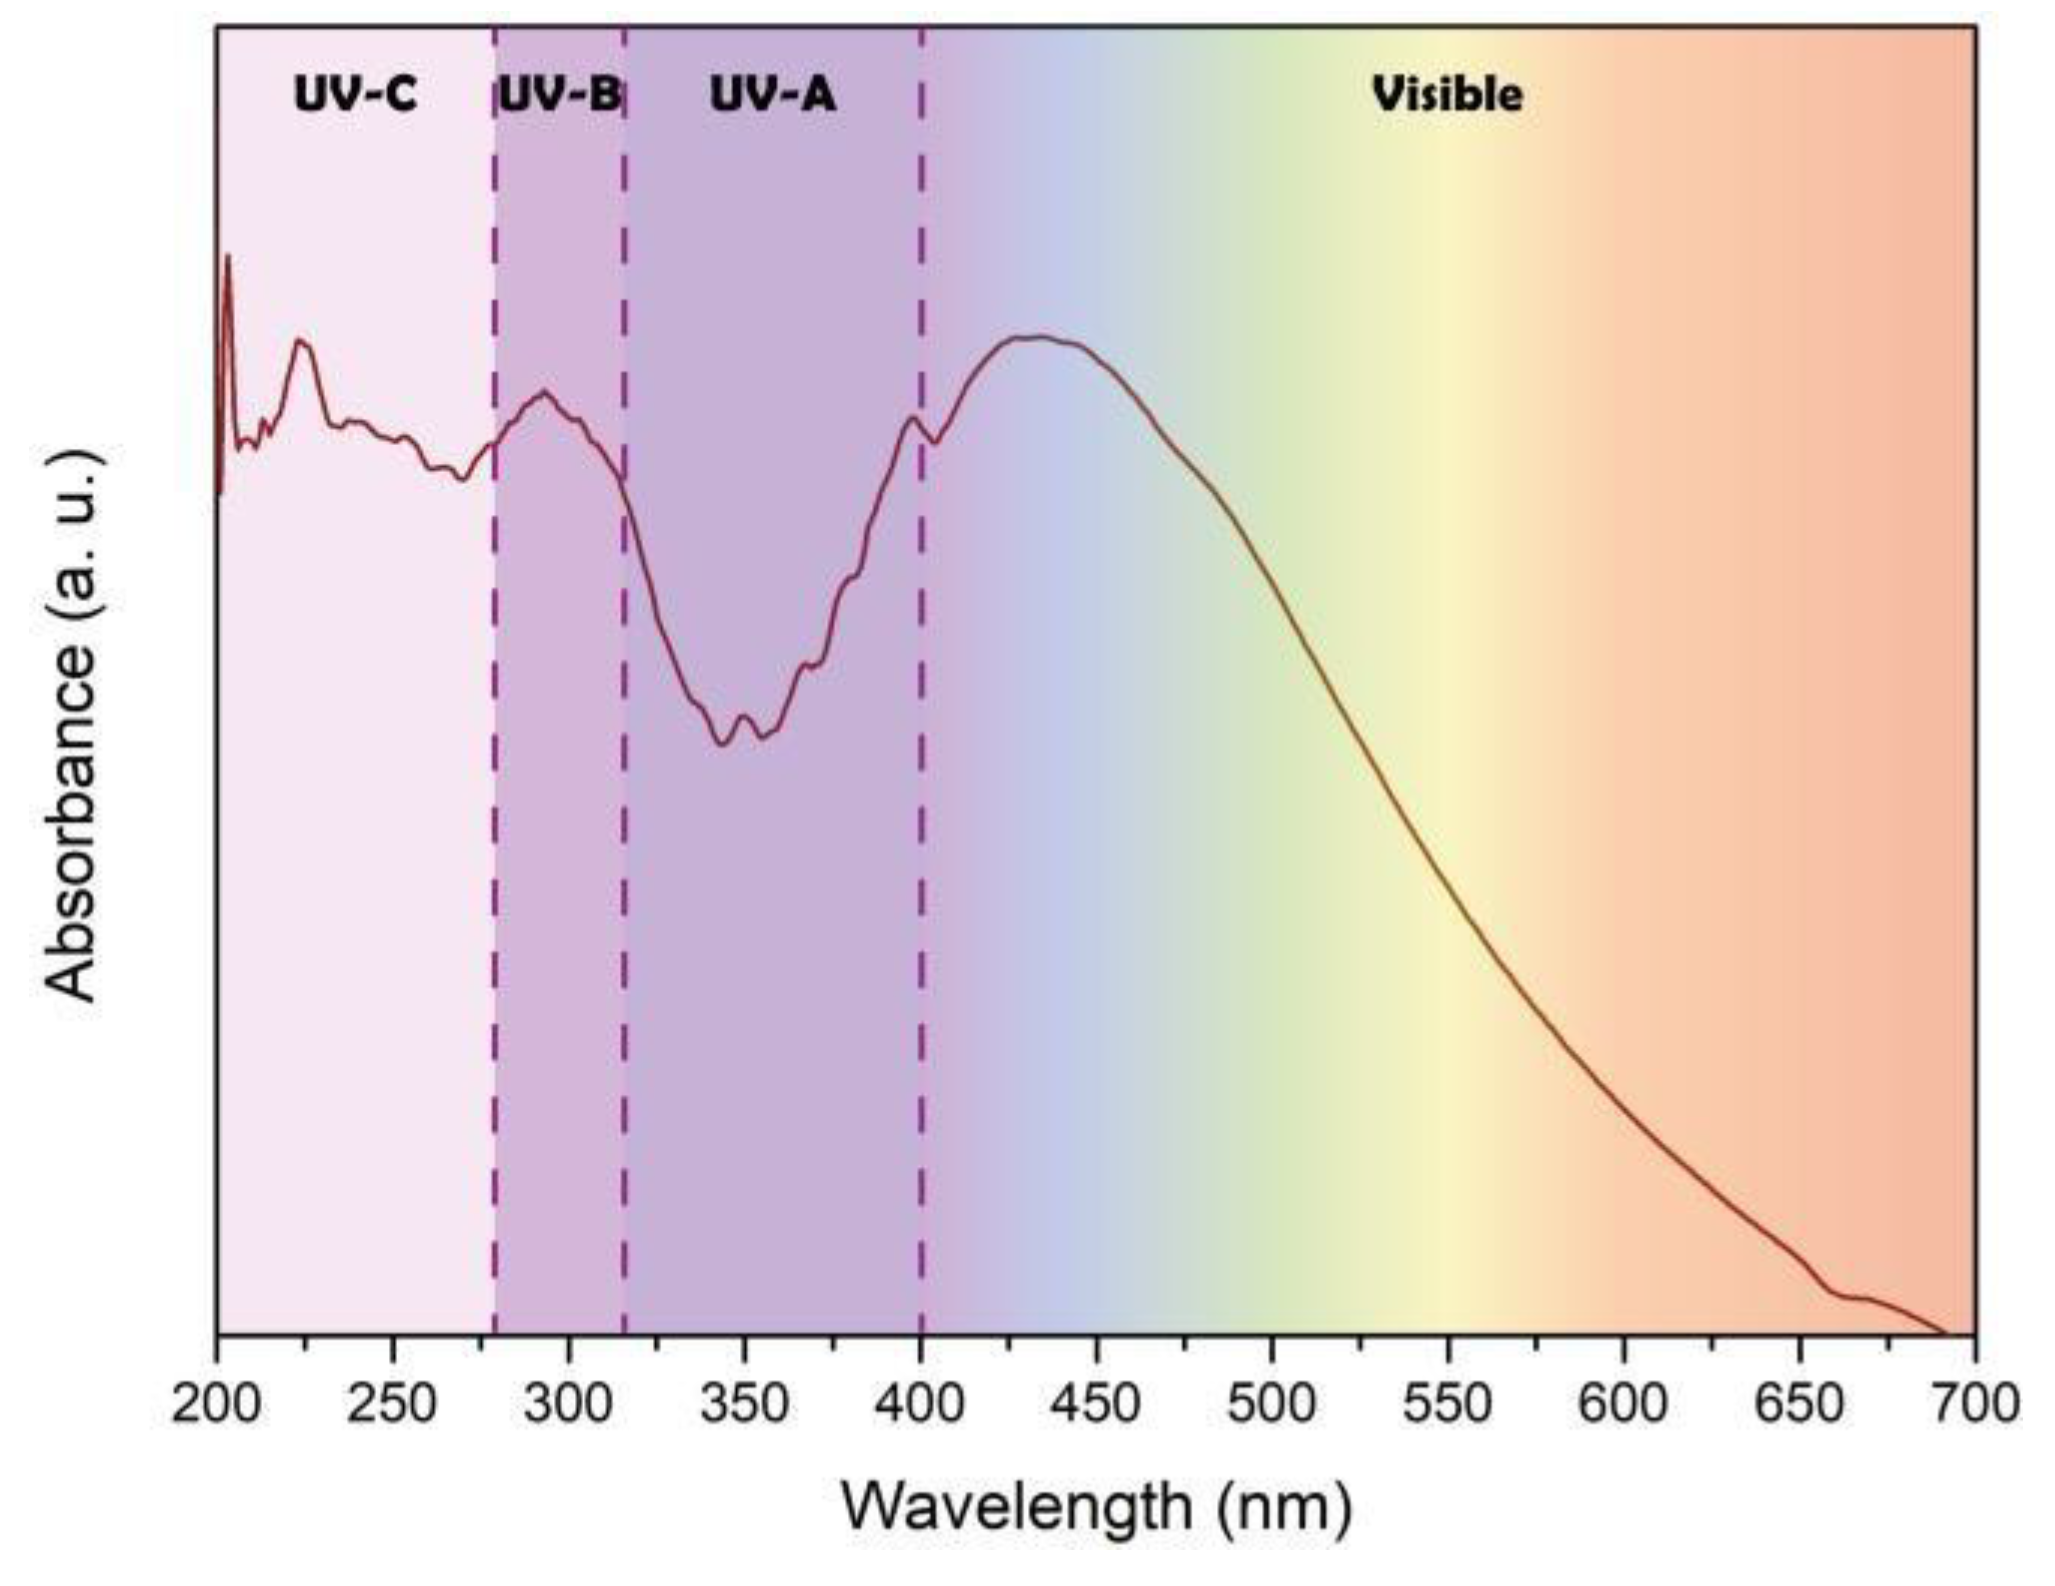
Figure 4.
Emission spectra and total irradiance for (a) PhR-T5, (b) PhR-B, (c) PhR-Hg, (d) PhR-I, (e) PhR-G and (f) solar radiation.
Figure 4.
Emission spectra and total irradiance for (a) PhR-T5, (b) PhR-B, (c) PhR-Hg, (d) PhR-I, (e) PhR-G and (f) solar radiation.
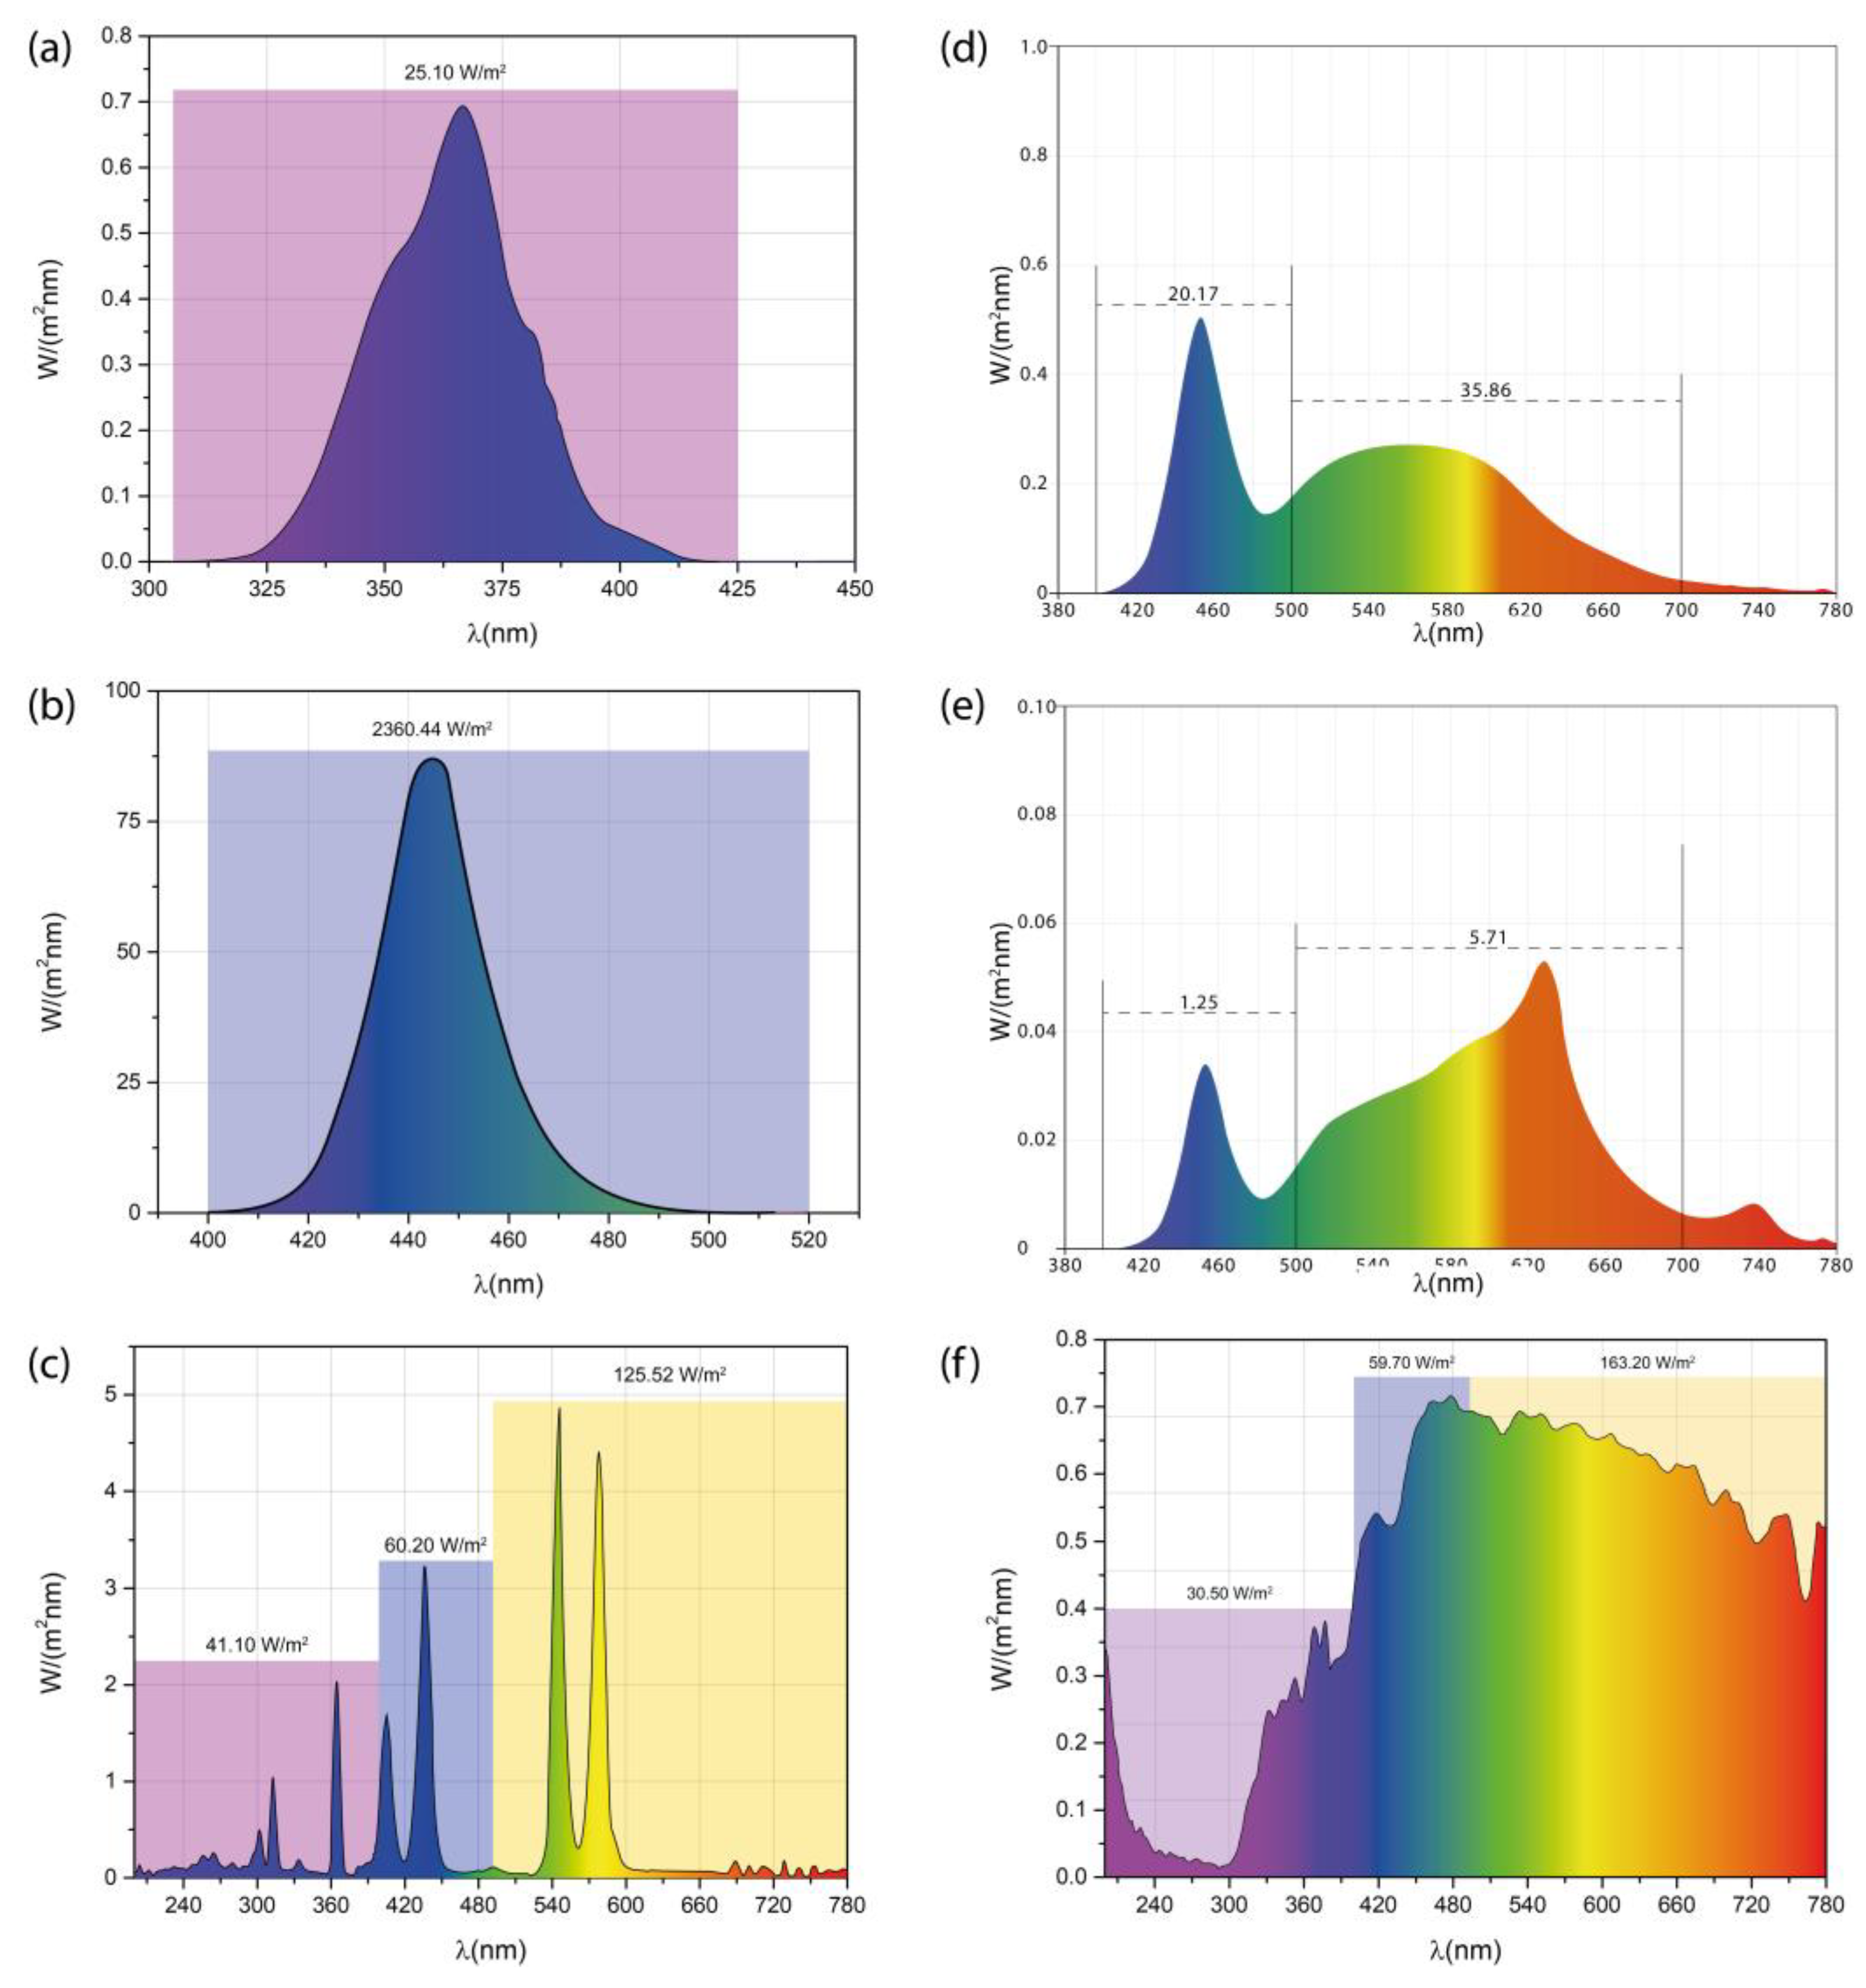
Figure 5.
UV-Vis DRS spectra of the MB under UV radiation with PhR-Hg at 75 V.
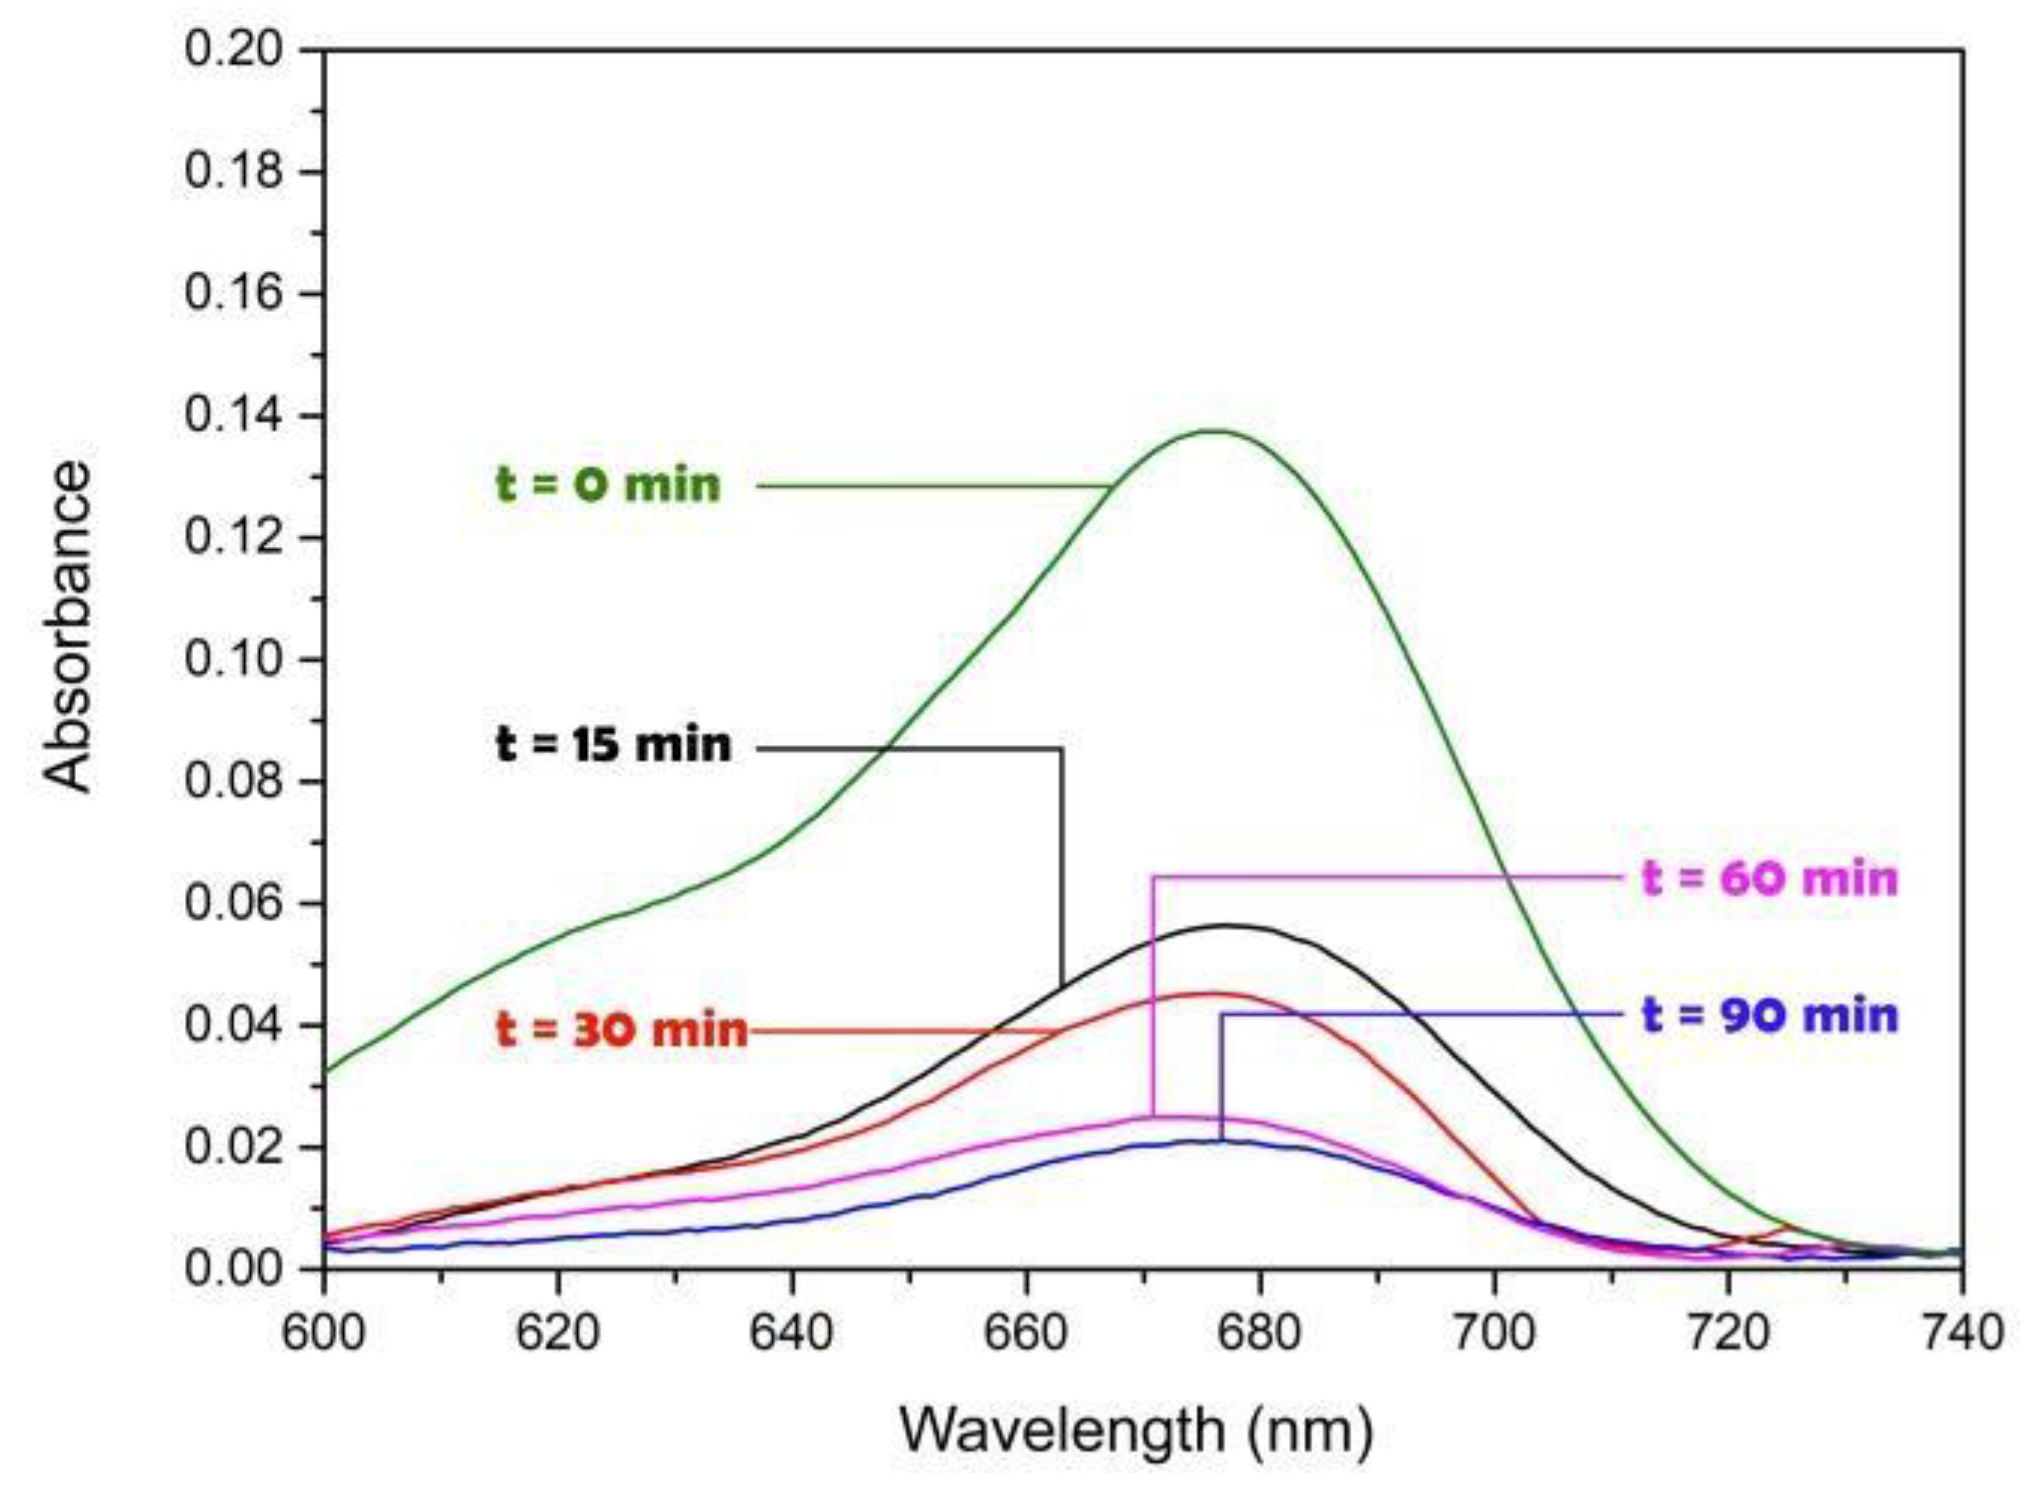
Figure 6.
(a) Characteristic degradation time (τ) for the MB degradation with PhR-T5, PhR-Hg, and solar radiation using AgTiC (b) pseudo first-order kinetic constants (k) vs total irradiance.
Figure 6.
(a) Characteristic degradation time (τ) for the MB degradation with PhR-T5, PhR-Hg, and solar radiation using AgTiC (b) pseudo first-order kinetic constants (k) vs total irradiance.
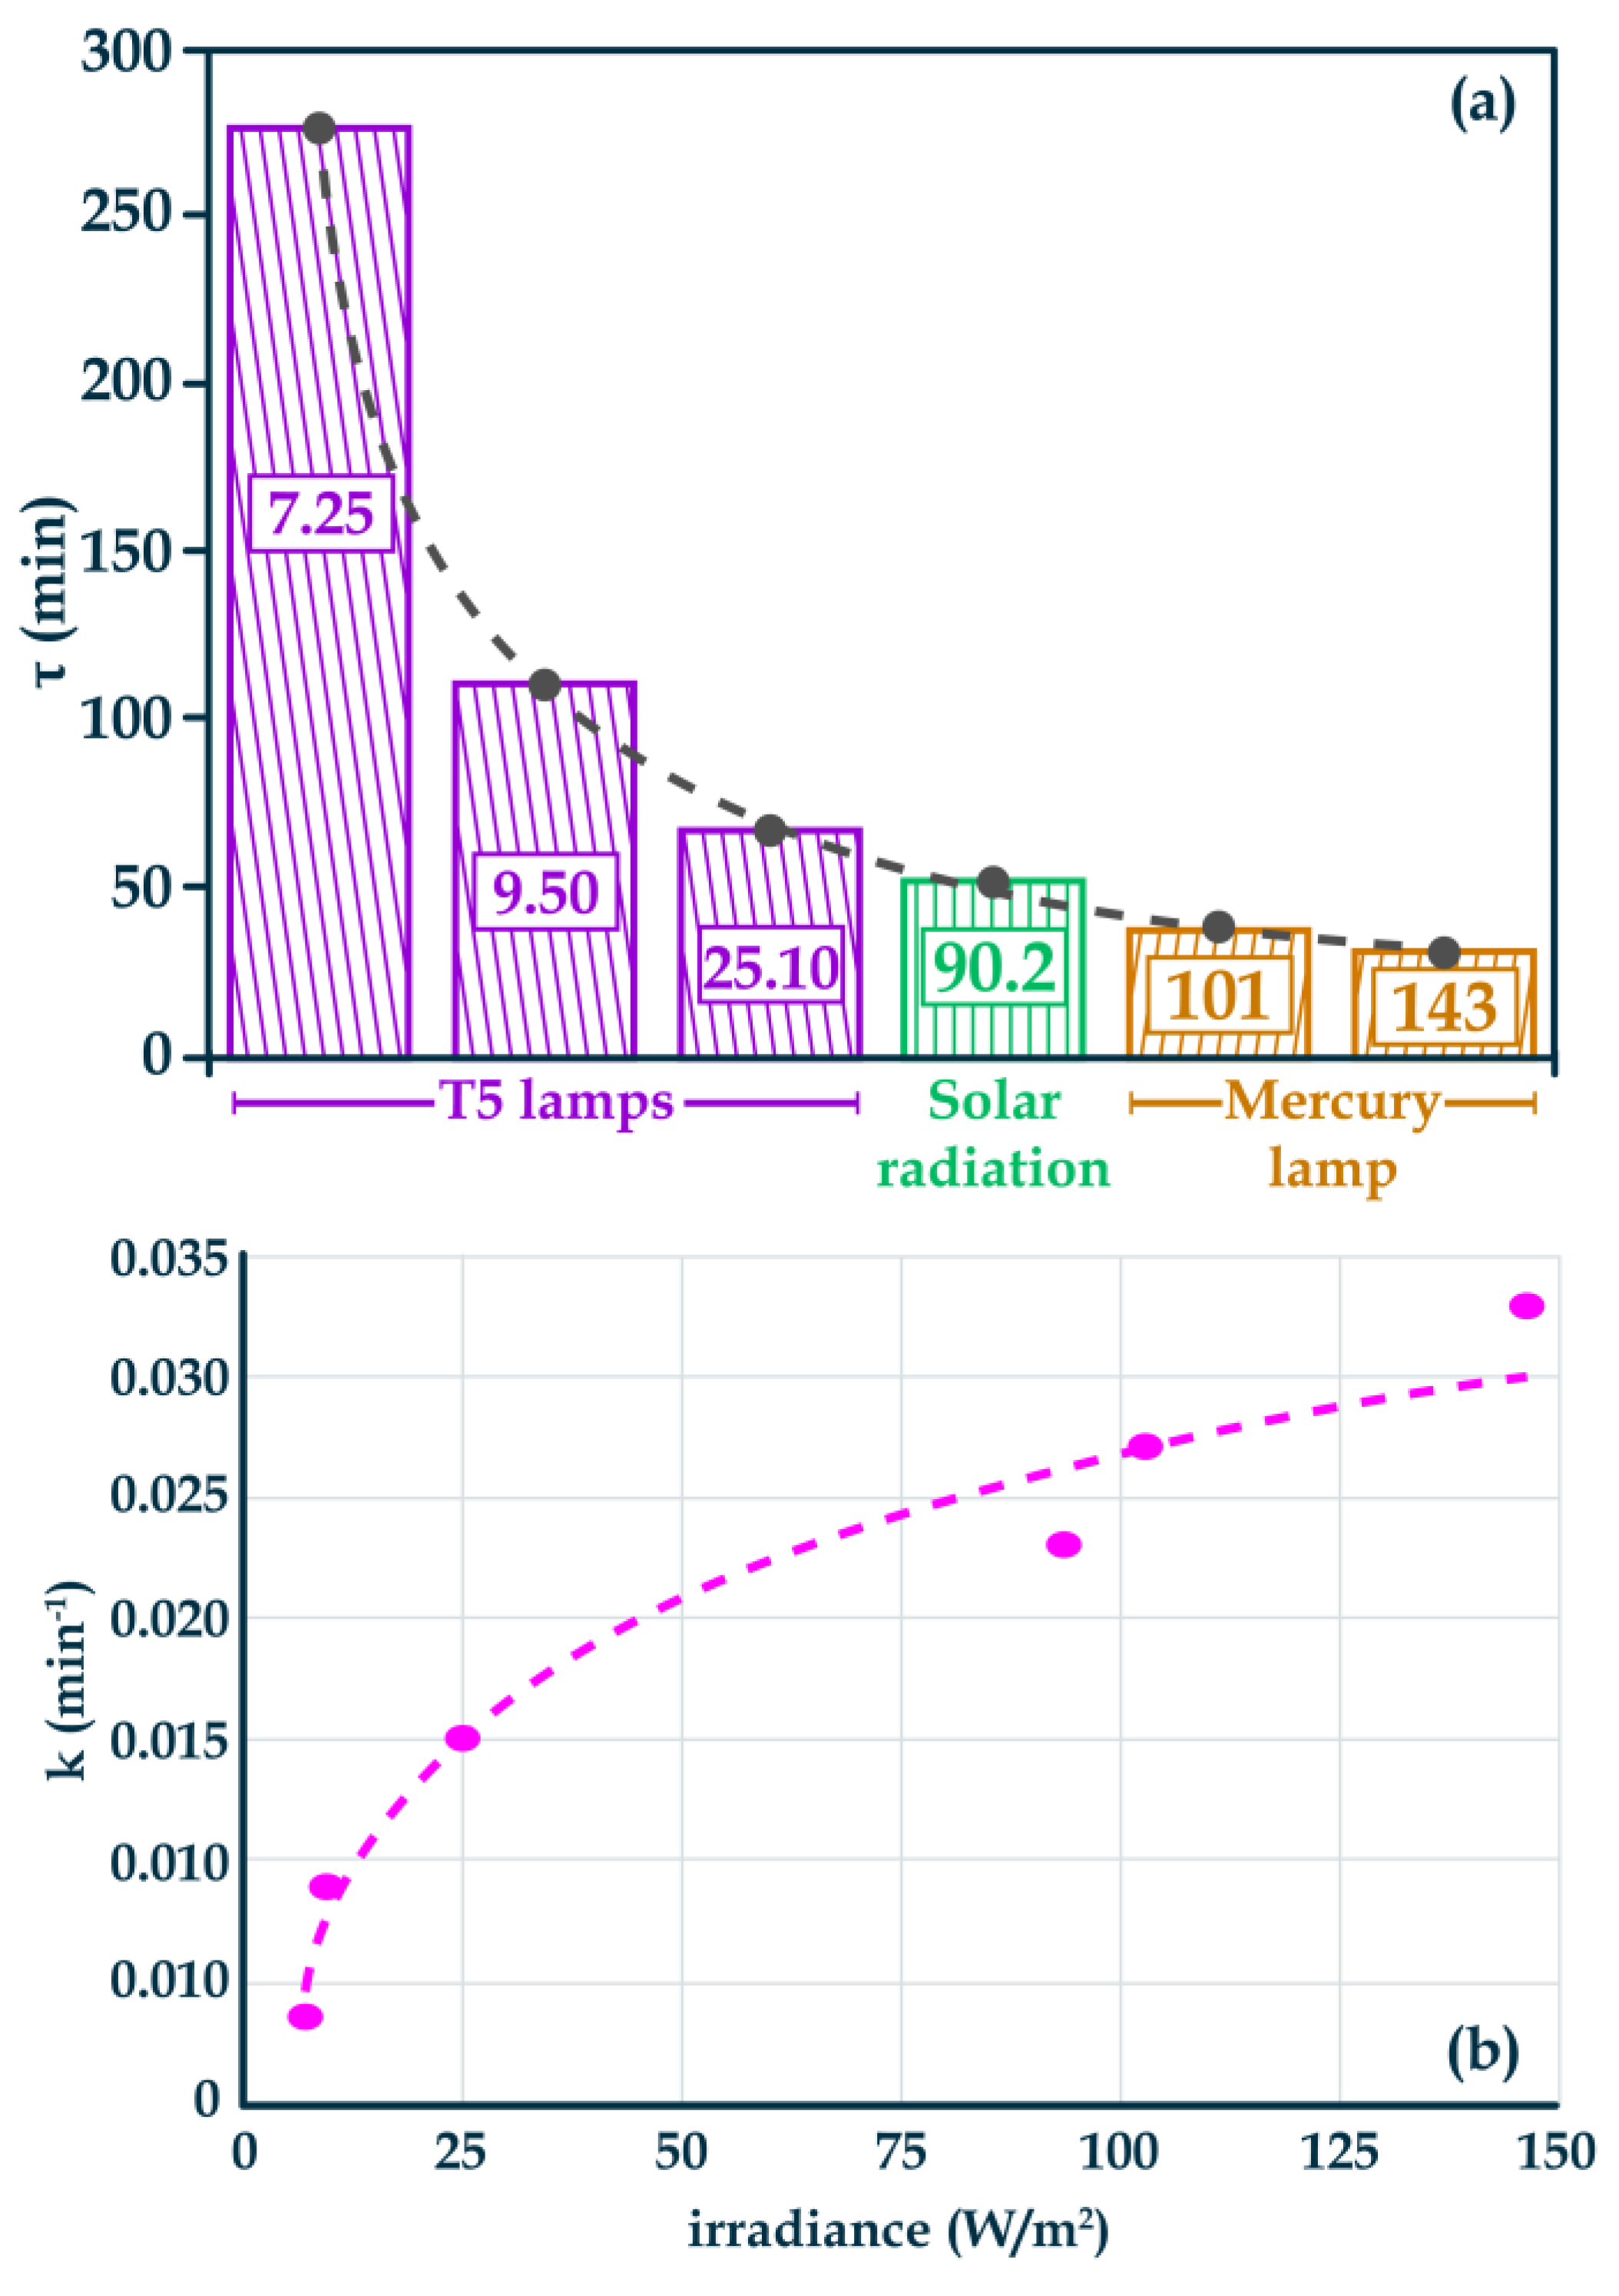
Figure 7.
Catalytic activity (k) vs irradiance (a) under UV radiation and (b) under UV+visible radiation.
Figure 7.
Catalytic activity (k) vs irradiance (a) under UV radiation and (b) under UV+visible radiation.
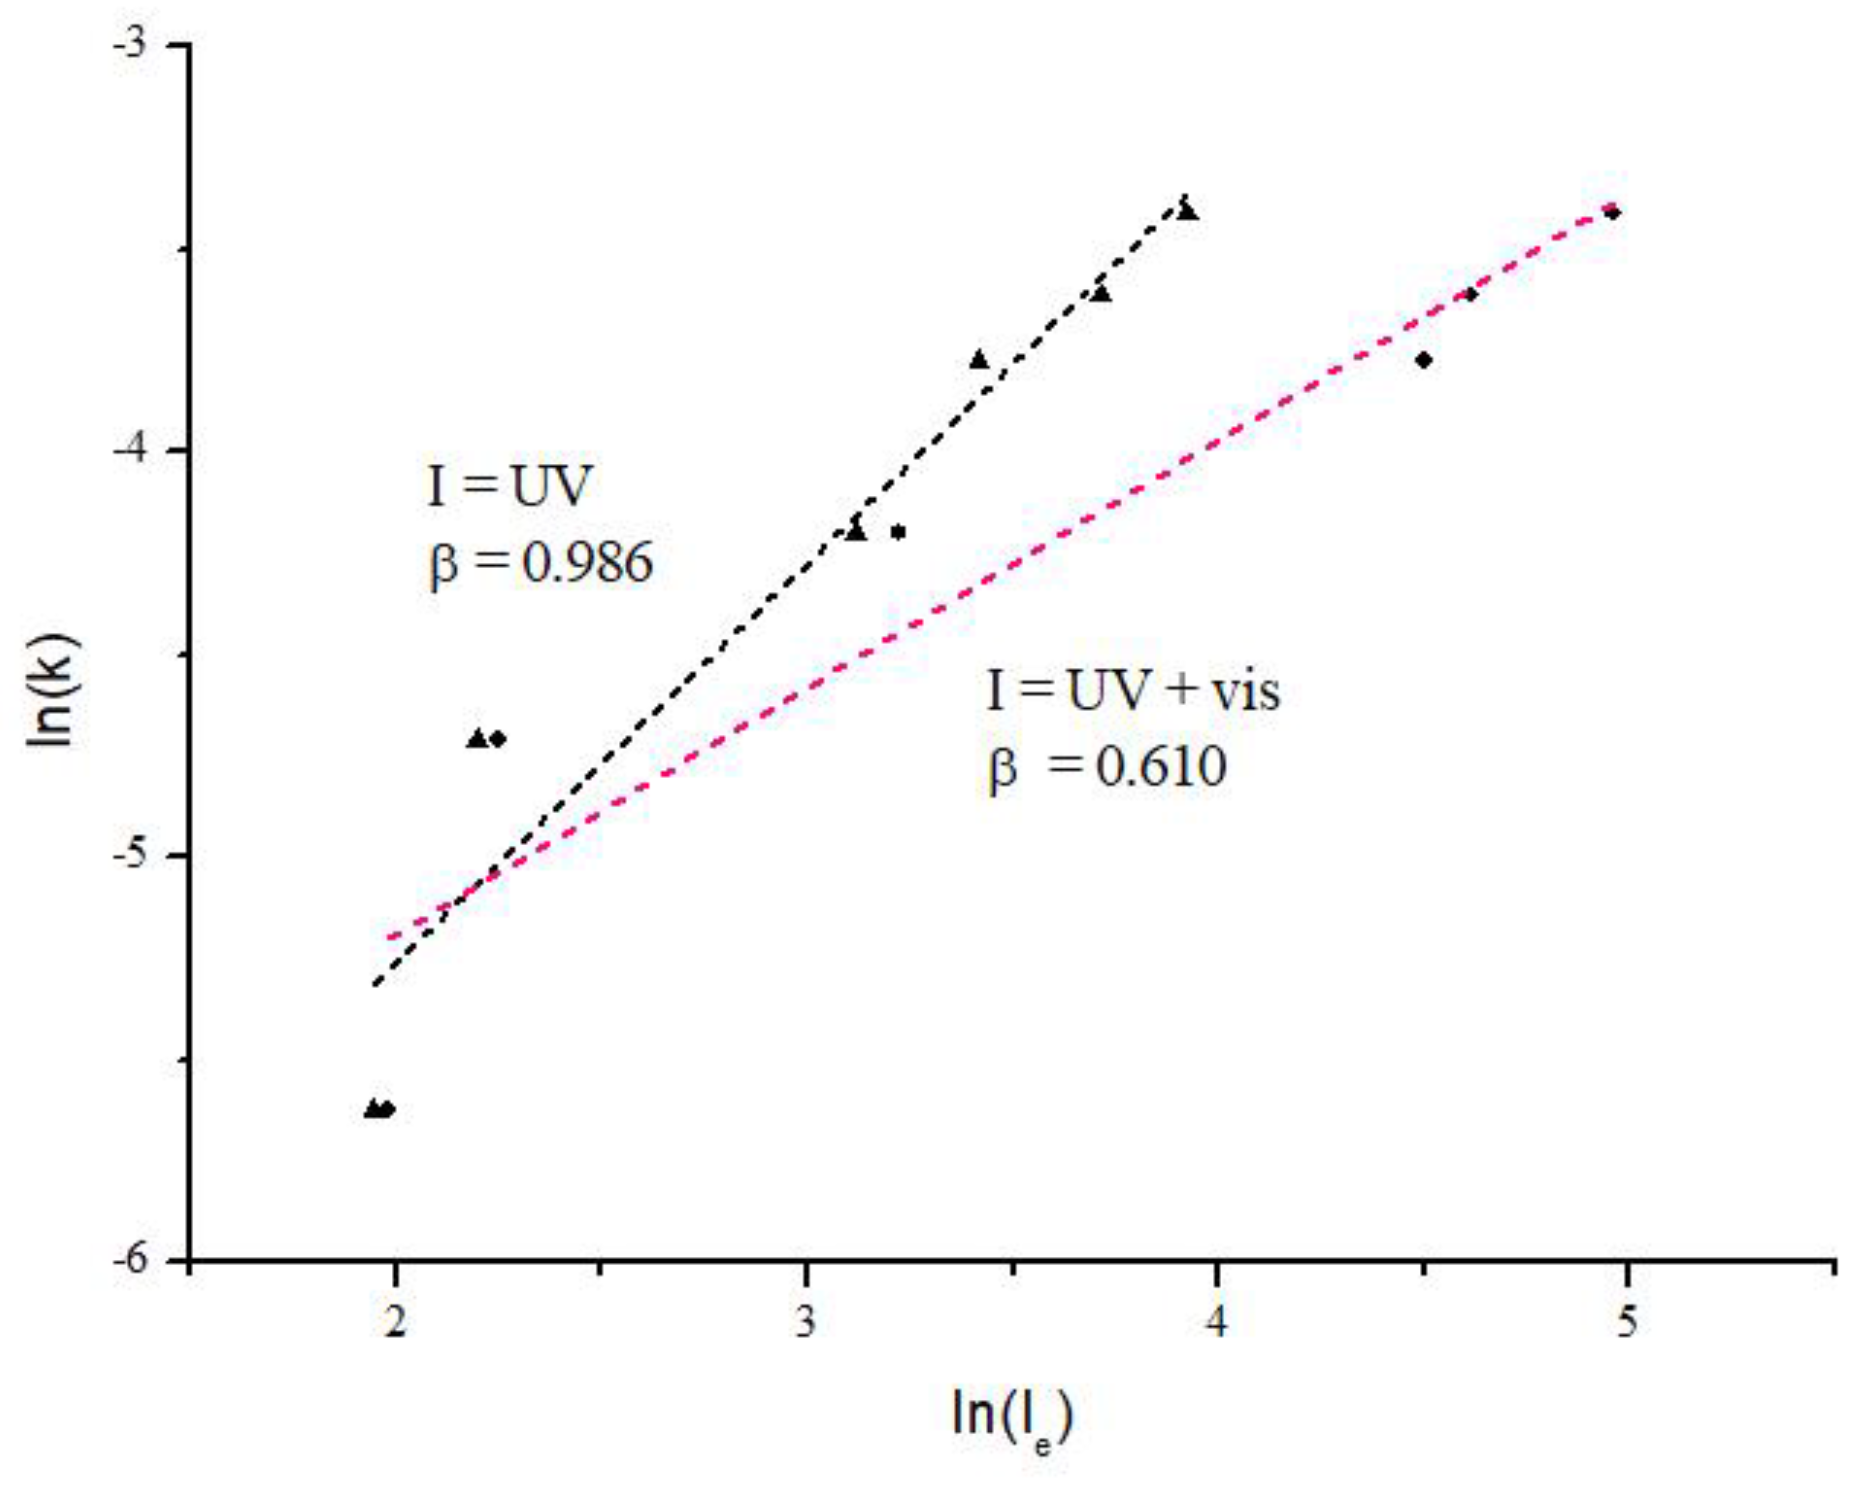

Table 1.
Technical characteristics and specifications of PhRs.
| Photoreactor | Equipped lamp | Energy Source | Power consumed |
| PhR-Hg |
Low pressure Hg (tubular bulb) (diameter: 5/8 in) (PL-VM-E93-250W) |
Hg vapor |
250 W |
| PhR-T5 |
UV-A type radiation-T5 (tubular bulb) (diameter: 5/8 in) (tecnolite) |
diodes |
16 W |
| PhR-I |
Industrial LED luminaire (LEDs array) |
diodes Panel 1 - 48 LEDs Panel 2 - 48 LEDs |
1.5 V - 3.3 V |
| PhR-G |
Greenhouse Full-spectrum LED (LEDs array) |
diodes Panel 1 - 126 LEDs Panel 2 - 164 LEDs |
60 W 6000 Lm |
| PhR-B |
Blue-radiation LED (LEDs array) (M2 photoreactor, MERK) |
diodes Panel 1 - 4 LEDs |
12 V |
Table 2.
Total irradiance for PhR-Hg and PhR-T5 at different configurations.
| Irradiance | |||
| Photoreactor | Photoreactor configuration | UV (W/m2) |
Visible (W/m2) |
| PhR-Hg | 75 V a | 41.10 | 60.20 |
| 90 V a | 50.64 | 73.00 | |
| PhR-T5 | 11.5 cm b | 7.00 | 0.25 |
| 4.5 cm b | 9.00 | 0.50 | |
| 0 cm b | 22.60 | 2.50 | |
| Supplied voltage a Height of the lamp respect to the reaction system b | |||
Disclaimer/Publisher’s Note: The statements, opinions and data contained in all publications are solely those of the individual author(s) and contributor(s) and not of MDPI and/or the editor(s). MDPI and/or the editor(s) disclaim responsibility for any injury to people or property resulting from any ideas, methods, instructions or products referred to in the content. |
© 2026 by the authors. Licensee MDPI, Basel, Switzerland. This article is an open access article distributed under the terms and conditions of the Creative Commons Attribution (CC BY) license (http://creativecommons.org/licenses/by/4.0/).
Copyright: This open access article is published under a Creative Commons CC BY 4.0 license, which permit the free download, distribution, and reuse, provided that the author and preprint are cited in any reuse.


