Submitted:
22 January 2026
Posted:
23 January 2026
You are already at the latest version
Abstract
Air pollution is one of the leading environmental risk factors affecting human health worldwide. Fine particulate matter (PM2.5) is considered particularly harmful due to its ability to penetrate deep into the lungs and enter the bloodstream, increasing the risk of respiratory diseases. This study aims to analyze the relationship between PM2.5 concentration and respiratory disease incidence in Kyrgyzstan using data visualization techniques. The dataset was obtained from two main sources: annual PM2.5 concentration data were collected from the World Health Organization (WHO), while respiratory disease statistics were acquired from the National Statistical Committee of the Kyrgyz Republic. The data cover the period from 1990 to 2024. After preprocessing and merging the datasets, various visualization and statistical techniques were applied using Python libraries, including Pandas, Matplotlib, and Seaborn. Trend analysis revealed a significant increase in PM2.5 levels after 2010, which coincided with a rise in respiratory disease cases. Correlation analysis showed a moderate positive relationship between PM2.5 concentration and respiratory disease incidence (r = 0.56). Regression analysis further confirmed that higher pollution levels are associated with increased numbers of respiratory disease cases. Although the correlation is not strong, the results indicate that air pollution is an important contributing factor to respiratory health outcomes. The moderate strength of the relationship may be explained by delayed health effects and the influence of additional factors such as lifestyle, seasonal infections, and healthcare access.
Keywords:
air pollution
; respiratory diseases
; data analysis
; data visualization
; matplotlib and seaborn plots
; interactive dashboard
I. Introduction
Air pollution has become one of the most serious environmental challenges of the 21st century, posing a significant threat to human health and sustainable development worldwide. According to the World Health Organization (WHO), ambient air pollution is responsible for approximately 7 million premature deaths each year, mainly due to respiratory and cardiovascular diseases [1]. Fine particulate matter with a diameter of less than 2.5 micrometers (PM2.5) is considered the most harmful pollutant because it can penetrate deep into the lungs and enter the bloodstream, causing long-term damage to vital organs.
Numerous epidemiological studies have confirmed a strong association between prolonged exposure to PM2.5 and respiratory illnesses such as asthma, chronic obstructive pulmonary disease (COPD), bronchitis, and lung cancer [2,3]. Long-term exposure to polluted air increases hospital admissions, reduces life expectancy, and significantly decreases quality of life [4]. Children, elderly people, and individuals with pre-existing conditions are particularly vulnerable to air pollution-related health risks [5].
In recent years, air quality in Bishkek, Kyrgyzstan, has significantly deteriorated, especially during the winter season. Due to coal-based heating, outdated vehicle fleets, industrial emissions, and unfavorable meteorological conditions, the city has frequently ranked among the most polluted urban areas in the world. Real-time air quality monitoring platforms show that PM2.5 concentrations in Bishkek often exceed WHO recommended limits by more than ten times during peak pollution periods. This alarming situation raises serious concerns about the long-term health consequences for residents.
This study aims to analyze the relationship between PM2.5 concentration and respiratory diseases using data visualization techniques. The primary goal is to demonstrate how prolonged exposure to polluted air can negatively affect human health and to raise public awareness about the severity of the problem. If effective measures are not taken, Bishkek may face severe health consequences similar to those observed in highly polluted cities such as Delhi, Lahore, and Beijing. Through this analysis, the study emphasizes the urgent need for environmental policies, cleaner energy solutions, and sustainable urban planning to improve air quality and protect public health.
Data visualization plays a crucial role in transforming complex environmental and health datasets into intuitive graphical representations. Visual analytics enables policymakers, researchers, and the public to better understand trends, identify risk factors, and support evidence-based decision-making [6,7]. By applying various visualization techniques, this research seeks to present air pollution data in a clear and accessible manner, facilitating informed discussions and encouraging proactive environmental actions.
II. Literature Review
Air pollution and its impact on human health have been extensively studied over the past decades. Fine particulate matter (PM2.5) has attracted particular attention due to its ability to penetrate deep into the lungs and enter the bloodstream, causing severe respiratory and cardiovascular diseases. According to the World Health Organization (WHO), there is no safe level of PM2.5 exposure, and even low concentrations can lead to adverse health effects [8].
Pope and Dockery were among the first researchers to establish a strong link between long-term exposure to PM2.5 and increased mortality rates [2]. Their study demonstrated that populations exposed to higher pollution levels experienced significantly higher risks of respiratory diseases and lung cancer. Similarly, Dockery et al. found a direct association between fine particulate matter and increased hospital admissions due to asthma and bronchitis [9].
Cohen et al. conducted a global burden of disease study and estimated that ambient air pollution contributes to more than four million premature deaths annually [3]. Their findings showed that PM2.5 exposure is one of the leading environmental risk factors worldwide. Burnett et al. further supported these results by demonstrating a strong relationship between long-term PM2.5 exposure and reduced life expectancy [4].
Several studies have focused on the impact of air pollution on vulnerable populations. Gauderman et al. examined lung development in children and found that exposure to polluted air significantly impaired lung growth [5]. Children living in highly polluted areas were more likely to develop asthma and other respiratory conditions. Similarly, Schraufnagel et al. reported that elderly individuals and people with pre-existing respiratory diseases are more susceptible to PM2.5-related health effects [10].
Research conducted in highly polluted cities such as Delhi, Beijing, and Lahore provides valuable insights into the long-term health consequences of poor air quality. Lelieveld et al. estimated that urban air pollution is responsible for millions of premature deaths annually, particularly in low- and middle-income countries [11]. Studies in China have shown a strong association between PM2.5 exposure and increased rates of chronic obstructive pulmonary disease (COPD) and lung cancer [12].
In Central Asia, limited studies have explored the health impacts of air pollution. However, recent reports indicate that cities such as Bishkek and Almaty frequently exceed WHO air quality guidelines, especially during winter months due to coal burning and vehicle emissions [13]. According to the Health Effects Institute, PM2.5 concentrations in this region remain significantly higher than global averages, increasing the risk of respiratory diseases among urban populations [14].
Recent research has also focused specifically on air pollution patterns in Kyrgyzstan. Sadriddin et al. [16] conducted a comparative analysis of PM2.5 sources in Kyrgyzstan and 31 other countries. Their study identified seasonal variations, population density, and energy consumption as key factors influencing air pollution levels. The authors emphasized the importance of data-driven approaches and cross-country comparisons to better understand pollution sources and support evidence-based environmental policies.
The use of data visualization in environmental health research has become increasingly important. Few emphasized that visual analytics help transform complex datasets into understandable insights, enabling policymakers to make evidence-based decisions [6]. Knaflic also highlighted the role of storytelling through data visualization to communicate scientific findings effectively to the public [7].
Recent studies have applied visualization techniques to air quality data. Li et al. developed interactive dashboards to monitor pollution levels and identify high-risk areas [15]. Their research demonstrated that visualization tools improve public awareness and support environmental policy development.
Overall, existing literature strongly confirms the negative impact of PM2.5 on respiratory health. However, there is a lack of localized studies focusing on Central Asian cities, including Bishkek. This research aims to fill this gap by using data visualization techniques to analyze pollution trends and their health implications, providing evidence to support urgent environmental action.
III. Method and Tools
A. Data Acquisition
This study utilizes publicly available datasets obtained from two main sources. Data on air pollution, specifically annual mean PM2.5 concentrations, were collected from the World Health Organization (WHO) database. Health-related data, including the number of respiratory disease cases, were obtained from the National Statistical Committee of the Kyrgyz Republic (National Statistics Committee).
The PM2.5 dataset provides information on mean annual exposure levels measured in micrograms per cubic meter (µg/m³). The health dataset includes annual statistics on respiratory diseases such as asthma, chronic obstructive pulmonary disease (COPD), bronchitis, and other related illnesses.
After collecting the data, both datasets were merged into a single unified dataset based on the year variable. This allowed for a direct comparison between air pollution levels and respiratory disease incidence over time.
Before analysis, the dataset was carefully cleaned and preprocessed. Missing values were checked and handled using interpolation techniques where necessary. Data formats were standardized to ensure consistency between the two sources. Outliers were identified and reviewed to avoid distortion of the results.
This data integration approach enabled a comprehensive analysis of how air quality trends relate to public health outcomes in Kyrgyzstan.
B. Data Visualization and Tools
To transform the collected dataset into clear and meaningful visual formats, advanced data visualization techniques were applied using Python programming tools, primarily the Matplotlib and Seaborn libraries. These tools enabled the creation of informative and visually engaging graphs that helped reveal important patterns and relationships within the data.
Several types of visualizations were designed and used in this study. Line charts were employed to illustrate long-term trends in PM2.5 concentration and respiratory disease cases over time, allowing for a clear observation of how both variables changed across years. Scatter plots were used to visually explore the relationship between air pollution levels and the number of respiratory diseases, making it easier to identify potential correlations between these variables.
In addition, bar charts were created to compare disease trends across different years, providing a straightforward comparison of changes in respiratory illness incidence. Heatmaps were applied to visualize correlations between variables and to highlight periods of increased risk. Each visualization was carefully designed with appropriate scaling, labeling, and layout to ensure clarity and ease of interpretation.
Together, these visual tools were intentionally selected to make complex environmental and health data more accessible and understandable. The main objective of using such visualizations was to bridge the gap between scientific research and public awareness. By presenting the data in a visually intuitive way, this study aims to help policymakers, healthcare professionals, and the general public better understand how air pollution affects respiratory health and why urgent action is needed to improve air quality in Bishkek and across Kyrgyzstan.
C. Statistical Analysis and Visualization
The collected data were systematically processed and analyzed using Python. Pandas was utilized for data cleaning and preparation, while Seaborn and Matplotlib were applied for statistical and graphical visualization. Descriptive statistics, including mean values, standard deviations, and trends over time, were calculated to summarize both PM2.5 concentrations and respiratory disease cases.
To quantify the relationship between air pollution and health outcomes, Pearson’s correlation analysis was performed to measure the strength and direction of association between PM2.5 levels and respiratory diseases. Linear regression models were also applied to examine how changes in pollution levels influence disease incidence.
A series of graphical representations were generated to illustrate the study findings. Trend lines demonstrated changes in pollution and disease rates over time, while regression plots visually highlighted their relationship. Box plots were used to show the distribution of PM2.5 concentrations across different years, helping to identify periods of unusually high pollution.
These visualization techniques significantly enhanced the interpretability of the results and provided a strong foundation for the subsequent Results and Discussion section. By combining statistical analysis with visual representation, the study offers a comprehensive and accessible understanding of how air quality impacts public health.
IV. Result and Discussion
Figure 1 illustrates the long-term trend of PM2.5 concentrations in Kyrgyzstan from 1990 to 2024. As shown in Figure 1, air pollution levels remained relatively stable at around 22–23 µg/m³ during the 1990s and early 2000s. However, a sharp increase is observed after 2010, reaching a peak of approximately 34.38 µg/m³ in 2012. This period marks a significant deterioration in air quality. Although a slight decline is visible between 2015 and 2019, PM2.5 levels rise again after 2021, reaching nearly 34 µg/m³ in 2022. These values greatly exceed the World Health Organization recommended limit of 5 µg/m³, indicating a serious environmental health risk.
Figure 2 presents the annual number of respiratory disease cases over the same period. As shown in Figure 2, the number of reported cases fluctuates over time but demonstrates an overall increasing trend. A noticeable decrease is observed around 2020, when cases dropped to approximately 406,435. This decline may be partially explained by reduced hospital visits during the COVID-19 pandemic. However, in subsequent years, a sharp increase occurs, with the highest recorded value in 2022 (687,141 cases). This pattern closely corresponds with the increase in PM2.5 levels observed in Figure 1.
The relationship between air pollution and respiratory diseases is further illustrated in Figure 3. The scatter plot shows a clear upward trend, indicating that higher PM2.5 concentrations are generally associated with a greater number of respiratory disease cases. This visual pattern suggests a positive relationship between the two variables.
Figure 4 confirms this relationship through regression analysis. The positive slope of the regression line demonstrates that increases in PM2.5 levels are associated with increases in respiratory disease incidence. This visual trend supports the hypothesis that air pollution plays a significant role in respiratory health outcomes.
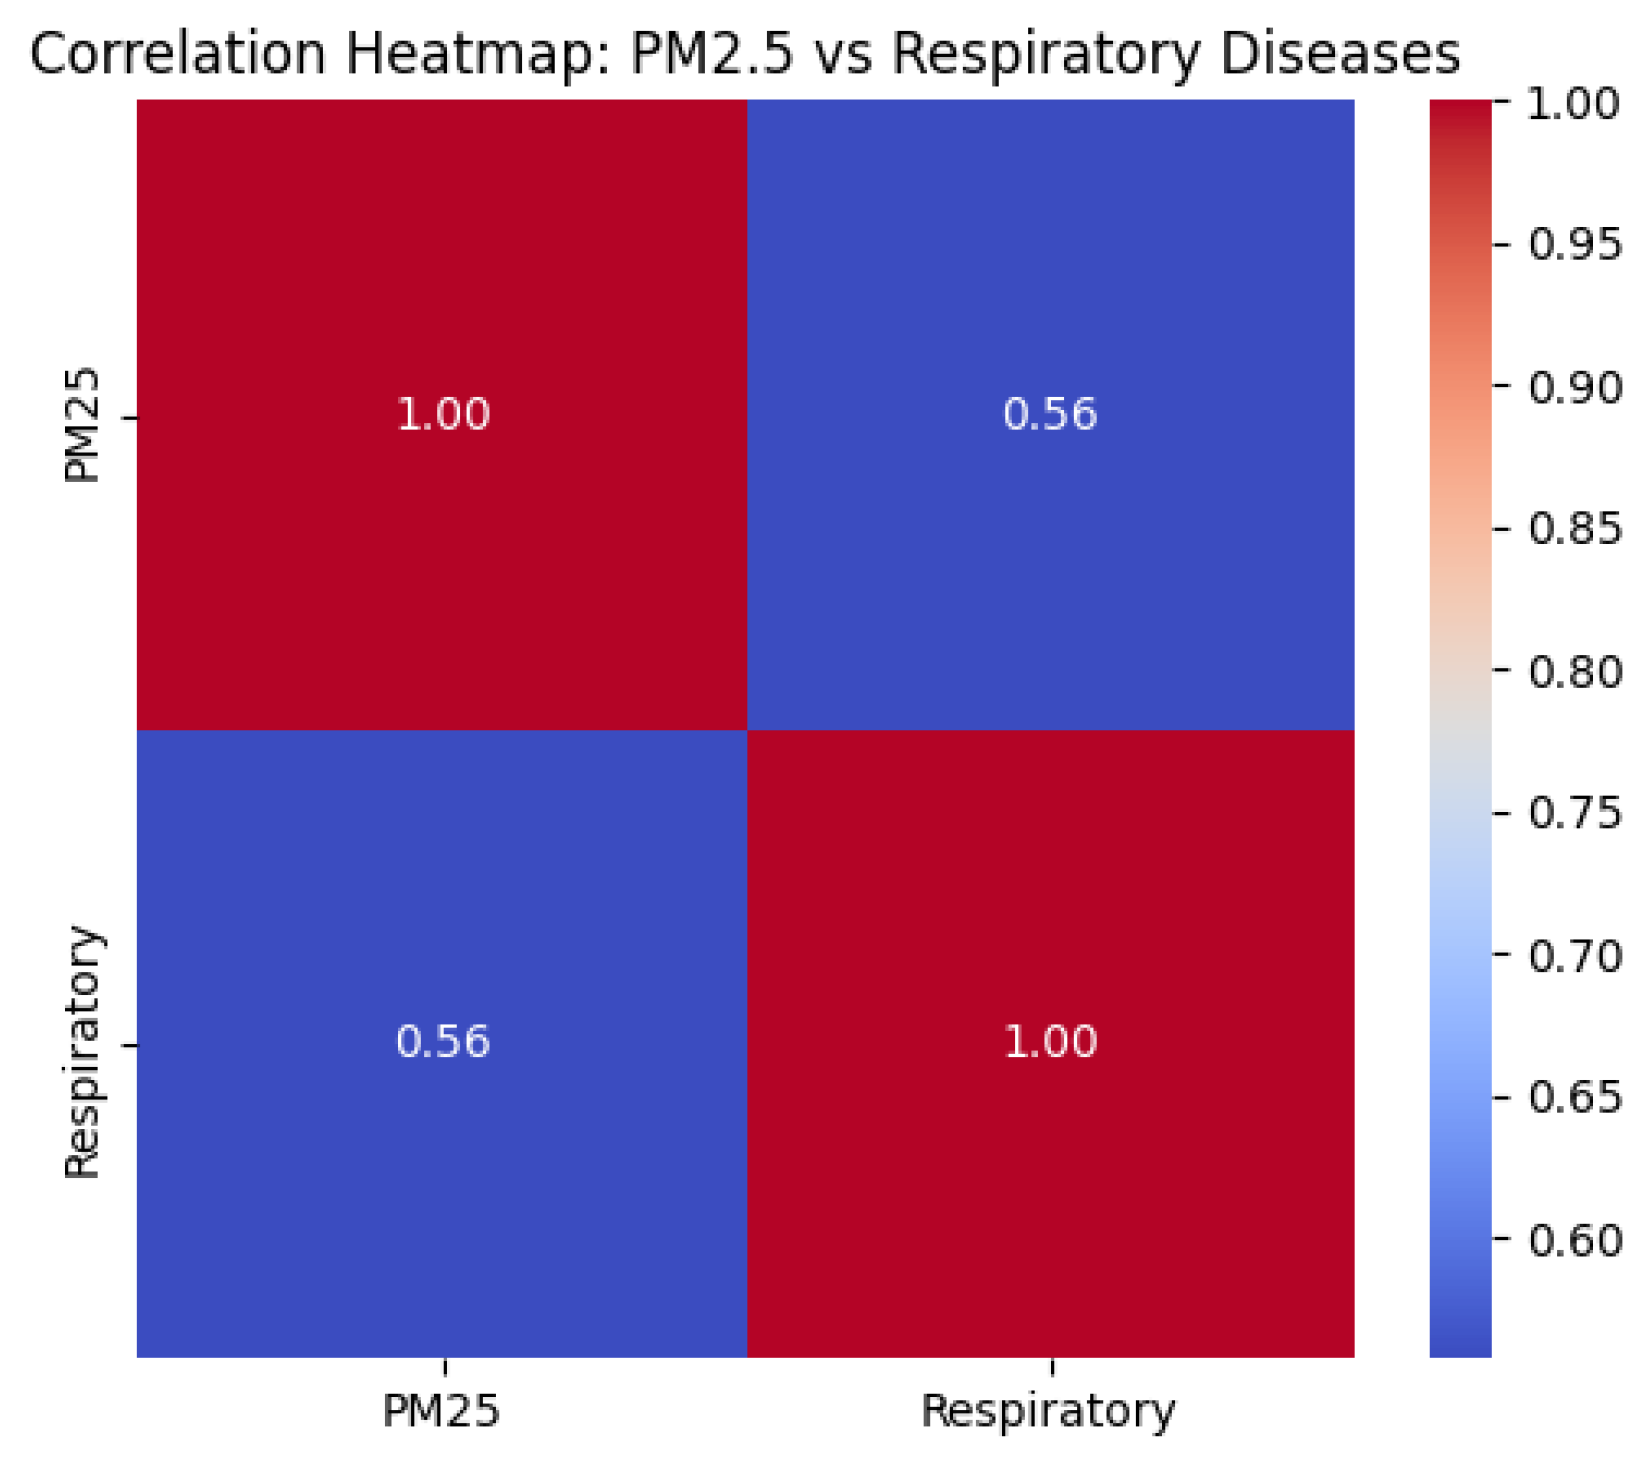
To quantify this relationship, a correlation analysis was conducted. The heatmap shown in Figure 5 presents the Pearson correlation coefficient between PM2.5 and respiratory diseases. The calculated value (r = 0.56) indicates a moderate positive correlation. This result suggests that although PM2.5 is not the only factor influencing respiratory health, it is a significant contributing variable. Other factors such as smoking, viral infections, seasonal changes, and access to healthcare may also affect disease prevalence.
Descriptive statistical analysis further supports these findings. The mean PM2.5 concentration over the study period was 25.99 µg/m³, with a standard deviation of 4.29, indicating substantial variability across years. The minimum recorded value was 22.02 µg/m³, while the maximum reached 34.38 µg/m³. All values exceed WHO guidelines, confirming long-term exposure to unhealthy air conditions.
Similarly, the average annual number of respiratory disease cases was 485,352, with a standard deviation of 89,945, demonstrating significant fluctuations. The minimum recorded number of cases was 338,051, while the maximum reached 687,141, which coincides with periods of high air pollution.
Overall, the results demonstrate a meaningful but moderate relationship between PM2.5 exposure and respiratory disease incidence in Kyrgyzstan. The synchronized increase in both variables after 2010, as shown in Figure 1 and Figure 2, highlights the growing public health burden associated with air pollution. Although the correlation is not strong (r = 0.56), it still indicates that PM2.5 is an important contributing factor to respiratory morbidity.
These findings are consistent with previous studies that link long-term exposure to fine particulate matter with adverse respiratory health outcomes. The results emphasize the urgent need for environmental interventions in Bishkek and across Kyrgyzstan. Measures such as transitioning to cleaner heating systems, regulating vehicle emissions, and expanding green infrastructure could significantly reduce pollution levels and improve public health outcomes.
V. Conclusions
This study investigated the relationship between PM2.5 air pollution and respiratory diseases in Kyrgyzstan using data visualization and statistical analysis techniques. The findings demonstrate that long-term exposure to elevated PM2.5 concentrations is associated with an increased number of respiratory disease cases. Throughout the study period, PM2.5 levels consistently exceeded the World Health Organization recommended guidelines, indicating a persistent public health risk.
Trend analysis revealed a significant rise in pollution levels after 2010, which was accompanied by a corresponding increase in respiratory disease incidence. The correlation analysis showed a moderate positive relationship (r = 0.56). Although this value does not indicate a strong correlation, it still confirms that air pollution is an important contributing factor to respiratory health outcomes.
The moderate strength of the correlation can be explained by several factors. First, the negative health effects of air pollution often develop gradually over many years. This means that the full impact of long-term PM2.5 exposure may not yet be fully reflected in current disease statistics. In other words, the strongest health consequences may still be ahead and could become more visible in the future as prolonged exposure continues.
Second, respiratory diseases are influenced by multiple additional factors, including smoking habits, viral infections, seasonal climate conditions, occupational exposure, and access to healthcare. These variables may weaken the direct statistical relationship between PM2.5 and disease incidence. Third, the use of aggregated annual data may mask short-term pollution peaks and seasonal effects, which could reveal stronger associations if daily or monthly data were analyzed.
These findings emphasize the urgent need for early preventive action. If air quality in Bishkek and across Kyrgyzstan continues to deteriorate, the health burden is likely to increase significantly in the coming years. This study therefore serves as a warning signal, highlighting that the current situation may represent only the beginning of a larger public health crisis.
Despite these limitations, the results provide strong evidence that air pollution already plays a significant role in respiratory health. Future research should focus on longer time periods, higher-resolution data, and additional health indicators to better capture delayed effects and strengthen causal interpretation.
In conclusion, this study demonstrates the effectiveness of data visualization in communicating complex environmental health data and supporting evidence-based decision-making. The findings underline the importance of immediate environmental interventions to prevent more severe health consequences in the future and to protect the well-being of the population in Kyrgyzstan.
References
- World Health Organization. “Ambient Air Pollution: Health Impacts,” 2023. Available online: https://www.who.int/news-room/fact-sheets/detail/ambient-(outdoor)-air-quality-and-health.
- Pope, C. A.; Dockery, D. W. Health effects of fine particulate air pollution: Lines that connect. Journal of the Air & Waste Management Association 2006, vol. 56(no. 6), 709–742. Available online: https://www.tandfonline.com/doi/abs/10.1080/10473289.2006.10464485. [CrossRef] [PubMed]
- Cohen, A. J. Estimates and trends of the global burden of disease attributable to ambient air pollution. The Lancet 2017, vol. 389(no. 10082), 1907–1918. Available online: https://www.thelancet.com/article/S0140-6736(17)30505-6/fulltext. [CrossRef] [PubMed]
- Burnett, R. Global estimates of mortality associated with long-term exposure to outdoor fine particulate matter. Proceedings of the National Academy of Sciences (PNAS) Available. 2018, vol. 115(no. 38), 9592–9597. [Google Scholar] [CrossRef] [PubMed]
- Gauderman, W. J. Association of improved air quality with lung development in children. New England Journal of Medicine 2015, vol. 372(no. 10), 905–913. Available online: https://www.nejm.org/doi/full/10.1056/NEJMoa1414123. [CrossRef] [PubMed]
- Few, S. “Data Visualization Effectiveness Profile,” 2017. Available online: https://www.perceptualedge.com/articles/visual_business_intelligence/data_visualization_effectiveness_profile.pdf.
- C. N. Knaflic, Storytelling with Data; Wiley: Hoboken, NJ, USA, 2015; Available online: https://www.storytellingwithdata.com.
- World Health Organization. WHO Global Air Quality Guidelines, 2021. Available online: https://www.who.int/publications/i/item/9789240034228.
- Dockery, D. W. An association between air pollution and mortality in six U.S. cities. New England Journal of Medicine 1993, vol. 329(no. 24), 1753–1759. Available online: https://www.nejm.org/doi/full/10.1056/NEJM199312093292401. [CrossRef] [PubMed]
- Schraufnagel, D. E. Air pollution and noncommunicable diseases. Chest 2019, vol. 155(no. 2), 409–416. Available online: https://journal.chestnet.org/article/S0012-3692(18)32202-3/fulltext. [CrossRef] [PubMed]
- Lelieveld, J. The contribution of outdoor air pollution sources to premature mortality. Nature 2015, vol. 525, 367–371. Available online: https://www.nature.com/articles/nature15371. [CrossRef] [PubMed]
- Chen, R. Fine particulate air pollution and daily mortality in China. In Environmental Health Perspectives; 2017; vol. 125, no. 11. Available online: https://ehp.niehs.nih.gov/doi/10.1289/EHP2125.
- World Bank. The Cost of Air Pollution, 2022. Available online: https://www.worldbank.org/en/topic/environment/brief/the-cost-of-air-pollution.
- Health Effects Institute, State of Global Air 2020, 2020. Available online: https://www.stateofglobalair.org.
- Li, X. Interactive visualization of air quality data. IEEE Access 2020, vol. 8, 21045–21056. Available online: https://ieeexplore.ieee.org/document/8973661.
- Sadriddin, Z.; Mekuria, R. R.; Isaev, R. A comparative study of the analysis of PM2.5 sources in Kyrgyzstan with 31 selected countries. in Proc. 17th Int. Conf. Electronics, Computer and Computation (ICECCO), Kaskelen, Kazakhstan, 2023; pp. 1–5. [Google Scholar] [CrossRef]
Figure 1.
Trend of PM2.5 concentration in Kyrgyzstan (1990–2024).
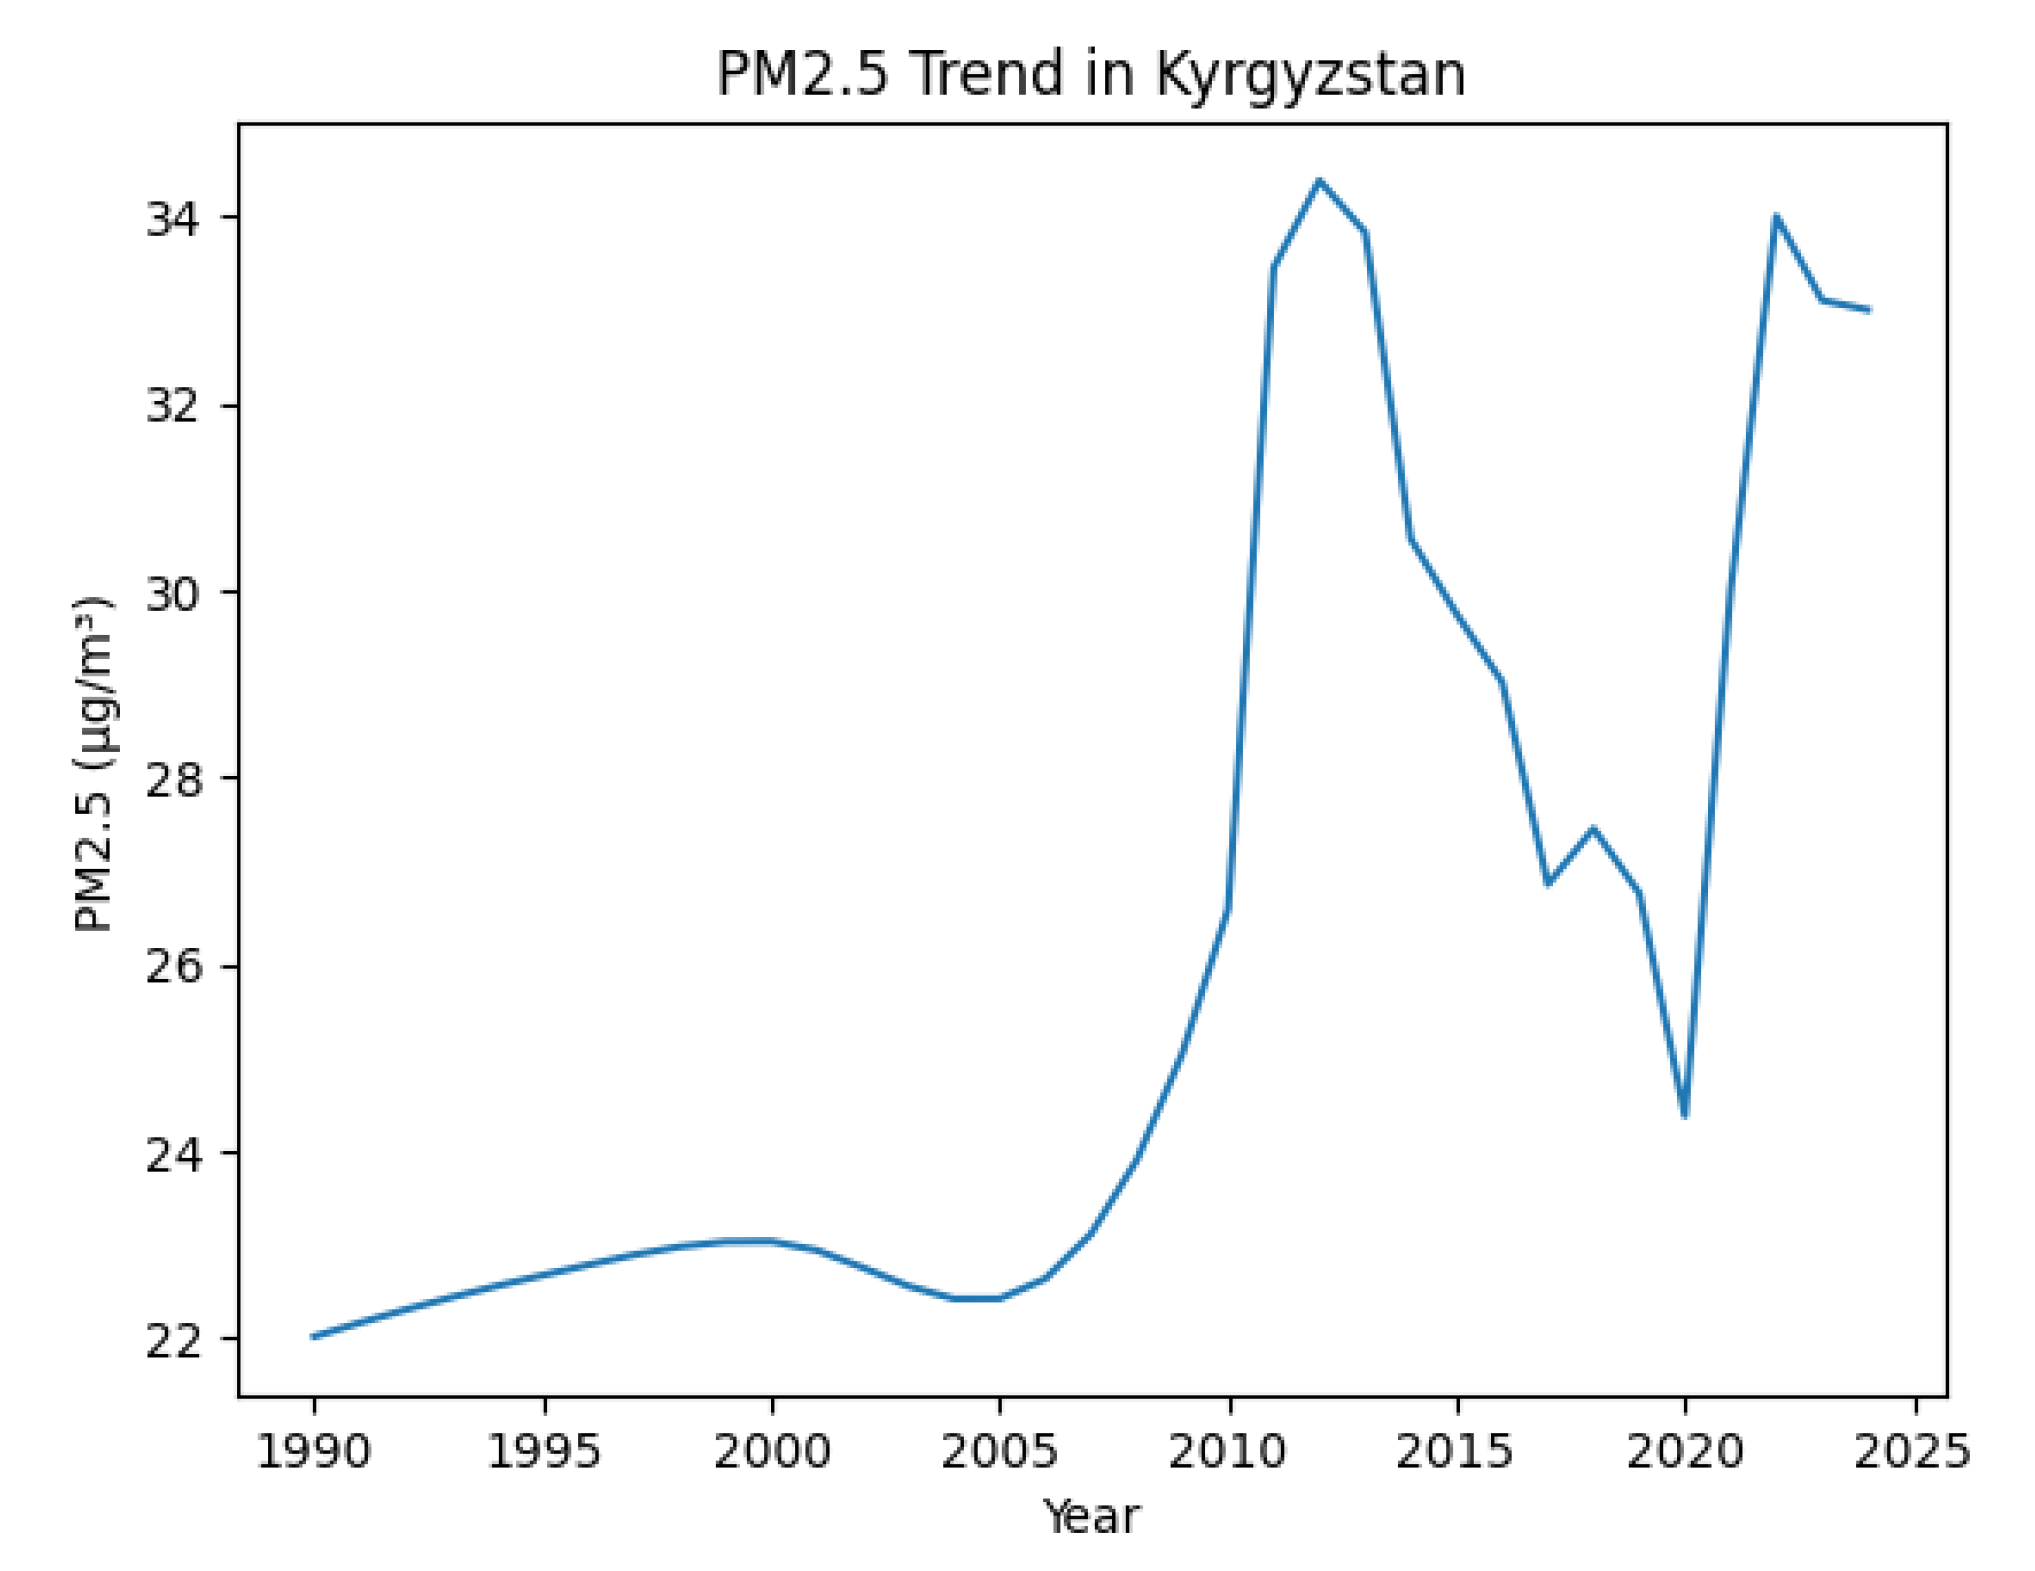
Figure 2.
Trend in respiratory disease cases in Kyrgyzstan (1990–2024).
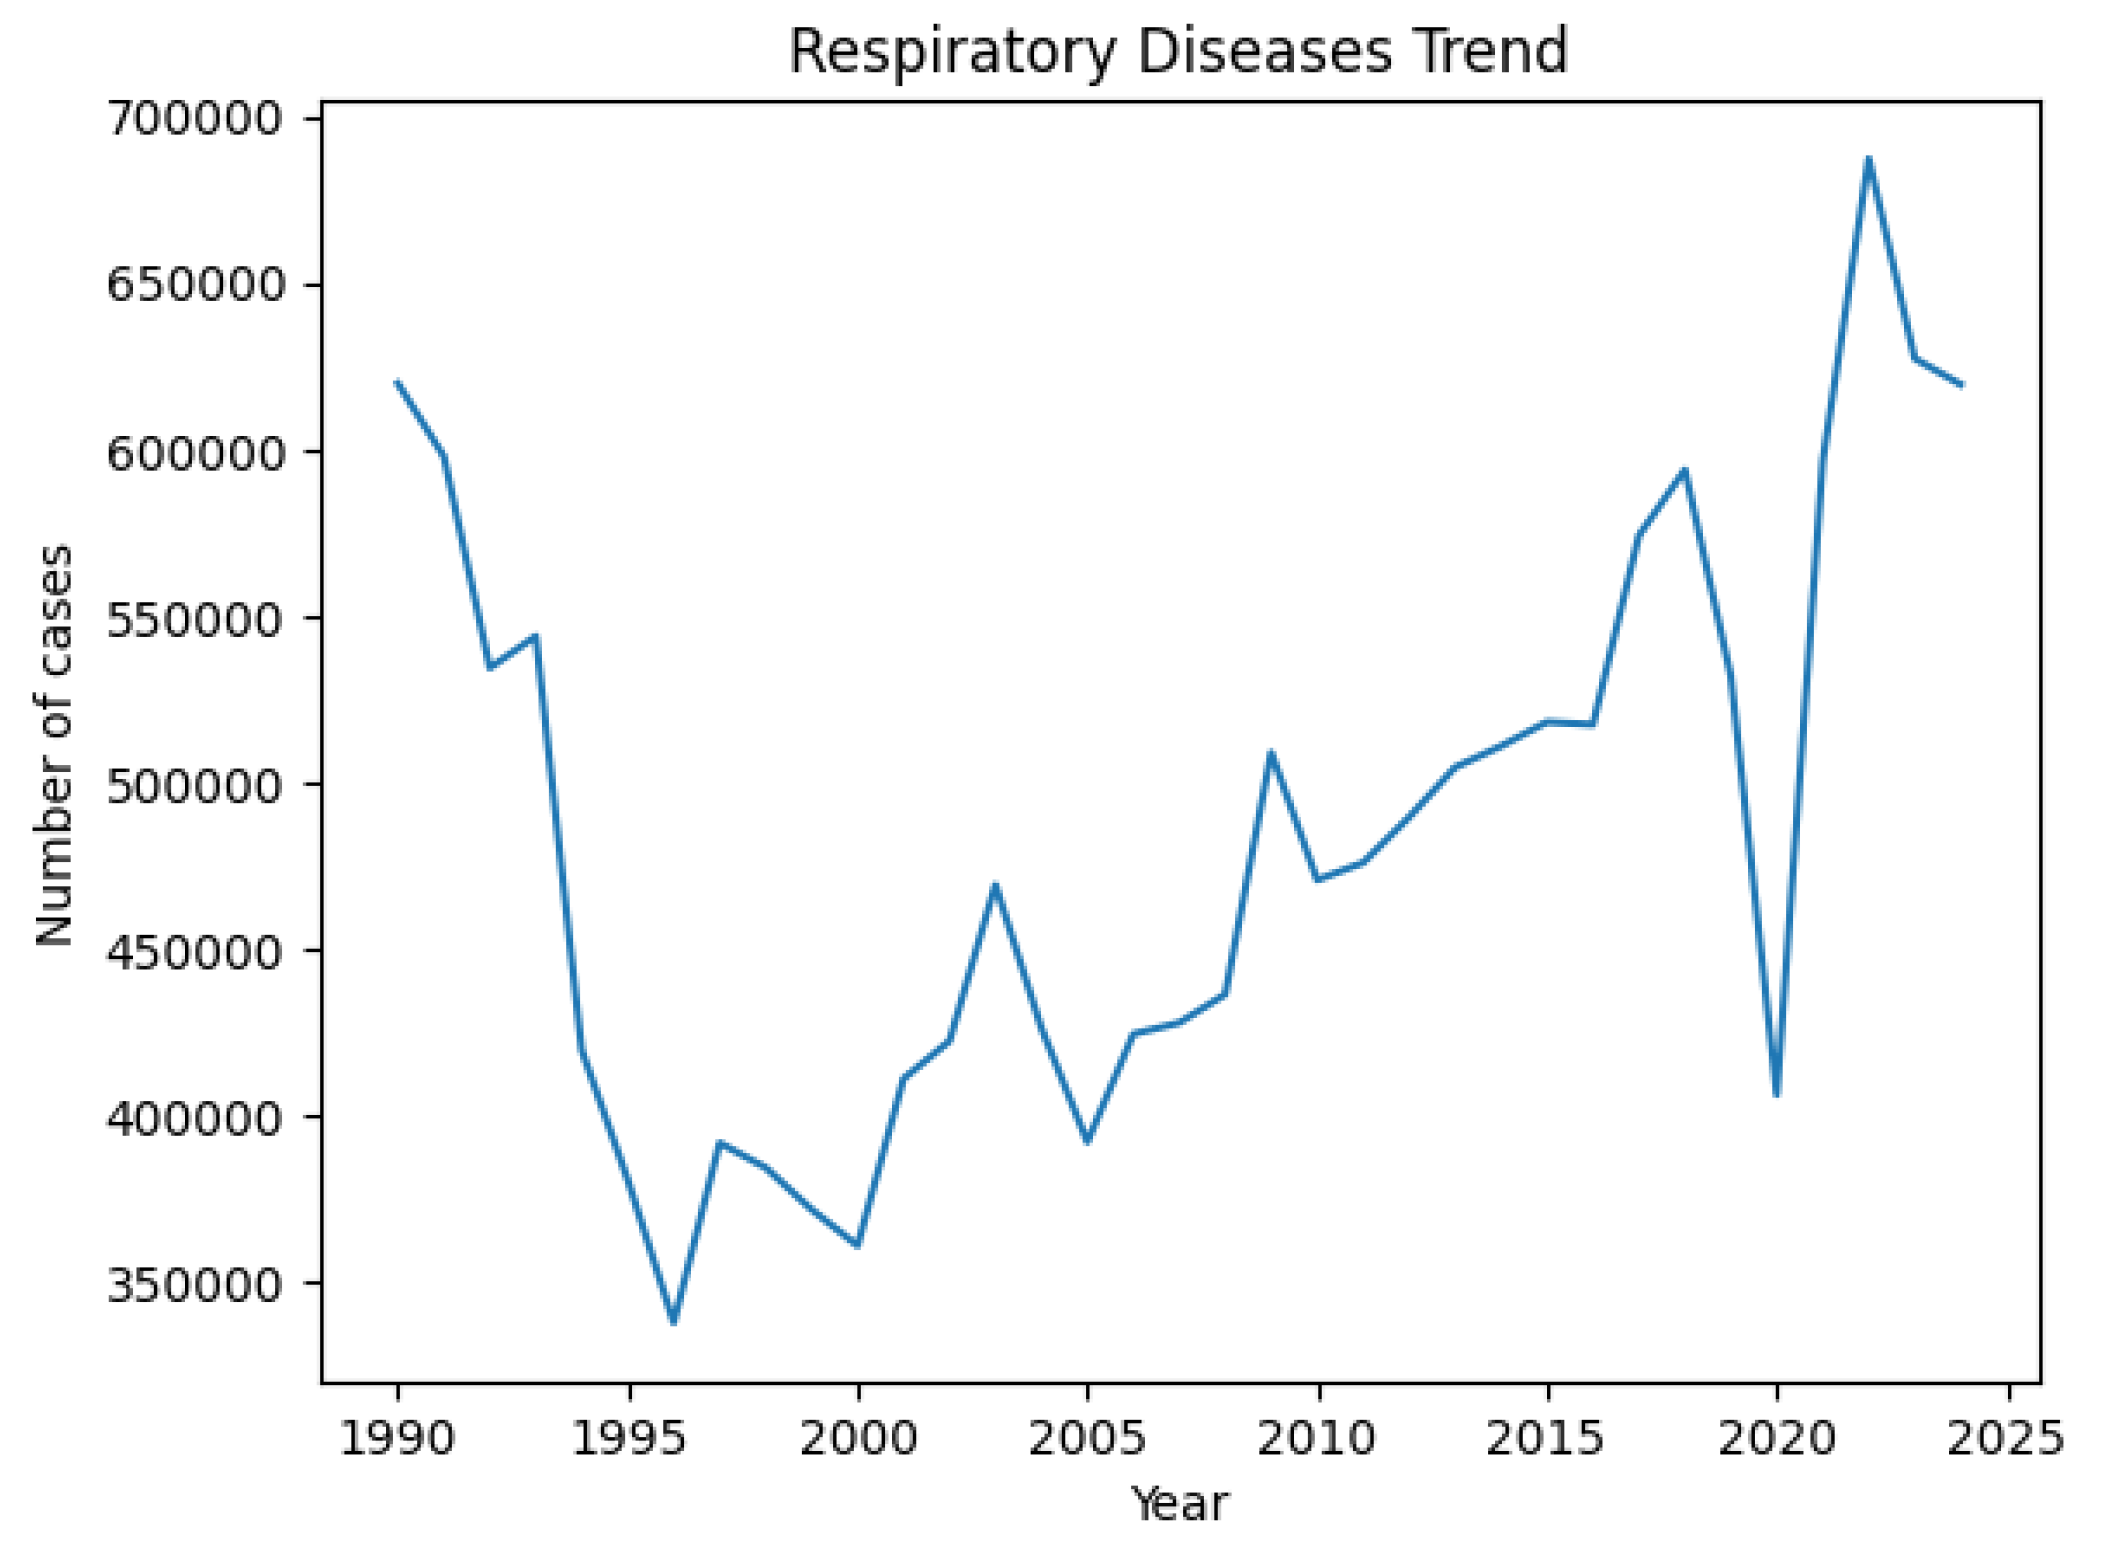
Figure 3.
Scatter plot showing the relationship between PM2.5 levels and respiratory diseases.
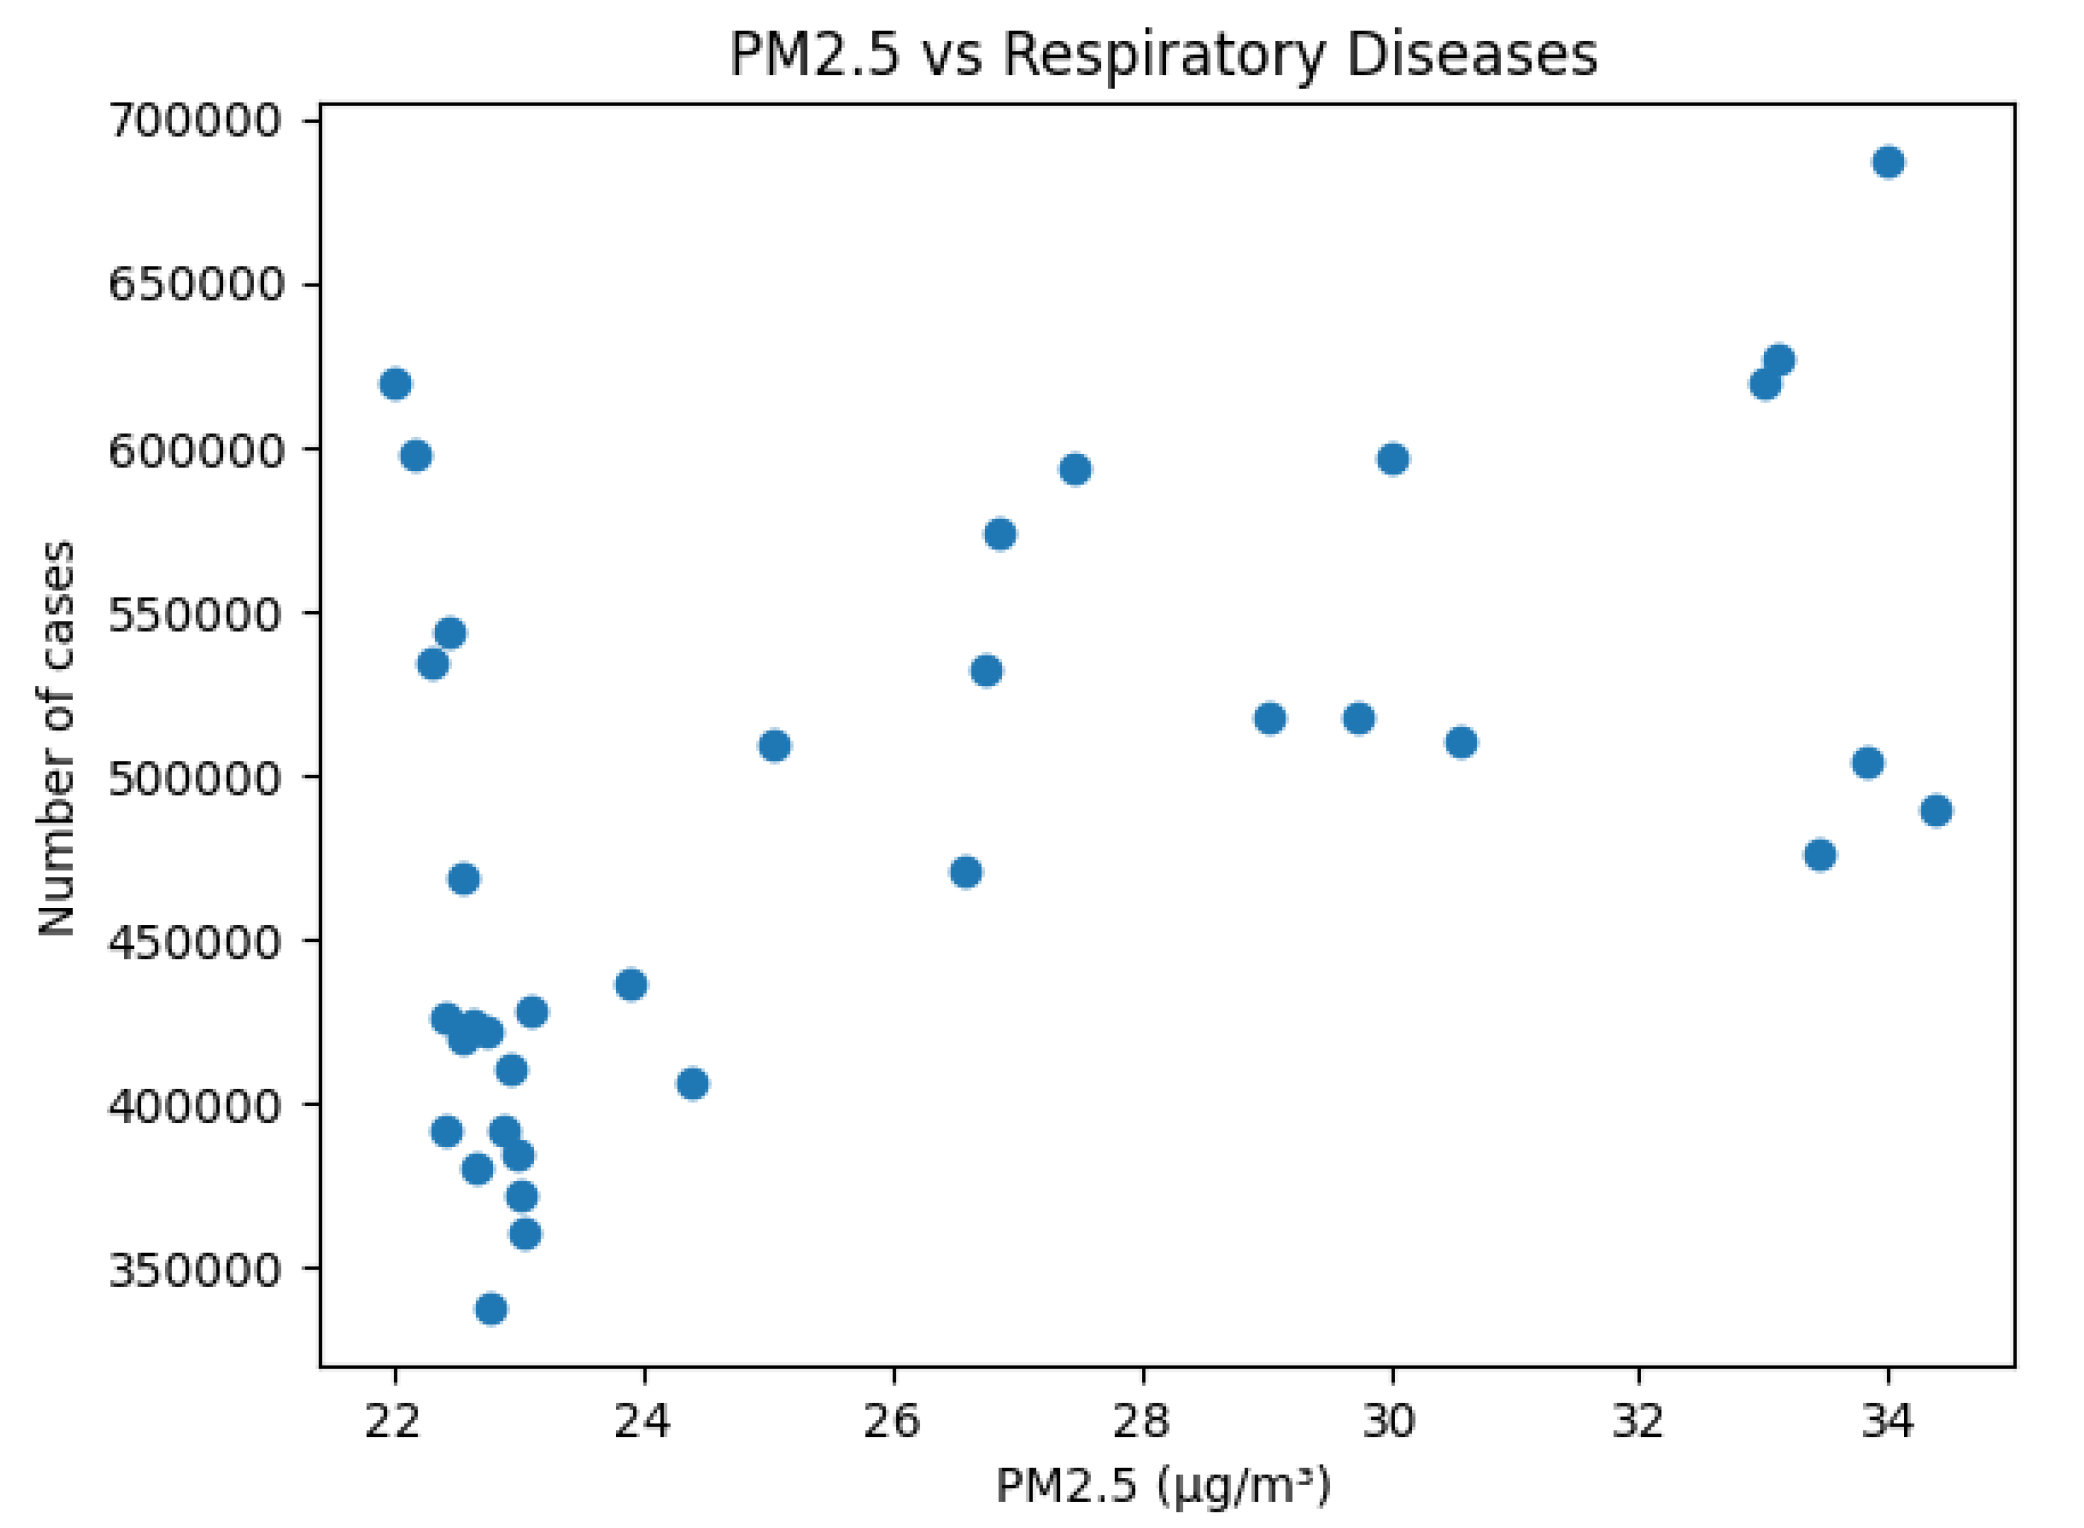
Figure 4.
Regression plot showing the relationship between PM2.5 and respiratory diseases.
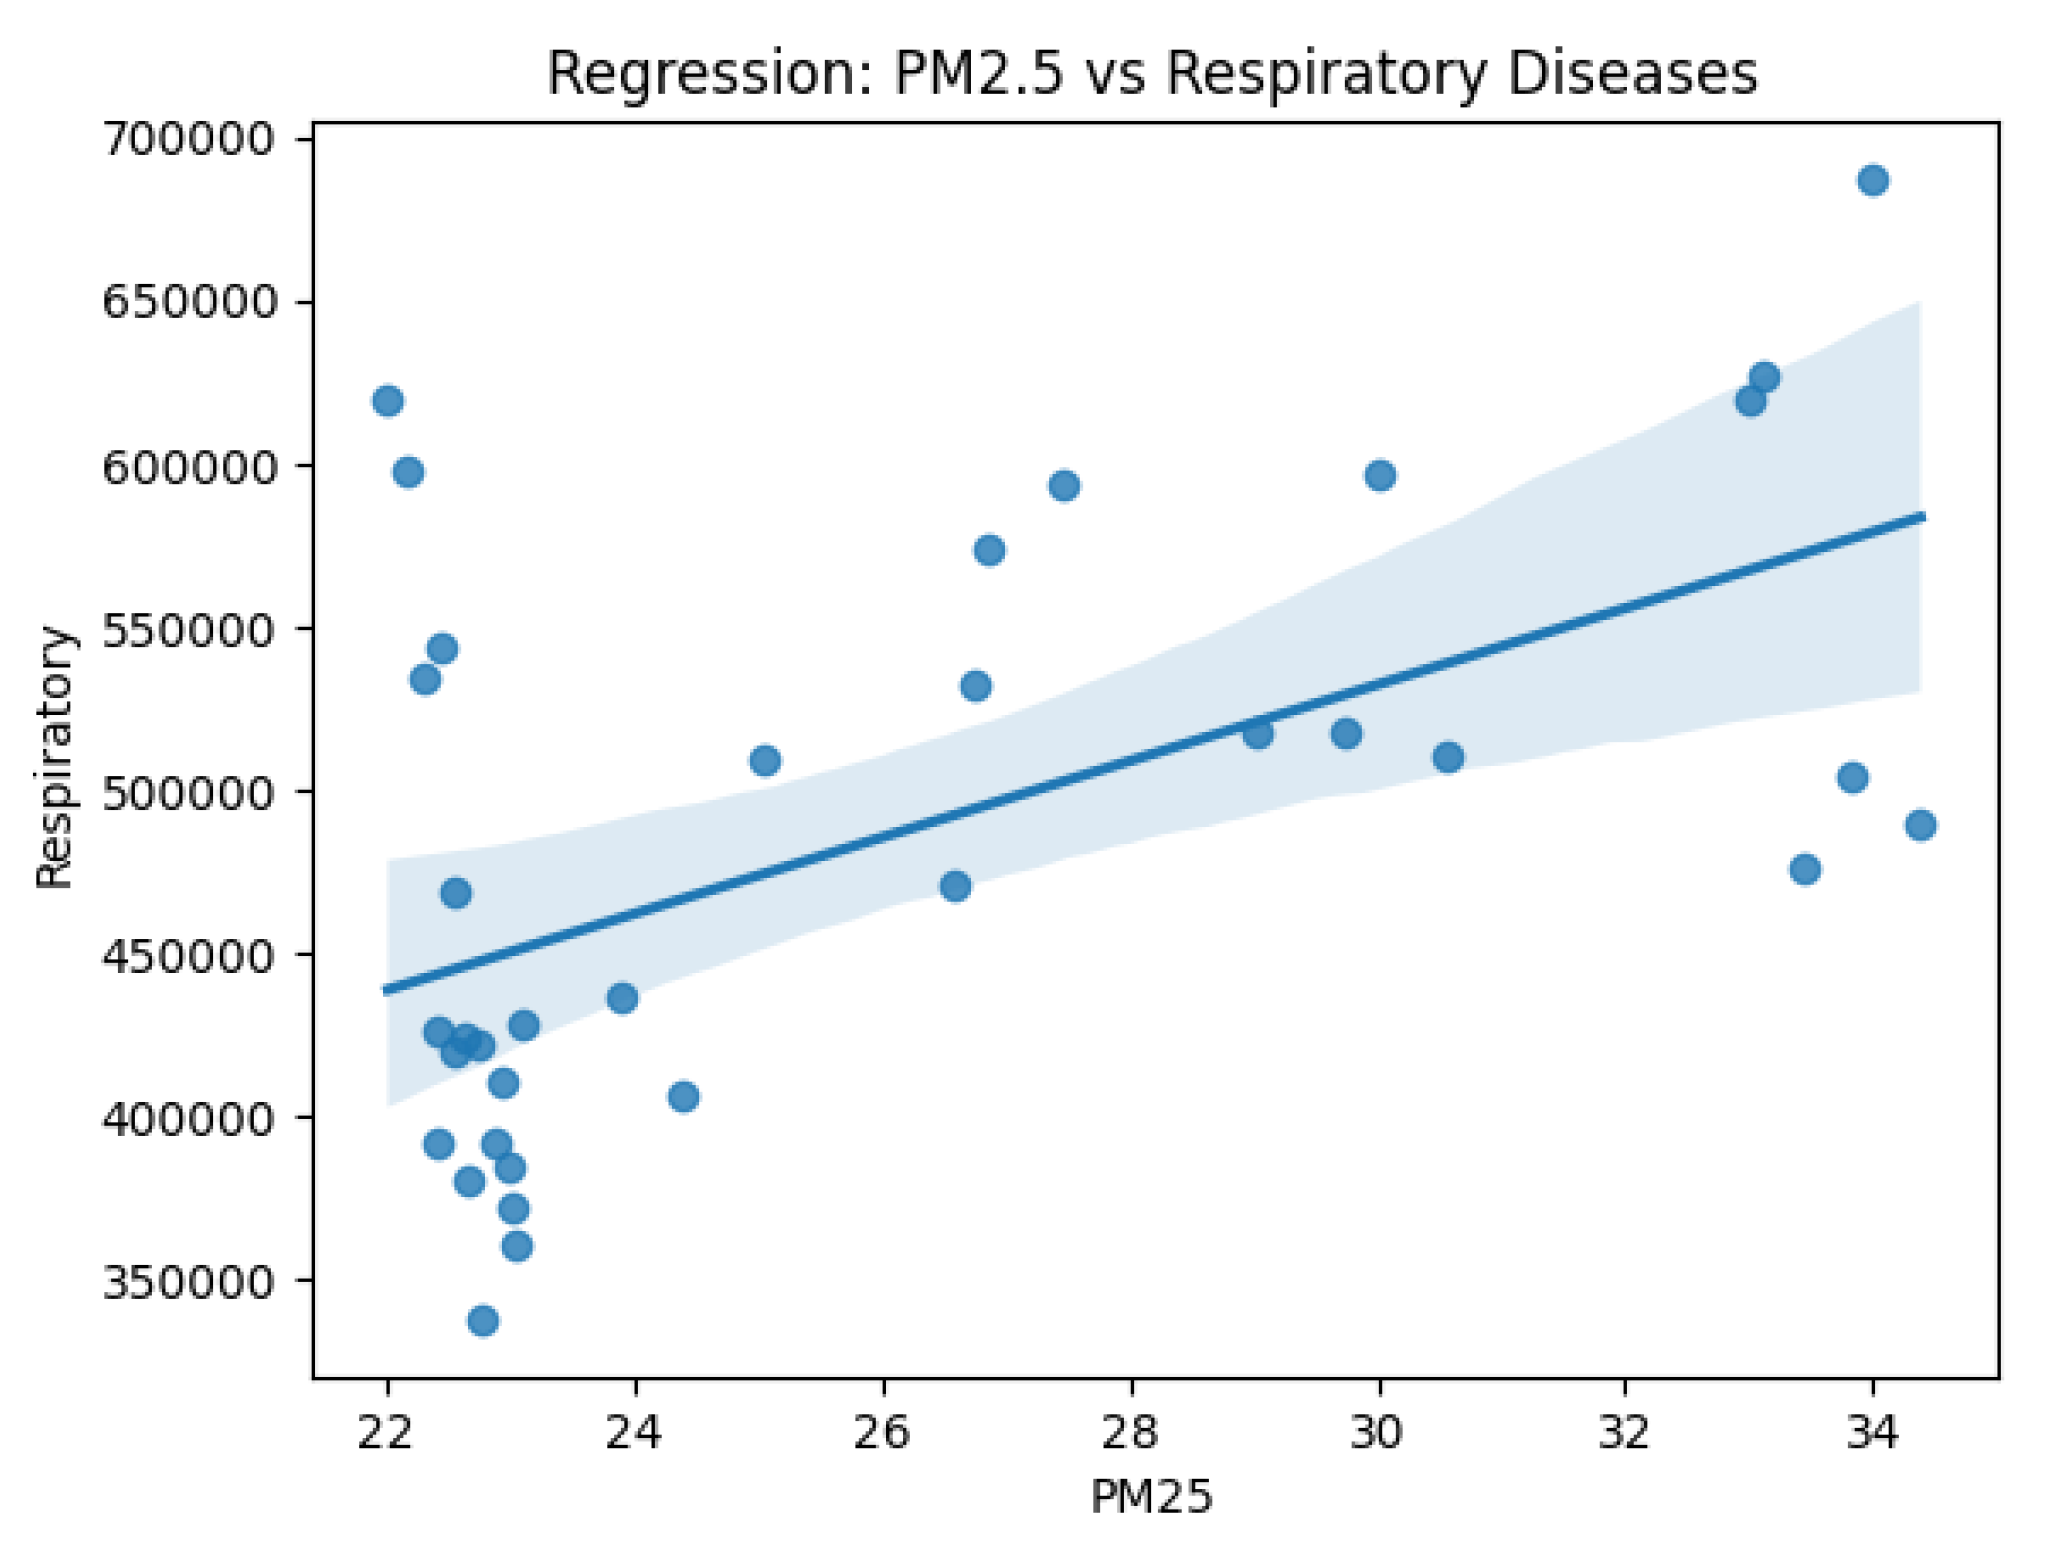
Figure 5.
Correlation heatmap between PM2.5 concentration and respiratory disease cases.
Disclaimer/Publisher’s Note: The statements, opinions and data contained in all publications are solely those of the individual author(s) and contributor(s) and not of MDPI and/or the editor(s). MDPI and/or the editor(s) disclaim responsibility for any injury to people or property resulting from any ideas, methods, instructions or products referred to in the content. |
© 2026 by the authors. Licensee MDPI, Basel, Switzerland. This article is an open access article distributed under the terms and conditions of the Creative Commons Attribution (CC BY) license (http://creativecommons.org/licenses/by/4.0/).
Copyright: This open access article is published under a Creative Commons CC BY 4.0 license, which permit the free download, distribution, and reuse, provided that the author and preprint are cited in any reuse.


