
Submitted:
20 January 2026
Posted:
21 January 2026
You are already at the latest version
Abstract
Viticulture is a vital sector of agriculture and economy exhibiting susceptibility to climate change, particularly in the Mediterranean regions. The present investigation examines the climatic suitability for vineyards development in Greece by exploiting geomorphological and bioclimatic data for the reference climatic period 1970–2000. The data are sourced from the ERA5-Land dataset and analyzed with R. The objective is to create a specific crop suitability map based on a simple, transparent model using coding processes. This map identifies the climatically suitable areas for grapevine cultivation during the reference period. Results demonstrate that the model is highly adaptable, as both variable thresholds and areas of interest can be modified, while incorporating future climate scenarios (e.g., RCP models) can be performed, allowing for dynamic reconfiguration. According to the mapped climatic suitability, 55.1% of Greece is rated 3.5-4.0, and 12.9% is rated 4.0-4.5. The total suitability over Greece is calculated with a score of 3.5-4.0 for the 50.9 % of total area, and for a score of 4.0-4.5, the covered area is 12.9%. Considering the Corine Land Cover classification as the reference land cover dataset, the false-negative areas are only 1.5% of the areas defined as viticultural. By providing clear and accurate spatial information, the model supports informed decision-making and the development of adaptation strategies, enhancing, therefore, the resilience and sustainability of viticulture in the context of climate change.
Keywords:
Mediterranean
; crop modelling
; ERA5-Land
; R - language
; bioclimate
; spatial analysis
1. Introduction
Climate change represents one of the most critical challenges of our time, as it has already reshaped, or is in the process of altering, the Earth's ecosystems. Its extensive impacts are particularly evident in the agricultural sector [1,2,3,4], which underpins global food production and is a key element of the global economy. Among the most affected regions is the Mediterranean Basin, recognized as a climate change hotspot, where climatic variations are expected to be particularly intense and consequential [5,6,7,8].
The main effects of climate change on agricultural production include reduced quantitative and qualitative productivity. Increased temperatures and decreased precipitation have intensified drought events, water scarcity, and desertification, leading to lower crop yield potential [9,10,11] but also to the expansion of agriculture to more climatically favorable areas or to its contraction owing to the adverse climatic conditions [12,13,14]. Projections indicate that if current greenhouse gas emission trends—especially CO₂—continue, global temperatures may rise by 2.5°C to 5.5 °C by the year 2100 [13]. This could result in substantial declines in the yield of major crops, including maize (−20 to −45%), wheat (−5 to −50%), and rice (−20 to −30%) [11,15,16,17].
Among the crops particularly vulnerable to climate change is the grapevine (Vitis vinifera L.), a species whose cultivation and wine production potential are closely linked to regional climatic conditions. Climate change influences the phenology of grapevines, such as delay in breaking time, reducing the rate of budbreak, and increasing the intensity of the phenomenon of acrotony, etc [18,19]. Rising temperatures accelerate the onset of phenological stages—such as budburst, flowering, and veraison—thus shortening the overall growing season [20]. Early ripening during hot periods can negatively affect grape and wine composition, including sugar–acid balance, flavonoid concentration, color, and aroma profiles. Consequently, wines may exhibit higher alcohol content, lower acidity, and altered sensory attributes [21,22].
Changes in temperature and precipitation patterns are already affecting the production potential and oenological characteristics of grape-growing regions [12,23,24,25]. Varieties that traditionally required cooler climates are experiencing yield declines, whereas those with higher thermal requirements are adapting more successfully [26]. Furthermore, climate change is expected to cause spatial shifts in suitable viticultural zones, with traditional regions progressively moving northward [27,28,29]. Warmer conditions and reduced water availability in southern Europe may alter the climatic suitability of established vineyards [30]. Conversely, areas previously considered too cold for viticulture, such as parts of Western and Central Europe, may become increasingly favorable [31]. For instance, in Austria, the suitable vineyard area is projected to double by 2050 [29,32]. Similar altitudinal shifts are also anticipated, as vineyards located at higher elevations or with lower solar exposure are expected to yield grapes with improved oenological characteristics due to slower ripening [3,21,33,34].
Viticulture has deep historical and cultural roots in Greece and remains a vital component of its economy [35,36,37]. References to grapevine cultivation appear in ancient texts, where it played an essential role not only in nutrition and economy but also in religious and social life, such as the Dionysian festivals. Today, viticulture continues to produce a wide range of products—wine, table grapes, and raisins—each requiring specific climatic conditions to achieve high-quality yields [44,45,46]. However, Greek vineyards have already experienced and are projected to continue to face the negative impacts of climate change, as persistently high year-round temperatures hinder both plant development and grapes quality.
This study aims to analyze and combine key climatic and geomorphological parameters that influence grapevine development and map the related climatic suitability.
For this purpose, climatic indices were employed and designed for the comprehension of the relationship between climate and viticulture. Specifically, parameters and indices related to temperature such Winkler index (WI), Huglin Index (HI), Cool Night Index (CNI), Mean Growing Season Temperature (GST), Very Hot Days (VHD), Very Hot Periods (VHP), Very Cold Days (VCD), Frost Days (FD) and precipitation such as Hydrothermal Coefficient (HTC), Growing Season Precipitation(GSP) were exploited, providing insights into both the quantitative and qualitative aspects of vine development [53,54,55,56]. In parallel, by considering the direct influential role of geomorphological parameters on grapevine growth, four geomorphological factors such as Solar Radiation Exposure, Slope, Terrain Roughness, Elevation (above sea level) were also applied, each playing a crucial role in determining vine development, the selection of suitable cultivation areas, and ultimately the qualitative characteristics of the final product [57,58,59].
Values for each of the aforementioned parameters were identified through a comprehensive literature review to define the optimal and limiting thresholds for grapevine growth. Subsequently, corresponding datasets were retrieved from the ERA5-Land reanalysis database via the Google Earth Engine (GEE) platform (https://code.earthengine.google.com). The data were processed and visualized in R, resulting in a viticultural suitability model that delineates areas in Greece capable of supporting viticulture under baseline climatic conditions (1970–2000).
The findings underscore the necessity of assessing viticultural suitability, particularly in southern European countries where climatic conditions are projected to become increasingly unfavorable for traditional grape cultivation. This climatic suitability model represents the first comprehensive assessment of viticultural suitability across the entire territory of Greece, integrating an extensive set of indicators that include ten climatic and four geomorphological parameters. The analysis was conducted in the R programming environment, enabling a robust, reproducible modelling framework.
2. Materials and Methods
2.1. Data
The data used in this study can be divided into two main categories: those related to the terrain's geomorphology and those concerning the climatic and bioclimatic conditions in Greece. The information about above parameters presented in the following section accompanied by the related score tables in the supplementary material document.
2.1.1. Geomorphological Data
The geomorphological data utilized to evaluate the related suitability across various geographical regions were obtained from a Digital Elevation Model (DEM) with a spatial resolution of 250m. Subsequently, spatial operations were performed on the geomorphological dataset to generate maps for the following indicators [58,60].
- Slope
Slope represents a parameter of particular importance for the growth and cultivation of grapevine. This geomorphological characteristic plays a decisive role in several aspects, including i) soil drainage and erosion processes, ii) vineyard aeration, and iii) accessibility for agricultural machinery [54].
According to the international literature, gentle slopes (1°-15°) are considered the most suitable for viticulture, as they minimize the risk of soil erosion [61,62]. As slope steepness increases, the hazards of surface runoff and erosion become more pronounced, and in the absence of dry-stone terraces, vineyard cultivation becomes significantly more challenging. It is noteworthy that a slight slope may be beneficial for vine development, as it facilitates more effective drainage. Finally, in colder climates, steeper slopes contribute to the protection of the vineyard from low nocturnal temperatures [63].
- Elevation (above sea level) - Altitude.
Elevation constitutes another critical parameter in shaping the microclimate of a vineyard, directly influencing temperature, the duration of the ripening period, and the chemical composition of the grape (e.g., phenolic compounds) [64]. In Europe, the highest vineyard elevations are found in Switzerland, in the village of Visperterminen, at 1150m , and in Greece, in the region of Metsovo, at 1050m. Consequently, these two elevations may serve as reference points for the upper altitudinal limits at which grapevines can be cultivated within the European context.
- Terrain roughness
Terrain roughness constitutes an additional geomorphological factor that critically influences grapevine growth and cultivation. Vineyards tend to develop more favorably under low roughness conditions, ideally when terrain roughness approaches zero [66,67,68].
Terrain roughness was calculated from the DEM using the terrain function from the terra package in R. Specifically, when the "roughness" option is selected, it computes the difference between the maximum and minimum elevation values of a cell and its eight surrounding cells, where each pixel has an approximate spatial resolution of 250m [69].
- Solar radiation exposure- Aspect
Vineyard aspect constitutes an important geomorphological factor, as the vineyard's spatial orientation determines the amount of solar radiation absorbed by the plant. Adequate sunlight duration is essential for proper vine development [70]. This condition is typically achieved in vineyards on south-facing slopes, which receive more solar radiation and consequently experience higher temperatures. It is noteworthy that the "exposure" parameter does not act as a limiting factor for grapevine cultivation. However, it plays a crucial role in defining the qualitative characteristics of production, as it largely influences the rate of fruit ripening and, consequently, its chemical composition [59].
2.1.2. Bioclimatic Data
The bioclimatic data used for assessing vineyard suitability across regions was retrieved from the ERA5-Land database. From this dataset, spatial operations were applied to compute the following agrometeorological indices and climatic parameters:
- Winkler Index (WI)
The WI represents the cumulative sum of heat units accumulated by grapevine varieties when the mean daily temperature exceeds 10 °C during the period from April 1st to October 31st (for the Northern Hemisphere). It has been widely established that 10°C constitutes the minimum threshold temperature for grapevine development, commonly referred to as the base temperature. Therefore, only mean daily temperature values that exceed this base temperature are summed, while days with mean temperatures below or equal to 10°C are assigned a value of zero, as they are considered non-contributory to vine growth [73].
The WI expressed in degree-days (°C) serves as a critical indicator for assessing the thermal suitability of a region for viticulture. Different index ranges correspond to distinct viticultural zones, each associated with varying levels of heat accumulation and, consequently, different grape-growing potentials. Regions classified as Zones I and II (850–1670°C) represent cooler climates, generally suitable for early-maturing grape varieties that favor the development of acidity and delicate aromatic profiles. Intermediate zones (III–IV; 1671–2220°C) provide moderate thermal conditions conducive to balanced sugar–acid ratios and optimal phenolic ripening. In contrast, Zone V (>2221°C) indicates warmer environments, often promoting rapid sugar accumulation and higher alcohol potential but potentially limiting acidity and aromatic complexity. Therefore, the WI is a valuable tool for delineating viticultural suitability and guiding the selection of appropriate grape varieties under varying climatic regimes [54,74].
Mathematical equation of the WI:
Tmax: maximum diurnal temperature (in °C).
Tmin: minimum diurnal temperature (in °C).
- Huglin Index (HI)
The HI is calculated as the cumulative sum of the mean and maximum daily temperatures when the daily temperature exceeds 10 °C. The period over which these values are accumulated extends from April 1st to September 30th. Additionally, the Huglin Index includes the study area's latitude as an input parameter [54].
Although this index is primarily used to qualitatively assess each grapevine variety, it can also be used to determine whether a specific region is suitable for viticulture. Specifically, areas classified within categories HI+1, HI+2, and HI+3, due to their warmer climates, can support the ripening of most grape varieties. In contrast, in cooler regions, this potential is limited to fewer cultivars. It is worth noting that in very warm areas, double harvests may be possible; however, such conditions can be unsuitable for some varieties due to the increased risk of over-ripening [75].
Mathematical equation of the HI:
Tmax: maximum diurnal temperature (in °C).
Tmean: average diurnal temperature (in °C).
d: day length coefficient by latitude.
- Cool Night Index (CNI)
The CNI calculates the mean minimum temperature during the grapevine harvest month (typically September in the Northern Hemisphere and March in the Southern Hemisphere) and is reported to be closely associated with grape maturation, grape color, and aromatic attributes. For this reason, the CNI is used as an indicator for the quantitative and qualitative assessment of grapes exploited for winemaking [76].
The CNI, based on the mean minimum temperature of September, plays a crucial role in grape ripening and in shaping the aromatic and phenolic composition of the grapevine, particularly in the red cultivars. Cooler nocturnal conditions promote the accumulation of pigments such as anthocyanins, as well as aromatic compounds and organic acids, while concomitantly slow down the rapid ripening processes often induced by elevated daytime temperatures. Consequently, regions characterized by low CNI values are generally associated with superior wine quality, as these conditions enhance color stability, aromatic complexity, and acidity balance. This effect is especially significant in warm-climate viticultural areas, where cool nocturnal temperatures mitigate excessive metabolic activity and preserve the sensory attributes essential to high-quality wine production [77].
Mathematical equation of CNI:
Tmin: minimum diurnal temperature (in °C).
- Hydrothermal Coefficient (HTC)
The HTC integrates the combined effects of precipitation and temperature during the grapevine growing season. This coefficient provides an indication of whether a vineyard can access sufficient water amount to support proper grape development [78].
The HTC values ranging between 0.5 and 2.5 mm/°C are considered favorable for the development of grapevine varieties. According to the literature, the optimal value of the HTC is 1. Values below 0.5 indicate dry or semi-arid conditions that may lead to water stress, whereas values above 2.5 are associated with excessive humidity, which can increase the incidence of phytopathological issues or adversely affect grape quality [54].
Mathematical equation of the HTC:
P: growing season precipitation (April to October) (in mm).
T0: the sum of temperatures when the mean daily temperature > 10°C.
- Growing Season Precipitation (GSP)
The GSP refers to the total amount of precipitation recorded during the period from April 1st to September 30th. The GSP is associated with the level of stress that non-irrigated grapevines may experience during the growing season due to variations in rainfall amount, whether resulting from insufficient or excessive precipitation compared to normal conditions.
Mathematical equation of the GSP:
Prec: total amount of precipitation (in mm).
- Mean Growing Season Temperature (GST)
The GST worldwide typically ranges between 13°C and 21°C. Slight deviations near these limits may still support certain outcomes: at the lower end (approximately 13°C) hybrids may thrive, while at the upper end (slightly above 21°C) grapes may be destined for non-bottled wines, table grapes, or raisins [55].
Therefore, optimal means growing-season temperatures for grapevine cultivation range from 13°C to 21°C, conditions that favor balanced vegetative growth and fruit ripening.
- Number of Very Hot Days (VHD)
Based on the aforementioned information regarding the optimal mean temperature range for grapevine growth and development, it is evident that extremely high temperatures constitute a limiting factor for viticulture. Reduced vine performance under such conditions is primarily due to increased thermal stress, which can adversely affect physiological processes such as photosynthesis, berry development, and metabolite accumulation[55].
Temperatures exceeding 30°C for a few days can be beneficial to grapevines by promoting fruit ripening. However, prolonged exposure to temperatures above 35°C induces thermal stress, leading to premature ripening and change of berry coloration (véraison). Such conditions may also result in berry detachment from the plant and cause partial or complete loss of flavor compounds typically developed during the ripening process [79].
- Heatwave Period (HP)
Another parameter related to high temperatures for grapevine varieties concerns their continuous exposure to temperatures exceeding 35°C for more than one day (consecutive days with ≥ 35 °C), or else the HP. Prolonged exposure subjects the plant to sustain thermal stress, thereby exacerbating the adverse effects on its growth and development. As a result, more consecutive days with this high temperature lead to a drop in the score [80].
- Number of Very Cold Days (VCD)
Minimum temperatures grapevines can withstand range from –5°C to –20°C, with certain hybrids demonstrating tolerance to slightly lower temperatures. Prolonged exposure to such low temperatures can cause severe damage to the plant, including cellular and, consequently, tissue destruction, as well as overall hydration reduction [73].
- Frost Days (FD)
Another crucial factor that adversely affects grapevine growth is the occurrence of frost (< 0 °C) during the growing season (from April to October). It has been demonstrated that temperatures below 0°C during this period can cause damage to the buds, reduce fruit set and overall yield, and, in severe cases, result in irreversible damage to the plant itself. An increased number of such days corresponds to a higher risk of adverse effects on the final yield [81].
2.2. Methodology
To ensure proper data acquisition, management, visualization, and modeling, a sequence of computational steps took place (Figure 1). For the bioclimatic data, the ERA5-Land dataset was accessed via the Google Earth Engine (GEE) platform [82] using its integrated code editor. JavaScript scripts were used to extract all necessary parameters for the study. ERA5-Land is a climate reanalysis dataset provided by the Copernicus Climate Change Service of the European Union via ECMWF (European Centre for Medium-Range Weather Forecasts). It offers a wide range of freely accessible climate variables, spanning a broad historical period (from 1950 to approximately 5 days before the current date). ERA5-Land provides high spatial and temporal resolution data for atmospheric parameters. It is a refined version of the land component of the ERA5 reanalysis, with a spatial resolution of approximately 9km [83,84,85].
A key advantage of ERA5-Land over other environmental datasets is its global coverage and consistency, providing homogeneous, gap-free data, unlike traditional station-based meteorological records, which often suffer from inconsistencies or missing values. This dataset is widely used in applications related to agrometeorology, bioclimatic research, water resource management, and ecosystem modeling [86,87,88,89].
After downloading the data from the GEE platform, we conducted the spatial transformation, calculations, and mapping using the R language, an open-source, multi-platform, and free programming language [90]. It enables rapid, automated data retrieval from various local sources. It is a general-purpose data analysis language, equipped with specialized packages for tabular and spatial data analysis and for biometeorological research, and supports advanced statistical and mathematical operations [91]. One of R's major strengths is its ability to produce high-quality visualizations and ensure precise data representation. It has significantly contributed to the scientific advancement of biometeorology by overcoming limitations of traditional research workflows, while enhancing research reproducibility and automation [92]. The R packages (libraries) we used for the analysis and the presentation of the results are terra [93], sf [94], and Tidyverse [95].
Based on the above:
- Maps were initially created for all parameters, with each parameter classified by a score from 1 to 5. The score value of 1 is assigned to adverse conditions of the parameter/index in relation to grapevine cultivation, and the score 5 is assigned to the optimal conditions of this parameter/index. Also, in some parameters (e.g., terrain roughness, elevation above sea level, etc.), a score of zero (0) may also be assigned, given that knowledge driven from the present data or the literature indicates that some values are unsuitable for viticulture. Thus, if the conditions are unsuitable for grapevine cultivation, the score is 0; otherwise, it ranges from 1 (least suitable) to 5 (most suitable). In the final map, regions with at least one value of 0 remain unsuitable, regardless of the scores for the remaining parameters/indexes. The scoring classification for each parameter/index is presented in the supplementary material.
- Subsequently, each categorized map was assigned a specific statistical weight according to the extent to which each parameter affects grapevine cultivation. This procedure was carried out because each parameter does not affect grapevine growth and cultivation to the same extent. Consequently, parameters that have a greater impact on grapevine cultivation were given higher statistical weights (e.g., 0.1) compared to those with lower influence (e.g., 0.05; 0.07; 0.03). Through this process, two final rasters were produced, representing the overall geomorphological and climatic suitability for grapevine cultivation in the study area for the 1970–2000 time period. The weights and the scoring are based on bibliographic knowledge, professional experience, and empirical observations of Greek viticulture. The assigned weights are presented in Supplementary Material Table S15.
- Finally, the geomorphological and climatic score rasters were combined to produce a final suitability score map. Geomorphology accounts for 30% of the final score, and climate for the remaining 70% in this version of the model. This ratio is based on the total number of parameters/indexes used in the coding-based model employed and on how each statistical weight contributes to it. The final viticulture suitability score map for Greece ranges from 2 to 4.5 for suitable areas. Cases with at least one 0 score have been removed from the final suitability map as they imply restrictiveness for viticulture cultivation. Furthermore, an additional map has been developed illustrating only the areas with high geomorphological and climatic suitability scores (values 4 to 4.5).
The main methodology has been applied to a recently published study on climatic suitability for olive cultivation in Greece [96].
3. Results and Discussion
3.1. Classification of Geomorphological Parameters
To construct the final viticultural suitability map, score maps for every parameter/index utilized in this model were developed. First, the digital elevation model (DEM) was used to generate geomorphological maps based on relative parameters (Elevation, Slope, Terrain roughness, and Aspect of the vineyard) using R.
The slope and aspect score maps were classified on a scale from 1 to 5, since, in the study area, the slope and aspect parameters do not correspond to values characterizing areas unsuitable for grapevine cultivation. On the contrary, elevation and terrain roughness are two parameters that correspond to values interpreted as areas unsuitable for grapevine cultivation. For this reason, elevation and terrain roughness have been classified on a scale from 0 to 5.
- i)
- Slope of the terrain
As illustrated in Figure 2, the regions of Central Macedonia, Western Thrace, Central continental Greece, Western Peloponnese, as well as parts of the Attica district and Crete, exhibited the highest suitability for viticulture (suitability score ≥ 4). Conversely, the Pindus and Rhodope mountain ranges, the foothills of Mount Olympus, the central Peloponnese, and a few localized areas in Crete were characterized by low suitability scores (1–2). Overall, despite the substantial geomorphological diversity across Greece, a large proportion of the national territory presents favorable conditions for grapevine cultivation. In Figure S2, we see the slope’s spatial distribution in Greek territory, and in Table S2, we present the score for this parameter.
- ii)
- Elevation above sea level- Altitude
According to Figure 3 (Figure S3 presents the altitude of the study area and Table S2 illustrate the scoring of this parameter.), the diverse topography provides a wide elevational range suitable for viticulture, varying from near sea level (10–20m) in coastal areas of Central Greece and the Peloponnese region, to the highest vineyards located in the region of Metsovo at the "Katogi Averoff" winery (950–1050m). The locations referred to in the text are shown in Figure S1 of the Supplementary Material.
Optimal elevations typically fall within intermediate ranges between these extremes, where temperature and humidity conditions are balanced most favorably for grapevine cultivation and grape quality development. In this model, altitudes above 1500m were considered unsuitable for grapevine cultivation (score = 0). These areas are located in the Pindus and Rhodope mountain ranges, Mount Olympus, the Central and South Peloponnese, and several localized regions of Crete.
- iii)
- Terrain roughness
As shown in Figure 4 (Figure S4 presents the spatial distribution of roughness in Greece, and Table S3 shows the parameter's scoring), terrain roughness in Greece exhibits substantial spatial variability, with the highest values observed predominantly in mountainous and deeply incised landscapes. These areas, such as the Pindus and Rhodope mountain ranges, the foothills of Mount Olympus, central Peloponnese, and several localized regions in Crete and Epirus, are generally less suitable for grapevine cultivation (score ≤ 2) or totally unsuitable (suitability score = 0) due to their pronounced topographic irregularity. In contrast, the remaining regions of the country display terrain roughness values conducive to viticulture, with the most suitable zones identified in Central Macedonia, Central continental Greece, and Western Peloponnese (suitability score ≥ 4).
- iv)
- Aspect of the vineyard
As demonstrated in Figure 5 (Figure S5 presents the aspect of the country and Table S4 illustrates the scoring of this parameter), south-facing vineyards get a higher score (score: 5) than north-facing vineyards (score: 3). South-facing vineyards are observed throughout the country, as optimal vineyard aspect values typically fall between the 45° – 135° and 225° – 270° ranges. Conversely, vineyards oriented toward the north, with aspect values ranging from 0° – 45° and 315° – 360°, receive the lowest suitability score. All remaining aspect classes for this parameter are assigned a suitability score of 4.
3.2. Classification of Climatic/ Bioclimatic Parameters and Indices
The ERA5-Land dataset was utilized for the required climatic data. It is noted that the spatial resolution of the climatic data is lower than that of the geomorphological data (9km vs. 250m). To enable spatial operations, data homogenization was performed, thereby enhancing the spatial resolution of the climatic data without altering the parameter values.
- i)
- Winkler Index (WI)
According to Figure 6 (score Table S5), the WI attains scores ≥ 3 across the majority of the Greek territory, except for limited areas in the Peloponnese, the Pindus and Rhodope mountain ranges, and the broader region surrounding Mount Olympus, where scores fall to ≤ 2. In all other areas, the WI indicates more favorable conditions for viticulture. Western Greece, extensive parts of Macedonia and the Central mainland, the Ionian Islands, and large areas of Crete exhibit higher suitability levels, with WI scores typically ranging from 4 to 5 (Figure 6b).
- ii)
- Huglin index (HΙ)
As shown in Figure 7 (score Table S6), a large part of Greece falls within the HI+3 category, which may result in certain regions being assigned lower ratings than their actual winemaking potential (e.g., the Nemea vineyard, northeastern Peloponnese) (Figure 7a). However, in both WI and HI, the high-value categories do not act as limiting factors for vine development; rather, elevated temperatures accelerate grape ripening and concurrently alter the chemical profile of the grapes.
Figure 7b illustrates that scores 2 and 3 could be obtained from areas with either lower or higher index values than the optimal. Furthermore, as shown in Figure 7b, the majority of Greece receives low suitability scores (= 2) due to elevated temperatures (HI+3 category). On the contrary, regions situated at higher altitudes, where temperatures are comparatively lower, achieve higher suitability scores (≥ 3) as they align more closely with the optimal HI range. Finally, it should be noted that, according to the HI, viticulture is not feasible in a few limited areas located within the Pindus and Rhodope mountain ranges, as well as at high elevations on Mount Olympus. In these regions, the index demonstrates unsuitable conditions for grapevine cultivation, resulting in a score of 0.
- iii)
- Hydrothermal coefficient (HTC)
As previously mentioned, the optimal value of the index is 1; therefore, values between 0.9 and 1.1 correspond to the highest score (5) [54]. As the values move farther from the preferred (optimum) value, the score drops proportionally. It is noted that scores 1 to 3 could be obtained in areas with either lower or higher HTC values than the optimal value.
As exhibited in Figure 8 (score Table S7), regions primarily in Central Greece and further north display relatively high values of this index and therefore receive the lowest suitability scores (= 1). Additionally, certain areas in southern Attica, the Cyclades, and most of Crete have low index values—and correspondingly low suitability scores (= 1)—due to low precipitation combined with elevated temperatures. In contrast, the remaining parts of the country, particularly large areas of the Peloponnese, Central continental Greece, and the southern portion of Macedonia, exhibit high suitability scores (≥ 4) (Figure 8b).
- iv)
- Mean growing season temperature (GST)
During the investigated time frame in Greece (1970 – 2000), the GST ranges from 12°C to 22°C (Figure 9a, Table S8). As such, GST from 12°C to 13°C was slightly less suitable for grape cultivation (score: 3) than values from 13°C to 21°C (score: 4 – 5). Additionally, temperatures above 21°C exceeded the optimal range and characterized areas receiving a score of 3.
As shown in Figure 9b, most of Greece is suitable for grapevine cultivation, as GST values across most regions fall within the desirable range. Exceptions include certain areas in northern Greece, where mean temperatures fall below 13°C, as well as regions in southern Crete, Attica, Evia, and southern Peloponnese, where the GST exceeds 22°C.
- v)
- Cool night index (CNI)
Figure 10 (score Table S9) demonstrates the distribution and score of the CNI across Greece. Most coastal areas of mainland Greece, the Aegean islands, and Crete exhibit high CNI values and consequently receive low suitability scores (≤ 2). In contrast, central Peloponnese and, more broadly, the northern part of the country display lower mean minimum temperatures during September, resulting in higher suitability scores (≥ 3) (Figure 10b).
- vi)
- Growing season precipitation index (GSP)
In Greece, during the reference period, precipitation ranges from 20mm to 600mm (Figure 11a, score Table S10). The highest scores (4 and 5) are obtained from areas receiving higher precipitation (North and Central continental Greece), while the lowest scores are distributed across southern and eastern areas with lower precipitation (Peloponnisos, Aegean islands, and Crete) (Figure 11b).
- vii)
- Average hot days (≥ 35°C) (HD)
To quantify the HD effect, a spatial analysis was conducted to generate a map showing the average number of days with maximum temperatures exceeding 35°C. The latter temperature value represents a threshold commonly recognized as the upper limit for the onset of heat stress in grapevines [97]. This indicator provides valuable insight into the spatial variability of heat stress risk and its potential implications for grapevine productivity and quality [98].
Classification results show that HD values ranging from 0 to 6 days (Figure 12a, score Table S11) receive higher suitability scores (5 and 4) (Figure 12b). These high-scoring areas are observed across most of the country; however, as the index exceeds 6 days, the score decreases proportionally. This pattern is observed in regions of the Thessalian plain, the western part of Central Greece, and the southern Peloponnese (Figure 12).
- viii)
- Heatwave period (HP)
During the reference period, the distribution map indicates that HP values across Greece range from 0.5 to 5.5 consecutive days (Figure 13a, score Table S12). Naturally, prolonged exposure to such elevated temperatures intensifies thermal stress on the vine, resulting in lower suitability scores. Conversely, as the number of consecutive hot days decreases, the corresponding suitability scores increase. As shown in Figure 13b, the scoring distribution shares many similarities with the HD parameter, with the highest scores (≥ 4) observed across most of the country. However, as the number of consecutive days with maximum temperatures of 35°C increases (≥ 3 days), the score decreases proportionally. This pattern is observed primarily in the same regions as those affected by the HD parameter.
- ix)
- Very Cold Days (VCD)
Temperatures below −5 °C represent the threshold of cold stress imposed on most grapevine varieties. As the number of VCD increases, so does the likelihood of the damaging and destruction risk of temperature-sensitive cultivars.
Figure 14 (score Table S13) displays maps of the distribution of the average number of days with temperatures below −5 °C (VCD) (Figure 14a) and the corresponding scores (Figure 14b) over Greece for the reference period. It is demonstrated that the VCD of 0 to 10 days corresponds to the highest scores (5 and 4). Furthermore, as the number of VCD increases (> 10 days), the score decreases proportionally. Across much of the country, the VCD parameter is below 10 days; therefore, all island regions of Greece, the Peloponnese, most of Central Mainland Greece, and part of Macedonia have suitability scores ≥ 4. In contrast, the Pindus and Rhodope mountain ranges, as well as the area surrounding Mount Olympus, exhibit scores that do not indicate high climatic suitability for viticulture (scores ≤ 2).
- x)
- Frost Days (FD)
According to Figure 15 (score Table S14), areas experiencing FD from 0 to 1 (Figure 15a) receive the maximum score of 5, indicating minimal risk. This range of values is observed across almost the entire Greek territory, as also illustrated in Figure 15b. As the frequency increases from 10 to 15 days, the score decreases, reflecting heightened vulnerability. Finally, areas with 15 to 21 frost days are assigned a score of 0, corresponding to the highest risk of frost-related damage. The regions with the lowest scores, including values approaching or equal to 0 (unsuitable for grape cultivation), are primarily located in the country's mountainous regions, such as the Pindus and Rhodope mountain ranges.
3.3. Total Climatic and Geomorphological Viticultural Suitability
Based on the above ratings of the spatial distribution of grapevine suitability in Greece, derived from individual geomorphological and climatic maps (weights Table S15), it is possible to construct a composite map based on the distributions of both geomorphological and climatic parameters. For this reason, maps depicting the total geomorphological score (Figure 16) and the total climatic score (Figure 17) were produced.
As we see, a large part of Greece is scored with high values (4-5) when the low score is calculated across the country's mountainous areas. The climatic suitability score map indicates the most problematic areas as those with extremely cold and very hot local climates.
Table 1 presents the spatial coverage of each suitability score class resulting from the combined climatic conditions. We see that almost 68% of the country's surface has a score higher than 3.5. The climatologically unsuitable areas (zero values) cover 1.6%, while the medium-to-low suitability scores cover ~30.4%.
The combined final map may provide an overall assessment of the potential viticultural suitability over the area investigated. The mapping is obtained by summing the individual scores for each point in the individual maps, based on geomorphological parameters (slope, elevation, terrain roughness, vineyard aspect) and climatic indicators (temperature and precipitation indices). Since each index does not influence grapevine cultivation equally, some are more pivotal than others. For this reason, greater statistical weight was assigned to the most influential parameters/indicators (Slope, Elevation, WI, GST, VCD, FD), while parameters considered to have a moderate impact (Terrain roughness, aspect of vineyard, HI, HTC, CNI, GSP, HD, HP) on vine development were given lower statistical weights. This approach was implemented to enhance the overall model's accuracy.
The final map of viticultural suitability in Greece (Figure 18). Areas with at least one 0 score have not been considered, and in their place, there is no color, since they are unsuitable for grapevine cultivation. Low scores appear in the Pindus and Rhodope mountain ranges, in the foothills of the Olympus Mountain, and in the Central Peloponnese. On the other hand, high scores occur across the western part of the country, in Central Macedonia, Crete, central continental Greece, and some Aegean islands.
3.4. Focused Results and Evaluation of the Model
Figure 19 depicts a map showing only areas with high viticultural suitability (4.0-4.5). As such, only areas with a score higher than 4 were selected, identifying, thus, regions considered ideal for grapevine cultivation. This step was considered appropriate since it serves as a fundamental criterion for the subsequent analysis and evaluation of the exploited model's accuracy. As illustrated in Figure 19, areas exhibiting high viticultural suitability (score ≥ 4) are predominantly located in Western Greece, the Peloponnese, Southern Macedonia, and Southern Thrace, with additional suitable zones scattered across Central Continental Greece, selected regions of Crete, and several islands of the Aegean Sea (e.g., Santorini, Limnos).
Figure 20 depicts the mean final viticultural suitability per district to provide a helpful illustration for policymakers and stakeholders (farmers, agricultural companies, etc.). The high scores are found in the Ionian islands, the western Peloponnese, Crete, and Chalkidiki. We note that this is the mean score per district, excluding the non-suitable sites in each district.
To evaluate the accuracy of our model, we used the Corine Land Cover (CLC) dataset [99] released 2018 (time extent 2017-2018), which classifies land cover with relatively high accuracy. The spatial resolution of the dataset is 100m, and the minimum mapping unit is 25ha for real features and 100m width for linear features. It is clear that this dataset underestimates the number of vineyards. Nevertheless, it is the most reliable dataset we have currently to check our model. So, Figure 21 presents the meaning suitability per district, restricted to sites where the CLC was identified as vine.
Moreover, in Table 2, we present the percentage of the covered area (second row) per suitability class (first row), and the score coverage only over the CLC vine areas.
The above results indicate a false-negative rate of 1.5% due to the low resolution of the initial data. Also, as we see in the following map (Figure 22), the red dots (have been enlarged to become visible) indicate the positions where the model gave a zero (0) value, but the CLC dataset identified a vineyard.
Considering the position of that false-negative spatial error, we infer that it is due to assigning zero values in the geomorphological map. In contrast, in those places, there is a vine. This means we underestimated cultivation's ability to thrive on rough, anomalous ground. When establishing a vineyard, other factors such as rootstock, training system, and pruning must be considered. Thus, we will conduct in-situ and remote sensing investigations to fine-tune the next versions of the model.
Since there is no such suitability mapping work for Greece, we may compare our findings with past noteworthy, published articles. In general, collective evidence from the sources demonstrates that climate change is a shared reality across European viticulture. However, the magnitude and nature of its impacts exhibit significant regional heterogeneity when comparing broad European trends to the specific context of Greece [3,13,20,52]. Consistent with observations across France, Italy, Spain, and Germany, the Greek wine-growing regions have experienced a steady increase in growing season temperatures and heat accumulation indices such as the Huglin Index (HI) and Growing Degree-Days (GDD) [3,20,51]. This research highlights a critical convergence between historical suitability patterns in Greece and the escalating pressures of climate change. While this study establishes a baseline in which moderate to high viticultural suitability characterizes approximately 80% of Greek territory, the aforementioned research contextualizes this by detailing the rapid phenological and qualitative shifts already underway due to global warming.
The presented study, which relies on indices such as the Winkler Index (WI) and Huglin Index (HI) to categorize suitability, notes that Zone V (>2221°C) and HI+3 categories already encompass much of Greece. Previously published articles [53] provide evidence that these thermal indices have trended sharply upward; for instance, the Mean Growing Season Temperature (GST) in Greece increased by an average of 1.3°C between 1981 and 2010. A unique finding in the Greek context, compared to broad European trends, is the relationship between maximum (TX) and minimum (TN) temperatures [20]. While earlier data suggested minimum temperatures were increasing faster than maximums (+0.8°C higher rate), the most recent decade (2011–2019) suggests a potential turning point where TX has begun to increase at a higher rate, particularly during the ripening period [3,52,53].
The suitability map (and the related parameter and index maps) is a tool for policymakers and stakeholders to enhance viticultural sustainability. The macroeconomic data in the sources support this need, revealing that international trade impacts Greek wine production more than domestic consumption [37]. Given that Greek wine ranks ninth in Europe for production but has yet to reach its full export potential, the focus must shift toward branding these heat-tolerant indigenous varieties [37,52]. The sources conclude that while traditional regions like Santorini or Samos may eventually require mandatory irrigation or face abandonment, the rebirth of viticulture in cooler, mountainous terroirs offers a viable path forward for the industry [36,52].
4. Conclusions
- The application of a bioclimatic modeling framework provides valuable insights into adaptive viticultural practices, offering accurate, spatially explicit projections of future grape-growing potential under evolving climate conditions.
- The model and its structure are easy to understand for all stakeholders; thus the community can update and improve it quickly and effectively.
- The model is expandable, and we will add layers on soil structure and fertility, climatic risks, and pathogens in the next version.
- Overall, climatic and geomorphological suitability for grapevine cultivation is relatively high across most of Greece.
- Excluding areas omitted from the final model due to complete unsuitability (i.e., at least one parameter scored 0), approximately 80% of the Greek territory exhibits moderate suitability for hosting and cultivating grapevines (score 2.5–4). In contrast, the remaining 18% demonstrates high suitability (score ≥ 4).
- The model and the mapping material may be important tools for policymakers, agricultural insurance agencies, wine companies, and investors.
- The model's accuracy is high, as evidenced by its comparison with a reliable CLC dataset.
As anticipated, the research team will improve the model in future versions and feed it with future climate change data to assess the potential impact of climate change on Greek viticulture. Moreover, the following steps include further dissemination of the method and its results, as well as the creation of an online platform to share the results interactively.
Supplementary Materials
The following supporting information can be downloaded at the website of this paper posted on Preprints.org, Figure S1. The locations and names of Greece. The mountains are denoted as mt.; Figure S2. Slope map of Greece.; Figure S3. Altitude range map of Greece.; Figure S4. Figure S5. Aspect map of Greece.; Roughness map of Greece.; Table S1. Classification of terrain slope values in Greece; Table S2. Classification of altitude values in Greece.; Table S3. Classification of roughness values in Greece.; Table S4. Classification of aspect values in Greece.; Table S5. Classification of Winkler index values in Greece.; Table S6. Classification of Hugln index values in Greece.; Table S7. Classification of Hydrothermal coefficient values in Greece.; Table S8. Classification of annual mean temperature values in Greece.; Table S9. Classification of Cool night index (CNI) values in Greece.; Table S10. Classification of Growing precipitation index (GSP) values in Greece. Table S11. Classification of the average number of hot days (> 35 °C) in Greece. Table S12. Classification of heatwave in Greece. Table S13. Classification of the average number of very cold days (< -5°C) in Greece.; Table S14. Classification of average number of frost days (< 0 °C) in Greece.; Table S15. The weight of the model’s input parameters.
Author Contributions
For research articles with several authors, a short paragraph specifying their individual contributions must be provided. The following statements should be used "Conceptualization, I.C.; methodology, I.C and N.K; software, N.K and I.C.; validation, F.D. and K.B.; formal analysis, N.K. and I.C.; investigation, N.K. and I.C.; resources, X.X.; writing—original draft preparation, N.K and F.D.; writing—review and editing, F.D., N.K., K.B. and I.C; visualization, N.K and I.C..; supervision, I.C. All authors have read and agreed to the published version of the manuscript.
Funding
This research received no external funding.
Institutional Review Board Statement
Not applicable.
Informed Consent Statement
Not applicable.
Data Availability Statement
The original contributions presented in this study are included in the article/Supplementary Materials. Further inquiries can be directed at the corresponding author.
Conflicts of Interest
The authors declare no conflicts of interest.
References
- Abbass, K.; Qasim, M.Z.; Song, H.; Murshed, M.; Mahmood, H.; Younis, I. A Review of the Global Climate Change Impacts, Adaptation, and Sustainable Mitigation Measures. Environ Sci Pollut Res 2022, 29, 42539–42559. [Google Scholar] [CrossRef]
- Brooks, N.; Grist, N.; Brown, K. Development Futures in the Context of Climate Change: Challenging the Present and Learning from the Past. Development Policy Review 2009, 27, 741–765. [Google Scholar] [CrossRef]
- Droulia, F.; Charalampopoulos, I. A Review on the Observed Climate Change in Europe and Its Impacts on Viticulture. Atmosphere 2022, 13, 837. [Google Scholar] [CrossRef]
- Pachauri, R.K.; Allen, M.R.; Barros, V.R.; Broome, J.; Cramer, W.; Christ, R.; Church, J.A.; Clarke, L.; Dahe, Q.; Dasgupta, P. Climate Change 2014: Synthesis Report. Contribution of Working Groups I, II and III to the Fifth Assessment Report of the Intergovernmental Panel on Climate Change; IPCC, 2014; ISBN 92-9169-143-7. [Google Scholar]
- Alrteimei, H.A.; Ash’aari, Z.H.; Muharram, F.M. Last Decade Assessment of the Impacts of Regional Climate Change on Crop Yield Variations in the Mediterranean Region. Agriculture 2022, 12, 1787. [Google Scholar] [CrossRef]
- Kostopoulou, E.; Jones, P.D. Assessment of Climate Extremes in the Eastern Mediterranean. Meteorol. Atmos. Phys. 2005, 89, 69–85. [Google Scholar] [CrossRef]
- Lazoglou, G.; Papadopoulos-Zachos, A.; Georgiades, P.; Zittis, G.; Velikou, K.; Manios, E.M.; Anagnostopoulou, C. Identification of Climate Change Hotspots in the Mediterranean. Sci Rep 2024, 14, 29817. [Google Scholar] [CrossRef] [PubMed]
- Zampieri, M.; Toreti, A.; Ceglar, A.; Naumann, G.; Turco, M.; Tebaldi, C. Climate Resilience of the Top Ten Wheat Producers in the Mediterranean and the Middle East. Reg Environ Change 2020, 20, 41. [Google Scholar] [CrossRef]
- Guo, H.; Xia, Y.; Jin, J.; Pan, C. The Impact of Climate Change on the Efficiency of Agricultural Production in the World’s Main Agricultural Regions. Environmental Impact Assessment Review 2022, 97, 106891. [Google Scholar] [CrossRef]
- Habib-ur-Rahman, M.; Ahmad, A.; Raza, A.; Hasnain, M.U.; Alharby, H.F.; Alzahrani, Y.M.; Bamagoos, A.A.; Hakeem, K.R.; Ahmad, S.; Nasim, W.; et al. Impact of Climate Change on Agricultural Production; Issues, Challenges, and Opportunities in Asia. Front. Plant Sci. 2022, 13. [Google Scholar] [CrossRef]
- Mall, R.K.; Gupta, A.; Sonkar, G. Effect of Climate Change on Agricultural Crops. In Current developments in biotechnology and bioengineering; Elsevier, 2017; pp. 23–46. [Google Scholar]
- Camps, J.O.; Ramos, M.C. Grape Harvest and Yield Responses to Inter-Annual Changes in Temperature and Precipitation in an Area of North-East Spain with a Mediterranean Climate. Int. J. Biometeorol 2012, 56, 853–864. [Google Scholar] [CrossRef]
- Droulia, F.; Charalampopoulos, I. Future Climate Change Impacts on European Viticulture: A Review on Recent Scientific Advances. Atmosphere 2021, 12, 495. [Google Scholar] [CrossRef]
- Laget, F.; Tondut, J.-L.; Deloire, A.; Kelly, M.T. Climate Trends in a Specific Mediterranean Viticultural Area between 1950 and 2006. J. Int. Sci. Vigne Vin 2008, 42, 113–123. [Google Scholar] [CrossRef]
- Iglesias, A.; Garrote, L.; Quiroga, S.; Moneo, M. A Regional Comparison of the Effects of Climate Change on Agricultural Crops in Europe. Climatic Change 2012, 112, 29–46. [Google Scholar] [CrossRef]
- Malhi, G.S.; Kaur, M.; Kaushik, P. Impact of Climate Change on Agriculture and Its Mitigation Strategies: A Review. Sustainability 2021, 13, 1318. [Google Scholar] [CrossRef]
- Wang, J.; Vanga, S.K.; Saxena, R.; Orsat, V.; Raghavan, V. Effect of Climate Change on the Yield of Cereal Crops: A Review. Climate 2018, 6, 41. [Google Scholar] [CrossRef]
- Anastasiou, E.; Templalexis, C.; Lentzou, D.; Biniari, K.; Xanthopoulos, G.; Fountas, S. Do Soil and Climatic Parameters Affect Yield and Quality on Table Grapes? Smart Agricultural Technology 2023, 3, 100088. [Google Scholar] [CrossRef]
- Daskalakis, I.; Biniari, K. A New Measurement Model to Estimate the Intensity of Acrotony on the Latent Buds of Grapevine Canes (Vitis Vinifera L.). Notulae Botanicae Horti Agrobotanici Cluj-Napoca 2019, 47, 1001–1004. [Google Scholar] [CrossRef]
- Jones, G.; Duchêne, E.; Tomasi, D.; Yuste, J.; Braslavska, O.; Schultz, H.; Martinez, C.; Boso, S.; Langellier, F.; Perruchot, C. Changes in European Winegrape Phenology and Relationships with Climate. 2005. [Google Scholar]
- Baltazar, M.; Castro, I.; Gonçalves, B. Adaptation to Climate Change in Viticulture: The Role of Varietal Selection—A Review. Plants 2025, 14, 104. [Google Scholar] [CrossRef]
- Duchêne, E.; Huard, F.; Dumas, V.; Schneider, C.; Merdinoglu, D. The Challenge of Adapting Grapevine Varieties to Climate Change. Clim. Res 2010, 41, 193–204. [Google Scholar] [CrossRef]
- Fraga, H.; Malheiro, A.C.; Moutinho-Pereira, J.; Santos, J.A. An Overview of Climate Change Impacts on European Viticulture. Food Energy Secur. 2012, 1, 94–110. [Google Scholar] [CrossRef]
- Schultz, H.R.; Stoll, M. Some Critical Issues in Environmental Physiology of Grapevines: Future Challenges and Current Limitations. Aust. J. Grape Wine Res 2010, 16, 4–24. [Google Scholar] [CrossRef]
- Urhausen, S.; Brienen, S.; Kapala, A.; Simmer, C. Climatic Conditions and Their Impact on Viticulture in the Upper Moselle Region. Clim Change 2011. [Google Scholar] [CrossRef]
- Piña-Rey, A.; González-Fernández, E.; Fernández-González, M.; Lorenzo, M.N.; Rodríguez-Rajo, F.J. Climate Change Impacts Assessment on Wine-Growing Bioclimatic Transition Areas. Agriculture 2020, 10, 605. [Google Scholar] [CrossRef]
- Christensen, J.H.; Christensen, O.B. A Summary of the PRUDENCE Model Projections of Changes in European Climate by the End of This Century. Climatic Change 2007, 81, 7–30. [Google Scholar] [CrossRef]
- Guiot, J.; Bernigaud, N.; Bondeau, A.; Bouby, L.; Cramer, W. Viticulture Extension in Response to Global Climate Change Drivers – Lessons from the Past and Future Projections. Climate of the Past 2023, 19, 1219–1244. [Google Scholar] [CrossRef]
- Irimia, L.M.; Patriche, C.V.; Petitjean, T.; Tissot, C.; Santesteban, L.G.; Neethling, E.; Foss, C.; Le Roux, R.; Quénol, H. Structural and Spatial Shifts in the Viticulture Potential of Main European Wine Regions as an Effect of Climate Change. Horticulturae 2024, 10, 413. [Google Scholar] [CrossRef]
- Adão, F.; Campos, J.C.; Santos, J.A.; Malheiro, A.C.; Fraga, H. Relocation of Bioclimatic Suitability of Portuguese Grapevine Varieties under Climate Change Scenarios. Frontiers in Plant Science 2023, 14. [Google Scholar] [CrossRef]
- Sgubin, G.; Swingedouw, D.; Mignot, J.; Gambetta, G.A.; Bois, B.; Loukos, H.; Noël, T.; Pieri, P.; García de Cortázar-Atauri, I.; Ollat, N.; et al. Non-Linear Loss of Suitable Wine Regions over Europe in Response to Increasing Global Warming. Glob. Chang. Biol. 2023, 29, 808–826. [Google Scholar] [CrossRef]
- Santos, J.A.; Fraga, H.; Malheiro, A.C.; Moutinho-Pereira, J.; Dinis, L.-T.; Correia, C.; Moriondo, M.; Leolini, L.; Dibari, C.; Costafreda-Aumedes, S.; et al. A Review of the Potential Climate Change Impacts and Adaptation Options for European Viticulture. Applied Sciences 2020, 10, 3092. [Google Scholar] [CrossRef]
- Alikadic, A.; Pertot, I.; Eccel, E.; Dolci, C.; Zarbo, C.; Caffarra, A.; De Filippi, R.; Furlanello, C. The Impact of Climate Change on Grapevine Phenology and the Influence of Altitude: A Regional Study. Agricultural and Forest Meteorology 2019, 271, 73–82. [Google Scholar] [CrossRef]
- Vigl, L.E.; Schmid, A.; Moser, F.; Balotti, A.; Gartner, E.; Katz, H.; Quendler, S.; Ventura, S.; Raifer, B. Upward Shifts in Elevation – a Winning Strategy for Mountain Viticulture in the Context of Climate Change? E3S Web Conf. 2018, 50, 02006. [Google Scholar] [CrossRef]
- Karagiannis, D.; Metaxas, T. Sustainable Wine Tourism Development: Case Studies from the Greek Region of Peloponnese. Sustainability 2020, 12, 5223. [Google Scholar] [CrossRef]
- Lazoglou, G.; Anagnostopoulou, C.; Koundouras, S. Climate Change Projections for Greek Viticulture as Simulated by a Regional Climate Model. Theoretical and Applied Climatology 2018, 133, 551–567. [Google Scholar] [CrossRef]
- Vlachos, V.A. A Macroeconomic Estimation of Wine Production in Greece. Wine Economics and Policy 2017, 6, 3–13. [Google Scholar] [CrossRef]
- Ruck, C. Entheogens in Ancient Times: Wine and the Rituals of Dionysus. In Toxicology in Antiquity; Academic Press, 2019; pp. 343–352. [Google Scholar]
- Pagnoux, C.; Bouby, L.; Valamoti, S.M.; Bonhomme, V.; Ivorra, S.; Gkatzogia, E.; Karathanou, A.; Kotsachristou, D.; Kroll, H.; Terral, J.-F. Local Domestication or Diffusion? Insights into Viticulture in Greece from Neolithic to Archaic Times, Using Geometric Morphometric Analyses of Archaeological Grape Seeds. Journal of Archaeological Science 2021, 125, 105263. [Google Scholar] [CrossRef]
- Valamoti, S.M.; Pagnoux, C.; Ntinou, M.; Bouby, L.; Bonhomme, V.; Terral, J.-F. More than Meets the Eye: New Archaeobotanical Evidence on Bronze Age Viticulture and Wine Making in the Peloponnese, Greece. Veget Hist Archaeobot 2020, 29, 35–50. [Google Scholar] [CrossRef]
- Pagnoux, C.; Bouby, L.; Valamoti, S.M.; Bonhomme, V.; Ivorra, S.; Gkatzogia, E.; Karathanou, A.; Kotsachristou, D.; Kroll, H.; Terral, J.-F. Local Domestication or Diffusion? Insights into Viticulture in Greece from Neolithic to Archaic Times, Using Geometric Morphometric Analyses of Archaeological Grape Seeds. Journal of Archaeological Science 2021, 125, 105263. [Google Scholar] [CrossRef]
- Ruck, C.A. Entheogens in Ancient Times: Wine and the Rituals of Dionysus. In Toxicology in antiquity; Elsevier, 2019; pp. 343–352. [Google Scholar]
- Valamoti, S.M.; Pagnoux, C.; Ntinou, M.; Bouby, L.; Bonhomme, V.; Terral, J.-F. More than Meets the Eye: New Archaeobotanical Evidence on Bronze Age Viticulture and Wine Making in the Peloponnese, Greece. Veget Hist Archaeobot 2020, 29, 35–50. [Google Scholar] [CrossRef]
- Kontaxakis, E.; Lydakis, D.; Fisarakis, I. Enhancing Red Table Grape Coloration Using Tsikoudia: A Novel and Sustainable Approach. Plants 2024, 13, 2689. [Google Scholar] [CrossRef]
- Vasilopoulou, E.; Trichopoulou, A. Greek Raisins: A Traditional Nutritious Delicacy. Journal of Berry Research 2014, 4, 117–125. [Google Scholar] [CrossRef]
- Xyrafis, E.G.; Gambetta, G.A.; Biniari, K. A Comparative Study on Training Systems and Vine Density in Santorini Island: Physiological, Microclimate, Yield and Quality Attributes. OENO One 2023, 57, 141–152. [Google Scholar] [CrossRef]
- Anastasiou, E.; Templalexis, C.; Lentzou, D.; Biniari, K.; Xanthopoulos, G.; Fountas, S. Do Soil and Climatic Parameters Affect Yield and Quality on Table Grapes? Smart Agricultural Technology 2023, 3, 100088. [Google Scholar] [CrossRef]
- Koufos, G.; Mavromatis, T.; Koundouras, S.; Fyllas, N.M.; Jones, G.V. Viticulture–Climate Relationships in Greece: The Impacts of Recent Climate Trends on Harvest Date Variation. International Journal of Climatology 2014, 34, 1445–1459. [Google Scholar] [CrossRef]
- Koufos, G.; Mavromatis, T.; Koundouras, S.; Fyllas, N.M. Viticulture: Climate Relationships in Greece and Impacts of Recent Climate Trends: Sensitivity to “Effective” Growing Season Definitions. In Proceedings of the Advances in Meteorology, Climatology and Atmospheric Physics; Helmis, C.G., Nastos, P.T., Eds.; Springer: Berlin, Heidelberg, 2013; pp. 555–561. [Google Scholar]
- Koufos, G.C.; Mavromatis, T.; Koundouras, S.; Fyllas, N.M.; Theocharis, S.; Jones, G.V. Greek Wine Quality Assessment and Relationships with Climate: Trends, Future Projections and Uncertainties. Water 2022, 14, 573. [Google Scholar] [CrossRef]
- Koufos, G.; Mavromatis, T.; Koundouras, S.; Fyllas, N.M.; Jones, G.V. Viticulture-Climate Relationships in Greece: The Impacts of Recent Climate Trends on Harvest Date Variation. International Journal of Climatology 2014, 34, 1445–1459. [Google Scholar] [CrossRef]
- Koufos, G.C.; Mavromatis, T.; Koundouras, S.; Fyllas, N.M.; Theocharis, S.; Jones, G.V. Greek Wine Quality Assessment and Relationships with Climate: Trends, Future Projections and Uncertainties. Water 2022, 14, 573. [Google Scholar] [CrossRef]
- Koufos, G.C.; Mavromatis, T.; Koundouras, S.; Jones, G.V. Response of Viticulture-Related Climatic Indices and Zoning to Historical and Future Climate Conditions in Greece. International Journal of Climatology 2018, 38, 2097–2111. [Google Scholar] [CrossRef]
- Alsafadi, K.; Mohammed, S.; Habib, H.; Kiwan, S.; Hennawi, S.; Sharaf, M. An Integration of Bioclimatic, Soil, and Topographic Indicators for Viticulture Suitability Using Multi-Criteria Evaluation: A Case Study in the Western Slopes of Jabal Al Arab—Syria. Geocarto International 2020, 35, 1466–1488. [Google Scholar] [CrossRef]
- Keller, M. Managing Grapevines to Optimise Fruit Development in a Challenging Environment: A Climate Change Primer for Viticulturists. Aust. J. Grape Wine Res 2010, 16, 56–69. [Google Scholar] [CrossRef]
- Sánchez, Y.; Martínez-Graña, A.M.; Santos-Francés, F.; Yenes, M. Index for the Calculation of Future Wine Areas According to Climate Change Application to the Protected Designation of Origin “Sierra de Salamanca” (Spain). Ecol. Indic. 2019, 107, 105646. [Google Scholar] [CrossRef]
- Nesbitt, A.; Dorling, S.; Lovett, A. A Suitability Model for Viticulture in England and Wales: Opportunities for Investment, Sector Growth and Increased Climate Resilience. Journal of Land Use Science 2018, 13, 414–438. [Google Scholar] [CrossRef]
- Polidori, L.; El Hage, M. Digital Elevation Model Quality Assessment Methods: A Critical Review. Remote Sensing 2020, 12, 3522. [Google Scholar] [CrossRef]
- Townsend, C.G. Viticulture and the Role of Geomorphology: General Principles and Case Studies. Geography Compass 2011, 5, 750–766. [Google Scholar] [CrossRef]
- Pichon, L.; Ducanchez, A.; Fonta, H.; Tisseyre, B. Quality of Digital Elevation Models Obtained from Unmanned Aerial Vehicles for Precision Viticulture. OENO One 2016, 50. [Google Scholar] [CrossRef]
- Badr, G.; Hoogenboom, G.; Moyer, M.; Keller, M.; Rupp, R.; Davenport, J. Spatial Suitability Assessment for Vineyard Site Selection Based on Fuzzy Logic. Precision Agric 2018, 19, 1027–1048. [Google Scholar] [CrossRef]
- Wanyama, D.; Bunting, E.L.; Goodwin, R.; Weil, N.; Sabbatini, P.; Andresen, J.A. Modeling Land Suitability for Vitis Vinifera in Michigan Using Advanced Geospatial Data and Methods. Atmosphere 2020, 11, 339. [Google Scholar] [CrossRef]
- Strack, T.; Schmidt, D.; Stoll, M. Impact of Steep Slope Management System and Row Orientation on Canopy Microclimate. Comparing Terraces to Downslope Vineyards. Agricultural and Forest Meteorology 2021, 307, 108515. [Google Scholar] [CrossRef]
- Irimia, L.M.; Patriche, C.V.; Roșca, B. Climate Change Impact on Climate Suitability for Wine Production in Romania. Theor Appl Climatol 2018, 133, 1–14. [Google Scholar] [CrossRef]
- Townsend, C.G. Viticulture and the Role of Geomorphology: General Principles and Case Studies. Geography Compass 2011, 5, 750–766. [Google Scholar] [CrossRef]
- Alfieri, J.G.; Kustas, W.P.; Nieto, H.; Prueger, J.H.; Hipps, L.E.; McKee, L.G.; Gao, F.; Los, S. Influence of Wind Direction on the Surface Roughness of Vineyards. Irrig Sci 2019, 37, 359–373. [Google Scholar] [CrossRef]
- Darboux, F.; Davy, Ph.; Gascuel-Odoux, C.; Huang, C. Evolution of Soil Surface Roughness and Flowpath Connectivity in Overland Flow Experiments. CATENA 2002, 46, 125–139. [Google Scholar] [CrossRef]
- Matranga, G.; Palazzi, F.; Leanza, A.; Milella, A.; Reina, G.; Cavallo, E.; Biddoccu, M. Estimating Soil Surface Roughness by Proximal Sensing for Soil Erosion Modeling Implementation at Field Scale. Environmental Research 2023, 238, 117191. [Google Scholar] [CrossRef]
- Hijmans, R.J.; van Etten, J.; Sumner, M.; Cheng, J.; Baston, D.; Bevan, A.; Bivand, R.; Busetto, L.; Canty, M.; Fasoli, B.; et al. Raster: Geographic Data Analysis and Modeling. Available online: https://CRAN.R-project.org/package=raster (accessed on 7 July 2022).
- Alganci, U.; Kuru, G.N.; Yay Algan, I.; Sertel, E. Vineyard Site Suitability Analysis by Use of Multicriteria Approach Applied on Geo-Spatial Data. Geocarto International 2019, 34, 1286–1299. [Google Scholar] [CrossRef]
- Nowlin, J.W.; Bunch, R.L.; Jones, G.V. Viticultural Site Selection: Testing the Effectiveness of North Carolina’s Commercial Vineyards. Applied Geography 2019, 106, 22–39. [Google Scholar] [CrossRef]
- Nowlin, J.W.; Bunch, R.L.; Jones, G.V. Viticultural Site Selection: Testing the Effectiveness of North Carolina’s Commercial Vineyards. Applied Geography 2019, 106, 22–39. [Google Scholar] [CrossRef]
- Van Leeuwen, C.; Seguin, G. The Concept of Terroir in Viticulture. Journal of Wine Research 2006, 17, 1–10. [Google Scholar] [CrossRef]
- Dimitri, G.M.; Trambusti, A. Precision Agriculture for Wine Production: A Machine Learning Approach to Link Weather Conditions and Wine Quality. Heliyon 2024, 10, e31648. [Google Scholar] [CrossRef]
- Lorenzo, M.N.; Taboada, J.J.; Lorenzo, J.F.; Ramos, A.M. Influence of Climate on Grape Production and Wine Quality in the Rías Baixas, North-Western Spain. Reg. Environ. Change 2013, 13, 887–896. [Google Scholar] [CrossRef]
- Crupi, P.; Alba, V.; Gentilesco, G.; Gasparro, M.; Ferrara, G.; Mazzeo, A.; Coletta, A. Viticultural Climate Indexes and Their Role in The Prediction of Anthocyanins and Other Flavonoids Content in Seedless Table Grapes. Horticulturae 2024, 10, 28. [Google Scholar] [CrossRef]
- Tonietto, J.; Carbonneau, A. A Multicriteria Climatic Classification System for Grape-Growing Regions Worldwide. Agric. For. Meteorol 2004, 124, 81–97. [Google Scholar] [CrossRef]
- Vyshkvarkova, E.; Rybalko, E.; Marchukova, O.; Baranova, N. Assessment of the Current and Projected Conditions of Water Availability in the Sevastopol Region for Grape Growing. Agronomy 2021, 11, 1665. [Google Scholar] [CrossRef]
- Venios, X.; Korkas, E.; Nisiotou, A.; Banilas, G. Grapevine Responses to Heat Stress and Global Warming. Plants 2020, 9, 1754. [Google Scholar] [CrossRef] [PubMed]
- Ferrandino, A.; Lovisolo, C. Abiotic Stress Effects on Grapevine (Vitis Vinifera L.): Focus on Abscisic Acid-Mediated Consequences on Secondary Metabolism and Berry Quality. Environmental and Experimental Botany 2014, 103, 138–147. [Google Scholar] [CrossRef]
- Poni, S.; Sabbatini, P.; Palliotti, A. Facing Spring Frost Damage in Grapevine: Recent Developments and the Role of Delayed Winter Pruning – A Review. Am J Enol Vitic. 2022, 73, 211–226. [Google Scholar] [CrossRef]
- Gorelick, N.; Hancher, M.; Dixon, M.; Ilyushchenko, S.; Thau, D.; Moore, R. Google Earth Engine: Planetary-Scale Geospatial Analysis for Everyone. Remote Sensing of Environment 2017, 202, 18–27. [Google Scholar] [CrossRef]
- Gomis-Cebolla, J.; Rattayova, V.; Salazar-Galán, S.; Francés, F. Evaluation of ERA5 and ERA5-Land Reanalysis Precipitation Datasets over Spain (1951–2020). Atmospheric Research 2023, 284, 106606. [Google Scholar] [CrossRef]
- Muñoz-Sabater, J.; Dutra, E.; Agustí-Panareda, A.; Albergel, C.; Arduini, G.; Balsamo, G.; Boussetta, S.; Choulga, M.; Harrigan, S.; Hersbach, H.; et al. ERA5-Land: A State-of-the-Art Global Reanalysis Dataset for Land Applications. Earth System Science Data 2021, 13, 4349–4383. [Google Scholar] [CrossRef]
- Yilmaz, M. Accuracy Assessment of Temperature Trends from ERA5 and ERA5-Land. Science of The Total Environment 2023, 856, 159182. [Google Scholar] [CrossRef]
- Garcia-Prats, A.; Carricondo-Antón, J.M.; Ippolito, M.; De Caro, D.; Jiménez-Bello, M.A.; Manzano-Juárez, J.; Pulido-Velazquez, M. High-Resolution Spatially Interpolated FAO Penman-Monteith Crop Reference Evapotranspiration Maps of Sicily Island (Italy) and Jucar River System (Spain) Using AgERA5 and ERA5-Land Reanalysis Datasets. Journal of Hydrology: Regional Studies 2025, 60, 102531. [Google Scholar] [CrossRef]
- Gourgouletis, N.; Gkavrou, M.; Baltas, E. Comparison of Empirical ETo Relationships with ERA5-Land and In Situ Data in Greece. Geographies 2023, 3, 499–521. [Google Scholar] [CrossRef]
- Ouassanouan, Y.; Simonneaux, V.; Kharrou, M.H.; Fakir, Y.; Baba, M.W.; Hssaine, B.A.; Hachimi, C.E.; Sourp, L.; Chehbouni, A. Downscaled ERA5 Land Addresses Agrometeorological Data Scarcity in North African Basins. Sci Rep 2025, 15, 38533. [Google Scholar] [CrossRef]
- Vanella, D.; Longo-Minnolo, G.; Belfiore, O.R.; Ramírez-Cuesta, J.M.; Pappalardo, S.; Consoli, S.; D’Urso, G.; Chirico, G.B.; Coppola, A.; Comegna, A.; et al. Comparing the Use of ERA5 Reanalysis Dataset and Ground-Based Agrometeorological Data under Different Climates and Topography in Italy. Journal of Hydrology: Regional Studies 2022, 42, 101182. [Google Scholar] [CrossRef]
- R Core Team R: A Language and Environment for Statistical Computing. Available online: https://www.R-project.org (accessed on 5 June 2025).
- Charalampopoulos, I. The R Language as a Tool for Biometeorological Research. Atmosphere 2020, 11, 682. [Google Scholar] [CrossRef]
- Guimarães, N.; Vehkalahti, K.; Campos, P.; Engel, J. Exploring Climate Change Data with R. In Statistics for Empowerment and Social Engagement: Teaching Civic Statistics to Develop Informed Citizens; Ridgway, J., Ed.; Springer International Publishing: Cham, 2022; pp. 267–296. ISBN 978-3-031-20748-8. [Google Scholar]
- Hijmans, R.J.; Bivand, R.; Forner, K.; Ooms, J.; Pebesma, E.; Sumner, M.D. Terra: Spatial Data Analysis. Available online: https://CRAN.R-project.org/package=terra (accessed on 7 July 2022).
- Pebesma, E. Simple Features for R: Standardized Support for Spatial Vector Data (accessed on 5 January 2026).
- Wickham, H. The Tidyverse. Available online: https://www.tidyverse.org/ (accessed on 15 April 2023).
- Charalampopoulos, I.; Droulia, F.; Mavridi, A.; Roussos, P.A. Mapping the Climatic Suitability for Olive Groves in Greece. Agronomy 2025, 15, 2604. [Google Scholar] [CrossRef]
- Xiao, F.; Yang, Z.Q.; Lee, K.W. Photosynthetic and Physiological Responses to High Temperature in Grapevine (Vitis Vinifera L.) Leaves during the Seedling Stage. The Journal of Horticultural Science and Biotechnology 2017, 92, 2–10. [Google Scholar] [CrossRef]
- Bernardo, S.; Dinis, L.-T.; Machado, N.; Moutinho-Pereira, J. Grapevine Abiotic Stress Assessment and Search for Sustainable Adaptation Strategies in Mediterranean-like Climates. A Review. Agron. Sustain. Dev. 2018, 38, 66. [Google Scholar] [CrossRef]
- Büttner, G. CORINE Land Cover and Land Cover Change Products. In Land Use and Land Cover Mapping in Europe; Remote Sensing and Digital Image Processing; Manakos, I., Braun, M., Eds.; Springer Netherlands, 2014; pp. 55–74. ISBN 978-94-007-7968-6. [Google Scholar]
Figure 1.
Flowchart depicting the data analysis methodology for determining the viticultural suitability based on specific geomorphological and climatic parameters.
Figure 1.
Flowchart depicting the data analysis methodology for determining the viticultural suitability based on specific geomorphological and climatic parameters.
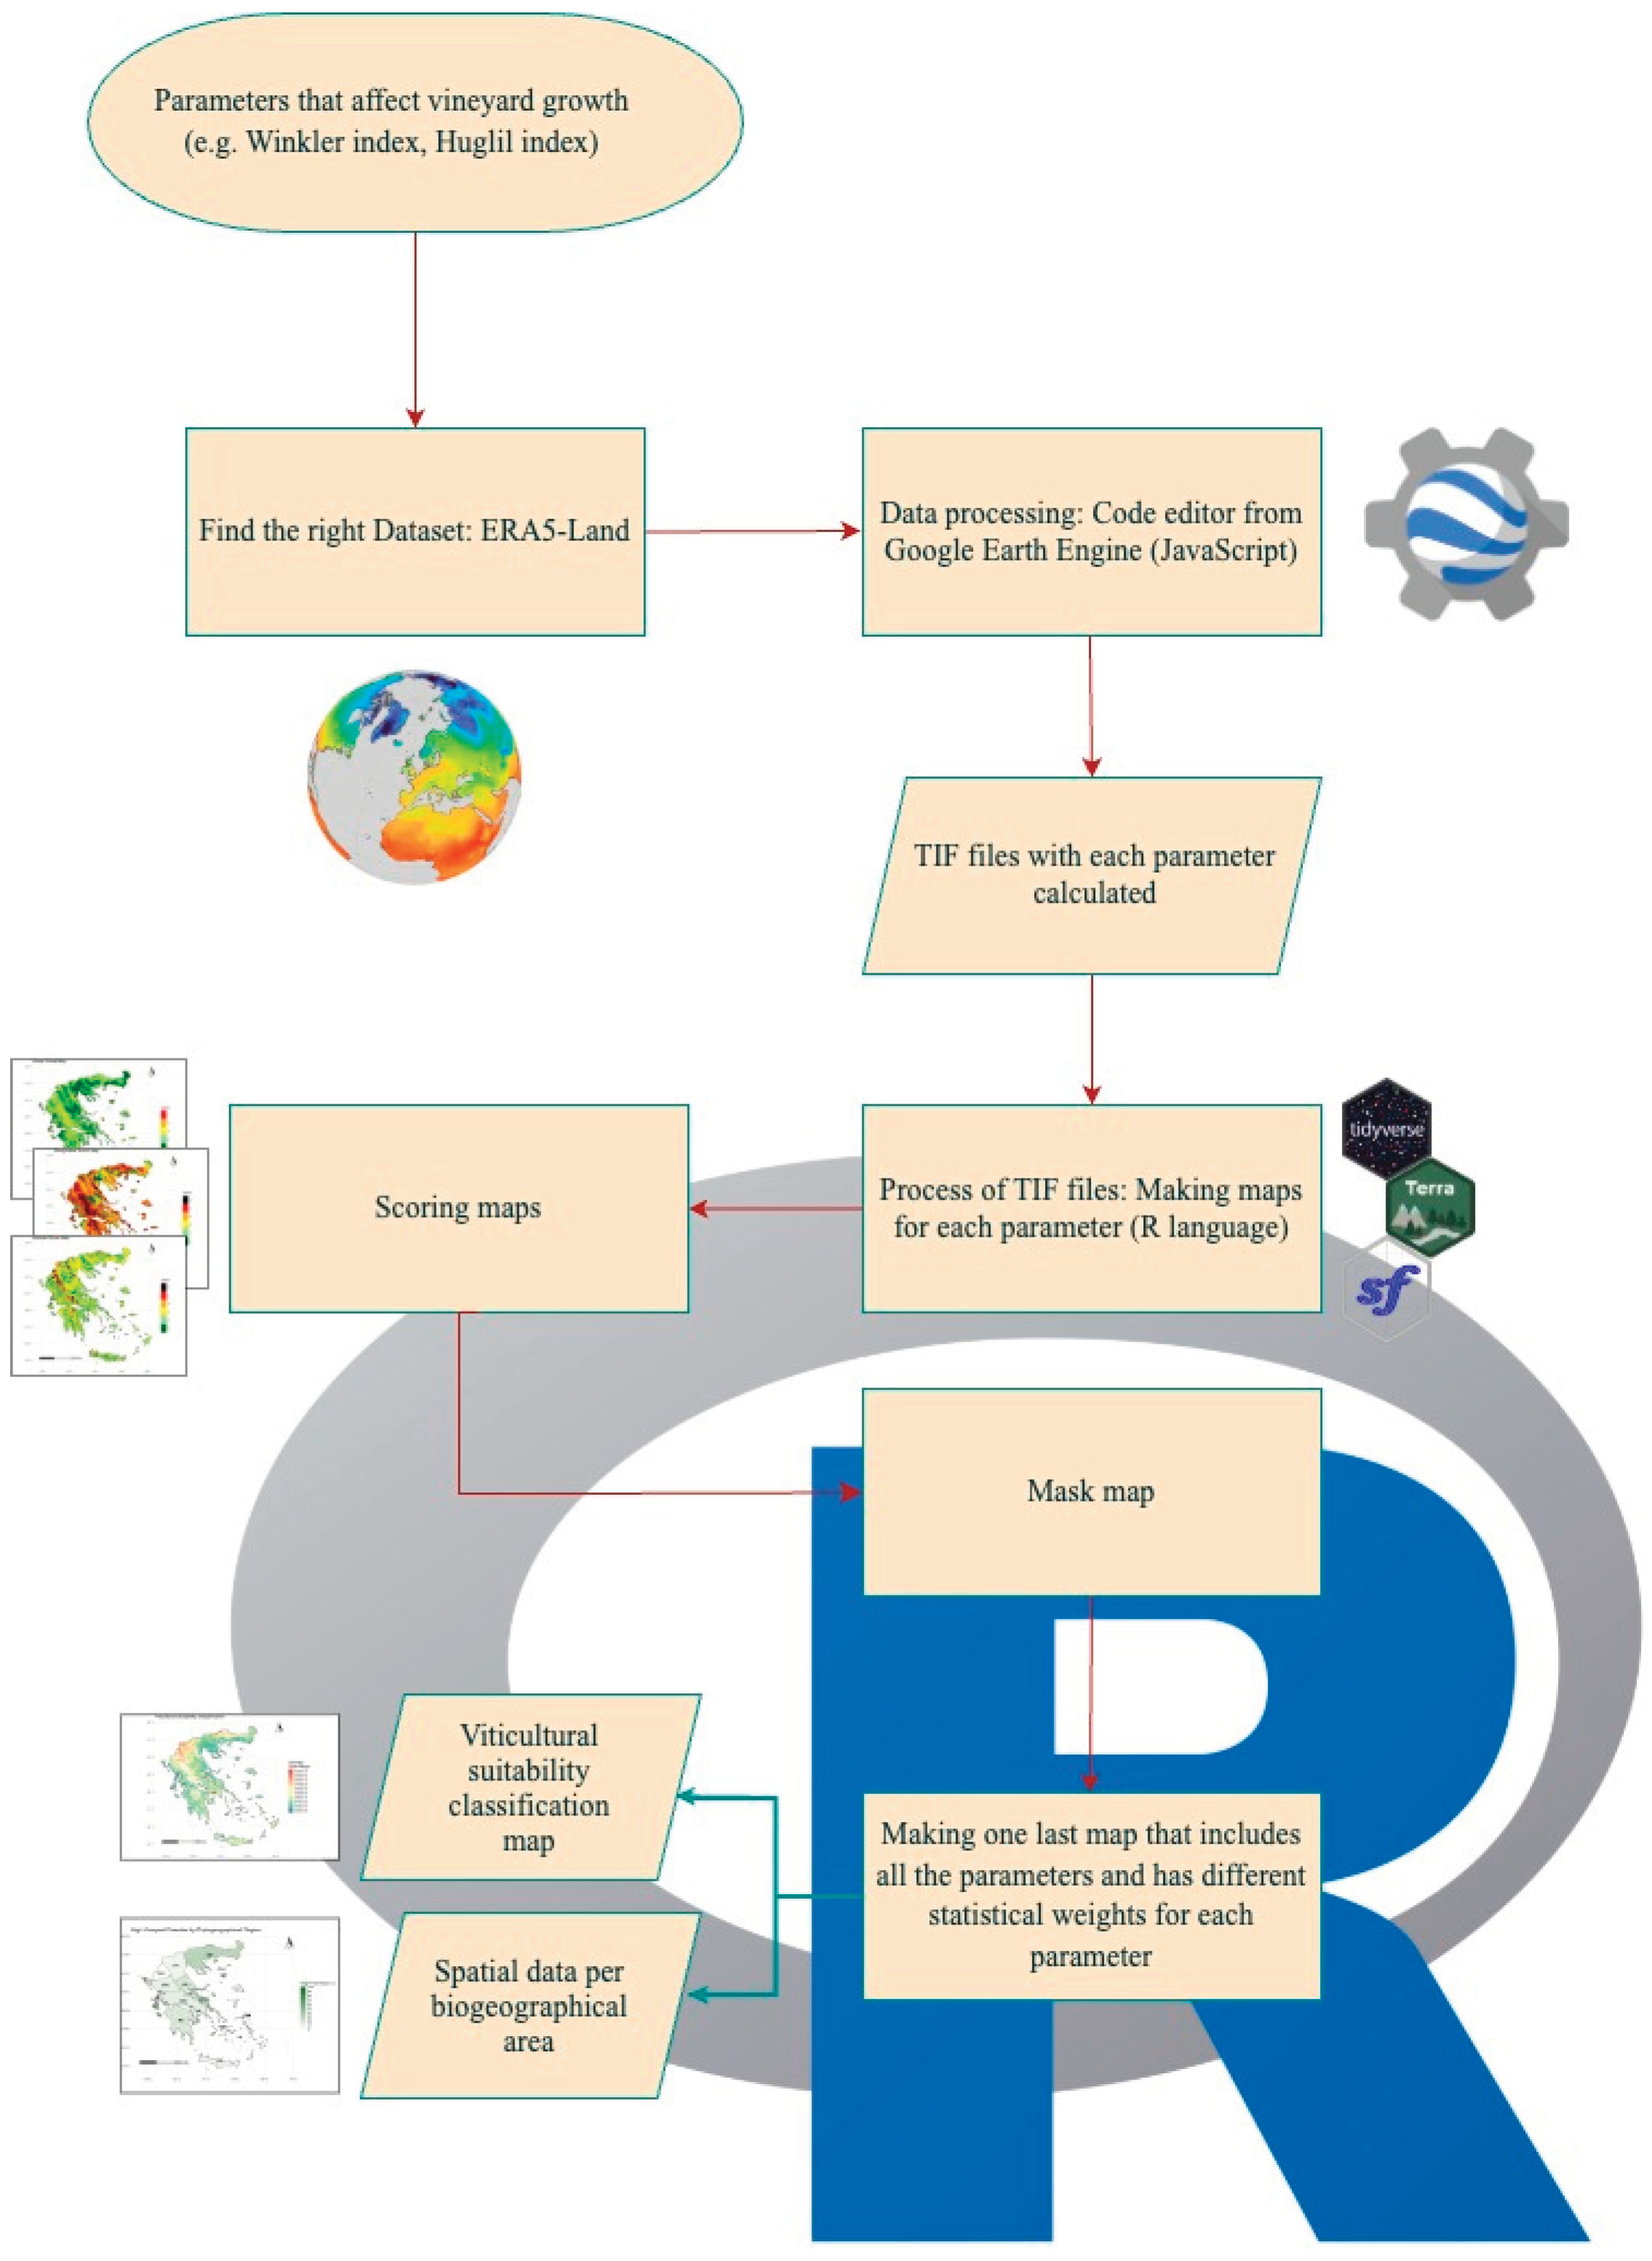
Figure 2.
Slope score map for grapevine cultivation in Greece.
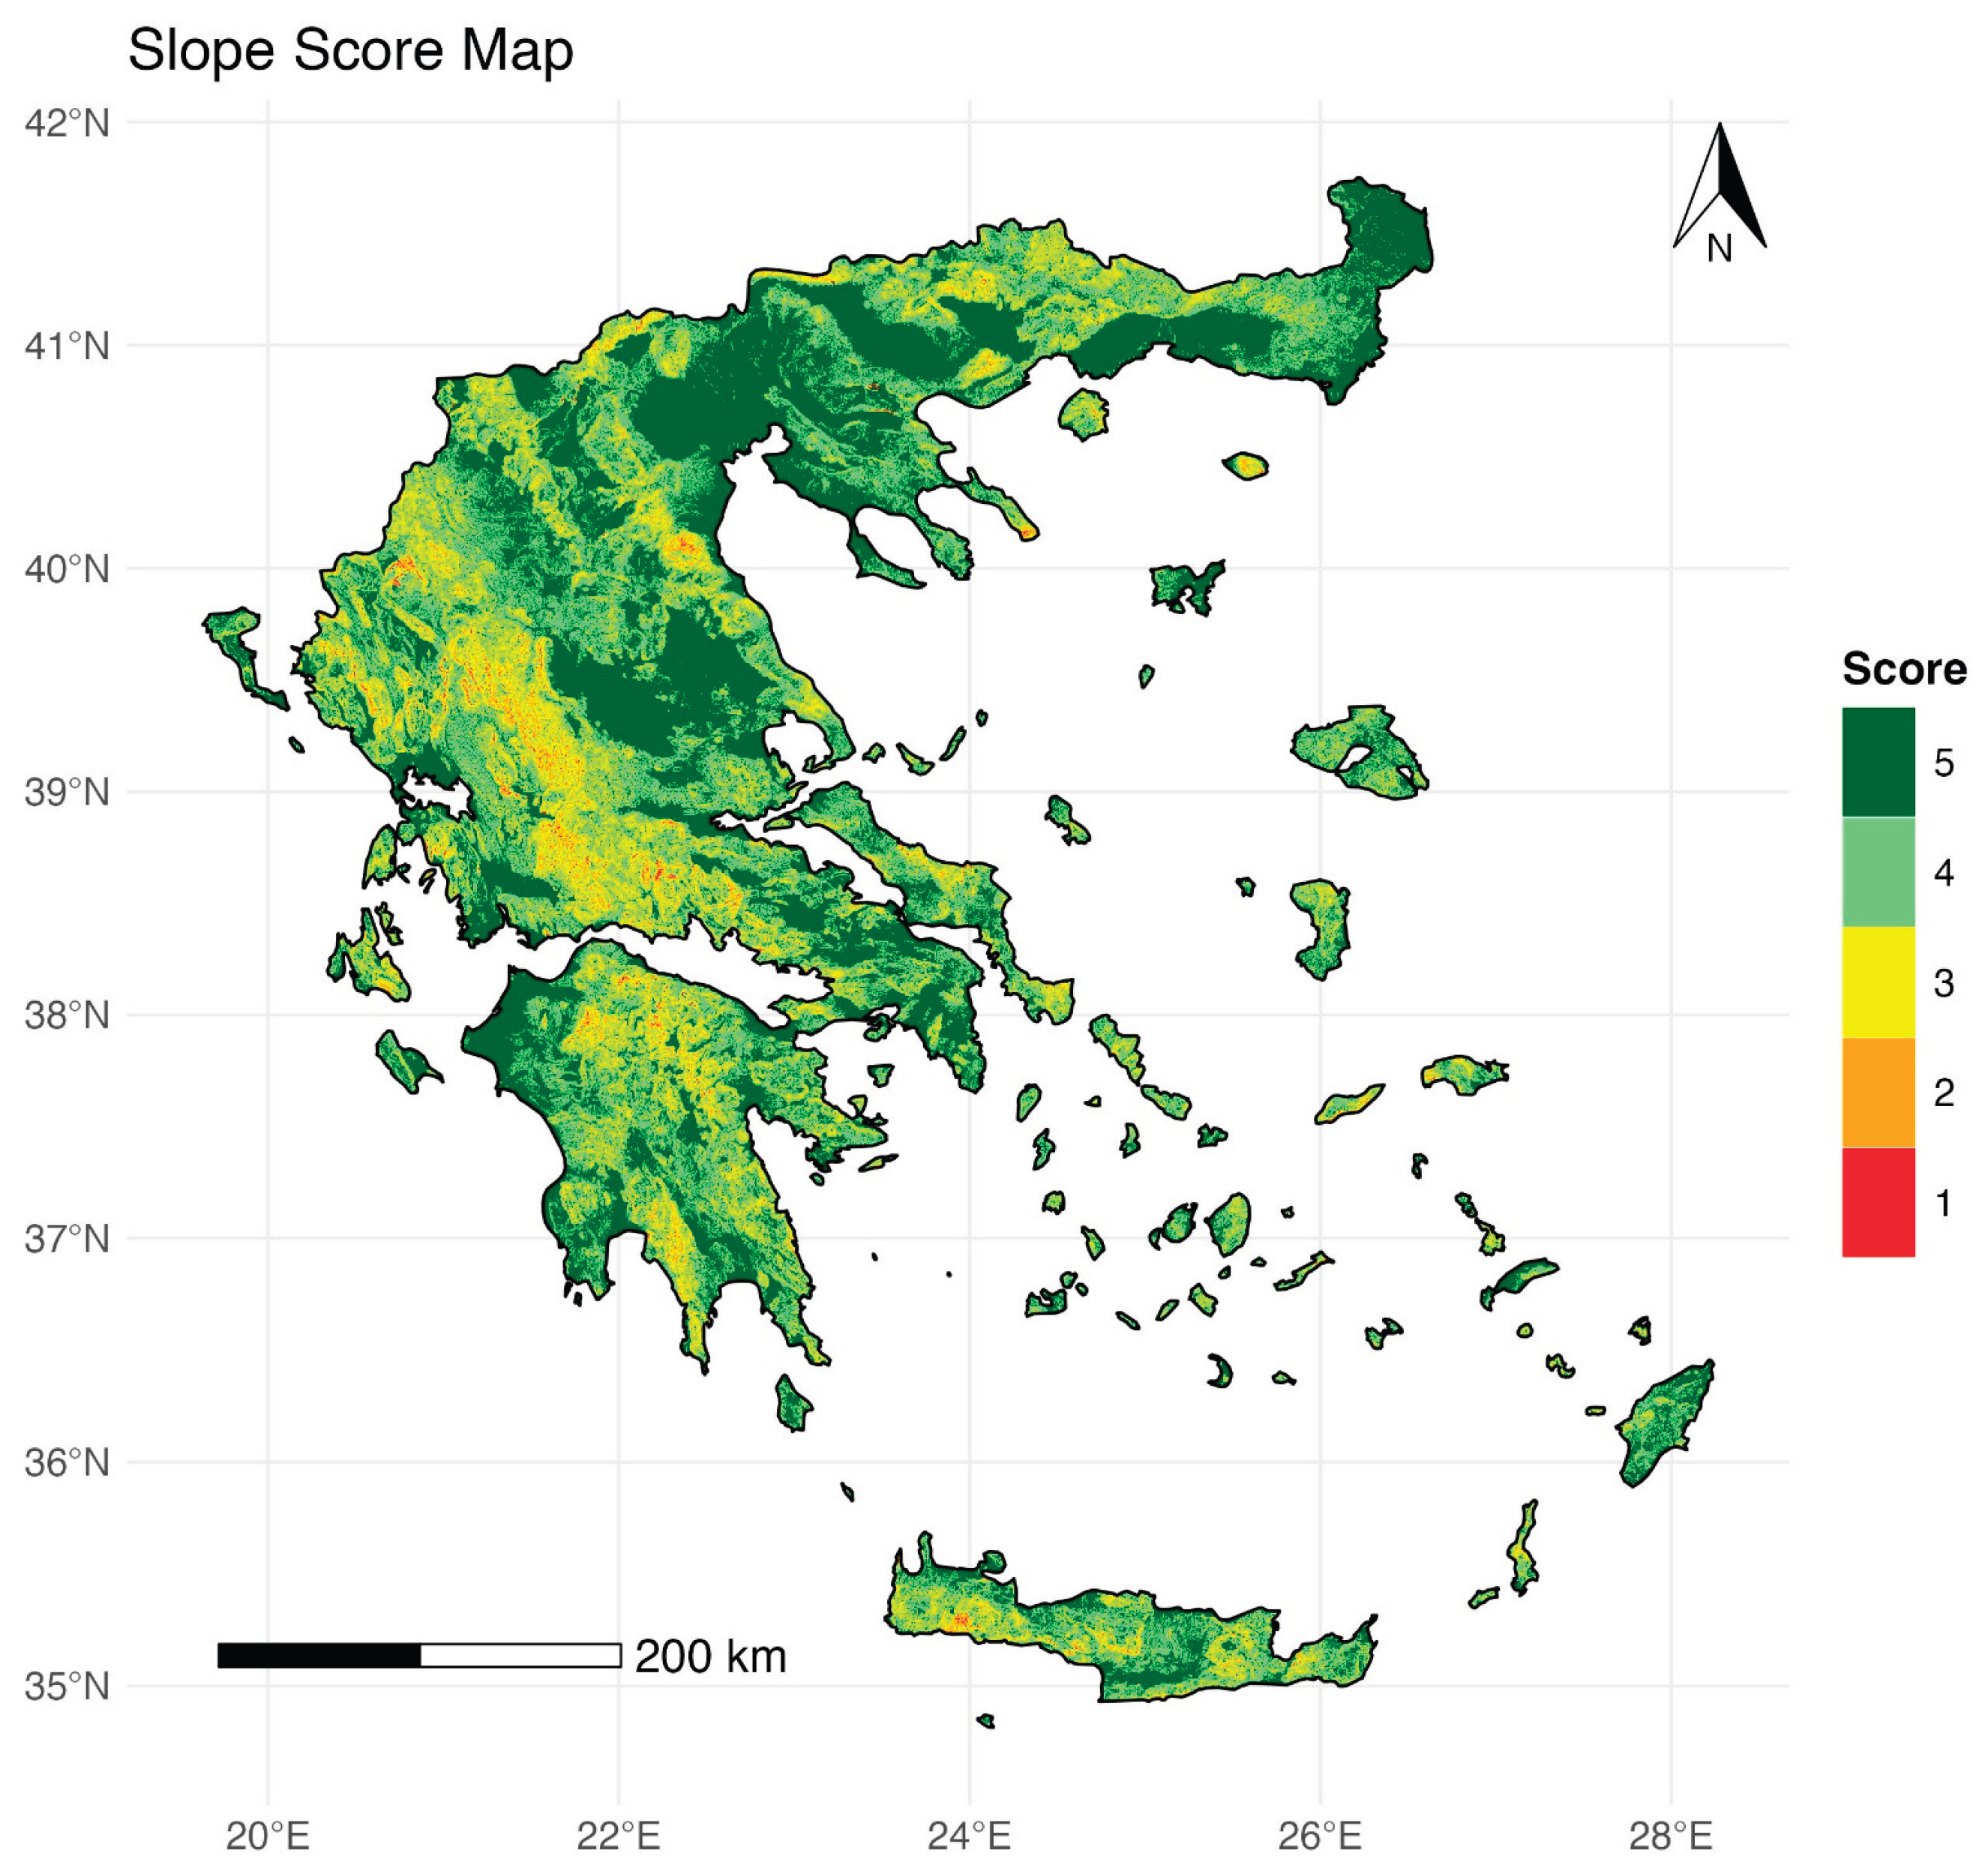
Figure 3.
Elevation score map for grapevine cultivation in Greece.
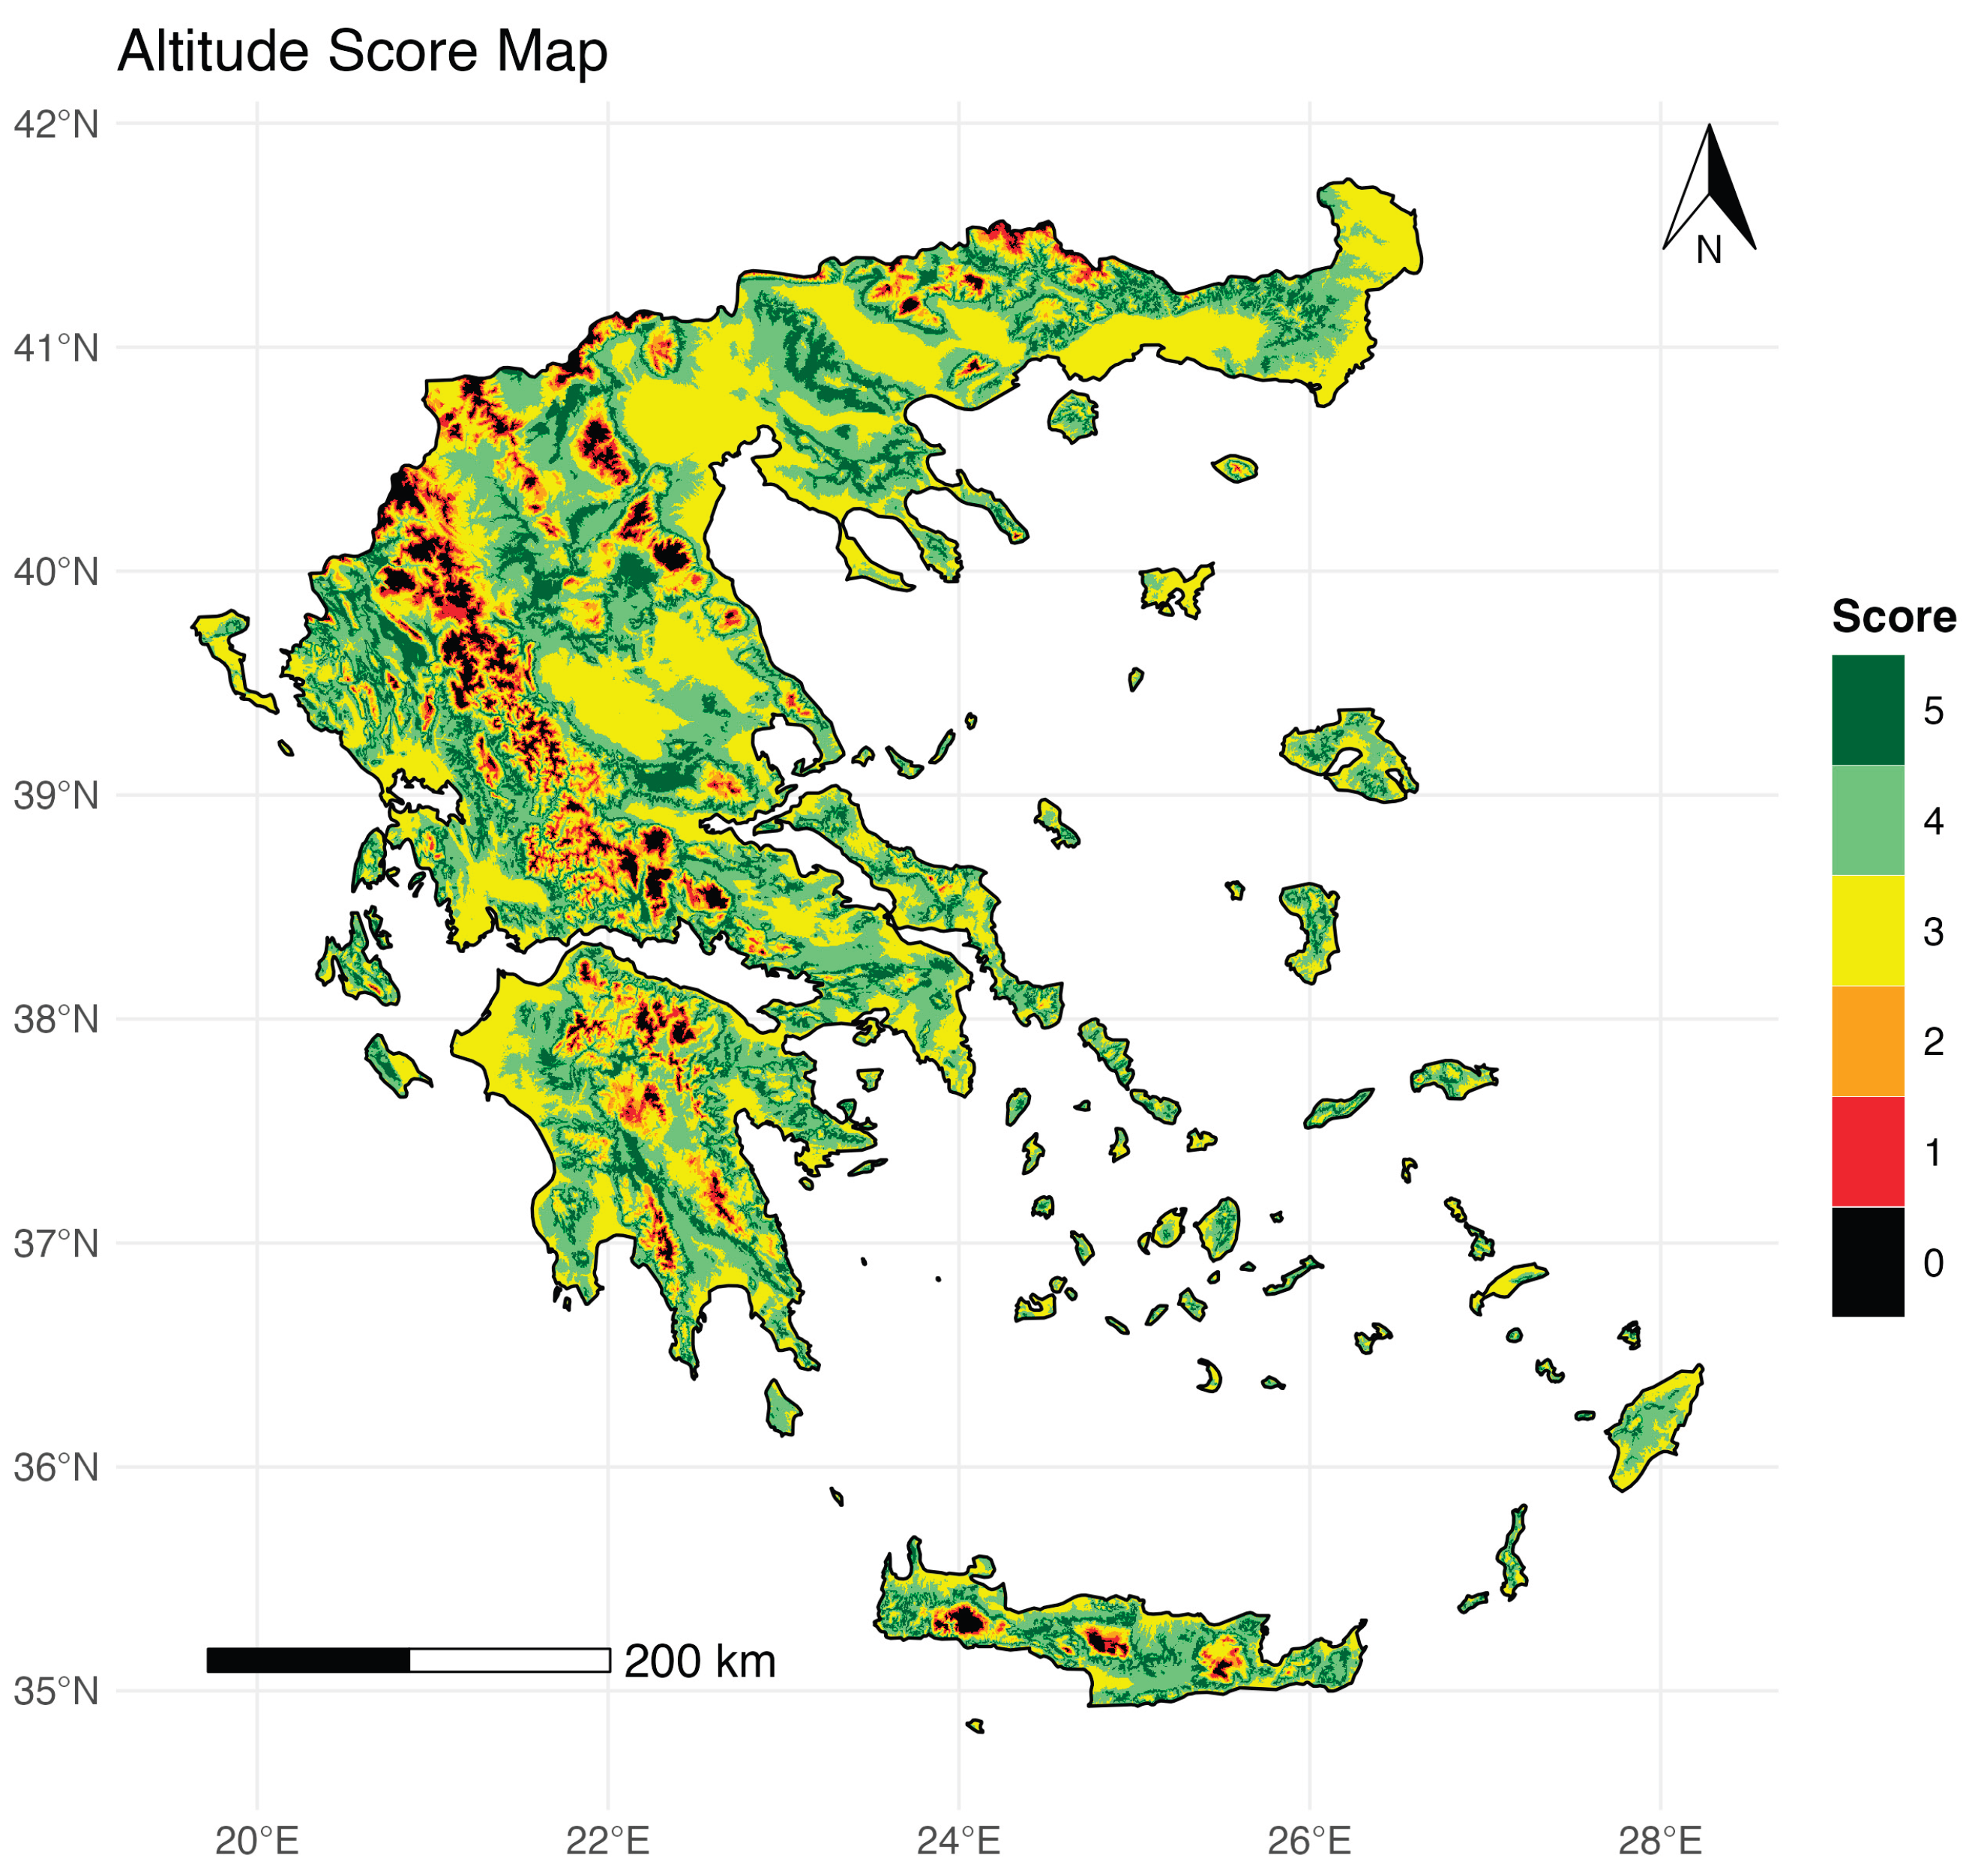
Figure 4.
Τerrain roughness score map for grapevine cultivation in Greece.
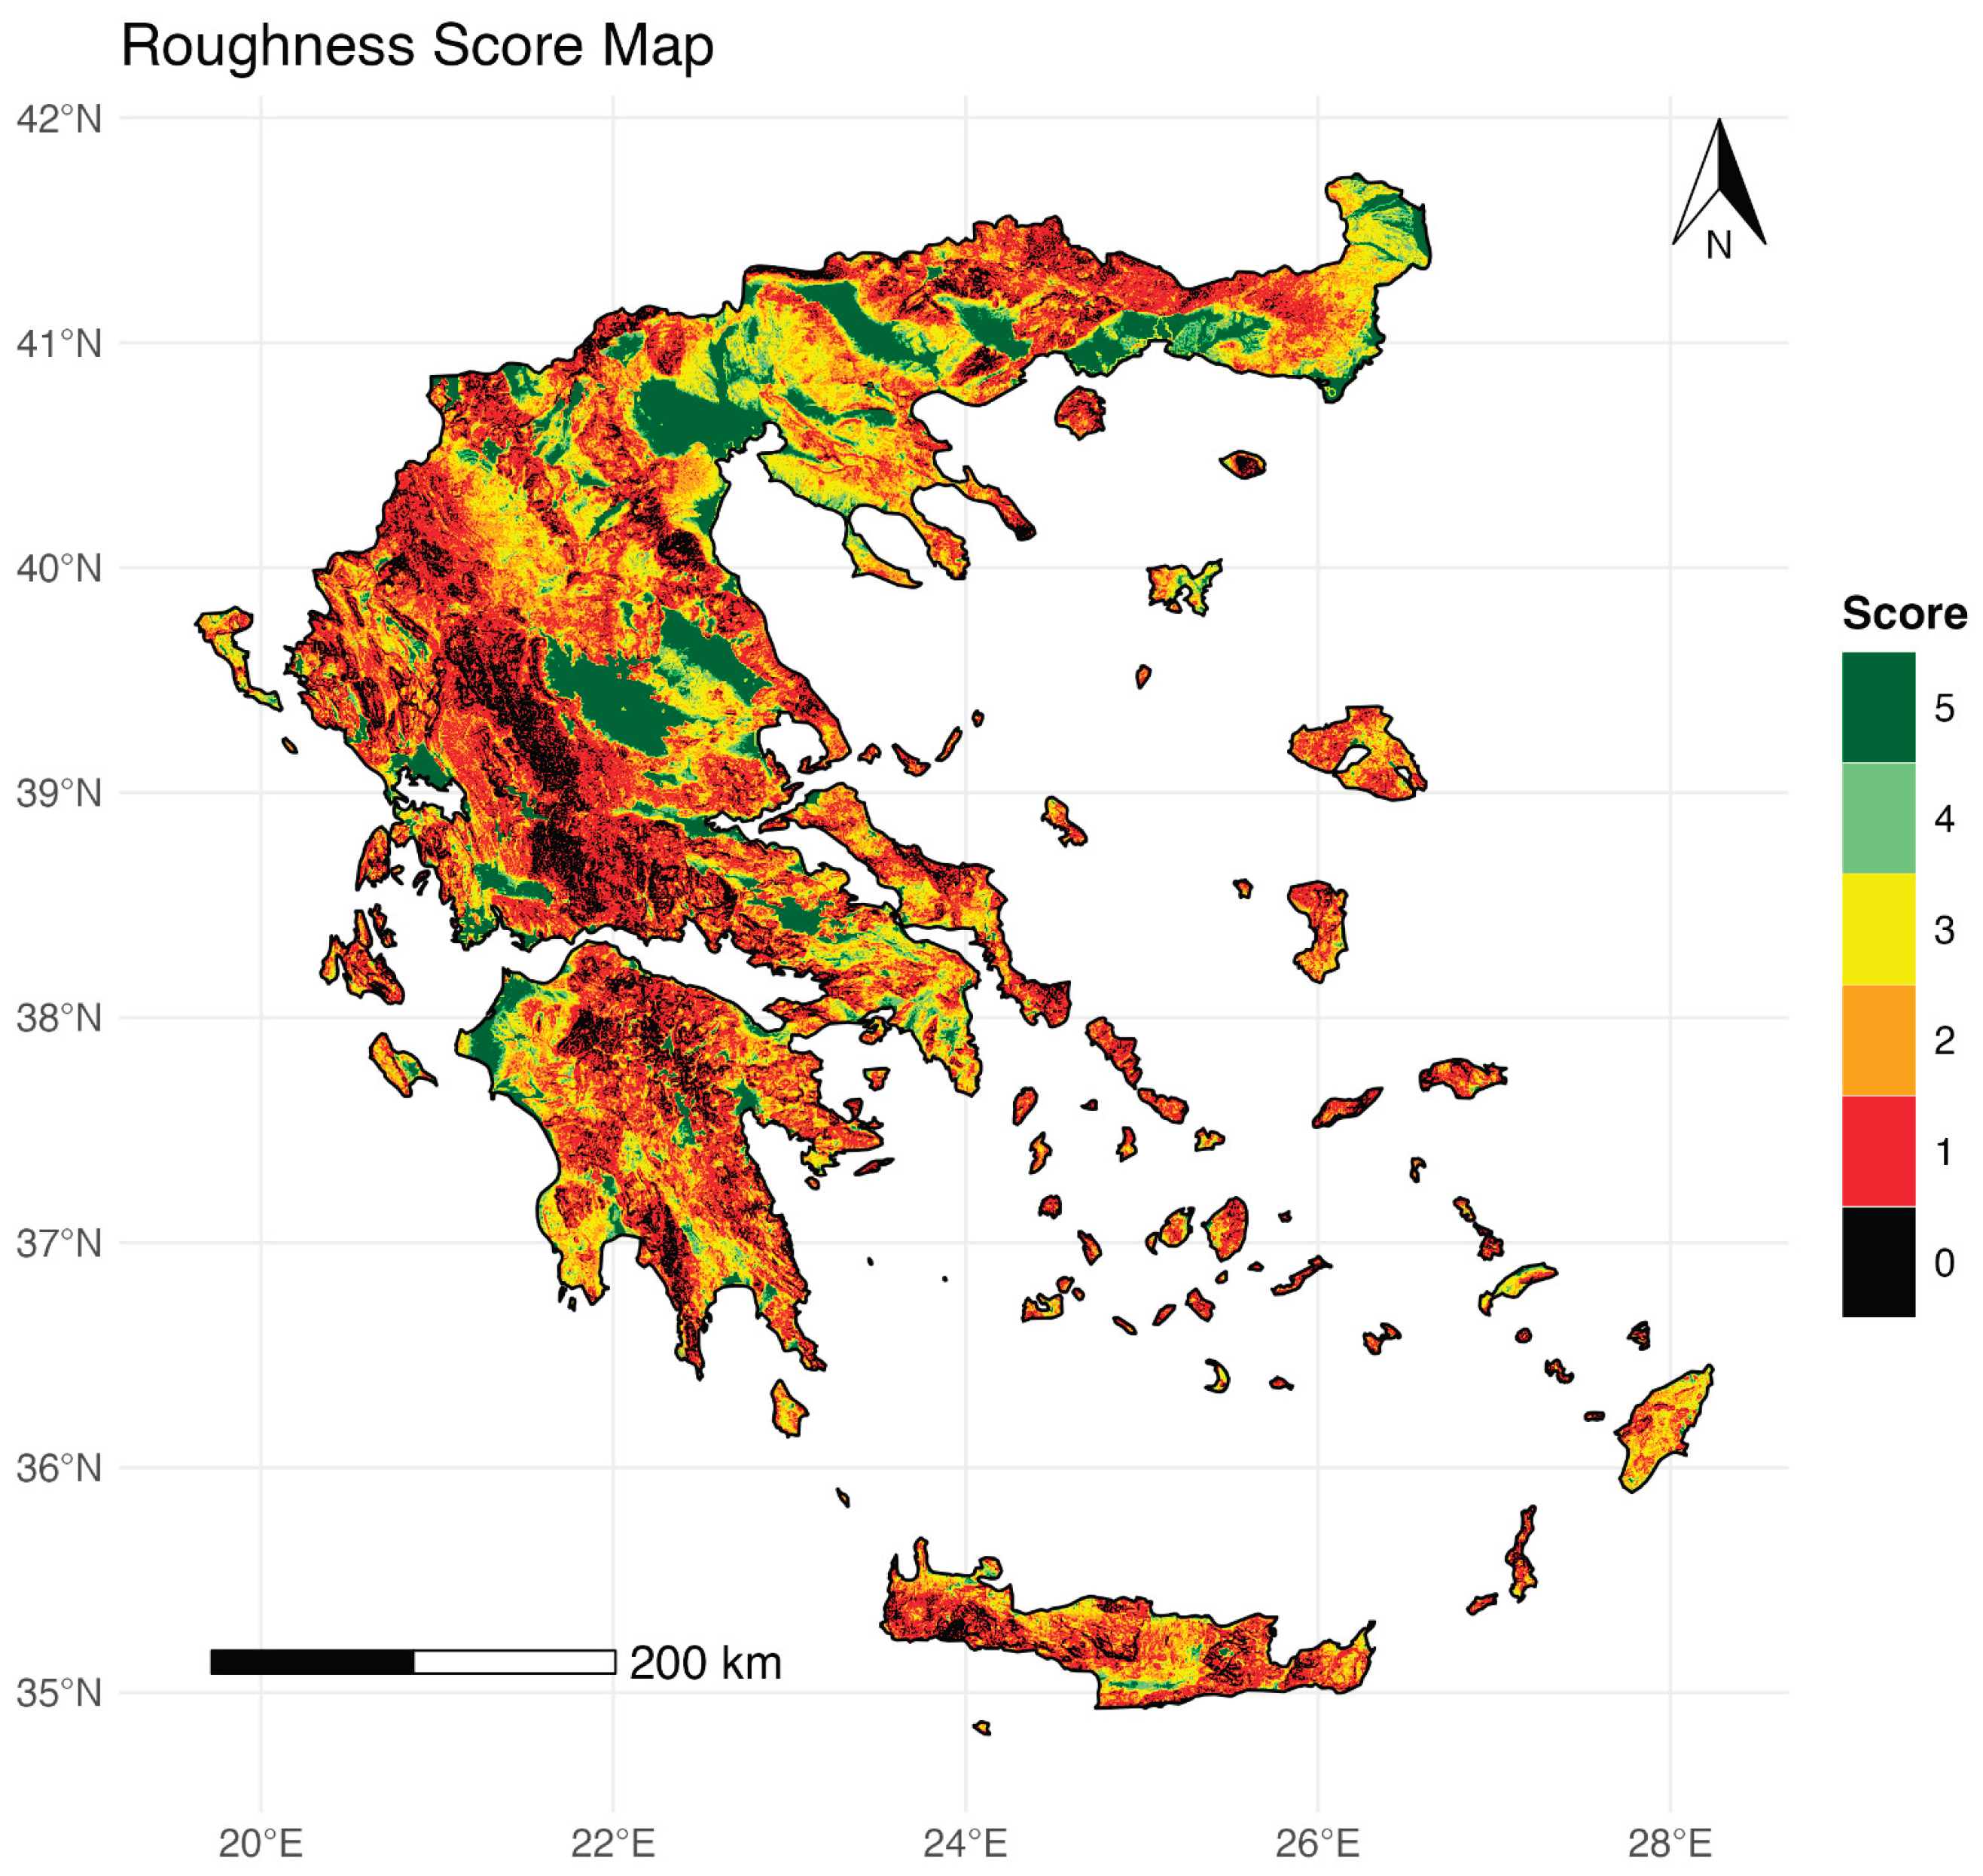
Figure 5.
Aspect score map range for grapevine cultivation in Greece.
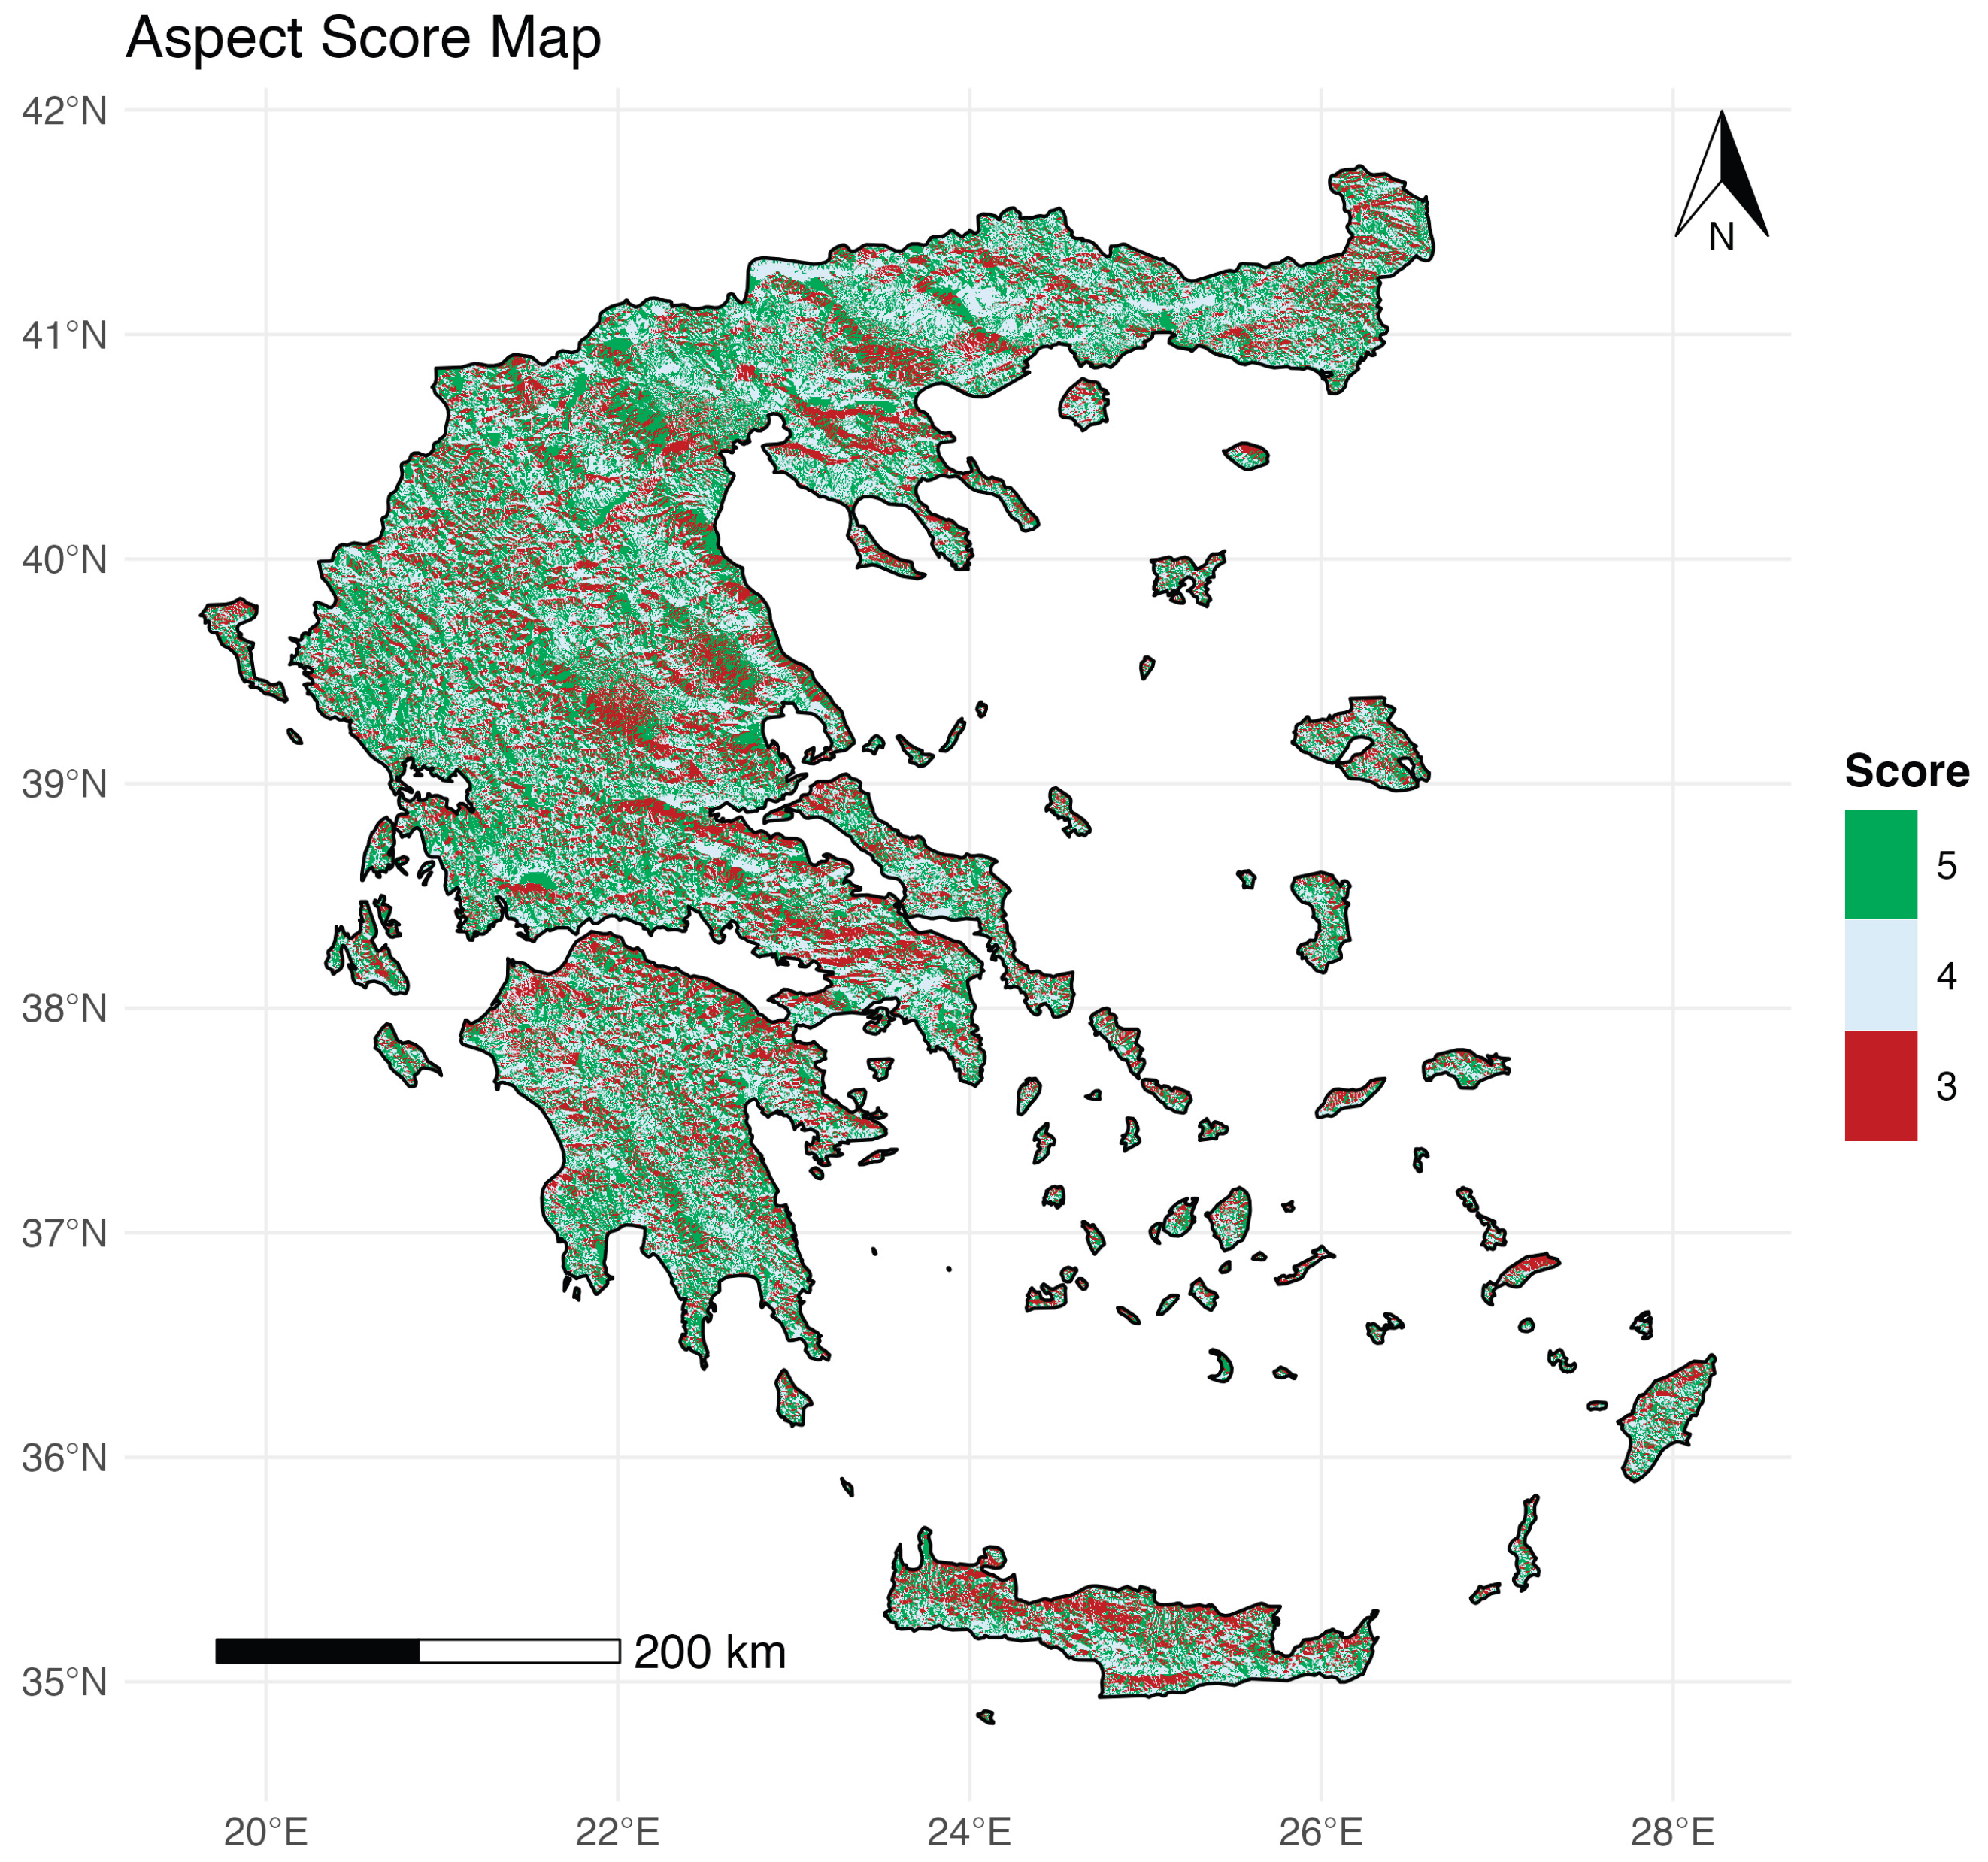
Figure 6.
Winkler Index distribution map (a) and score map (b) for the reference period (1970 – 2000).
Figure 6.
Winkler Index distribution map (a) and score map (b) for the reference period (1970 – 2000).
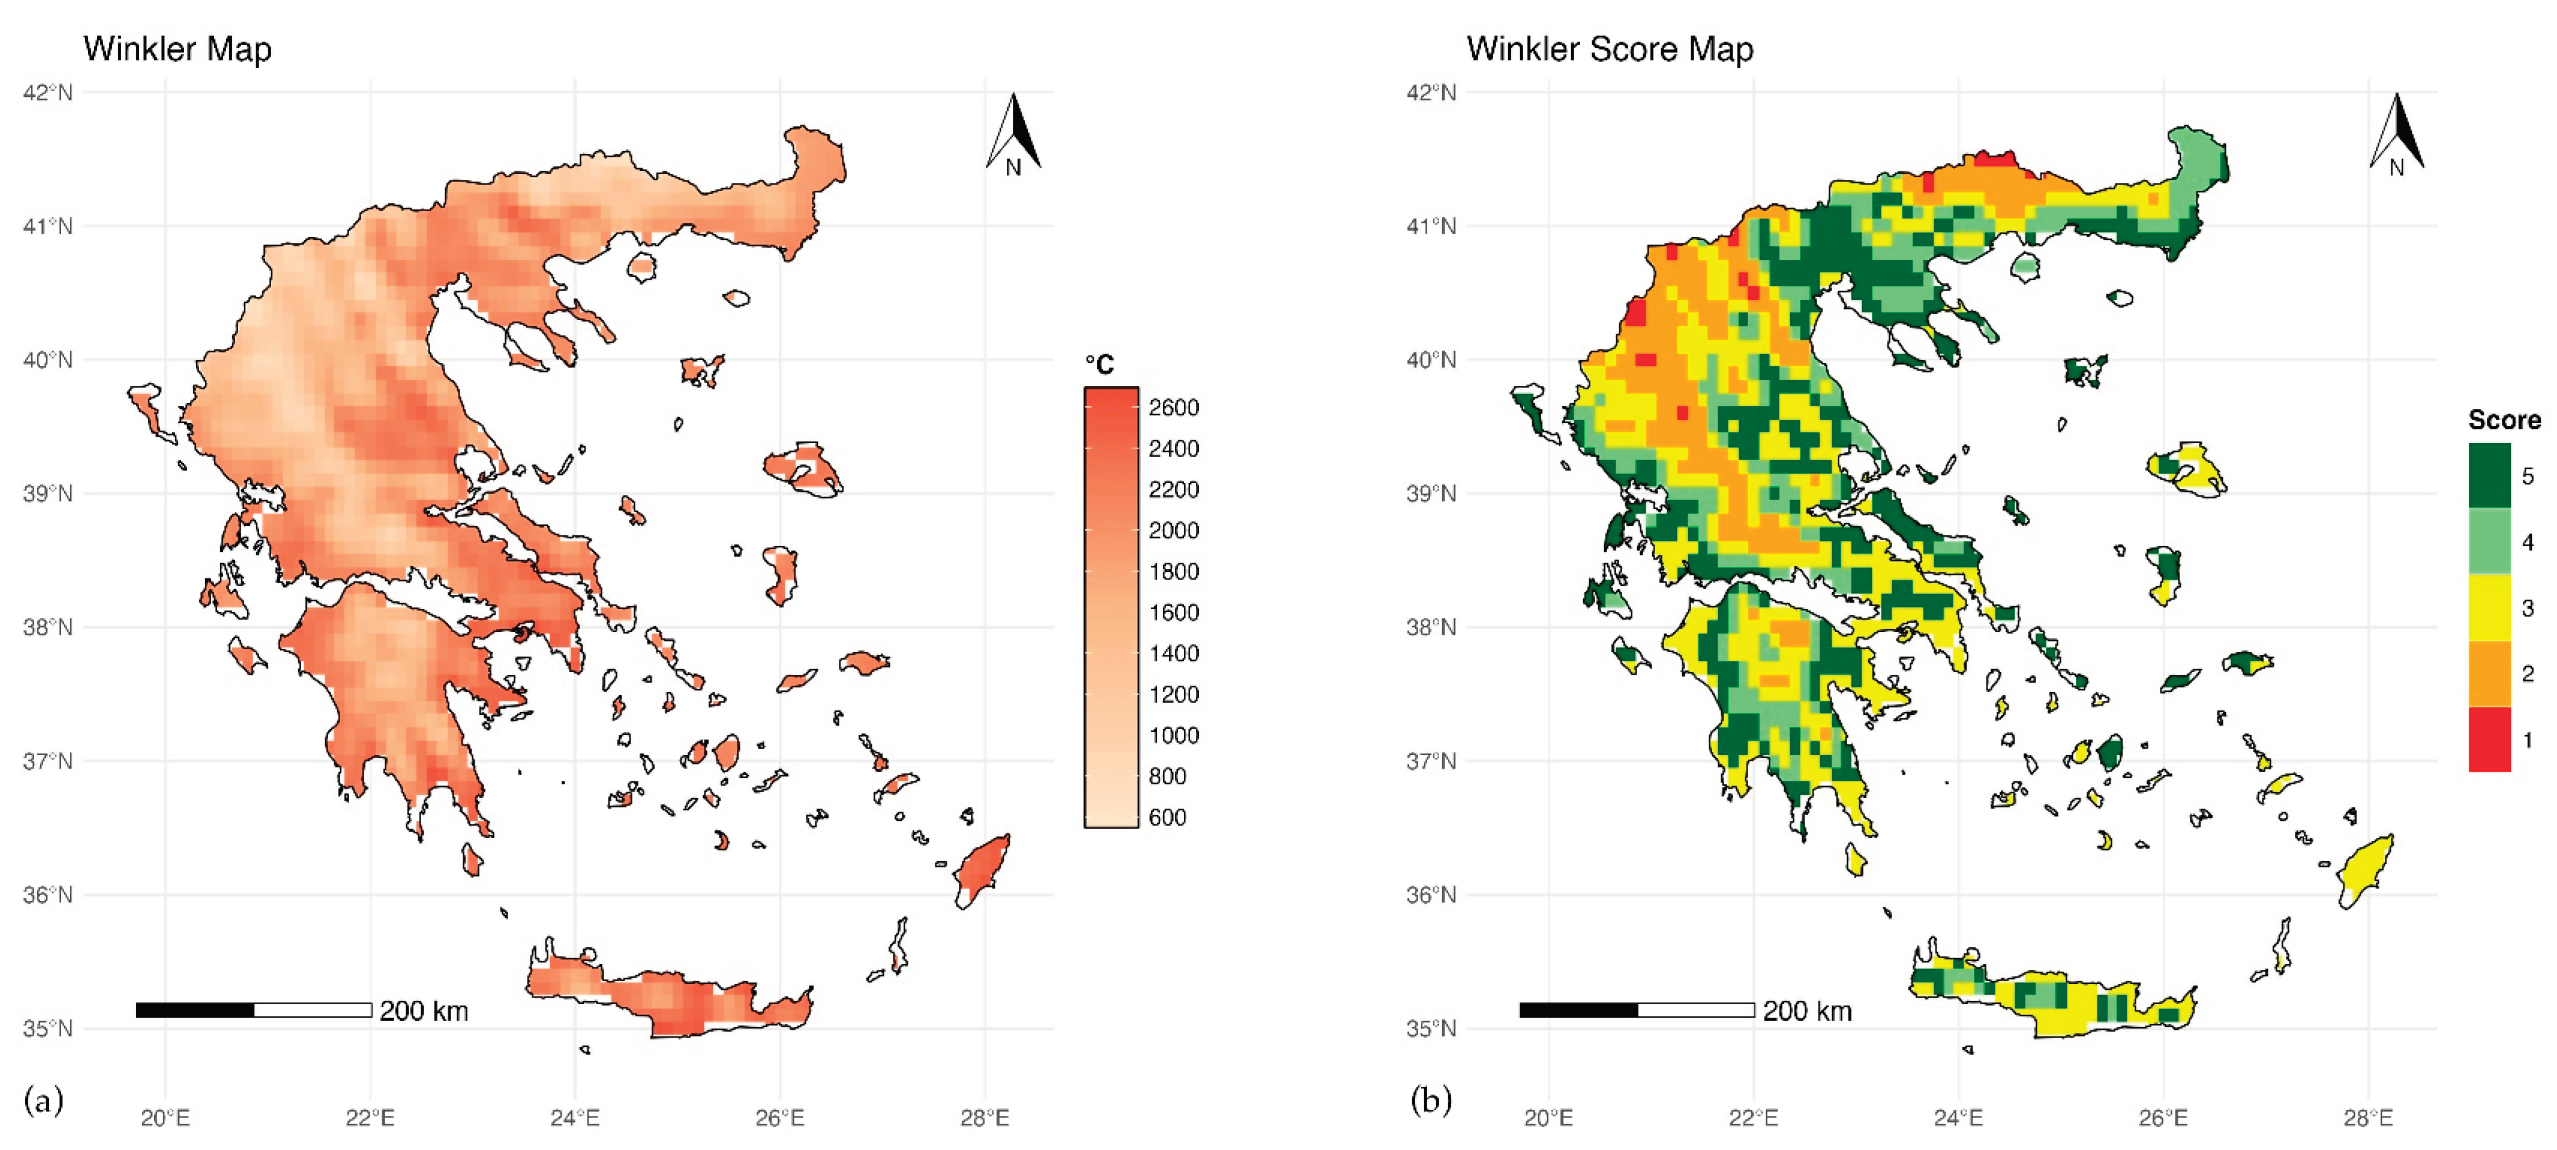
Figure 7.
Huglin index distribution map (a) and score map (b) for the reference period (1970 – 2000).
Figure 7.
Huglin index distribution map (a) and score map (b) for the reference period (1970 – 2000).
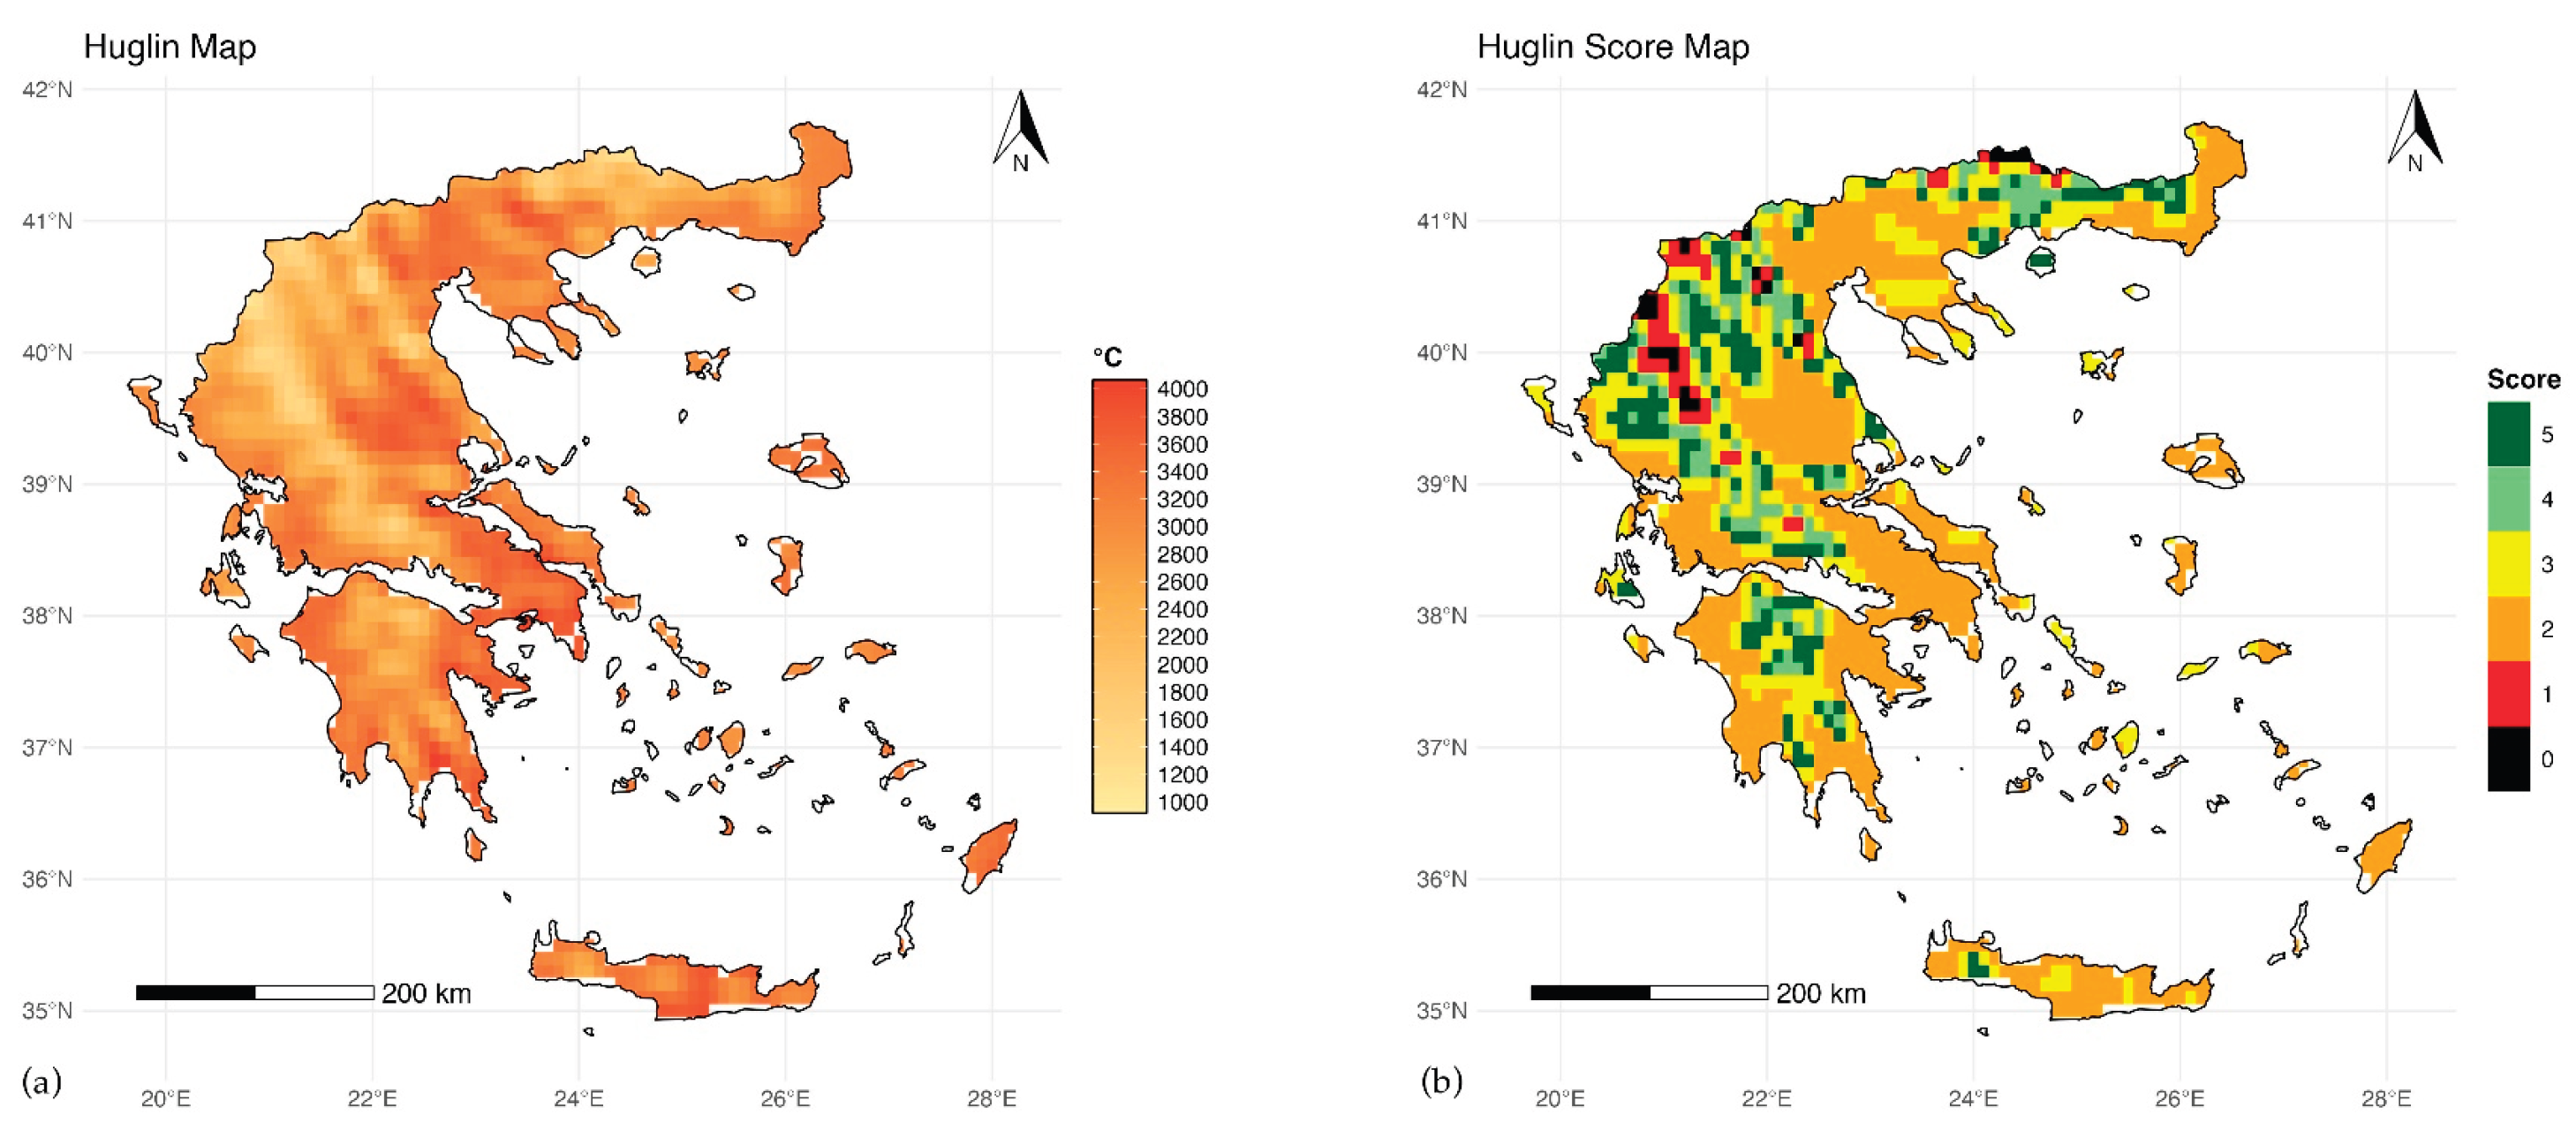
Figure 8.
Hydrothermal coefficient distribution map (a) and score map (b) for the reference period (1970 – 2000).
Figure 8.
Hydrothermal coefficient distribution map (a) and score map (b) for the reference period (1970 – 2000).
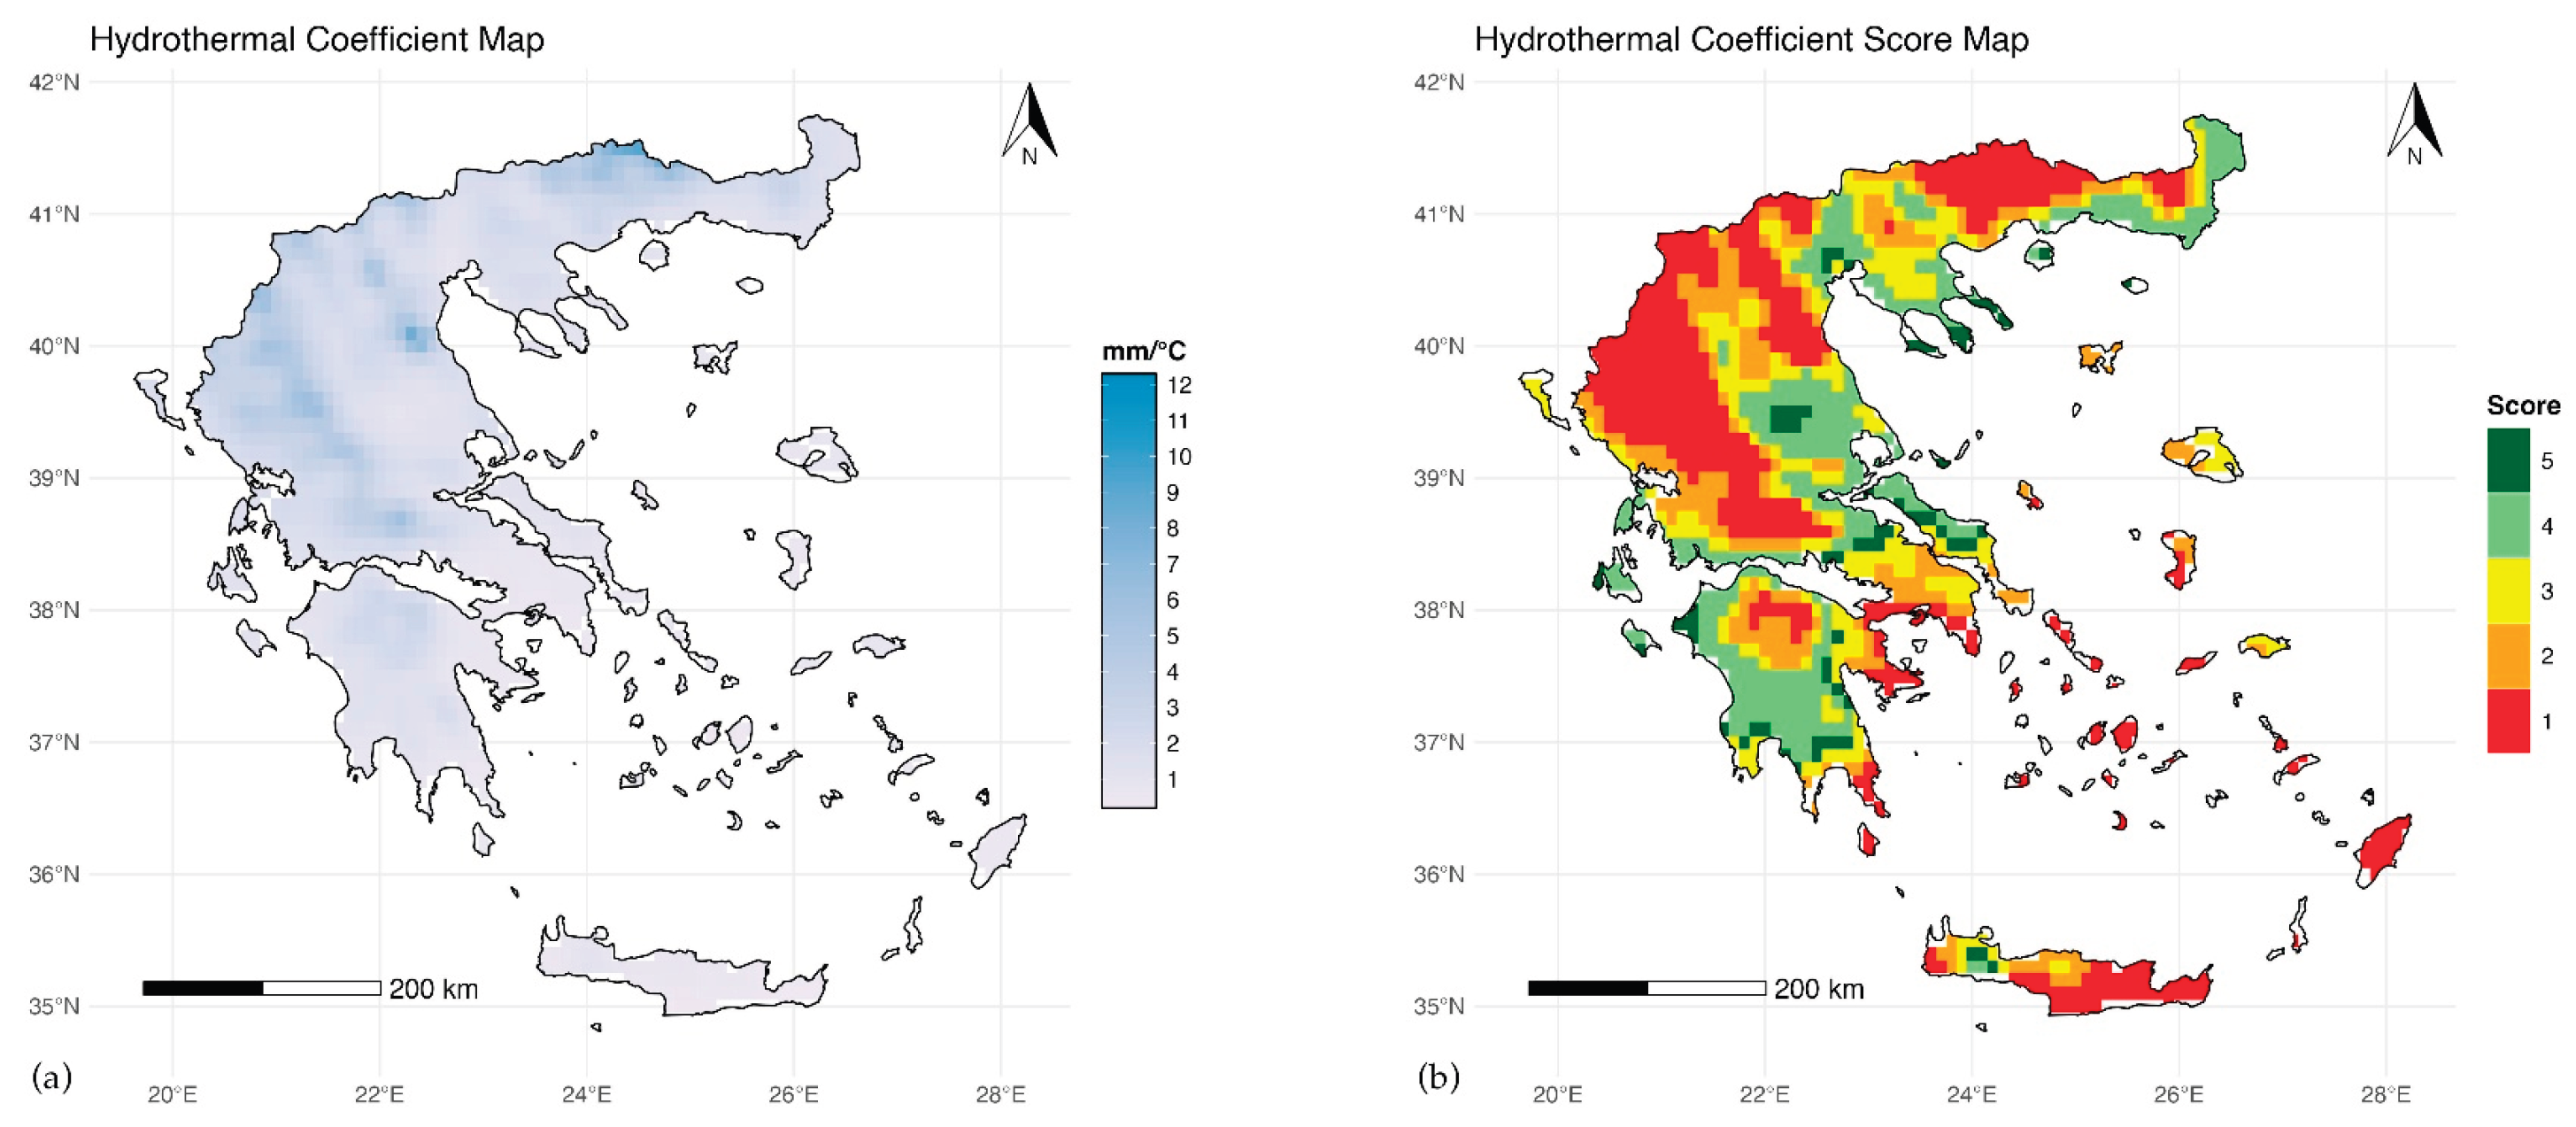
Figure 9.
Growing season mean temperature distribution map (a) and score map (b) for the reference period (1970 – 2000).
Figure 9.
Growing season mean temperature distribution map (a) and score map (b) for the reference period (1970 – 2000).
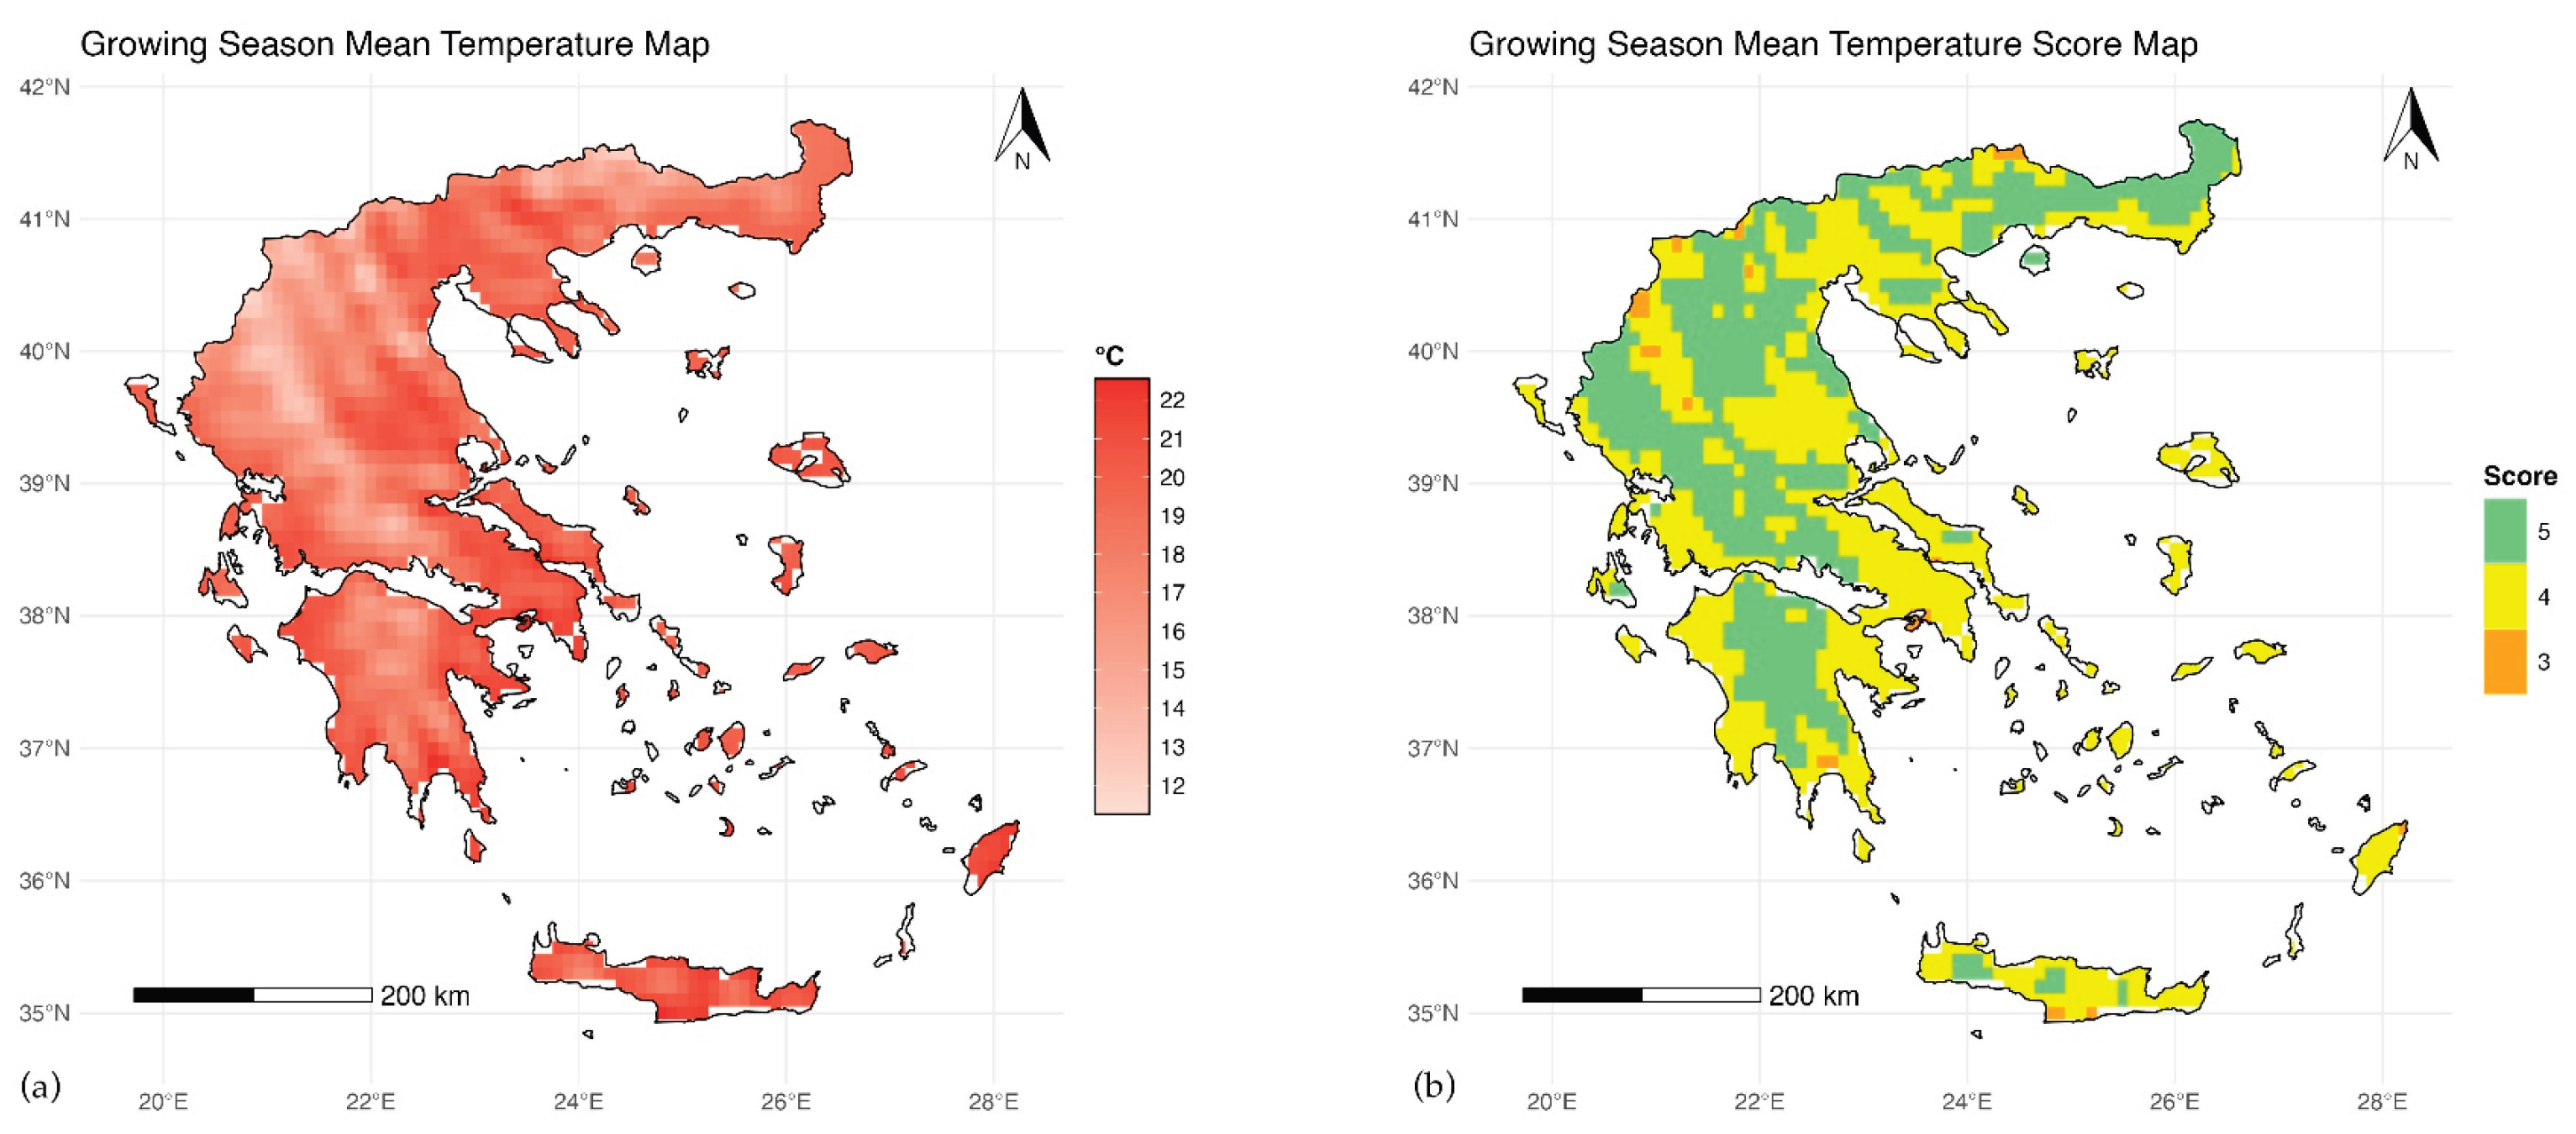
Figure 10.
Cool night index distribution map (a) and score map (b) for the reference period (1970 – 2000).
Figure 10.
Cool night index distribution map (a) and score map (b) for the reference period (1970 – 2000).
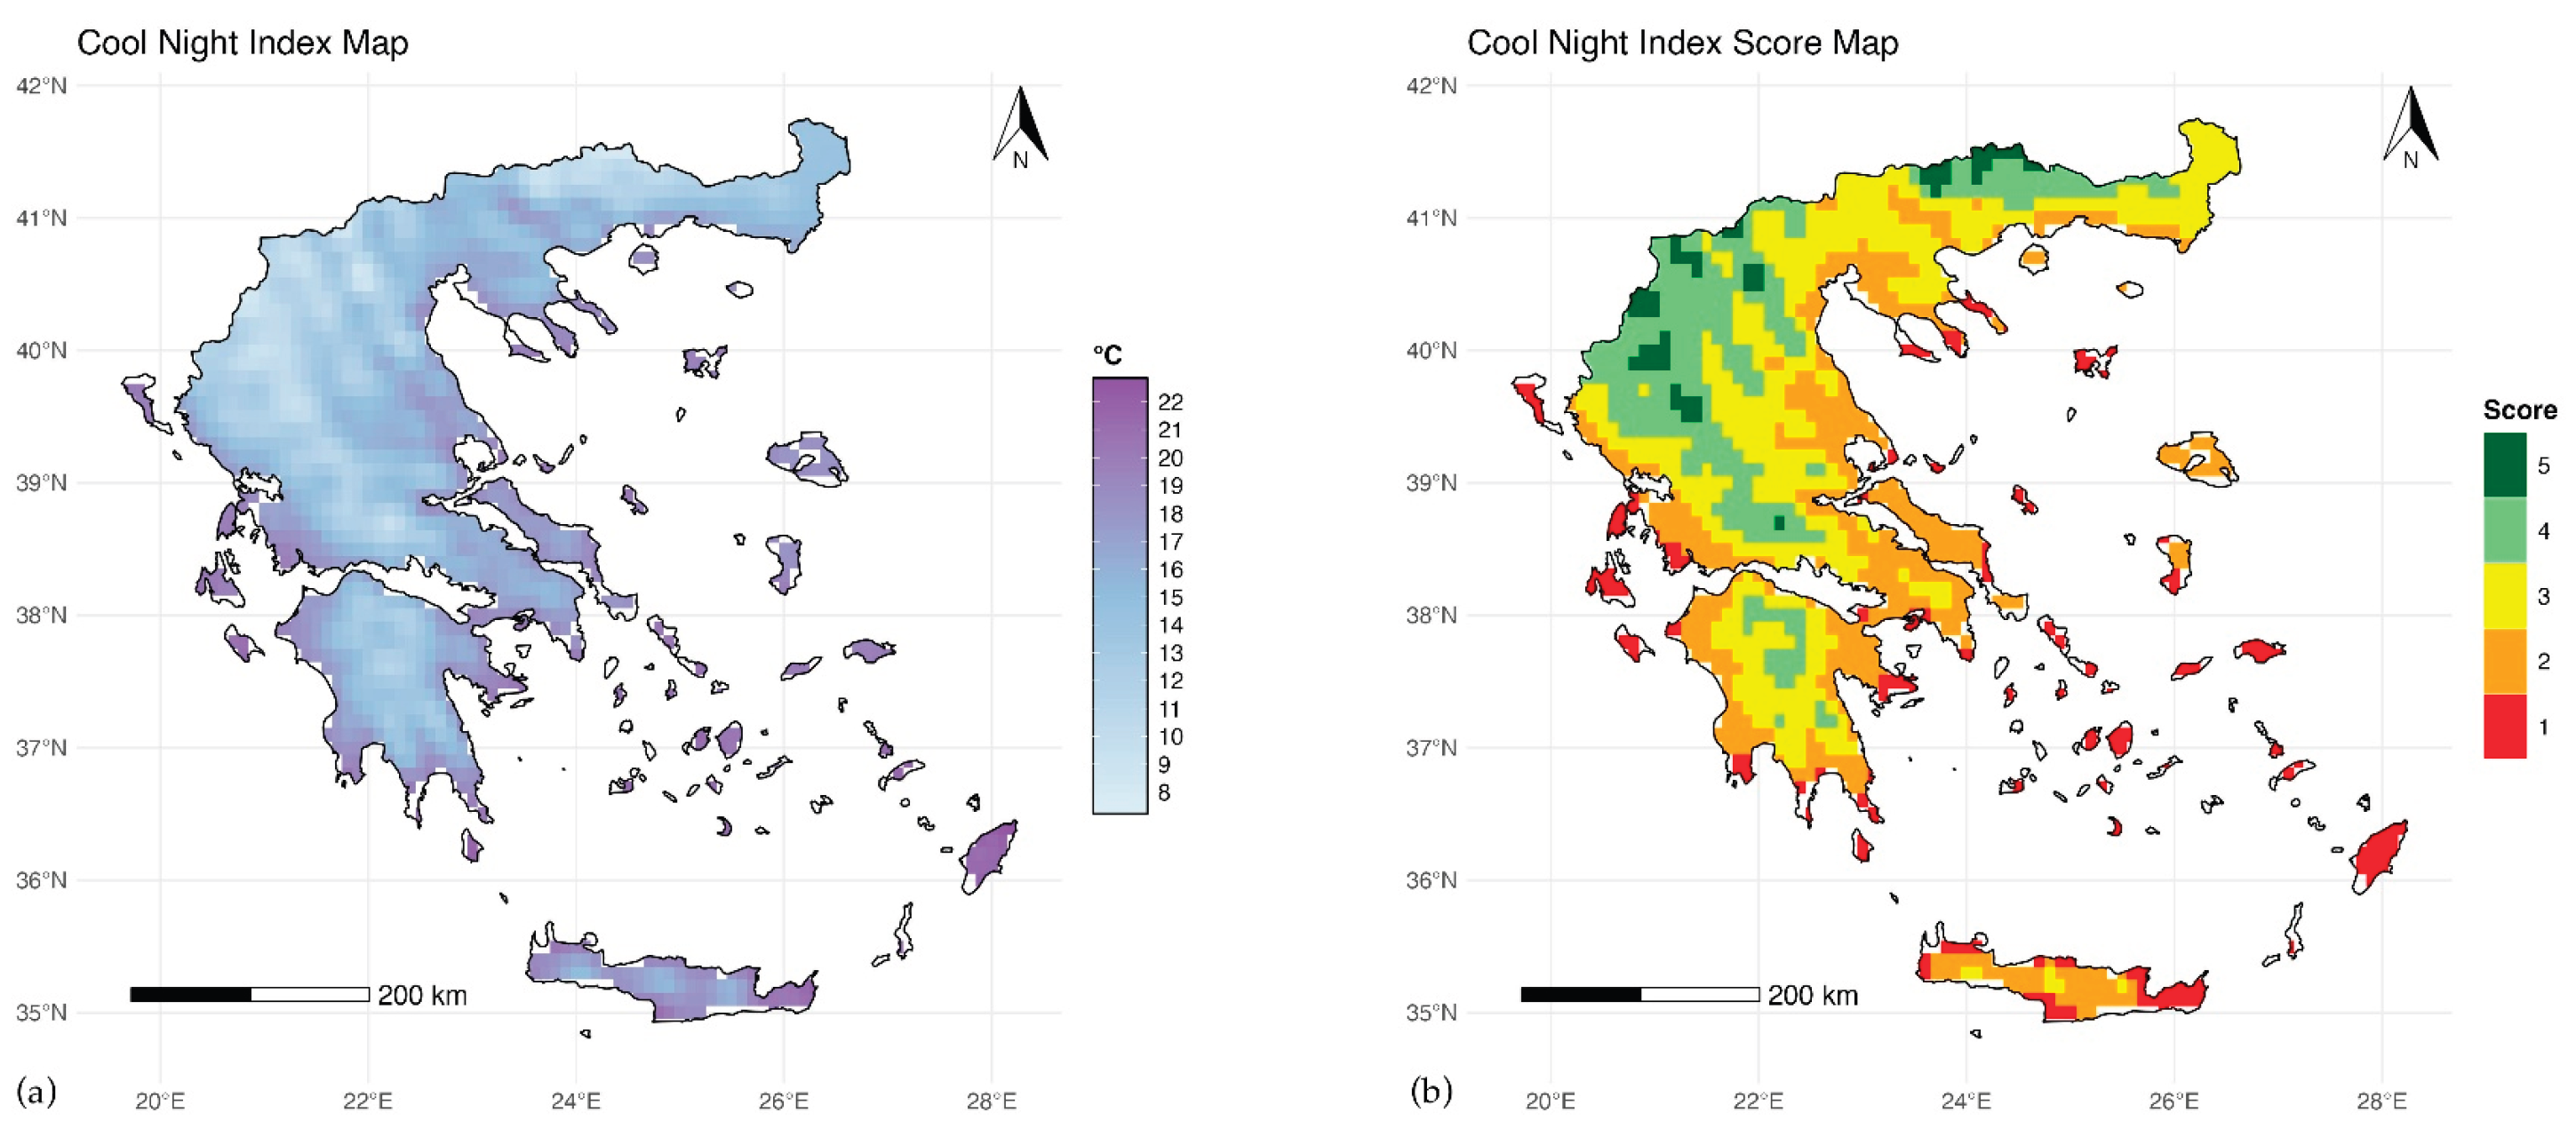
Figure 11.
Growing season precipitation index distribution map (a) and score map (b) for the reference period (1970 – 2000).
Figure 11.
Growing season precipitation index distribution map (a) and score map (b) for the reference period (1970 – 2000).
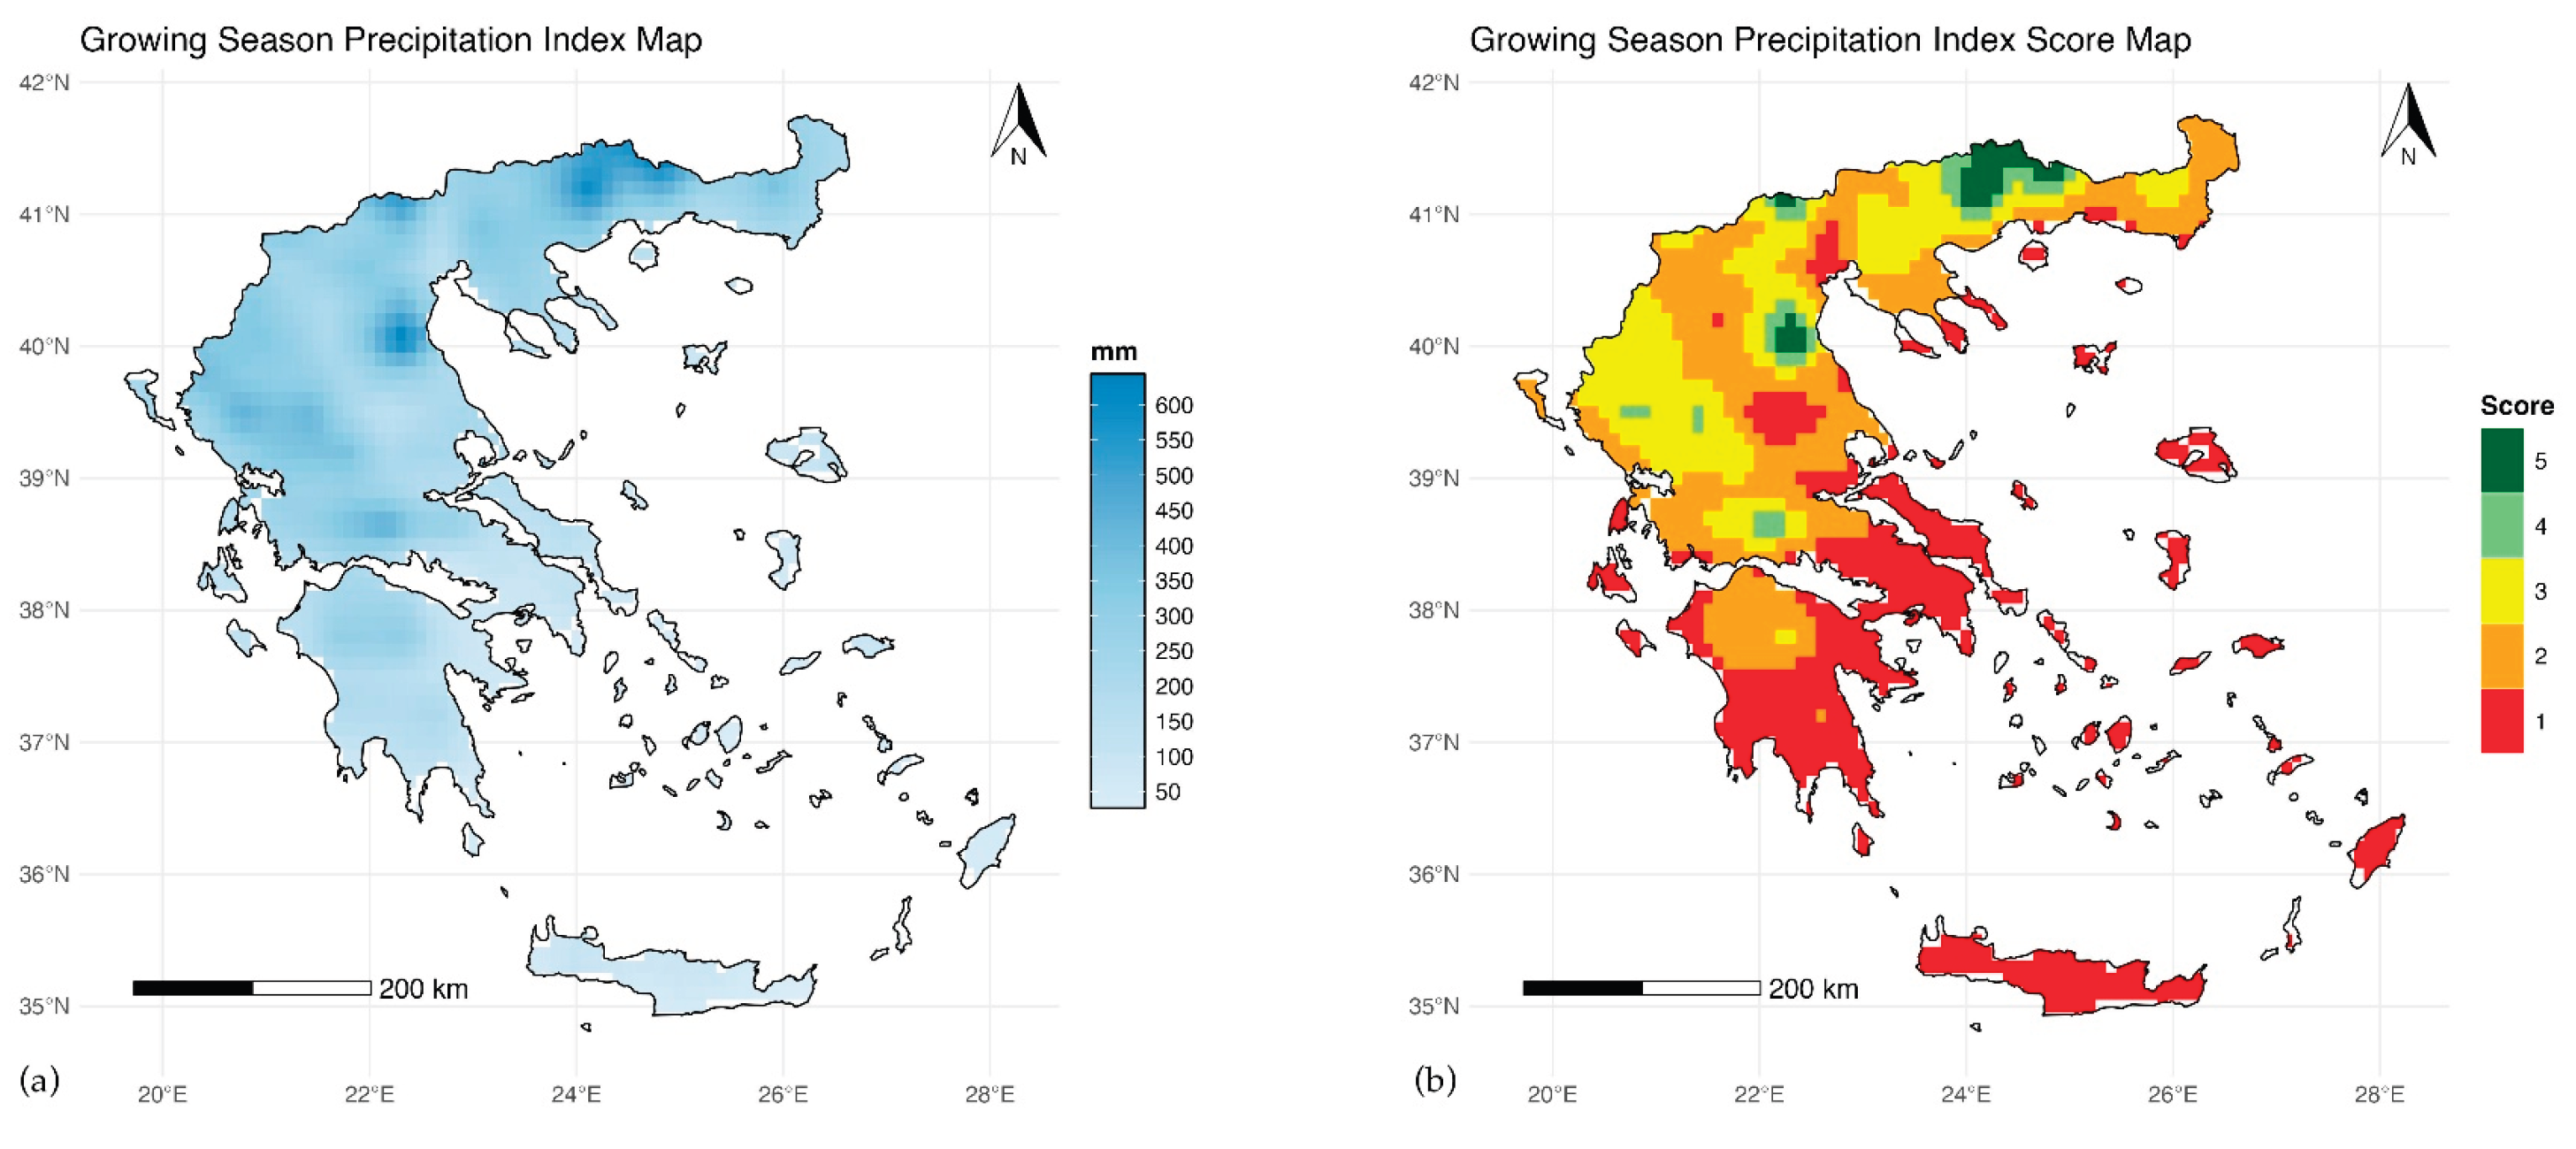
Figure 12.
Average hot days (>35°C) distribution map (a) and score map (b) for the reference period (1970 – 2000).
Figure 12.
Average hot days (>35°C) distribution map (a) and score map (b) for the reference period (1970 – 2000).
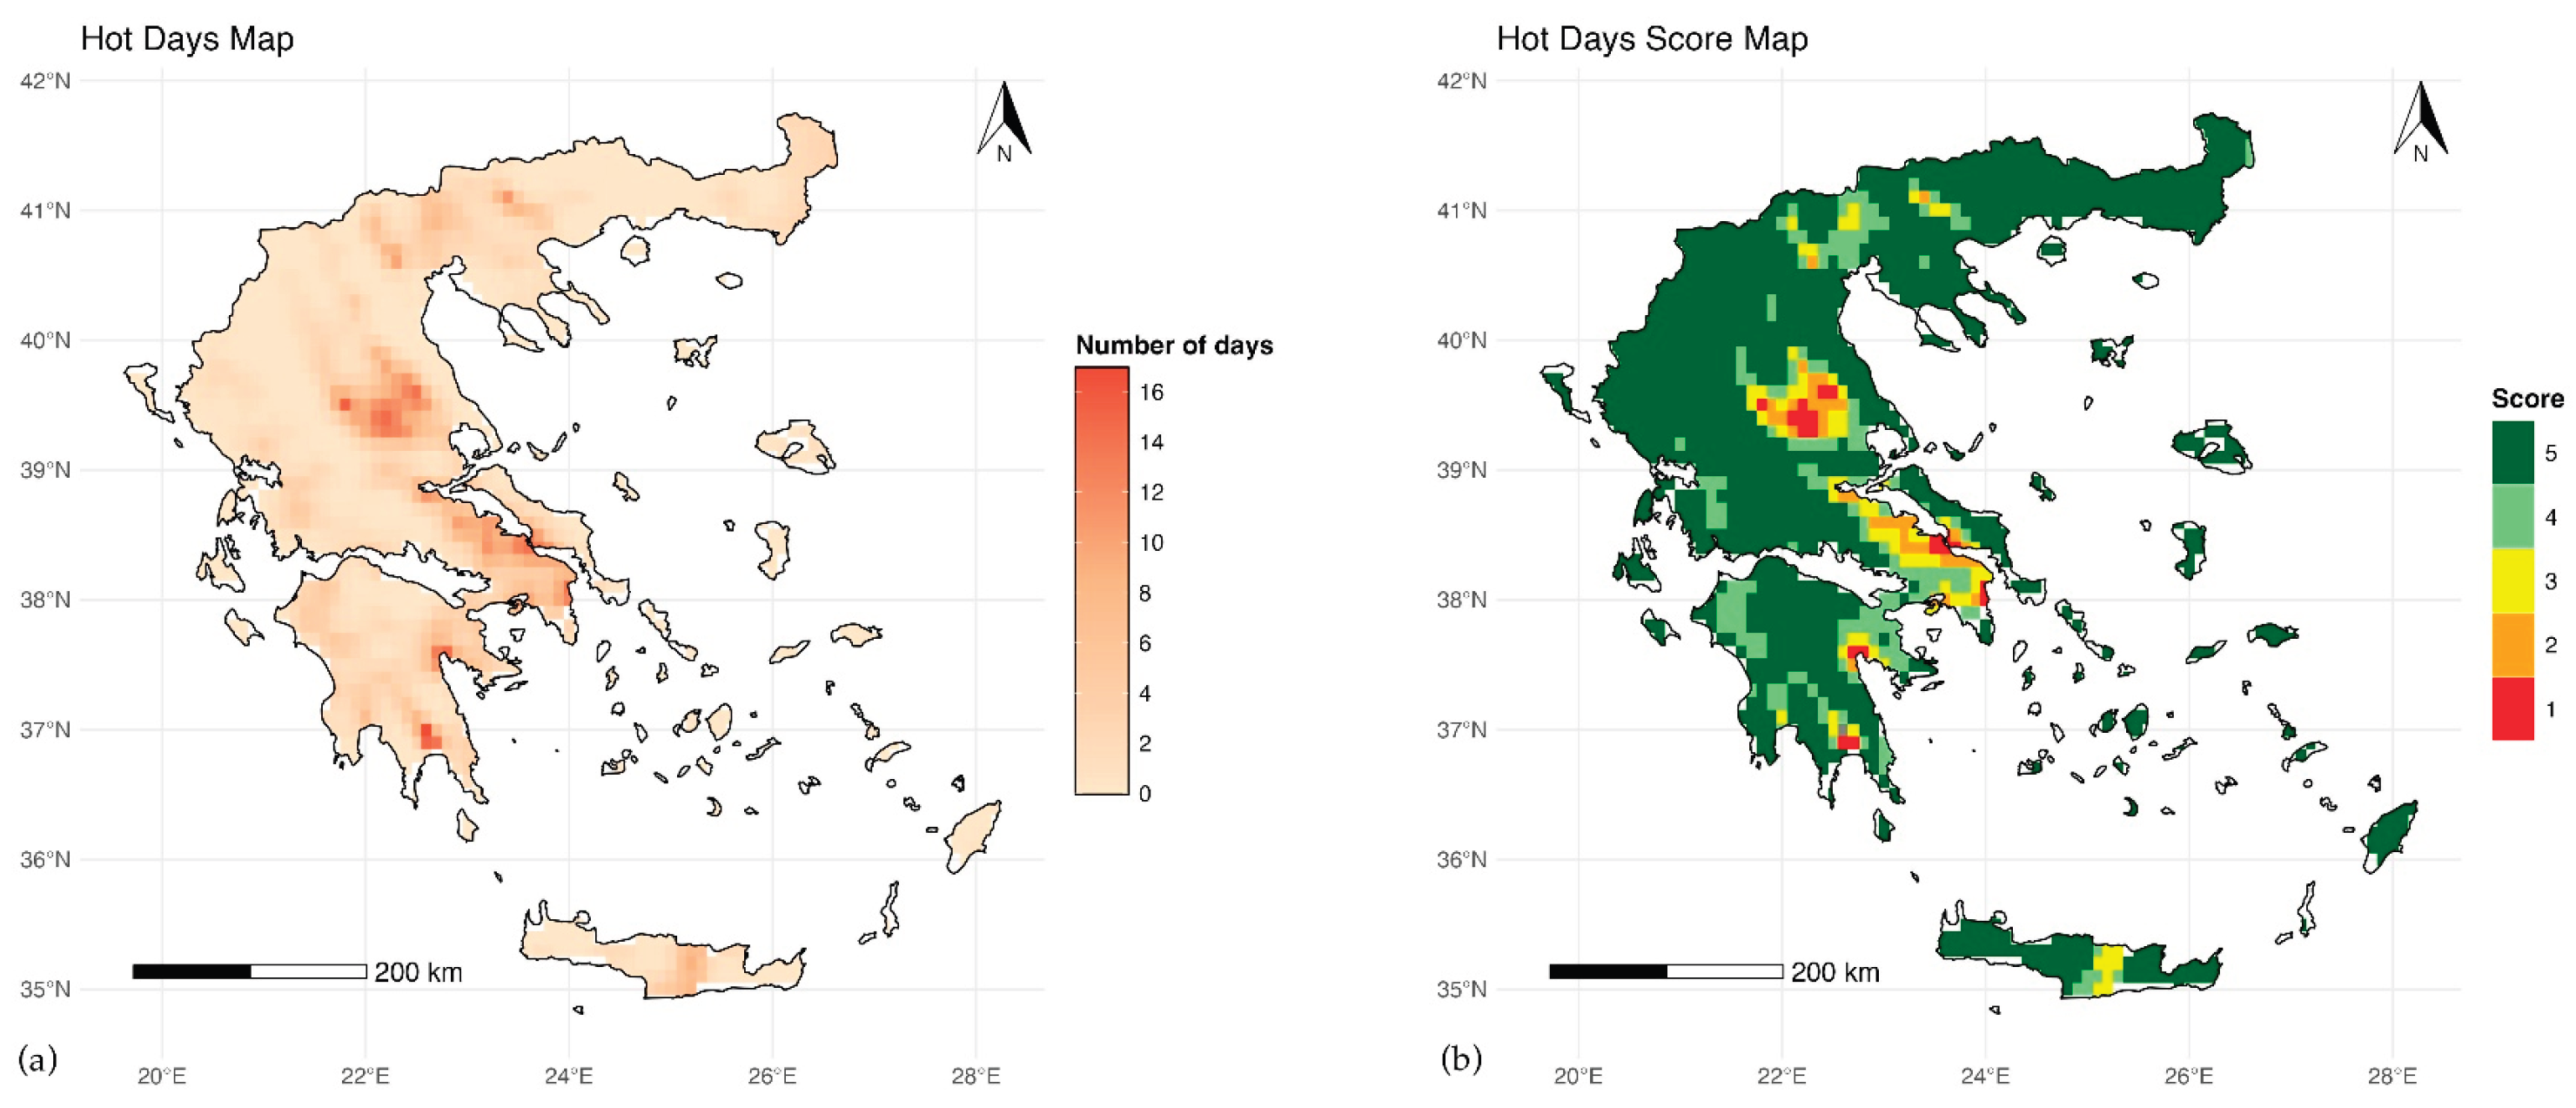
Figure 13.
Heatwave period (>35°C) distribution map (a) and score map (b) for the reference period (1970 – 2000).
Figure 13.
Heatwave period (>35°C) distribution map (a) and score map (b) for the reference period (1970 – 2000).
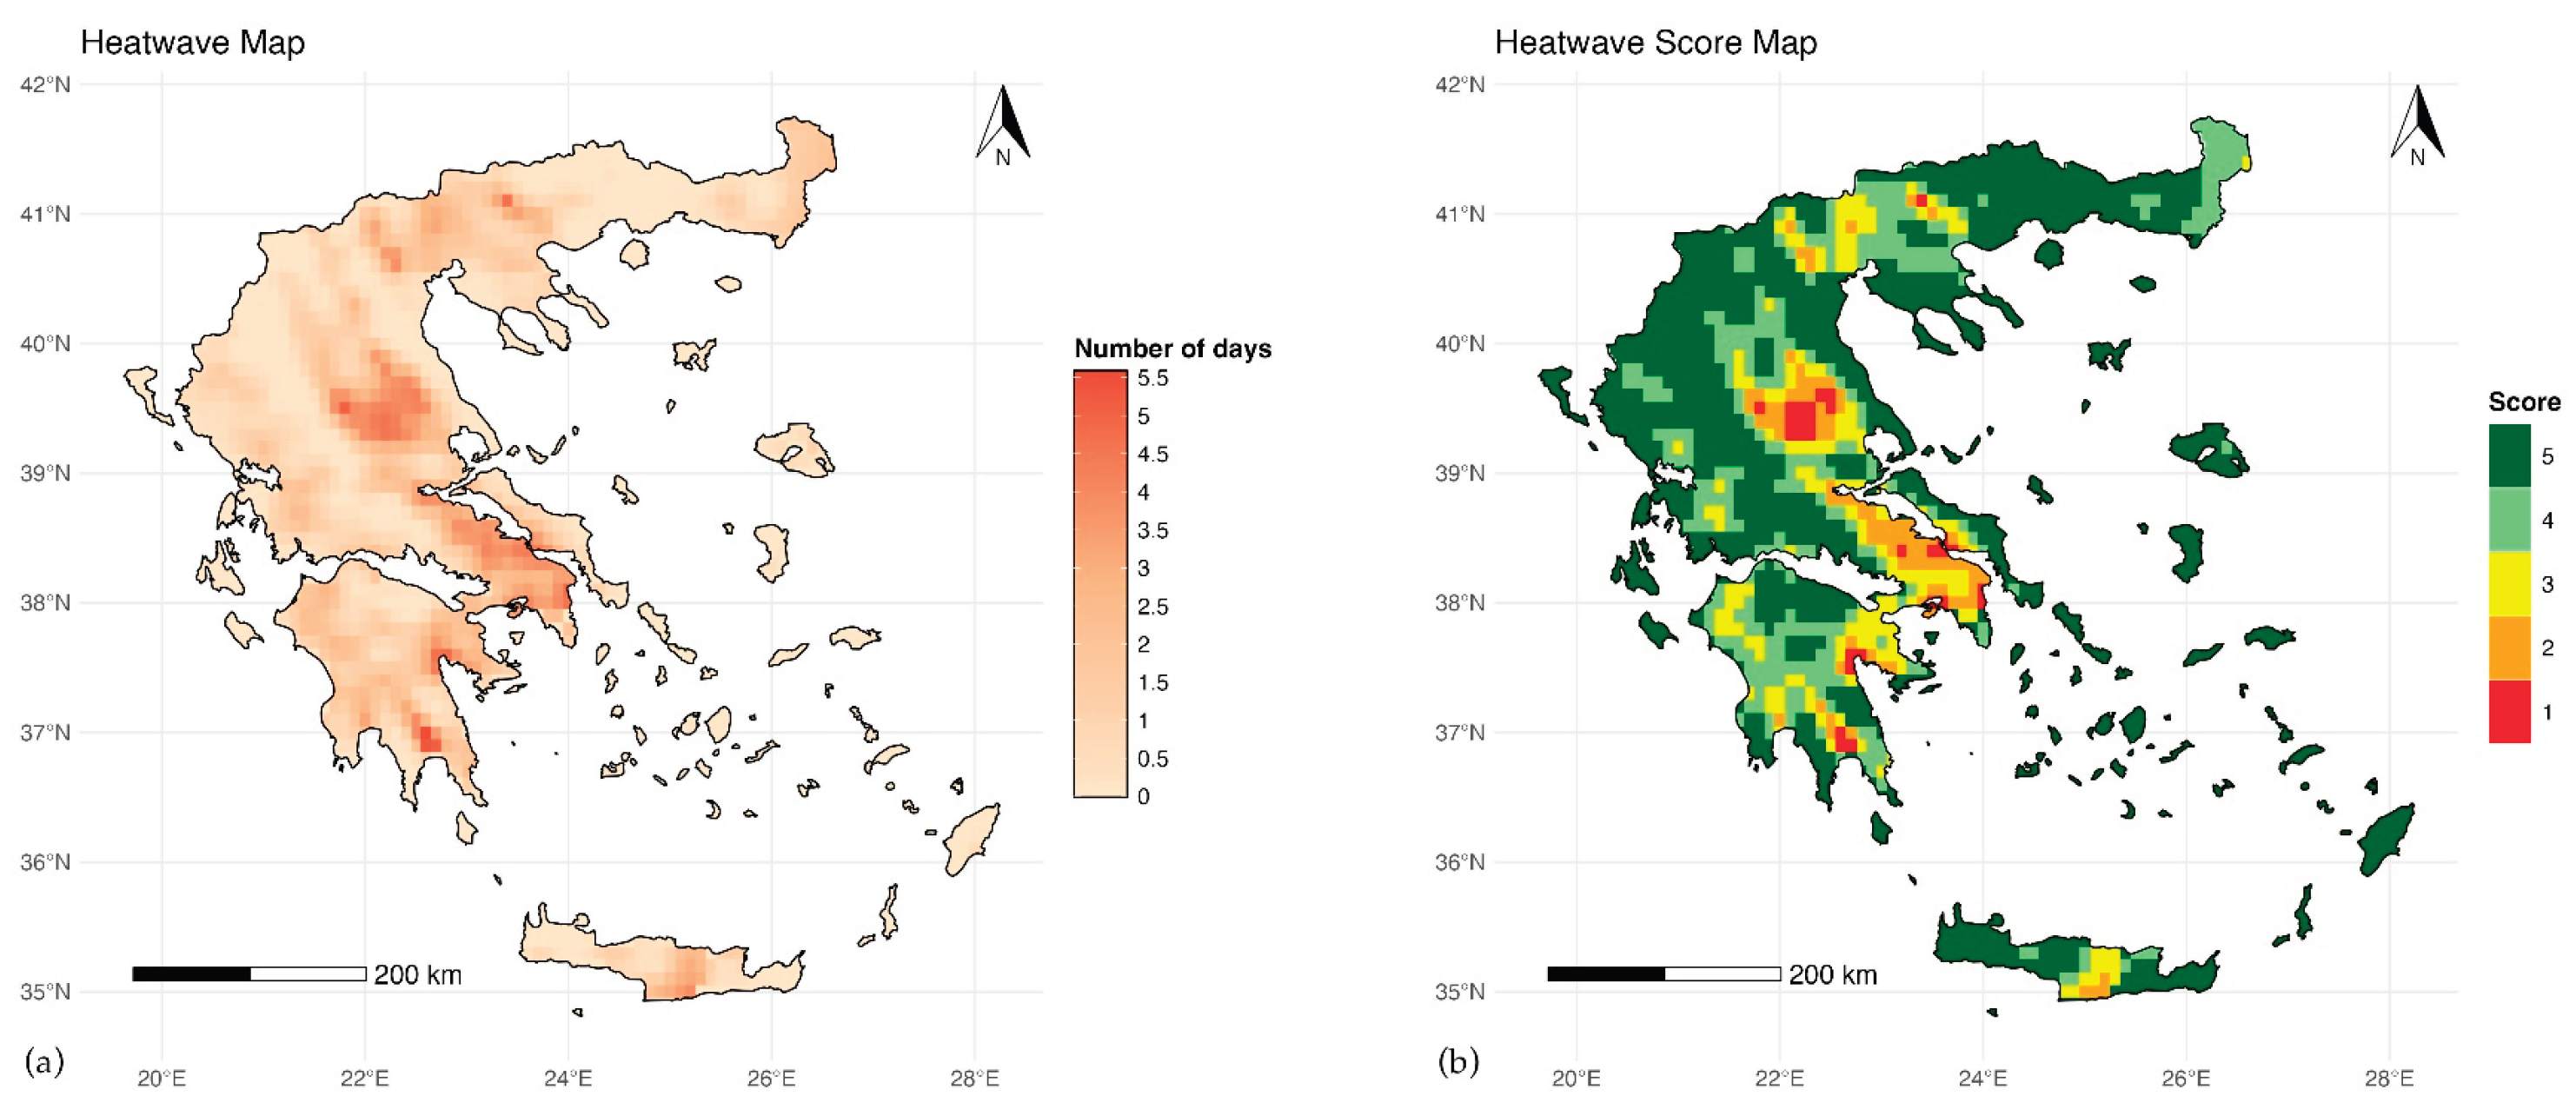
Figure 14.
Average very cold days (< -5°C) distribution map (a) and score map (b) for the reference period (1970 – 2000).
Figure 14.
Average very cold days (< -5°C) distribution map (a) and score map (b) for the reference period (1970 – 2000).
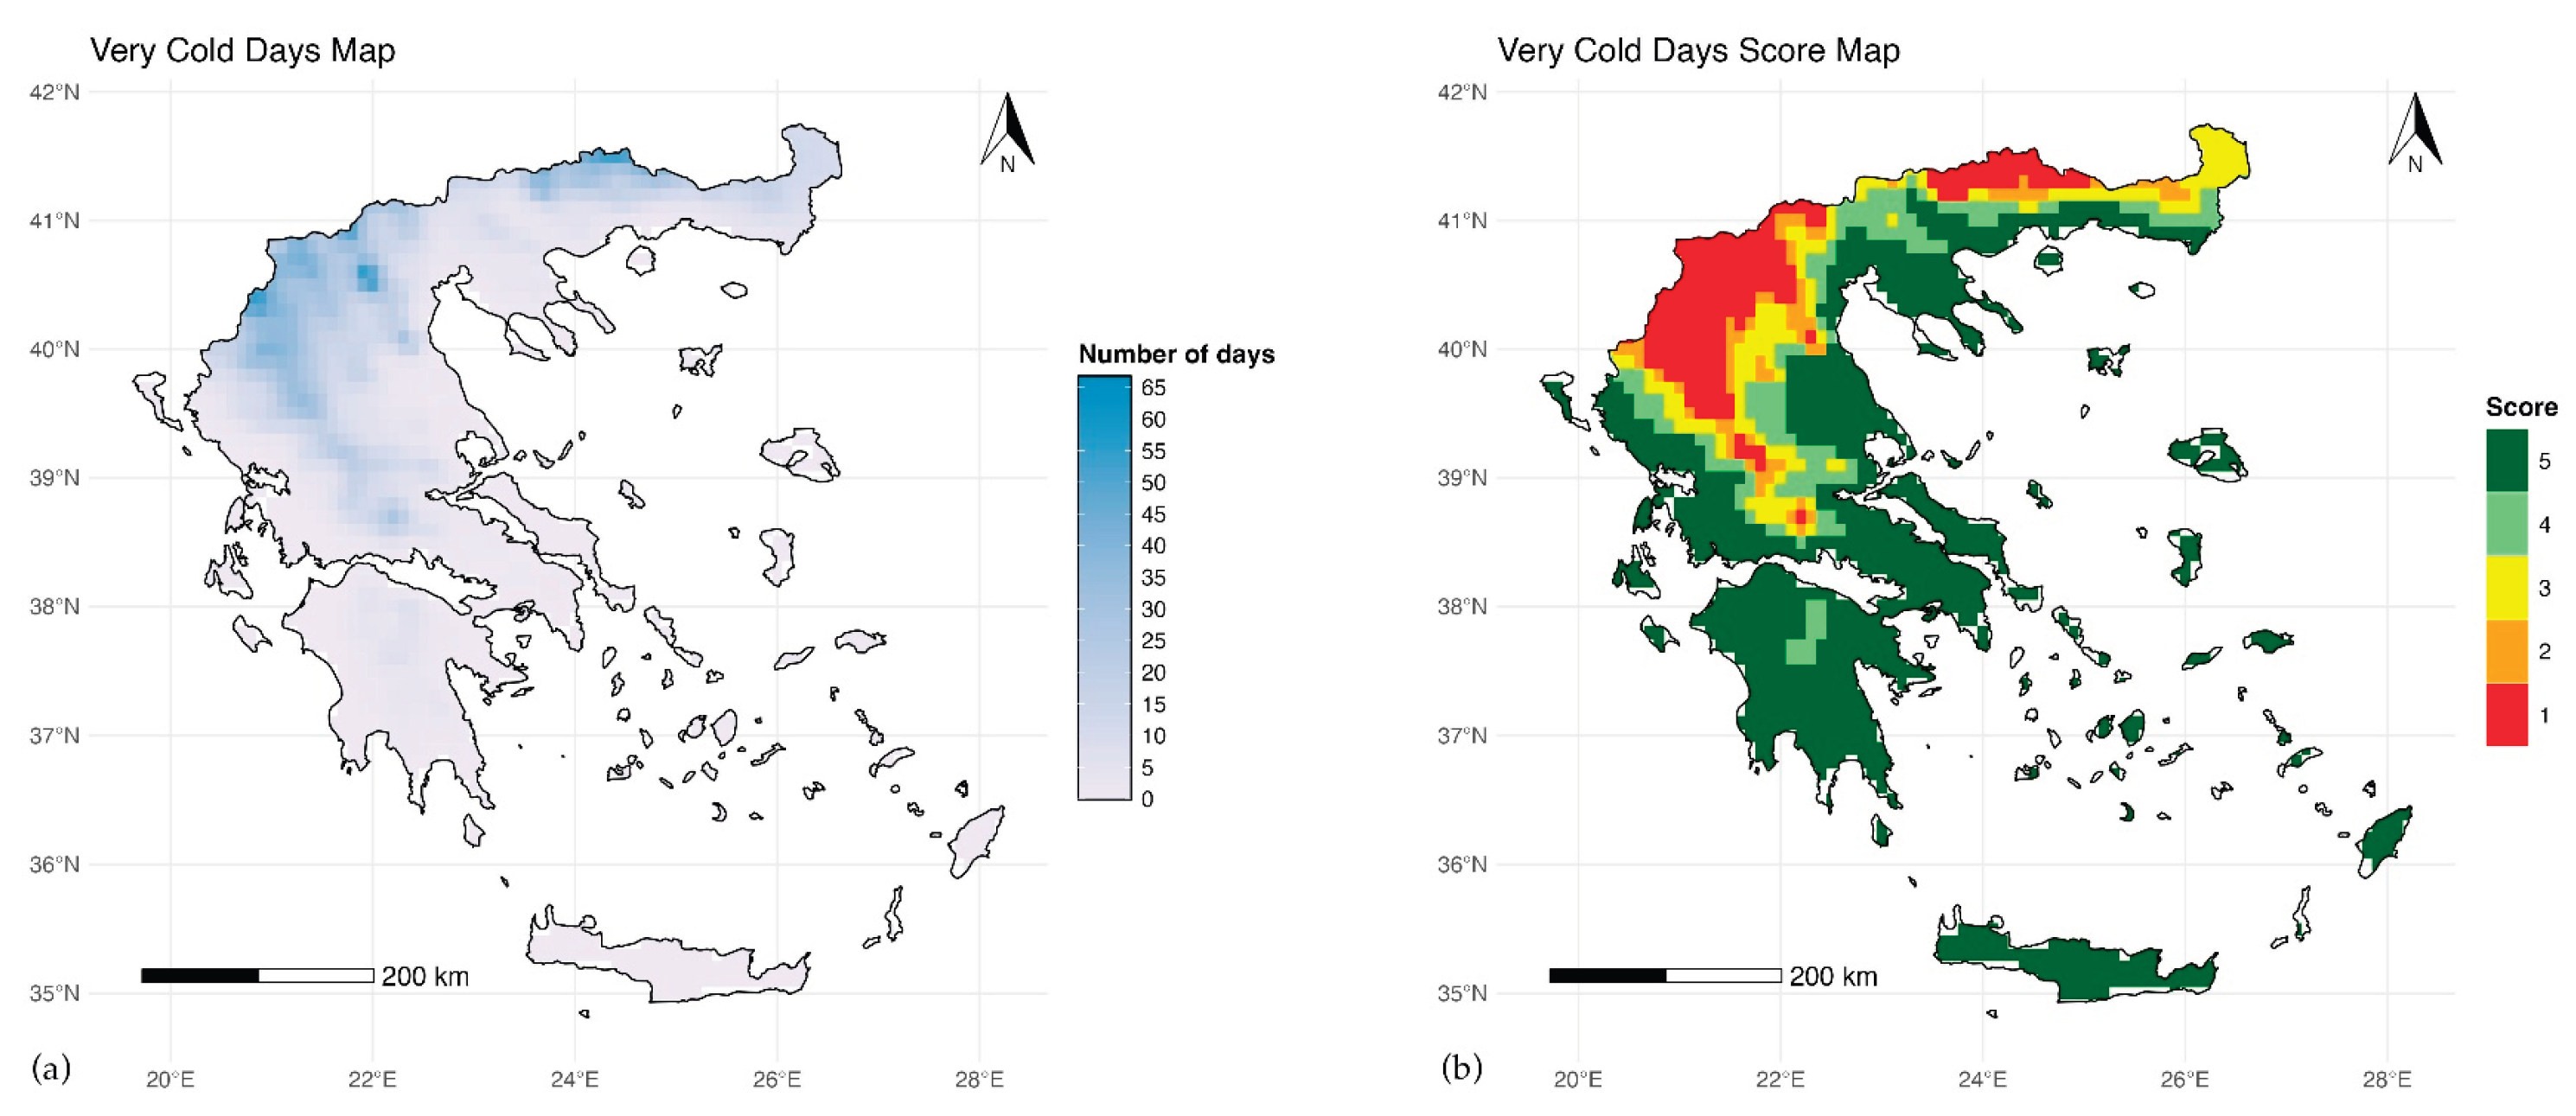
Figure 15.
Average growing season frost days (> 0°C) distribution map (a) and score map (b) for the reference period (1970 – 2000).
Figure 15.
Average growing season frost days (> 0°C) distribution map (a) and score map (b) for the reference period (1970 – 2000).
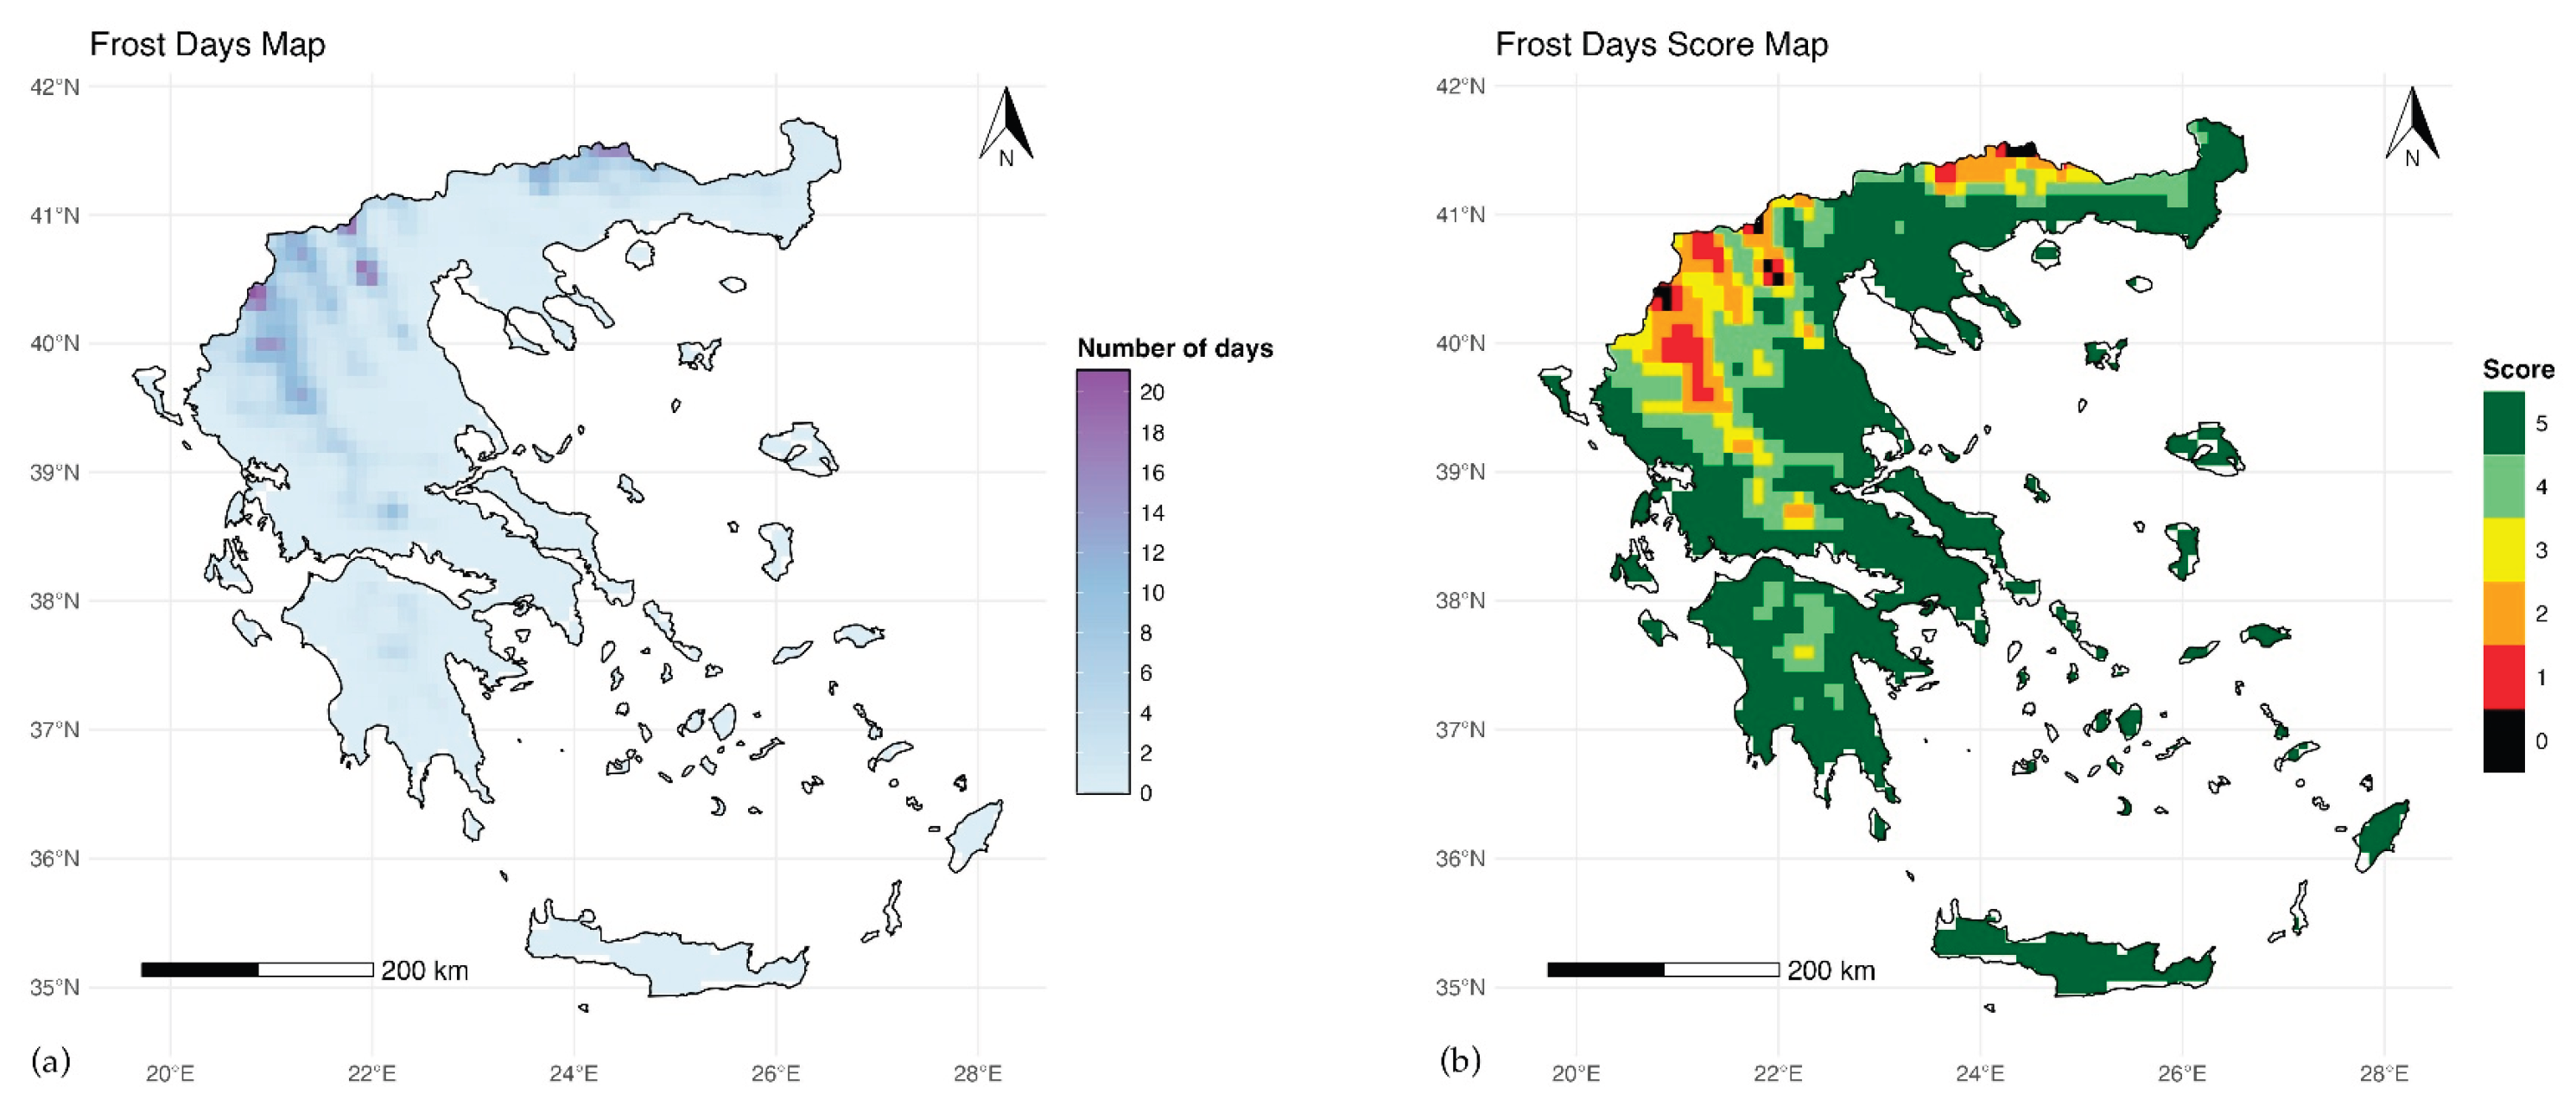
Figure 16.
Geomorphological viticultural suitability scoring map for the reference period (1970 – 2000). Continental sites with no color are the unsuitable areas (zero values).
Figure 16.
Geomorphological viticultural suitability scoring map for the reference period (1970 – 2000). Continental sites with no color are the unsuitable areas (zero values).
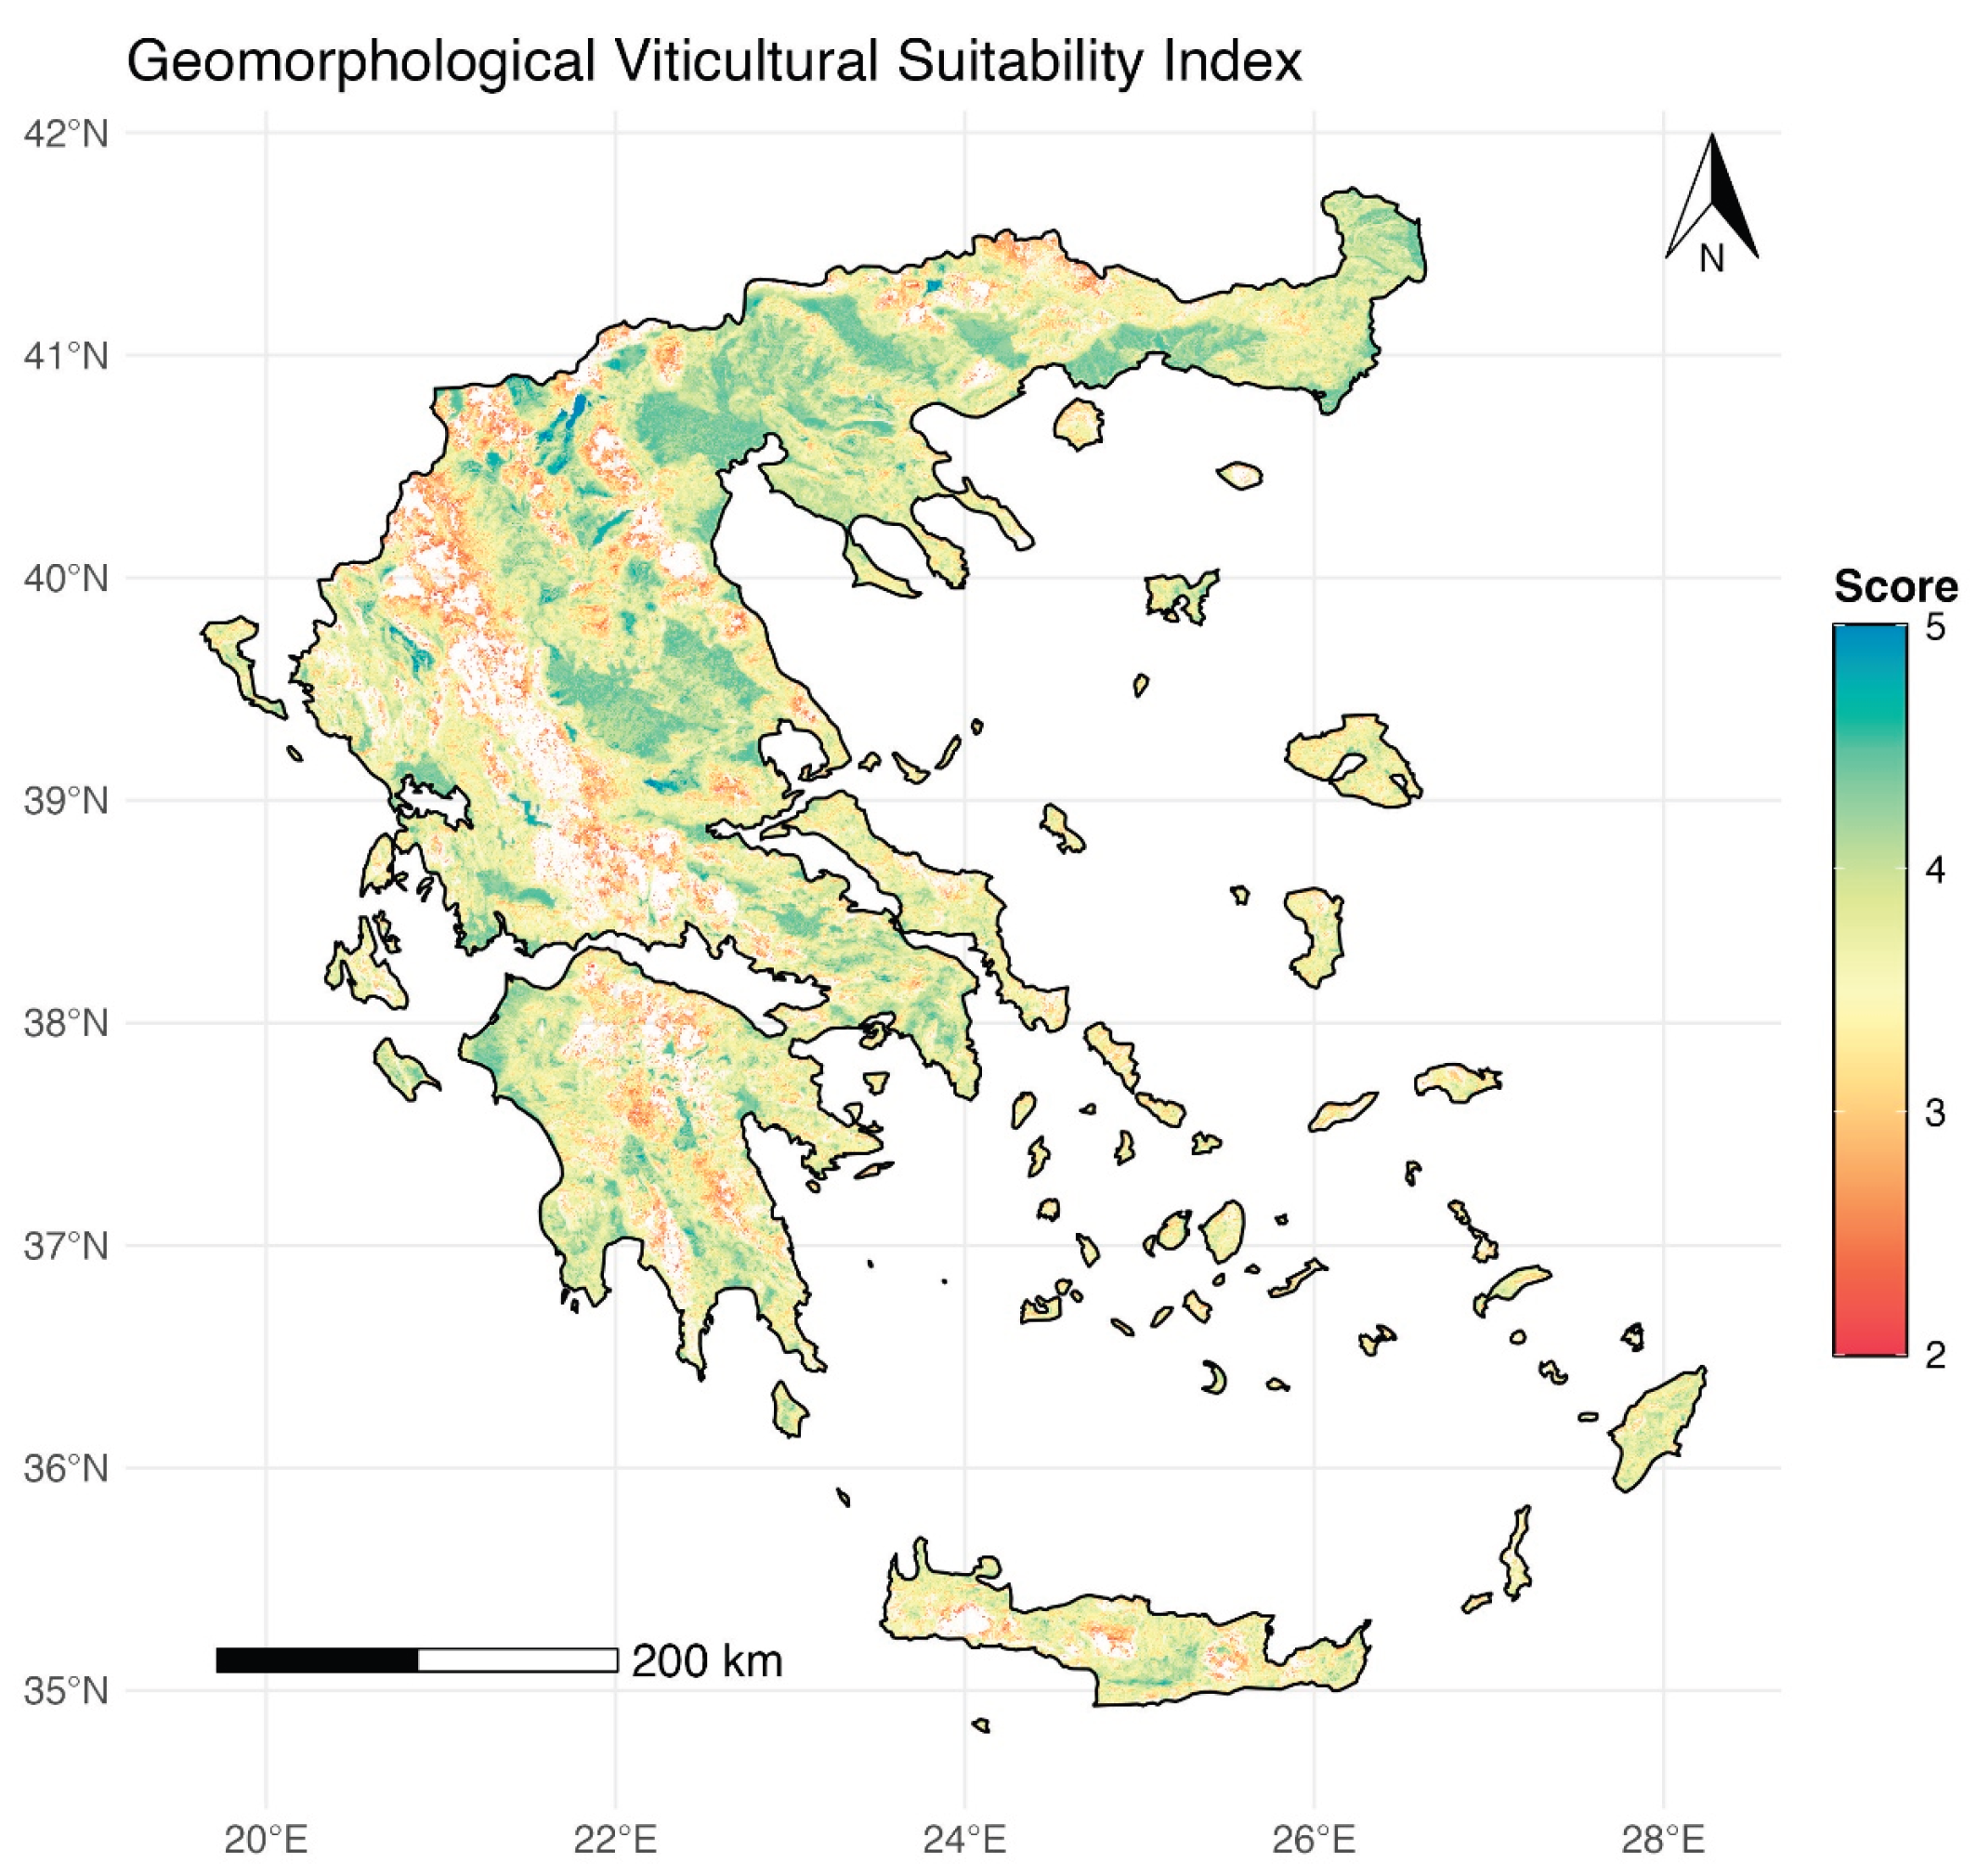
Figure 17.
Climatic viticultural suitability scoring map for the reference period (1970 – 2000). Continental sites with no color are the unsuitable areas (zero values).
Figure 17.
Climatic viticultural suitability scoring map for the reference period (1970 – 2000). Continental sites with no color are the unsuitable areas (zero values).
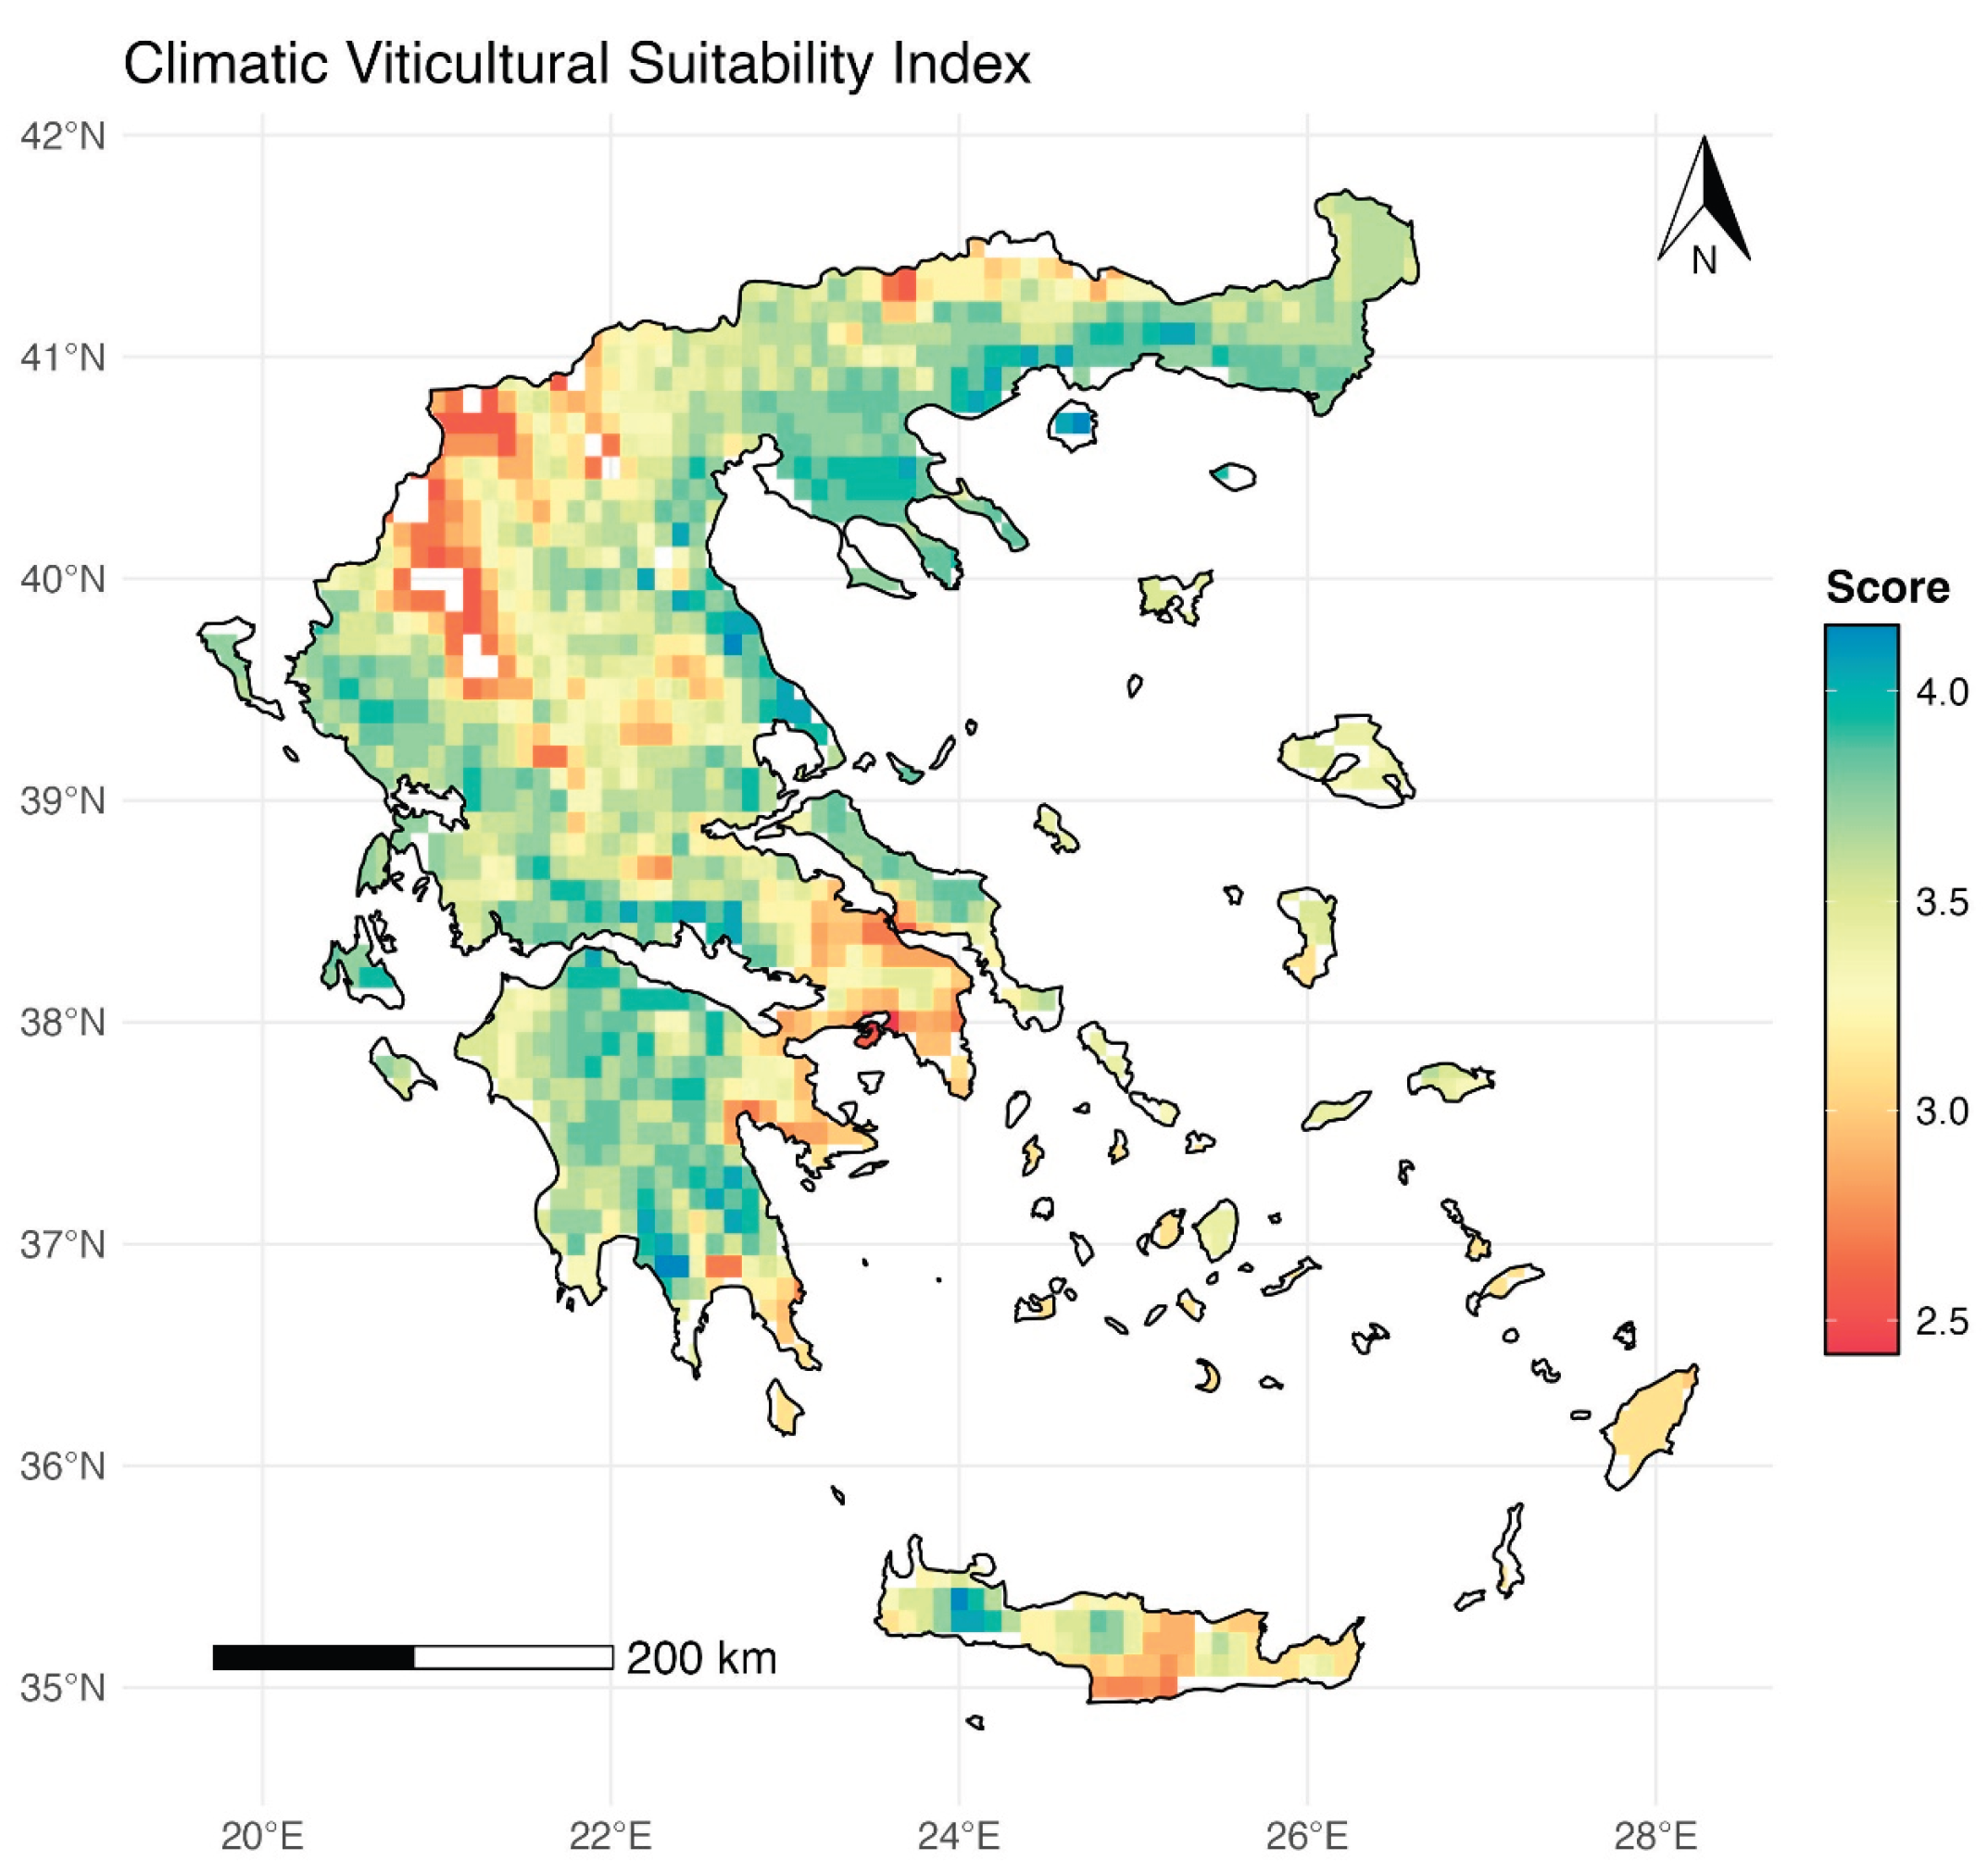
Figure 18.
Final viticultural suitability classification map for the reference period (1970 – 2000).
Figure 18.
Final viticultural suitability classification map for the reference period (1970 – 2000).
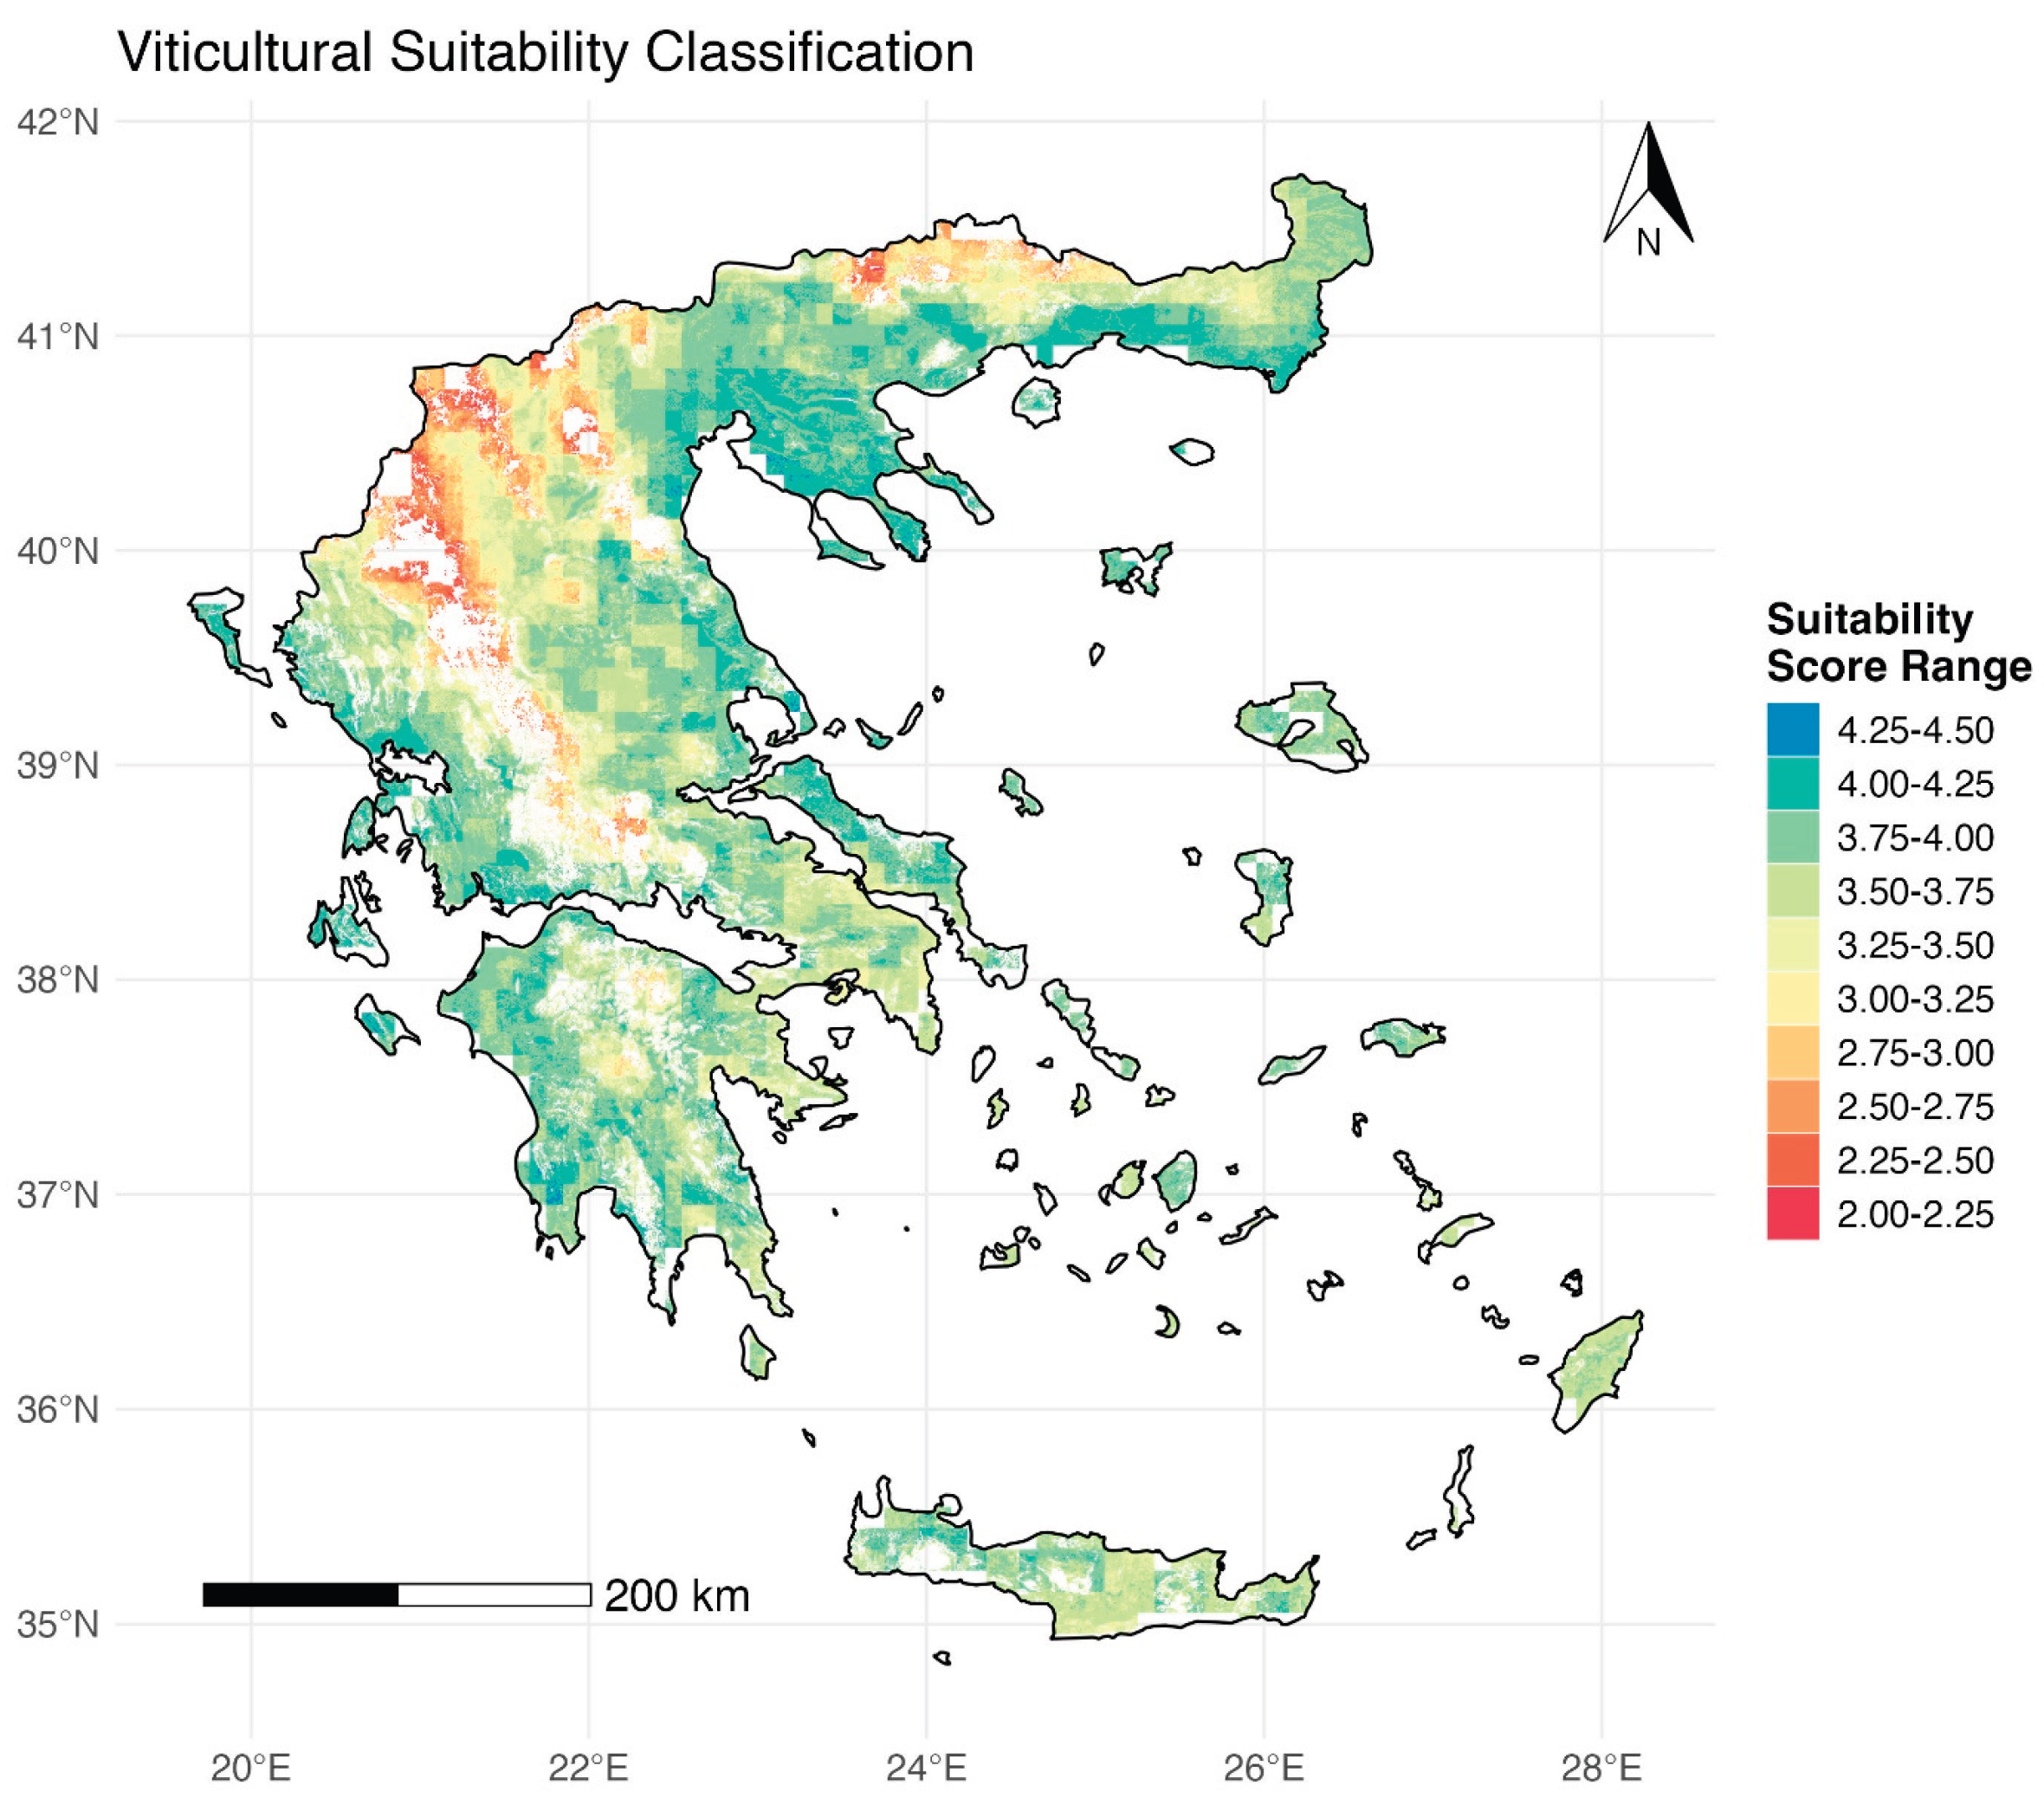
Figure 19.
High final viticultural suitability classification map for the reference period (1970 – 2000).
Figure 19.
High final viticultural suitability classification map for the reference period (1970 – 2000).
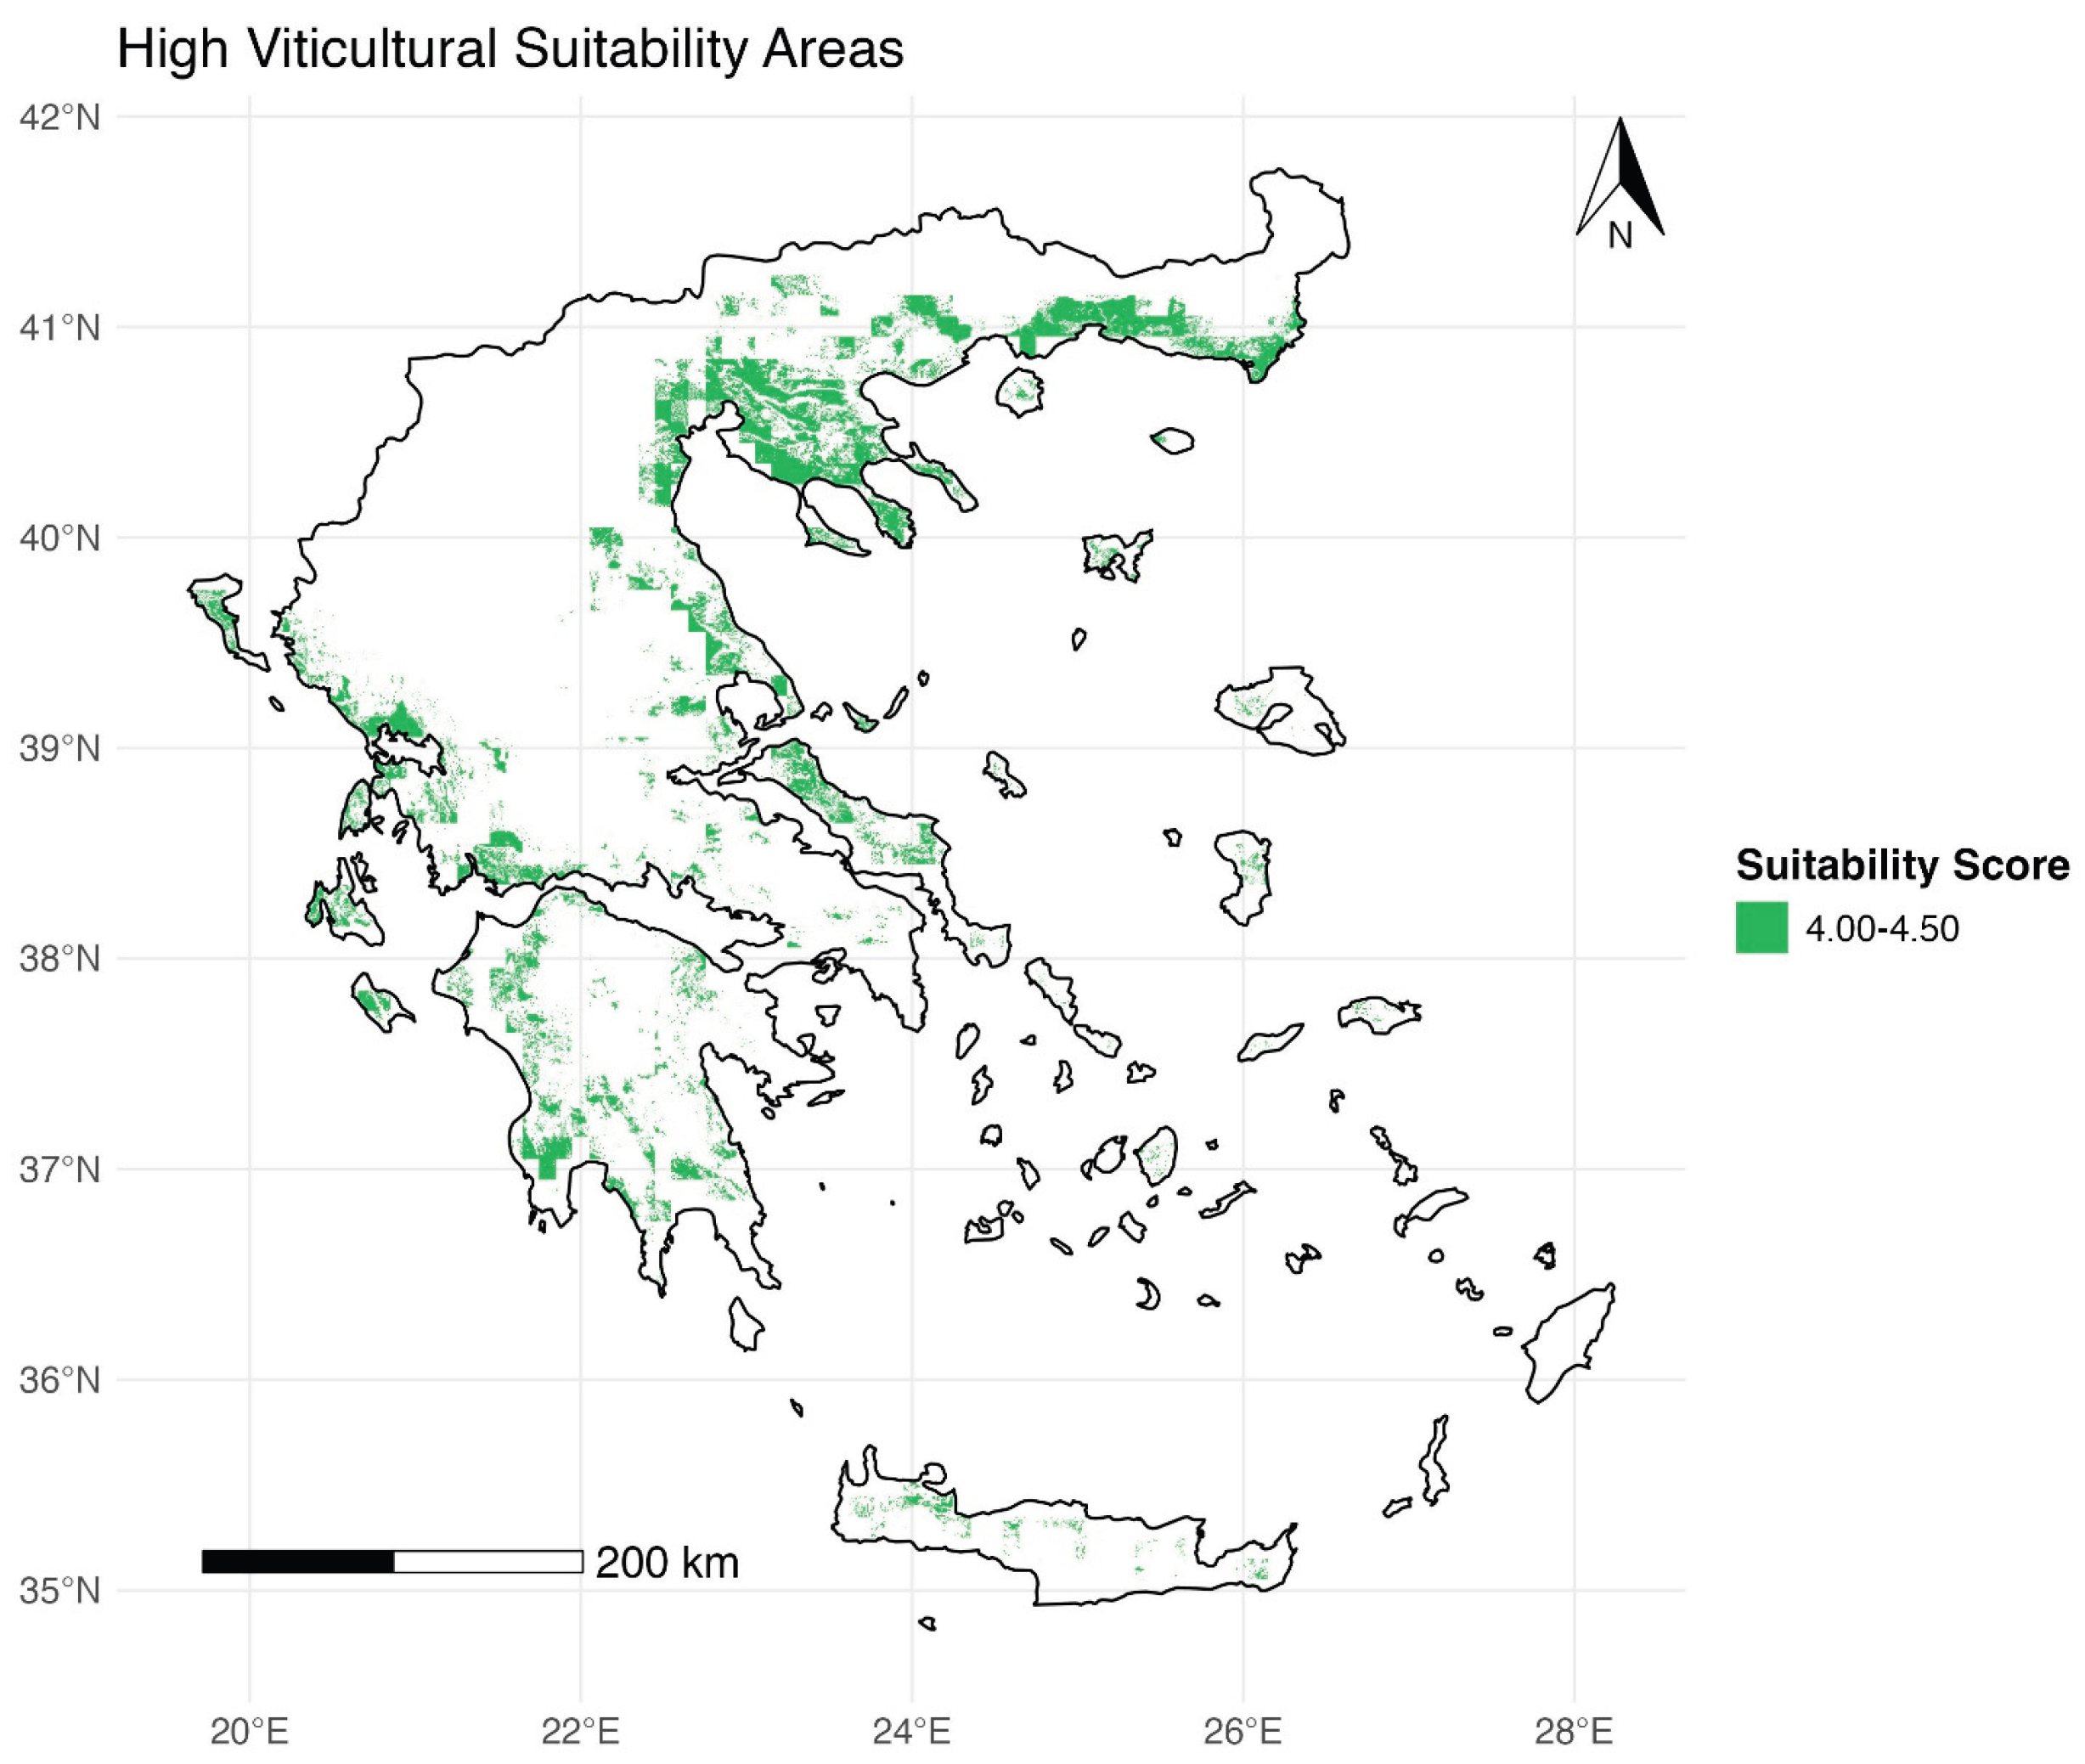
Figure 20.
Mean suitability score per district.
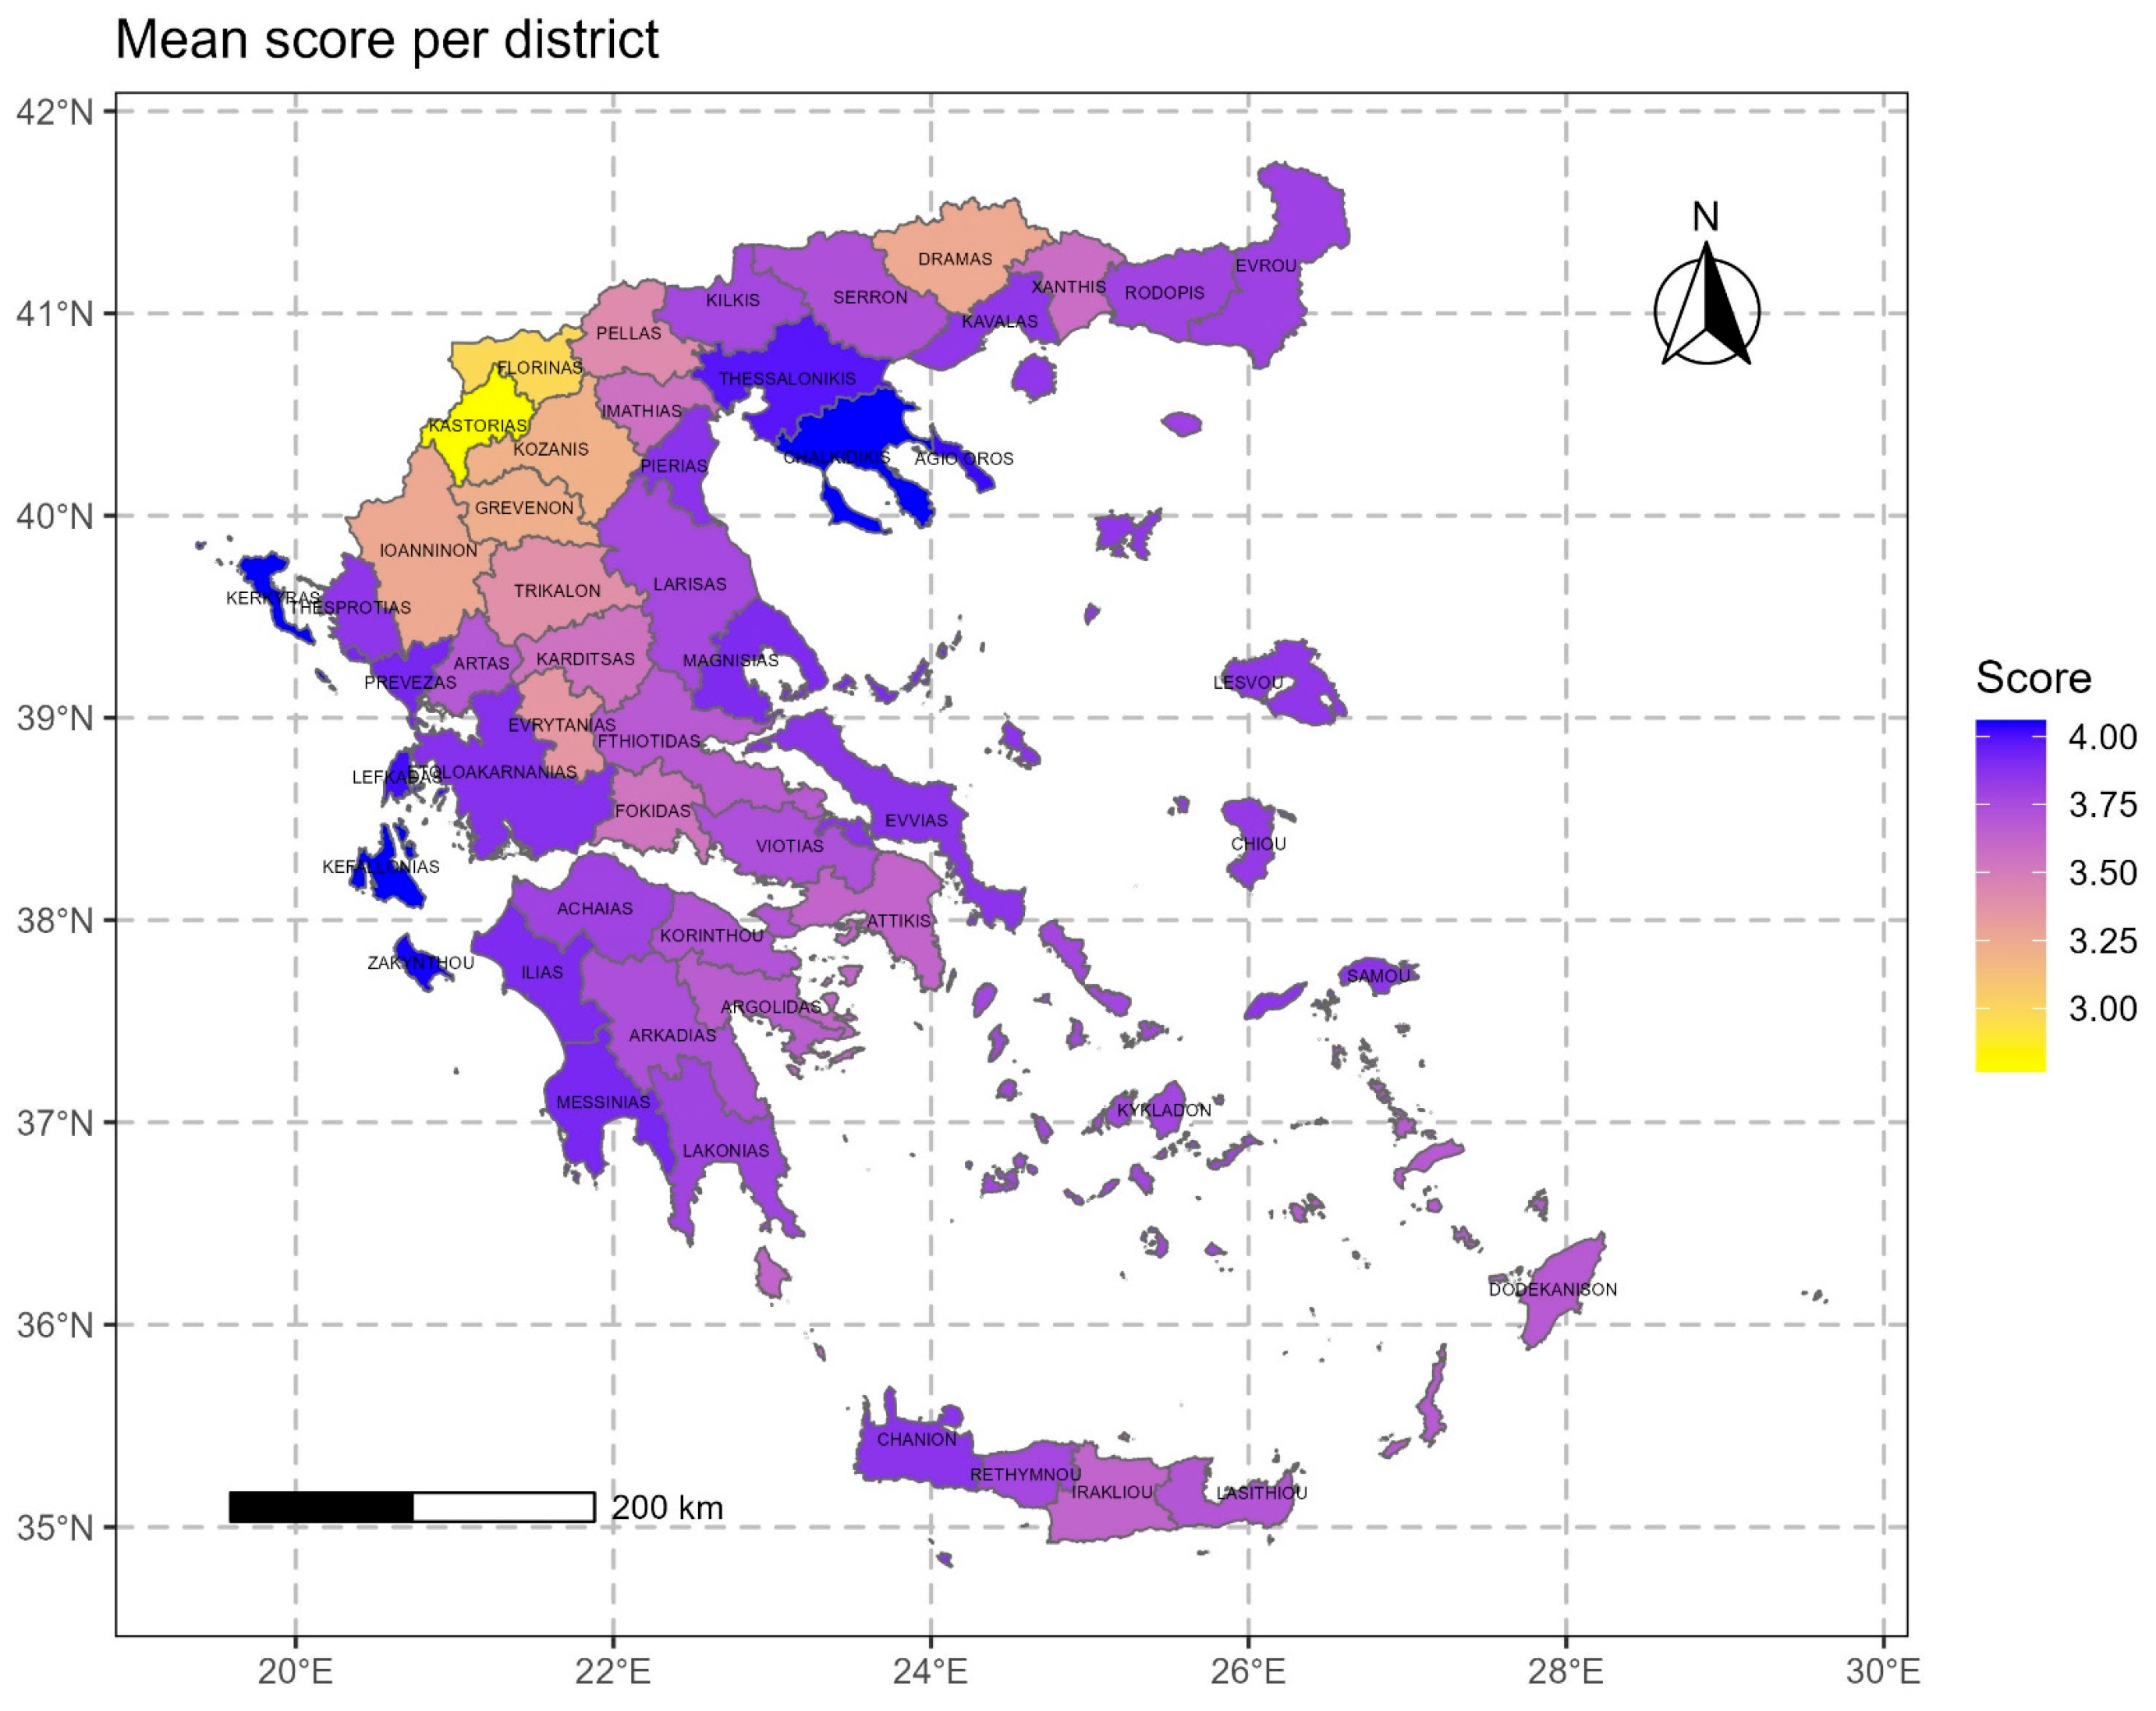
Figure 21.
Mean suitability score per district over vines according to CLC (grey areas indicate absence of suitability).
Figure 21.
Mean suitability score per district over vines according to CLC (grey areas indicate absence of suitability).
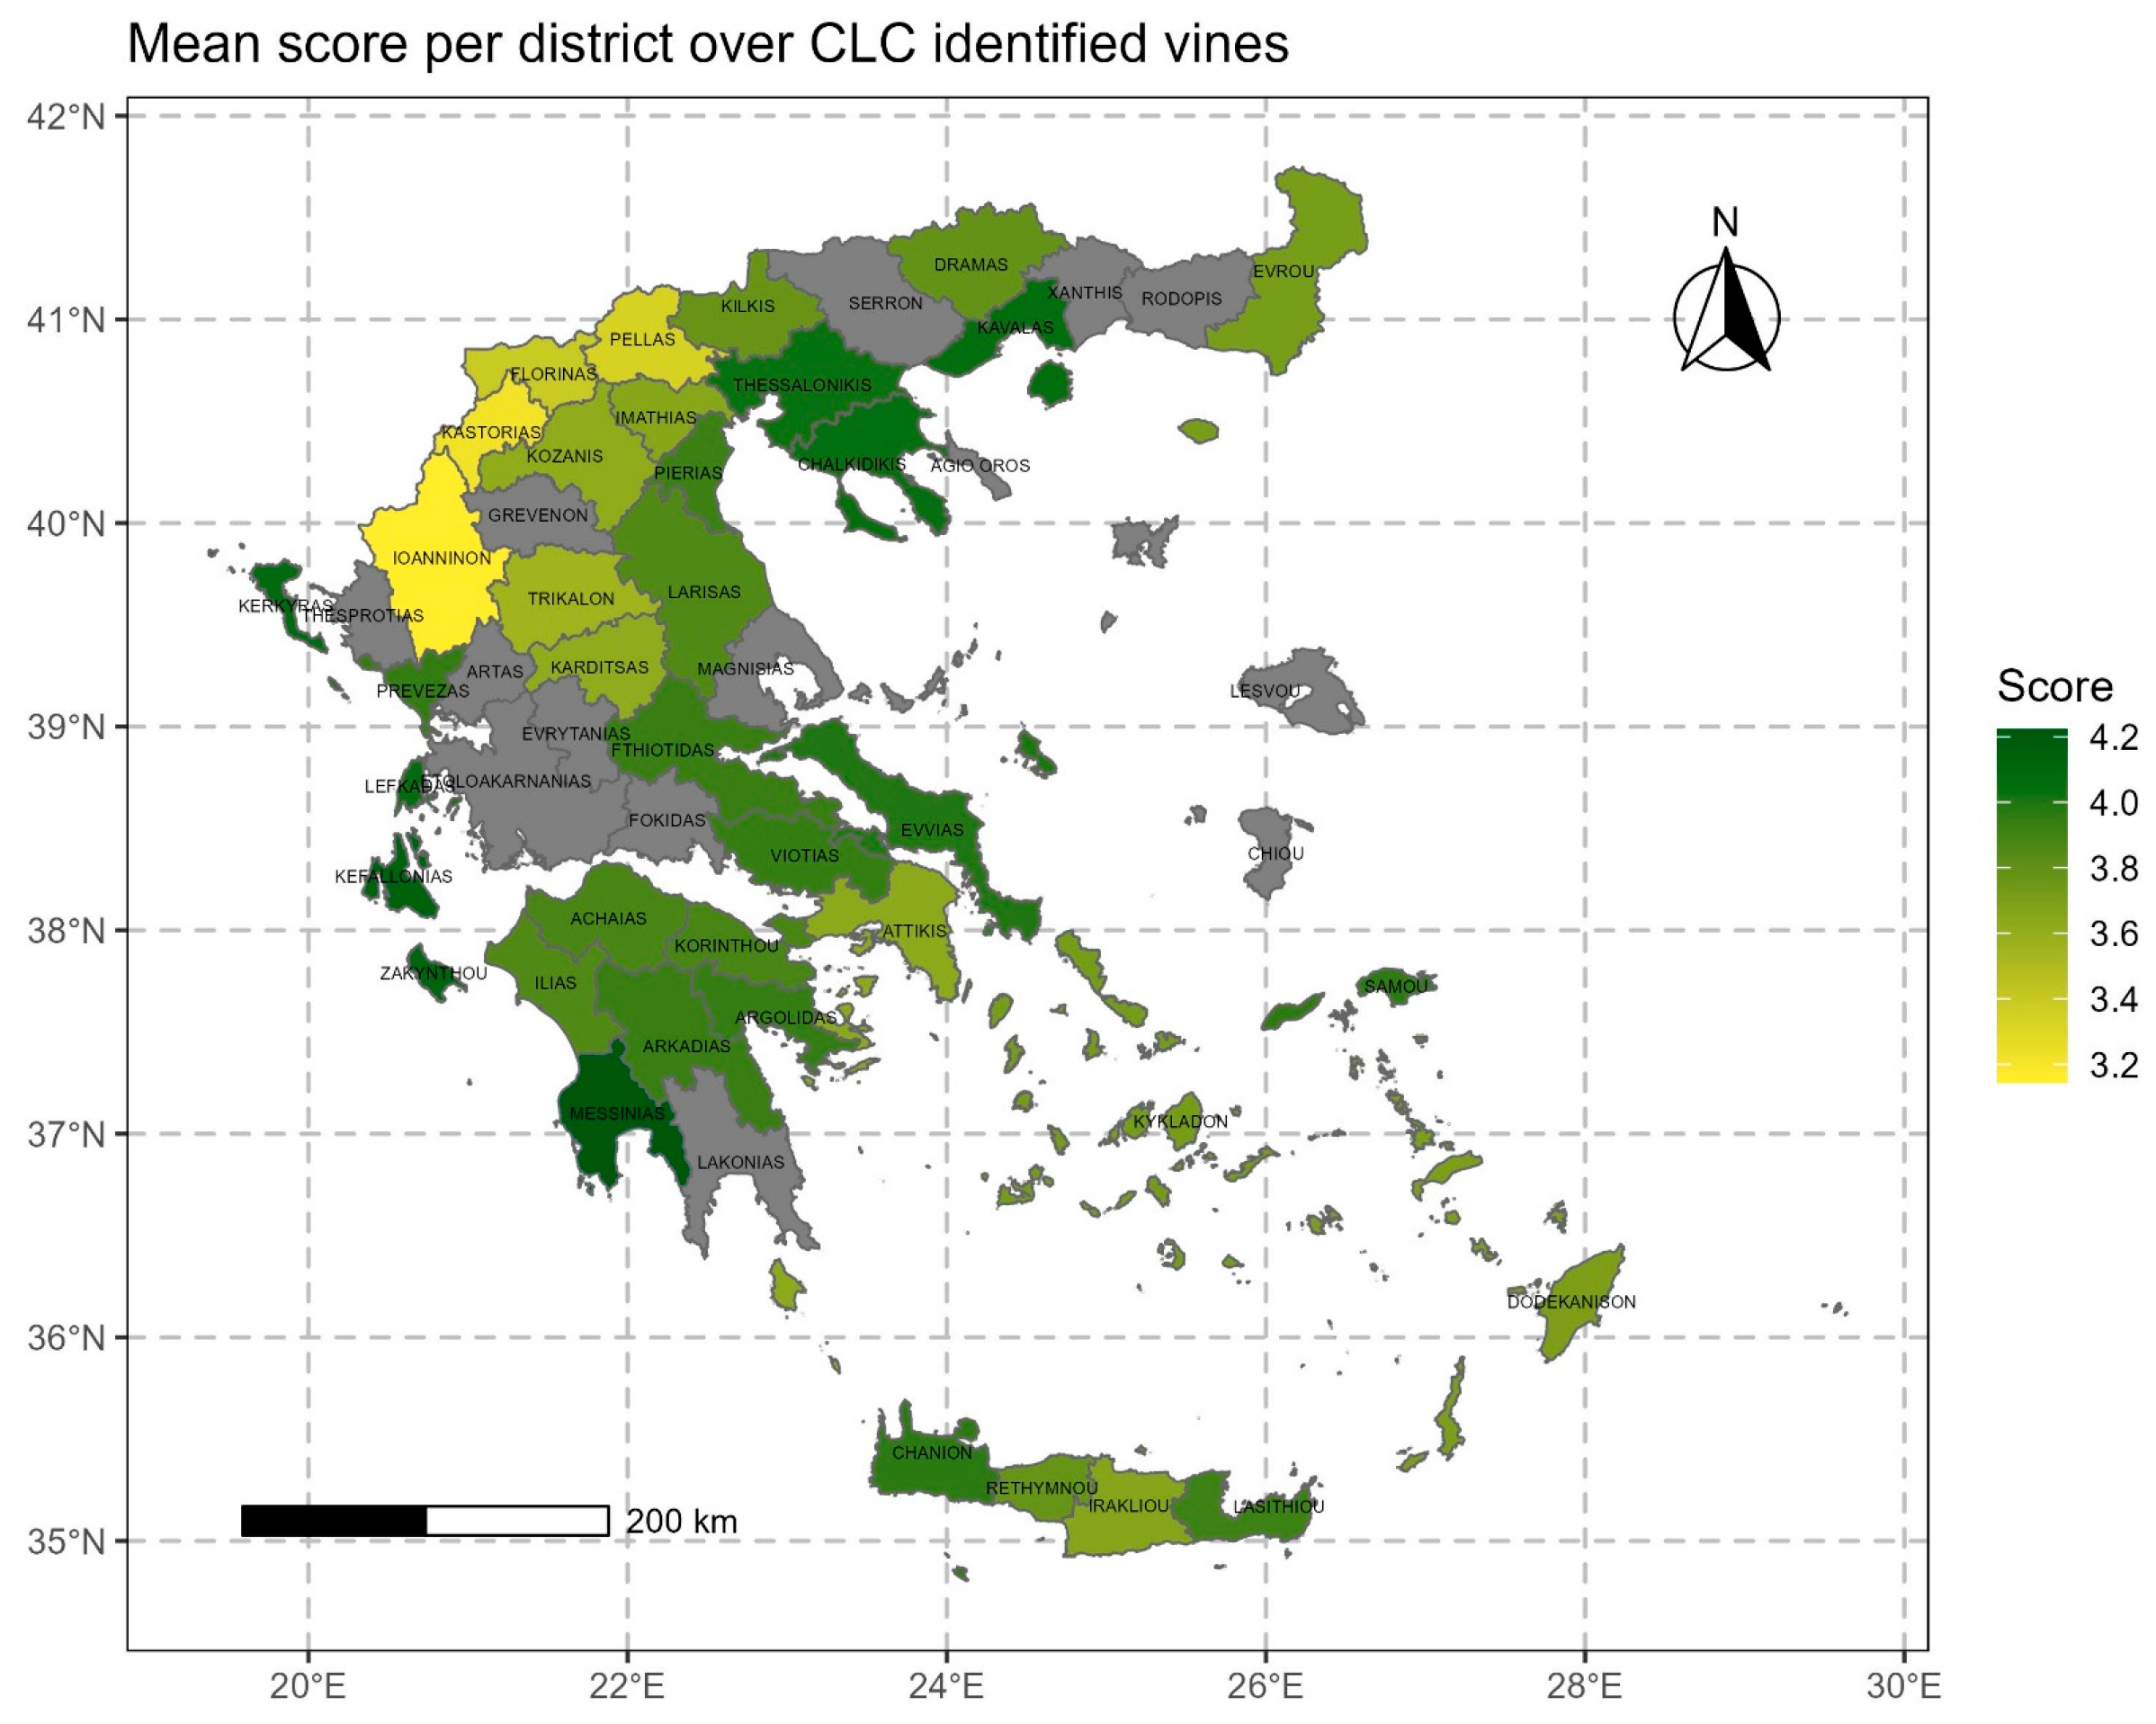
Figure 22.
The positions of the false negative positions (red).
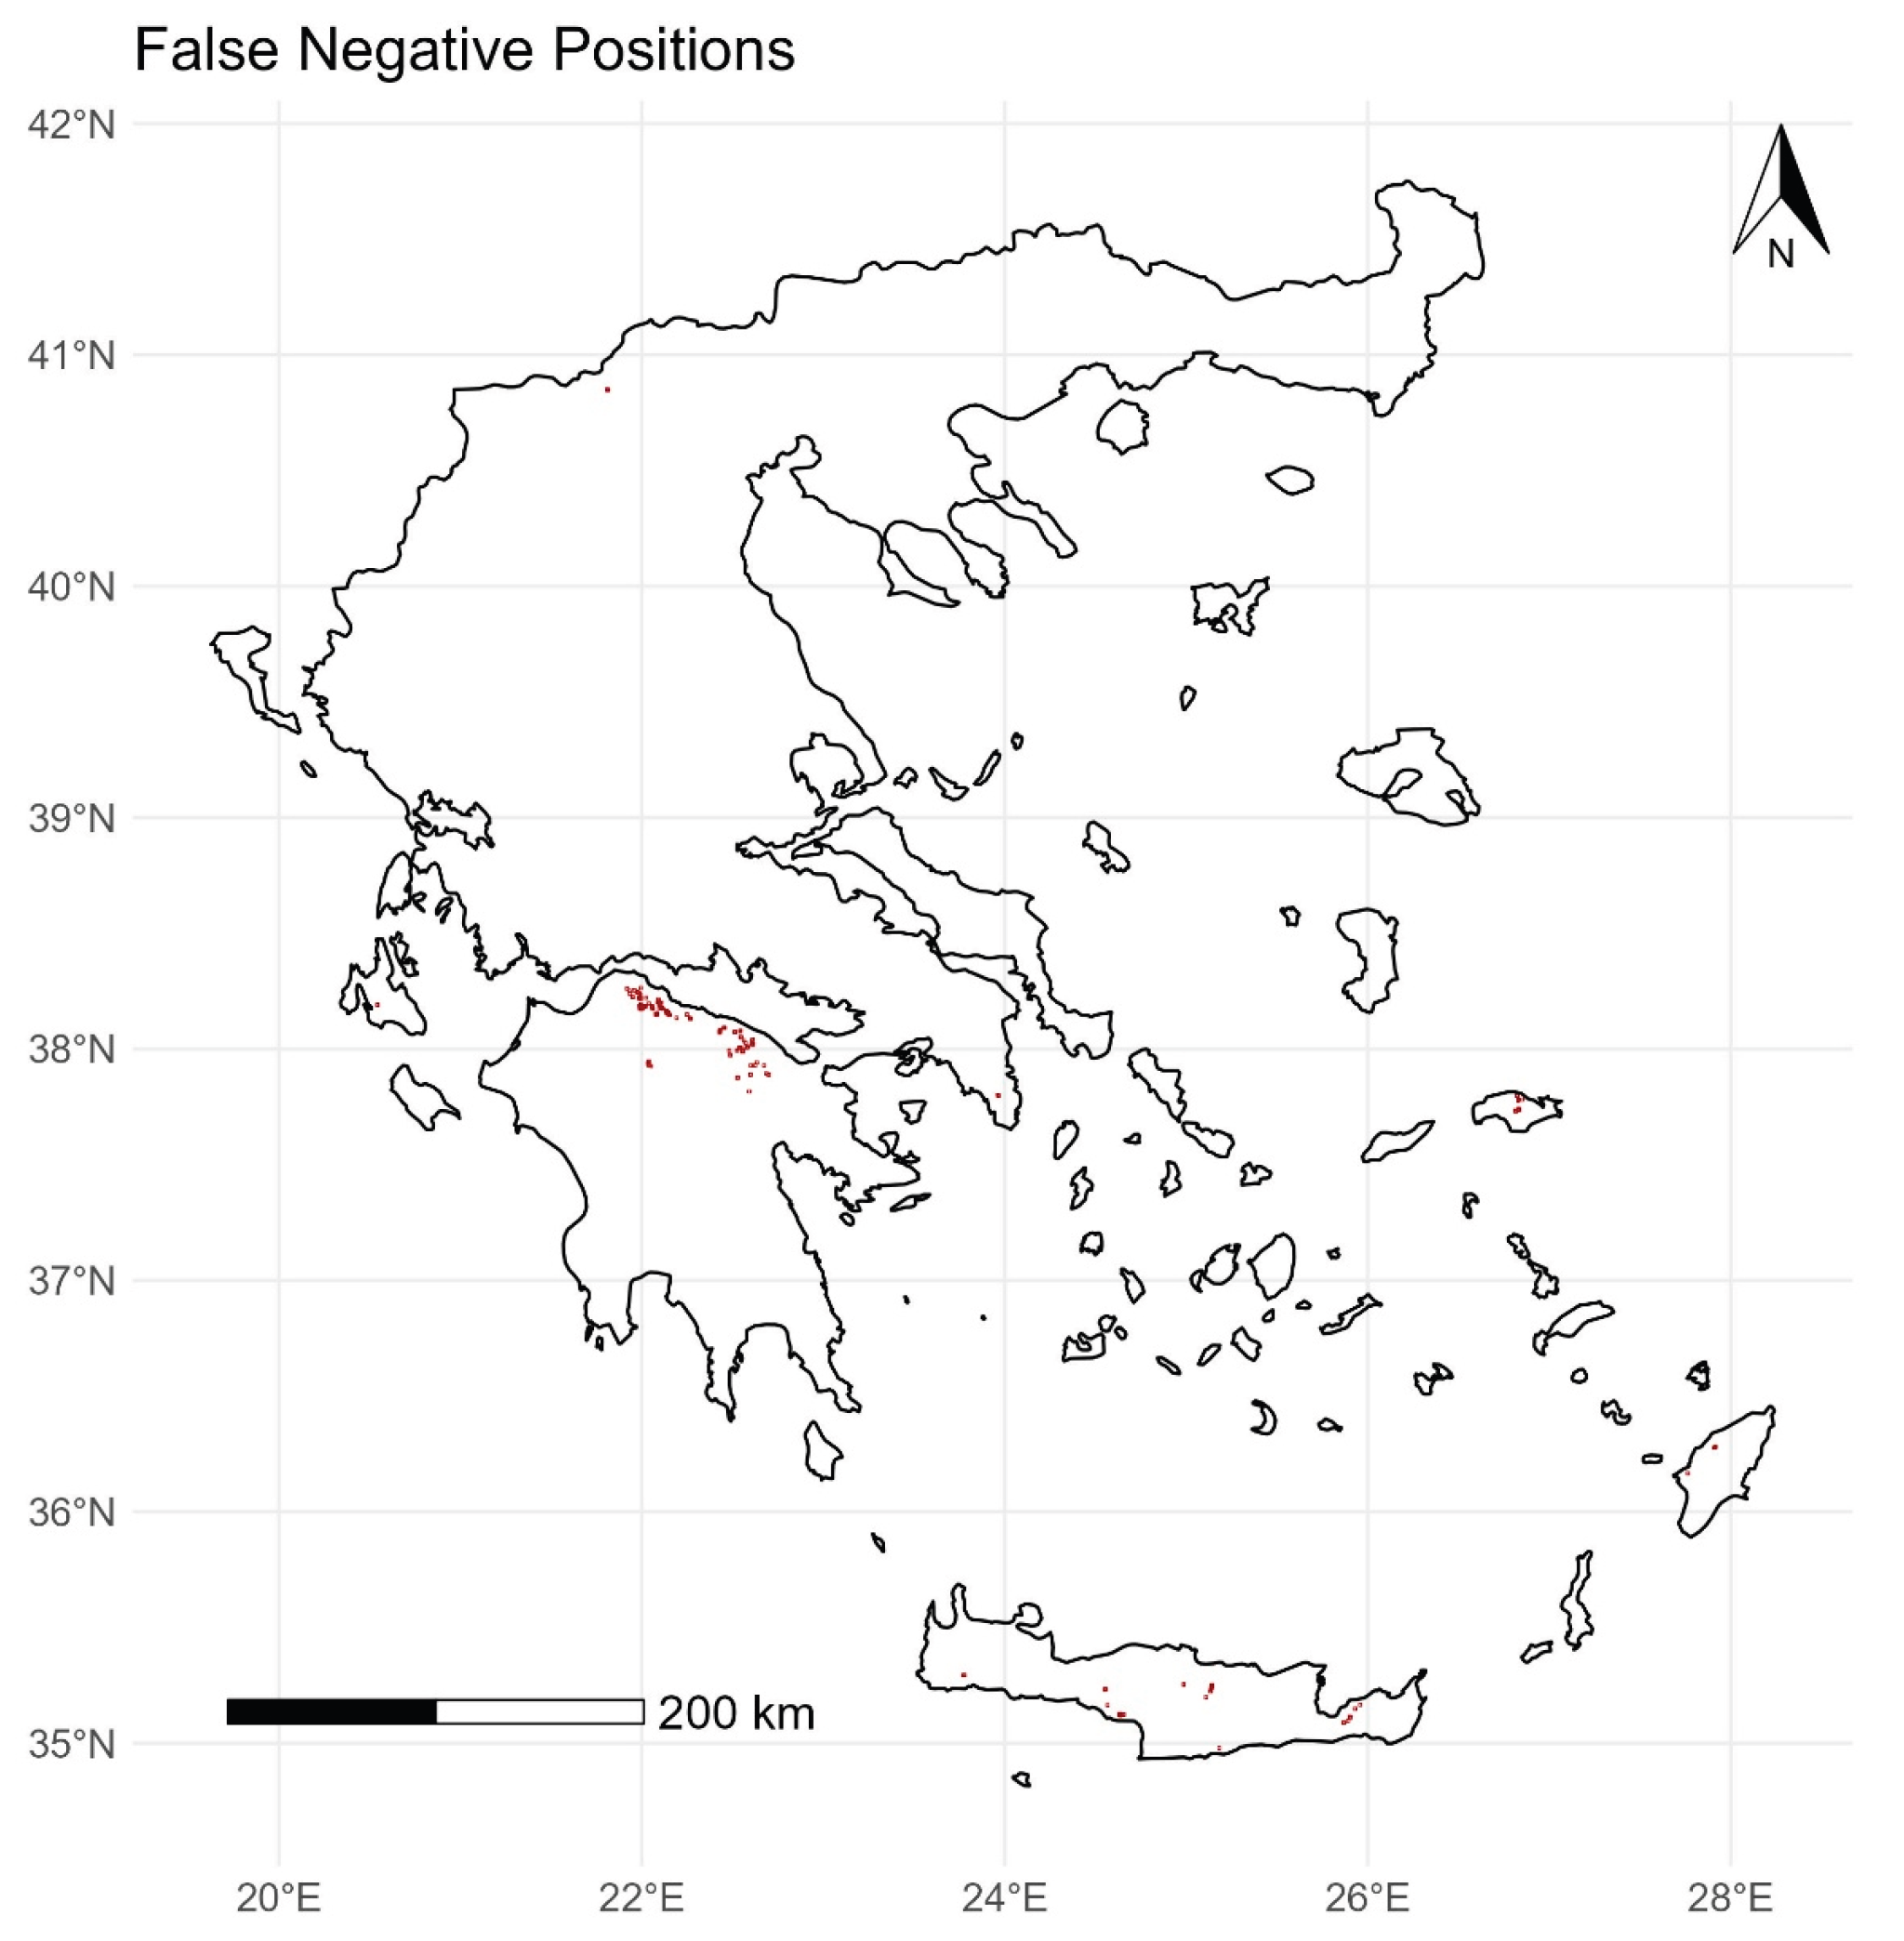

Table 1.
The percentage of Greece's surface covered by each climatic suitability score.
| Climatic Suitability Score | Area Covered (%) |
|---|---|
| 0 | 1.6 |
| 1.5-2.0 | 0.3 |
| 2.0-2.5 | 3.7 |
| 2.5-3.0 | 8.2 |
| 3.0-3.5 | 18.2 |
| 3.5-4.0 | 55.1 |
| 4.0-4.5 | 12.9 |
Table 2.
The percentage of total suitability score for Greece and the identified vine areas according to CLC.
Table 2.
The percentage of total suitability score for Greece and the identified vine areas according to CLC.
| Total Suitability Score | Total Greece Area (%) | Over CLC Areas (%) |
|---|---|---|
| 0 | 16.1 | 1.5 |
| 1.5-2.0 | 0.0 | 0.0 |
| 2.0-2.5 | 1.5 | 0.0 |
| 2.5-3.0 | 5.4 | 0.7 |
| 3.0-3.5 | 13.2 | 9.9 |
| 3.5-4.0 | 50.9 | 68.4 |
| 4.0-4.5 | 12.9 | 19.5 |
Disclaimer/Publisher’s Note: The statements, opinions and data contained in all publications are solely those of the individual author(s) and contributor(s) and not of MDPI and/or the editor(s). MDPI and/or the editor(s) disclaim responsibility for any injury to people or property resulting from any ideas, methods, instructions or products referred to in the content. |
© 2026 by the authors. Licensee MDPI, Basel, Switzerland. This article is an open access article distributed under the terms and conditions of the Creative Commons Attribution (CC BY) license (http://creativecommons.org/licenses/by/4.0/).
Copyright: This open access article is published under a Creative Commons CC BY 4.0 license, which permit the free download, distribution, and reuse, provided that the author and preprint are cited in any reuse.


