
Submitted:
21 January 2026
Posted:
21 January 2026
You are already at the latest version
Abstract
As dockless bike-sharing systems rapidly expanded across China, scholars have increasingly examined bicycle usage efficiency across locations and its relationship to the geographical environment. Existing studies rely primarily on big data to evaluate location-specific efficiency using Time-to-Booking (ToB)—the idle duration before a bicycle is rented at a given location. This indicator, however, ignores network flow effects: bicycles departing from the same location may reach destinations with vastly different ToB values. This gap is addressed by incorporating the destination ToB after each trip, developing a flow-integrated ToB index for central Beijing. Analysis reveals that the improved index exhibits significant spatial heterogeneity while maintaining the overall distribution pattern of the original metric, indicating that most bicycles flow to areas with efficiency similar to that of their origin. The flow-integrated index compresses the efficiency range—maximum values decrease, minimum values increase—suggesting greater spatial balance in usage efficiency. Bicycles in the city center consistently show higher usage efficiency than those in peripheral areas. Multiple factors influence usage efficiency with significant spatial heterogeneity. Understanding of bike-sharing efficiency is advanced, and practical insights are provided for operators and urban planners in developing refined management strategies.
Keywords:
dockless bike-sharing
; usage efficiency
; built environment
; GWR
1. Introduction
Bike-sharing is an environmentally friendly and active transportation mode that has attracted considerable attention and experienced rapid global expansion [1,2]. Among its various forms, dockless bike-sharing (DBS) systems are noted for their convenience, allowing users to pick up and return bicycles at any suitable location within the service area [3]. Many Chinese cities have deployed DBS to meet short-distance mobility needs and bridge the first-and-last-mile gap in public transit networks, given its flexibility, convenience, and low-carbon benefits [4,5,6,7]. Consequently, DBS has become especially prevalent in densely populated urban areas across China [8].
With the widespread adoption of bike-sharing systems, research on this topic has expanded considerably. Existing literature has extensively examined various dimensions, including ridership patterns [9], demand forecasting [10], integration with public transit [11], and spatiotemporal usage characteristics [12]. However, improving usage efficiency remains a critical operational challenge, especially in contexts such as China where most bike-sharing systems are run by private enterprises and commercial viability depends on sustainable operation. Research focusing specifically on efficiency is still limited. Although a small number of studies have adopted the Time-to-Booking (ToB) metric to assess operational efficiency and have explored its distribution and explanatory factors [13,14], such indicators are largely designed from a local, static perspective. Therefore, further investigation into the spatiotemporal patterns of usage efficiency from a network-flow perspective is needed to address operational challenges.
This study aims to explore the spatial distribution of bike-sharing usage efficiency and its influencing factors, taking Beijing as an empirical case. While prior research has adopted the Time-to-Booking (ToB) to evaluate usage efficiency from a static, location-based perspective [13], this study will develop a flow-integrated index that incorporates waiting times at both trip origins and destinations. To examine the effects of built-environment and demographic factors, this study applies geographically weighted regression (GWR), which is increasingly employed in spatially sensitive transportation studies to account for local heterogeneity.
The remainder of this paper is structured as follows. Section 2 reviews the literature on bike-sharing usage efficiency and its influencing factors. Section 3 introduces the study area and data sources, and outlines the methodological approach. Section 4 presents the results, analyzing the spatial distribution of usage efficiency and its relationship with various determinants. Finally, Section 5 provides a discussion of the findings, summarizes the key conclusions, and offers practical recommendations for management and planning.
2. Literature Review
Existing research on bike-sharing has largely focused on usage patterns and their determinants. Studies have examined spatial and temporal usage characteristics, revealing daily dynamics and typical trip distance-duration distributions [15]. External shocks such as the COVID-19 pandemic have also been shown to reshape usage patterns, affecting trip volume and duration [16]. In terms of influencing factors, researchers have employed diverse approaches to explain variations in usage efficiency and mobility patterns. For example, Shen et al. [17] applied spatial autoregressive models to analyze the impacts of fleet size, infrastructure, and weather, while Zheng et al. [18] highlighted the role of traffic conditions and site type. Overall, bike-sharing usage exhibits considerable spatial-temporal complexity, with built environment factors often demonstrating nonlinear effects, threshold behaviors, and context-dependent operational ranges [19].
Subsequent studies have explored more granular usage patterns, particularly their distribution over time and space. For instance, Gao et al. [20] identified spatial variations in the distance decay of dockless bike-sharing trips across Shanghai. Xu et al. [21] integrated dockless bike-sharing data with POI information to uncover daily activity patterns in Beijing, noting that cycling peaks align with subway schedules and that modal transfer is a primary trip purpose. Cheng et al. [22] compared station-based and dockless systems, finding that station-based usage is mainly demand-driven, whereas dockless usage is more sensitive to efficiency considerations. Other work has focused on specific behavioral scenarios, such as improper parking [23] or the operational dynamics of bike-to-bus and bike-to-metro integration [24]. The latter topic has attracted particular attention: studies have examined how bike-sharing extends metro catchment areas [25], how the built environment affects bike-metro connectivity [11,26], and how transfer distances vary spatially [27]. Wu et al. [28] further refined measures of cycling accessibility around metro stations by accounting for competition between cycling and walking in short-range transfers.
Methodologically, advances in information technology have enabled more refined and visual analytics in bike-sharing research. Geographic Information Systems (GIS) have been widely used to incorporate spatial attributes, while increasingly advanced modeling techniques address the complexity of these systems. Examples include geographically weighted regression combined with machine learning algorithms to capture spatially varying relationships [29], explainable AI for demand prediction [30], and a range of statistical models—from discrete choice and OLS to GWR, SGWR, and generalized additive mixture models—that account for spatial heterogeneity and improve analytical accuracy.
Compared with station-based systems, dockless bike-sharing offers greater flexibility but also introduces issues on usage imbalances and inefficiencies [31,32], prompting extensive research on efficiency evaluation and rebalancing strategies [33,34,35,36]. The existing literature has developed various metrics for evaluating bike-sharing efficiency. Compared to basic measures such as usage frequency or ride duration, time-based indicators like Time-to-Booking (ToB), defined as the idle duration between consecutive trips of a bicycle, offer a more direct reflection of operational intensity and local supply–demand dynamics [13,14]. Other time-sensitive metrics have also been proposed, and their influencing factors have been examined. For example, Fu et al. [37] extended the analytical framework by incorporating ride duration into a survival model to identify usage heterogeneity, while Shi et al. [38] introduced the non-operating rate (NOR), defined as the ratio of idle-to-usage time, to quantify system-level idleness in electric bike-sharing. While ToB effectively captures waiting time before reuse, existing studies have focused on idle duration at trip origins, without accounting for the complete trip flow, while the waiting time at the destinations may be quite different. Thus, there is a need to further develop the ToB indicator from a flow perspective.
3. Study Area and Datasets
As China's national capital and a megacity, Beijing has seen extensive adoption of bike-sharing. This study focuses on its central urban area—a densely populated and well-connected region encompassing six districts (Dongcheng, Xicheng, Chaoyang, Haidian, Fengtai, and Shijingshan) and covering approximately 1,378 km². For analytical purposes, the area was divided into a grid with a spatial resolution of 0.01° (about 1 km²; see Figure 1), a scale commonly employed in urban mobility studies to balance spatial detail and analytical tractability [13].
This study utilizes large-scale trip data provided by Meituan Bike (formerly Mobike Beijing). The Beijing dataset has 103,583,313 trip records across 338,446 bicycles over a one-week period from July 1 to July 7, 2022. Each trip record includes the bicycle ID, district, county, start and end timestamps, and the corresponding latitude and longitude coordinates. Representative examples of the data are presented in Table 1. A preliminary analysis of the bike-sharing dataset was conducted to inform preprocessing parameters and procedures. The results showed that the vast majority of trips (95.95%) covered distances of 0–5 km, and 88.19% lasted 0–20 minutes, which aligns with previous findings indicating that bike-sharing primarily serves short-distance travel. To remove erroneous records resulting from GPS anomalies or improper user operations, trips with distances shorter than 100 m or longer than 30 km, and durations shorter than 2 minutes or exceeding 120 minutes were excluded [22,39]. Furthermore, weekdays were selected for analysis to capture routine usage patterns and minimize fluctuations due to holidays or special events.
Demographic, road network, and Point of Interest (POI) data were integrated to comprehensively analyze factors influencing bike-sharing usage efficiency. Population distribution data were sourced from LandScan, which provides raster-based estimates of population density at the grid level. Road network data were obtained from OpenStreetMap (OSM) to capture the urban transportation structure, including road types, lengths, and intersection density—key factors affecting mobility and accessibility. POI data were acquired from Amap (Gaode Maps), with each record containing the name, address, category, and geographic coordinates. The dataset covers 14 major categories such as Dining, Science & Education, and Shopping; the detailed classification and distribution are summarized in Table 2. To quantify land-use diversity, a POI Mixing Entropy index was constructed. Given the functional similarity among urban activities, the original 14 POI categories were reclassified into five functional zones: Residential (Business & Residential), Public Services (Medical, Life Services, Science & Education), Transport, Work (Companies), and Commercial Services (Dining, Shopping, Leisure, Sports, Hotels, Finance). The POI Mixing Entropy (H) was then calculated using the Shannon Entropy formula:
where n represents the number of functional types (n=5), and denotes the proportion of the i-th POI type within the grid cell. Higher H values indicate a more balanced functional mix.
4. Method
4.1. Measuring Bike-Sharing Usage Efficiency
Bike-sharing usage efficiency in each analytical unit was quantified using the average Time-to-Booking (ToB) indi cator. Time-to-Booking (ToB) is defined as the idle duration between consecutive rentals of the same bicycle [40]. Following its definition, continuous trip sequences for each bicycle were constructed by grouping trips by bicycle ID and sorting them by departure timestamp. To exclude distortions from non-user activities such as operator repositioning and data gaps, relocation distance was considered: only trips with an origin within 50 meters of the previous trip’s destination were retained [13]. ToB for each trip was calculated as:
where refers to the departure time of a particular trip and refers to the end time of the same bicycle's previous trip. Generally, lower ToB implies higher usage efficiency.
However, the conventional ToB metric has a key limitation: it evaluates efficiency only at the trip origin, without accounting for subsequent bicycle flows. For instance, an area may exhibit a low ToB (high local efficiency), but if bicycles rented there flow into areas with substantially higher ToB and remain idle, overall system efficiency is compromised.
To address this limitation, we propose a Flow-Weighted Time-to-Booking (FwToB) metric. It incorporates not only the idle time before a rental but also the usage efficiency expected at the destination. The formula is defined as:
where is the idle time before trip i, is the average ToB at the destination zone of trip i. By capturing the dynamic interaction and flow efficiency between areas, FwToB provides a more systemic perspective for evaluating network-wide performance and informing rebalancing strategies.
4.2. Exploring Influences on Usage Efficiency
To investigate the factors influencing shared-bicycle usage efficiency, this study applies two statistical modeling approaches: Ordinary Least Squares (OLS) regression and Geographically Weighted Regression (GWR). The OLS model provides a global assessment of variable relationships, while the GWR framework accounts for potential spatial non-stationarity—where the strength or direction of relationships may vary across geographic space. By comparing and integrating results from both methods, key explanatory variables can be robustly identified and their spatial variability systematically evaluated.
Ordinary Least Squares regression estimates parameters by minimizing the sum of squared residuals. Its core as sumption is that each independent variable exerts a uniform effect on the dependent variable throughout the study area, offering a generalized, global analytical perspective. The OLS model is expressed as:
where represents the number of explanatory variables, denotes the dependent variable, is the regression co efficient for variable i (spatially constant), is the intercept, and denotes the random error term.
This study further employs Geographically Weighted Regression (GWR) to address spatial non-stationarity, given that the effects of environmental variables often exhibit substantial heterogeneity across geographic space. In contrast to global regression models, GWR allows regression coefficients to vary locally by calibrating a distinct model at each observation location. This approach captures how the relationships between variables may differ from one place to another [41]. By incorporating spatial weighting based on geographic proximity, the method ensures that nearby observations exert a stronger influence on local parameter estimates, thereby more accurately reflecting context-specific patterns in the data. The GWR model is expressed as:
where represents the number of explanatory variables, denotes the value of the i-th explanatory variable at lo cation j, denotes the dependent variable, represents the coordinates of location j, is the location-specific intercept, is the location-specific regression coefficient for variable i, and is the random error term.
In contrast to the OLS model, the GWR model enables an examination of whether and how the effects of various factors on bike-sharing usage efficiency vary across geographic space, as well as how such spatial heterogeneity is distributed [41,42]. The optimal bandwidth for the GWR estimation was determined by minimizing the corrected Akaike Information Criterion (AICc) with an adaptive bisquare kernel function. By analyzing the GWR results, we can not only identify statistically significant influencing factors but also discern how the magnitude and direction of their effects differ across regions, thereby supporting more targeted recommendations for regional planning and management.
To investigate how built environment and demographic characteristics influence bike-sharing usage efficiency, explanatory variables were selected following the 5D built environment framework—density, diversity, design, destination accessibility, and distance to transit [43]. Based on this framework and while controlling for covariance, 12 variables were retained for analysis. The improved usage efficiency index serves as the dependent variable. All selected explanatory variables are summarized in Table 3.
Data standardization is essential in regression analysis, enabling faster convergence, more stable results, and more reliable coefficients [44]. Variables of different magnitudes and units were standardized using the following formula:
where and represent the standardized and original values of variable i at location j, respectively, and and represent the maximum and minimum values of variable i across all locations.
5. Results
5.1. Usage Efficiency
Based on the usage and idle records derived from shared-bicycle trajectory data, this study calculated the vehicle waiting time for each trip, thereby obtaining the distribution of ToB across all orders, as illustrated in Figure 2. The distribution exhibits a pronounced long-tailed characteristic, with a substantial discrepancy between the mean and the median values. The mean ToB for all orders is 201.18 minutes, whereas the median is only 33.25 minutes. The mean value, reflecting the expected utilization rate of shared bicycles within each grid, offers operators more actionable insights for operational benefits compared to the median.
Based on the ToB values of individual trips, this study calculated the average ToB for all bicycle orders within each grid cell. This indicator reflects the average parking duration of bicycles before their next rental in a given area and serves as a key measure of usage efficiency. Figure 3 presents the spatial distribution of bike-sharing usage efficiency derived from this index. Usage efficiency exhibits significant spatial heterogeneity across the study area. Descriptive statistics reveal a considerable range, with a maximum value of 619 minutes, a minimum of 50 minutes, a mean of 224 minutes, and a standard deviation of 96 minutes. This wide variation underscores that bike-sharing usage is strongly influenced by localized geographic contexts. Spatially, a clear core-periphery pattern emerges, that is, usage efficiency is generally higher in the city center and lower in outlying zones. Specifically, higher efficiency is observed within the belt between the East 2nd Ring Road and the East 4th Ring Road, the corridor from the West 2nd Ring Road to the West 3rd Ring Road, as well as in parts of the southwest, west, northwest, and northeast. In contrast, scattered grids in the urban periphery, particularly outside the 4th Ring Road, show lower efficiency, indicating areas where bicycles remain idle for extended periods.
Figure 4 shows the distribution of FwToB at the scale of grid cells. The spatial pattern observed in Figure 4 is similar to that of the original ToB in Figure 3, both exhibiting higher usage efficiency in the city center and lower efficiency in peripheral areas. Figure 5 presents a comparison between the two measures for each grid, further confirming the consistency in their spatial patterns. The values show a strong linear correlation in Figure 5. This high degree of similarity in both spatial pattern and numerical values indicates that most bicycles flow to areas with efficiency levels similar to their origins, which is also related to the prevalence of round-trip patterns in user behavior.
5.2. Influencing Factors
Based on the ordinary least squares (OLS) regression results, the effects of each independent variable on bike-sharing usage efficiency were analyzed for central Beijing. The model's adjusted R² is 0.317, indicating that it explains approximately 31.7% of usage efficiency variation. Several variables show statistical significance, revealing the specific impacts of different factors on usage efficiency.
Univariate spatial autocorrelation of the improved ToB was measured using GeoDa. Moran's I was 0.585 (z-score=21.7056, p=0.001), confirming significant spatial autocorrelation in the variable. Since spatial autocorrelation violates the assumption of independent observations in OLS regression and the model inadequately accounts for spatial heterogeneity, geographically weighted regression (GWR) was applied to further explore spatial differentiation in bike-sharing usage efficiency and the spatially varying influence mechanisms of independent variables.
Table 4 compares the performance of the OLS and GWR models and presents the regression coefficients. The GWR model's R² and adjusted R² are 0.511 and 0.444, respectively, substantially higher than those of the OLS model (0.330 and 0.317). The GWR model's AICc is 1553, decreased from the OLS model (AICc=1613), and residual sum of squares is reduced from 433.459 to 261.229, indicating superior explanatory power and model fit. Residual distributions all fall within ±2.5, indicating small differences between predicted and actual values across the study area. Descriptive statistics for GWR regression coefficients show spatial trends in sign and magnitude for different variables. For example, population density exhibits relatively large standard deviation (0.193), with coefficients ranging from -0.669 to 0.259, indicating that its effect on usage efficiency varies substantially in both magnitude and direction across regions. Transport facilities show consistently negative effects across all locations (range: -0.571 to -0.003), suggesting that increased transport facility counts universally improve bike-sharing efficiency. Distance to nearest metro station shows predominantly positive effects (range: -0.115 to 0.410), indicating that greater distances generally decrease usage efficiency, though spatial variation exists.
For road network design variables, main road length shows positive impacts in the eastern and western study area but negative impacts in the central and southern portions where road network connectivity is better, suggesting that an increase in main road length may promote rather than reduce efficient bike-sharing usage by improving traffic flow and regional accessibility. Bike lane length exhibits negative impacts in most regions, indicating that bike lane construction generally favors usage efficiency.
Variables representing the diversity dimension include industrial facility proportion and POI mixing entropy. In dustrial facility proportion shows positive impacts in the southwest and negative impacts in the southeast, possibly related to industrial zone types and characteristics. Areas with negative POI mixing entropy coefficients also exhibit low land use diversity, while those with positive coefficients generally have relatively diverse land use types, indicating that beyond a certain threshold, increased land use diversity may reduce bike-sharing utilization in the area.
In terms of facility accessibility, considering the number of medical institutions, parks and squares, shopping centers and transportation facilities in different areas, Table 4 shows that the average value of the coefficients is negative, indicating that overall, the increase in the number of these facilities is conducive to the improvement of bicycle usage efficiency. At the grid scale, the elevated number of medical facilities may cause a decrease in bicycle usage efficiency in the northern and western parts of the study area; parks and plazas in the southwestern part of the area may elevate the average vacancy time of shared bicycles in the area; and shopping centers may have some negative impact on bicycle usage efficiency in the western part of the study area. The increase in the number of transportation facilities may cause a decrease in bicycle usage efficiency in the central and southern portions of the study area. This may be because excessive transportation facilities increase the level of congestion in the area, thus affecting the mobility and accessibility of shared bicycles. For the distance to transit stations indicator, three indicators were selected, namely the number of bus stops, the number of metro stations, and the distance to the nearest metro station. It is worth noting that the average coefficients of these variables are positive. As the distance to the nearest subway station increases, the efficiency of bicycle use decreases in most areas of the study area, suggesting that the area around subway stations may be a more efficient area for the operation of shared bicycles, while in some areas within the East Second Ring Road, the proximity to the subway station may result in a decrease in the efficiency of the use of shared bicycles, probably because of the dense distribution of bicycles in the vicinity of the subway station in that area, where a large number of shared bicycles are stagnant. Except for a few areas, the increase in the number of buses brings about a decrease in the efficiency of shared bicycle use, and the effect of the number of metro stations shows an unevenness within the region, with an increase in the number of metro stations instead decreasing the efficiency of shared bicycle use in the eastern, northern, and southern parts of the study area. The possible reason for this is that the dense distribution of stations increases the tendency to choose public transportation over shared bikes and provides an alternative to walking to the nearest station rather than using shared bikes. In addition, there is a peak phenomenon of pedestrian flow around metro stations, which leads to rapid use and clustering of shared bikes in a short period of time, followed by prolonged parking around the stations, which in turn affects the efficiency of operation on an all-day scale.
Regarding facility accessibility, variables including counts of healthcare facilities, parks and squares, shopping centers, and transportation facilities across areas were analyzed. Table 4 shows that average coefficient values are negative, indicating that overall, increases in these facilities improve usage efficiency. At the grid scale, elevated healthcare facility counts may decrease usage efficiency in northern and western portions; parks and squares in the southwest may increase average bicycle idle time; and shopping centers may negatively impact usage efficiency in the west. Increased transportation facility counts may decrease usage efficiency in central and southern portions, possibly because excessive transportation facilities increase local congestion, thus affecting bike-sharing mobility and accessibility.
For distance to transit variables, three indicators were selected: bus stop count, metro station count, and distance to nearest metro station. Notably, these variables' average coefficients are positive. As distance to the nearest metro station increases, usage efficiency decreases in most areas, suggesting that areas around metro stations represent more efficient zones for bike-sharing operations. However, in some areas within the East 2nd Ring Road, proximity to metro stations may decrease usage efficiency, likely because dense bicycle distribution near metro stations in these areas causes large numbers of bikes to remain idle. Except in a few areas, increased bus stop counts decrease bike-sharing usage efficiency. Metro station count effects show spatial unevenness, with increased station counts instead decreasing usage efficiency in eastern, northern, and southern portions. Possible reasons include: dense station distribution increases the tendency to choose public transit over bike sharing and provides alternatives to walking to the nearest station rather than using bikes. Additionally, pedestrian flow peaks around metro stations lead to rapid bicycle usage and clustering in short periods, followed by prolonged parking around stations, which affects operational efficiency on a daily scale.
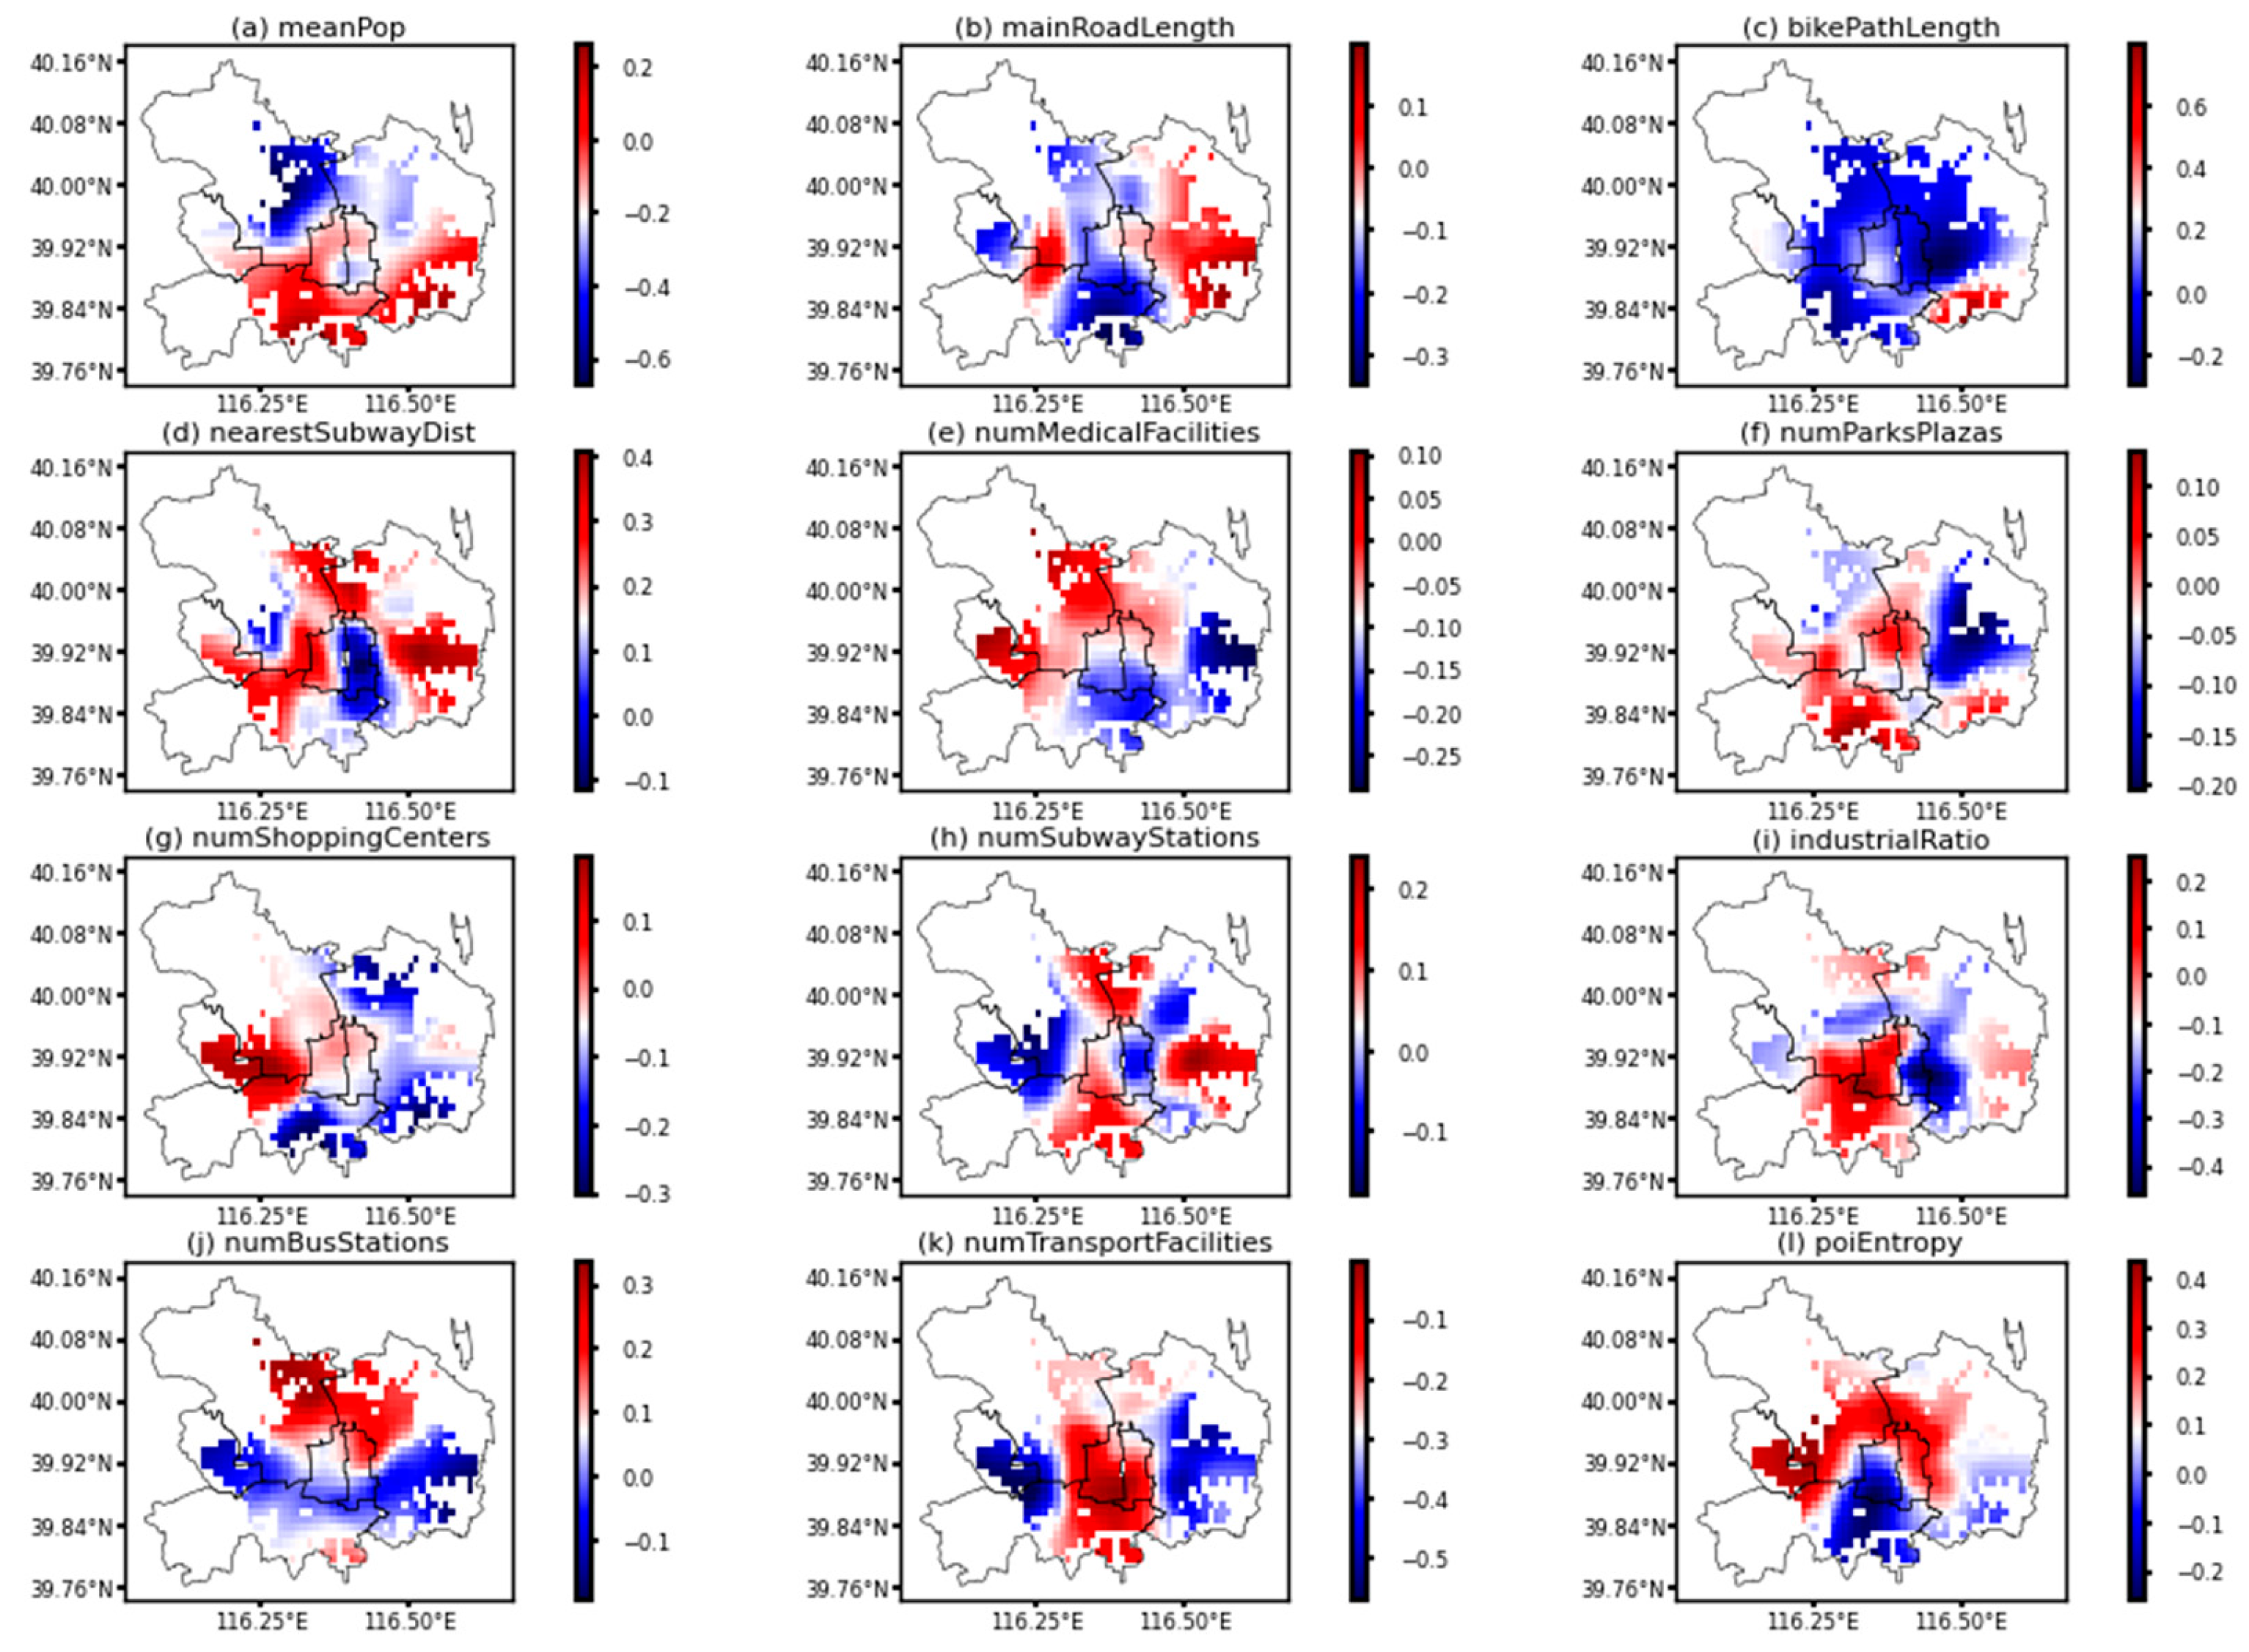
Figure 6.
Spatial Distribution of Estimated Coefficients for Different Variables (GWR).
6. Conclusions and Discussion
6.1. Conclusions
This study introduced a flow-weighted Time-to-Booking (FwToB) index that incorporates both origin and destination idle times to evaluate dockless bike-sharing usage efficiency in central Beijing. Compared to the conventional origin-based ToB metric, the FwToB provides a more systemic measure that better captures the impact of bicycle flows on operational efficiency, offering a refined tool for performance assessment and rebalancing strategy formulation.
Analysis using the FwToB index reveals a distinct core-periphery pattern in usage efficiency across the study area. Efficiency is consistently higher in the central urban districts—particularly within commercial hubs, major attractions, and neighborhoods with concentrated activity—while lower efficiency characterizes peripheral areas, especially those located beyond the 4th Ring Road.
The application of Geographically Weighted Regression (GWR) demonstrates significant spatial non-stationarity in the relationships between built environment factors and usage efficiency. While factors such as higher population density, greater numbers of healthcare and shopping facilities, and increased transport infrastructure generally promote higher efficiency, and greater distance to metro stations reduces it, the strength and even direction of these effects vary substantially across different locations within the city.
6.2. Discussion
This study introduces a flow-based perspective to systematically evaluate the usage efficiency of dockless bike-sharing systems. The results reveal pronounced spatial heterogeneity in usage efficiency, underscoring the need for context-specific approaches when assessing system performance. The application of Geographically Weighted Regression (GWR) further demonstrates that the relationships between built-environment factors and bike-sharing efficiency are spatially non-stationary. Variables such as population density, transport facility availability, and distance to metro stations exhibit varying effect sizes—and occasionally opposite directions—across different locations. This spatial differentiation underscores the limitations of “one-size-fits-all” planning or operational strategies and highlights the importance of context-sensitive approaches in managing bike-sharing systems.
These findings can offer some insights for bike-sharing operators and urban planners. Efficiency assessment should integrate destination-side conditions, as measured by the FwToB index, to better guide rebalancing efforts and prevent bicycle accumulation in low-efficiency areas. Infrastructure planning should reflect spatial differentiation, with priority given to parking management around metro stations in core urban zones, while bus-bike integration and targeted incentives could be enhanced in peripheral areas to stimulate demand. Furthermore, promoting mixed land use and improving street-level walkability and cyclability can help create neighborhoods that support consistent bike-sharing usage, contributing to a more resilient and efficient system overall.
Several limitations should be acknowledged. First, the data were collected in July 2022 when COVID-19-related restrictions could still influence travel behavior. The resulting usage patterns and efficiency metrics may therefore not fully reflect bike-sharing operations under typical, non-pandemic conditions. Second, the explanatory variables employed in the analysis involve certain simplifications. For instance, land-use diversity was proxied using POI-based mixing entropy, which may not fully capture the functional complexity or intensity of urban land use. Third, although the geographically weighted regression (GWR) model accounts for spatial heterogeneity, it does not incorporate several other potentially relevant factors—such as real-time operational interventions or weather conditions—which could further explain variations in usage efficiency
References
- Otero, I.; Nieuwenhuijsen, M.J.; Rojas-Rueda, D. Health Impacts of Bike Sharing Systems in Europe. Environ. Int. 2018, 115, 387–394. [CrossRef]
- Zhang, Y.; Mi, Z. Environmental Benefits of Bike Sharing: A Big Data-Based Analysis. Appl. Energy 2018, 220, 296–301. [CrossRef]
- Mooney, S.J.; Hosford, K.; Howe, B.; Yan, A.; Winters, M.; Bassok, A.; Hirsch, J.A. Freedom from the Station: Spatial Equity in Access to Dockless Bike Share. J. Transp. Geogr. 2019, 74, 91–96. [CrossRef]
- Xu, C.; Ji, J.; Liu, P. The Station-Free Sharing Bike Demand Forecasting with a Deep Learning Approach and Large-Scale Datasets. Transp. Res. Part C Emerg. Technol. 2018, 95, 47–60. [CrossRef]
- Chen, Z.; Van Lierop, D.; Ettema, D. Dockless Bike-Sharing Systems: What Are the Implications? Transp. Rev. 2020, 40, 333–353. [CrossRef]
- Ma, Y.; Rong, K.; Mangalagiu, D.; Thornton, T.F.; Zhu, D. Co-Evolution between Urban Sustainability and Business Ecosystem Innovation: Evidence from the Sharing Mobility Sector in Shanghai. J. Clean. Prod. 2018, 188, 942–953. [CrossRef]
- Tao, J.; Zhou, Z. Evaluation of Potential Contribution of Dockless Bike-Sharing Service to Sustainable and Efficient Urban Mobility in China. Sustain. Prod. Consum. 2021, 27, 921–932. [CrossRef]
- Zhang, L.; Zhang, J.; Duan, Z.; Bryde, D. Sustainable Bike-Sharing Systems: Characteristics and Commonalities across Cases in Urban China. J. Clean. Prod. 2015, 97, 124–133. [CrossRef]
- Rixey, R.A. Station-Level Forecasting of Bike Sharing Ridership: Station Network Effects in Three U.S. Systems. 2013.
- El-Assi, W.; Salah Mahmoud, M.; Nurul Habib, K. Effects of Built Environment and Weather on Bike Sharing Demand: A Station Level Analysis of Commercial Bike Sharing in Toronto. Transportation 2017, 44, 589–613. [CrossRef]
- Guo, Y.; He, S.Y. Built Environment Effects on the Integration of Dockless Bike-Sharing and the Metro. Transp. Res. Part Transp. Environ. 2020, 83, 102335. [CrossRef]
- Barbour, N.; Zhang, Y.; Mannering, F. A Statistical Analysis of Bike Sharing Usage and Its Potential as an Auto-Trip Substitute. J. Transp. Health 2019, 12, 253–262. [CrossRef]
- Li, A.; Zhao, P.; Huang, Y.; Gao, K.; Axhausen, K.W. An Empirical Analysis of Dockless Bike-Sharing Utilization and Its Explanatory Factors: Case Study from Shanghai, China. J. Transp. Geogr. 2020, 88, 102828. [CrossRef]
- Zhao, P.; Li, A.; Pilesjö, P.; Mansourian, A. A Machine Learning Based Approach for Predicting Usage Efficiency of Shared E-Scooters Using Vehicle Availability Data. AGILE GIScience Ser. 2022, 3, 20. [CrossRef]
- Du, Y.; Deng, F.; Liao, F. A Model Framework for Discovering the Spatio-Temporal Usage Patterns of Public Free-Floating Bike-Sharing System. Transp. Res. Part C Emerg. Technol. 2019, 103, 39–55. [CrossRef]
- Jiao, J.; Lee, H.K.; Choi, S.J. Impacts of COVID-19 on Bike-Sharing Usages in Seoul, South Korea. Cities 2022, 130, 103849. [CrossRef]
- Shen, Y.; Zhang, X.; Zhao, J. Understanding the Usage of Dockless Bike Sharing in Singapore. Int. J. Sustain. Transp. 2018, 12, 686–700. [CrossRef]
- Zheng, L.; Meng, F.; Ding, T.; Yang, Q.; Xie, Z.; Jiang, Z. The Effect of Traffic Status on Dockless Bicycle-Sharing: Evidence from Shanghai, China. J. Clean. Prod. 2022, 381, 135207. [CrossRef]
- Chen, E.; Ye, Z. Identifying the Nonlinear Relationship between Free-Floating Bike Sharing Usage and Built Environment. J. Clean. Prod. 2021, 280, 124281. [CrossRef]
- Gao, K.; Yang, Y.; Li, A.; Qu, X. Spatial Heterogeneity in Distance Decay of Using Bike Sharing: An Empirical Large-Scale Analysis in Shanghai. Transp. Res. Part Transp. Environ. 2021, 94, 102814.
- Xu, X.; Wang, J.; Poslad, S.; Rui, X.; Zhang, G.; Fan, Y. Exploring Intra-Urban Human Mobility and Daily Activity Patterns from the Lens of Dockless Bike-Sharing: A Case Study of Beijing, China. Int. J. Appl. Earth Obs. Geoinformation 2023, 122, 103442. [CrossRef]
- Chen, W.; Chen, X.; Cheng, L.; Chen, J.; Tao, S. Locating New Docked Bike Sharing Stations Considering Demand Suitability and Spatial Accessibility. Travel Behav. Soc. 2024, 34, 100675. [CrossRef]
- Wang, Y.; Li, J.; Su, D.; Zhou, H. Spatial-Temporal Heterogeneity and Built Environment Nonlinearity in Inconsiderate Parking of Dockless Bike-Sharing. Transp. Res. Part Policy Pract. 2023, 175, 103789. [CrossRef]
- Zhou, X.; Dong, Q.; Huang, Z.; Yin, G.; Zhou, G.; Liu, Y. The Spatially Varying Effects of Built Environment Characteristics on the Integrated Usage of Dockless Bike-Sharing and Public Transport. Sustain. Cities Soc. 2023, 89, 104348. [CrossRef]
- Lin, D.; Zhang, Y.; Zhu, R.; Meng, L. The Analysis of Catchment Areas of Metro Stations Using Trajectory Data Generated by Dockless Shared Bikes. Sustain. Cities Soc. 2019, 49, 101598. [CrossRef]
- Guo, Y.; Yang, L.; Lu, Y.; Zhao, R. Dockless Bike-Sharing as a Feeder Mode of Metro Commute? The Role of the Feeder-Related Built Environment: Analytical Framework and Empirical Evidence. Sustain. Cities Soc. 2021, 65, 102594. [CrossRef]
- Li, W.; Chen, S.; Dong, J.; Wu, J. Exploring the Spatial Variations of Transfer Distances between Dockless Bike-Sharing Systems and Metros. J. Transp. Geogr. 2021, 92, 103032. [CrossRef]
- Wu, X.; Lu, Y.; Lin, Y.; Yang, Y. Measuring the Destination Accessibility of Cycling Transfer Trips in Metro Station Areas: A Big Data Approach. Int. J. Environ. Res. Public. Health 2019, 16, 2641. [CrossRef]
- Schimohr, K.; Doebler, P.; Scheiner, J. Prediction of Bike-sharing Trip Counts: Comparing Parametric Spatial Regression Models to a Geographically Weighted XGBoost Algorithm. Geogr. Anal. 2023, 55, 651–684. [CrossRef]
- Ngeni, F.; Kutela, B.; Chengula, T.J.; Ruseruka, C.; Musau, H.; Novat, N.; Indah, D.A.; Kasomi, S. Prediction of Bike-Sharing Station Demand Using Explainable Artificial Intelligence. Mach. Learn. Appl. 2024, 17, 100582. [CrossRef]
- Pan, L.; Cai, Q.; Fang, Z.; Tang, P.; Huang, L. A Deep Reinforcement Learning Framework for Rebalancing Dockless Bike Sharing Systems. In Proceedings of the Proceedings of the AAAI conference on artificial intelligence; 2019; Vol. 33, pp. 1393–1400. [CrossRef]
- Gu, Z.; Zhu, Y.; Zhang, Y.; Zhou, W.; Chen, Y. Heuristic Bike Optimization Algorithm to Improve Usage Efficiency of the Station-Free Bike Sharing System in Shenzhen, China. ISPRS Int. J. Geo-Inf. 2019, 8, 239.
- Faghih-Imani, A.; Hampshire, R.; Marla, L.; Eluru, N. An Empirical Analysis of Bike Sharing Usage and Rebalancing: Evidence from Barcelona and Seville. Transp. Res. Part Policy Pract. 2017, 97, 177–191. [CrossRef]
- Hua, M.; Chen, X.; Zheng, S.; Cheng, L.; Chen, J. Estimating the Parking Demand of Free-Floating Bike Sharing: A Journey-Data-Based Study of Nanjing, China. J. Clean. Prod. 2020, 244, 118764. [CrossRef]
- Wang, J.; Wang, Y. A Two-Stage Incentive Mechanism for Rebalancing Free-Floating Bike Sharing Systems: Considering User Preference. Transp. Res. Part F Traffic Psychol. Behav. 2021, 82, 54–69. [CrossRef]
- Wei, Z.; Ma, H.; Li, Y. A Multiscale Approach for Free-Float Bike-Sharing Electronic Fence Location Planning: A Case Study of Shenzhen City. J. Adv. Transp. 2024, 2024, 1783038. [CrossRef]
- Fu, C.; Yen, B.T.; Yeh, C.-J. The Analysis of the Shared Bike Usage Pattern: Application of Survival Model to Taiwan YouBike. Asian Transp. Stud. 2024, 10, 100125. [CrossRef]
- Shi, Z.; Wang, J.; Liu, K.; Liu, Y.; He, M. Exploring the Usage Efficiency of Electric Bike-Sharing from a Spatial–Temporal Perspective. Transp. Res. Part Transp. Environ. 2024, 129, 104139. [CrossRef]
- Cheng, L.; Huang, J.; Jin, T.; Chen, W.; Li, A.; Witlox, F. Comparison of Station-Based and Free-Floating Bikeshare Systems as Feeder Modes to the Metro. J. Transp. Geogr. 2023, 107, 103545. [CrossRef]
- Guidon, S.; Becker, H.; Axhausen, K. Avoiding Stranded Bicycles in Free-Floating Bicycle-Sharing Systems: Using Survival Analysis to Derive Operational Rules for Rebalancing. In Proceedings of the 2019 IEEE Intelligent Transportation Systems Conference (ITSC); IEEE, 2019; pp. 1703–1708.
- Brunsdon, C.; Fotheringham, A.S.; Charlton, M.E. Geographically Weighted Regression: A Method for Exploring Spatial Nonstationarity. Geogr. Anal. 1996, 28, 281–298. [CrossRef]
- Zhao, P.; Xu, Y.; Liu, X.; Kwan, M.-P. Space-Time Dynamics of Cab Drivers’ Stay Behaviors and Their Relationships with Built Environment Characteristics. Cities 2020, 101, 102689. [CrossRef]
- Ewing, R.; Cervero, R. Travel and the Built Environment: A Meta-Analysis. J. Am. Plann. Assoc. 2010, 76, 265–294. [CrossRef]
- Oshan, T.M.; Li, Z.; Kang, W.; Wolf, L.J.; Fotheringham, A.S. Mgwr: A Python Implementation of Multiscale Geographically Weighted Regression for Investigating Process Spatial Heterogeneity and Scale. ISPRS Int. J. Geo-Inf. 2019, 8, 269. [CrossRef]
Figure 1.
Study area.
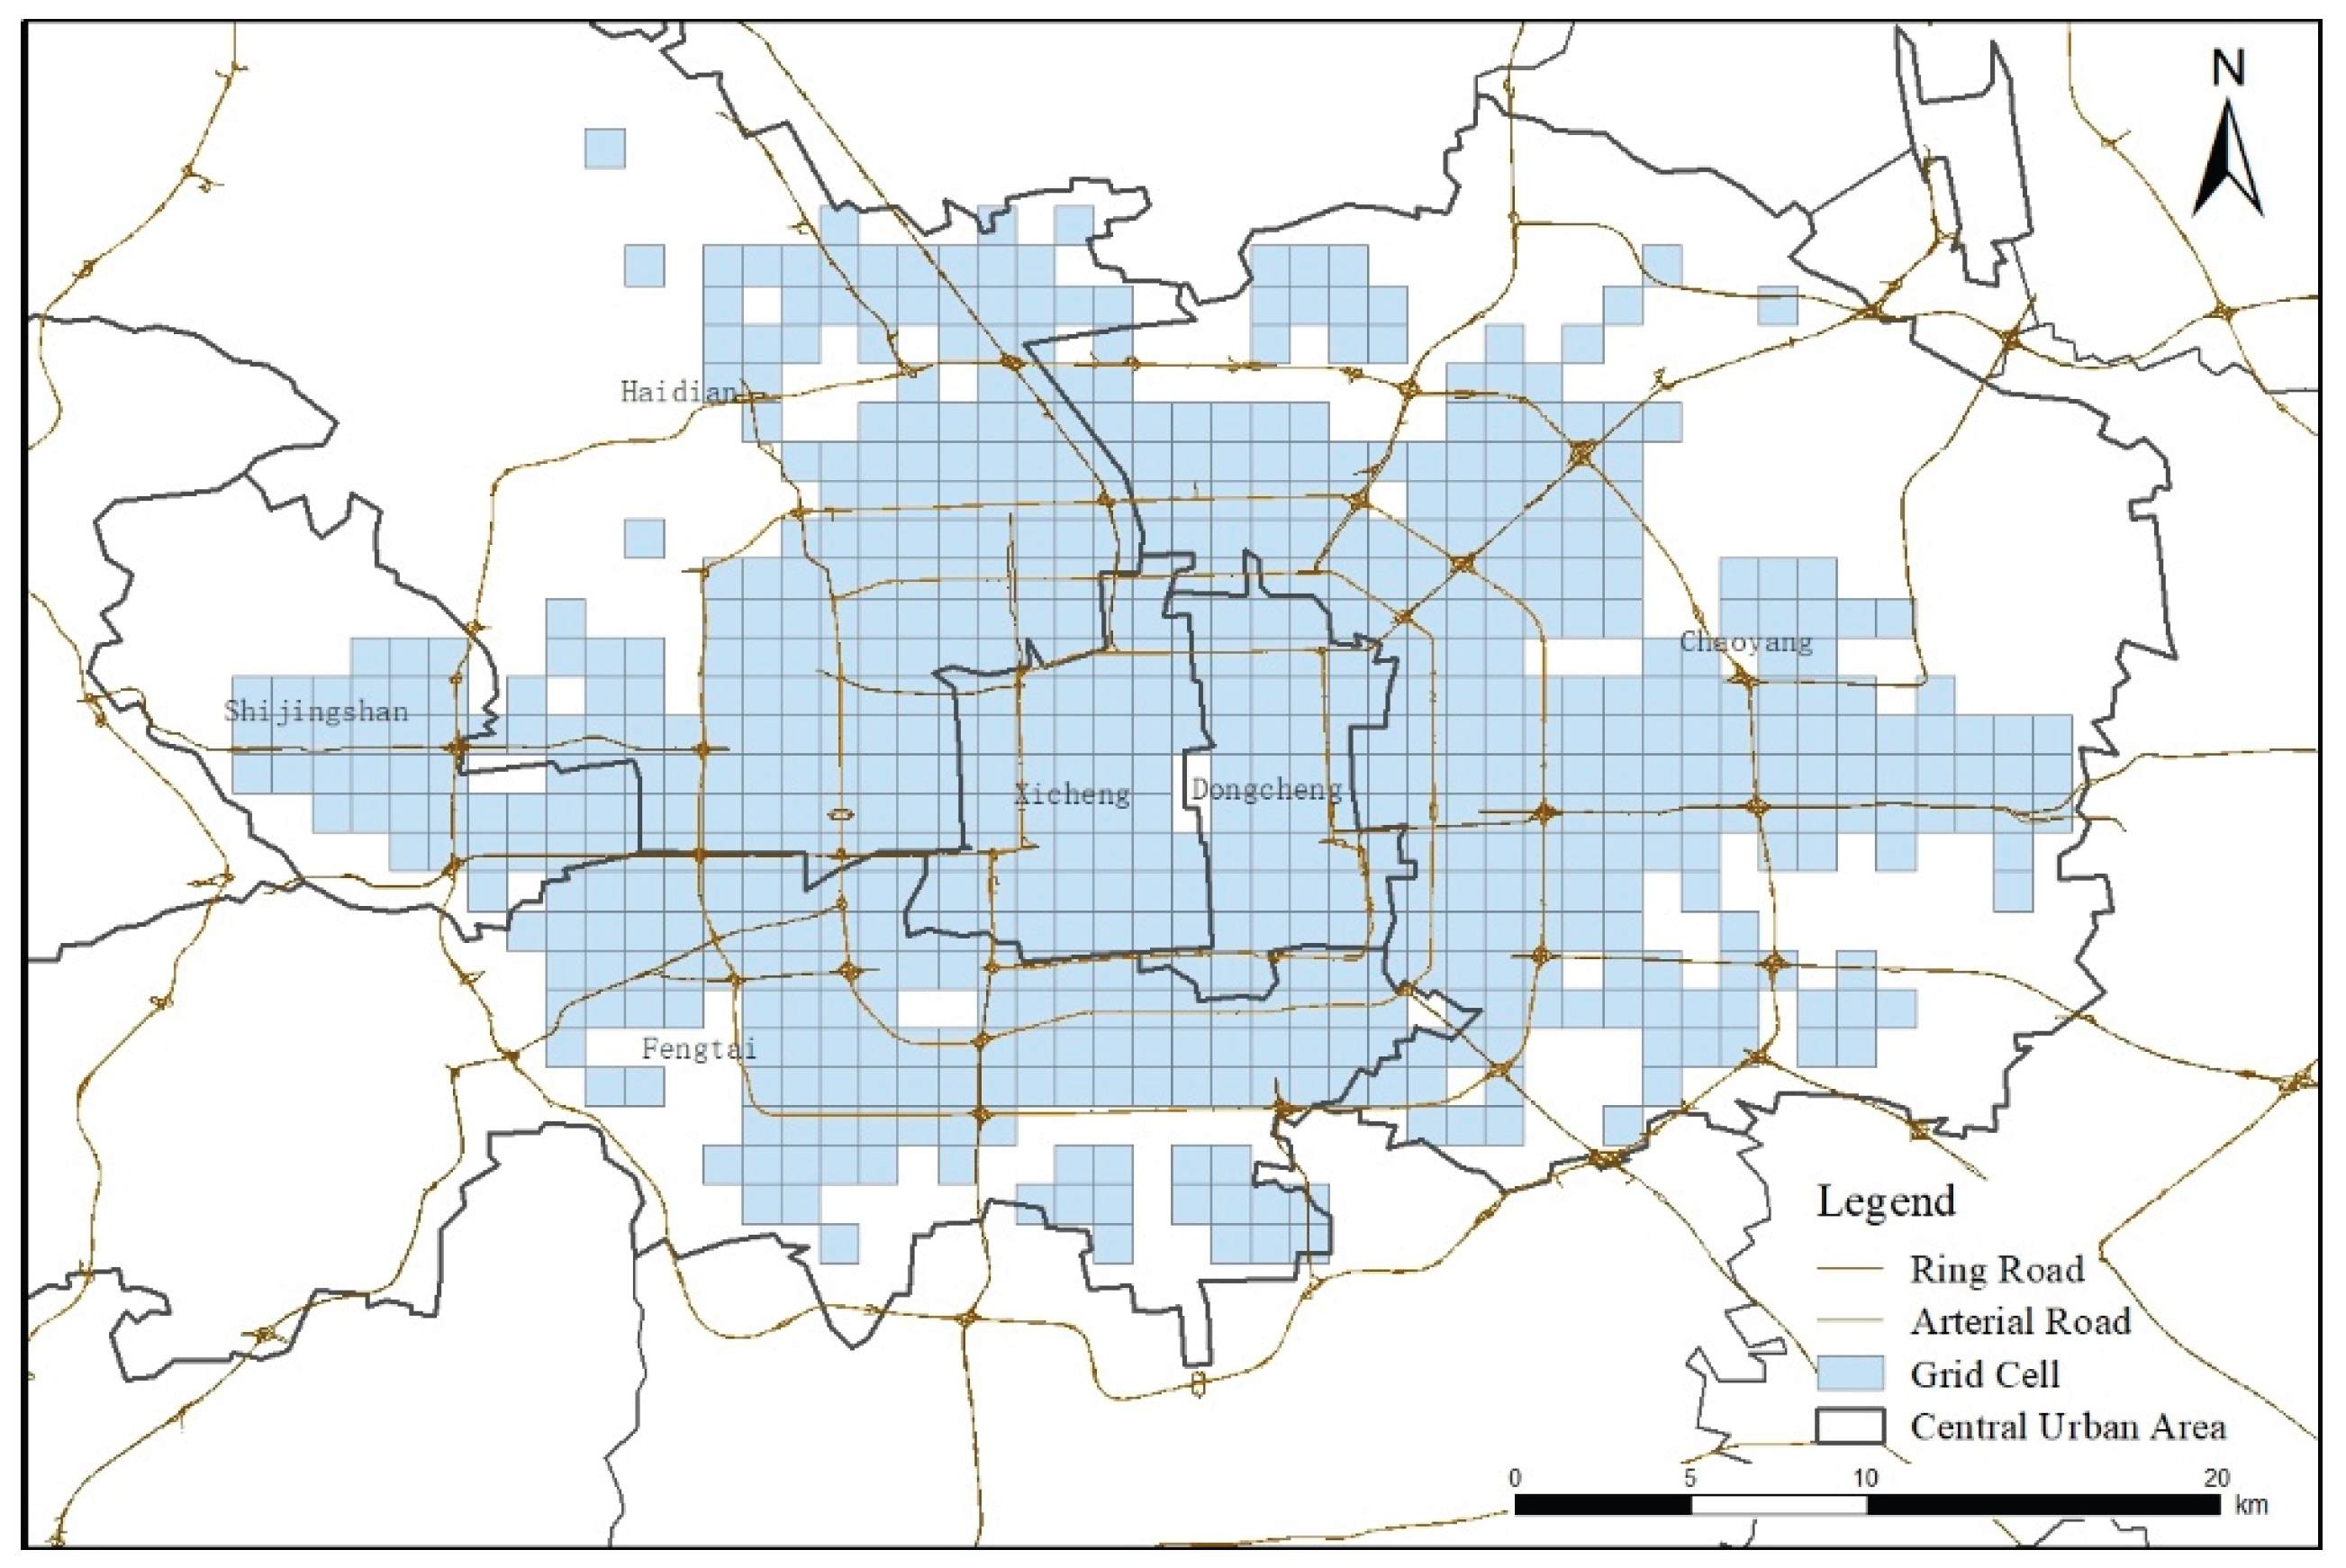
Figure 2.
Distribution of ToB for All Trips.
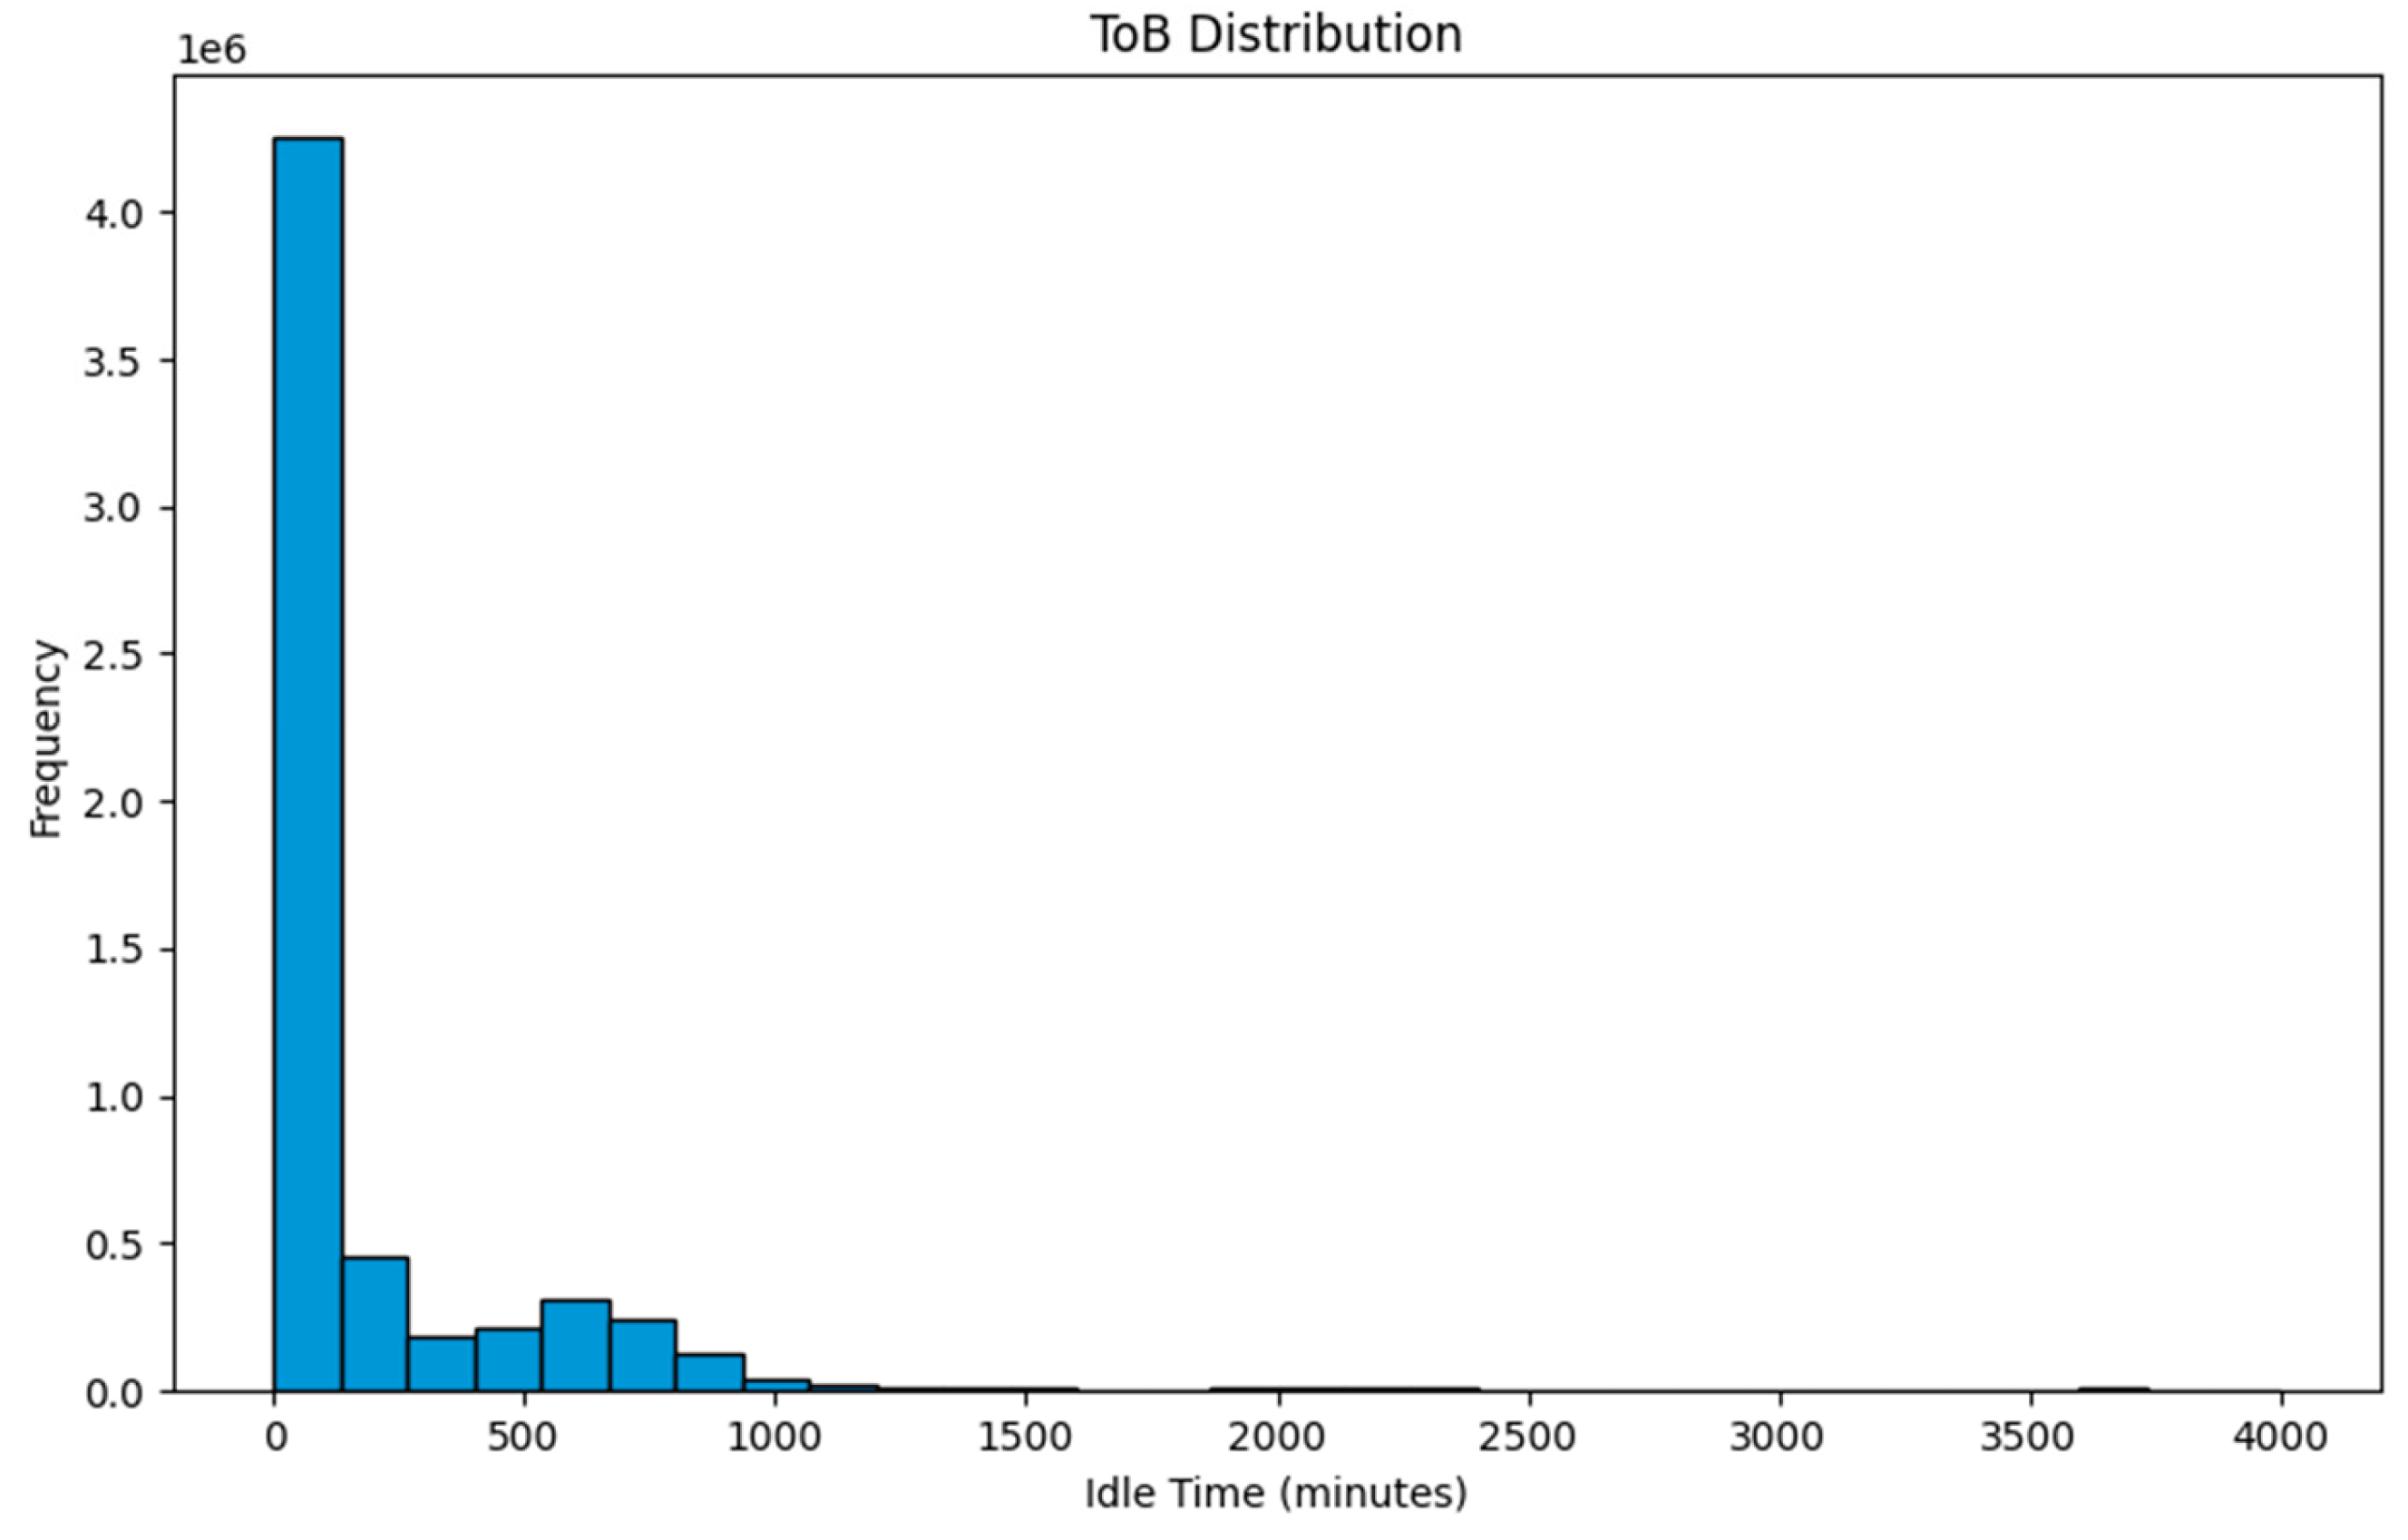
Figure 3.
Spatial Distribution of ToB.
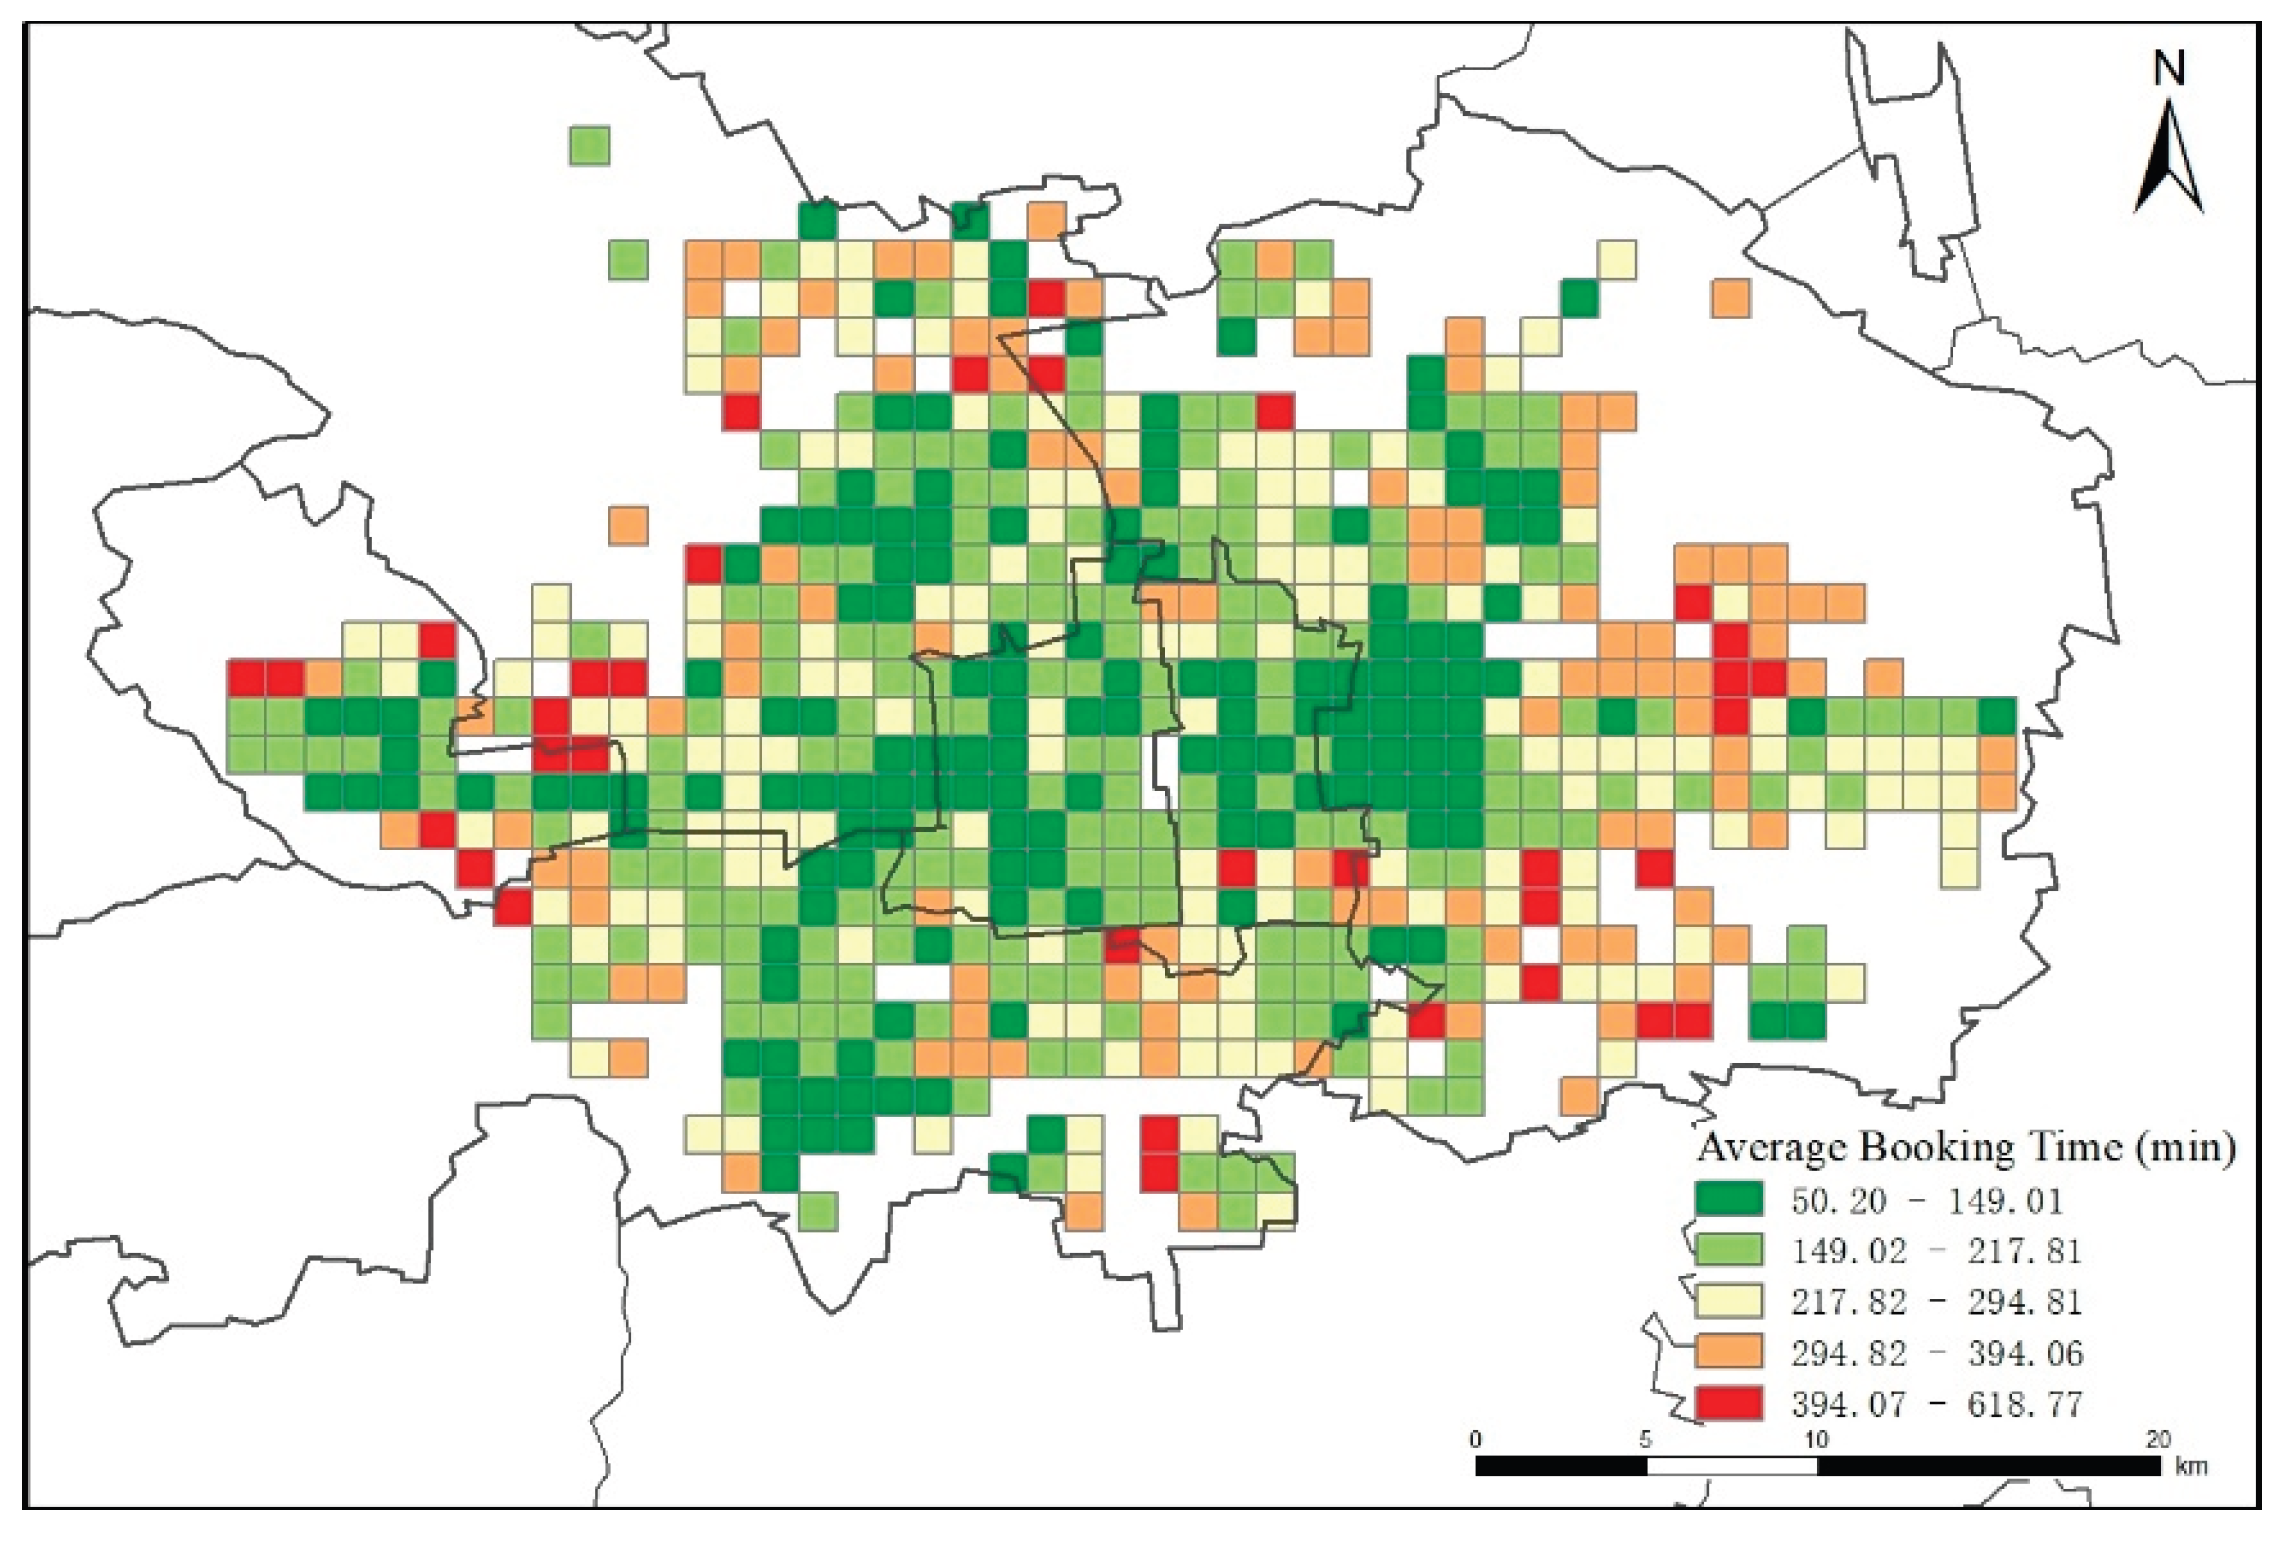
Figure 4.
Spatial Distribution of FwToB.
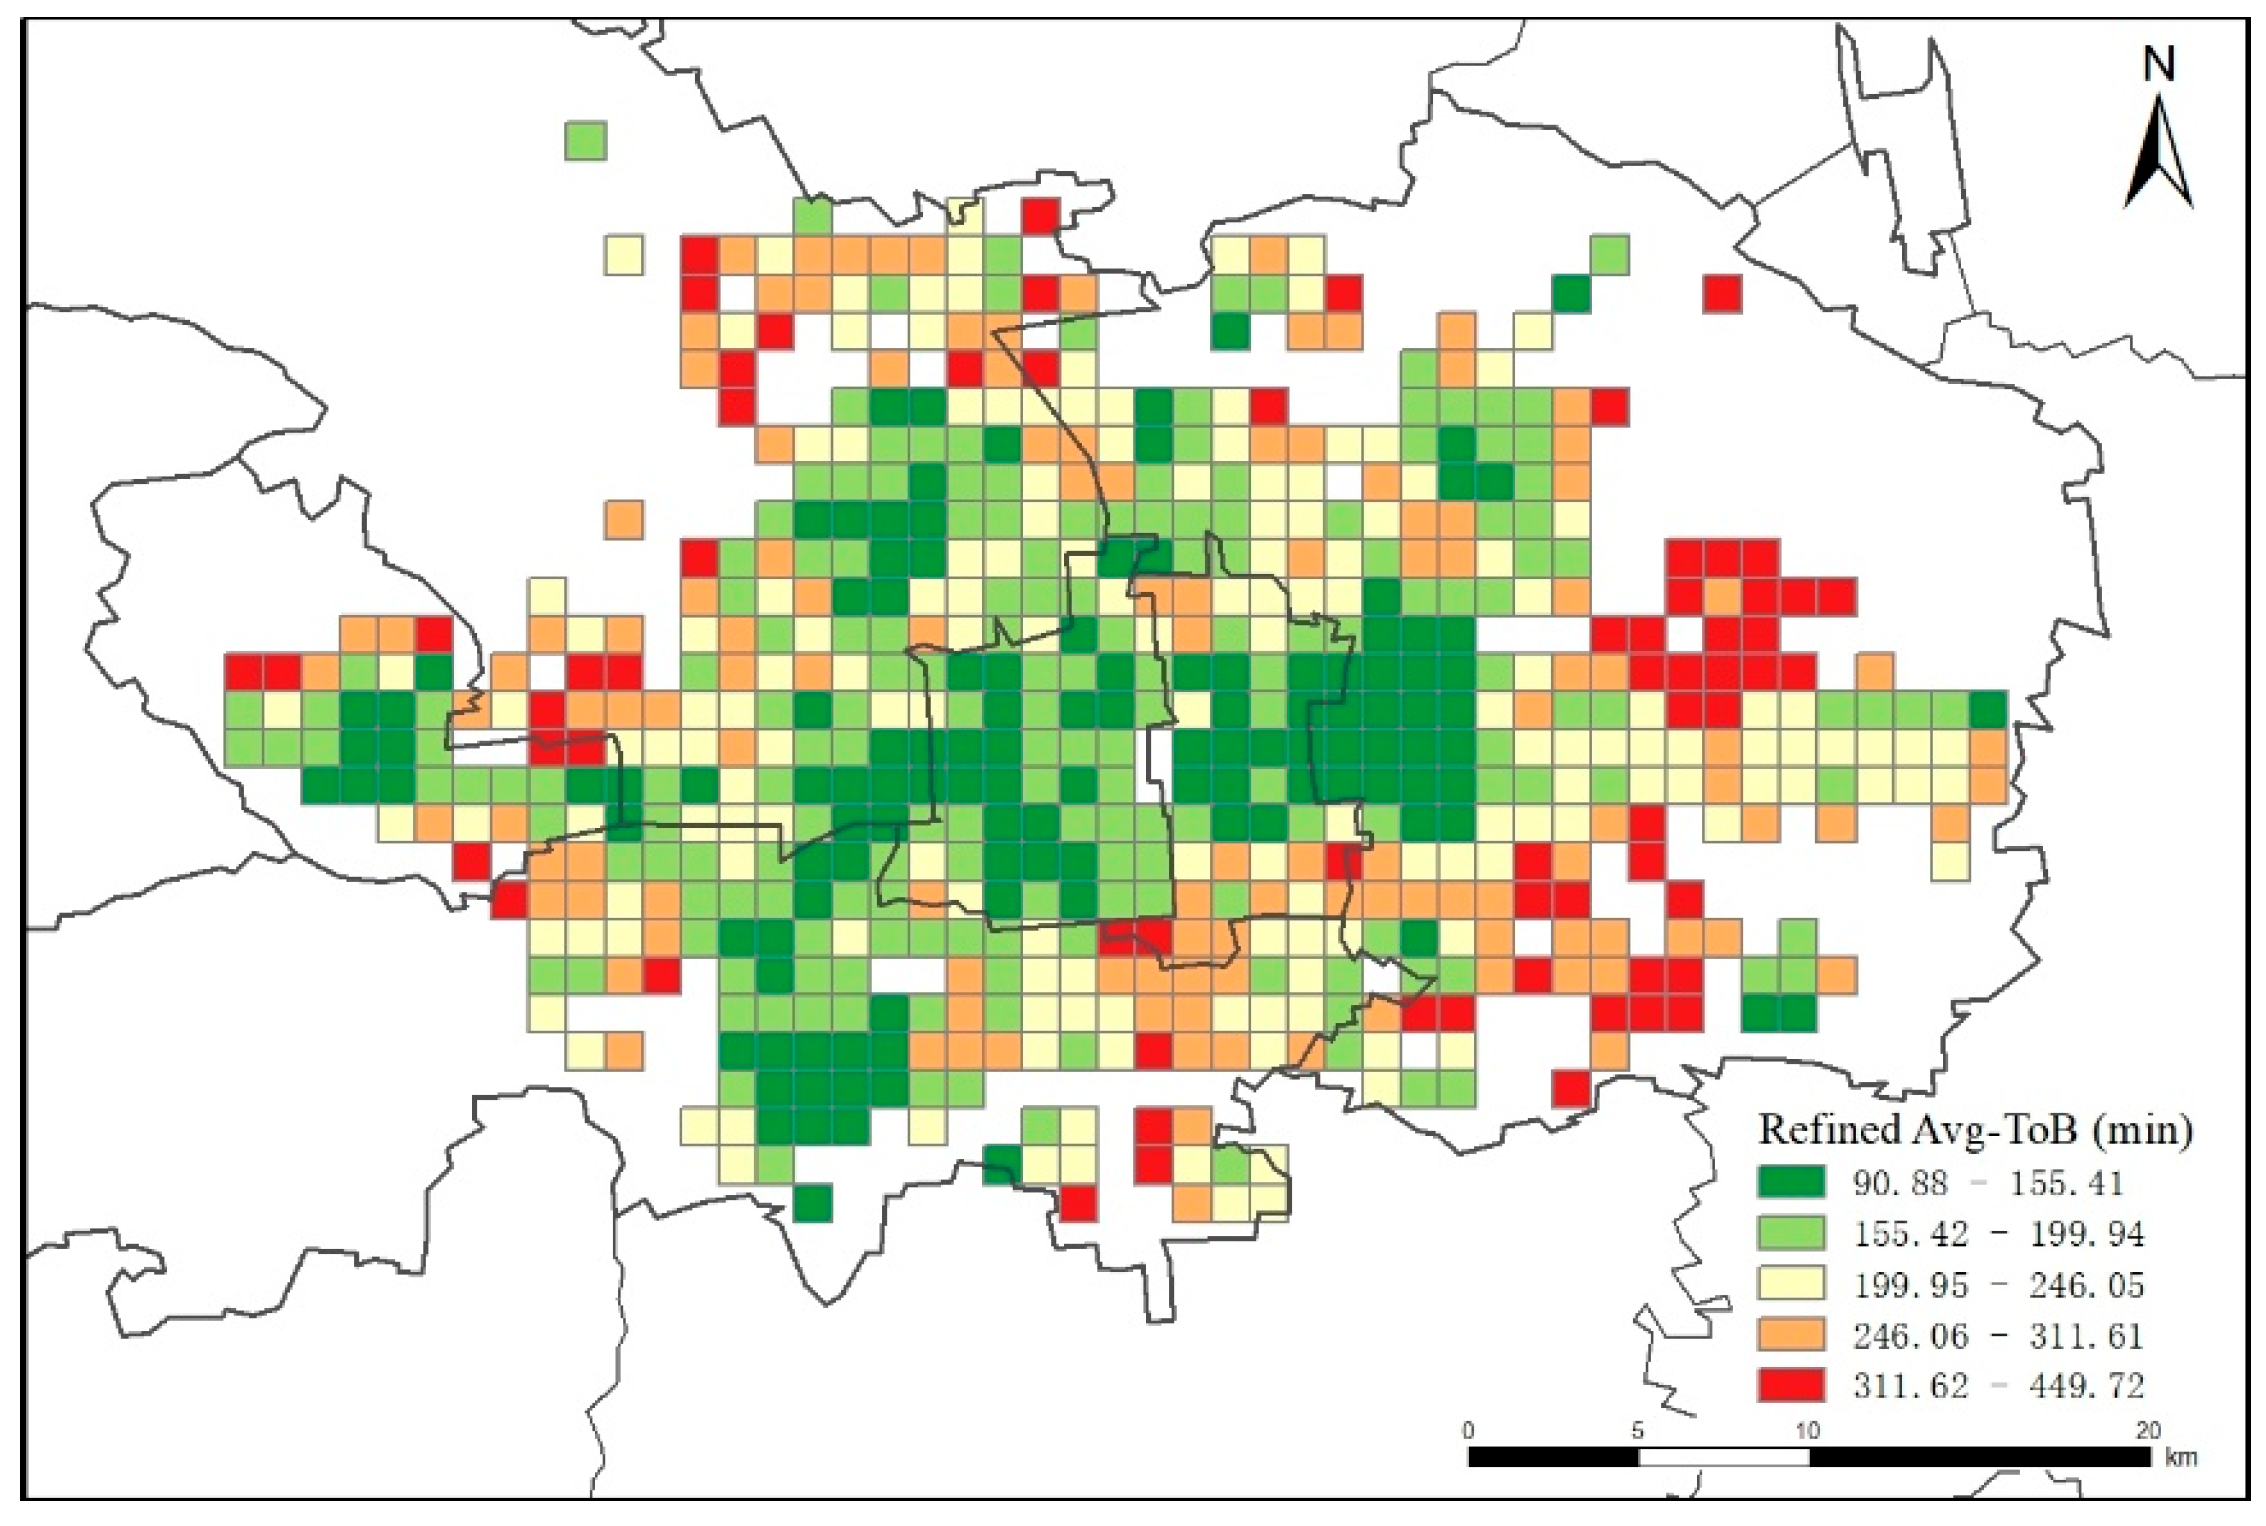
Figure 5.
Comparison of the values between Tob and FwToB.
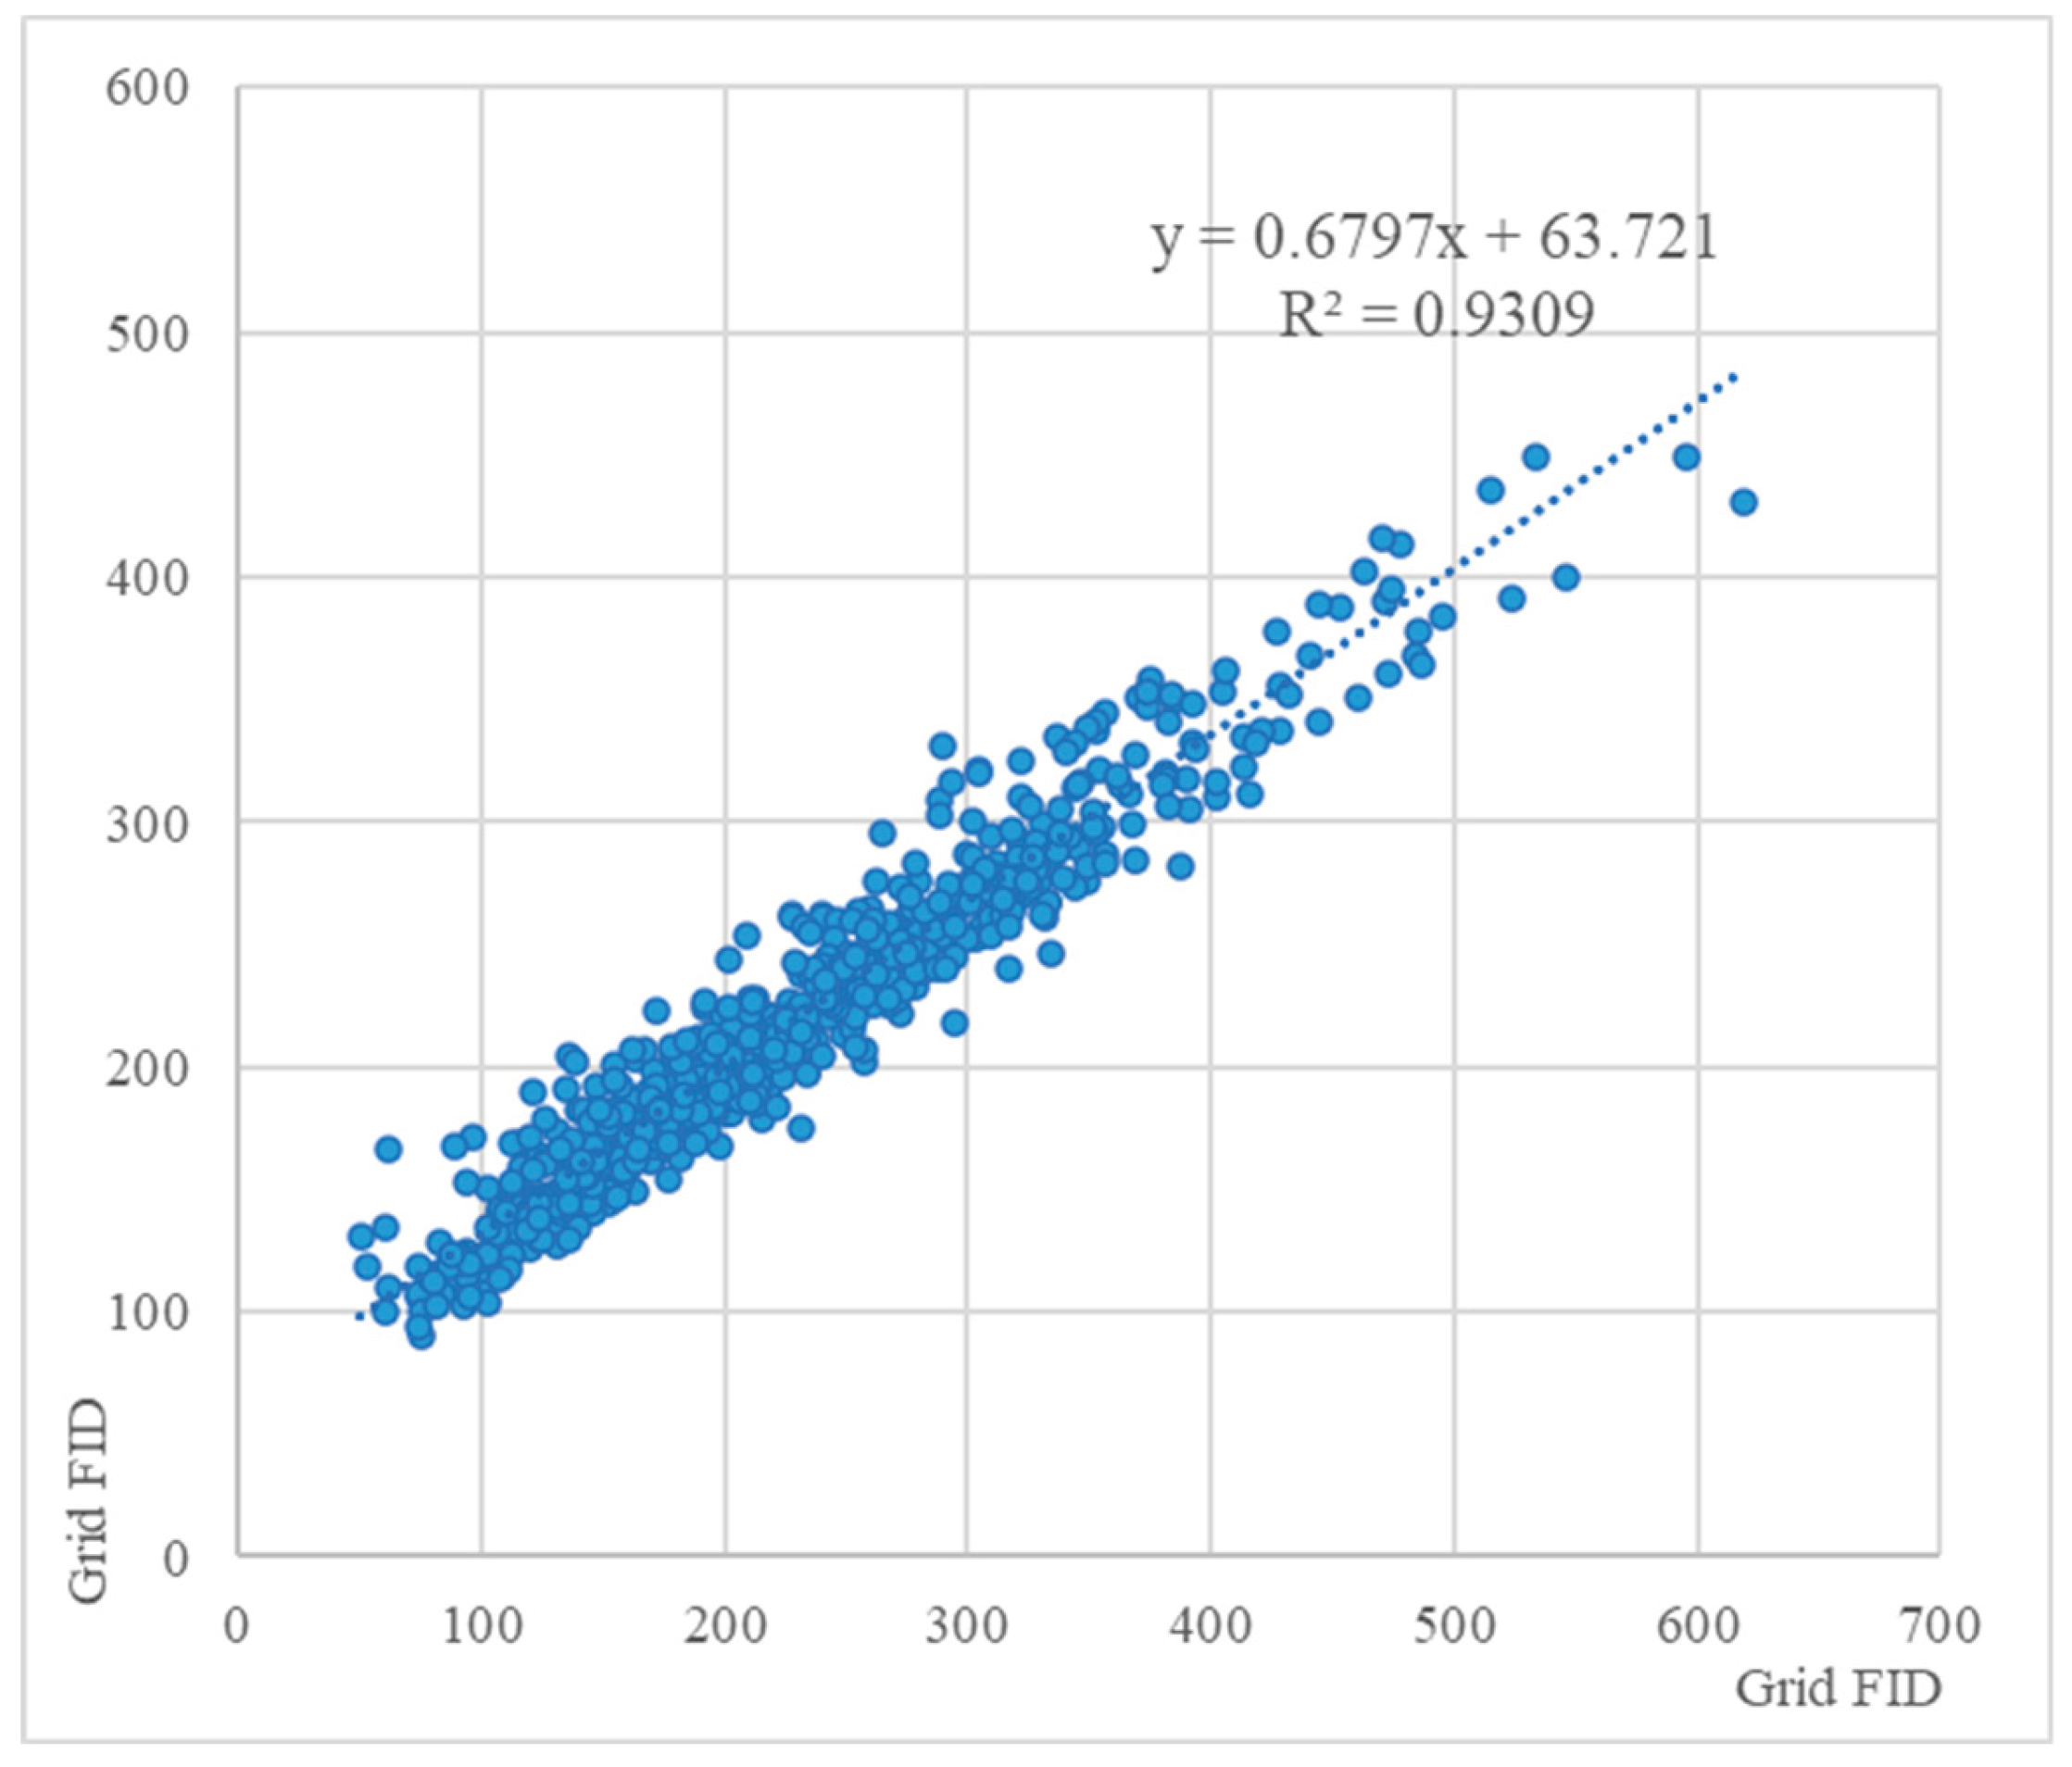

Table 1.
Data samples.
| District | Bike ID | Start Date | Start Time | Start Lon. | Start Lat. | End Date | End Time | End Lon. | End Lat. |
|---|---|---|---|---|---|---|---|---|---|
| Haidian | 8641958202 | 2022-07-04 | 07:46:58 | 116.345 | 39.96733 | 2022-07-04 | 07:53:51 | 116.361 | 39.96711 |
| Fengtai | 8650407056 | 2022-07-02 | 12:35:11 | 116.2922 | 39.80814 | 2022-07-02 | 12:39:13 | 116.2858 | 39.80281 |
| Chaoyang | 8651782342 | 2022-07-03 | 10:28:37 | 116.46 | 39.87633 | 2022-07-03 | 10:35:07 | 116.4461 | 39.87773 |
Table 2.
POI Data Types.
| Category | Count | Ratio (%) |
|---|---|---|
| Transport Facilities | 69570 | 10.24 |
| Leisure & Entertainment | 13609 | 2.00 |
| Companies | 75574 | 11.12 |
| Medical Care | 24563 | 3.62 |
| Business & Residential | 30440 | 4.48 |
| Tourist Attractions | 10286 | 1.51 |
| Automotive Services | 22898 | 3.37 |
| Life Services | 97163 | 14.3 |
| Science, Education & Culture | 43524 | 6.41 |
| Shopping & Consumption | 149225 | 21.96 |
| Sports & Fitness | 12732 | 1.87 |
| Hotel & Accommodation | 17713 | 2.61 |
| Financial Institutions | 12195 | 1.79 |
| Dining & Food | 99921 | 14.71 |
Table 3.
Description of the variables.
| Category | Variable | Meaning (Description) | Unit |
|---|---|---|---|
| density | meanPop | Population Density | person |
| diversity | poiEntropy | POI Mixing Entropy | - |
| industrialRatio | Ratio of Industrial POIs | % | |
| design | mainRoadLength | Length of Trunk Roads | m |
| bikePathLength | Length of Bike Lanes | m | |
| destination accessibility | numMedicalFacilities | No. of Medical Facilities | count |
| numParksPlazas | No. of Parks and Plazas | count | |
| numShoppingCenters | No. of Shopping Centers | count | |
| numTransportFacilities | No. of Transport Facilities | count | |
| distance to transit | numBusStations | No. of Bus Stops | count |
| numSubwayStations | No. of Metro Stations | count | |
| nearestSubwayDist | Distance to Nearest Metro Station | m |
Table 4.
The results of OLS and GWR Model.
| Variable | OLS Model | GWR Model | |||||
|---|---|---|---|---|---|---|---|
| Coef. | t-value | Mean | Std. | Min | Median | Max | |
| (Constant) | -0.000 | -0.000 | -0.008 | 0.274 | -0.486 | 0.014 | 0.760 |
| Population Density | -0.180** | -4.509 | -0.166 | 0.193 | -0.669 | -0.174 | 0.259 |
| POI Mixing Entropy | 0.060 | 1.463 | 0.119 | 0.165 | -0.260 | 0.125 | 0.435 |
| Ratio of Industrial POIs | -0.062 | -1.600 | -0.084 | 0.130 | -0.461 | -0.082 | 0.252 |
| Length of Trunk Roads | -0.078* | -2.102 | -0.081 | 0.111 | -0.346 | -0.091 | 0.196 |
| Length of Bike Lanes | -0.074* | -2.141 | 0.013 | 0.163 | -0.293 | -0.022 | 0.794 |
| No. of Medical Facilities | -0.094* | -2.324 | -0.087 | 0.083 | -0.290 | -0.079 | 0.106 |
| No. of Parks and Plazas | -0.028 | -0.849 | -0.032 | 0.067 | -0.206 | -0.026 | 0.136 |
| No. of Shopping Centers | -0.089* | -2.345 | -0.060 | 0.113 | -0.303 | -0.059 | 0.194 |
| No. of Transport Facilities | -0.234** | -5.157 | -0.286 | 0.143 | -0.571 | -0.273 | -0.003 |
| No. of Bus Stops | 0.045 | 1.125 | 0.063 | 0.124 | -0.195 | 0.040 | 0.337 |
| No. of Metro Stations | 0.084* | 1.992 | 0.039 | 0.092 | -0.179 | 0.039 | 0.242 |
| Distance to Nearest Metro Station | 0.254** | 5.922 | 0.195 | 0.111 | -0.115 | 0.197 | 0.410 |
| Model Performance | |||||||
| Adjusted R² | 0.317 | 0.444 | |||||
| AICc | 1613 | 1553 | |||||
| Residual Sum of Squares | 433.459 | 261.229 | |||||
** and * denote significance at the 0.05 and 0.1 levels, respectively. The spatial distribution of estimated coefficients for all variables was plotted using Python, as shown in Figure 7. A negative coefficient indicates that the ToB value decreases as the variable increases, signifying an improvement in operational efficiency. Figure 7 shows that population density exerts negative impacts in most areas, especially in the northwest, while positive impacts appear in portions of the southwest and southeast. Negative coefficients imply reduced idle times; therefore, population concentration tends to promote efficient bike-sharing usage in most areas, particularly in relatively densely populated zones.
Disclaimer/Publisher’s Note: The statements, opinions and data contained in all publications are solely those of the individual author(s) and contributor(s) and not of MDPI and/or the editor(s). MDPI and/or the editor(s) disclaim responsibility for any injury to people or property resulting from any ideas, methods, instructions or products referred to in the content. |
© 2026 by the authors. Licensee MDPI, Basel, Switzerland. This article is an open access article distributed under the terms and conditions of the Creative Commons Attribution (CC BY) license (http://creativecommons.org/licenses/by/4.0/).
Copyright: This open access article is published under a Creative Commons CC BY 4.0 license, which permit the free download, distribution, and reuse, provided that the author and preprint are cited in any reuse.


