
Submitted:
21 October 2025
Posted:
22 October 2025
You are already at the latest version
Preprints on COVID-19 and SARS-CoV-2
Abstract
Implementing effective cycling mobility requires infrastructure that enhances safety and reduces travel time. A common metric for tracking progress is the total length of dedicated cycling infrastructure. However, this does not always correlate with increased cycling usage. For instance, in Italy (2008–2015), cycling infrastructure grew by 48%, but ridership remained unchanged. Design quality, behavioral, and contextual factors all influence this dynamic. This study analyzes a 16-year time series (2009–2024) of monthly cyclist flows surveys in Bologna, Italy. It focuses on flows, gender, and bike lane usage. It represents the most detailed and longest series of its kind in the country. Findings show a positive correlation between infrastructure growth (meters per inhabitant) and cyclist flows, though this weakened significantly after COVID-19 and the extensive introduction of non-exclusive bike lanes on mixed use roads from 2020. Regression analysis reveals that new bike flows per new meter/inhabitant of infrastructure were 3 times greater before 2020. The study identifies two likely causes: the insufficient perceived safety of the newly introduced mixed traffic lanes from 2020 and the lack of attractiveness of bike mode for the female population, as highlighted in the decreasing trend in usage of bike infrastructure by female riders after 2020.
Keywords:
bike infrastructure
; infrastructure policy
; active mobility
; bike ridership
; mixed use bike lanes
; protected bike lanes
; gender gap in bike transport
1. Introduction
1.1. Global Context
Urban planning has increasingly focused on promoting active and sustainable modes of transport, as they can play a crucial role in reducing congestion, urban pollution, dependence on fossil fuels, and physical inactivity [2]. A growing number of cities are investing in new or improved cycling infrastructure; thus there is the need to understand what policies on new bikeways construction can be effective in incentivizing new bike trips. Numerous studies have found a positive correlation between bike facilities and cycling frequency[3,4,5,6], with evidence suggesting that grade-separated or bike lanes can attract new users to cycling [7]. However, not all cycling infrastructure is perceived equally by users. Many studies based on stated preference surveys have tried to identify the environmental and infrastructural elements that can encourage or discourage cycling [8,9,10,11,12,13,14,15,16]. These studies indicate that cyclists generally prefer bike lanes that are physically separated from motorized traffic or at least with road marking delimiters, as well as routes with fewer intersections. Moreover, Nelson and Allen [4] found a positive correlation between the length of bikeways per capita and cycling mode share, measuring a 0.069% increase in bike commuting for each additional mile of bikeway per 100,000 people. Existing infrastructure and local environmental factors can also heavily influence route and mode choice, as stated by Winters et al. [14] in a study conducted in Vancouver, Canada. Dill and Carr [3] analyzed 35 large U.S. cities and found that higher levels of bike infrastructure were associated with greater bicycle commuting rates. More information can be found from revealed preference surveys, increasingly available through GPS tracking from smartphones. A study by Dill [17] in Portland, USA, (166 users for 1,955 trips) suggests that a well-connected network of low-traffic, low-priority roads may be more effective at encouraging cycling than new bikeways on high-traffic, high-priority roads. Menghini et al. [18], in a study conducted in Zurich, Switzerland, (2,498 trips) found that the primary environmental factors influencing cycling trips were trip distance and maximum road gradient, while the presence of separated bike paths had a comparatively lower impact. Hood et al. [19] analyzed GPS traces (366 users for 2,777 trips) in San Francisco, USA, and found that grade-separated bikeways were the preferred infrastructure, particularly among infrequent cyclists. Both Hood et al. [19] and Broach et al. [20] (164 users, 1,449 trips) confirmed that factors such as route length, maximum road grade, traffic volume, number of turns, and intersections deter cyclists when choosing their paths. Bernardi et al. [21] compared the effects and frequencies of disturbances on off-street bicycle facilities (from other cyclists and pedestrians) with disturbances (from motorized vehicles) in mixed traffic, by analyzing the speed reductions from different types of disturbances. Three extensive studies by Rupi et al. [22,23,24] (1,123 users for 4,272 trips) in Bologna, Italy, revealed that cyclists prefer safer, low-traffic roads even at the cost of significantly longer travel distances (+20.7% on average). The studies also confirmed that many cyclists avoid intersections and traffic lights; only a few users showed a strong preference for signalized crossings. Interest in cycling is also influenced by the topology and density of the cycling network. An extensive review by Buehler and Dill [?] shows that cities and countries with high bike usage have extensive networks of separated bike lanes and traffic-calmed streets; moreover, demand for cycling infrastructure is more elastic in areas where networks are already dense, well connected and with shortcuts where car traffic is low. Furthermore, there are many studies that report a women preference for protected infrastructure that separates them from interactions with motor vehicle traffic [25,26,27,28]. Providing physically protected and connected infrastructure can be very useful to meet the preferences of female cyclists and consequently is a key factor in increasing and diversifying bike riding participation. The COVID-19 pandemic reshaped urban transportation, primarily by decreasing public transit ridership due to a high perceived risk of COVID-19 transmission among users [29,30]. This perception led to a notable shift towards active transportation modes like walking and cycling, which were viewed as safer alternatives [31,32,33,34]. During this period, there was a pronounced increase in daily activities undertaken for leisure, exercise, and general well-being, rather than predominantly for essential travel or commuting, a trend observed in countries like Australia and specifically in Seoul [29]. In response to these evolving mobility patterns, some urban authorities implemented various policy interventions, with a primary focus on investing in and developing new cycling infrastructure [35]. Paris, for example, built 52 km of new bike lanes by late 2020 [36], and 22 European cities studied by Kraus and Koch [37] added 11.5 km on average. Another notable example is Yogyakarta, Indonesia, where bicycle lanes, parking facilities, and separated lanes notably increased bicycle adoption [38]. The pandemic context has also been an opportunity to observe the influence of social dynamics on cycling adoption. Lecouteux and Moulin [36] observed that in Paris the increase in cycling during the pandemic seems to have been partially driven by a social dynamic of imitation. Non-cyclists were positively influenced by the increase in bike use and started a positive feedback loop. Though the effect seems not to have strongly lasted after the pandemic phase-out.
1.2. Bologna Case Study
This paper examines the evolution of the cycling supply and mobility within the municipality of Bologna, pre and post COVID-19. In 2020, the municipality of Bologna promoted the spread of cycling mobility through coexistence between cyclists and motorized road users. This moment was significant for Bologna’s bikeway infrastructure evolution as the municipality started introducing mixed traffic bike lanes introduced by Legislative Decree in 2020 (Figure 1).
This analysis is conducted starting from the kilometers of cycle paths, distinguishing the various typologies and in particular referring to the kilometers of cycle lanes in the roadway that were first introduced in 2020. The study is based on a series of cyclists’ flow measurements both through automatic counters and operators who manually collected a series of information on the characteristics of cyclists. In this paper the term “bicycle” is used as an inclusive term for all vehicles powered partly or completely by pedal power, including bicycles, mountain bikes, fat-bikes, cargo bicycles, and pedal-assisted bicycles.
Bologna is a medium sized Italian city with approximately 392,000 inhabitants [39]. The city is located in the north of the country and the climate is favorable for all-year cycling, with an annual average temperature just below 15°C and moderate-low precipitation (around 700 mm of rainfall per year over 74 rainy days). For Bologna, the home-to-work bicycle mode share was 10.0% [40] while in Italy in 2023 the share of commuters using bikes was 5.8% [41]. Instead, in 2019 the average bike mode share across 28 European Union member states was 8.0% [42]. During the last 16 years, the city of Bologna has made significant enhancements to its bikeway network. In 2024 the total extension of the bike infrastructure reached 187 km, comprising different types of bikeways [43]. The bike network features 13 main radial paths that connect the city center and suburbs, as well as many other paths connecting these 13 radial corridors (Figure 2).
In Figure 3 is reported bike infrastructure growth referenced to 2009 for the Italian territory and Bologna: bikeway provision of Italy data from 2009 to 2022 was obtained by ISTAT (Italian institute of statistics) [45], while data for 2023 was obtained from Ancma-Legambiente report [46]; Bologna bikeway network extension data from 2009 to 2024 was provided by the city’s municipality. As is evident from Figure 3, in the analyzed period, cycling Italian and Bologna’s infrastructure grew at similar rates.
2. Data and Methods
DICAM-Trasporti of the University of Bologna and the Municipality of Bologna carried out manual and instrumental counting for bicycle flows from 2009 to 2024. Measurements were mainly conducted from September to October of each year with the exclusion of rainy days. Location of counters was decided by selecting representative sections of the network in different parts of the city, on different bikeways and including some roads heavily used by cyclists (Figure 4).
Indeed, all these 10 sections have been chosen since they are sufficiently distributed across the territory and are located on the most important bikeways and roads, most utilized by cyclists. The aim was to intercept the greatest number of cyclists, trying to avoid repeatedly monitoring the same cyclist as much as possible. The measuring spots chosen are able to capture the main streams of bike traffic in the city of Bologna. During the monitoring, three kinds of instruments were used: pneumatic and radar traffic counters and camera-based traffic data collection devices. As regards manual counting, for each section, operators recorded on weekdays the passage of bicycles, divided by direction of travel. Manual counting was carried out by 10 operators who simultaneously detected the flow of cyclists while recording their main characteristics (gender, age, type of bicycle used, use of the helmet etc...). Manual and instrumental counting was conducted at each road section from 08:00 to 10:00 and from 16:30 to 17:30 on weekdays. As emerged from the instrumental surveys, these periods in fact coincide with the peak hours of weekdays. In this way, the main trip’s purpose during these time frames is most likely commuting for “work” or “study”. The overall average two-way hourly flows were obtained by dividing the sum of the flows detected in the two directions both on the bikeways and on the adjacent roads by the total number of hours of detection. Most of the sections are located within the historic center and on the main radial routes. Some of them are on dedicated paths (protected and physically separated bike lanes), others on pedestrian paths with cycling allowed (bike lane on footpath), others on painted bike lanes, and others on bus lanes with cycling allowed. The obtained flow counts were then put into relation with the bike infrastructure provision per inhabitant. Linear regressions are carried out to highlight the influence of bike infrastructure on cycling traffic. Regressions are carried out for both the period before and after 2020, when the bike infrastructure expansion policy faced a sudden change and the mixed use bike lanes were introduced. This allows a comparison in terms of attractiveness between the infrastructure built until 2019 and from 2020.
3. Results
During the considered period, the bikeway meters per citizen increased by 109% , starting with 0.228 m/citizen in the year 2009 and reaching 0.476 m/citizen in 2024. The total average flows recorded in the monitored sections increased between 2009 and 2024 by around 113%, which is of the same order of magnitude as the increase in bikeway meters per inhabitant in the same period. The municipality of Bologna, which has continuously invested in new bike infrastructure in the past 16 years (Figure 5), until 2019 has built mainly separated bikeways, while from 2020 the main increment in bike network was due to bike lanes painted on existing carriageways. These new lanes are of two types: solid-painted lanes with exclusive (non-separated) bike access and dash-painted lanes for mixed traffic use. The concept of dash-painted lanes for mixed traffic use (cycle lane) was first introduced in Italy by Legislative Decree no. 76 of 16 July 2020 and subsequently amended by Law no. 120 of 11 September 2020. Safety standards for new infrastructure dropped significantly, especially for the dashed-paint type that is used in carriageways.
As shown in Figure 6, bike infrastructure provision per inhabitant positively correlates with bike flows along the measurement sections for the 2009-2024 period (slope=5777; =0.8225).
The trend suffers a steep change after 2019, during the COVID-19 outbreak and the change in bike network expansion strategy. If the regression analysis is repeated for the periods 2009-2019 and 2019-2024 separately, the regression results differ greatly from those found in the 2009-2024 period (Figure 7). Before 2019, when the meters of infrastructure were mainly of separated type, both slope and values (slope=10,871; =0.9775) are much greater than the 2009-2024 reference period. After 2019, slope and have a sheer decrease (slope=3415; =0.7355).
The same regression analysis was repeated using meters of only separated infrastructure per inhabitant, instead of total infrastructure length per inhabitant (excluding the on-road bike lane kilometers from 2020 to 2024). The regression for the whole period (2009-2024) features a higher slope (slope=9456; =0.9545) (Figure 8).
Some quite interesting results can be seen: the slope significantly increases also due to the reduction of the x axis values from 2020 to 2024; is definitely greater. Reaching a value above 0.95, it seems that this linear model (considering only separated bikeway provision) is much more capable of explaining the increase in bike flow than the one using all types of infrastructure. When doing the regression for the 2009-2019 and 2020-2024 periods separately, the 2020-2024 period still features a sheer greater value of slope and a way worse value (slope=11,090; =0.5203). with respect to the 2009-2019 period (slope=10,871; =0.9775) (Figure 9).
The results of the linear regressions, together with significance tests, are reported in Table 1. The coefficient denotes the intercept, and corresponds to the independent variable in Equation 1.
Models 2 and 4 yield identical results, since prior to 2019 all cycling infrastructure in Bologna was of the separated type.
The first three models in Table 1 consider all infrastructure types when computing per-capita provision. Both the model estimated on the full time series and the model restricted to 2009–2019, that is, before the introduction of on-road bike lanes, show a statistically significant with a strong . The model estimated on 2020–2024 data yields a only marginally significant , so it is not a reliable predictor, although the partial significance allows comparison of its with that from 2009–2019. The intercepts are not particularly informative in this context, since we have no prior expectation for their values, and the data points are far from the origin. As a result, none of these models should be used to predict outcomes near zero infrastructure provision. These results support the initial hypothesis: the introduction of mixed-use on-road bike lanes is scarcely associated with increased bicycle flows. Both the slope and its significance deteriorate markedly when meters per inhabitant of on-road bike lanes are considered. A possible counterargument is the limited number of post-2019 observations, and indeed, this analysis should be revisited as additional data become available.
The latter three models in Table 1 consider only separated infrastructure when computing per-capita provision. As with the first three models, both the model estimated on the full time series and the one restricted to 2009–2019, that is, before the introduction of on-road bike lanes, show a statistically significant with a strong . The model estimated on 2020–2024 data does not exhibit strong statistical significance. One possible reason is that, during 2020–2024, per-capita provision of separated bike lanes declined in some years, producing a cluster of observations. Bicycle demand is not expected to decline immediately as separated lanes are removed, and adaptation may take time, which complicates the identification of a clear pattern in these later data.
Models 4 and 5 perform best. Both consider only separated infrastructure and indicate a clear association between greater provision of separated facilities and higher bicycle traffic.
Gender related data is available only from 2015 to 2024, with some gaps in 2016 (no data) and 2018 (only general female share data). From 2015 to 2020 the share of female cyclists increased constantly (Figure 10). In 2020 the 45% of counted cyclists were female, while on separate infrastructure they made 48% of the total flow. After 2020 until 2024 the trend is decreasing, with 2024 data featuring only 42% female cyclists. In 2020, the bike network expansion was mainly driven by new bike lanes on mixed traffic roads and mixed traffic bike lanes (dash-painted bike lanes). The change in trend could be attributed to the more cautious behavior held by women cyclists [47]. On road bike lanes could be ineffective in attracting many new female bike users, thus lowering the female to male ratio of cyclists. The gap between share of female riders on all ways and only separated bikeways is either zero or in favor of separated infrastructure. Though, the gap registered was always quite small.
4. Discussion
After Covid-19, there was a significant drop in urban public transport users due to fear of contagion, thus creating favorable conditions for a significant increase in cycling. However, in some cities, this increase was much less widespread than expected. After 2020, in the city of Bologna, the rate of growth of bike flows with respect to new bike infrastructure decreased by almost 3 times with respect to 2009-2019 period. Even after the initial traffic disruptions caused by COVID-19, the trend does not give any sign of significant improvements. Mode choice is a phenomenon driven by a multitude of factors thoroughly studied in the field of environmental psychology [?], but as the sheer decrease in new flow coincides with the introduction of new on-road bike lanes instead of separated infrastructure, it would seem natural to identify the drop in perceived ride safety and comfort as the main driver of the phenomenon. These new bikeways share the same carriageways as motorized traffic users: they are delimited by dashed lines that allow other vehicles to temporarily occupy the bikeway space. Moreover, these new lanes are often packed between motor road on the left and roadside parking on the right, creating possible conflict points on both sides for cyclists. This precarious safety standard may have an even stronger impact on the female population, which is observed in literature to have a more cautious behavior when moving by bike. Our counting is consistent with this phenomenon as the share of female bike riders, even on separated bikeways, decreased from 48% in 2020 to 42% in 2024. This decreasing share of female riders could suggest that new bike infrastructures may be predominantly attracting male riders. Unfortunately, these results alone, related to the last 4 years, are not definitive evidence of a gender-related issue. To better understand if gender differences are a key driver of the phenomenon, it would be necessary to collect data related to successive years. There might also be other causes generating these results. One possibility is that the COVID-19 pandemic and the relative routine changes impacted travel behaviors in the medium to long term. Such an impact would be difficult to assess without studying long time series of all transport modes. A second possibility is that the newly built infrastructure had a reduced impact in the spots where the flows counting were performed. While the measuring spots were carefully picked to also capture flows from and to the city center, the new infrastructure expansion may have affected areas that escape our monitoring. Moreover, increasing housing prices may divert some demand away from the city center, where our counting is most effective. In conclusion, while there might be important secondary effects that bias our results, the change in trend is too sudden and precisely timed with the change in infrastructure building policy to discard the decrease in safety standards as the main driver of the phenomenon, especially considering the extensive body of literature documenting the strong negative effects of mixed-use bike lanes. Fostering bike mobility is to provide safe and comfortable infrastructure for the users. Bike mobility is not merely a matter of how much you build; it is about how you build it.
Author Contributions
Conceptualization, F.R. and G.B.; methodology, F.R. and G.B.; formal analysis, G.B.; investigation, F.R.; resources, F.R.; data curation, G.B. and F.R.; writing—original draft preparation, G.B.; writing—review and editing, G.B., F.R. and J.S.; visualization, G.B.; supervision, F.R. and J.S.; project administration, F.R.; funding acquisition, F.R. All authors have read and agreed to the published version of the manuscript.
Acknowledgments
This research was funded by the ECOSISTER project, Spoke 4, the Italian PNRR program, and the European Next Generation EU program. We are grateful to the Traffic Department of the city of Bologna for providing detector flows and bike infrastructure data.
Conflicts of Interest
The authors declare no conflicts of interest.
References
- Legambiente. Rapporto L’A Bi Ci, 2017.
- Nieuwenhuijsen, M.J. Urban and transport planning pathways to carbon neutral, liveable and healthy cities; A review of the current evidence. Environment international 2020, 140, 105661. [Google Scholar] [CrossRef]
- Dill, J.; Carr, T. Bicycle commuting and facilities in major US cities: if you build them, commuters will use them. Transportation research record 2003, 1828, 116–123. [Google Scholar] [CrossRef]
- Nelson, A.C.; Allen, D. If you build them, commuters will use them: association between bicycle facilities and bicycle commuting. Transportation research record 1997, 1578, 79–83. [Google Scholar] [CrossRef]
- Howard, C.; Burns, E.K. Cycling to work in Phoenix: Route choice, travel behavior, and commuter characteristics. Transportation Research Record 2001, 1773, 39–46. [Google Scholar] [CrossRef]
- Parkin, J.; Wardman, M.; Page, M. Estimation of the determinants of bicycle mode share for the journey to work using census data. Transportation 2008, 35, 93–109. [Google Scholar] [CrossRef]
- Pucher, J.; Komanoff, C.; Schimek, P. Bicycling renaissance in North America?: Recent trends and alternative policies to promote bicycling. Transportation Research Part A: Policy and Practice 1999, 33, 625–654. [Google Scholar]
- Landis, B.W.; Vattikuti, V.R.; Brannick, M.T. Real-time human perceptions: Toward a bicycle level of service. Transportation Research Record 1997, 1578, 119–126. [Google Scholar] [CrossRef]
- Axhausen, K.W.; Smith Jr, R. Bicyclist link evaluation: a stated-preference approach Transportation Research Record 1986, 1085, 7–15.
- Hunt, J.D.; Abraham, J.E. Influences on bicycle use. Transportation 2007, 34, 453–470. [Google Scholar] [CrossRef]
- Krizek, K.J. Two approaches to valuing some of bicycle facilities’ presumed benefits: Propose a session for the 2007 national planning conference in the city of brotherly love. Journal of the American Planning Association 2006, 72, 309–320. [Google Scholar] [CrossRef]
- Stinson, M.A.; Bhat, C.R. Commuter bicyclist route choice: Analysis using a stated preference survey. Transportation research record 2003, 1828, 107–115. [Google Scholar] [CrossRef]
- Tilahun, N.Y.; Levinson, D.M.; Krizek, K.J. Trails, lanes, or traffic: Valuing bicycle facilities with an adaptive stated preference survey. Transportation Research Part A: Policy and Practice 2007, 41, 287–301. [Google Scholar] [CrossRef]
- Winters, M.; Brauer, M.; Setton, E.M.; Teschke, K. Built environment influences on healthy transportation choices: bicycling versus driving. Journal of urban health 2010, 87, 969–993. [Google Scholar] [CrossRef] [PubMed]
- Winters, M.; Davidson, G.; Kao, D.; Teschke, K. Motivators and deterrents of bicycling: comparing influences on decisions to ride. Transportation 2011, 38, 153–168. [Google Scholar] [CrossRef]
- Forsyth, A.; Krizek, K.J.; Agrawal, A.W.; Stonebraker, E. Reliability testing of the Pedestrian and Bicycling Survey (PABS) method. Journal of physical activity and health 2012, 9, 677–688. [Google Scholar] [CrossRef] [PubMed]
- Dill, J. Bicycling for transportation and health: the role of infrastructure. Journal of public health policy 2009, 30, S95–S110. [Google Scholar] [CrossRef]
- Menghini, G.; Carrasco, N.; Schüssler, N.; Axhausen, K.W. Route choice of cyclists in Zurich. Transportation research part A: policy and practice 2010, 44, 754–765. [Google Scholar] [CrossRef]
- Hood, J.; Sall, E.; Charlton, B. A GPS-based bicycle route choice model for San Francisco, California. Transportation letters 2011, 3, 63–75. [Google Scholar] [CrossRef]
- Broach, J.; Dill, J.; Gliebe, J. Where do cyclists ride? A route choice model developed with revealed preference GPS data. Transportation Research Part A: Policy and Practice 2012, 46, 1730–1740. [Google Scholar] [CrossRef]
- Bernardi, S.; Krizek, K.J.; Rupi, F. Quantifying the role of disturbances and speeds on separated bicycle facilities. Journal of Transport and Land Use 2016, 9, 105–119. [Google Scholar] [CrossRef]
- Rupi, F.; Poliziani, C.; Schweizer, J. Data-driven bicycle network analysis based on traditional counting methods and GPS traces from smartphone. ISPRS International Journal of Geo-Information 2019, 8, 322. [Google Scholar] [CrossRef]
- Rupi, F.; Schweizer, J. Evaluating cyclist patterns using GPS data from smartphones. IET Intelligent Transport Systems 2018, 12, 279–285. [Google Scholar] [CrossRef]
- Rupi, F.; Poliziani, C.; Schweizer, J. Analysing the dynamic performances of a bicycle network with a temporal analysis of GPS traces. Case studies on transport policy 2020, 8, 770–777. [Google Scholar] [CrossRef]
- Pearson, L.; Reeder, S.; Gabbe, B.; Beck, B. What a girl wants: a mixed-methods study of gender differences in the barriers to and enablers of riding a bike in Australia. Transportation research part F: traffic psychology and behaviour 2023, 94, 453–465. [Google Scholar] [CrossRef]
- Aldred, R.; Elliott, B.; Woodcock, J.; Goodman, A. Cycling provision separated from motor traffic: a systematic review exploring whether stated preferences vary by gender and age. Transport reviews 2017, 37, 29–55. [Google Scholar] [CrossRef] [PubMed]
- Patterson, Z.; Ewing, G.; Haider, M. Gender-based analysis of work trip mode choice of commuters in suburban Montreal, Canada, with stated preference data. Transportation Research Record 2005, 1924, 85–93. [Google Scholar] [CrossRef]
- Dingil, A.E.; Rupi, F.; Esztergár-Kiss, D. An integrative review of socio-technical factors influencing travel decision-making and urban transport performance. Sustainability 2021, 13, 10158. [Google Scholar] [CrossRef]
- Sung, H. Causal impacts of the COVID-19 pandemic on daily ridership of public bicycle sharing in Seoul. Sustainable cities and society 2023, 89, 104344. [Google Scholar] [CrossRef] [PubMed]
- Zafri, N.M.; Khan, A.; Jamal, S.; Alam, B.M. Risk perceptions of COVID-19 transmission in different travel modes. Transportation research interdisciplinary perspectives 2022, 13, 100548. [Google Scholar] [CrossRef]
- Anke, J.; Francke, A.; Schaefer, L.M.; Petzoldt, T. Impact of SARS-CoV-2 on the mobility behaviour in Germany. European Transport Research Review 2021, 13, 100548. [Google Scholar] [CrossRef]
- Ehsani, J.P.; Michael, J.P.; Duren, M.L.; Mui, Y.; Porter, K.M.P. Mobility patterns before, during, and anticipated after the COVID-19 pandemic: An opportunity to nurture bicycling. American journal of preventive medicine 2021, 60, e277–e279. [Google Scholar] [CrossRef]
- Harrington, D.M.; Hadjiconstantinou, M. Changes in commuting behaviours in response to the COVID-19 pandemic in the UK. Journal of transport & health 2022, 24, 101313. [Google Scholar]
- Monterde-i Bort, H.; Sucha, M.; Risser, R.; Kochetova, T. Mobility patterns and mode choice preferences during the COVID-19 situation. Sustainability 2022, 14, 768. [Google Scholar] [CrossRef]
- Nikitas, A.; Tsigdinos, S.; Karolemeas, C.; Kourmpa, E.; Bakogiannis, E. Cycling in the era of COVID-19: Lessons learnt and best practice policy recommendations for a more bike-centric future. Sustainability 2021, 13, 4620. [Google Scholar] [CrossRef]
- Lecouteux, G.; Moulin, L. Cycling in the aftermath of COVID-19: An empirical estimation of the social dynamics of bicycle adoption in Paris. Transportation research interdisciplinary perspectives 2024, 25, 101115. [Google Scholar] [CrossRef]
- Kraus, S.; Koch, N. Provisional COVID-19 infrastructure induces large, rapid increases in cycling. Proceedings of the National Academy of Sciences 2021, 118, e2024399118. [Google Scholar] [CrossRef] [PubMed]
- Irawan, M.Z.; Andani, I.G.A.; Hasanah, A.; Bastarianto, F.F. Do cycling facilities matter during the COVID-19 outbreak? A stated preference survey of willingness to adopt bicycles in an Indonesian context. Asian Transport Studies 2023, 9, 100100. [Google Scholar] [CrossRef]
- Comune di Bologna I numeri di Bologna Metropolitana: demografia, 2024.
- Comune di Bologna I numeri di Bologna Metropolitana: indagine casa lavoro nel comune di bologna, 2023.
- ISTAT - Istituto Nazionale di Statistica Aspetti della vita quotidiana.
- Directorate-General for Communication Special Eurobarometer 495: Mobility and transport, 2019.
- Comune di Bologna I numeri di Bologna Metropolitana: piste ciclabili, 2024.
- Comune di Bologna Sustaineble Urban Mobility Plan of Metropolitan Bologna.
- ISTAT - Istituto Nazionale di Statistica Mobilità Urbana.
- Ancma-Legambiente. Infrastrutture e politiche di incentivazione per moto e biciclette nei comuni capoluogo italiani, 2024.
- Rupi, F.; Freo, M.; Poliziani, C.; Postorino, M.N.; Schweizer, J. Analysis of gender-specific bicycle route choices using revealed preference surveys based on GPS traces. Transport policy 2023, 133, 1–14. [Google Scholar] [CrossRef]
Figure 1.
Example of cycle lane (on the right of the carriageway) introduced in Italy by Legislative Decree no. 76 of 16 July 2020 in the city of Bologna.
Figure 1.
Example of cycle lane (on the right of the carriageway) introduced in Italy by Legislative Decree no. 76 of 16 July 2020 in the city of Bologna.

Figure 2.
. Map of Bologna’s main metropolitan bikeway network (does not include local access bike paths).[44]
Figure 2.
. Map of Bologna’s main metropolitan bikeway network (does not include local access bike paths).[44]
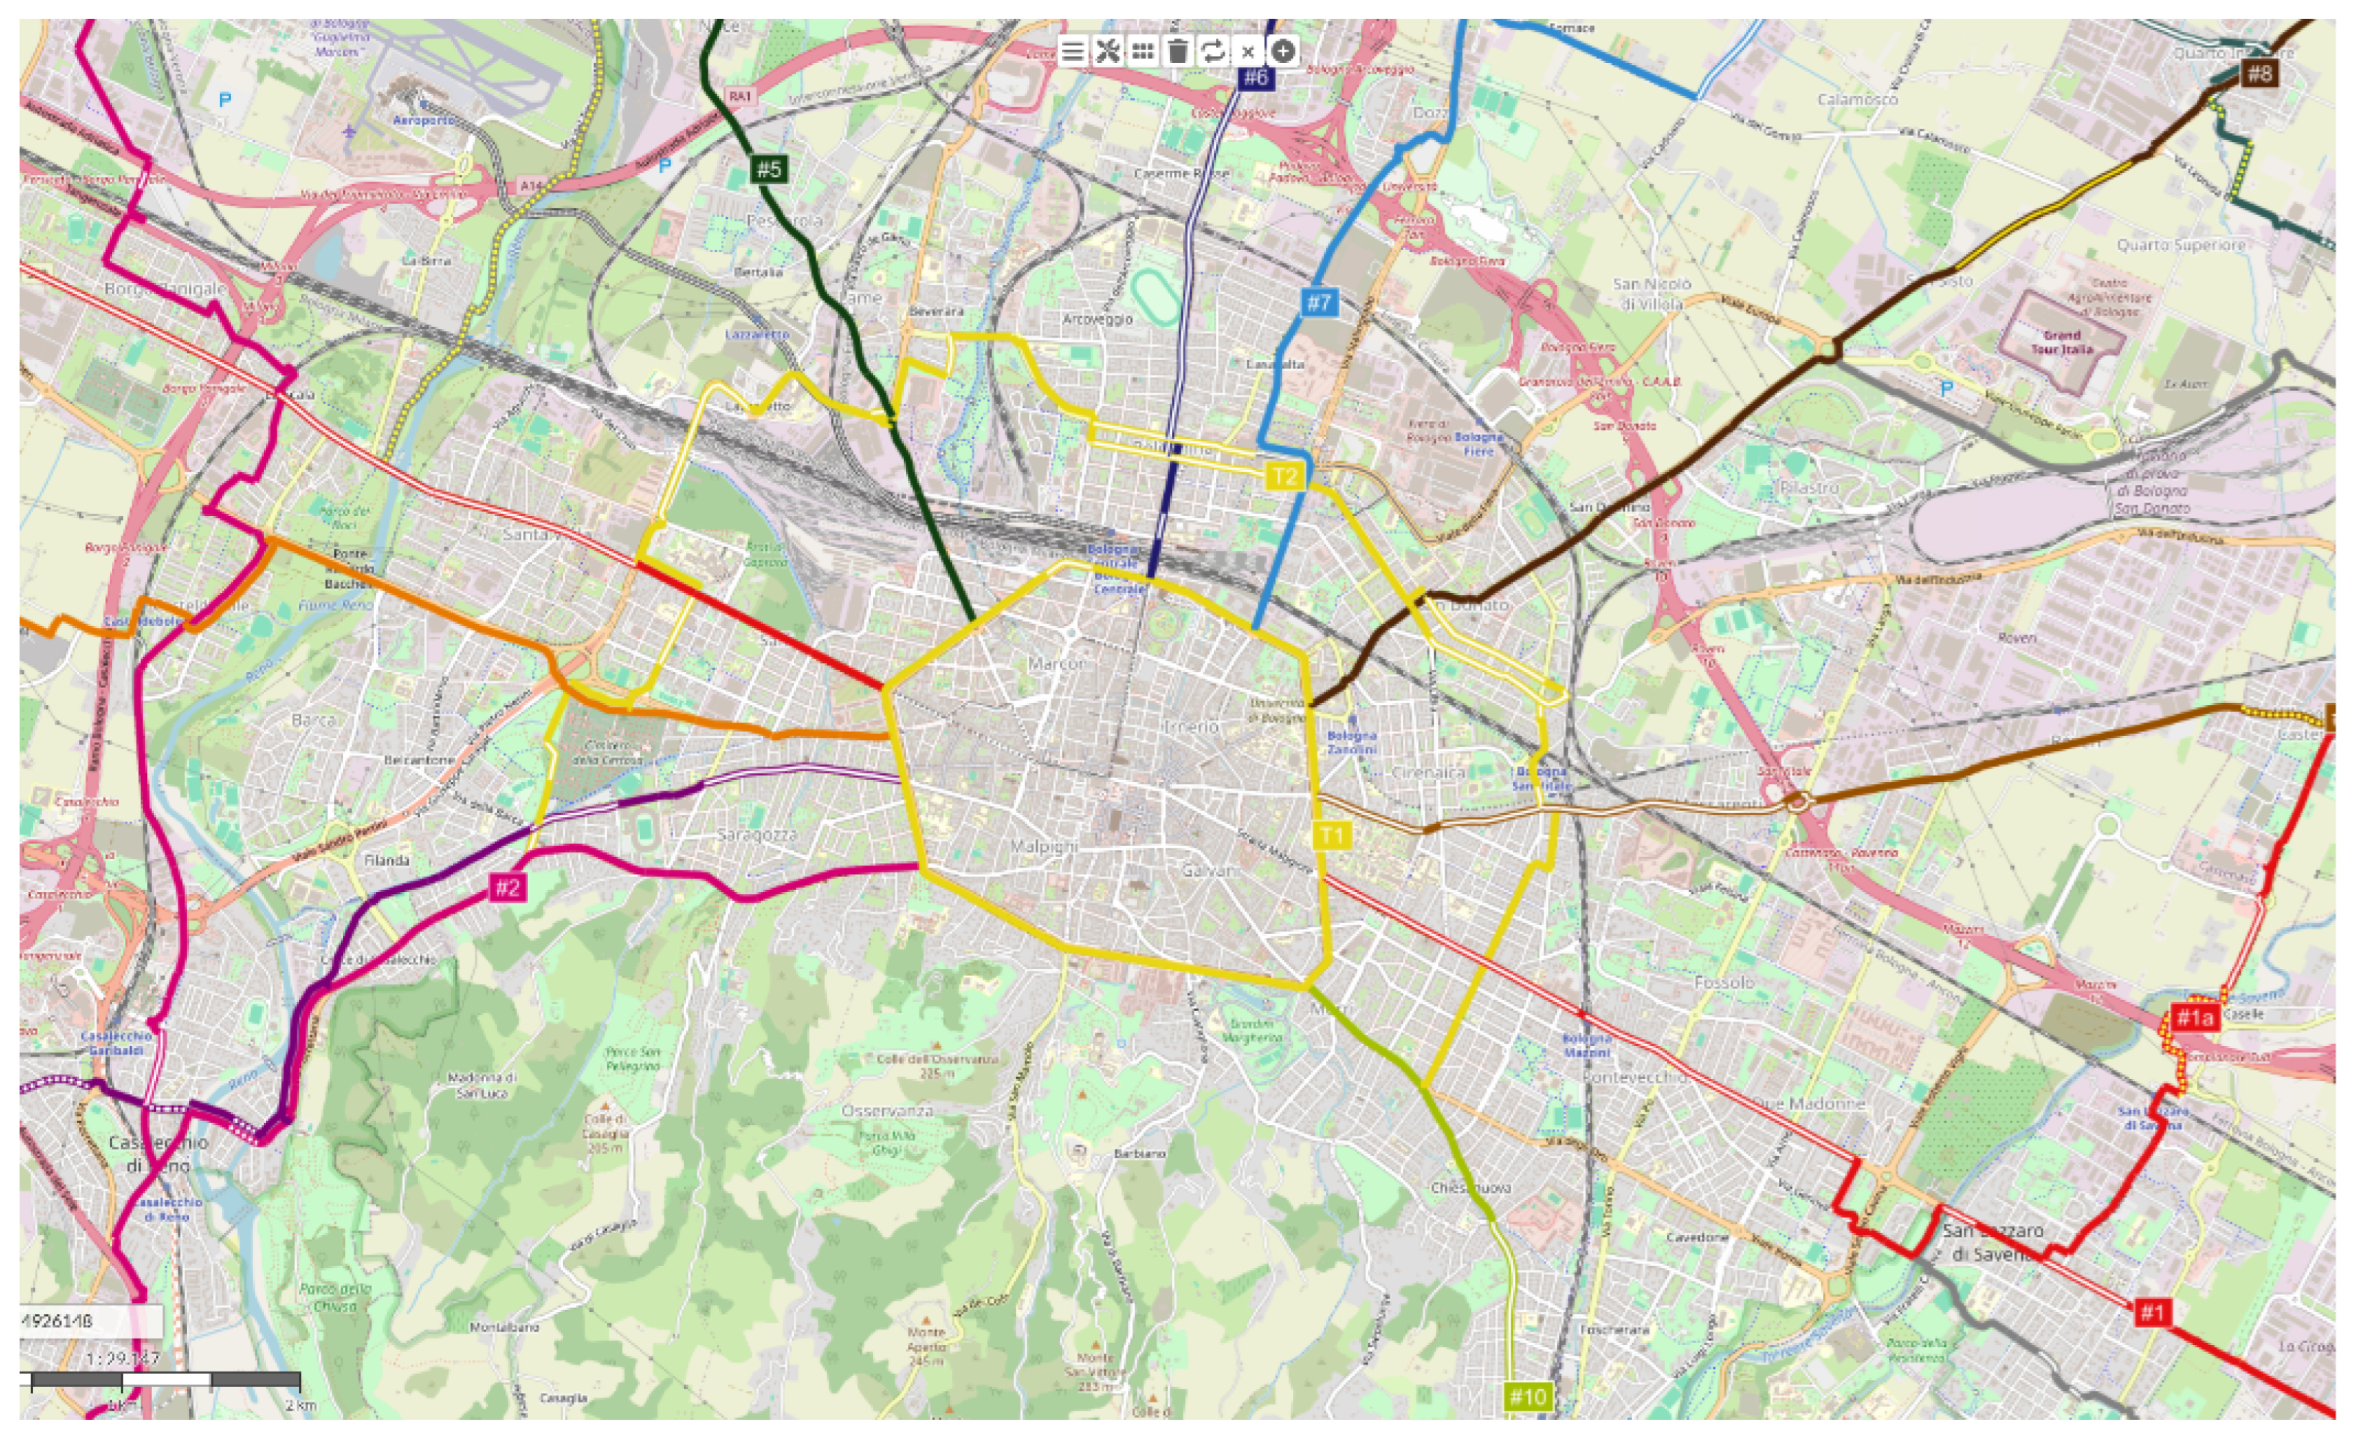
Figure 3.
Growth of Bologna’s and Italian bike infrastructure with respect to 2009. (Italian territory data of 2024 is currently unavailable)
Figure 3.
Growth of Bologna’s and Italian bike infrastructure with respect to 2009. (Italian territory data of 2024 is currently unavailable)
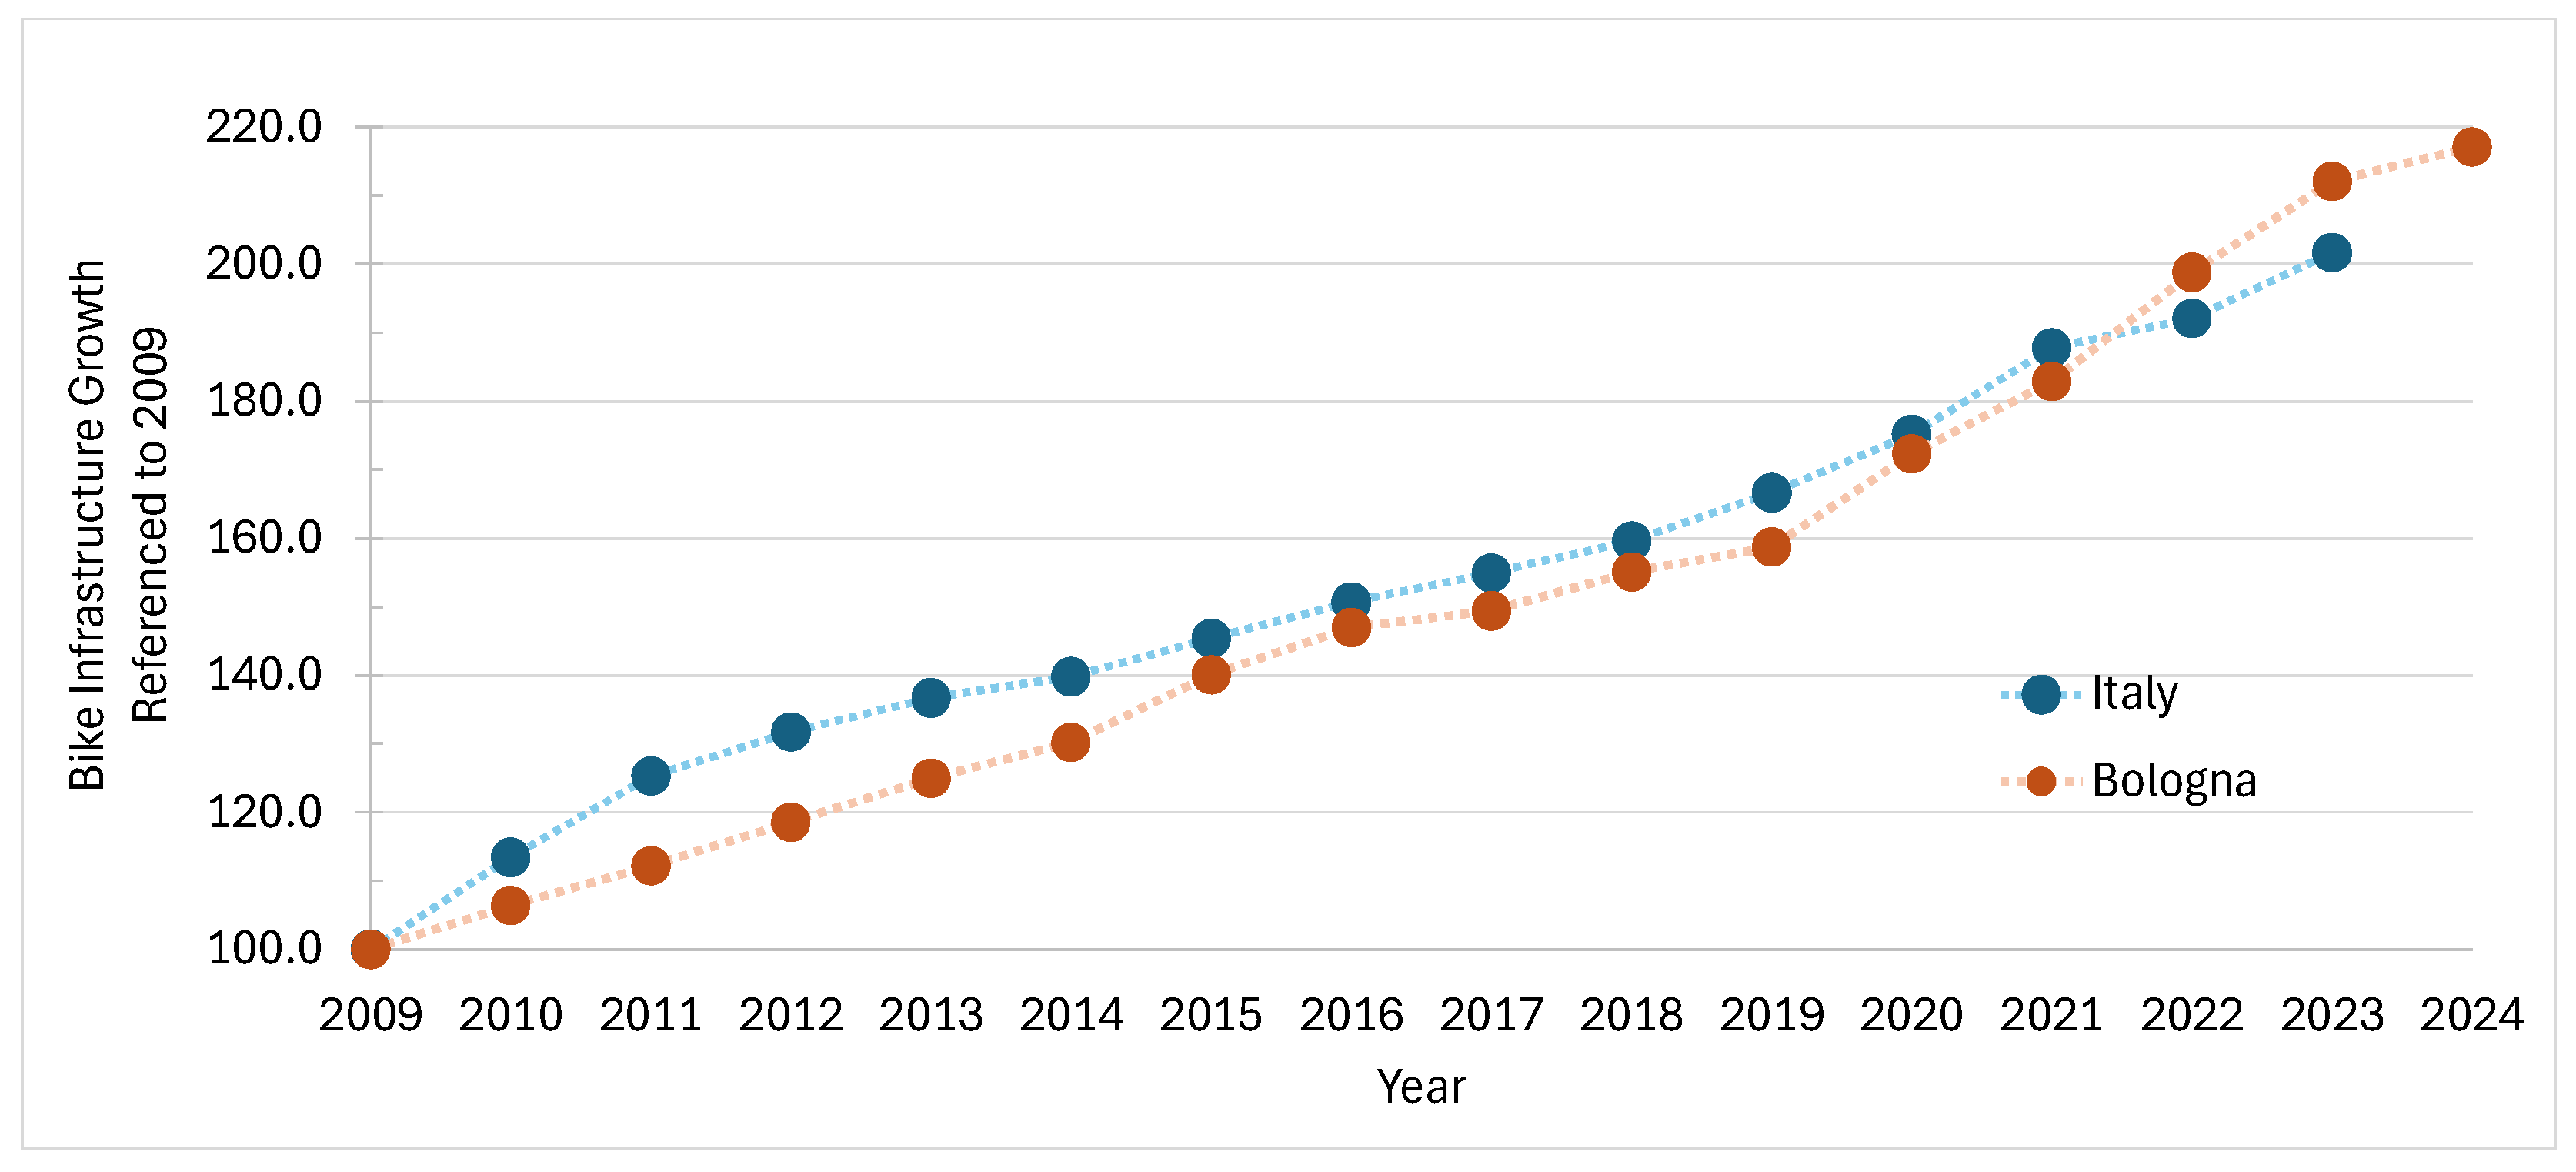
Figure 4.
Measurement spots of bike flows.
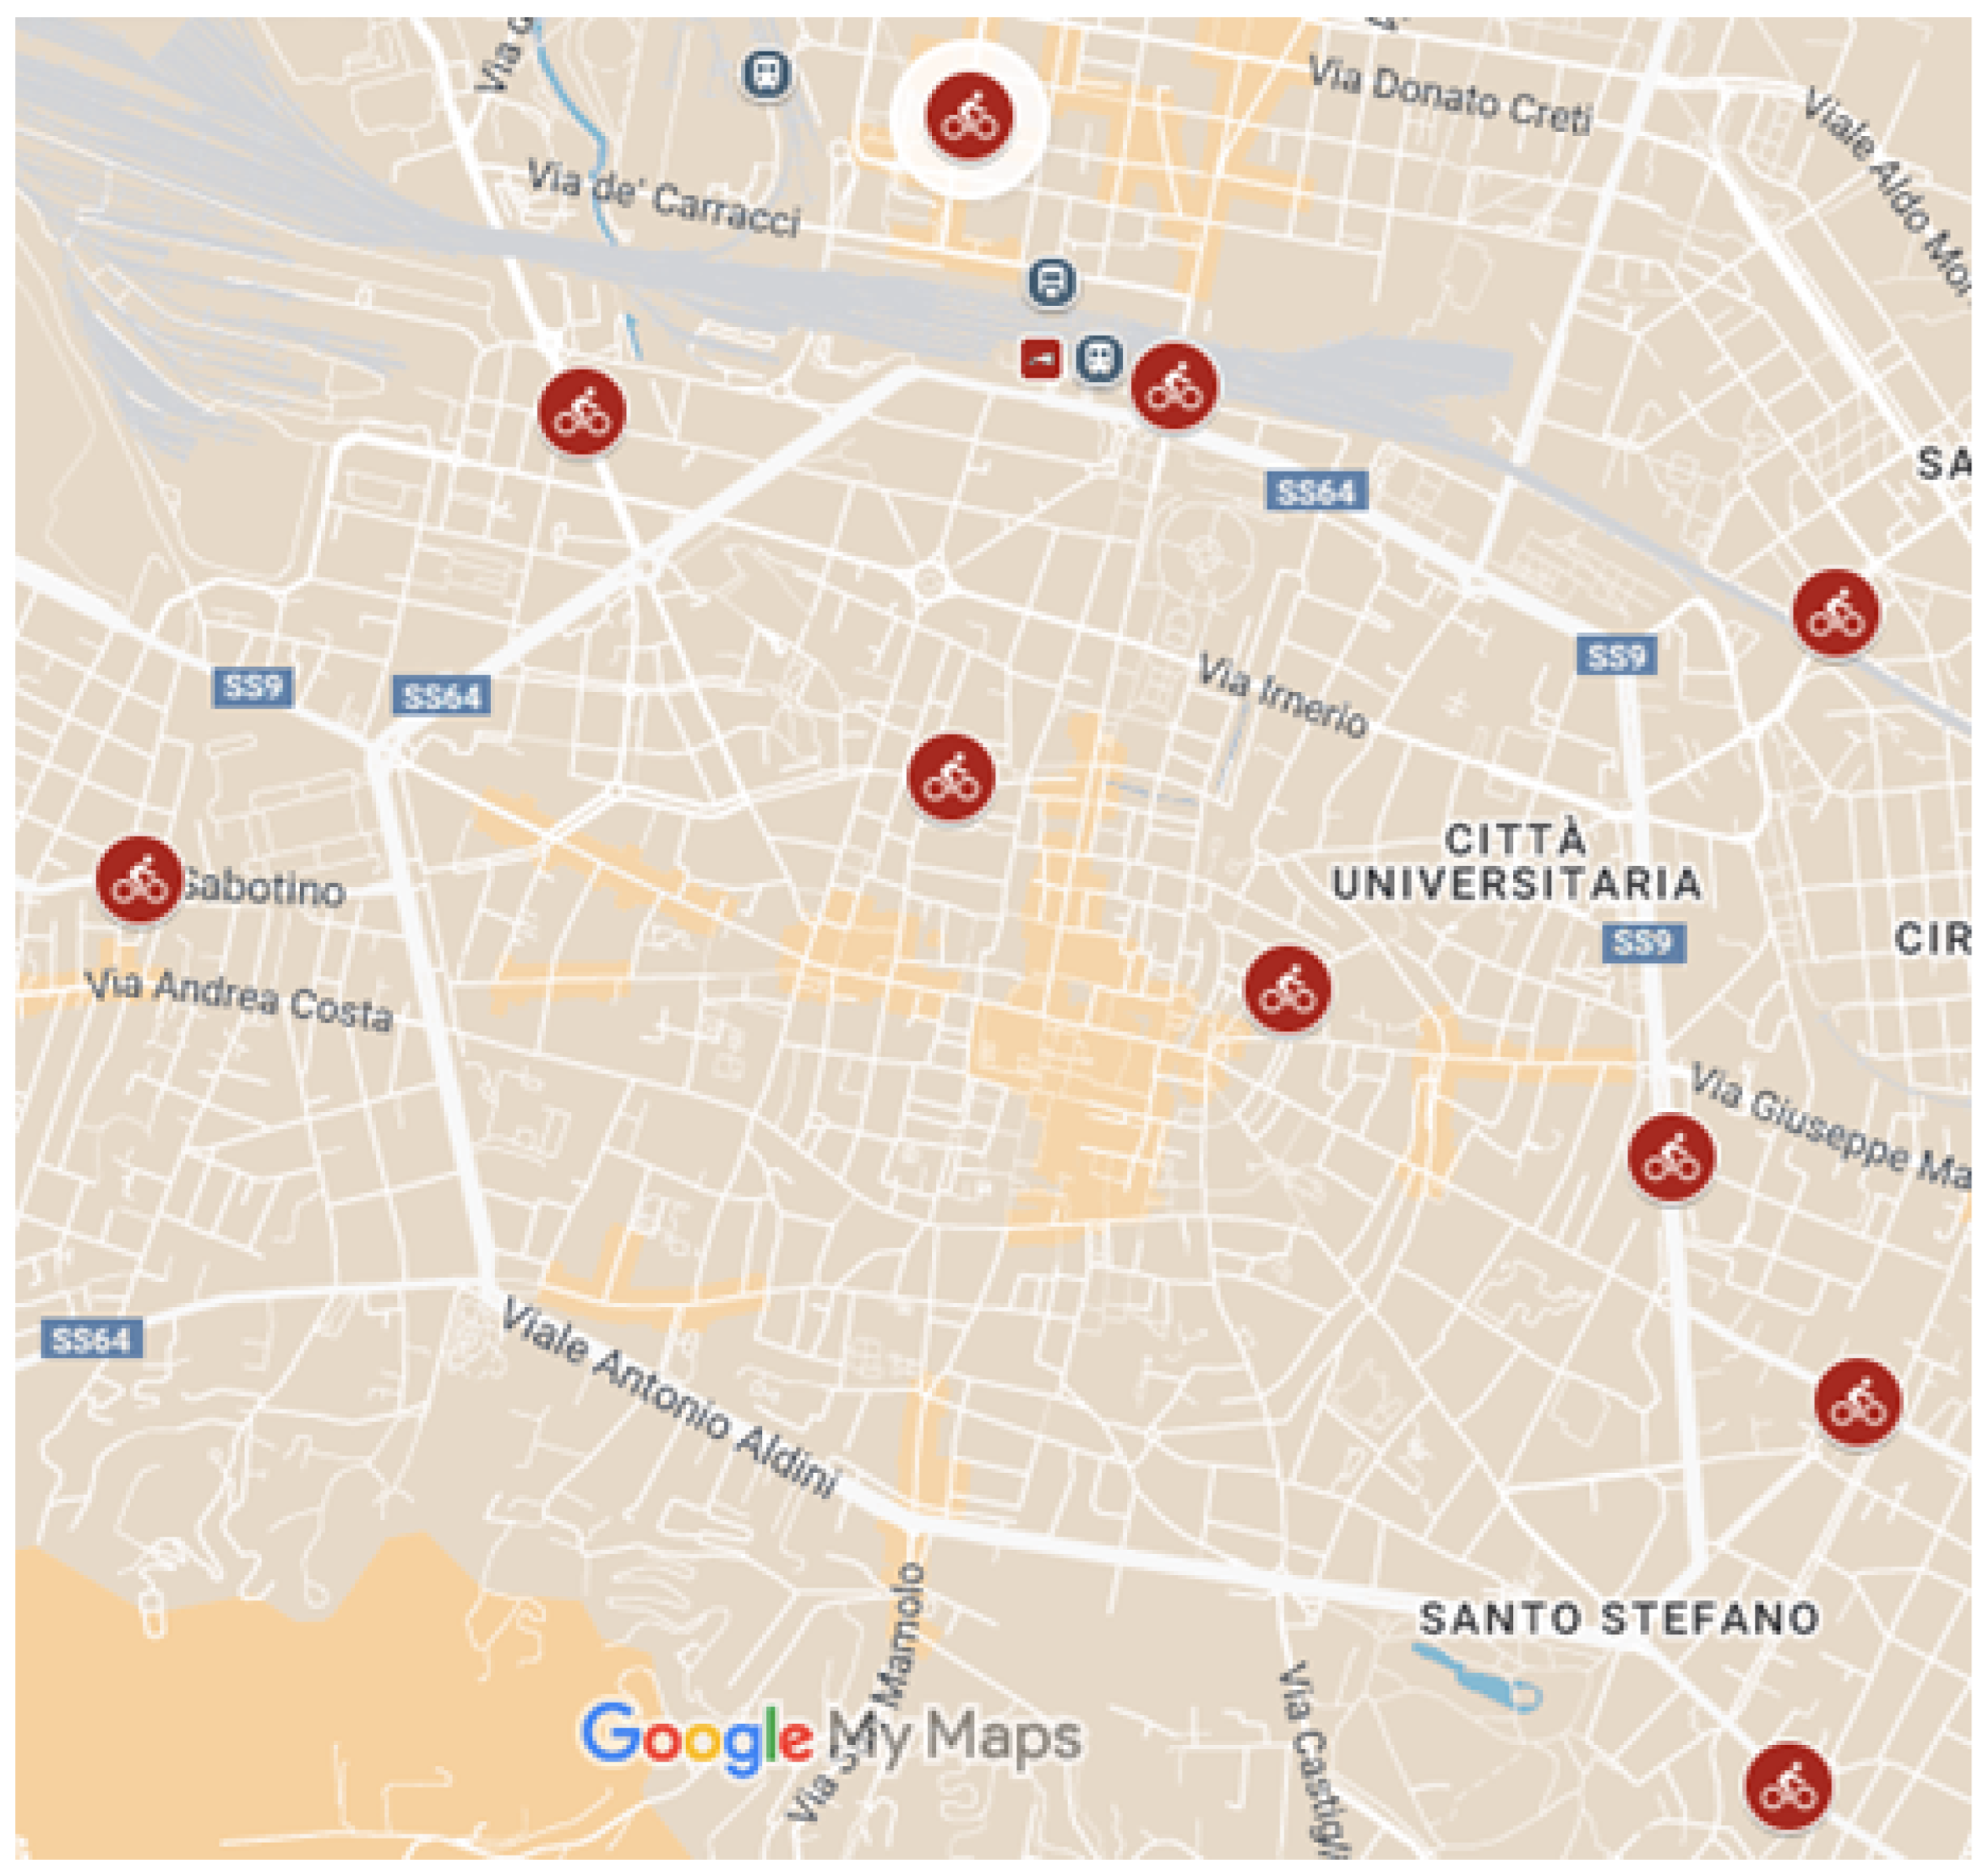
Figure 5.
Length of Bologna’s bike infrastructure per separation type from 2009 to 2024.
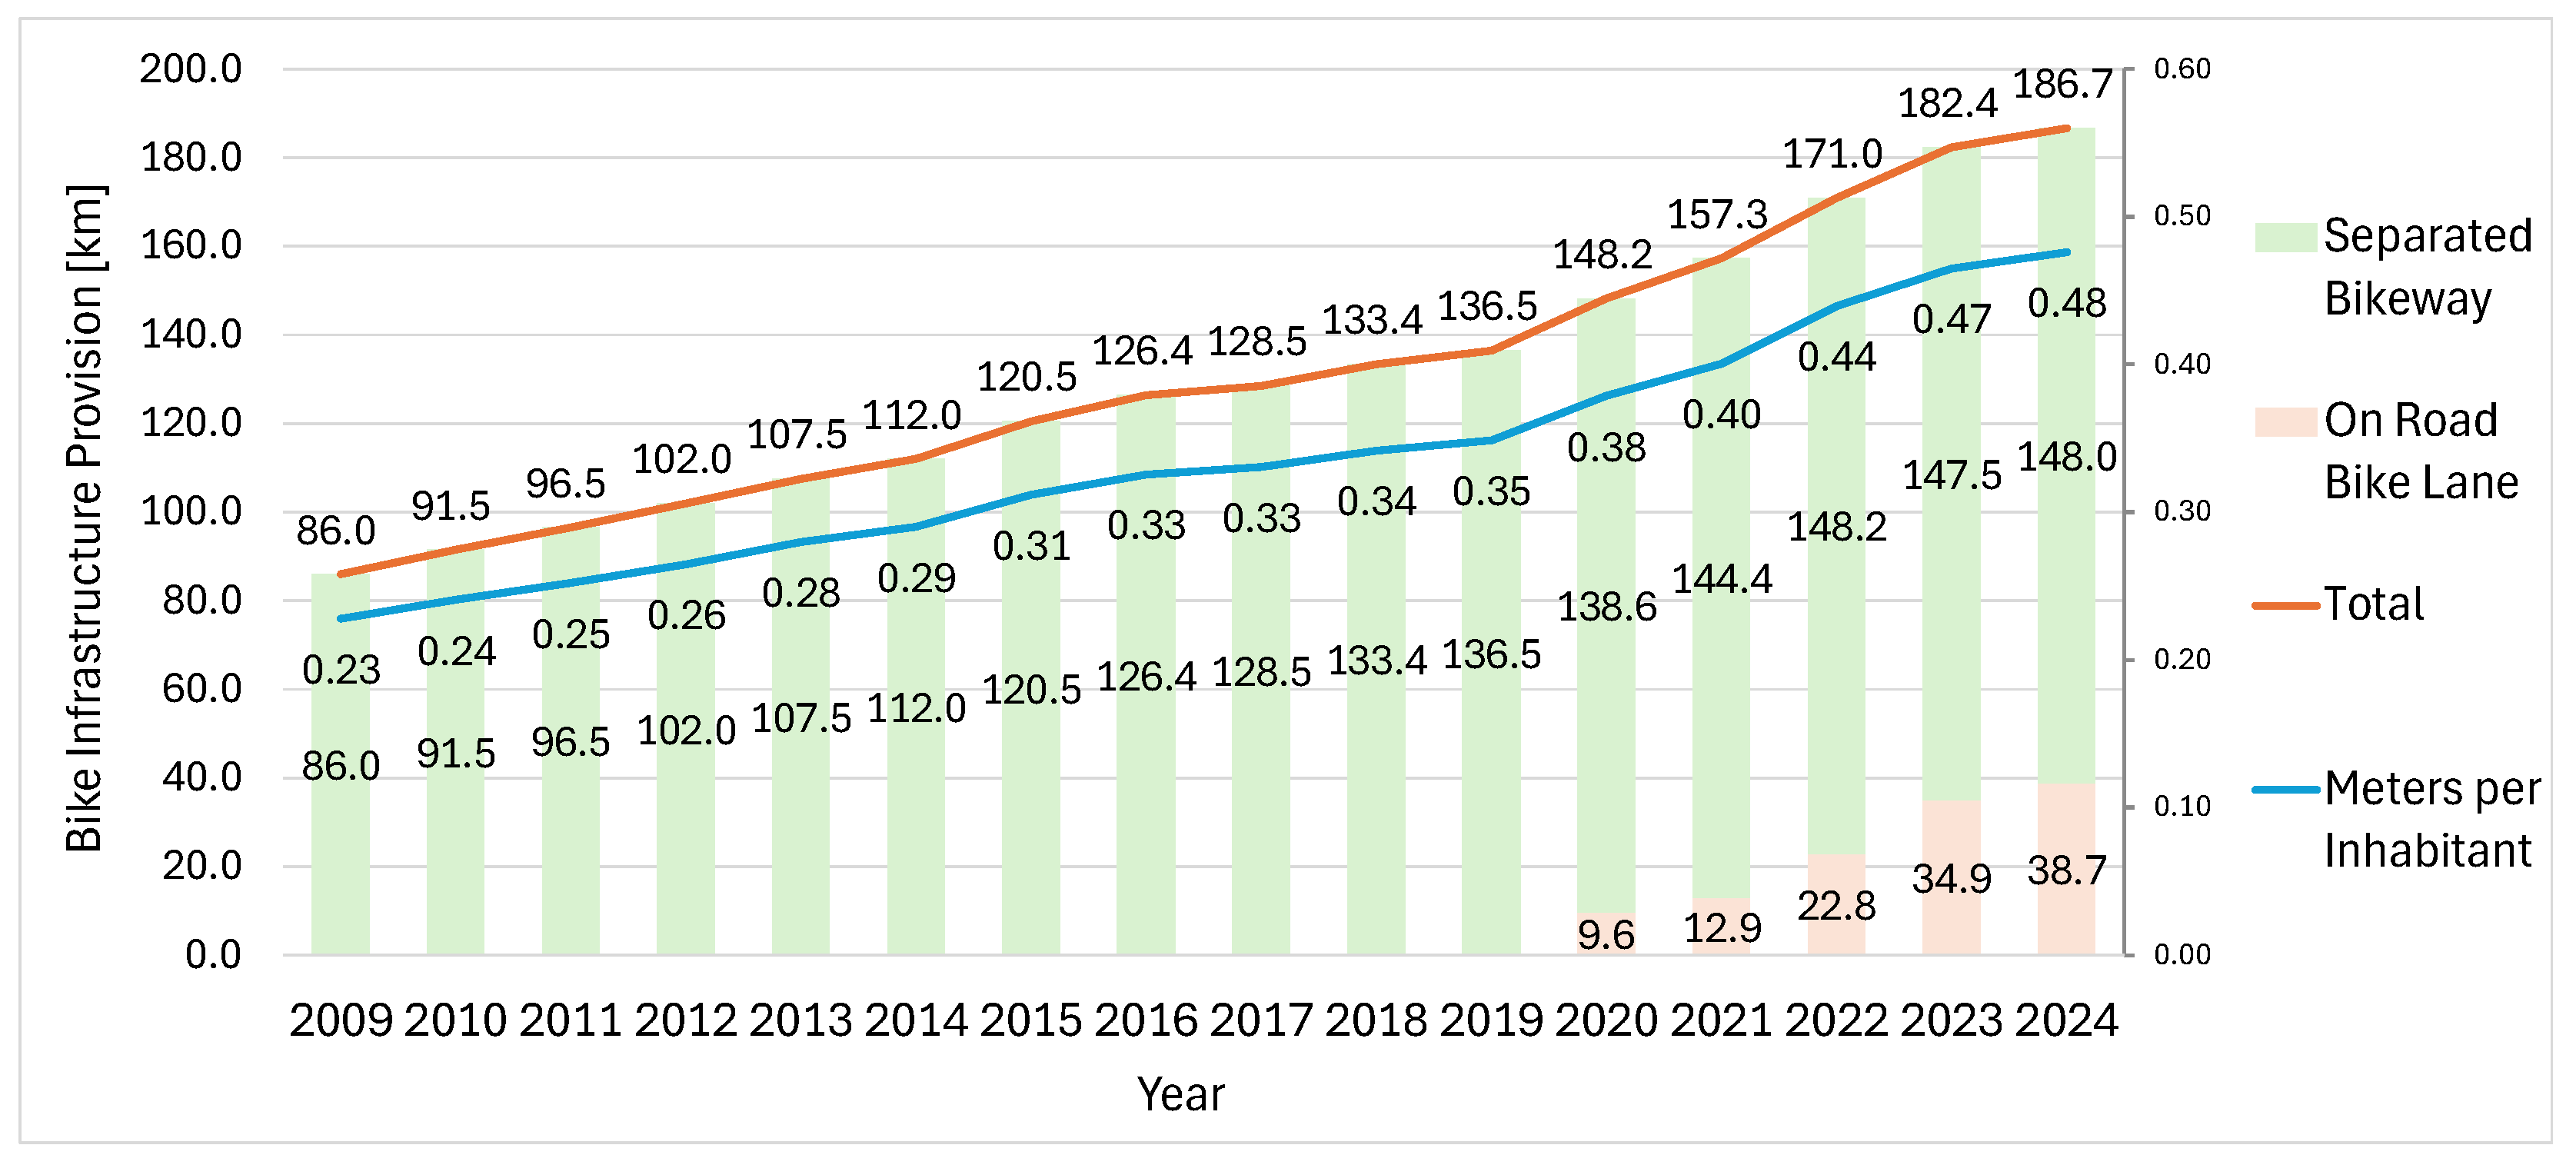
Figure 6.
Bike flows measured (cyclists/hour) vs bike infrastructure provision per inhabitant (meters/inhabitant). Regression line and its equation for 2009-2024 period.
Figure 6.
Bike flows measured (cyclists/hour) vs bike infrastructure provision per inhabitant (meters/inhabitant). Regression line and its equation for 2009-2024 period.
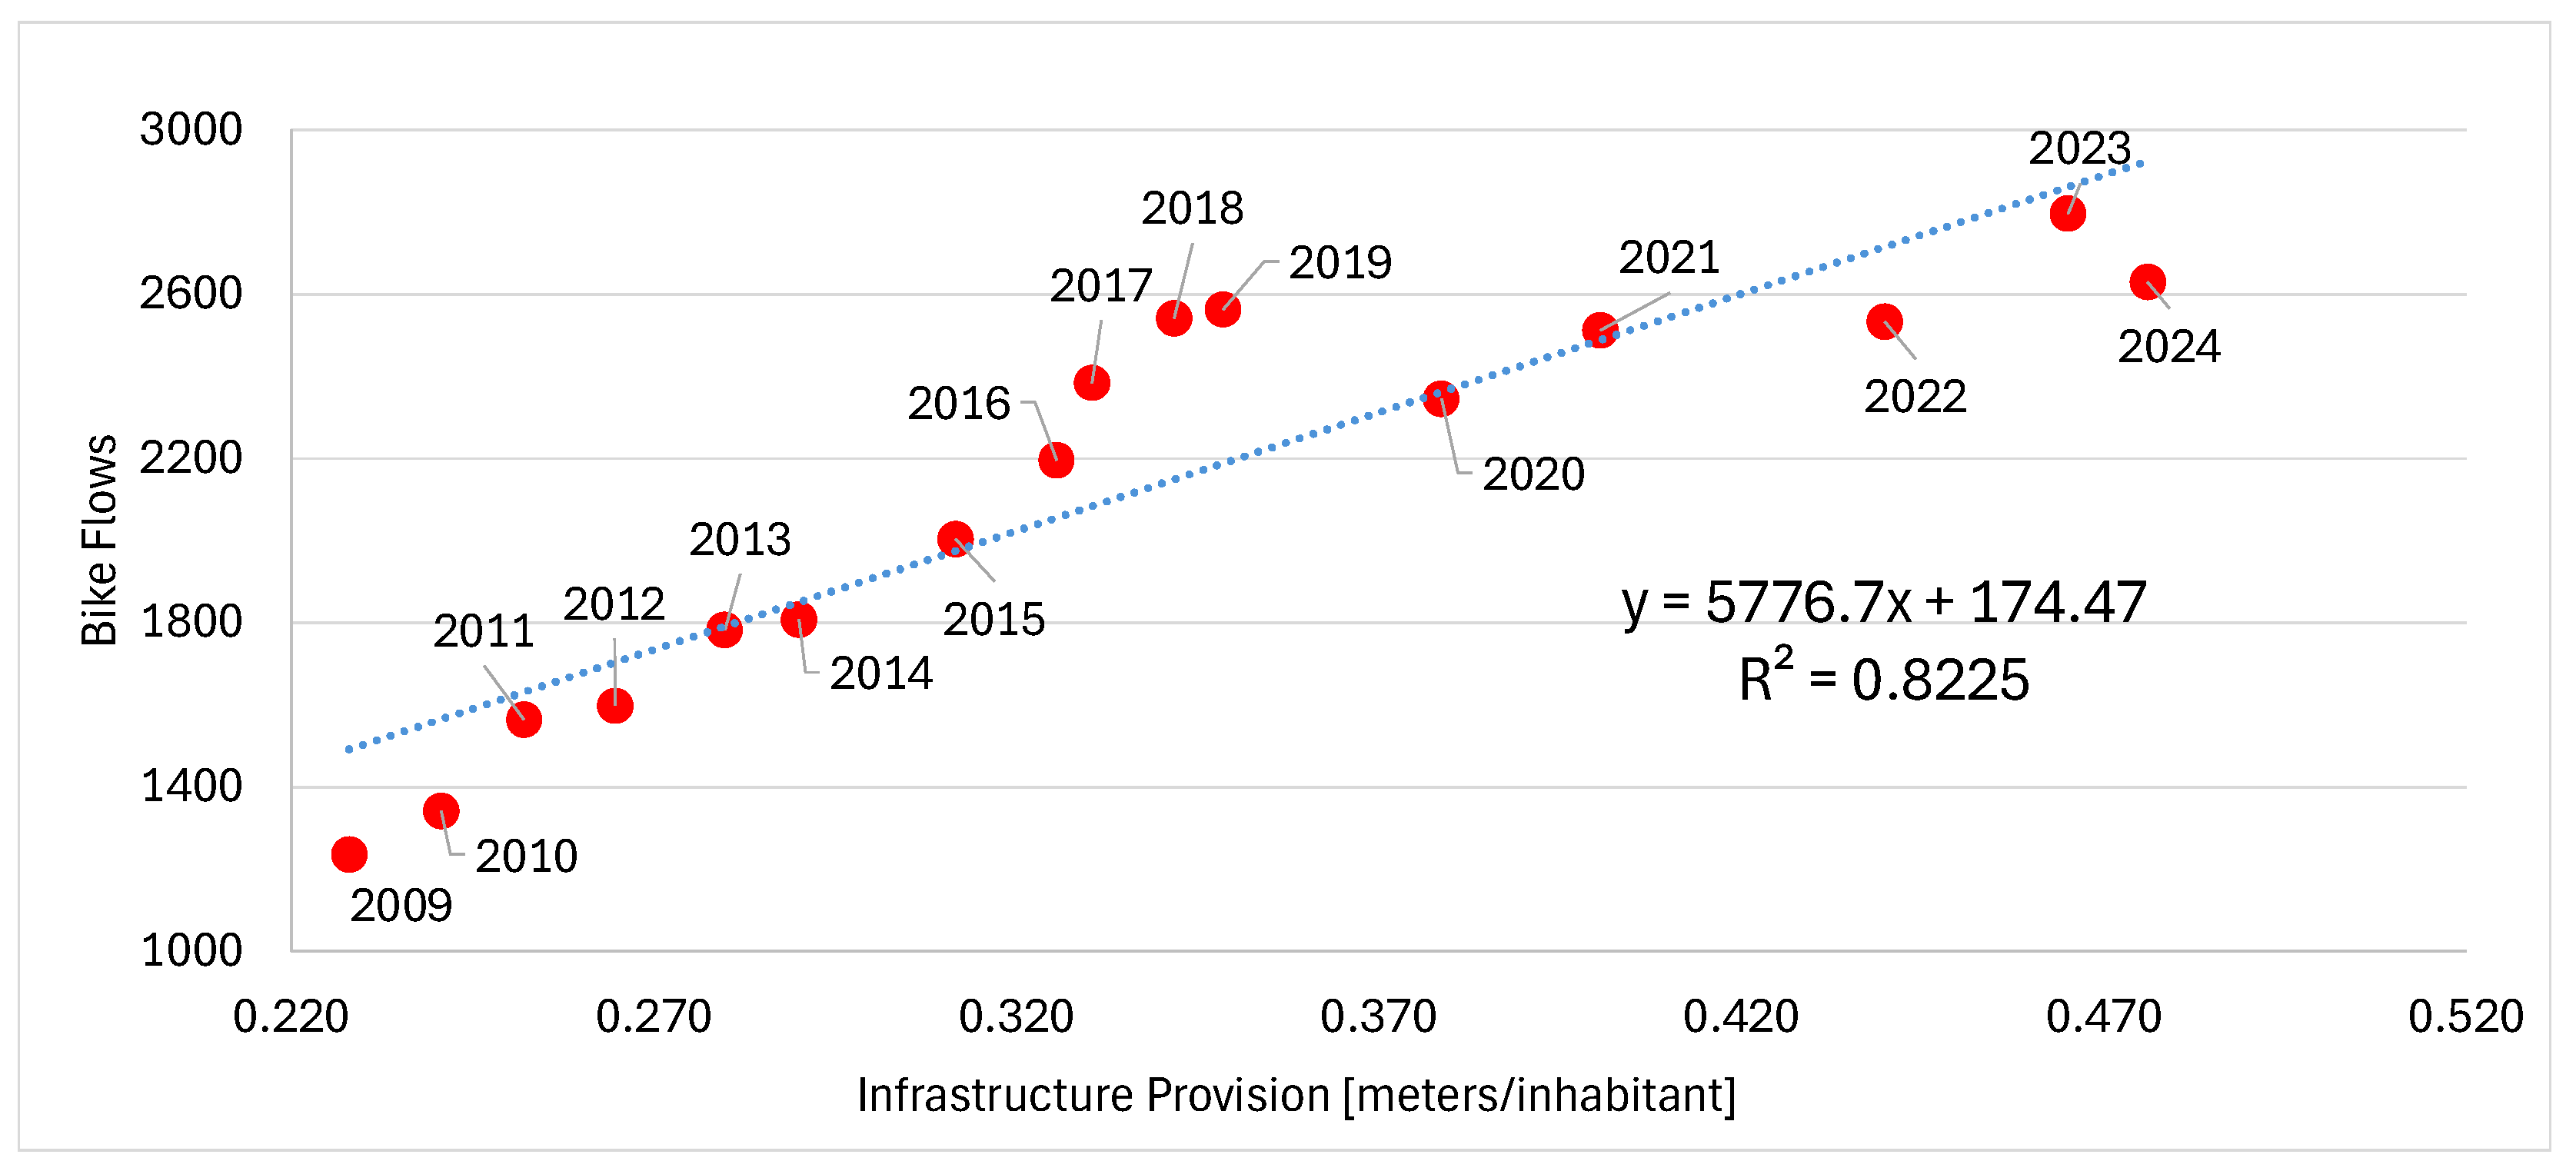
Figure 7.
Bike flows measured (cyclists/hour) vs bike infrastructure provision per inhabitant (meters/inhabitant). Regression lines and their equations for 2009-2019 and 2020-2024 periods.
Figure 7.
Bike flows measured (cyclists/hour) vs bike infrastructure provision per inhabitant (meters/inhabitant). Regression lines and their equations for 2009-2019 and 2020-2024 periods.
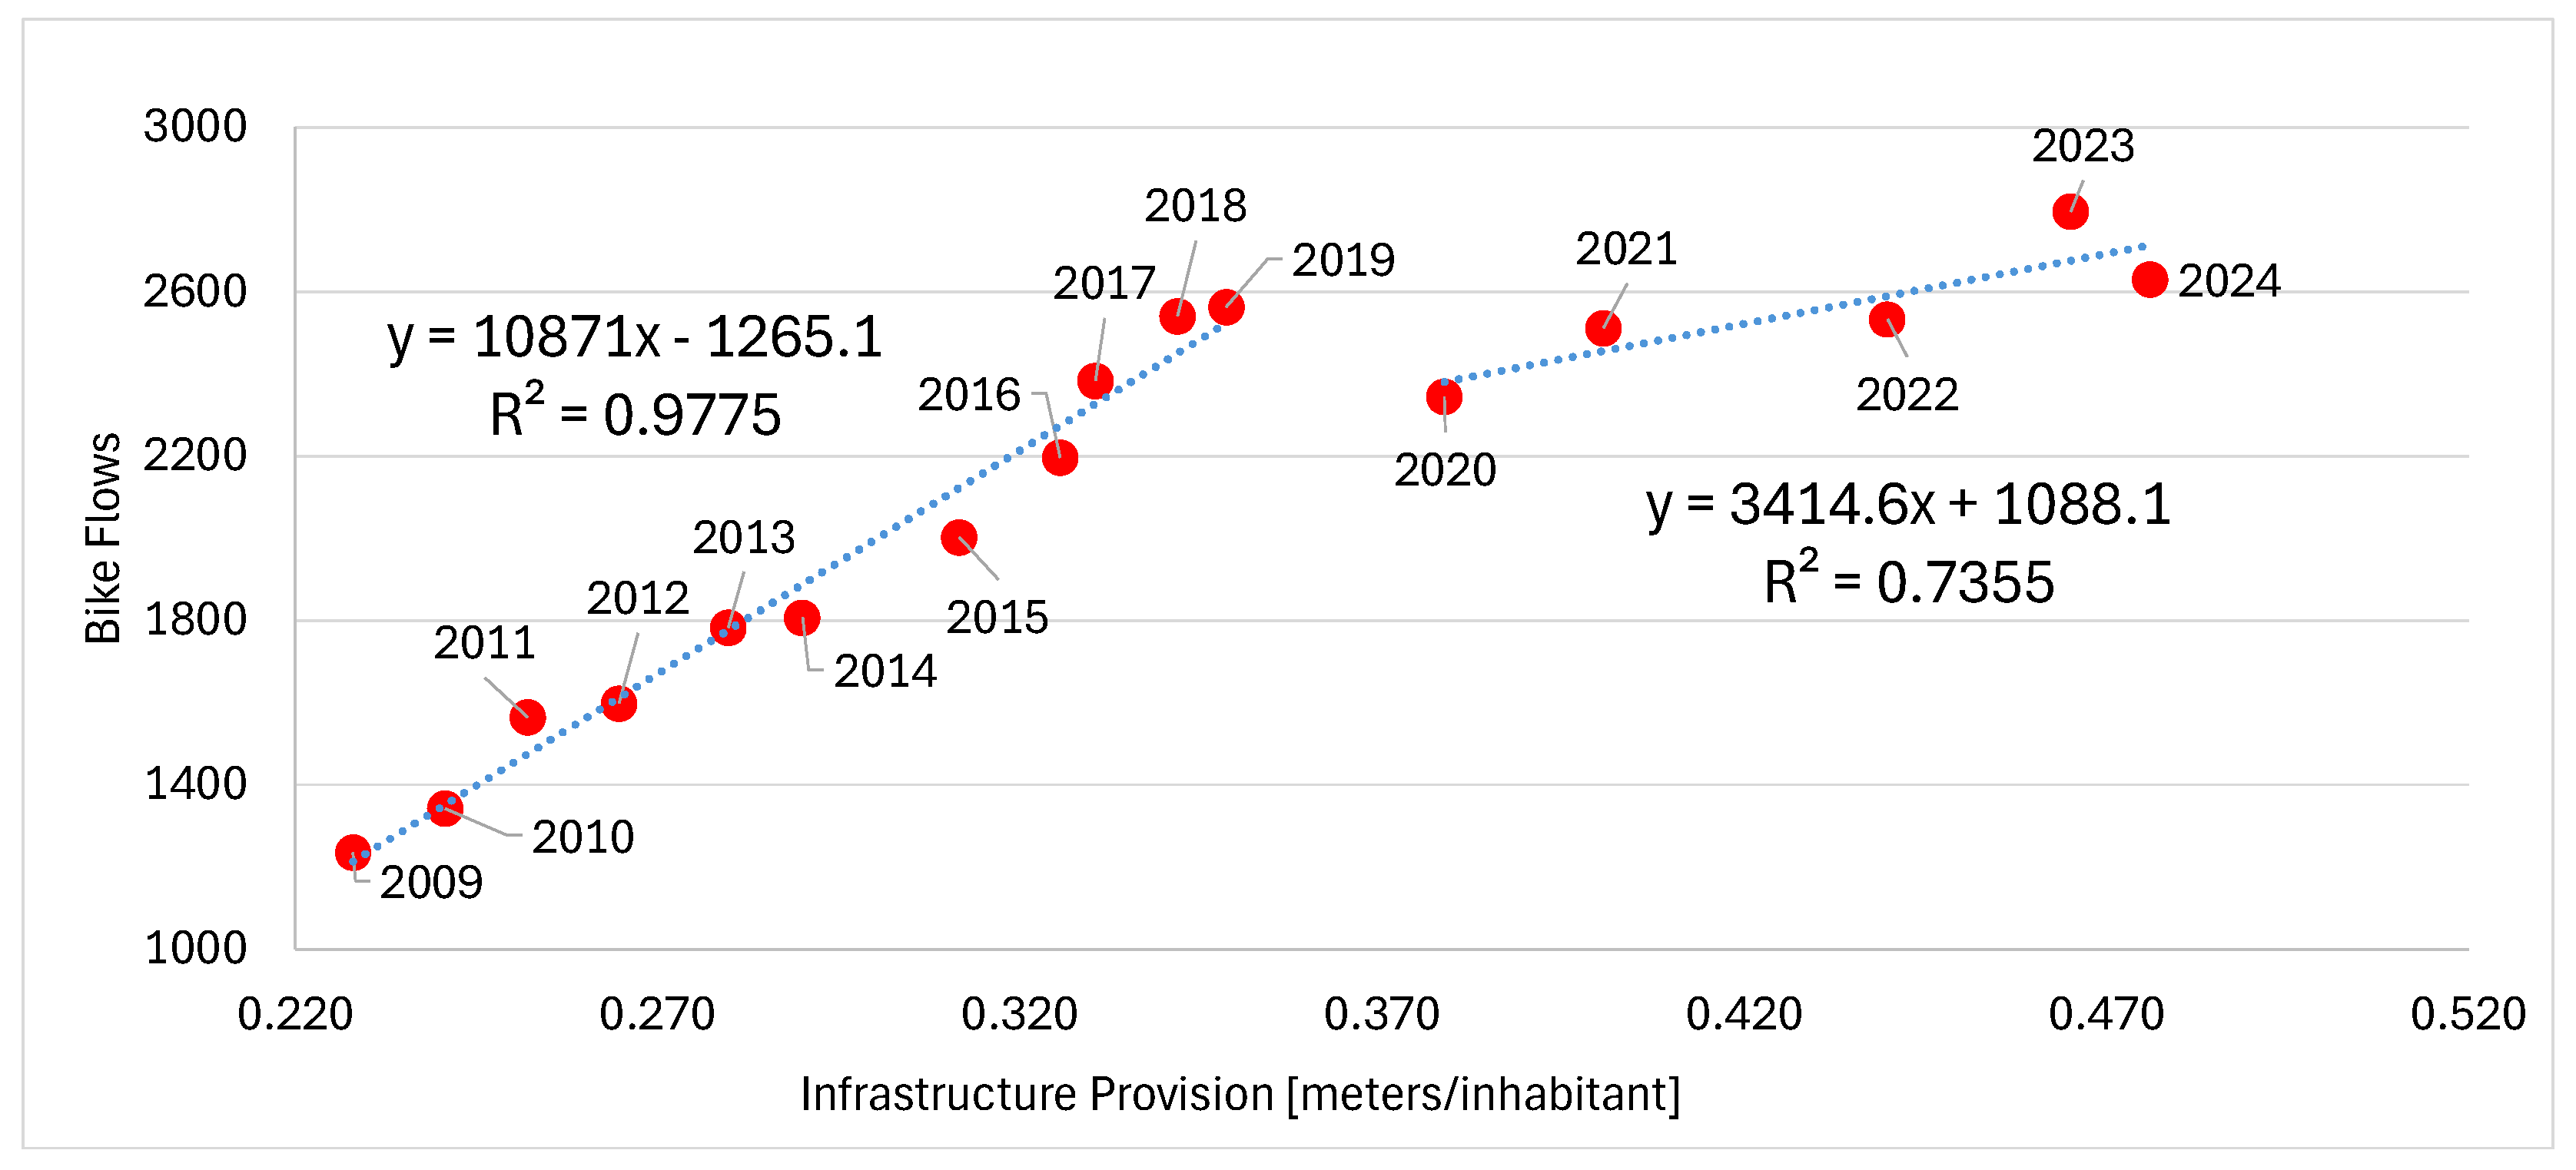
Figure 8.
Bike flows measured (cyclists/hour) vs separated bike infrastructure provision per inhabitant (meters/inhabitant). Regression lines and their equations for 2009-2024 period.
Figure 8.
Bike flows measured (cyclists/hour) vs separated bike infrastructure provision per inhabitant (meters/inhabitant). Regression lines and their equations for 2009-2024 period.
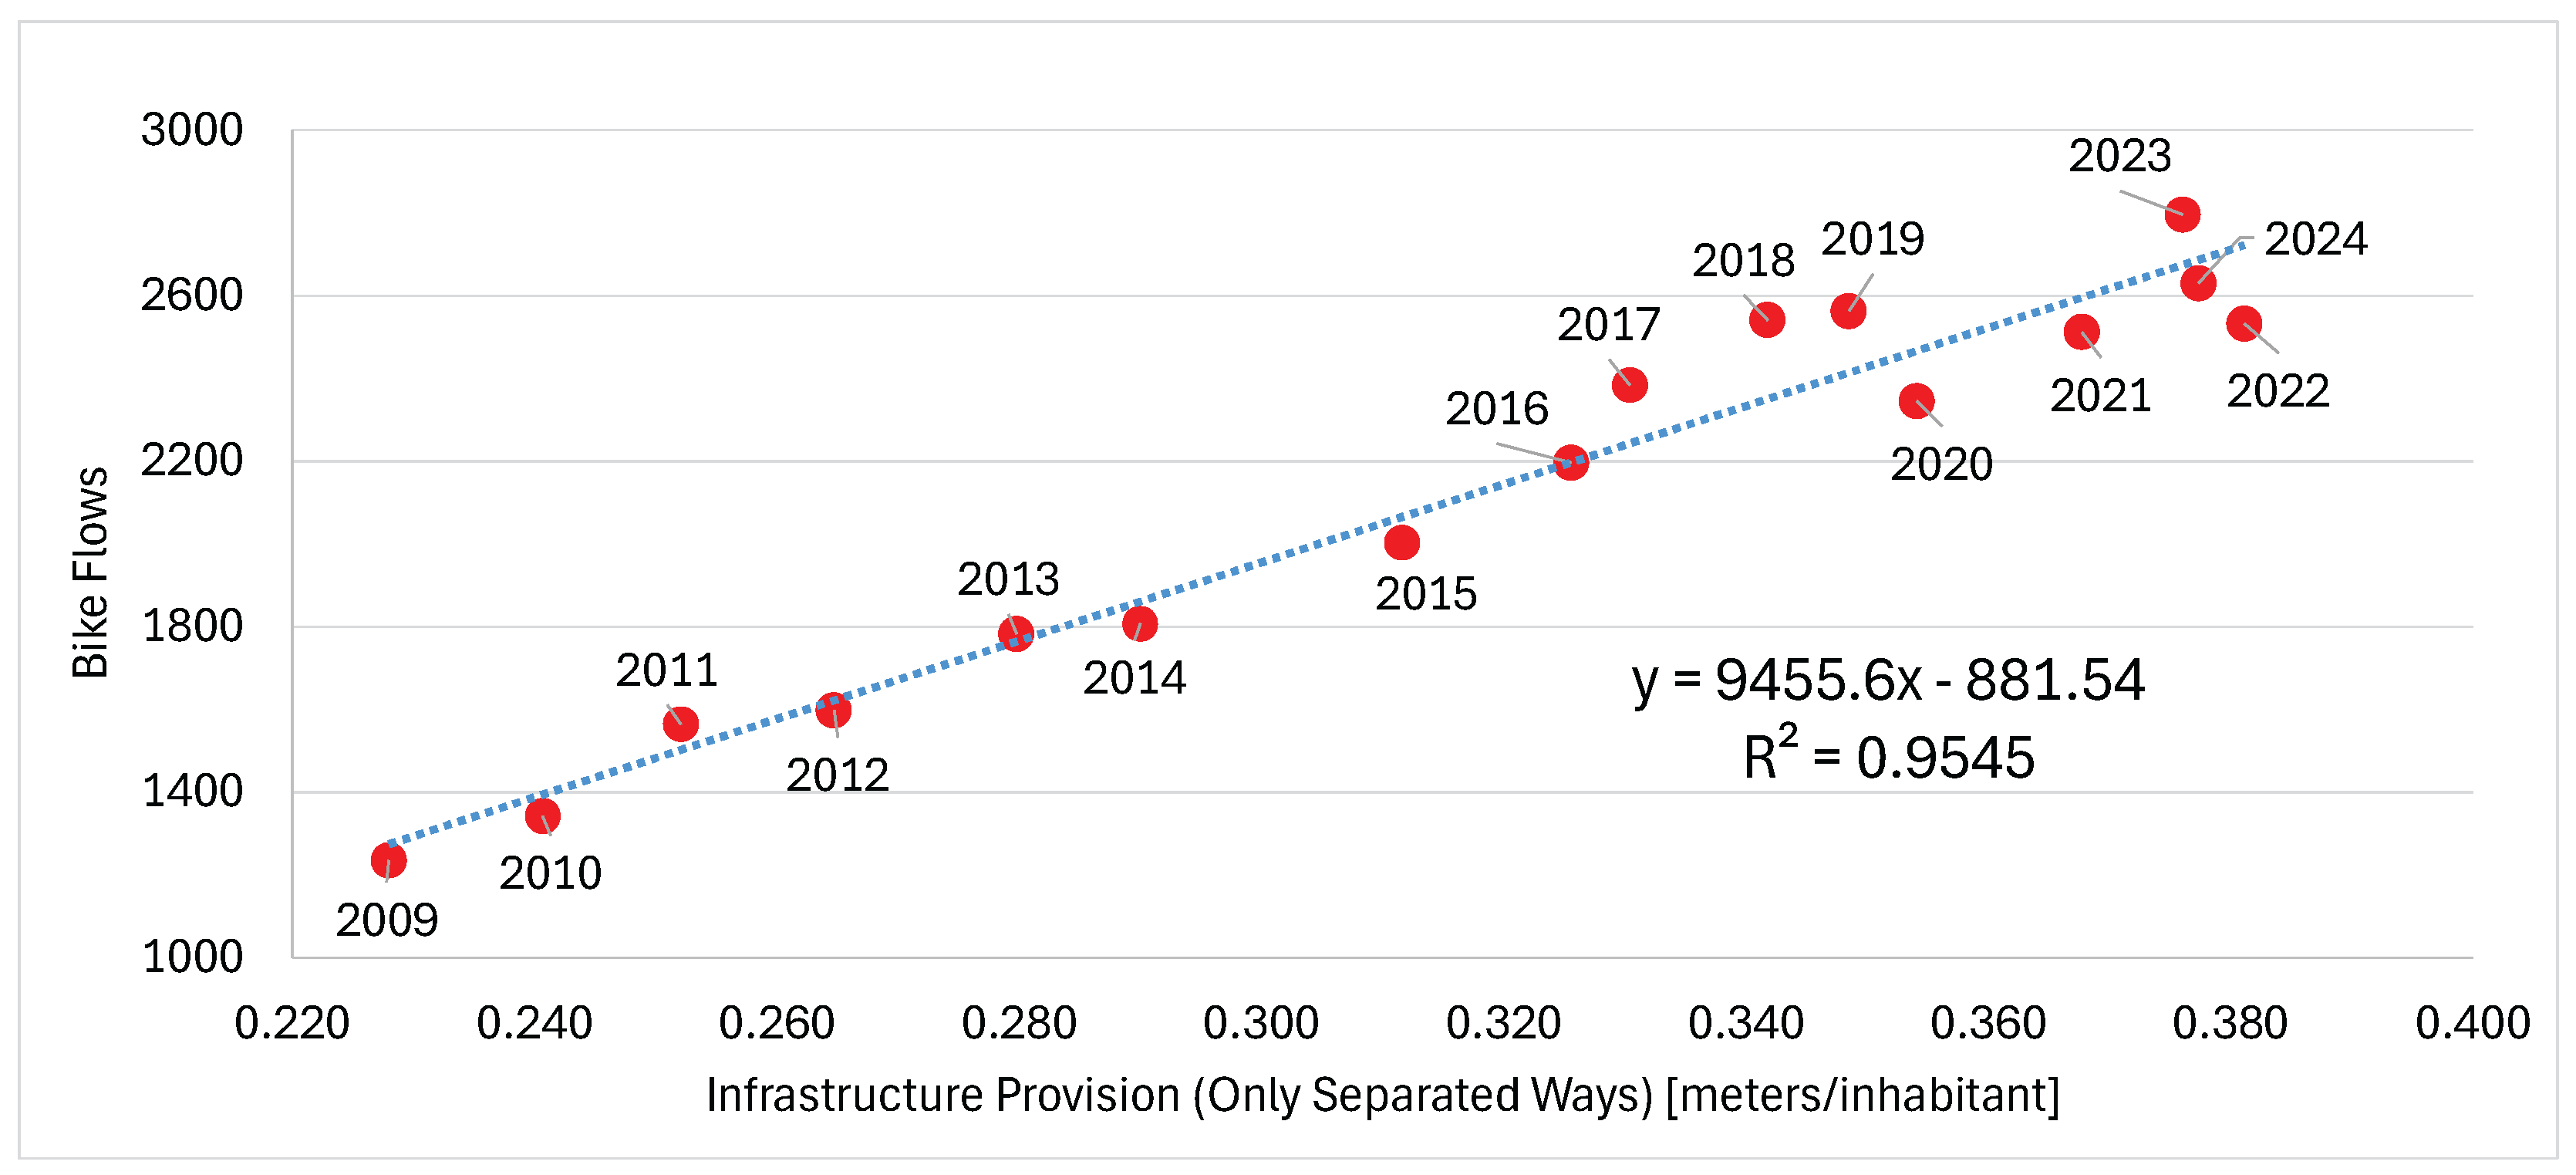
Figure 9.
Bike flows measured (cyclists/hour) vs separated bike infrastructure provision per inhabitant (meters/inhabitant). Regression lines and their equations for 2009-2019 and 2020-2024 periods.
Figure 9.
Bike flows measured (cyclists/hour) vs separated bike infrastructure provision per inhabitant (meters/inhabitant). Regression lines and their equations for 2009-2019 and 2020-2024 periods.
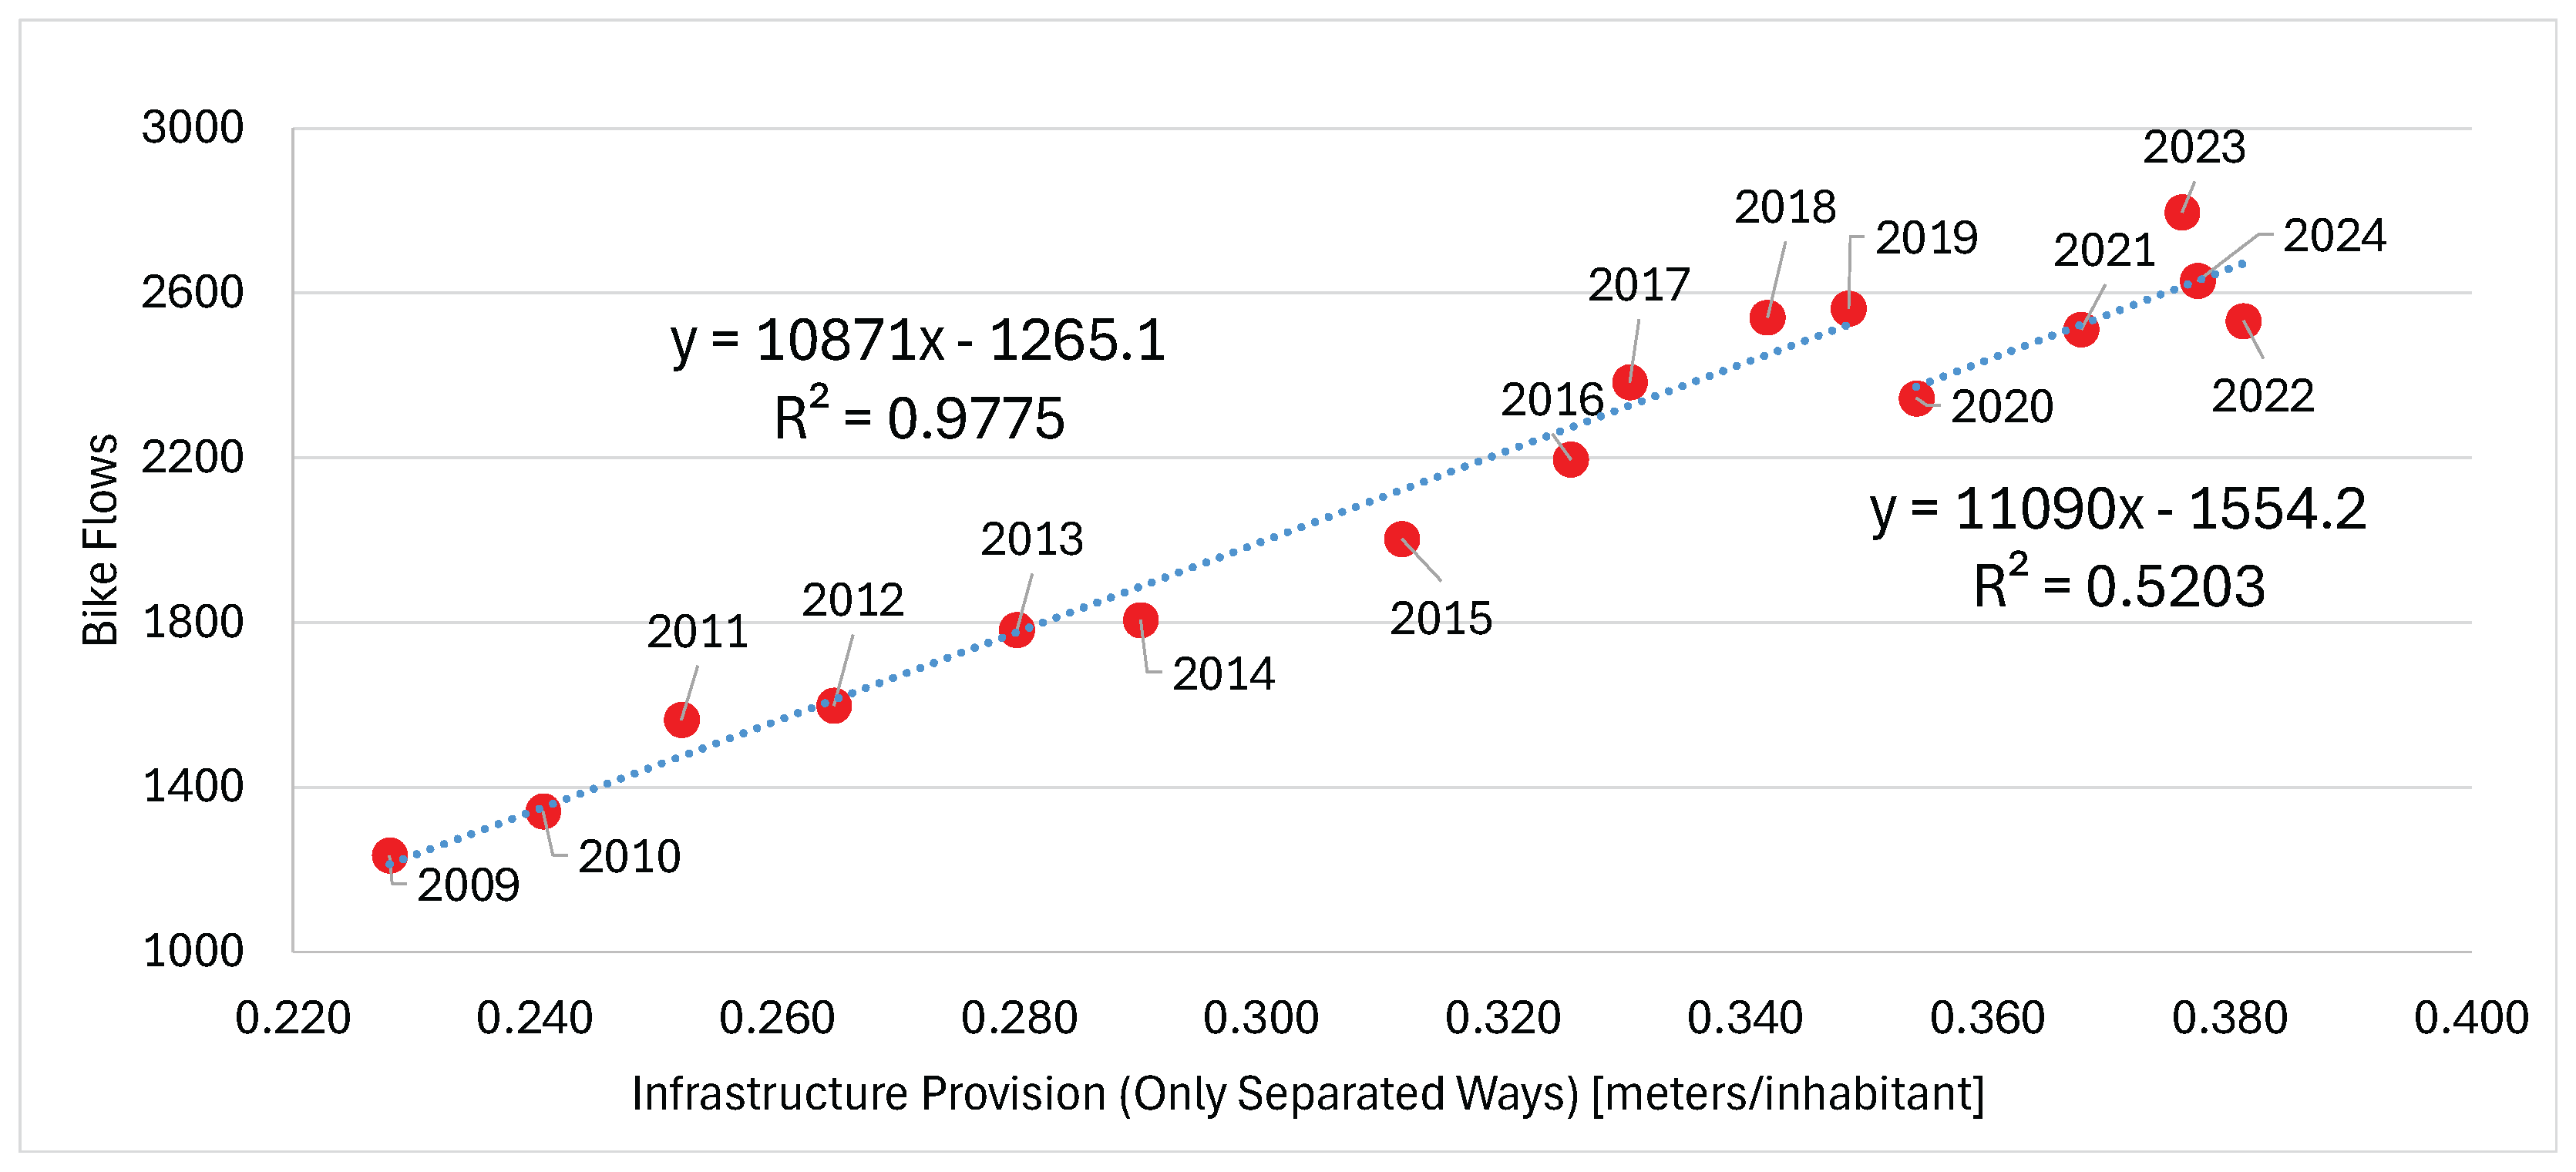
Figure 10.
Share of female cyclists on generic (blue) and separated (orange) bike lanes and their percentage points gaps (pink blocks).
Figure 10.
Share of female cyclists on generic (blue) and separated (orange) bike lanes and their percentage points gaps (pink blocks).
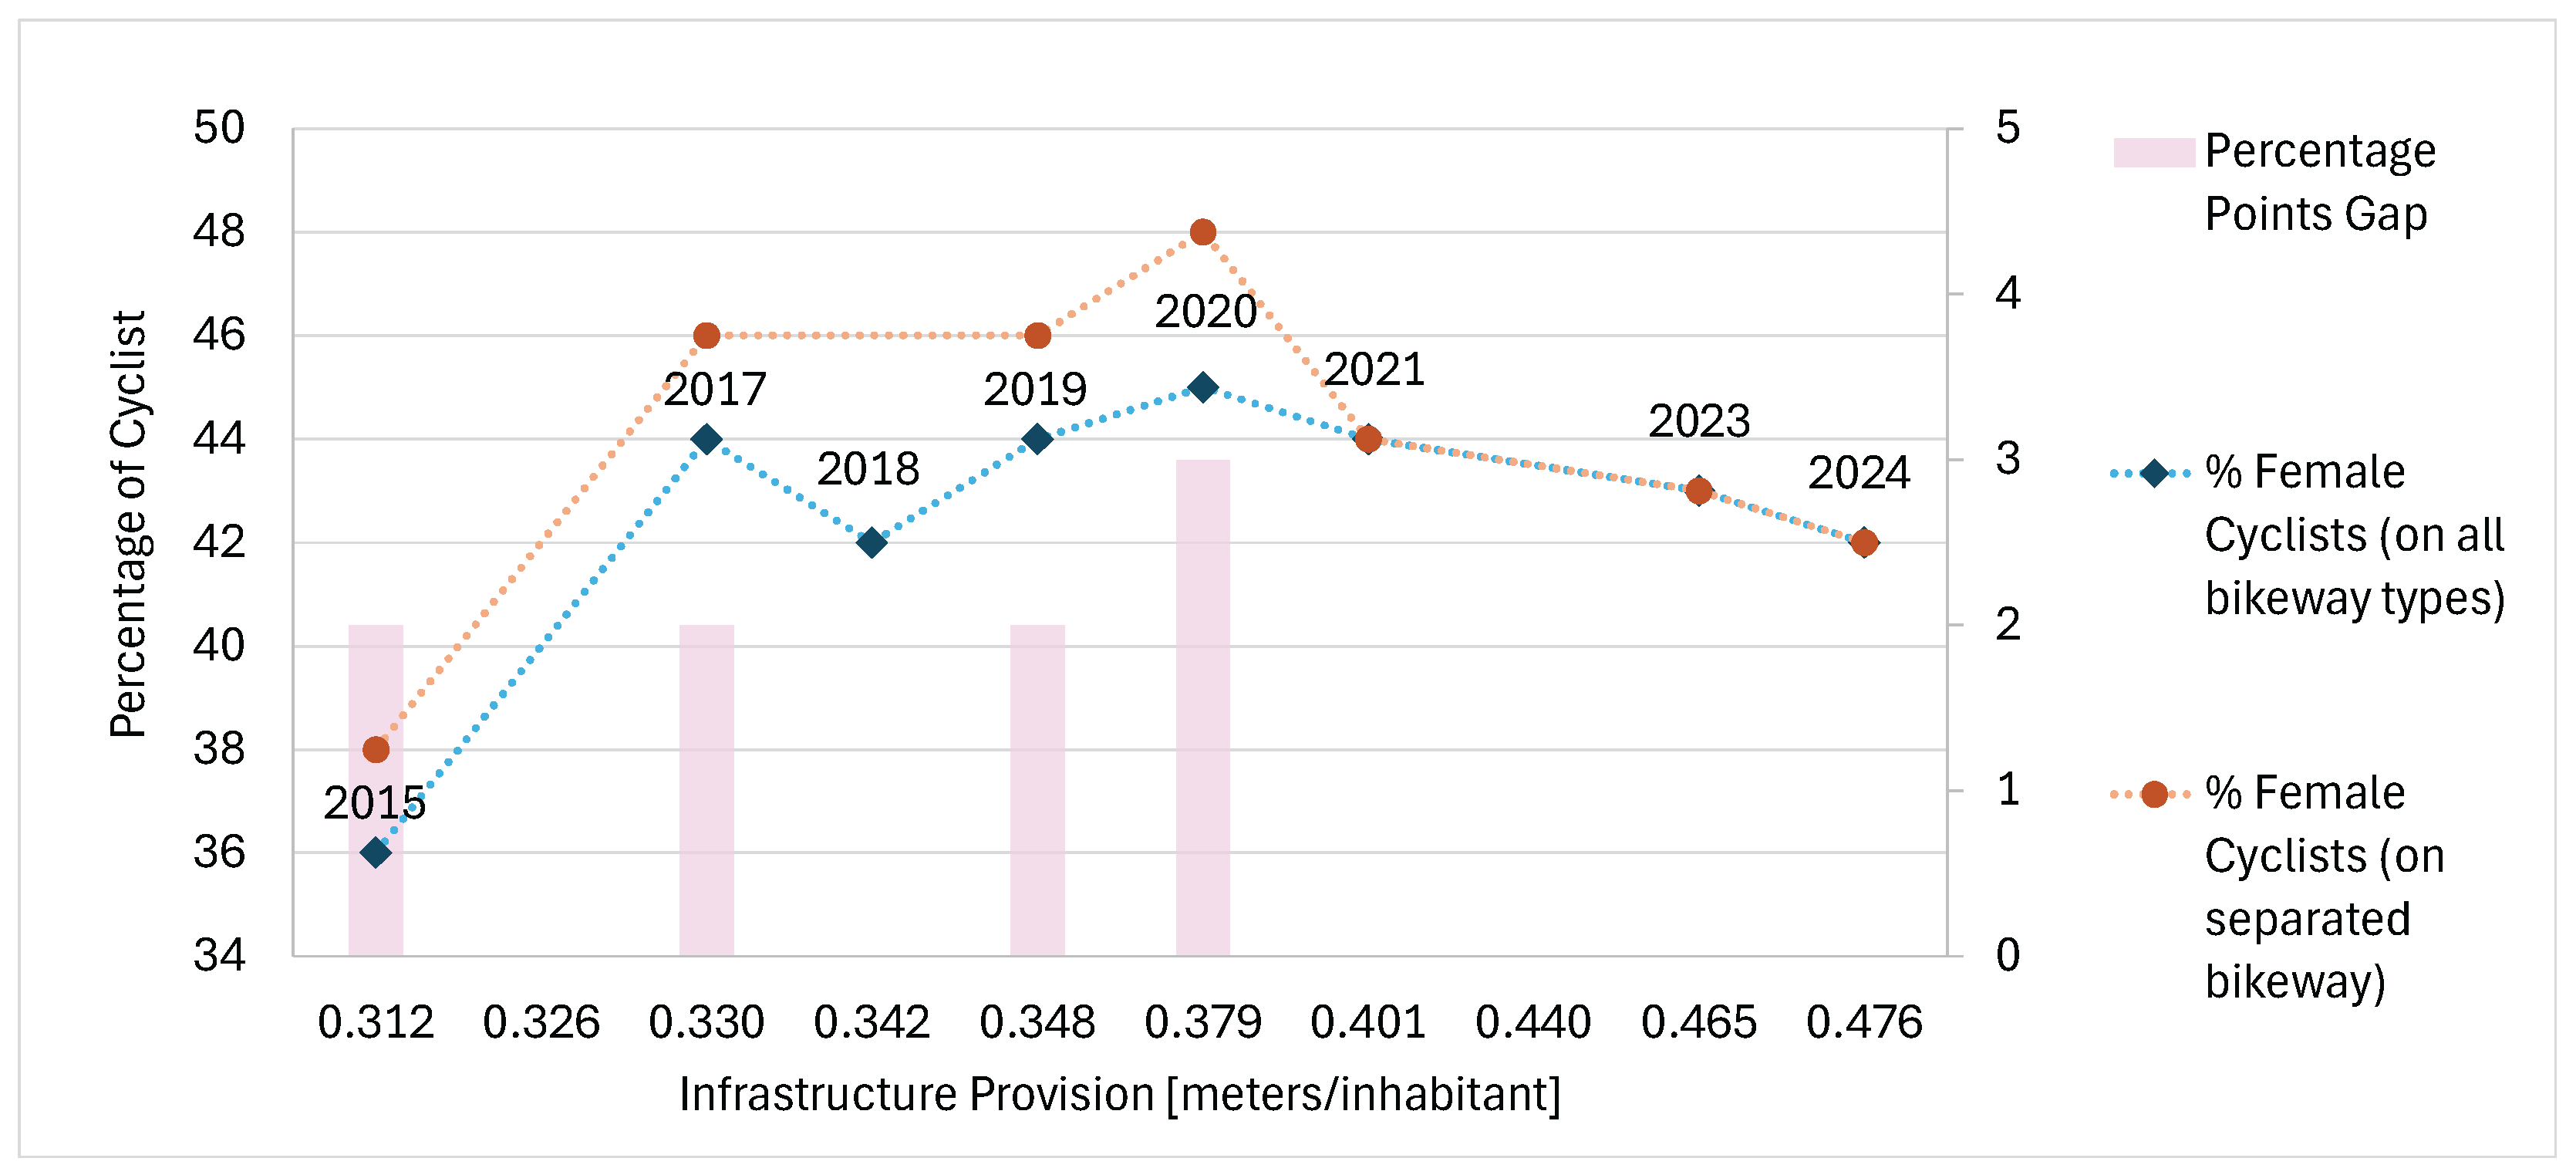

Table 1.
Results and statistical significance of regression analysis.
| Linear Regression Model | Model parameter | Parameter value | t stat | p | Model’s SE | R2 |
|---|---|---|---|---|---|---|
| 1. All Inf. 2009-2024 i | 174.47 | 0.7064 | 0.4915 | 217.7 | 0.8224 | |
| 5776.7 | 8.0532 | <0.0001** | ||||
| 2. All Inf. 2009-2019 i | -1265.1 | -7.8097 | <0.0001** | 73.5 | 0.9775 | |
| 10871 | 19.7895 | <0.0001** | ||||
| 3. All Inf. 2020-2024 i | 1088.1 | 2.1228 | 0.1239 | 98.4 | 0.7355 | |
| 3414.6 | 2.8886 | 0.0631* | ||||
| 4. Sep. Inf. 2009-2024ii | -881.54 | -4.9833 | 0.0002** | 110.1 | 0.9545 | |
| 9455.6 | 17.1451 | <0.0001** | ||||
| 5. Sep. Inf. 2009-2019ii | -1265.1 | -7.8097 | <0.0001** | 73.5 | 0.9775 | |
| 10871 | 19.7895 | <0.0001** | ||||
| 6. Sep. Inf. 2020-2024ii | -1554.2 | -0.6807 | 0.5449 | 132.5 | 0.5203 | |
| 11090 | 1.8038 | 0.1690 |
**The parameter is considered significant for . *The parameter is considered marginally significant for . iThe model considers all types of infrastructure provision as independent variable. iiThe model only considers separated infrastructure provision as independent variable
Disclaimer/Publisher’s Note: The statements, opinions and data contained in all publications are solely those of the individual author(s) and contributor(s) and not of MDPI and/or the editor(s). MDPI and/or the editor(s) disclaim responsibility for any injury to people or property resulting from any ideas, methods, instructions or products referred to in the content. |
© 2025 by the authors. Licensee MDPI, Basel, Switzerland. This article is an open access article distributed under the terms and conditions of the Creative Commons Attribution (CC BY) license (http://creativecommons.org/licenses/by/4.0/).
Copyright: This open access article is published under a Creative Commons CC BY 4.0 license, which permit the free download, distribution, and reuse, provided that the author and preprint are cited in any reuse.


