
Submitted:
21 January 2026
Posted:
21 January 2026
You are already at the latest version
Abstract
Clutch persistence, the ability to sustain consecutive egg-laying cycles, is a critical determinant of profitability in the poultry industry, especially for aging laying hens (≥65 weeks). However, its underlying regulatory mechanisms remain poorly understood, largely due to limitations of the traditional “ovary-centric” research paradigm, which ignores the long-range regulatory effects of intestinal microbiota on ovarian metabolism. To address this knowledge gap, the present study aimed to dissect the comprehensive regulatory network governing clutch persistence using integrated multi-omics analyses. A total of 20 sixty-five-week-old Rhode Island Red (RIR) laying hens with cumulative egg production exceeding 300 eggs but distinct clutch persistence was stratified into high-persistence group (DLCD, ≥25 clutches, n=10) and low-persistence group (DLCS, ≤15 clutches, n=10). Multi-omics profiling, including ovarian transcriptomics, proteomics, and metabolomics, serum metabolomics and cecal microbiota 16S rRNA sequencing was performed. Data integration and association mining were conducted via Spearman correlation analysis with stringent thresholds (r > 0.6, P < 0.01). Integrated analyses revealed a “gut-ovary axis” regulatory model mediated by a lipid mediator network, operating through a three-tiered mechanism: 1) Gut Initiation: The DLCD group exhibited enriched cecal γ-Proteobacteria promoted biosynthesis of lipid precursors. 2) Serum Transport: Key serum lipid mediators, most notably LysoPC (22:6) (VIP = 4.5) and cholesterol ester CE (20:4)—served as critical carriers transducing gut-derived signals to the ovary. 3) Ovarian Execution: These lipid signals activated a core ovarian metabolic pathway centered on the PLA2G6-ALOX15B-AGPAT3 axis, which coordinated follicular development and ovulation by supplying steroid hormone synthesis substrates, exerting anti-inflammatory effects, and stabilizing membrane structures. Collectively, this study demonstrates that gut microbiota modulates clutch persistence in aging laying hens via lipid mediators, orchestrating a systemic “gut-serum-ovary” regulatory cascade. These findings provide a novel theoretical framework for extending the economic egg-laying cycle through targeted manipulation of intestinal microbiota or serum lipid metabolism.
Keywords:
gut-ovary axis
; clutch persistence
; lipid mediators
; gut microbiota
; laying hens
Laying performance is a core economic indicator of the poultry industry, clutch egg laying continuity(the ability to maintain a continuous egg-laying cycle) exerting a particularly prominent impact on the production efficiency of aged laying hens (≥65 weeks of age) [1]. Although genetic breeding has significantly improved the total lifetime egg production of laying hens (reaching 500 eggs by 100 weeks of age) [2], the sustainability of egg production in the advanced age stage remains a key bottleneck restricting production profitability. Clutch egg-laying continuity is quantified by “egg-laying clusters": consecutive laying ≥2 eggs defines one cluster, and a new cycle initiates with an interval of ≥1 day. High-yield and persistent individuals optimize feed utilization efficiency by reducing non-production days; in contrast, even with equivalent total egg production, individuals with low continuity exhibit diminished economic benefits due to dispersed laying rhythm. This phenomenon is particularly pronounced in hens ≥65 weeks of age-among those with total egg production exceeding 300, less than 10% demonstrate high laying sustainability-highlighting the practical significance of elucidating its regulatory mechanism. Egg-laying cluster size, as an inherent trait of hens, not only describe individual laying pattern but also serves as a valuable breeding trait[3,4,5]and a marker for assessing reproductive performance. Genetic studies indicate that the heritability of egg-laying cluster traits, estimated based on single nucleotide polymorphisms (SNPs), ranges from 0.06 to 0.59 [6]. Notably, selective breeding targeting these traits has been shown to effectively improve laying hens’ egg production [3,4], providing a promising strategy for enhancing industry productivity.
In laying hen production, the late egg-laying stage commences with the decline of peak egg production, accompanied by a concurrent reduction in egg production and reproductive performance [7,8]. This phenotypic deterioration is primarily attributed to prolonged egg-laying cycles, insufficient secretion of reproductive hormones, and alterations in intestinal microbiota composition [8,9]. Previous studies have demonstrated that the quantity, growth rate, cycle and hierarchical order of ovarian follicles directly determine the duration and continuity of egg-laying cluster, while the termination of a cluster is associated with growth rhythm discrepancies between the terminal follicle (Ct) and the first follicle of the subsequent cluster (C1)-specifically, delayed entry into the rapid growth phase or prolonged growth phase of C1 [10]. Collectively, these findings indicate that the ovary and intestinal microbiota represent key breakthrough points for investigating the regulatory mechanisms underlying sustained egg production in laying hens.
To address this, the present study focused on 65-week-old laying hens with a total egg production of exceeding 300 but significant differences in clutch egg-laying persistence. Two groups were established: The high-yield persistence group (DLCD group, ≥25 egg-laying clusters) and the low-yield persistence group (DLCS group, ≤15 egg-laying clusters). By integrating ovarian transcriptomic, proteomic, and metabolomic analyses, serum metabolomic profiling and cecal microbiome sequencing (16S rRNA), combined with Spearman correlation analysis (r >0.6, P<0.01) for multi-omics data integration, we systematically explored the regulatory mechanism underlying clutch continuous egg-laying. This study provides a theoretical basis and potential targets for extending the economic egg-laying cycle of laying hens (beyond 72 weeks of age).
1. Materials and Methods
1.1. Ethical Statement
All experimental procedures in this study were approved by the Animal Welfare Committee of Shanghai Academy of Agricultural Sciences (Approval Number: SAASPZ0523078). To minimize the stress in laying hens to the greatest extent, the laying hens were fasted for 12 hours and then euthanized by cervical dislocation.
1.2. Animal Selection and Phenotyping
65-week-old RIR laying hens were selected as experimental subjects, with the screening criterion of total egg production exceeding 300 eggs from 20 to 65 weeks of age. An “egg-laying cluster” was defined as consecutive laying of ≥ 2 eggs, and an interval of ≥1 day marked the initiation of a new cluster cycle. Based on the number of egg-laying clusters, hens were divided into two groups (n=10 per group): the high-cluster group (DLCD), consisting of individuals with ≥25 (top 10% of the population), and the low-cluster group (DLCS), consisting of individuals with ≤15 clusters (bottom 10% of the population). All hens were reared in a standardized environment with a 16L:8D photoperiod and ambient temperature maintained at 22±1 °C. Ad libitum access to feed and water was provided throughout the experiment.
1.3. Sample Collection
Ovarian tissue samples: Within 5 min post-euthanasia, ovaries were completely dissected and randomly cut into three ~0.5 g fragments for different pretreatment procedures. Transcriptome samples were fixed in RNA-later (4 °C, 24 h) and stored at -80 °C. Proteomic samples were homogenized on ice in RIPA lysis buffer supplemented with protease inhibitors and stored at -80 °C. Metabolome samples were immediately immersed in pre-cooled methanol: water (80:20, v/v), vortexed to inactivate enzyme activity, and stored at -80 °C. All ovarian tissue manipulations were performed on ice within 10 minutes to avoid cross-contamination.
Blood samples were collected via the wing vein and centrifuged at 3500 rpm for 10 min at 4 °C to separate serum. The resulting serum from each individual was equally divided into two aliquots on ice within 5 minutes (volume error < 2%)—one for targeted metabolomics and the other for non-targeted metabolomics analysis. For non-targeted metabolomics, serum was precipitated with acetonitrile (1:4, v/v), and the supernatant was freeze-dried and reconstituted in an appropriate LC–MS-compatible solvent. Samples were analyzed using LC–QTOF/MS in both positive and negative ionization modes. Quality control (QC) samples, prepared by pooling equal volumes of all serum samples, were injected regularly throughout the analytical batch to ensure data stability and reproducibility. For targeted metabolomics, 40 μL of serum was spiked with internal standards and subjected to liquid–liquid extraction using methyl tert-butyl ether and methanol (5:1, v/v). The extract was dried under vacuum at 37 °C and reconstituted in a solvent mixture of dichloromethane, methanol, and water (60:30:4.5, v/v/v). After centrifugation (12,000 rpm, 15 min, 4 °C), the supernatant was analyzed by UHPLC–MS/MS in multiple reaction monitoring (MRM) mode.
Cecal contents samples: Cecal contents were aseptically collected and homogenized in PBS buffer. A 0.5g aliquot was subjected to 16S rRNA gene sequencing, with DNA extracted using the MOBIO PowerSoil Kit.
1.4. Multi-Omics Profiling
1.4.1. Cecal Microbiome
Total DNA was extracted from cecal contents using the E.Z.N.A.® Soil DNA Kit. After quality verification via 1% agarose gel electrophoresis and NanoDrop2000, the V3-V4 region of the 16S rRNA gene was amplified with 338F (5’-ACTCCTACGGGAGGCAGCAG-3’)/806R(5’-GGACTACHVGGGTWTCTAAT-3’) primers. The PCR program was as follows: pre-denaturation at 95 °C for 3 min, followed by 27 cycles) of denaturation at 95 °C for 30 s, annealing at 55 °C for 30 s, and extension at 72 °C for 30 s. PCR products were recovered and purified by 2% agarose gel electrophoresis, and then paired-end sequenced on the Illumina Nextseq2000 platform. Raw data was processed with fastp (filtering bases with Q-value < Q20, sequences < 50 bp in length, and those containing ambiguous "N" bases) and FLASH (minimum overlap of 10bp, maximum mismatch rate of 0.2). The ASV (Amplicon Sequence Variant) feature table was generated using the DADA2 plugin in QIIME2. After excluding chloroplast and mitochondrial sequences, samples were rarefied to 20,000 sequences (Good's coverage > 99%), and taxonomic annotation was performed against the SILVA database (v138). Subsequent analyses were conducted on the Meiji Cloud platform: Alpha diversity indices (Chao1, Shannon) were calculated with intergroup differences tested by the Wilcoxon rank-sum test; principal coordinate analysis (PCoA) based on Bray-Curtis distance was performed to assess community structure differences (PERMANOVA test), and differentially abundant microbiota were identified via LEfSe with thresholds of LDA score > 2 and P < 0.05.
1.4.2. Ovarian/Serum Metabolome
Ovarian non-targeted metabolomics: Frozen ovarian tissue was ground to a fine powder in liquid nitrogen, followed by metabolite extraction with pre-chilled methanol/water (4:1, v/v) containing L-2-chlorophenylalanine as an internal standard. The homogenate underwent cryogenic grinding and low-temperature ultrasonication, then centrifuged (12,000 rpm, 15 min, 4 °C). The supernatant was collected for non-targeted analysis.
Serum non-targeted metabolomics: Serum proteins were precipitated by adding cold acetonitrile/methanol (1:1, v/v), vortexed, and incubated at –20 °C for 30 min. After centrifugation, the supernatant was dried under a gentle nitrogen stream and reconstituted in acetonitrile/water (1:1, v/v).
Serum targeted metabolomics: A separate serum aliquot was processed using liquid–liquid extraction with methyl tert-butyl ether (MTBE) and methanol (5:1, v/v) spiked with isotope-labeled internal standards. The organic phase was evaporated and reconstituted in dichloromethane/methanol/water (60:30:4.5, v/v/v) prior to analysis.
For both non-targeted and targeted workflows, quality control (QC) samples were prepared by pooling equal volumes of all experimental samples. One QC sample was injected after every 5–15 analytical runs to monitor system stability.
Non-targeted metabolomic profiling was performed on a UHPLC-Q Exactive HF-X mass spectrometer coupled with an HSS T3 column (100 × 2.1 mm, 1.8 μm). The mobile phases were: (A) 0.1% formic acid in water/acetonitrile (95:5, v/v) and (B) acetonitrile/isopropanol/water (47.5:47.5:5, v/v/v). Data were acquired in both positive and negative ionization modes with an m/z range of 70–1050, with MS¹ resolution of 60,000 and MS² resolution of 7,500.
Targeted metabolomics was conducted on a UHPLC–triple quadrupole MS system operating in multiple reaction monitoring (MRM) mode, with optimized transitions for each lipid mediator.
Raw non-targeted data were processed using Progenesis QI software for peak detection, alignment, and metabolite annotation against HMDB, METLIN, and in-house libraries. All data were uploaded to the Meiji Cloud platform for preprocessing: features with > 20% missing values in any group were removed; remaining missing values were imputed with the minimum observed value; total sum normalization and log₁₀ transformation were applied. Additionally, metabolites with relative standard deviation (RSD) >30% in QC samples were excluded. Differentially expressed metabolites (DEMs) were identified via OPLS-DA (VIP > 1 and P < 0.05) and subjected to KEGG pathway enrichment analysis.
1.4.3. Ovarian Transcriptome
Ovarian tissue was ground in liquid nitrogen, and total RNA was extracted using QIAzol Lysis Reagent (Qiagen). RNA purity was determined using a NanoDrop2000 (OD260/280=1.8-2.2), and integrity was verified via an Agilent 5300 (RNA Qualified Number, RQN>6.5). Qualified samples (RNA concentration ≥ 30 ng/μL) were used for library construction with the Illumina Stranded mRNA Prep kit: mRNA was enriched using Oligo (dT) magnetic beads, fragmented to ~300 bp, and reverse-transcribed into double-stranded cDNA. After end repair and adapter ligation, 300-400 bp fragments were selected for PCR amplification. Libraries were quantified using a Qubit 4.0 and sequenced on the NovaSeq X Plus platform with 150 bp paired-end reads (≥ 40 million reads/samples). Bioinformatics analysis was performed as follows: ① Low-quality reads were filtered using fastp (v0.23.2); ② Clean reads were aligned to the bGalGal1. Mat. Broiler. GRCg7b genome using HISAT2 (v2.2.1); ③ Transcripts per million(TPM) values were calculated using RSEM (v1.3.3); ④ Differentially expressed genes (DEGs) were identified using DESeq2 (v1.38.3) with the criteria of |log₂ fold change (FC)| > 1 and false discovery rate (FDR) < 0.05; ⑤ Gene Ontology (GO) and Kyoto Encyclopedia of Genes and Genomes (KEGG) enrichment analyses were conducted using Goatools (v1.1.6) and SciPy (v1.10.0), respectively, with statistical significance defined as Bonferroni-corrected P < 0.05.
1.4.4. Ovarian Proteome
Frozen ovarian tissue was homogenized in lysis buffer containing protease inhibitors (8 M urea, 1% SDS) using a tissue grinder (180 s × 3 cycles) and subsequently sonicated on ice for 30 min. The lysate was centrifuged, and the supernatant was collected for protein quantification using the BCA assay. A 100 μg aliquot of protein was dissolved in 100 mM triethylammonium bicarbonate (TEAB). Reduction was performed by adding 10 mM tris (2-carboxyethyl)phosphine (TCEP) and incubating at 37 °C for 60 min, followed by alkylation with 40 mM iodoacetamide at room temperature for 40 min in the dark. Proteins were then precipitated with cold acetone, reconstituted, and digested overnight with trypsin at 37 °C. The resulting peptides were desalted, concentrated, and quantified using a NanoDrop spectrophotometer. Chromatographic separation was carried out on a Vanquish Neo UHPLC system equipped with a uPAC High Throughput column (75 μm × 5.5 cm) using an 8-min gradient elution with mobile phases consisting of 0.1% formic acid in water (A) and acetonitrile (B). Peptides were analyzed on an Orbitrap Astral mass spectrometer operated in data-independent acquisition (DIA) mode with positive ionization and a spray voltage of 1.5 kV, and a scan range of m/z 100–1700. Raw data were processed using Spectronaut 19 software to identify differentially expressed proteins (DEPs), defined as those with |log₂(fold change)| ≥ 0.263 and P < 0.05. Functional enrichment analysis (GO and KEGG pathways) and protein–protein interaction (PPI) network construction were performed on the Meiji Cloud Platform.
1.5. Multi-Omics Data Integration Analysis
Multi-omics association mining was performed on the Meiji Cloud platform, integrating proteomic, metabolomic, and cecal microbiome data. First, Spearman correlation analysis was conducted between differentially expressed proteins (DEPs, |log₂ fold change (FC)| ≥ 0.263, P < 0.05), differentially expressed metabolites (DEMs, VIP>1, p<0.05), and differentially abundant bacterial genera (LDA score >2, p<0.05) with thresholds of correlation coefficient r > 0.6 and P < 0.01, to construct a protein-metabolite-microbe interaction network. Second, joint KEGG pathway annotation was performed to map the three-omics data to shared metabolic pathways, enabling identification of cross-omics regulatory nodes. Finally, distance-based redundancy analysis (db-RDA) was used to quantify the association strength between microbial community structure and host proteins/metabolites, thereby revealing the “microbiota-host” co-metabolic mechanism. All analyses were completed on the Meiji Cloud platform, with data interaction visualization implemented via its built-in multi-omics integration module.
1.6. Bioinformatic Analysis of Differentially Expressed Proteins
To systematically characterize the physicochemical properties, structural features, and functional roles of DEPs identified in proteomic profiling, integrated bioinformatic analyses were performed, including hydrophobicity assessment, three-dimensional (3D) structure prediction, and subcellular localization annotation. These analyses were conducted using publicly available databases and computational tools, ensuring reliable validation of DEP functions associated with lipid mediator networks and clutch egg-laying persistence mechanisms.
1.6.1. Hydrophobicity Estimation
Hydrophobicity scores of DEPs were calculated using the ProtParam tool (ExPASy; https://web.expasy.org/protparam/) based on the Kyte-Doolittle scale. This method quantifies the relative hydrophobicity of amino acid sequences, with scores > 0 indicating hydrophobic regions and scores < 0 indicating hydrophilic domains. Input sequences for DEPs were derived from UniProtKB (https://www.uniprot.org/). A sliding window size of 9 amino acids was used to smooth local fluctuations, and results were normalized to a scale of −2 to +2. Hydrophobicity profiles were employed to infer membrane association potential and lipid-binding capacity, which aligns with the lipid metabolism pathways discussed in subsequent results.
1.6.2. Three-Dimensional Structure Prediction
Three-dimensional (3D) structures of DEPs were predicted using AlphaFold v2.0, with default parameters for monomeric protein folding. Input sequences were retrieved from the NCBI RefSeq database. AlphaFold generated five models per protein, and the highest-confidence model was selected based on a predicted Local Distance Difference Test (pLDDT) scores >70, indicating high structural reliability. Structural validation was performed via SWISS-MODEL (https://swissmodel.expasy.org/) using template-based homology modeling, with a sequence identity thresholds of > 30% to ensure reliable alignment. Predicted structures were visualized and analyzed for functional domains using PyMOL v2.5, with a focus on residues involved in lipid metabolism.
1.6.3. Subcellular Localization Prediction
Subcellular localization of DEPs was predicted via a consensus approach integrating three tools:
WoLF PSORT (https://www.genscript.com/wolf-psort.html) for eukaryotic sequences, which analyzes amino acid composition, sorting signals, and functional motifs.
TargetP v2.0 for identifying N-terminal targeting peptides.
DeepLoc v1.0 for deep learning-based predictions using protein sequence embeddings.
Input sequences were annotated with UniProt IDs, and predictions were cross-validated against the COMPARTMENTS database (https://compartments.jensenlab.org/) to incorporate experimental evidence. High-confidence predictions were defined by WoLF PSORT scores >10 and DeepLoc probability scores > 0.8. These results were used to infer DEP roles in organelle-specific lipid synthesis and signal transduction, directly supporting the subsequent ovarian pathway analyses.
2. Results
2.1. Results of Cecal Microbiota Diversity Analysis
2.1.1. PCoA Analysis
PCoA based on amplicon sequence variant (ASV) levels revealed significant differences in cecal microbiota structure between the DLCD (blue squares) and the DLCS (red dots) groups (Figure 1). The two-dimensional PCoA space was defined by PC1 (explaining 31.14% of total variation) and PC2 (explaining 23.91% of total variation); DLCD samples were concentrated in the positive quadrants of both PC1 and PC2, while DLCS samples aggregated distinctly in the negative regions of both axes, with no overlap in inter-group distribution boundaries. PC1 served as the dominant dimension driving grouping differentiation, with DLCD samples localized in the PC1 positive zone and DLCS samples in the PC1 negative zone. In contrast, PC2 primarily reflected intra-group variation, with DLCD samples showing higher dispersion along the PC2 axis. The cumulative explanatory power of PC1 and PC2 reached 55.05%. Permutational multivariate analysis of variance (PERMANOVA) confirmed that clutch egg-laying persistence was the key driver of cecal microbiota β diversity differentiation (P=0.002, R=0.48, permutation number=999). Notably, the DLCS group exhibited higher homogeneity in microbiota structure (outlined by pink ellipses), T whereas the dispersion of DLCD samples along PC2 may be attributed to individual variations in functional bacteria abundance.
2.1.2. Community Bar Plot and Pie Plot
This bar plot revealed significant differences in the relative abundance of intestinal microbiota at the phylum level between the DLCD group and DLCS group (Figure 2). In the DLCD group, Bacteroidota (yellowish-green) was the dominant phylum, accounting for 50%-70% of the total microbiota, followed by Firmicutes (yellow, 20%-40%), while other phyla collectively contributed 5%-10%. In contrast, the DLCS group was dominated by Firmicutes (40%-60%), with Bacteroidetes accounted for a relatively lower proportion (30%-50%), and all other phyla each representing 5%. Notably, Bacteroides plays crucial roles in food digestion and host immune regulation [11]. Functionally, Bacteroidetes exhibits advantages in polysaccharide degradation and short-chain fatty acid (SCFA) synthesis; thus, the high abundance of Bacteroidota in the DLCD group implies superior nutrient utilization efficiency, which is more conducive to intestinal metabolic health [12]. In contrast, the “high-Firmicutes, low-Bacteroidetes” structure in the DLCS group may increase the risk of energy accumulation.
2.1.3. LEfSe Analysis
LEfSe identified significant differences in cecal microbiota composition between the DLCD and DLCS group (linear discriminant analysis [LDA] score > 2, P < 0.05) (Figure 3). Differentially enriched microbiota in the DLCD group primarily belonged to the phyla Bacteroidota, Firmicutes, Campilobacterota, and Proteobacteria, including the families Christensenellaceae, Barnesiellaceae, Helicobacteraceae, and Oxalobacteraceae. Among these, the family Christensenellaceae and its subordinate genus Christensenellaceae_R-7_group exhibitedthe highest LDA scores (3.72 and 3.68, respectively). Enriched taxa in the DLCS group mainly derived from Firmicutes and Cyanobacteria, encompassing the family Erysipelotrichaceae, family Ruminococcaceae, and class Vampirivibrionia. Specifically, the genus Faecalitalea (Erysipelotrichaceae) and phylum Cyanobacteria had LDA scores of 2.77and 2.45, respectively. Functionally, the DLCD group was characterized by higher abundance of microbiota associated with short-chain fatty acid production (SCFA) biosynthesis and energy metabolism, whereas the DLCS group showed enrichment of non-core intestinal microbiota.
2.2. Serum Metabolism
2.2.1. PLS-DA Analysis
The PLS-DA score plot of the serum metabolome revealed a distinct separation trend in the metabolic profiles between the DLCD and DLCS groups (Figure 4). Samples from the DLCD group were distributed in the lower-left area, whereas those from the DLCS group were clustered in the upper-right area. The two groups formed separate cluster distribution along component 1 (vertical axis, variance contribution) and component 2 (horizontal axis, variance contribution 14.8%), indicating differences in serum metabolites between the two groups.
2.2.2. Comparative Analysis of Serum Metabolites Between Groups
The volcano plot of serum metabolome (Figure 5) visualized the differential expressed metabolites (DEMs) between the DLCD and DLCS groups. Significantly differential metabolites were defined with thresholds of |Log2FC| > 1 and -Log10 (P value) > 1.3). Among these DEMs, Janthitrem B exhibited the most prominent upregulation( Log2FC of ≈ 0.4, -Log10(P value) > 4.0), followed by Lysophosphatidylcholine (Lysopc(22:6(4Z,7Z,10Z,13Z,16Z,19Z)/0:0); Log2FC≈ 0.2 , -Log10(P value) ≈ 3.8). In contrast, N-Acetyl-5-Hydroxytryptamine was downregulated (Log2FC ≈ -0.15, - Log10(P value) = 3.6). Additionally, 5-Hydroxyindole-3-Acetic Acid showed a slight upregulation (Log2FC ≈0.05, - Log10(P value) = 3.2), while Pyrogallol was moderately downregulated (Log2FC = -0.08, -Log10(P value) = 2.7).
2.2.3. VIP Value Analysis
The variable importance in projection (VIP) plot of serum metabolomics identified a panel of metabolites associated with egg-laying clutch persistence (DLCD vs DLCS groups) (Figure 6). Screening criteria prioritized metabolites with high discriminative power (VIP > 2, indicating significant contribution to group separation), clear differential directionality, and functional relevance to egg-laying physiology.
Ranked by VIP values, the top 5 differentially abundant metabolites were Janthitrem B (VIP = 4.703, P = 7.87 × 10⁻⁵), Ziprasidone (VIP = 4.496, P = 0.0063), Riboflavin (VIP = 3.761, P = 0.0023), Pyroglutamyl-Glutamyl-Proline Amide (VIP = 3.691, P = 0.0122), and 9-Aminocamptothecin (VIP = 3.680, P = 0.0089). Notably, Janthitrem B exhibited the most significant statistical difference (P < 0.001), emerging as the most discriminative metabolite between the two groups.
In addition to the top-ranked Janthitrem B, Ziprasidone and Riboflavin upregulated metabolites in the DLCD group included Lysophosphatidylcholine (Lysopc(22:6(4Z,7Z,10Z,13Z,16Z,19Z)/0:0); VIP = 2.890, P = 0.00018), 4-Oxododecanedioic Acid (VIP = 2.756, P = 0.0024), Melanostatin (VIP = 2.863, P = 0.0156), and Pyrocatechol (VIP = 2.188, P = 0.0486). These metabolites include Lysophosphatidylcholine (lipid metabolism intermediates), neuroregulatory substances, antioxidant, and lipid signaling molecules—indicating enhanced endogenous anabolic activity in DLCD group, with more robust metabolic characteristics in lipid metabolism, neural regulation and antioxidant defense, which are critical for sustaining egg-laying performance.
Downregulated metabolites in the DLCD group were exemplified by N-Acetyl-5-Hydroxytryptamine (VIP = 2.901, P = 0.00024), Protoporphyrin IX (VIP = 2.827, P = 0.0408), and S-Adenosylhomocysteine (VIP = 2.685, P = 0.0129), along with (1S)-Hydroxy-(2S)-Glutathionyl-1,2-Dihydronaphthalene (VIP = 3.108, P = 0.0300), and Dec-7-Enedioylcarnitine (VIP = 2.477, P = 0.0133). These metabolites involve neurotransmitter precursors, detoxification conjugates, porphyrin synthesis intermediates, and fatty acid transporters, reflecting intergroup differences in neuroendocrine metabolic pathways and specific metabolite biosynthesis.
Notably, 5-Hydroxyindole-3-Acetic Acid (VIP = 2.254, P = 0.00066), a key serotonin metabolite, was significantly upregulated in the DLCD group, while N-Acetyl-5-Hydroxytryptamine was downregulated. This directional shift suggests specific modulation of serotonin metabolism in DLCD group, which may regulate reproductive neuroendocrine function through the gut-ovarian axis.
Furthermore, upregulation of 7-Methylguanosine 5'-Phosphate (VIP = 2.424, P = 0.0280) in the DLCD group implies enhanced RNA post-transcriptional modification activity. This finding provides insights for subsequent exploration of gene expression regulatory mechanisms underlying sustained egg-laying capacity, as RNA modification plays a pivotal role in modulating metabolic and reproductive gene networks.
2.2.4. KEGG Metabolic Pathway Enrichment Analysis
KEGG enrichment analysis of serum metabolome revealed multiple differentially enriched metabolic pathways between the DLCD and DLCS groups (Figure 7). Among these, “Biosynthesis of cofactors” and “Citrate cycle (TCA cycle)” were significantly enriched, characterized by large dots sizes and small p-values in the enrichment plot, indicating that energy metabolism-related pathways are central to mediating the phenotypic differences between the two groups. Additional enriched pathways included “Tryptophan metabolism” and “Riboflavin metabolism” which may regulate the egg-laying clusters phenotype by participating in energy supply, biomacromolecule synthesis, and signal transduction. The “Glycerophospholipid metabolism” pathway was also enriched; this pathway governs the synthesis, degradation, and remodeling of glycerophospholipids. As the primary components of cell membranes, glycerophospholipids form the physical barrier separating intracellular and extracellular environments. Their metabolites further act as key signaling molecules, regulating physiological processes such as cell growth, differentiation, and apoptosis-all of which are critical for sustaining the reproductive performance of laying hens.
2.3. Ovarian Transcriptome Results
2.3.1. Ovarian Transcriptome Differential Expression Analysis
For transcriptome sequencing, three samples were randomly selected from each of the DLCD and DLCS groups (Figure 8). Differential expression analysis identified 1,775 upregulated and 3,305 downregulated genes. Volcano plot visualization further confirmed significant differential expression of key genes: POLE3 and SATB2 were markedly upregulated, while NAGLU, FHIP1B, KANSL2, MGRN1, LPAR2 and CBY1 were significantly downregulated. POLE3 encodes a histone fold protein that interacts with other histone fold proteins to bind DNA in a sequence-independent manner. These histone fold dimers integrate into large enzymatic complexes, participating in DNA transcription, replication and packaging. SATB2 encodes a DNA-binding protein that specifically targets nuclear matrix attachment region, mediating transcriptional regulation and chromatin remodeling. NAGLU encodes an enzyme that degrades heparan sulfate by hydrolyzing terminal N-acetyl-D-glucosamine residues in N-acetyl-α-D-glucosaminides. FHIP1B is a component of the FTS/HOOK/FHIP (FHF) complex, which interact with the homotypic fusion and vacuole protein sorting (HOPS) complex—implicating it in vesicular trafficking. KANSL2, a component of the NSL complex, is involved in the positive regulation of DNA-templated transcription and localizes to multiple cellular compartments, including the actin cytoskeleton, cytoplasmic and nucleoplasm. MGRN1 exhibits ubiquitin-protein transferase activity participating in endosomes-to-lysosomes transport, negative regulation of adenylate cyclase-activated G protein-coupled receptor signaling, and protein monoubiquitination. CBY1 suppresses the Wnt/Wingless pathway by binding to CTNNB1/β-catenin and competing with TCF/LEF transcription factors for binding sites, thereby inhibiting β-catenin-mediated transcriptional activation. Ligands of LPAR2 act as key lipid signaling molecules, and the pathways they regulate are directly associated with phenotypic traits relevant to this study, such as apoptosis and tissue function regulation.
2.3.2. GO Enrichment Analysis of Differentially Expressed Genes
GO enrichment analysis identified multiple key functional categories of differentially expressed genes (DEGs) (Figure 9). In terms of molecular functions (MF), “protein binding” and “enzyme binding” were prominently enriched. For cellular components (CC), significant categories included “organelle membrane”, “intracellular membrane-bounded organelle”, “membrane-bounded organelle”, “cytosol”, “plasma membrane”, “membrane”, and “organelle bounding membrane”. Regarding biological processes (BP), enriched terms covered “positive regulation of biological process”, “positive regulation of cellular process”, “regulation of response to stimulus”, “regulation of signal transduction”, and “regulation of signaling”. Membrane-bound organelles serve as core sites for steroid hormone synthesis; their functional status directly modulates the synthesis estrogen, progesterone, and other hormones, thereby significantly influencing follicular development and ovulation rhythm. Differentially expressed genes may regulate follicular granulosa cell survival through two potential mechanisms: participating in mitochondrial energy metabolism to supply ATP for cellular activities, or mediating endoplasmic reticulum stress responses.
2.3.2. KEGG Enrichment Analysis of Ovarian Transcriptome
Based on functional characteristics, the biological processes involved in the ovarian transcriptome KEGG enrichment results were categorized into four major classes (Figure 10).
Class 1: cell structure and adhesive-related pathways included "Regulation of actin cytoskeleton" and "Focal adhesion". These pathways regulate the dynamic assembly of actin filaments and the anchoring of cell-extracellular matrix (ECM), providing a cytological basis for follicular structure stability. They play pivotal roles in maintaining follicular morphology, mediating intercellular mechanical transmission, and coordinating physiological functions.
Class 2: signal transduction pathways encompassed the vascular endothelial growth factor (VEGF) signaling pathway, mitogen-activated protein kinase (MAPK) signaling pathway, Calcium signaling pathway, Wnt signaling pathway, and ErbB signaling pathway, which form a complex intracellular signal transduction network. The VEGF pathway participates in ovarian angiogenesis and blood supply regulation, ensuring nutrient delivery. The MAPK and Calcium signaling pathways mediate gonadal responses to hormonal and mechanical stimuli, regulating cell proliferation, differentiation, and functional execution. The Wnt and ErbB pathways serve as core mediator in cell fate determination, tissue development, and homeostasis maintenance, synergistically sustaining ovarian contraction rhythm and the order of physiological activities.
Class 3: Metabolism-related pathways included Oxidative phosphorylation, Glycerolipid metabolism, and Arachidonic acid metabolism. As the core of mitochondrial energy metabolism, Oxidative phosphorylation supplies ATP for ovarian cellular physiological activities. Glycerolipid metabolism regulates lipid homeostasis, maintaining membrane structural integrity and bioactive molecules synthesis. Arachidonic acid metabolism produces prostaglandins and leukotrienes to mediate inflammation, immunity, and reproduction-related physiological processes, collectively laying the material and energy foundation for ovarian function.
Class 4: Cellular homeostasis and response pathways comprised Autophagy-animal, Lysosome, and mammalian target of rapamycin (mTOR) signaling pathway. Autophagy cooperates with the lysosomal pathway to remove senescent organelles and misfolded proteins via selective or non-selective degradation, maintaining intracellular homeostasis. The mTOR pathway integrates nutritional and energy signals to regulate cell growth, proliferation, and metabolic reprogramming.
2.4. Ovarian Proteomic Analysis
2.4.1. Differential Protein Identification and Characterization
Differential expression analysis (Figure 11A) showed that compared with the DLCS group, the DLCD group had 252 upregulated proteins and 139 downregulated proteins, totaling 491 differentially expressed proteins (DEPs). The volcano plot (Figure 11B) identified core DEPs with the most significant differences: ZNF212, SLC38A3, TMC1, PEBP4, GIPC2, and PAQR9 were downregulated, while BTN1A1, TMEM82, FRA10AC1, and LOC121108491were upregulated.
Downregulated proteins: ZNF212 (C2H2-type zinc finger family) mediates nucleic acid binding and protein-protein interactions via its KRAB domain to regulate transcription, and participates in the “Gene expression (Transcription)” pathway; its abnormalities are linked to Chromosome 19Q13.11 Deletion Syndrome. SLC38A3(solute carrier family 38), functions as a Na⁺-dependent neutral amino acid symporter (transporting L-glutamine, L-histidine, and L-asparagine via 1 Na⁺/1 H⁺ antiport), critical for the brain glutamate-GABA-glutamine cycle and involved in ion/amino acid transport and neuroinflammation; its defects associate with developmental and epileptic encephalopathies. TMC1 encodes a transmembrane component of the mechanotransducer (MET) non-selective cation channel complex (aided by LHFPL5, TMIE and CIB2/3) that mediates cation transport. PEBP4 (phosphatidylethanolamine -binding protein family) has phosphatidylethanolamine-binding and serine protease inhibitory activities, and may regulate the PI3K-AKT pathway via promoting AKT phosphorylation (paralogous to PEBP1). GIPC2 acts as a tumor suppressor in acute myeloid leukemia (AML) with downregulation driven by promoter methylation; its overexpression inhibits the PI3K/AKT to induce AML cells apoptosis. PAQR9 (mPRε, class II progestin and adipoQ receptor family) is a nonclassical progesterone (P4) signaling molecule in the nervous system, mediating P4’s non-genomic effects to complement classical progestin receptor (PGR) signaling, potentially regulating neuroendocrine and neuroprotective functions relevant to ovarian reproductive regulation. Upregulated proteins: BTN1A1, identified in laying hen ovarian transcriptome is a functionally conserved gene. Analogous to its role in ruminants, it may participate in ovarian lipid metabolism/transport-processes critical for supporting egg production, though its specific function in laying hens warrants further validation. TMEM82 is a novel DEG in hepatocellular and colorectal cancers; while its ovarian function in laying hens is unclear, its transmembrane localization suggests potential roles in signal transduction or nutrient transport. FRA10AC1 encodes a nuclear phosphoprotein involved in pre-mRNA splicing, containing a CpG island CGG repeat region (8–14 repeats; > 200 repeats in FRA10A fragile site with hypermethylation and reduced expression); it is associated with neurodevelopmental disorder Jacobsen Syndrome.
2.4.2. GO Enrichment Analysis of Differential Proteins
GO enrichment analysis of differential expressed proteins, identified functional pathways potentially associated with sustained egg-laying performance (Figure 12). The MAPK/JNK pathway which regulates cellular stress responses and cell proliferation/apoptosis, includes key terms such as “positive regulation of JNK cascade”, “regulation of MAPK cascade”, and “positive regulation of stress-activated protein kinase activity” —these may modulate follicular development, ovulation rhythm or fallopian tube contraction. In the “neutrophil mediated immunity” category, neutrophil infiltration indicates the local inflammatory status of the ovary or fallopian tube; chronic inflammation may interfere with follicular atresia, ovulation efficiency, and sustained egg-laying capacity. “Phospholipase A2 activity” contributes to prostaglandin synthesis by catalyzing arachidonic acid release, and prostaglandins directly regulate ovulation and fallopian tube contraction—processes closely linked to egg-laying frequency. Additionally, “ATP-dependent diacylglycerol kinase activity” connects lipid metabolism with energy metabolism, potentially affect in energy supply for follicular membrane lipid synthesis and fallopian tube contraction—both critical for maintaining continuous egg-laying physiology.
2.4.3. KEGG Enrichment Analysis of Differential Proteins
Based on KEGG enrichment results of the DLCD vs. DLCS comparison, and egg-laying clutch-related physiological processes several functionally relevant pathways were identified (Figure 13). Glycerophospholipid metabolism, as key component of biological membranes, phospholipids regulate the follicular membranes structure and fallopian tube function, which are closely linked to egg-laying physiology. Neuroactive ligand-receptor interaction modulates reproductive system ovulation rhythm and neural innervation via neural signal transduction, thereby affecting egg-laying clutch persistence. Histidine metabolism: Histidine and its metabolites participate in energy metabolism and cell proliferation, potentially influencing follicular development and other egg-laying-related processes. Glycosaminoglycan biosynthesis-keratan sulfate: Keratan sulfate, a glycosaminoglycan, contributes to extracellular matrix composition, which may regulate the follicular microenvironment and fallopian tube structure to support egg-laying physiology. Linoleic acid metabolism: Linoleic acid serves as a prostaglandins precursor; the pathway regulates ovulation and fallopian tube contraction via prostaglandins synthesis, making it tightly associated with egg-laying clutch persistence.
2.5. Integrated Analysis of Ovarian Transcriptomics and Proteomics
Integrated analysis revealed three overlapping pathways between the ovarian proteome and transcriptome: Arachidonic Acid Metabolism, Glycerophospholipid Metabolism and Glycerolipid metabolism. Additionally, three common DEPs were identified: AGPAT3, ALOX15B and PLA2G6 (Figure 14).
AGPAT3 (1-Acylglycerol-3-Phosphate O-Acyltransferase 3): Functional annotation identified multiple conserved domains and conserved peptides. A core domain (aa 90-212) annotated as Phospholipid/glycerol acyltransferase (SMART: SM00563) constitutes the active site for acyltransferase activity, catalyzing acyl groups transfer to phospholipid or glycerol substrates to mediate lipid anabolism (functional validation pending in vitro enzyme activity and in vivo metabolomic assays). An Inter Prorepresentative domain (aa 62-256, Accession: cd07990) classifies AGPAT3 into the lysophospholipid acyltransferase (LPLATs) family, which participates in glycerophospholipids biosynthesis -. exhibiting functional similarity to LCLAT1 to support lipid metabolism regulation. Three unique peptide segments were verified via PeptideAtlas (PAp05852299, PAp05856469, PAp05847477) and aligned to the Saccharomyces cerevisiae proteome (UP000000539): PROTEOMICS 162-179 (sequence: LADYPEYMWFLLYCEGTR), PROTEOMICS 187-195 (sequence: ISMEVAESK), and PROTEOMIC 282-303 (sequence: DALQEMYNOQEGTFPGQQFKPPR). These peptides serve as specific biomarkers for targeted proteomic detection and quantification. ALOX15B (Arachidonate 15-Lipoxygenase Type B): Multiple functional sites critical for biological activity were identified, including two Ca²⁺ binding site (aa 17 and 76) and four Fe²⁺/Fe³⁺ binding sites (aa 364, 369, 544 and 677). The metal ion binding sites may mediate iron transport, storage, or catalytic reactions. Notably, the amino acid at position 99 is essential for stabilizing ALOX15B interaction with cortical actin-like protein 1 (COTL1) - a regulator of cytoskeletal dynamics and signal transduction-suggesting a key role modulating ALOX15B-mediated cellular pathways.
PLA2G6 (Phospholipase A2 Group VI) contains 6 domains, including one PNPLA domains (aa 472-656) and 5 ANK (ankyrin) repeat domains. Three conserved motifs and two catalytic sites were annotated via PROSITE (PRU01161): MOTIF 476-481 (pattern: GXGXXG, potentially energy metabolism-related), MOTIF 508-512(pattern: GXSG, mediating ligand interaction and conformational stability), MOTIF 643-645(pattern: DGA/G, linked to catalysis), ACT_SITE 510 (nucleophile), and ACT_SITE 643 (proton acceptor). Functional characterization requires experimental validation, such as site-directed mutagenesis and enzyme activity assays.
Key physicochemical properties of the three proteins are summarized as follows: AGPAT3 (376 aa, 43.6 kDa, pI 8.76) localizes primarily to the endoplasmic reticulum; ALOX15B (667 aa, 75.9 kDa, pI 6.53) is cytoplasmic; PLA2G6 (796 aa, 88.4 kDa, pI 7.07) distributes across multiple compartments (extracellular space, microtubule cytoskeleton, mitochondrion, nuclear speck, plasma membrane). A Notably, protein hydrophilicity data were incomplete in the original dataset.
2.6. Ovarian Metabolomic Analysis
2.6.1. Data Preprocessing and Quality Control
Table 1 summarizes the preprocessing results of ovarian metabolomics data across different ion modes in positive ion mode (Pos), the number of effective peaks decreased from 4454 to 3131 post-preprocessing, while the metabolite identification rate increased from 12.17% to 15.3%. In negative ion mode (Neg), effective peaks reduced from 4,296 to 3,336, with the identification rate rising from 6.33% to 7.37%. For the mixed mode, total effective peaks declined from 8,750 to 6,467, and identification rate improved from 9.3% to 11.21%. Quality control (QC) processing significantly enhanced metabolite identification efficiency across all three modes, with an average increase of over 2 percentage points. This confirms that the preprocessing workflow effectively filtered noise peaks while preserving target metabolite information. Subsequent analyses were performed using the preprocessed data matrix (Origin table).
2.6.2. Expression Level Data Processing
Table 2 summarizes the ovarian metabolomic data processing results. In positive ion mode, 3,131 mass spectrometry peaks were detected, with 479 metabolites identified including 381 annotated in public databases and 202 matched to the KEGG database. In negative ion model, 3,336 peaks were captured, corresponding to 246 identified metabolites (211 in public databases and 126 with KEGG annotations). Mixed model integration yielded 6,467 total peaks and 725 identified metabolites, of which 592 were annotated in public databases and 328 in KEGG. Unidentified peaks accounted for over 80% of total peaks across all modes (Pos: 2652, Neg: 3090, mix: 5742), reflecting the abundance of uncharacterized metabolite information in non-targeted metabolomics. These results provide a robust data foundation for subsequent differential metabolites screening. Notably, the mixed mode yielded 328 KEGG-annotated metabolites, accounting for 45.2% of all identified metabolites—facilitating downstream pathway enrichment analyses.
2.6.3. Partial Least Squares-Discriminant Analysis (PLS-DA)
PLS-DA was used to link ovarian metabolic profiles with egg-laying clutch persistence (Figure 15). The first two components explained 20.8% and 25.4% of total variance, respectively (cumulative: 46.2%), capturing the major metabolic divergence between groups. Notably, the DLCD (high persistence; green) and DLCS (low persistence; yellow) groups showed complete separation: DLCD clustered in the lower-left quadrant (Comp1 < –10, Comp2 < 10), while DLCS occupied the upper-right (Comp1 > 20, Comp2 > 30). A permutation test confirmed this separation was non-random (R = 0.1796, P = 0.018, permutation number = 200 ).
Component 1—accounting for 20.8% of variance—was the primary driver of group discrimination, likely reflecting metabolic traits essential for sustained egg production. Integrated multi-omics data suggest two key mechanisms:
(1) Lipid homeostasis, supported by consistent enrichment of the glycerophospholipid metabolism pathway across transcriptome and proteome; balanced phospholipid synthesis ensures follicular membrane integrity and steroidogenesis;
(2) Efficient energy supply, linked to mitochondrial oxidative phosphorylation (transcriptome KEGG), which fuels high-frequency follicular development.
In contrast, Component 2 may reflect neuroendocrine regulation (aligned with the proteomic neuroactive ligand–receptor interaction pathway) and prostaglandin-mediated ovulation rhythm, potentially governed by ALOX15B and PLA2G6.
Together, these results indicate that ovarian metabolism is tightly shaped by egg-laying performance: the compact DLCD cluster signifies stable folliculogenesis and efficient energy use, whereas the dispersed DLCS profile suggests dysregulation in lipid–hormone–energy networks. This clear phenotype-metabolism association prioritizes metabolites with high loadings on Component 1 for downstream differential screening.
2.6.4. Analysis of Differential Metabolites
The ovarian metabolome volcano plot (Figure 16) clearly distinguished metabolic profiles between the DLCD and DLCS groups. A total of 60 metabolites were significantly differentially expressed (DEMs): 50 were upregulated and 10 were downregulated in the DLCD group relative to the DLCS group.
Among the most significantly upregulated DEMs (red dots), 2-hydroxyhexadecanoic acid, nonylpropanediol, N-undecanoylglycine, and 1-cyclohexyl-3-[[(1-hydroxymethyl) cyclopropyl] methyl] urea. were identified. In contrast, 2-picoline (2-methylpyridine) was the most prominently downregulated DEM (blue dot). Metabolites represented by black dots showed no significant intergroup differences.
Notably, key upregulated metabolites exhibit functional relevance to egg-laying physiology: 2-hydroxyhexadecanoic acid, can regulate energy metabolism via the fatty acid β-oxidation pathway and modulate ovarian local inflammatory responses as a signaling molecule—both critical for maintaining follicular development stability. N-Undecanoylglycine, a member of the acylglycine family, typically accumulates in response to mitochondrial fatty acid metabolism disorders; its upregulation may indicate a metabolic stress state in the DLCS group, whereas its controlled level in the DLCD group suggests efficient energy utilization.
2.6.5. VIP Value-Based Metabolite Screening and Functional
Analysis: to identify key metabolites mediating egg-laying clutch persistence, we screened candidates with high discriminatory power using a VIP score plot (Figure 17), where dot color indicates VIP value magnitude (red = high VIP, blue = low VIP). The screening was further refined by integrating pathway biological functions and intergroup expression differences.
Arachidonic Acid Metabolism-associated metabolite: Platelet-Activating Factor (PAF), a glycerophospholipid derivative, emerged as a key candidate. PAF activates phospholipase A2 (PLA2) —consistent with the upregulated PLA2G6 in our transcriptome-proteome integrated analysis—to release arachidonic acid, which drives prostaglandin synthesis. Prostaglandins directly regulate fallopian tube smooth musclecontraction and ovulation rhythm, thereby shortening the interval between consecutive ovipositions—a critical determinant of egg-laying clutch persistence.
Glycerophospholipid Metabolism-associated metabolites: Lysophosphatidylcholine (LysoPC) and Lysophosphatidylethanolamine (LysoPE) were identified, with specific candidates including Lyscope (P-18:1(9Z)/0:0), Lysope (P-16:0/0:0), and Lysope (P-18:0/0:0). As a membrane phospholipid degradation product, LysoPC mediates cell signaling and membrane fluidity regulation; It modulates follicular granulosa cells proliferation and apoptosis via activating G protein-coupled receptors, directly influencing follicular survival and ovulation efficiency. LysoPE, by contrast, maintains oocyte energy homeostasis through regulating mitochondrial membrane stability—ensuring sufficient ATP supply for high-frequency follicular development in the DLCD group.
Metabolites with both high VIP values and significant expression differences between groups were prioritized as key regulatory factors (Figure 17). Red dots (upregulated in DLCD) included deferitrin (ferritin), norepinephrine, indole-3-Acetic Acid (IAA, LysoPC (P-18:1) (9Z)/0:0), and PAF. Among these: deferitrin maintains iron homeostasis to support ALOX15B-mediated iron-dependent arachidonic acid metabolism; norepinephrine modulates neuroendocrine regulation of ovulation—echoing the proteomic Neuroactive ligand-receptor interaction pathway; IAA may regulate follicular growth via modulating granulosa cell differentiation.
In contrast, 1-(hydroxymethyl)-5,5-dimethyl-2,4-imidazolidinedione (blue dot) was downregulated in DLCD. Collectively, these metabolites form a regulatory network involving lipid signaling, energy metabolism, and neuroendocrine control, which modulates ovarian physiological functions to drive differences in egg-laying clutch number.
2.6.6. KEGG Pathway Enrichment Analysis of Differential Metabolites
To dissect the metabolic regulatory networks underlying egg-laying clutch persistence, KEGG pathway enrichment analysis was performed on ovarian differentially expressed metabolites (DEMs) between the DLCD and DLCS groups (Figure 18). Key pathways with functional relevance to reproductive phenotypes and intergroup metabolic divergence are discussed below.
Glycerophospholipid metabolism pathway, as the core hub pathway was significantly enriched (small P-value, large bubble size in Figure 18), confirming its central role in mediating ovarian metabolic differences between groups. Consistent with our transcriptome-proteome integrated results, Glycerophospholipid Metabolism acts as a functional hub linking Arachidonic Acid Metabolism and Glycerolipid Metabolism—it supplies phospholipid precursors for arachidonic acid release and supports glycerolipid synthesis. Subsequent metabolite correlation analysis will be required to elucidate the indirect crosstalk mechanisms between these pathways, particularly regarding how phospholipid remodeling modulates prostaglandin synthesis and energy storage.
Three pathways closely associated with egg-laying performance were significantly enriched: Arginine and Proline Metabolism, Citrate Cycle (TCA Cycle), and Tyrosine Metabolism. Their regulatory roles in egg-laying clutch persistence are inferred as follows: TCA Cycle: As the core of mitochondrial energy metabolism, its enrichment reflects enhanced energy supply capacity in the DLCD group. Elevated TCA cycle activity ensures sufficient ATP production for high-frequency follicular development, granulosa cell proliferation, and fallopian tube contraction—key physiological processes sustaining continuous oviposition. The reduced enrichment in DLCS may contribute to energy deficiency-induced follicular atresia. Arginine and Proline Metabolism: Arginine serves as a precursor for reproductive hormones and nitric oxide (NO). Hormonal synthesis regulated by this pathway modulates ovulation rhythm, while NO enhances ovarian angiogenesis to improve nutrient delivery to developing follicles—collectively promoting egg-laying clutch extension. Tyrosine Metabolism: Tyrosine-derived catecholamines mediate neuroendocrine regulation of the hypothalamic-pituitary-ovarian (HPO) axis. This pathway modulates gonadotropin release and ovarian response to hormonal signals, directly influencing the interval between consecutive ovulations.
Collectively, metabolic remodeling of these three pathways coordinates energy supply, hormone synthesis, and neuroendocrine signaling to regulate ovarian physiological functions, ultimately driving differences in egg-laying clutch number between the DLCD and DLCS groups.
2.7. Serum Targeted Metabolomics Validation
To validate the multi-omics-derived hypothesis that “the gut-ovarian axis regulates egg-laying clutch persistence in laying hens via lipid mediators”, targeted metabolomics was performed on serum samples from DLCD and DLCS groups. This analysis systematically characterized intergroup differences in serum metabolic phenotypes, core lipid mediator abundance, and associated regulatory pathways, with key findings presented below.
2.7.1. Data Quality Control and Preprocessing
Raw quantitative data for 956 metabolites were acquired via targeted detection. Post-quality control (QC) and preprocessing —including missing values imputation (half the minimum detected value), and outlier filtering (coefficient of variation [CV] > 30% excluded)-all 956 metabolites retained eligibility for downstream statistical analysis, resulting in no significant data loss or technical artifacts. Intra-group metabolite quantification exhibited a relative standard deviation (RSD) < 20%, confirming excellent detection reproducibility and suitability for intergroup comparison.
2.7.2. Intergroup Segregation of Serum Metabolic Phenotypes
2.7.2.1. Orthogonal Partial Least Squares-Discriminant Analysis (OPLS-DA)
A supervised OPLS-DA model was constructed to prioritize intergroup metabolic differences (Figure 19). Model parameters were: principal components configuration 1+1+0, cumulative explained variance of X-variables (R²X(cum)) = 0.268, cumulative explained variance of grouping variables (R²Y(cum)) = 0.944, and cumulative predictive ability (Q²(cum)) = -0.057. The high R²Y(cum) (94.4%) indicated strong correlation between serum metabolic profiles and egg-laying persistence phenotypes. Although Q²(cum) was negative—attributed to the small sample size (n=5/group)—200-permutation test validation (Figure 19A) ruled out over fitting: R²Y and Q² values of permuted models were consistently lower than the original model, with P value for R²Y > 0.05 (126/200 permutations), and Q² > 0.05 (23/200 permutations l). The OPLS-DA score plot (Figure 19B) demonstrated complete spatial segregation of the two groups along the predictive component t[1]P axis, a with tight intra-group clustering along the orthogonal component t[1]O axis. This confirms phenotype-specific serum metabolic signatures and robust intra-group consistency—supporting the role of systemic lipid metabolism in mediating egg-laying persistence.
2.7.3. Core Differential Lipid Mediators
Screening and Functional Traits Combined univariate (Student's t-test) and multivariate (OPLS-DA VIP value) analyses identified 9 significant differential metabolites (DEMs) using the criteria: VIP > 1, P < 0.05, and |Log₂FC| > 0.58 (Figure 20). All 9 DEMs were lipids or lipid derivatives, with 4 upregulated and 5 downregulated in the DLCD group relative to DLCS.
DLCD-upregulated lipid mediators: Long-chain fatty acid FA(22:1) (VIP = 2.798, P = 0.001, FC = 1.549, Log₂FC = 0.631), triglyceride(TGs) including TG (40:0)_FA(14:0) (VIP = 2.452, P = 0.043, FC = 1.49, Log₂FC = 0.575), TG(42:0)_FA(16:0), and TG(44:0)_FA(18:0). These TGs and FA (22:1) serve as high-energy substrates; their elevated levels in DLCD provide a continuous energy supply for follicular development and ovulation—addressing the high ATP demand of sustained egg-laying observed in the ovarian transcriptome’s oxidative phosphorylation pathway.
DLCS-upregulated lipid mediators: Cholesterol esters (CEs) CE(20:4) (VIP = 2.624, P = 0.021, FC = 0.666, Log₂FC = -0.587) and CE(20:2) (VIP = 2.337, P = 0.029, FC= 0.666, Log₂FC = -0.586), phosphatidylglycerol PG(18:0_18:0) (VIP = 2.554, P = 0.025, FC = 0.667, Log₂FC = -0.585), diacylglycerophosphate BMP(16:1_18:0) (VIP = 2.47, P = 0.027, FC = 0.625, Log₂FC = -0.677), and ceramide HexCer(18:1/18:0) (VIP = 2.347, P = 0.047, FC = 0.733, Log₂FC = -0.448). Critically, CE(20:4)—the cholesterol ester form of arachidonic acid (ARA)-is a key precursor for ovarian prostaglandin synthesis. Its higher abundance in DLCD aligns with upregulated PLA2G6 (phospholipase A2) in our transcriptome-proteome integration, ensuring sufficient ARA release for prostaglandin-mediated ovulation rhythm regulation.
2.7.4. Functional Association and Pathway Enrichment of Differential Lipids
2.7.4.1. Hierarchical Clustering Lipids' Expression Patterns
Hierarchical clustering analysis (Euclidean distance, complete linkage) of the 9 differential lipids yielded two distinct clusters perfectly matching the grouping (Figure 21). At the metabolite level, FA(22:1) and TG subtypes (TG(40:0)_FA(14:0), TG(42:0)_FA(16:0)) formed a DLCS-dominant branch, reflecting dysregulated energy storage; CE subtypes (CE(20:4), CE(20:2)), PG(18:0_18:0), and HexCer (18:1/18:0) formed a DLCD-dominant branch, indicative of enhanced lipid precursor reserve. This pattern supports a phenotype-linked metabolic divergence: DLCD serum lipid metabolism prioritizes energy substrate supply (for high-frequency follicular development) and lipid signaling precursor storage (for ovulation regulation), whereas DLCS exhibits disrupted lipid homeostasis—consistent with the ovarian metabolome’s observation of inefficient energy utilization in DLCS.
2.7.4.2. KEGG Pathway Enrichment
Mapping these different lipids to the chicken (Gallus gallus) KEGG database identified two significantly enriched core pathways: gga00561 Glycerolipid Metabolism and gga00100 Steroid Biosynthesis—both overlapping with the ovarian transcriptome-proteome integrated pathways. Glycerolipid Metabolism (gga00561): Glycerol-3-phosphate (KEGG: C00422), showed elevated abundance in DLCD. This aligns with upregulated AGPAT3 (glycerophospholipid synthase) in our multi-omics integration, indicating active phospholipid biosynthesis in DLCD serum—providing structural precursors for follicular membrane formation and lipid signaling molecule synthesis. Steroid Biosynthesis (gga00100): Differential expression of cholesterol metabolism intermediate (KEGG: C02530) in this pathway correlates with CE (20:4) and CE (20:2) abundance. This suggests DLCD modulates cholesterol esterification to maintain ARA availability—supporting ALOX15B-mediated arachidonic acid metabolism and subsequent prostaglandin synthesis, which directly regulates ovulation interval.
Collectively, these results validate the gut-ovarian axis hypothesis: DLCD maintains a coordinated serum lipid profile that prioritizes energy supply and lipid signaling precursors, via Glycerolipid Metabolism and Steroid Biosynthesis, to sustain ovarian follicular development and ovulation rhythm—whereas DLCS exhibits lipid metabolic dysregulation that impairs egg-laying persistence.
3. Discussion
3.1. Intestinal Microbiota: The Initiation Hub of Regulatory Signals
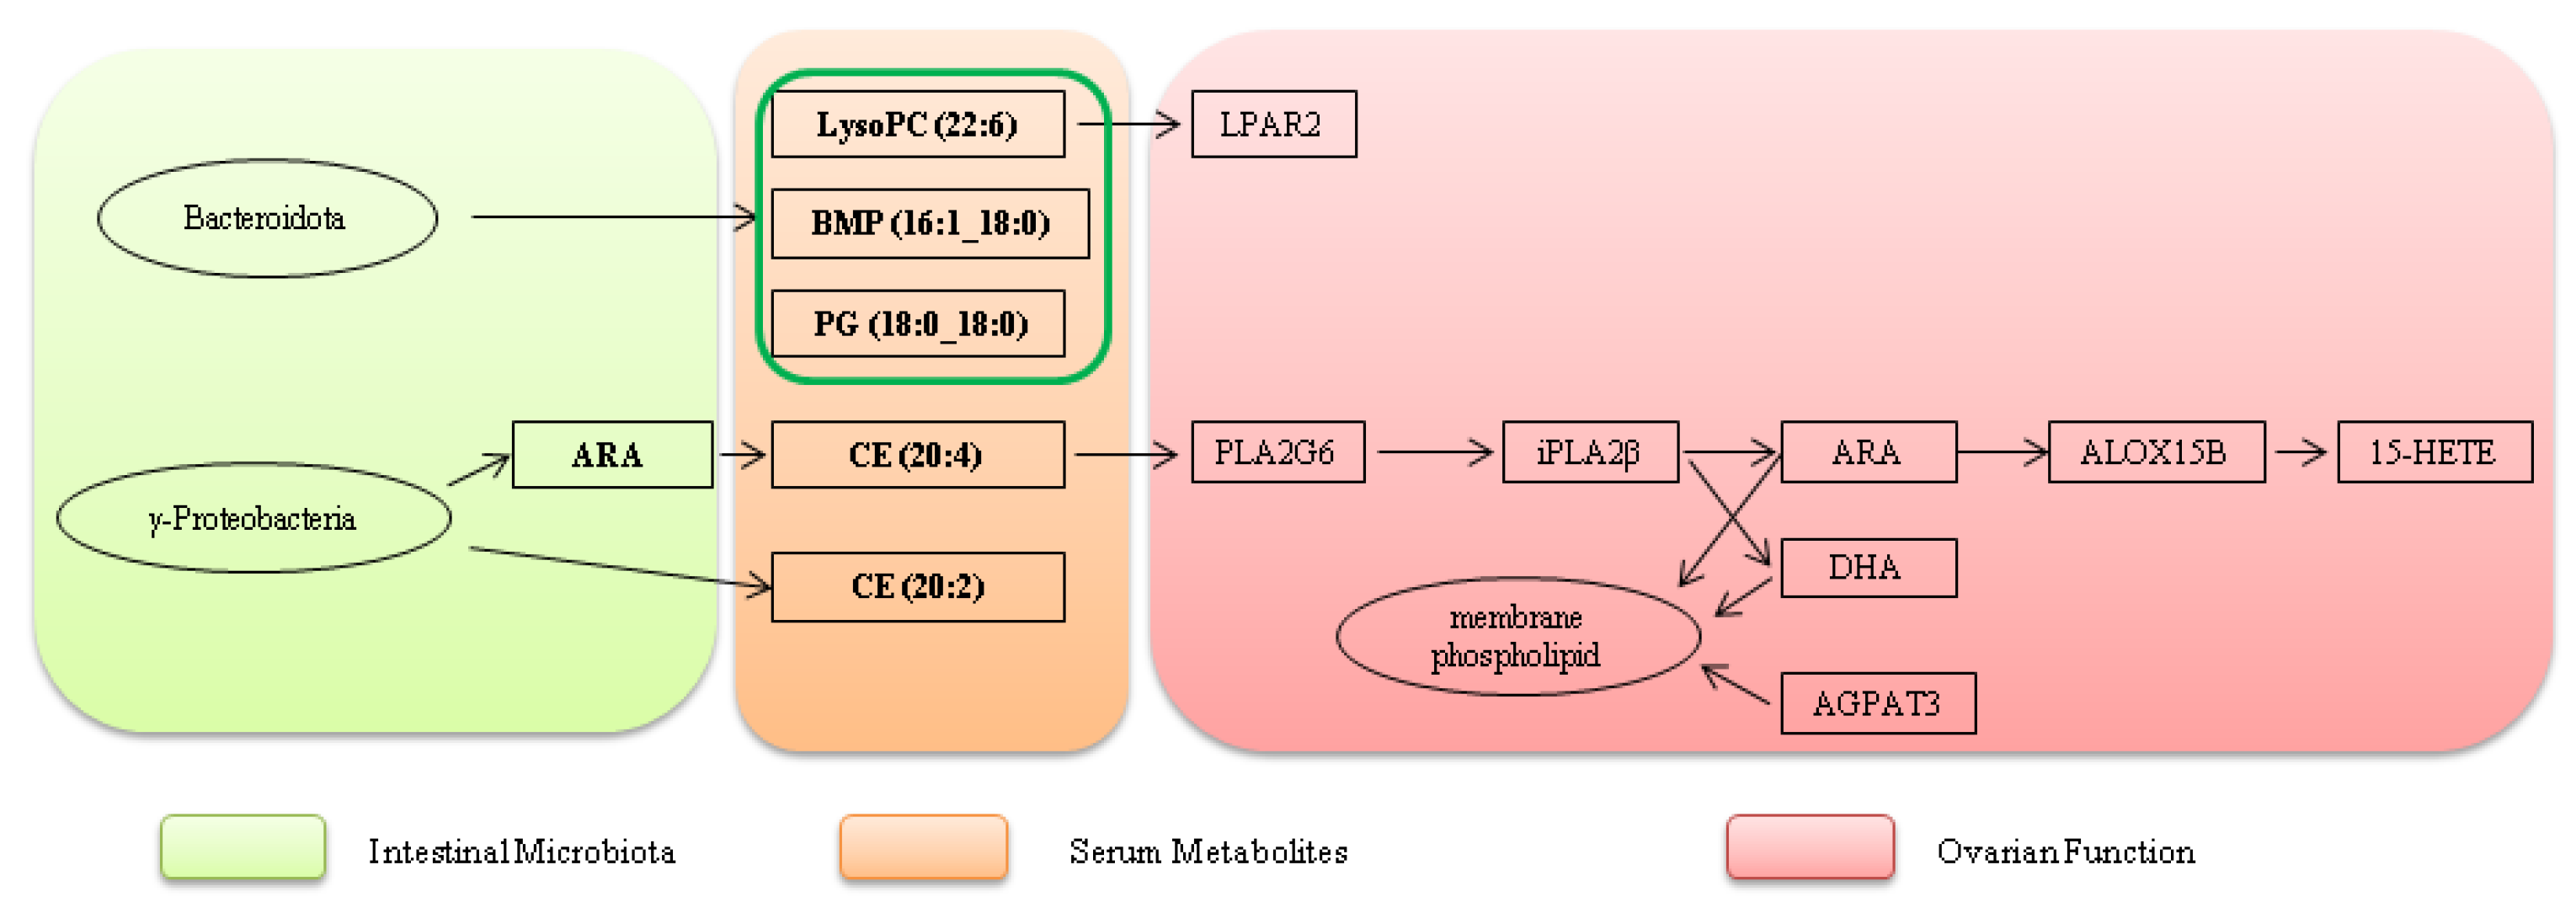
Traditional "ovarian-centric theory" emphasizes follicular development, hormone secretion, and ovarian function as core determinants of egg-laying performance [13,14,15]. However, this framework fails to explain the observed correlation between intestinal health and egg-laying traits, such as intergroup differences in ovarian morphology and reproductive performance in laying hens. A critical limitation lies in its neglect of regulatory inputs from peripheral system, particularly the intestine. To address this gap, we propose an integrated “gut-ovarian axis” model mediated by a lipid mediator network in laying hens, whose core logic revolves around the three-stage cascade: intestinal microbiota -serum metabolites-ovarian function.
The intestinal microbiota exhibited distinct compositional and functional divergence between the DLCD and DLCS groups, forming the initial regulatory layer. In DLCD, functionally significant γ-Proteobacteria (including Hydrogenophaga and Methylobacteriaceae) were enriched, which enhance energy metabolism, stabilize membrane structure, and reduce the production of deleterious metabolites - collectively creating a favorable microenvironment for supported lipid-mediated signal transmission. In contrast, DLCS is dominated by presumably environmental taxa, which correlate with disrupted intestinal homeostasis, impaired intestinal barrier function, and increased risk of ovarian damage. These findings support the intestinal microbiota as a “metabolic signal generator” that modulates extraintestinal tissues via metabolite secretion [16]. Specifically, it produces or modifies lipid precursors that serve as initial signaling molecules for downstream regulatory processes. Our serum target metabolome data provide critical validation for this cascade: DLCD exhibits significantly higher serum levels of cholesterol ester CE (20:4) compared to DLCS. As the cholesterol ester form of arachidonic acid (ARA), CE (20:4) is a core carrier that stably circulates in serum after ARA synthesis by the intestinal microbiota. Combined with the functional trait of DLCD-enriched γ-proteobacteria, this confirms a clear regulatory chain: γ-proteobacteria generate ARA via metabolic activities, which is then incorporated into serum circulation as CE (20:4). This provides direct molecular carrier evidence for gut-ovary cross-organ signal transmission, addressing the limitation of earlier omics studies that could only infer associations without empirical support for the serum intermediate link.
3.2. Serum Metabolites: The Cross-Organ Signaling Hub
Lysophosphatidylcholine (22:6) in DLCD serum exhibits a high VIP value of 4.5. It maintains the continuity and coordination of follicular development, as well as cellular functional e stability, by activating the ovarian G protein-coupled receptor LPAR2 via the LPA-LPAR2 signaling axis- ultimately supporting continuous ovulation and sequential l egg-laying in hens. LysoPC is bioactive lipid mediator produced by phospholipase A2 -catalyzed hydrolysis of phosphatidylcholine (PC), which is abundant in the circulatory system; its fluctuations dynamically reflect cholesterol levels [17]. Specifically, LysoPC (22:6) is a Lysophosphatidylcholine subtype carrying docosahexaenoic acid (DHA), which releases DHA under the action of phospholipase (PLA1/PLA2). DHA not only reduces triglyceride levels and cardiovascular disease risk [18] but also mediates vasodilation to regulate blood pressure [19]- processes that indirectly support ovarian blood supply and nutrient delivery.
LPAR2 is a G protein-coupled receptor, participates in cell development, proliferation, and apoptosis, with critical roles in follicular development. A SNP (rs410670692) in the 3’UTR of LPAR2 correlates with litter size in small-tailed Han sheep: individuals with the TT genotype exhibit higher LPAR2 expression. This SNP acts as a targeted regulatory element of miR-939-5p, which downregulates LPAR2 mRNA and protein levels by interfering with miR-939-5p binding. In sheep granulosa cells, overexpression of miR-939-5p inhibits granulosa proliferation and promotes apoptosis by blocking the LPAR2-dependent PI3K/Akt signaling pathway, thereby indirectly affecting litter size [20]. Beyond ruminants, LPAR2 has been implicated in pan-cancer prognosis, Muscovy ducks egg-laying regulation [21], and broilers testis transcriptional response to heat stress [22]. In ovarian physiology, LPAR2 expression in follicular theca cells may mediate lysophosphatidic acid (LPA)-dependent follicular regulation, including participation in cell proliferation, differentiation, and steroid synthesis[23]. Its high mRNA expression in atretic follicles suggests a potential role in follicular atresia. Additionally, theca cells transduce LPA signals via LPAR2 and may cooperate with granulosa cells to regulate intrafollicular hormonal balance, thereby influencing follicular development and dominant follicles selection. This mechanism confirms that LysoPC (22:6) acts as both a downstream metabolite of Bacteroidetes metabolism and an upstream activator of ovarian lipid signaling, forming a complete “microbiota metabolism - serum transmission - ovarian response” signaling chain in DLCD. Five other serum lipid metabolites—BMP (16:1_18:0), CE (20:4), CE (20:2), HexCer (18:1/18:0), and PG (18:0_18:0) — synergize with LysoPC (22:6) to constitute the core intermediate carrier network for gut-ovary cross-organ regulation, forming a coordinated functional cascade: 1. Synthesis foundation: DLCD-enriched intestinal functional flora provide biosynthetic substrates for these lipids via specialized metabolic activities—γ-Proteobacteria conjugate dietary fatty acids with cholesterol to generate CE (20:4) and CE (20:2); Bacteroidota participate in phospholipid metabolism to produce BMP and PG (18:0_18:0) and regulate sphingolipid synthesis to generate HexCer (18:1/18:0). The synthesis processes are closely linked to the intestinal homeostasis maintenance and barrier function enhancement, laying the material foundation for cross-organ signal transmission. 2. Serum transport: After entering the circulatory system, these metabolites achieve stable transport via structural characteristics: CE (20:4) and CE (20:2) form complexes with lipoproteins; BMP maintains biologically activity; PG (18:0_18:0) and HexCer (18:1/18:0) integrate into the serum lipid network. Serum targeted metabolomics confirms their significant differential expression and enrichment in core pathways, forming a synergistically transported lipid signaling network. 3. Ovarian response: Upon reaching the ovary, each metabolite undergoes functional transformation and synergizes with upregulated genes to participate in key follicular development processes: (1) Unsaturated fatty acids released by CE (20:4) and CE (20:2) hydrolysis provide substrates for the PLA2G6-ALOX15B axis and support steroid hormone synthesis; (2) BMP activates ovarian signaling pathways to regulate follicular theca cell proliferation and differentiation; (3) PG (18:0_18:0) enhances mitochondrial energy metabolism efficiency and follicular membrane stability; (4) HexCer (18:1/18:0) participates in cell membrane remodeling and inhibits follicular atresia.
The KEGG pathway annotation of serum targeted metabolomics confirms that these differential lipids are significantly enriched in the Glycolipid metabolism pathway (gga00561). Glycerol-3-phosphate (KEGG: C00422), a core intermediate in phospholipid synthesis, exhibits high-abundance in DLCD serum—consistent with ovarian omics finding that the PLA2G6-ALOX15B axis regulates phospholipid metabolism. The differential distribution of serum lipid intermediate products provide direct substrate source of the ovarian PLA2G6-ALOX15B axis: PLA2G6 catalyzes the release of serum -derived phospholipids into ovarian cells, which are then metabolized by ALOX15B to regulate follicular development; AGPAT3 utilizes serum lipid precursors for phospholipid remodeling, stabilizing the follicular membrane structure.
In summary, DLCD establishes a coordinated regulatory system: gut microbiota-derived specific serum lipids—with LysoPC (22:6) as the signaling molecule and BMP, CE (20:4), CE (20:2), HexCer (18:1/18:0), and PG (18:0_18:0) as key intermediate carriers-are precisely transported to the ovary. There, they activate critical receptors and synergize with upregulated genes. Providing multi-dimensional support (energy supply, signal transmission, structural integrity) via “intestinal synthesis - serum transport - ovarian response” coordination. This ensures continuous follicular development and ovulation, ultimately realizing the high clutch persistence phenotype.
3.3. Ovarian Lipid Metabolic Pathways: The Functional Core
Cross-omics data analysis identifies the PLA2G6-ALOX15B-AGPAT3 pathway as a key regulatory hub for follicular development, achieving synergy via metabolic flux guidance and functional effect coupling. As the pathway’s initiation node, PLA2G6 is significantly upregulated by 1.8-fold. It encodes calcium-independent phospholipase A2β (iPLA2β), which drives the intracellular release of ARA from membrane phospholipids-providing core substrates for downstream prostaglandins synthesis that promotes follicular maturation, thereby defining the direction of metabolic flux. iPLA2β also release DHA (22:6n-3), which participates in inflammation, immunity and vasodilation [24,25]. ARA, as a key precursor, is converted into inflammatory mediators via cyclooxygenase or lipoxygenase [26] — mediating ovulation and follicular survival.
ALOX15B (a lipoxygenase family member) catalyzes the conversion of ARA to 15-HETE (15-hydroxyeicosapentaenoic acid), which reduces oxidative damage during follicular development via anti-inflammatory effects, prolonging follicular survival and complementing PLA2G6 metabolic initiation role. Upon stimulation by calcium ionophores, ALOX15B localization increases on both the plasma membrane and cytoplasmic side of intracellular membrane [27,28]. Expressed in human macrophages [29], it catalyzes stereospecific peroxidation of polyunsaturated fatty acids (PUFAs) to generate hydroperoxyl derivatives identical to those produced by ALOX15 [30]—supporting its conserved role in lipid signaling.
AGPAT3 (lysophosphatidic acid acyltransferase) modulates membrane properties through phospholipid remodeling, helping to maintain a suitable lipid environment for membrane-associated metabolic reactions. During lipid synthesis, AGPAT3 preferentially uses fatty acyl-coenzyme A (formed by ARA/DHA conjugation with coenzyme A) as substrate, acquiring acyl groups for phospholipids synthesis [31]. It plays a key role in ovarian phospholipid synthesis [32]: AGPAT3-mediated phosphatidic acid synthesis enhances follicular membrane fluidity, providing a crucial structural basis for follicular rupture during ovulation and ensuring ovulation efficiency. Collectively, these three genes form a complete regulatory chain : substrate supply (PLA2G6) → functional effect (ALOX15B) → environmental support (AGPAT3).
The association confirms that the “intestinal microbiota → serum lipid transfer of → ovarian pathway response” cascade is not random omics-level correlation but a logically consistent process of material transfer and functional response: gut - derived lipid precursors are transported to the ovary via serum carriers, directly activating core metabolic pathways and providing substrates/structural support for follicular development. Serum targeted metabolomics validation further strengthens the credibility of the gut - ovarian axis regulation of egg-laying persistence.
Serum targeted metabolomics validation provide key experimental evidence from two dimensions: (1) carrier evidence for gut - serum signal transmission; (2) substrate support for ovarian lipid pathway. This strongly supports the “gut - ovarian axis lipid mediator regulatory model” proposed by earlier omics studies. DLCD enriches intestinal microbiota to synthesizes lipid precursors, which are precisely transported to the ovary via serum lipids, activating the PLA2G6-ALOX15B axis regulated phospholipid metabolic pathway and maintaining high egg-laying persistence. In contrast, DLCS group, exhibits serum lipid metabolic dysregulation, leading to blocked intestinal signal transmission and insufficient ovarian lipid pathway substrate, resulting in reduced egg-laying persistence. These findings advance the gut - ovarian axis mechanism and provide a theoretical basis for improving the egg-laying performance of in aged laying hens via intestinal microbiota modulation or serum lipid metabolism regulation. Future studies could focus on targeted intervention of key flora or lipid mediators, LysoPC (22:6)) to develop practical strategies for enhancing egg-laying persistence.
Figure 22.
Schematic Diagram of the Gut-Ovarian Axis Regulated by Microbial-Derived Lipid Mediators.
Figure 22.
Schematic Diagram of the Gut-Ovarian Axis Regulated by Microbial-Derived Lipid Mediators.
4. Conclusion
This study investigated the regulatory mechanisms underlying clutch persistence in 65-week-old laying hens using multi-omics analyses, proposing a lipid mediator network-mediated “gut-ovarian axis” model that extends the traditional “ovary-centric” paradigm. Key findings identified distinct profiles of cecal microbiota, serum metabolites, and ovarian regulatory pathways associated with high clutch persistence. Specifically, DLCD-enriched γ-Proteobacteria drove lipid precursors biosynthesis, which optimized the follicular microenvironment—potentially via downregulating ovarian TNF-α. Serum LysoPC (22:6), a critical signaling molecule identified herein, activated ovarian LPAR2 to the continuity of follicular development. The ovarian PLA2G6-ALOX15B-AGPAT3 axis orchestrated lipid metabolism, directly supporting follicle maturation and ovulation. Collectively, these results demonstrate that gut microbiota-derived lipid mediators bridge intestinal and ovarian function, forming a “microbiota-serum-ovary” regulatory cascade. This work provides novel insights for extending the economic laying cycle of aged hens and identifies promising targets to enhance poultry production efficiency.
Acknowledgments
The authors would like to express their sincere gratitude to Mr. Chuanwei Zheng and Mr. Zhiqiong Mao of Zhongnong Bangyang Egg-type Chicken Breeding Co., Ltd. for providing access to the experimental facilities and poultry farm, which were essential for the successful conduct of this study. Their generous support in data collection and logistical assistance is also gratefully acknowledged.
Author Contributions
For research articles with several authors, the following statements should be used “Conceptualization, X.X. and Y.Y.; methodology, X.X.; software, X.X.; validation, X.X., Y.Y. and Z.Z.; formal analysis, X.X.; investigation, X.X.; resources, X.X.; data curation, X.X.; writing—original draft preparation, X.X.; writing—review and editing, X.X.; visualization, X.X.; supervision, X.X.; project administration, X.X.; funding acquisition, Y.Y. All authors have read and agreed to the published version of the manuscript.”.
Funding
Please add: This research received no external funding or This research was funded by [name of funder] grant number [xxx] And The APC was funded by [XXX]. Information regarding the funder and the funding number should be provided. Please check the accuracy of funding data and any other information carefully.
Institutional Review Board Statement
In this section, you should add the Institutional Review Board Statement and approval number, if relevant to your study. You might choose to exclude this statement if the study did not require ethical approval. Please note that the Editorial Office might ask you for further information. Please add “The study was conducted in accordance with the Declaration of Helsinki, and approved by the Institutional Review Board (or Ethics Committee) of NAME OF INSTITUTE (protocol code XXX and date of approval).” for studies involving humans. OR “The animal study protocol was approved by the Institutional Review Board (or Ethics Committee) of NAME OF INSTITUTE (protocol code XXX and date of approval).” for studies involving animals. OR “Ethical review and approval were waived for this study due to REASON (please provide a detailed justification).” OR “Not applicable” for studies not involving humans or animals.
Informed Consent Statement
Any research article describing a study involving humans should contain this statement. Please add “Informed consent was obtained from all subjects involved in the study.” OR “Patient consent was waived due to REASON (please provide a detailed justification).” OR “Not applicable.” for studies not involving humans. You might also choose to exclude this statement if the study did not involve humans.Written informed consent for publication must be obtained from participating patients who can be identified (including by the patients themselves). Please state “Written informed consent has been obtained from the patient(s) to publish this paper” if applicable.
Data Availability Statement
We encourage all authors of articles published in MDPI journals to share their research data. In this section, please provide details regarding where data supporting reported results can be found, including links to publicly archived datasets analyzed or generated during the study. Where no new data were created, or where data is unavailable due to privacy or ethical restrictions, a statement is still required. Suggested Data Availability Statements are available in section “MDPI Research Data Policies” at https://www.mdpi.com/ethics.
Conflicts of Interest
Declare conflicts of interest or state “The authors declare no conflict of interest.”.
References
- Liu, S; Yin, J; Cong, K; Yue, S; Zhang, Y; Sun, J; et al. Synergistic transcriptomic and metabolomic analyses in Zi geese ovaries with different clutch lengths. Poult Sci. 2025, 104(7), 105210, Epub 2025/04/29. [Google Scholar] [CrossRef] [PubMed] [PubMed Central]
- Bain, MM; Nys, Y; Dunn, IC. Increasing persistency in lay and stabilising egg quality in longer laying cycles. What are the challenges? Br Poult Sci. 2016, 57(3), 330–8, Epub 2016/03/17. [Google Scholar] [CrossRef] [PubMed Central]
- Wolc A, Bednarczyk M, Lisowski M, Szwaczkowski TJJoA, Sciences F. Genetic relationships among time of egg formation, clutch traits and traditional selection traits in laying hens. 2010;19(3):452-9.
- Noda, K; Kino, K; Miyakawa, H; Banba, H; Umezawa, YJJoPS. Persistency of Laying Strain Building by Index Selection Including Oviposition Time as Selection Trait in Laying Hen. 2004, 39(3), 140–8. [Google Scholar] [CrossRef]
- Chen, CF; Evolution, MT-BJGS. Estimation of genetic variability and selection response for clutch length in dwarf brown-egg layers carrying or not the naked neck gene. 2003, 35(2), 219–38. [Google Scholar] [CrossRef] [PubMed]
- Wang, J; Liu, Z; Cao, D; Liu, J; Li, F; Han, H; et al. Elucidation of the genetic determination of clutch traits in Chinese local chickens of the Laiwu Black breed. BMC genomics 2023, 24(1), 686, Epub 2023/11/16. [Google Scholar] [CrossRef] [PubMed] [PubMed Central]
- Amevor, FK; Cui, Z; Ning, Z; Du, X; Jin, N; Shu, G; et al. Synergistic effects of quercetin and vitamin E on egg production, egg quality, and immunity in aging breeder hens. Poult Sci. 2021, 100(12), 101481, Epub 2021/10/31. [Google Scholar] [CrossRef] [PubMed] [PubMed Central]
- Su, Y; Tian, S; Li, D; Zhu, W; Wang, T; Mishra, SK; et al. Association of female reproductive tract microbiota with egg production in layer chickens. GigaScience 2021, 10(9). Epub 2021/09/24. [Google Scholar] [CrossRef] [PubMed] [PubMed Central]
- Cryan, JF; O'Riordan, KJ; Cowan, CSM; Sandhu, KV; Bastiaanssen, TFS; Boehme, M; et al. The Microbiota-Gut-Brain Axis. Physiological reviews 2019, 99(4), 1877–2013, Epub 2019/08/29. [Google Scholar] [CrossRef] [PubMed]
- Zakaria, AH; Miyaki, T; Imai, K. The relationships of clutch length and egg position on ovarian follicular growth in laying hens. Poult Sci. 1984, 63(6), 1250–4, Epub 1984/06/01. [Google Scholar] [CrossRef] [PubMed]
- Reeves AR, Wang GR, Salyers AA. Characterization of four outer membrane proteins that play a role in utilization of starch by Bacteroides thetaiotaomicron. Journal of bacteriology. 1997;179(3):643-9. Epub 1997/02/01. doi: 10.1128/jb.179.3.643-649.1997. PubMed PMID: 9006015; PubMed Central PMCID: PMCPMC178742. 3. [CrossRef] [PubMed] [PubMed Central]
- Zafar, H; Saier, MH, Jr. Gut Bacteroides species in health and disease. Gut microbes 2021, 13(1), 1–20, Epub 2021/02/05. [Google Scholar] [CrossRef] [PubMed] [PubMed Central]
- Apperson, KD; Bird, KE; Cherian, G; Löhr, CV. Histology of the Ovary of the Laying Hen (Gallus domesticus). Vet Sci. 2017, 4. Epub 2017/12/14. [Google Scholar] [CrossRef] [PubMed] [PubMed Central]
- Nili, H; Kelly, WR. Form and function of lacunae in the ovary of the laying hen. The Anatomical record 1996, 244(2), 165–74, Epub 1996/02/01. [Google Scholar] [CrossRef] [PubMed]
- Li, P; Yu, X; Xie, J; Yao, X; Liu, W; Yao, J; et al. Expression of cocaine- and amphetamine-regulated transcript (CART) in hen ovary. Biological research 2017, 50(1), 18, Epub 2017/05/24. [Google Scholar] [CrossRef] [PubMed] [PubMed Central]
- Mann, ER; Lam, YK; Uhlig, HH. Short-chain fatty acids: linking diet, the microbiome and immunity. Nature reviews Immunology 2024, 24(8), 577–95, Epub 2024/04/03. [Google Scholar] [CrossRef] [PubMed]
- Tazuma, S; Kanno, K; Sugiyama, A; Kishikawa, N. Nutritional factors (nutritional aspects) in biliary disorders: bile acid and lipid metabolism in gallstone diseases and pancreaticobiliary maljunction. Journal of gastroenterology and hepatology 2013, 28 Suppl 4, 103–7, Epub 2013/11/28. [Google Scholar] [CrossRef] [PubMed]
- Retterstøl, K; Rosqvist, F. Fat and fatty acids - a scoping review for Nordic Nutrition Recommendations 2023. Food & nutrition research 2024, 68. Epub 2024/02/08. [Google Scholar] [CrossRef] [PubMed] [PubMed Central]
- Bercea, CI; Cottrell, GS; Tamagnini, F; McNeish, AJ. Omega-3 polyunsaturated fatty acids and hypertension: a review of vasodilatory mechanisms of docosahexaenoic acid and eicosapentaenoic acid. British journal of pharmacology 2021, 178(4), 860–77, Epub 2020/12/08. [Google Scholar] [CrossRef] [PubMed]
- Zhang, R; Liu, Y; Li, W; Wang, P; Liu, Z; Wen, Y; et al. A mutation in LPAR2 activates the miR-939-5p-LPAR2-PI3K/AKT axis to regulate the proliferation and apoptosis of granulosa cells in sheep. Theriogenology 2024, 219, 1–10, Epub 2024/02/19. [Google Scholar] [CrossRef] [PubMed]
- Bello, SF; Xu, H; Guo, L; Li, K; Zheng, M; Xu, Y; et al. Hypothalamic and ovarian transcriptome profiling reveals potential candidate genes in low and high egg production of white Muscovy ducks (Cairina moschata). Poult Sci. 2021, 100(9), 101310, Epub 2021/07/24. [Google Scholar] [CrossRef] [PubMed] [PubMed Central]
- Wang, SH; Cheng, CY; Tang, PC; Chen, CF; Chen, HH; Lee, YP; et al. Acute heat stress induces differential gene expressions in the testes of a broiler-type strain of Taiwan country chickens. PLoS One 2015, 10(5), e0125816, Epub 2015/05/02. [Google Scholar] [CrossRef] [PubMed Central]
- Sinderewicz, E; Grycmacher, K; Boruszewska, D; Kowalczyk-Zięba, I; Woclawek-Potocka, I. Lysophosphatidic acid expression in theca cells depends on the type of bovine ovarian follicle. Reprod Domest Anim. 2017, 52(1), 28–34, Epub 2016/09/21. [Google Scholar] [CrossRef] [PubMed]
- Murakami, M; Taketomi, Y; Miki, Y; Sato, H; Hirabayashi, T; Yamamoto, K. Recent progress in phospholipase A₂ research: from cells to animals to humans. Progress in lipid research. 2011, 50(2), 152–92, Epub 2010/12/28. [Google Scholar] [CrossRef] [PubMed]
- Burke, JE; Dennis, EA. Phospholipase A2 structure/function, mechanism, and signaling. Journal of lipid research 2009, 50 Suppl(Suppl), S237–42, Epub 2008/11/18. [Google Scholar] [CrossRef] [PubMed] [PubMed Central]
- Serrano-Mollar, A; Closa, D. Arachidonic acid signaling in pathogenesis of allergy: therapeutic implications. Current drug targets Inflammation and allergy 2005, 4(2), 151–5, Epub 2005/04/28. [Google Scholar] [CrossRef] [PubMed]
- Brinckmann, R; Schnurr, K; Heydeck, D; Rosenbach, T; Kolde, G; Kühn, H. Membrane translocation of 15-lipoxygenase in hematopoietic cells is calcium-dependent and activates the oxygenase activity of the enzyme. Blood 1998, 91, 64–74, Epub 1998/02/07. [Google Scholar] [CrossRef] [PubMed]
- Bender, G; Schexnaydre, EE; Murphy, RC; Uhlson, C; Newcomer, ME. Membrane-dependent Activities of Human 15-LOX-2 and Its Murine Counterpart: IMPLICATIONS FOR MURINE MODELS OF ATHEROSCLEROSIS. The Journal of biological chemistry 2016, 291(37), 19413–24, Epub 2016/07/21. [Google Scholar] [CrossRef] [PubMed] [PubMed Central]
- Wuest, SJ; Crucet, M; Gemperle, C; Loretz, C; Hersberger, M. Expression and regulation of 12/15-lipoxygenases in human primary macrophages. Atherosclerosis 2012, 225(1), 121–7, Epub 2012/09/18. [Google Scholar] [CrossRef] [PubMed]
- Kutzner, L; Goloshchapova, K; Heydeck, D; Stehling, S; Kuhn, H; Schebb, NH. Mammalian ALOX15 orthologs exhibit pronounced dual positional specificity with docosahexaenoic acid. Biochimica et biophysica acta Molecular and cell biology of lipids 2017, 1862(7), 666–75, Epub 2017/04/13. [Google Scholar] [CrossRef] [PubMed]
- Zhou, H; Fick, K; Patel, V; Hilton, LR; Kim, HW; Bagi, Z; et al. AGPAT3 deficiency impairs adipocyte differentiation and leads to a lean phenotype in mice. American journal of physiology Endocrinology and metabolism 2024, 327(1), E69–e80, Epub 2024/05/08. [Google Scholar] [CrossRef] [PubMed] [PubMed Central]
- Pan, K; Zhu, B; Wang, L; Guo, Q; Shu-Chien, AC; Wu, X. Expression pattern of AGPATs isoforms indicate different functions during the triacylglyceride synthesis in Chinese mitten crab, Eriocheir sinensis. Comparative biochemistry and physiology Part A, Molecular & integrative physiology 2024, 287, 111535, Epub 2023/10/19. [Google Scholar] [CrossRef] [PubMed]
Figure 1.
PCoA analysis of cecal contents and box plot of PC1 axis interpretation values among groups. Note: The interpretation values of the PC1 axis across different groups are presented as a box plot, which enables more intuitive comparison of inter-group differences in the PC1 axis.
Figure 1.
PCoA analysis of cecal contents and box plot of PC1 axis interpretation values among groups. Note: The interpretation values of the PC1 axis across different groups are presented as a box plot, which enables more intuitive comparison of inter-group differences in the PC1 axis.
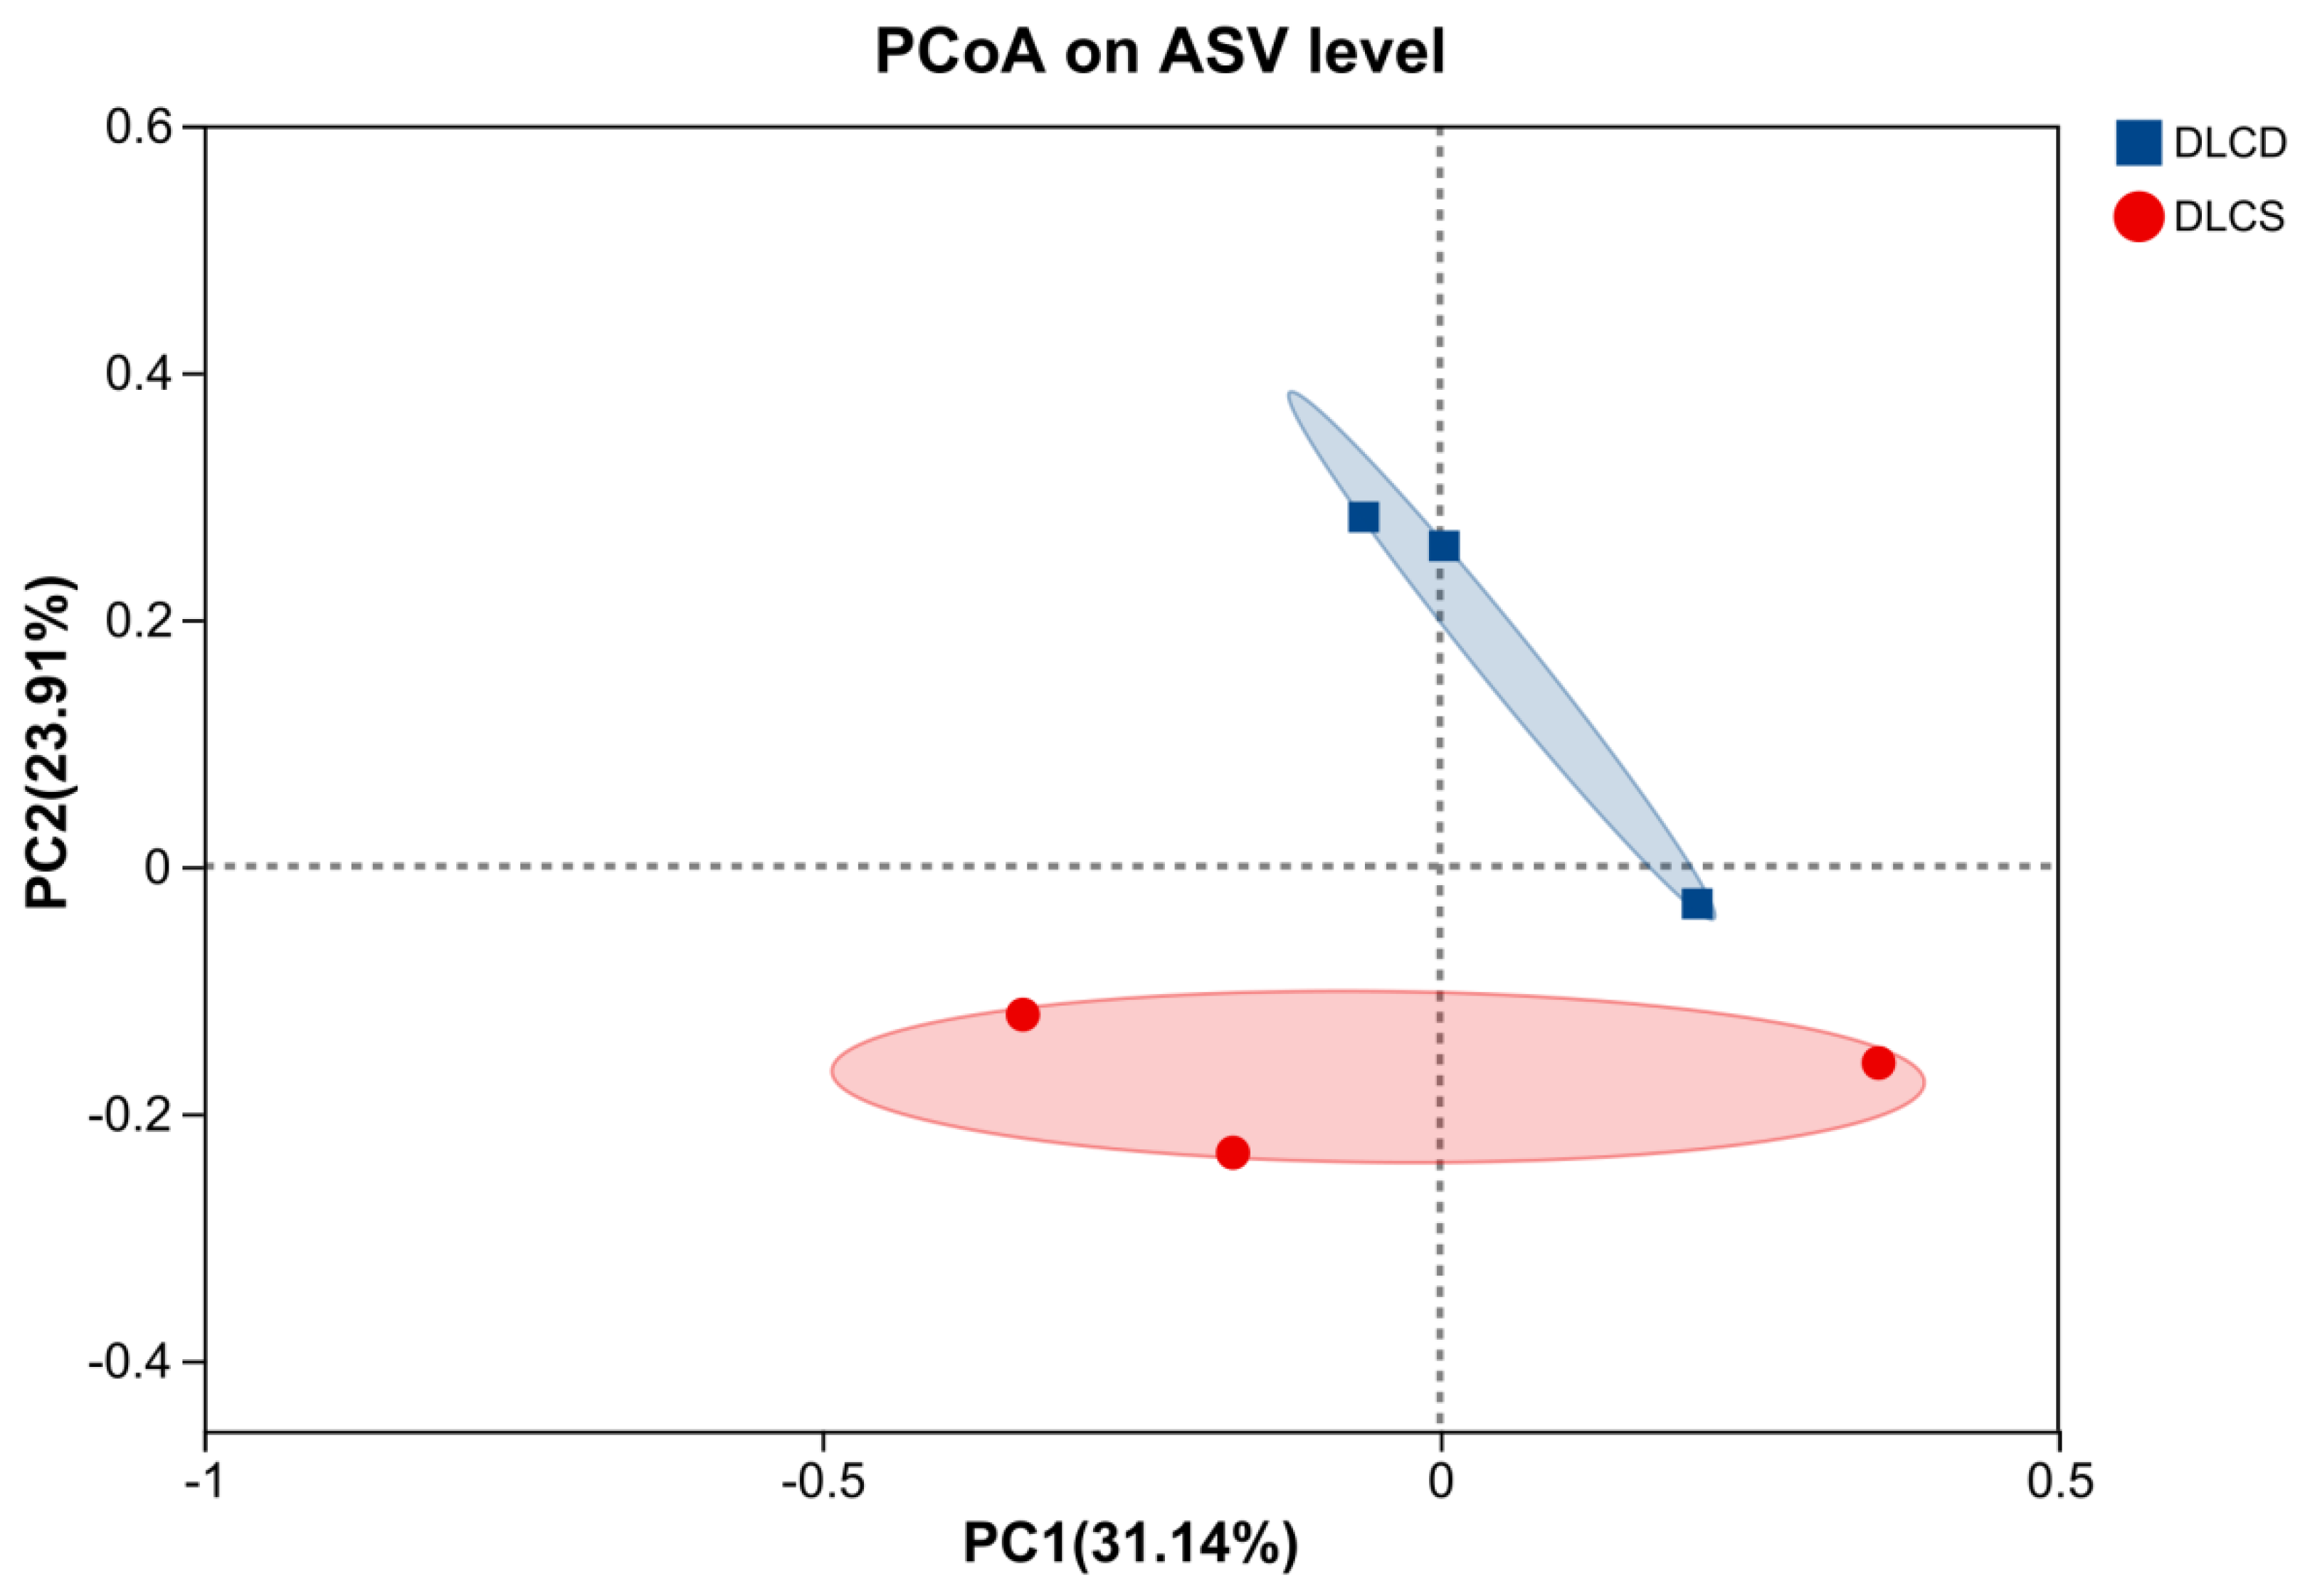
Figure 2.
Bar plot and Pie plot of cecal microbiota community composition. Note: For the bar plot, the abscissa represents sample names, and the ordinate indicates the relative abundance of each microbial species in the corresponding sample. Columns of different colors correspond to different microbial species, with column length reflecting species abundance. Group labels are marked on the columns to distinguish the DLCD and DLCS groups.
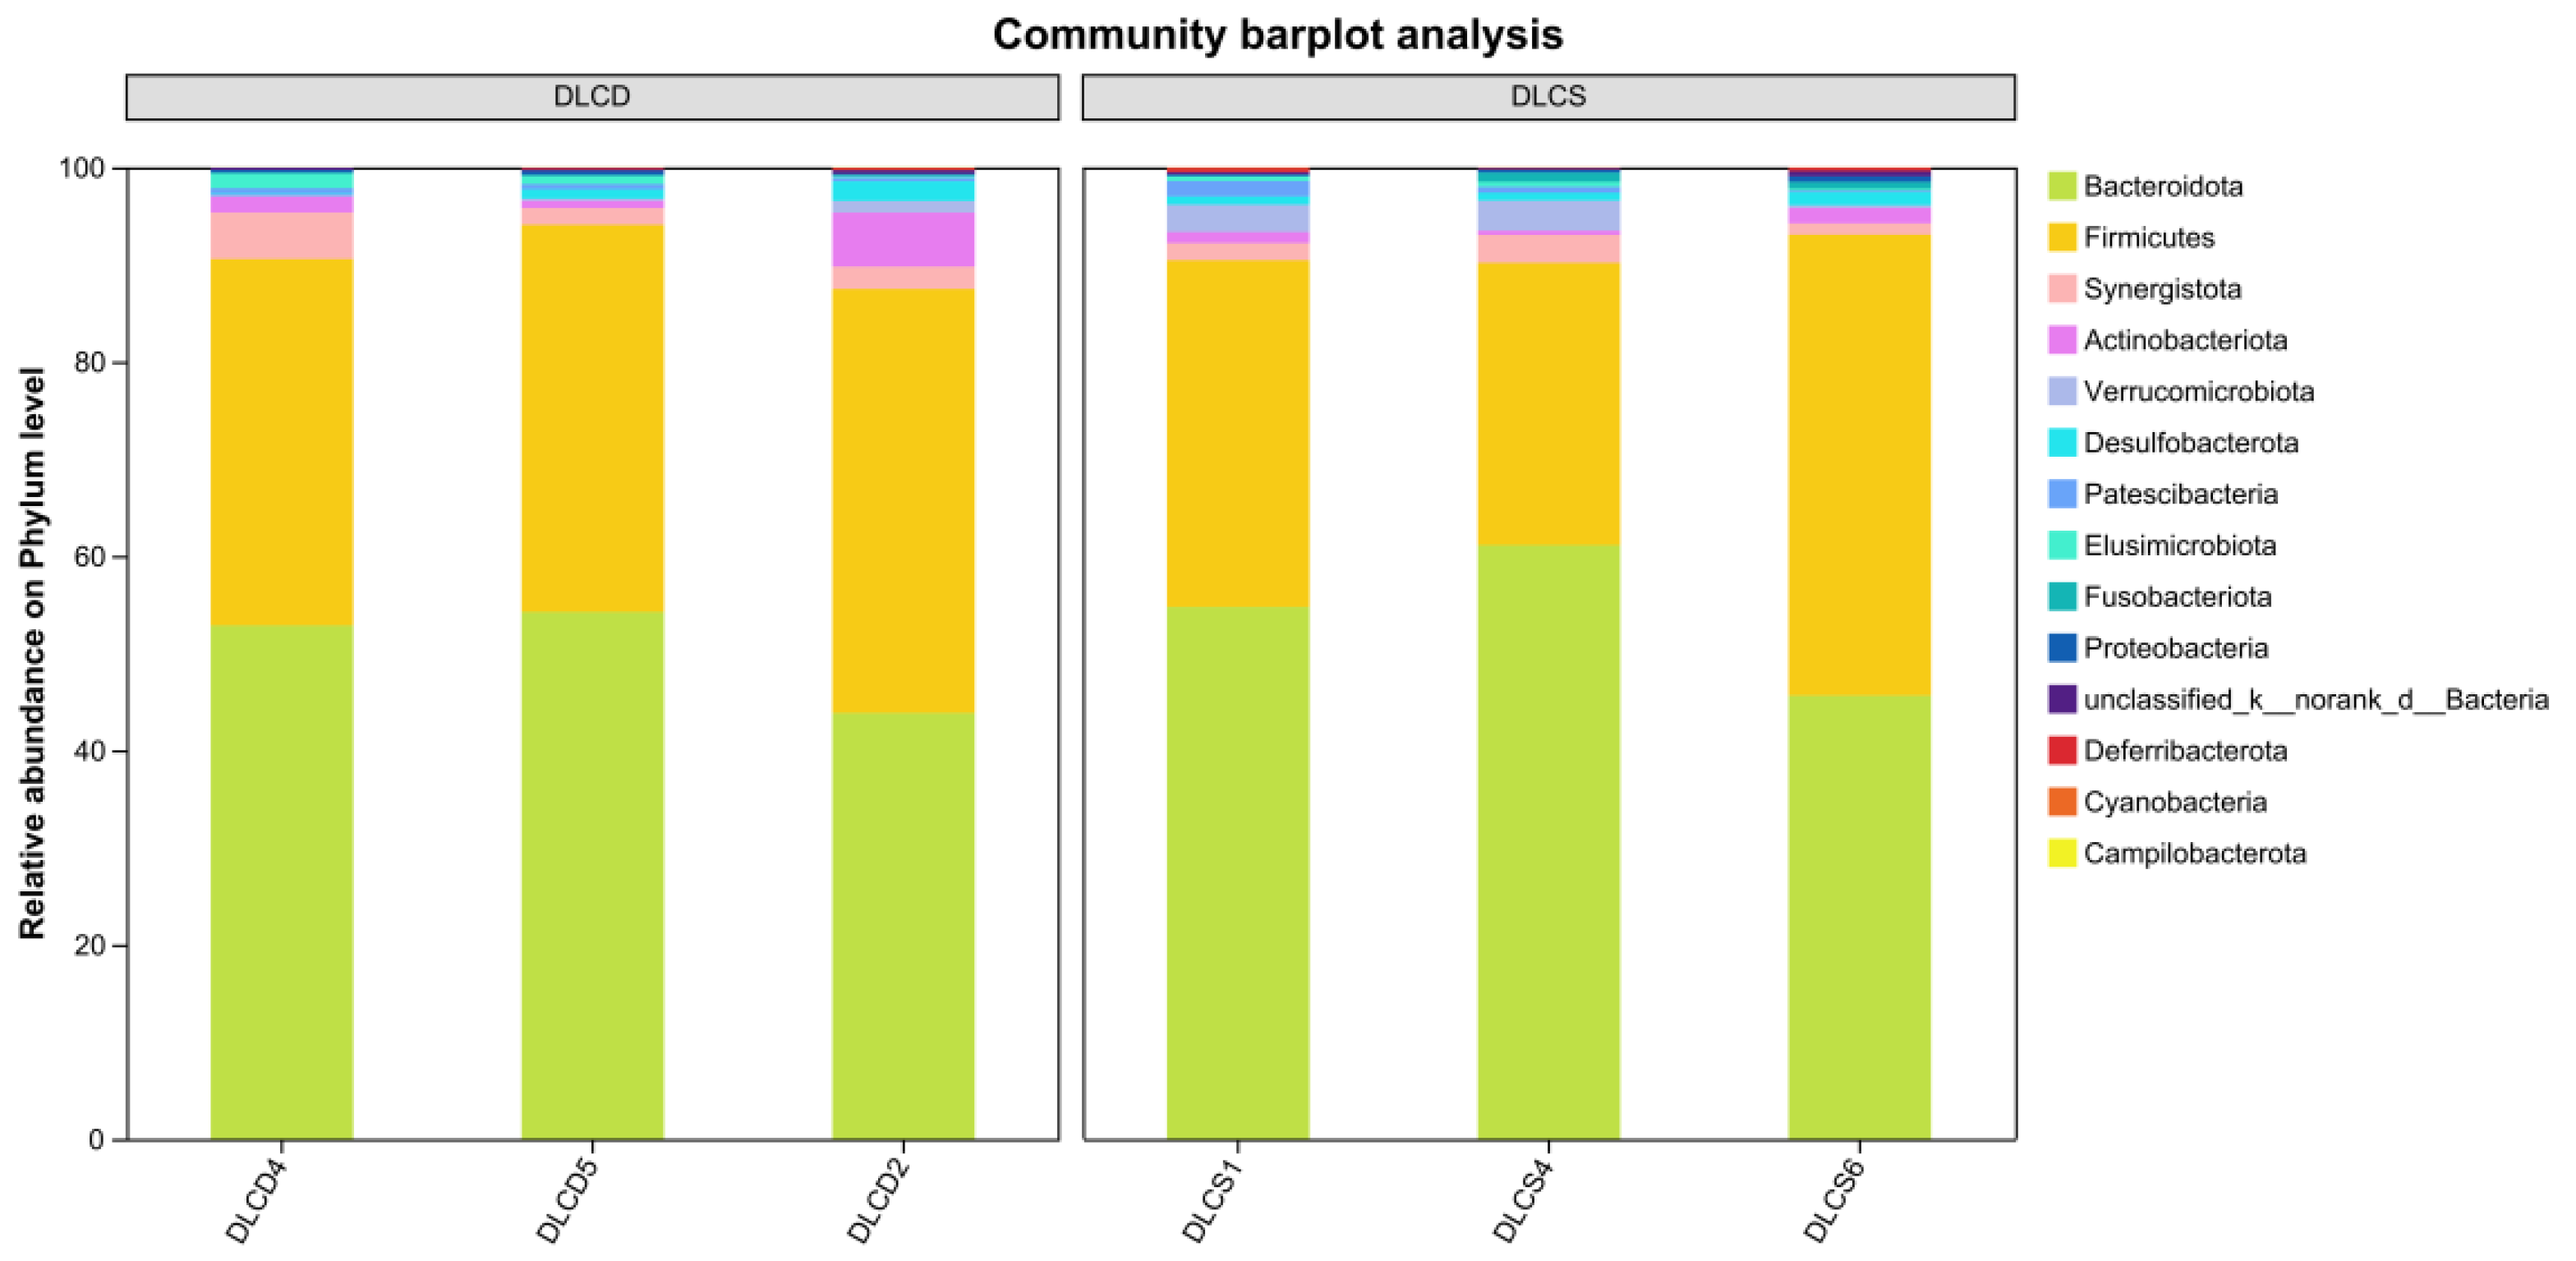
Figure 3.
LEfSe analysis of cecal microorganisms.
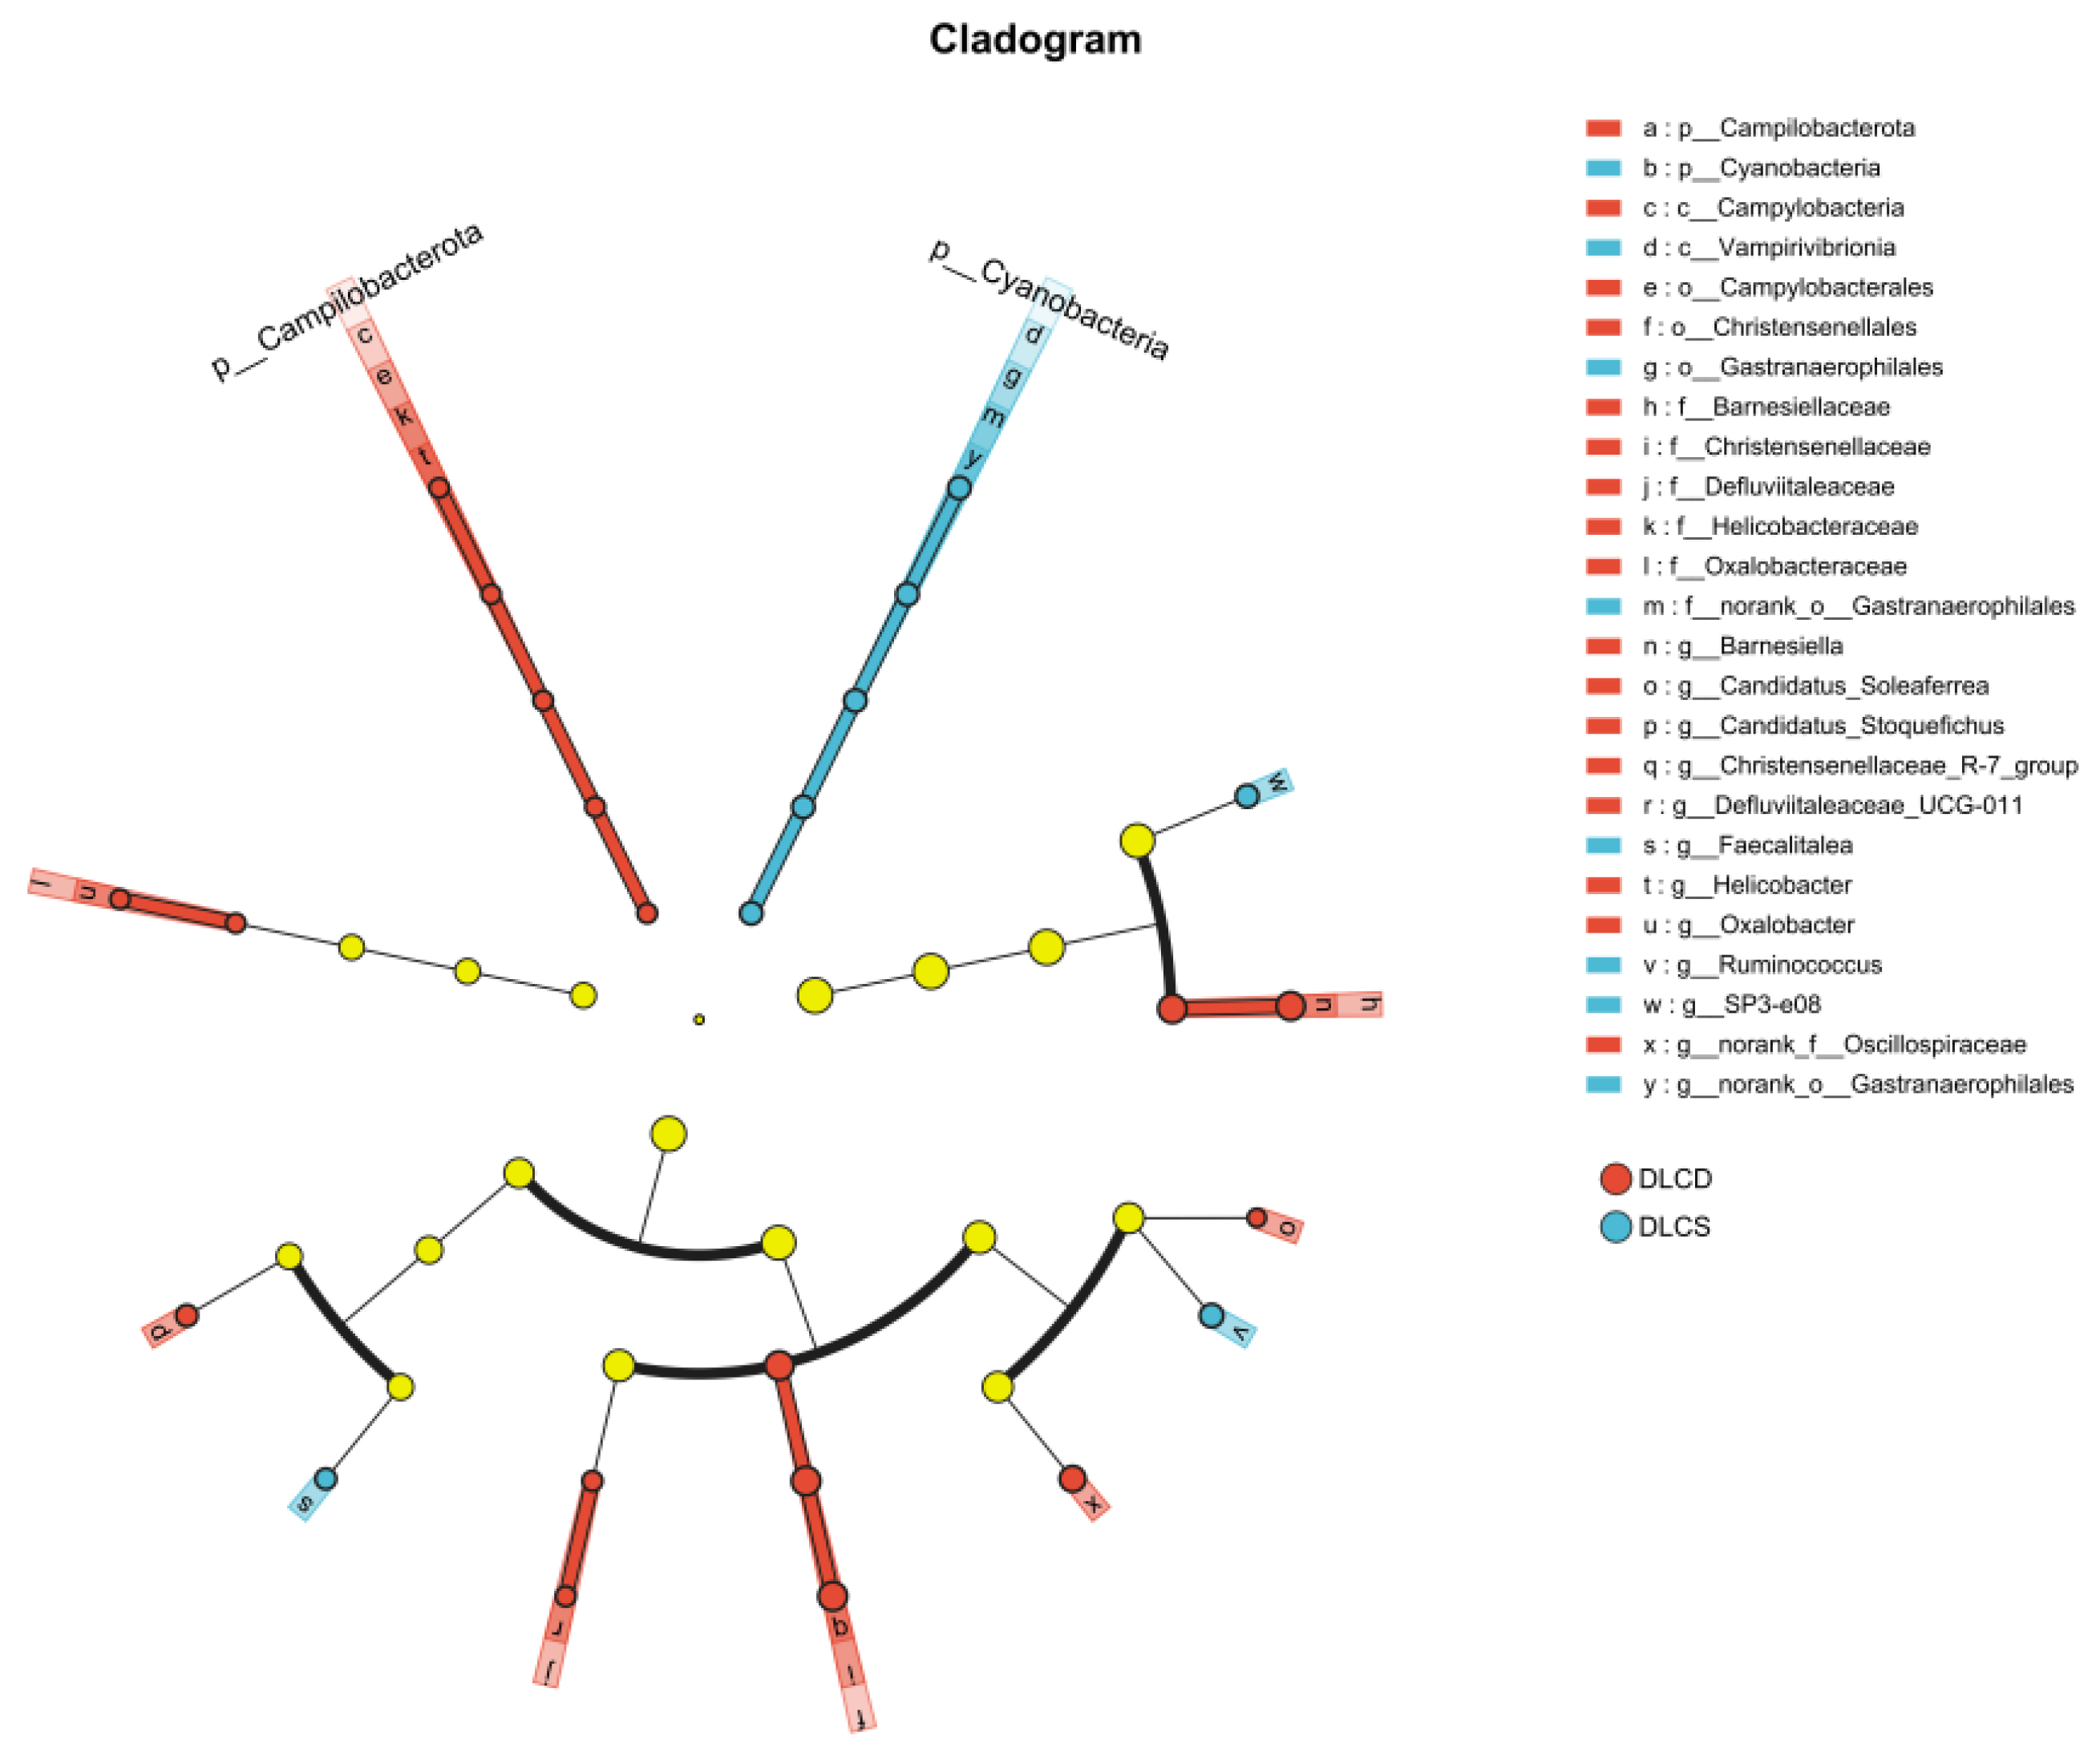
Figure 4.
Serum metabolome PLS-DA analysis.
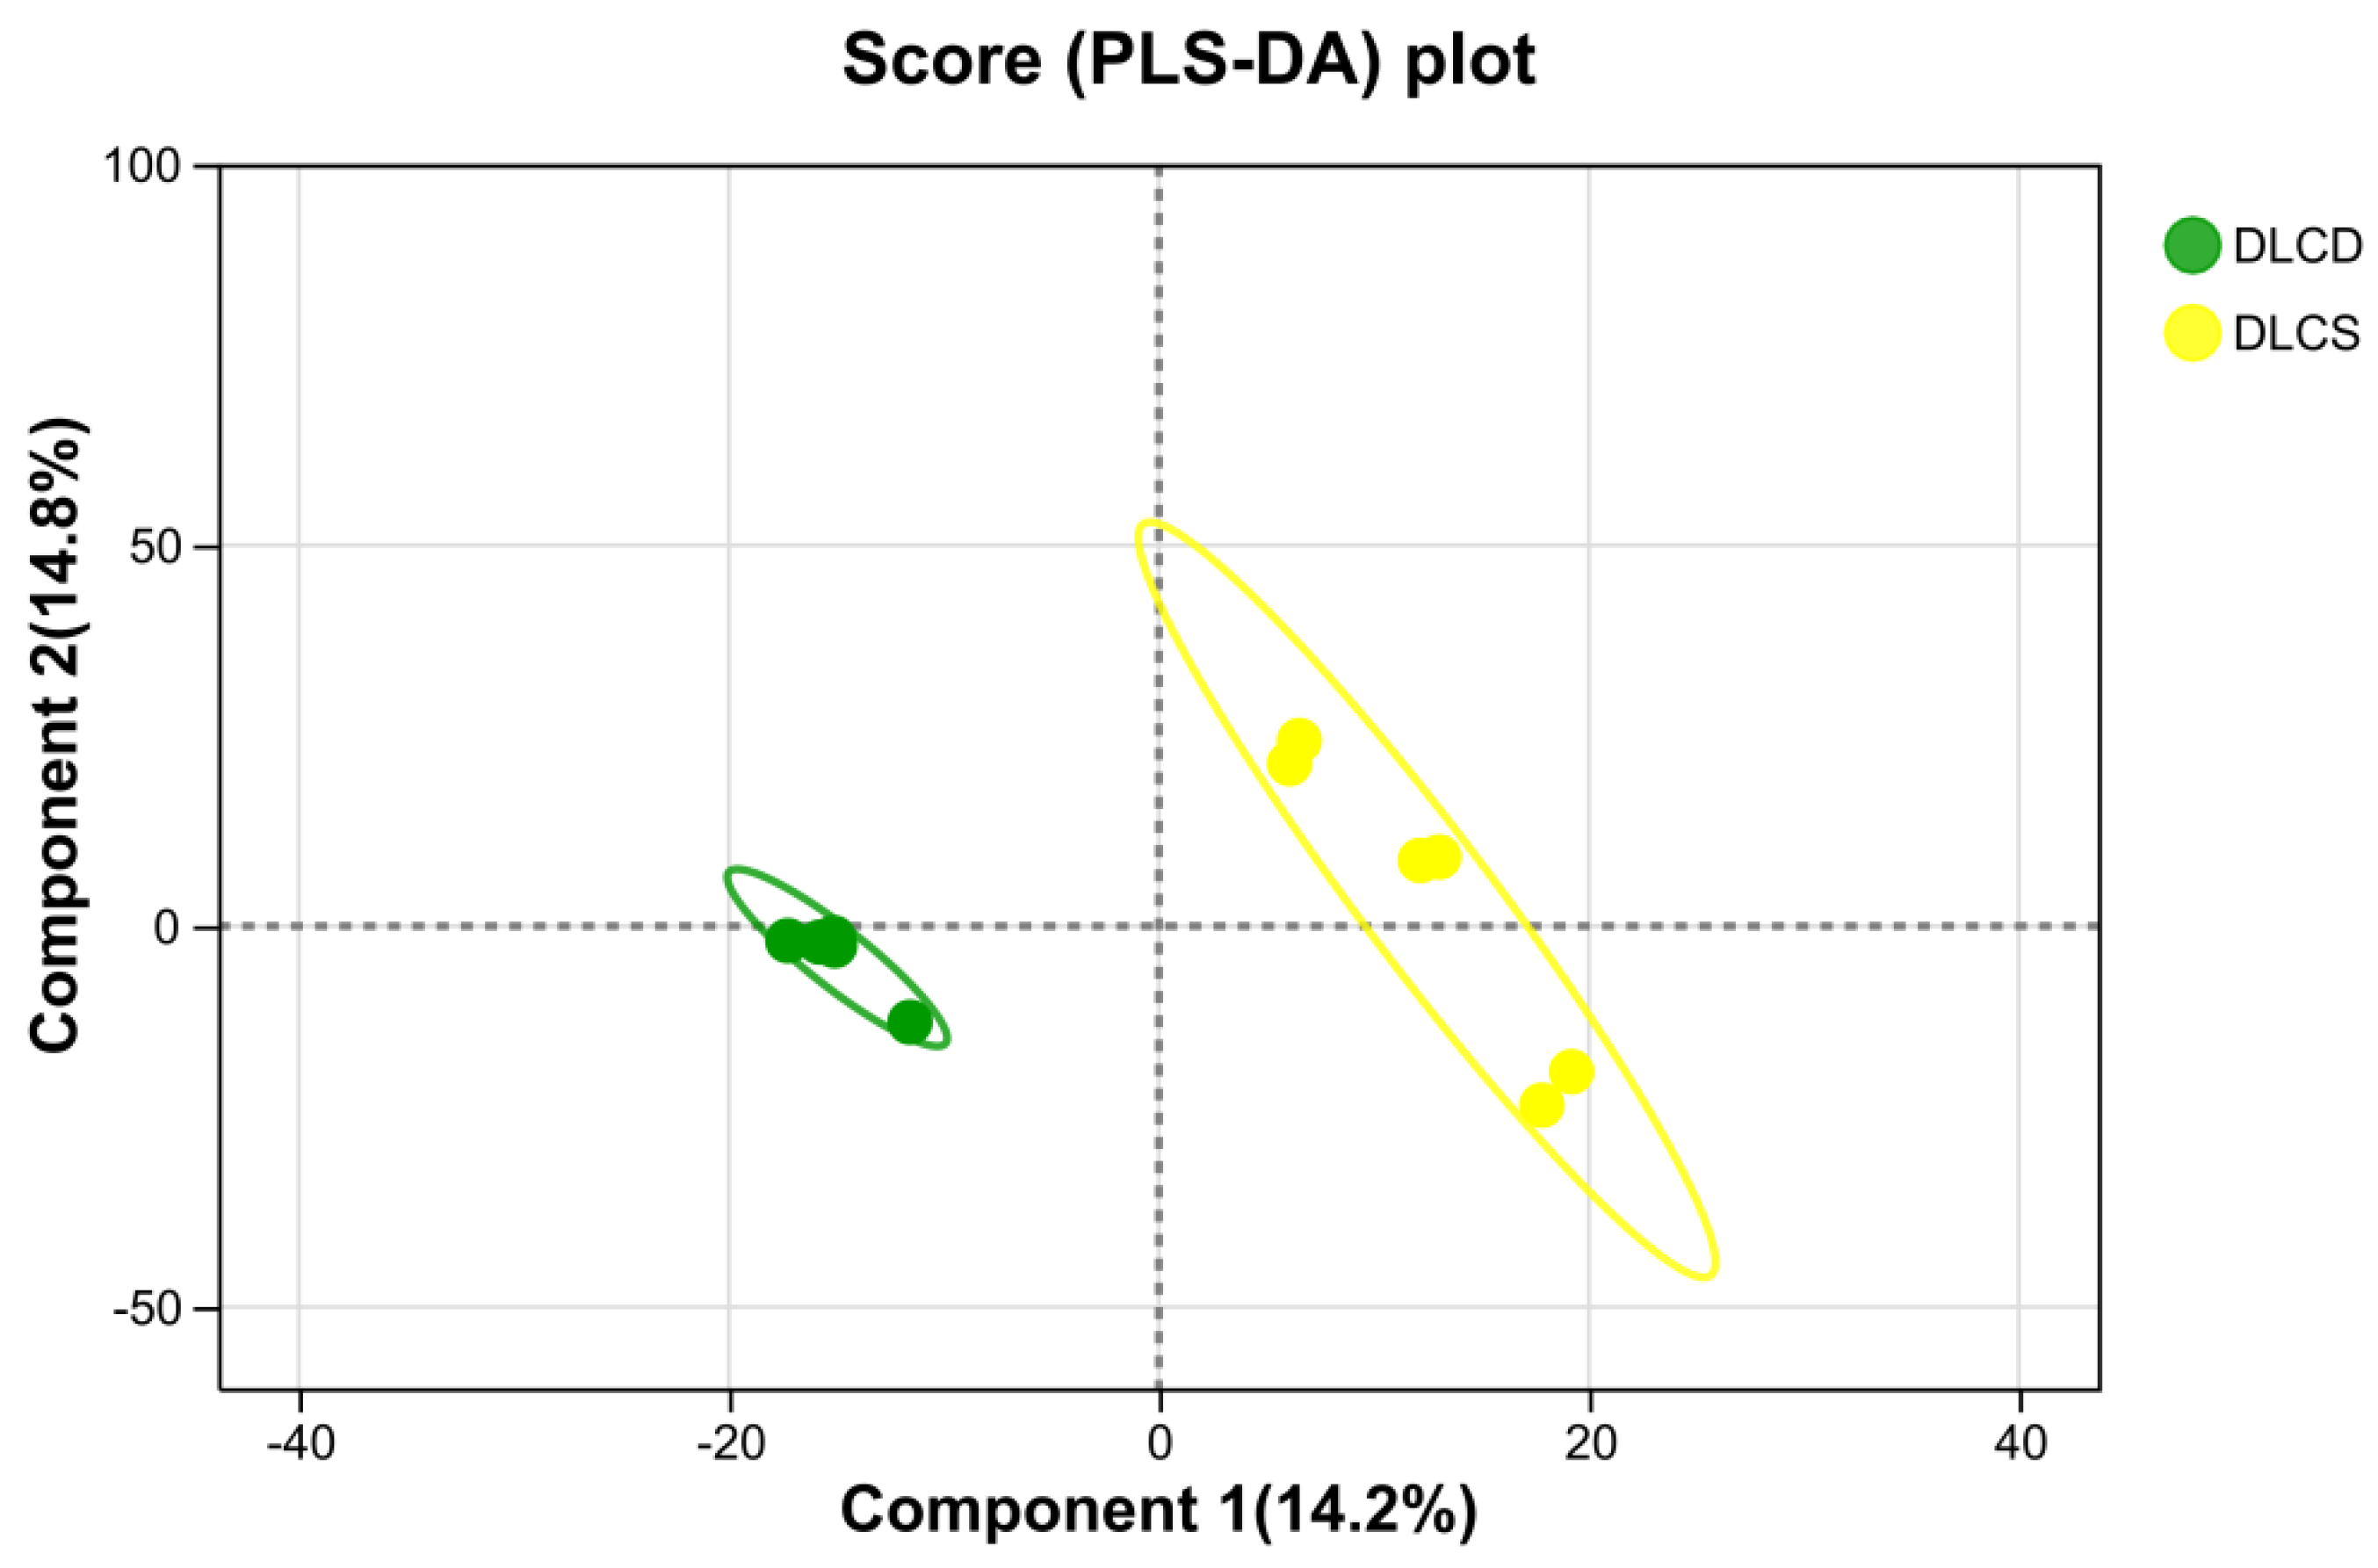
Figure 5.
Volcano diagram of differential metabolites in serum metabolome Note: Label the names of key differential metabolites directly on the volcano plot for intuitive reading.
Figure 5.
Volcano diagram of differential metabolites in serum metabolome Note: Label the names of key differential metabolites directly on the volcano plot for intuitive reading.
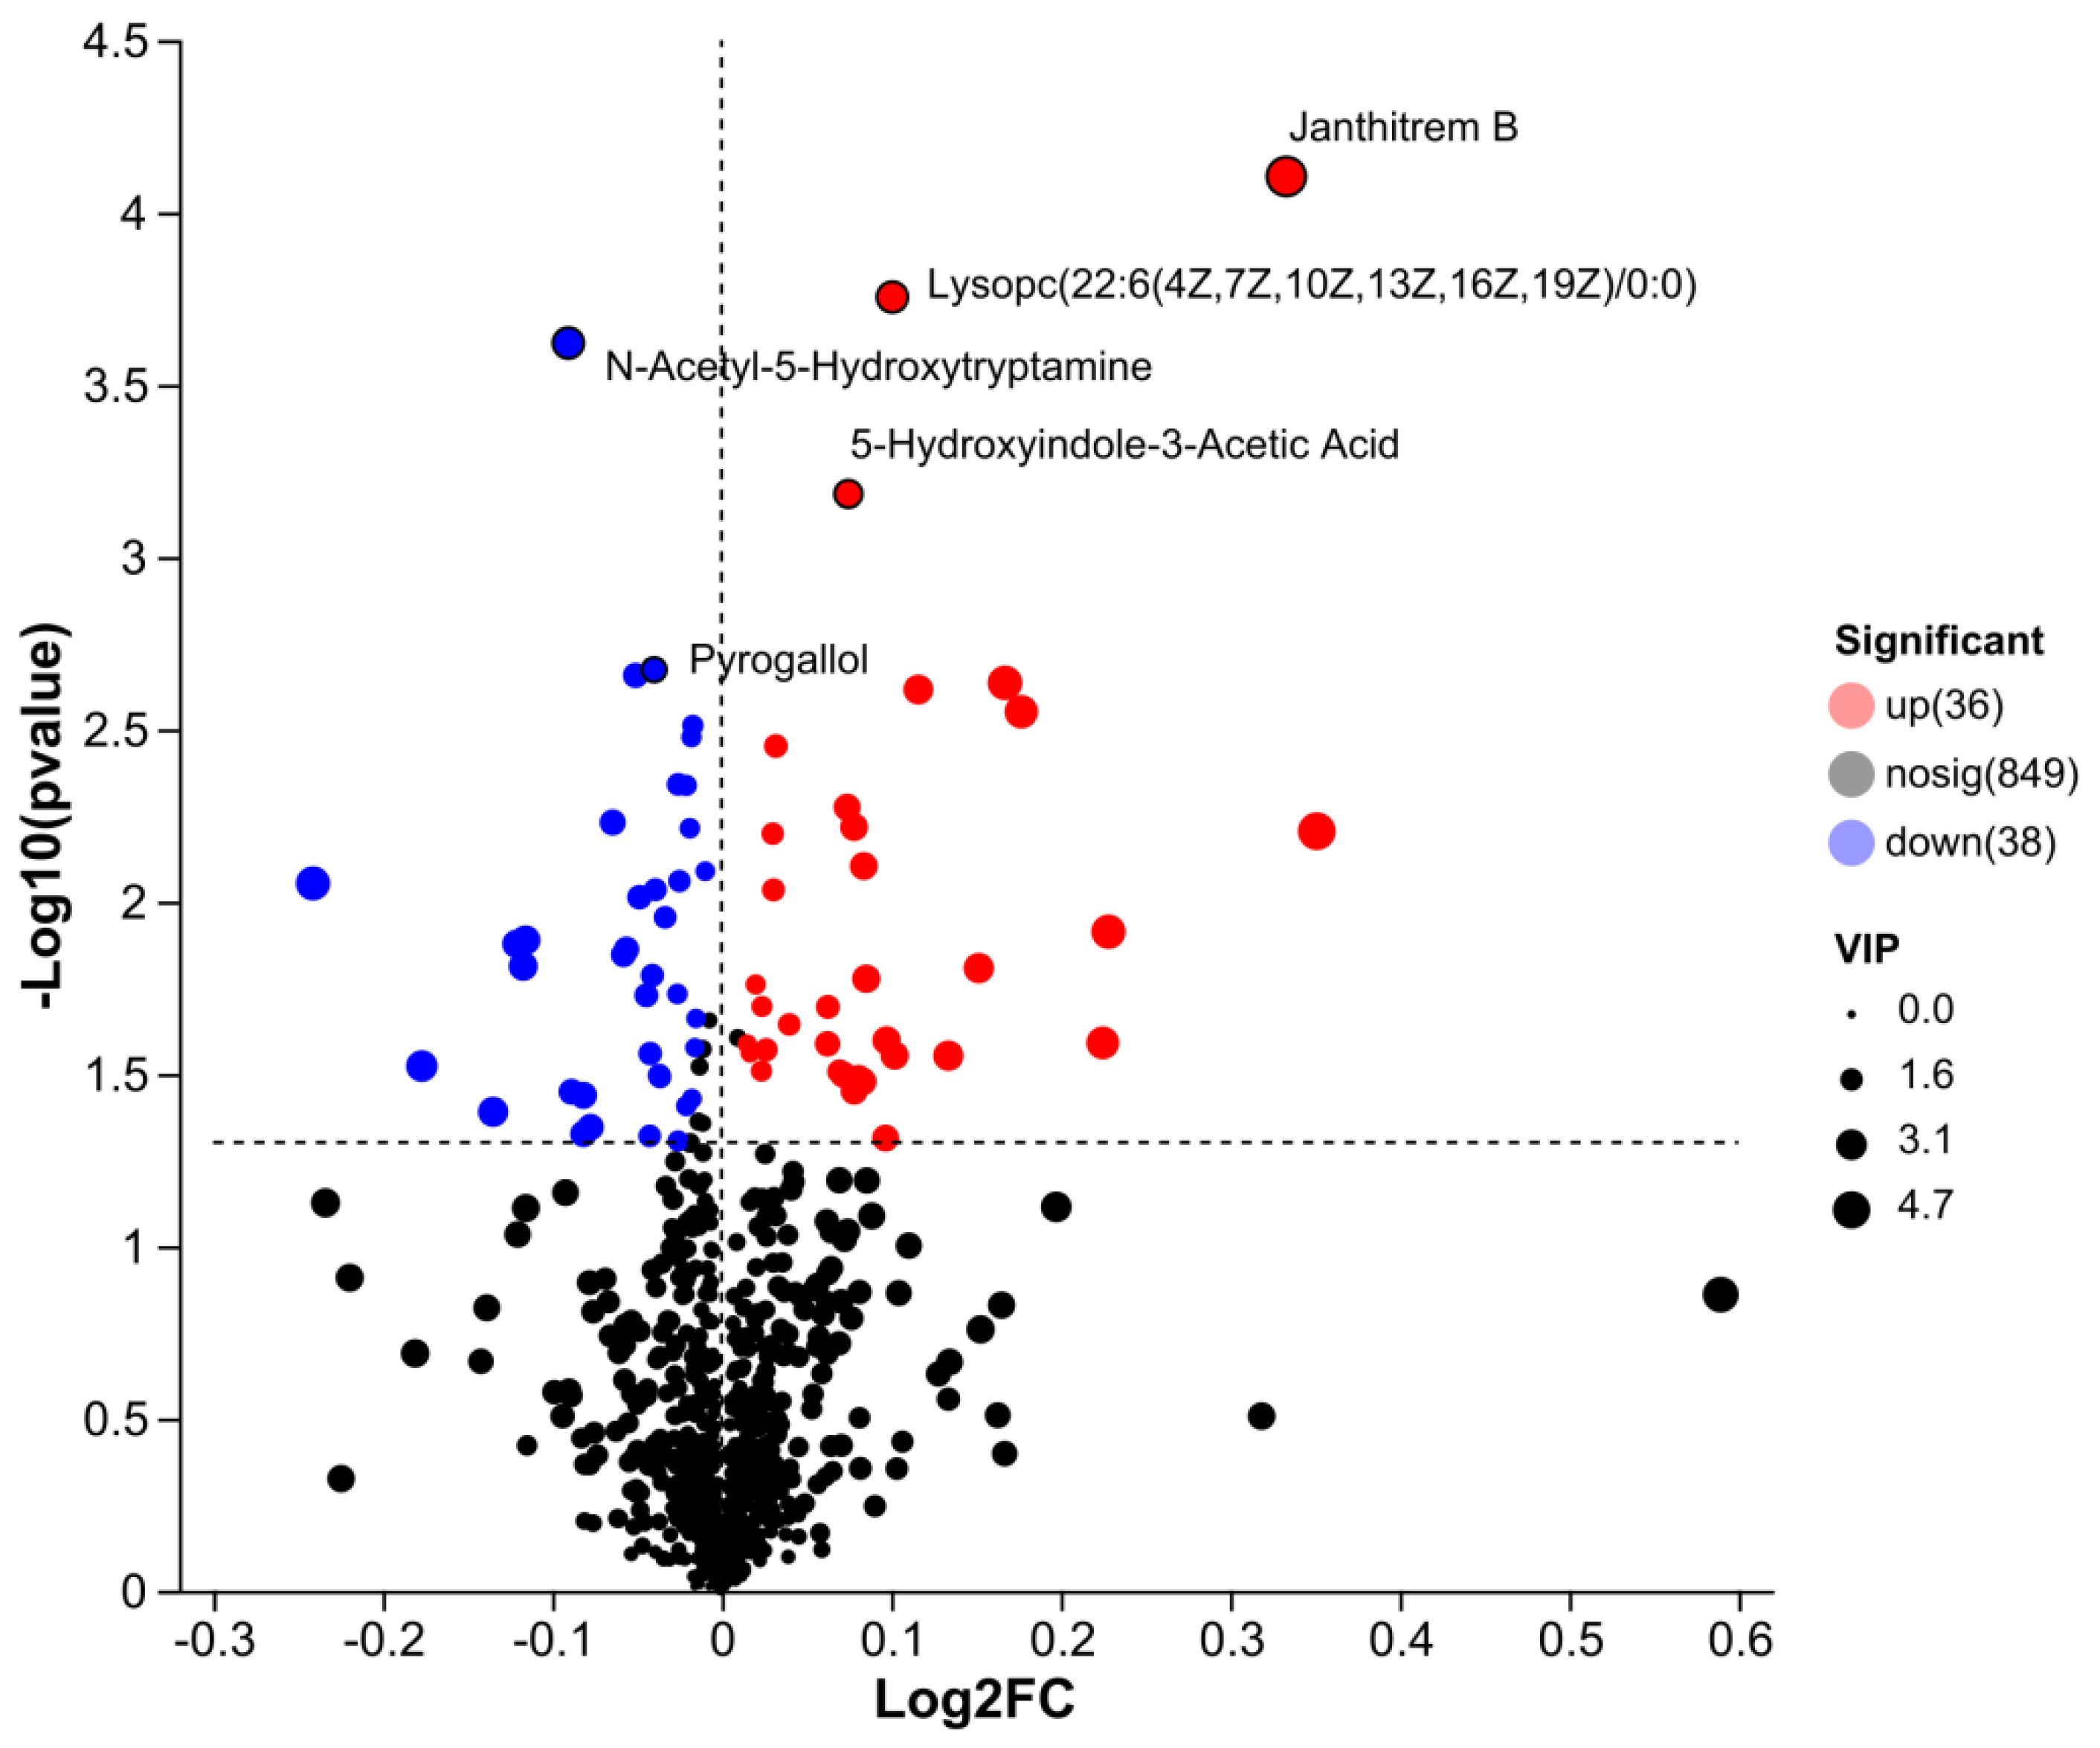
Figure 6.
VIP Value Analysis of Differentially Abundant Metabolites in Serum Metabolomics.
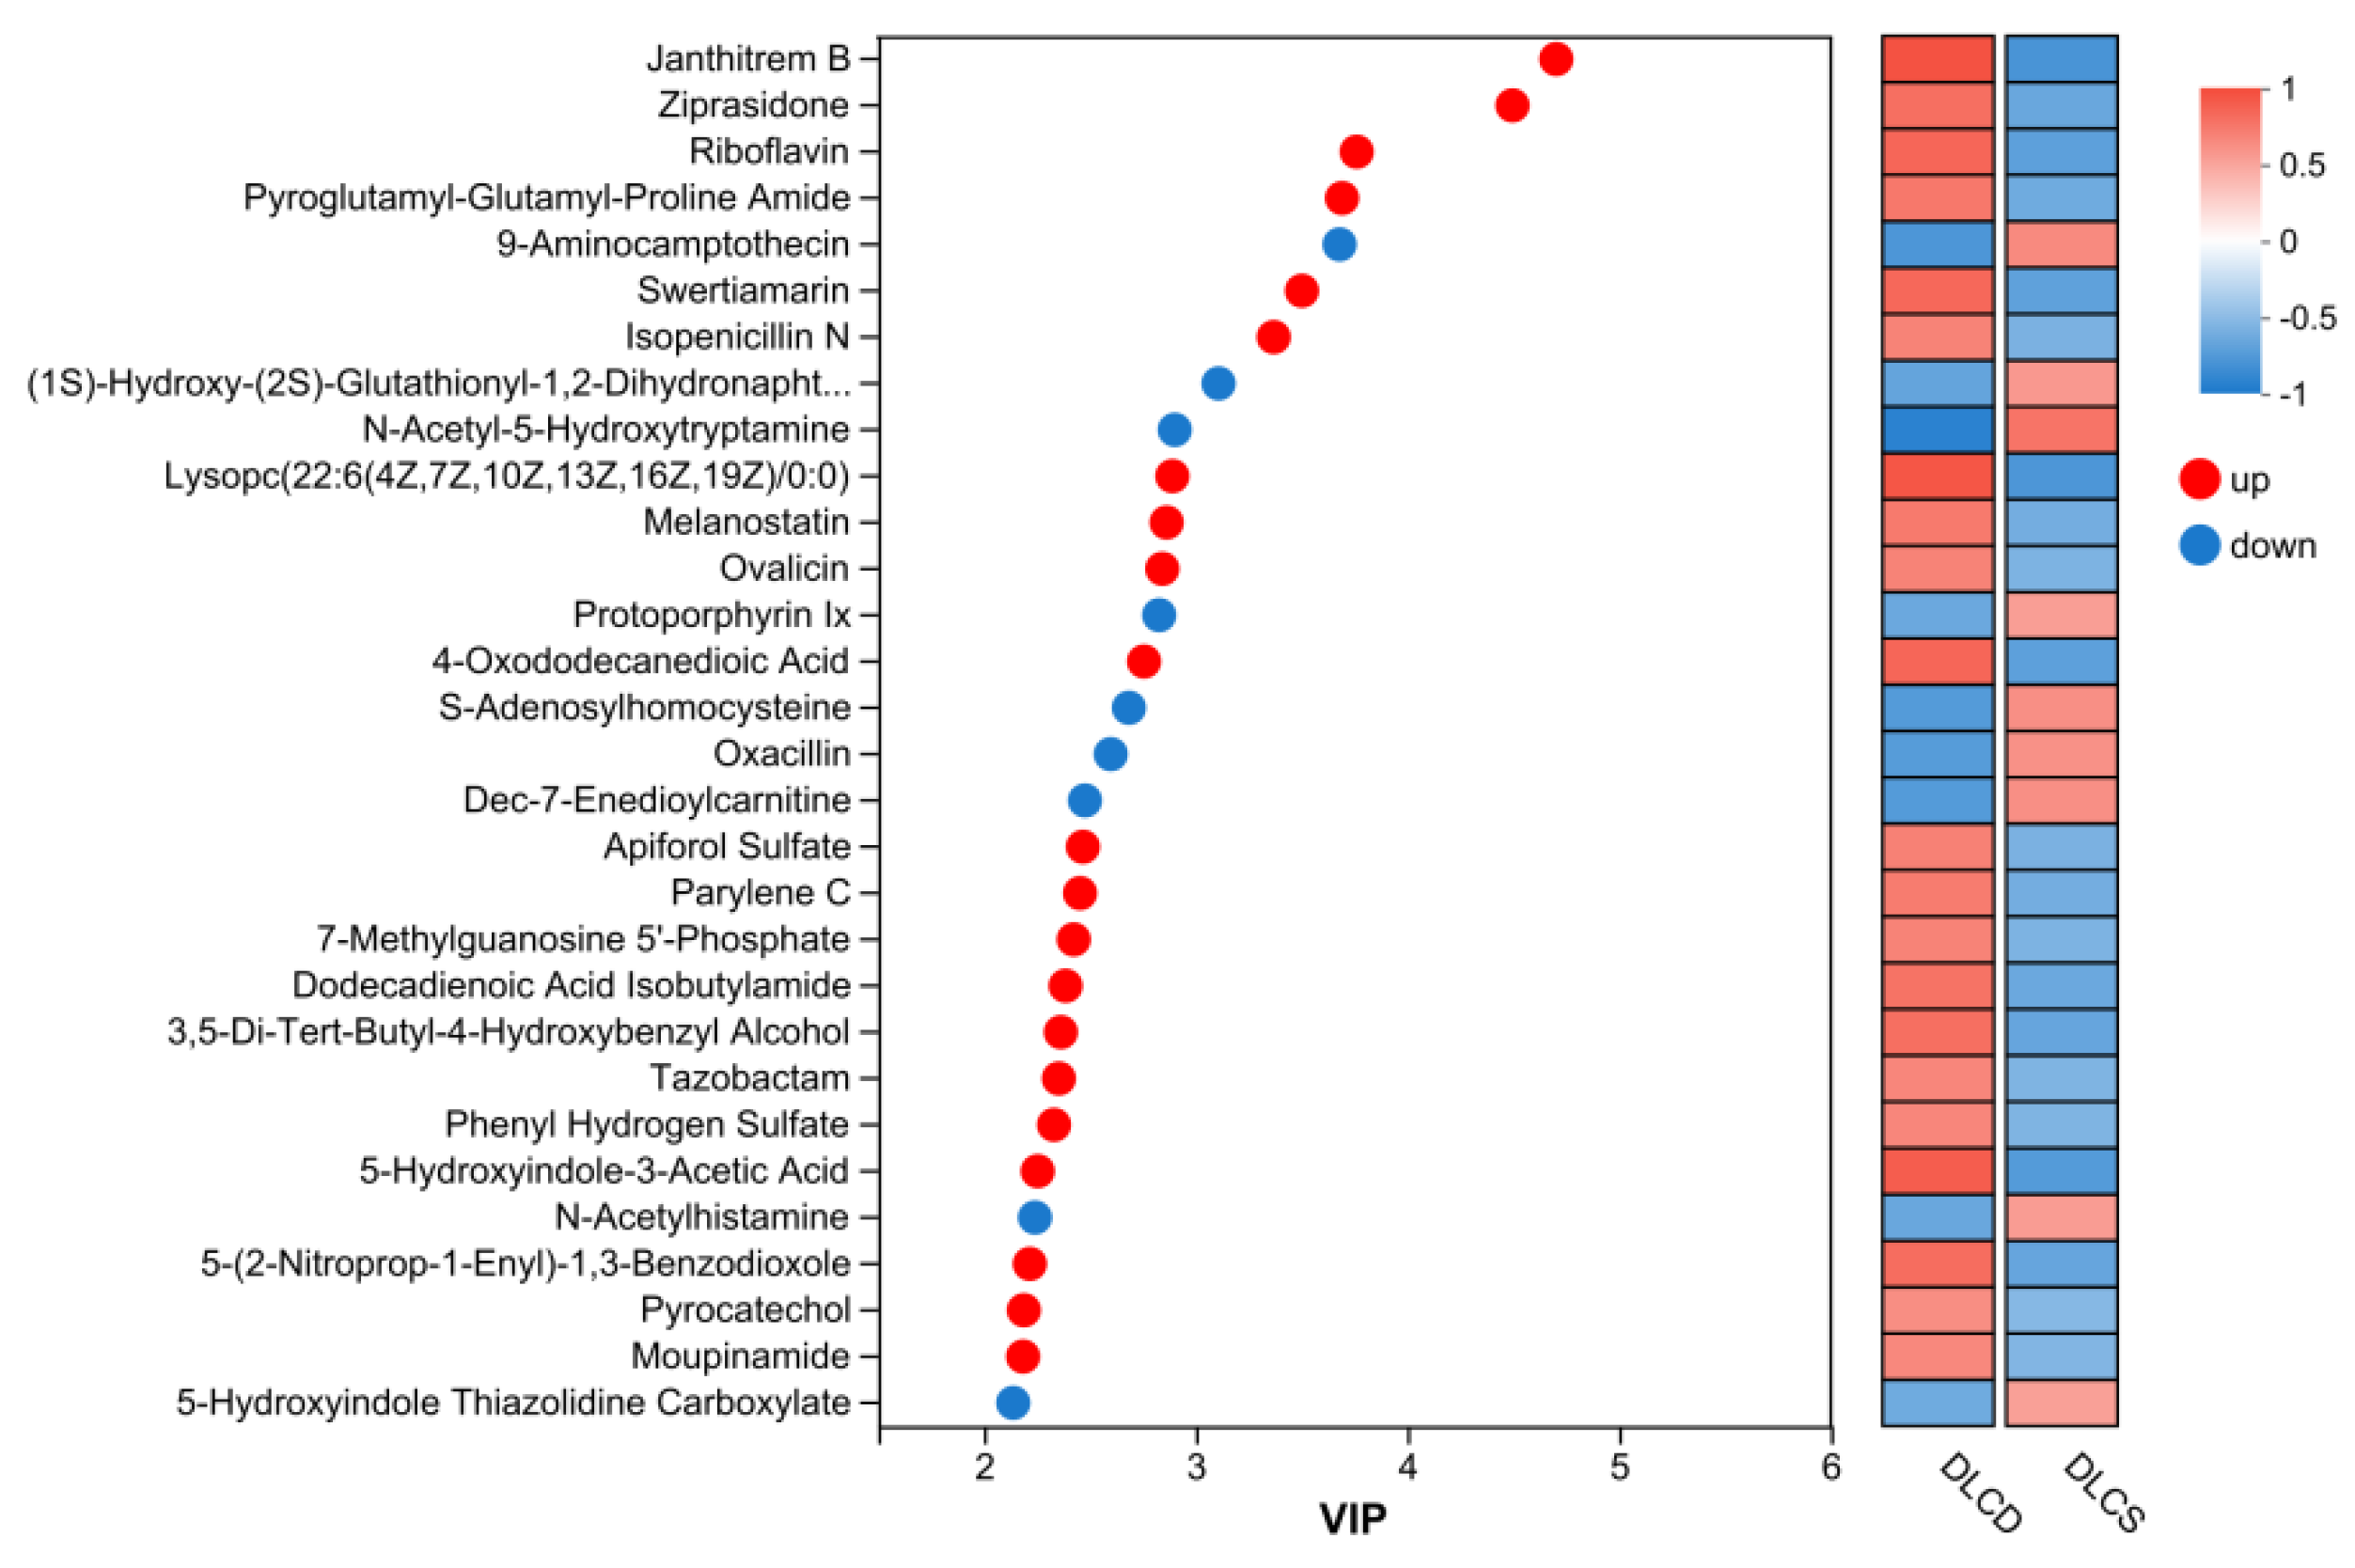
Figure 7.
KEGG Enrichment Analysis of Differentially Abundant Metabolites in Serum Metabolomics.
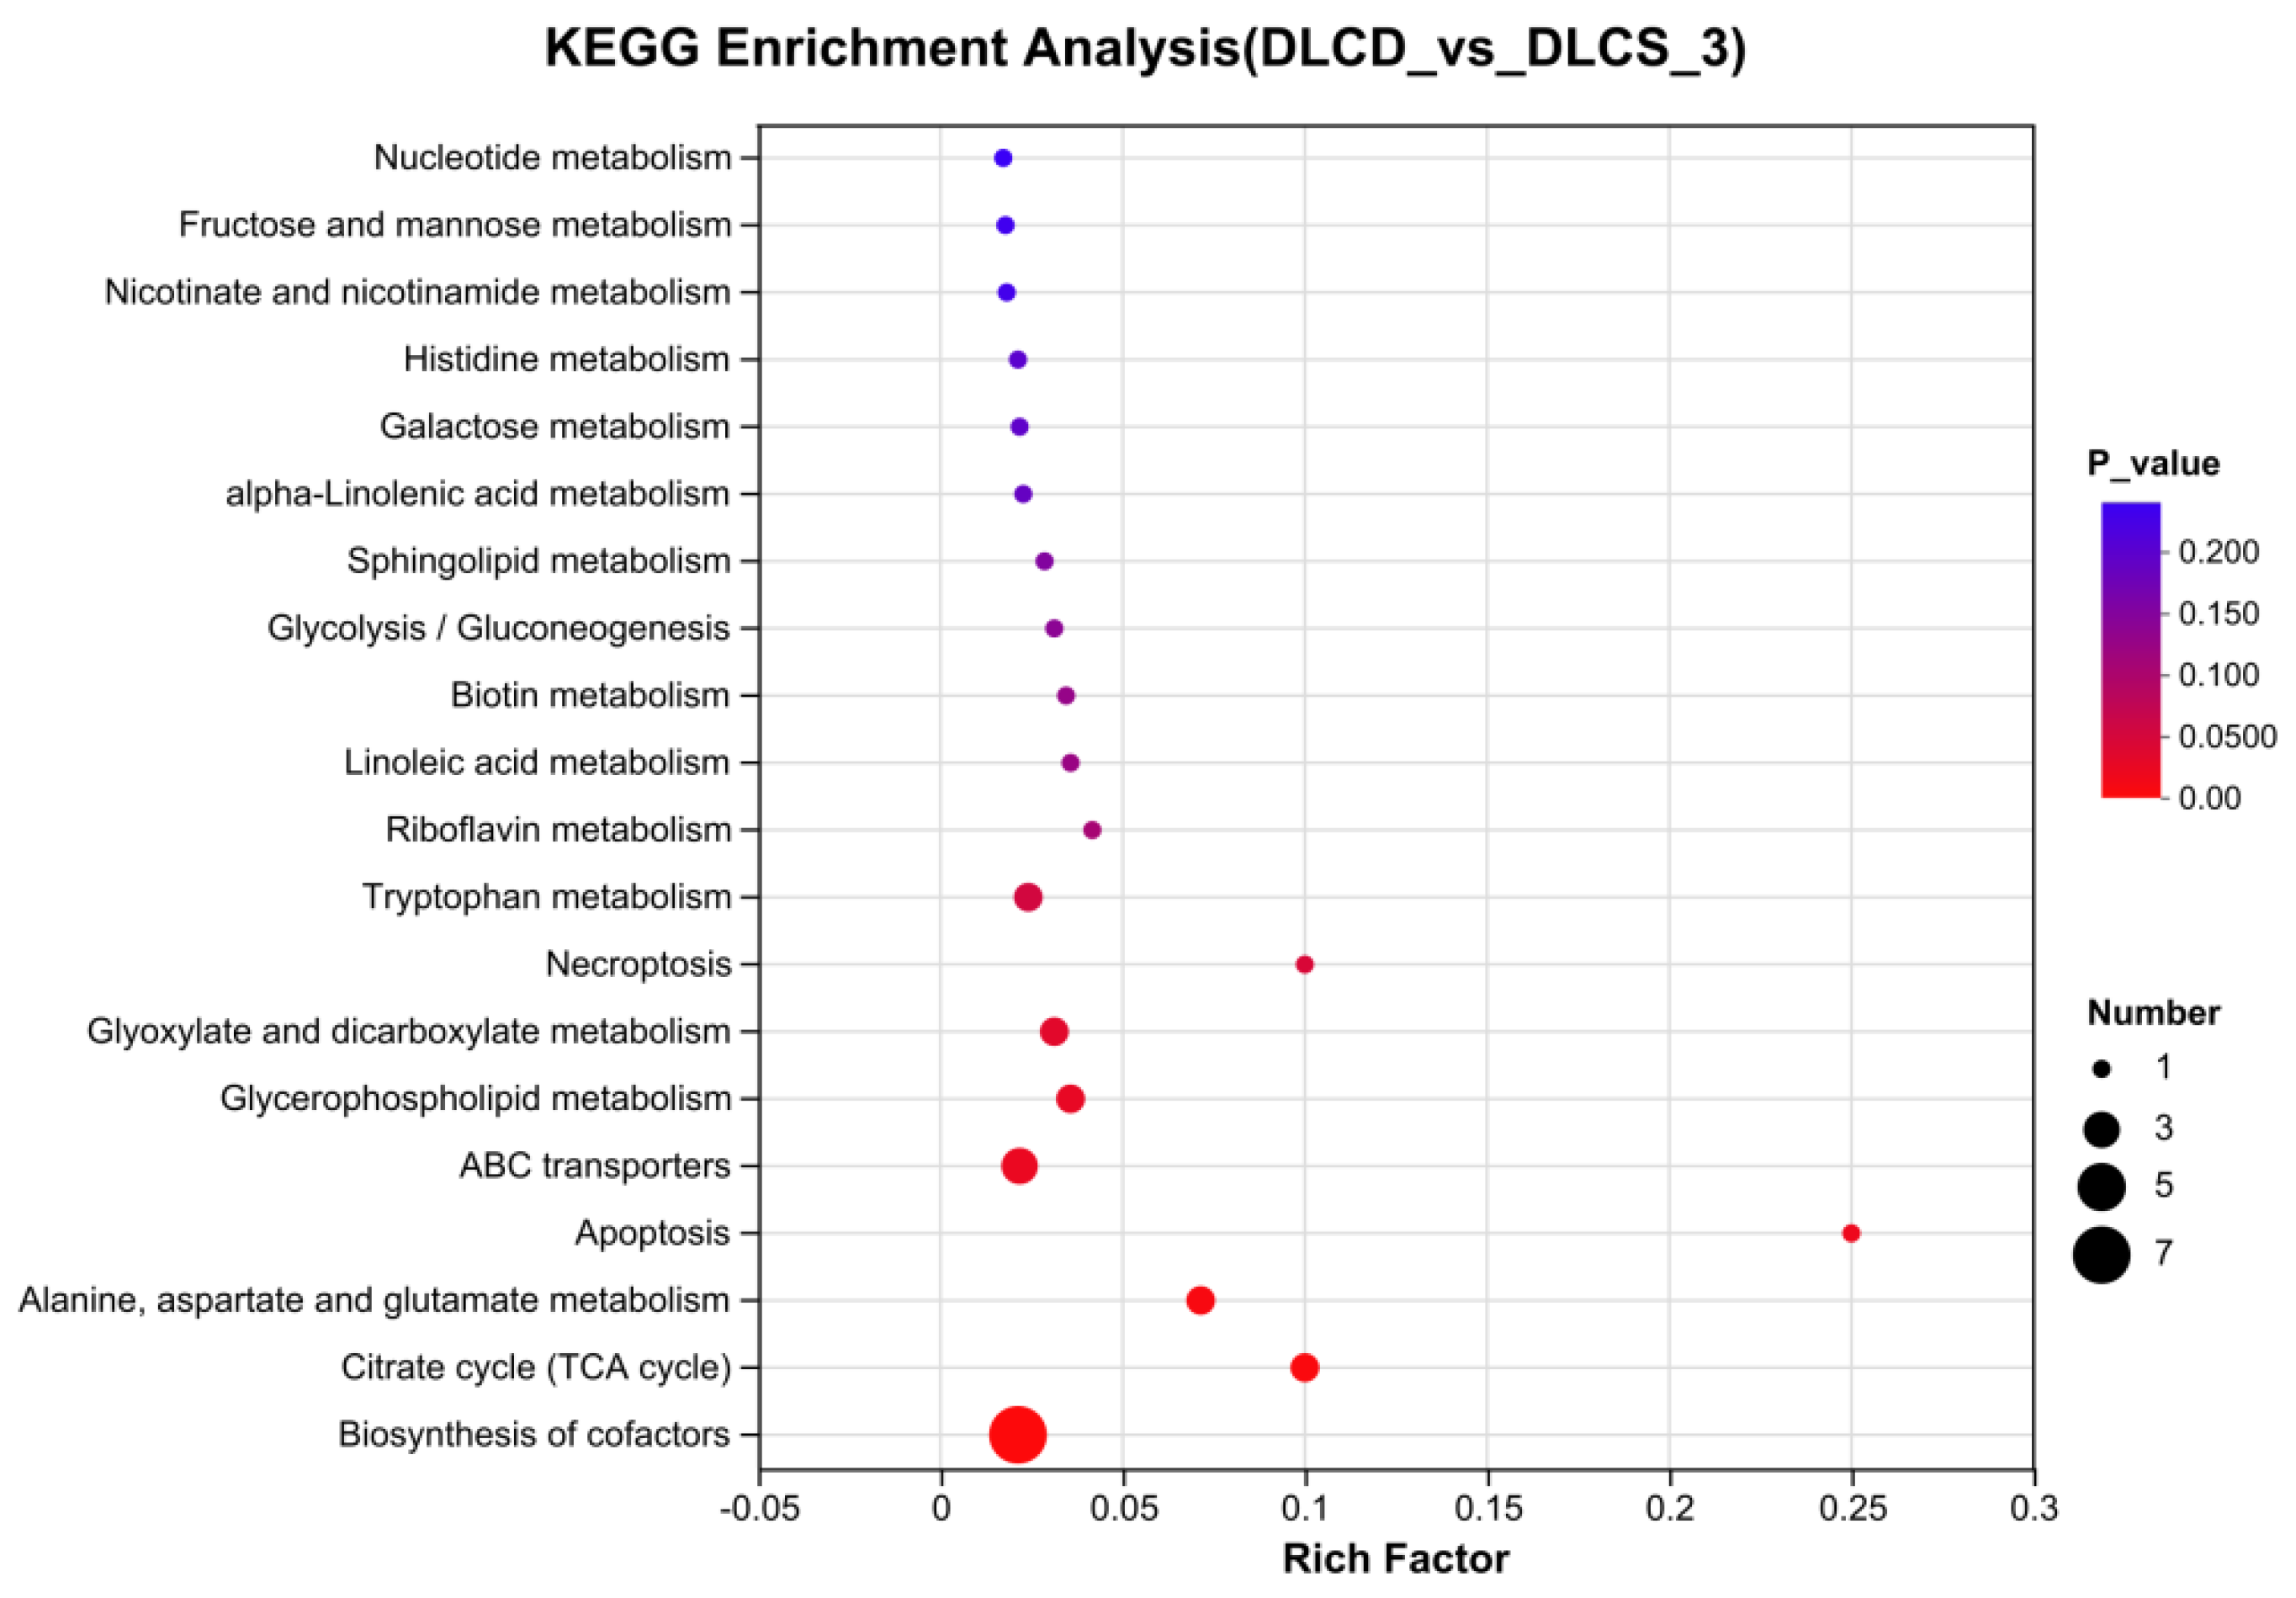
Figure 8.
Results of Ovarian Transcriptome Differential Expression Analysis. Note: Label the names of key differential genes directly on the volcano plot for intuitive reading.
Figure 8.
Results of Ovarian Transcriptome Differential Expression Analysis. Note: Label the names of key differential genes directly on the volcano plot for intuitive reading.
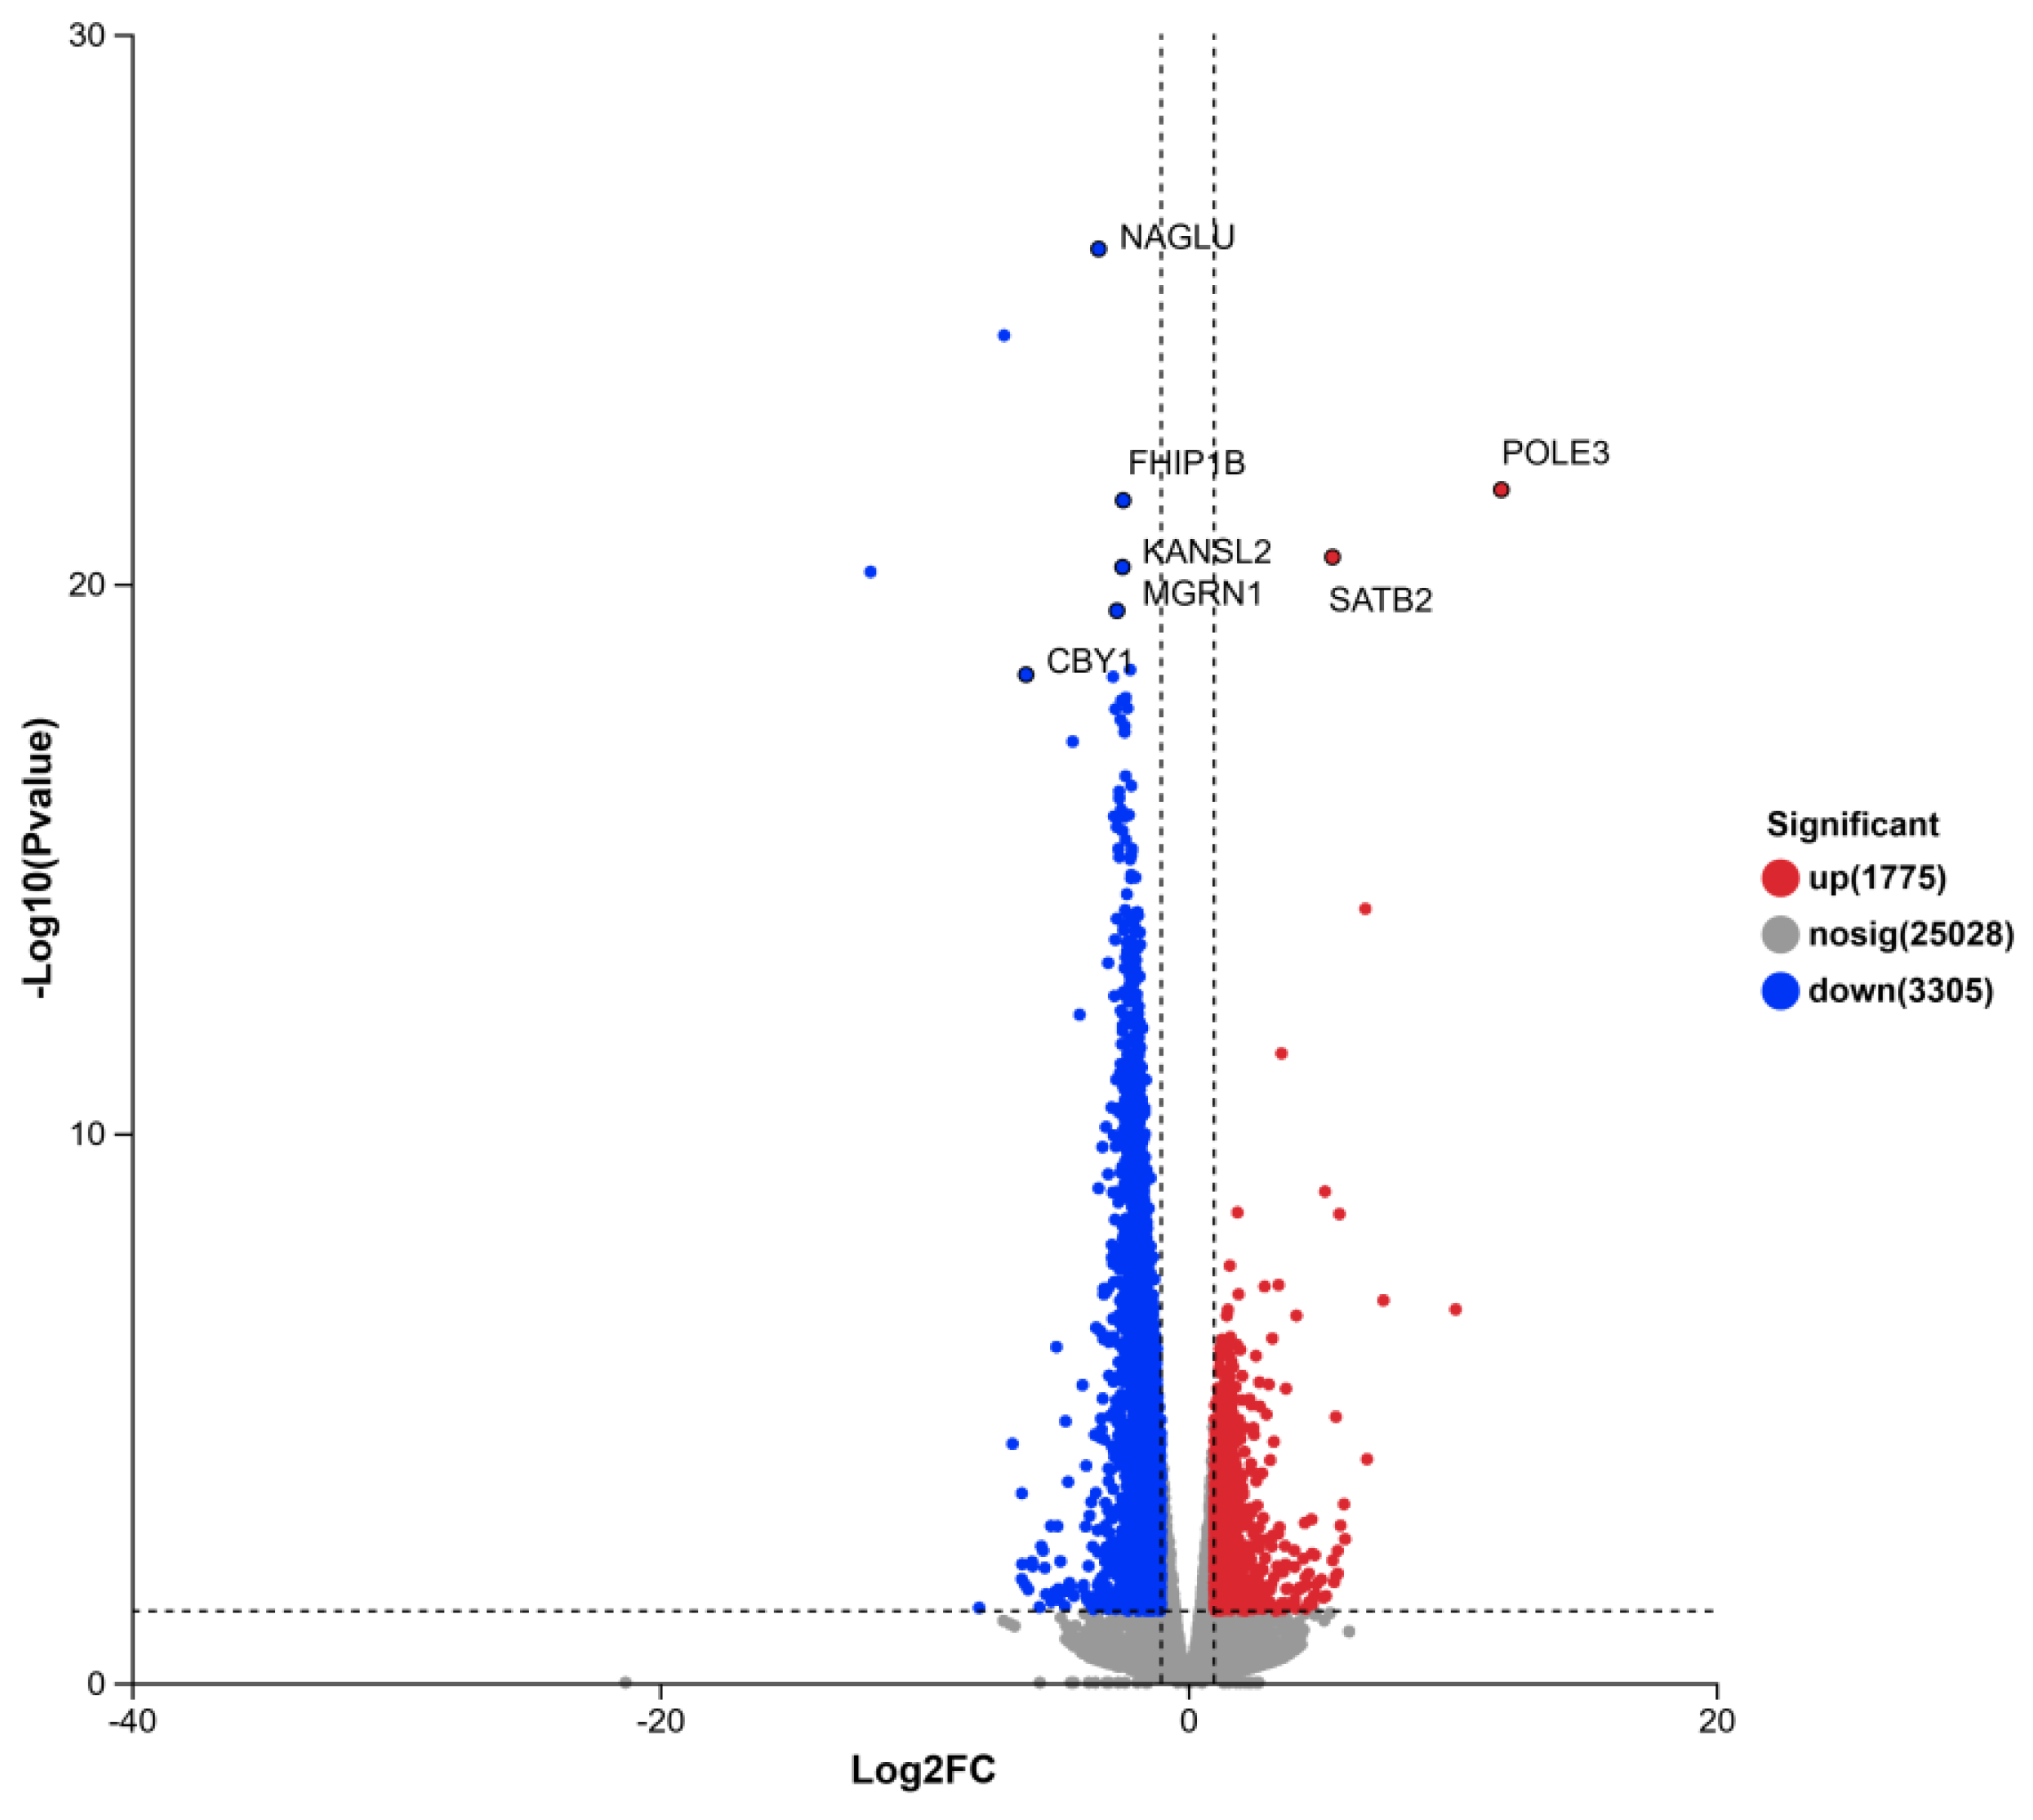
Figure 9.
GO Enrichment Analysis Results of Transcriptome Differential Expressed Genes.
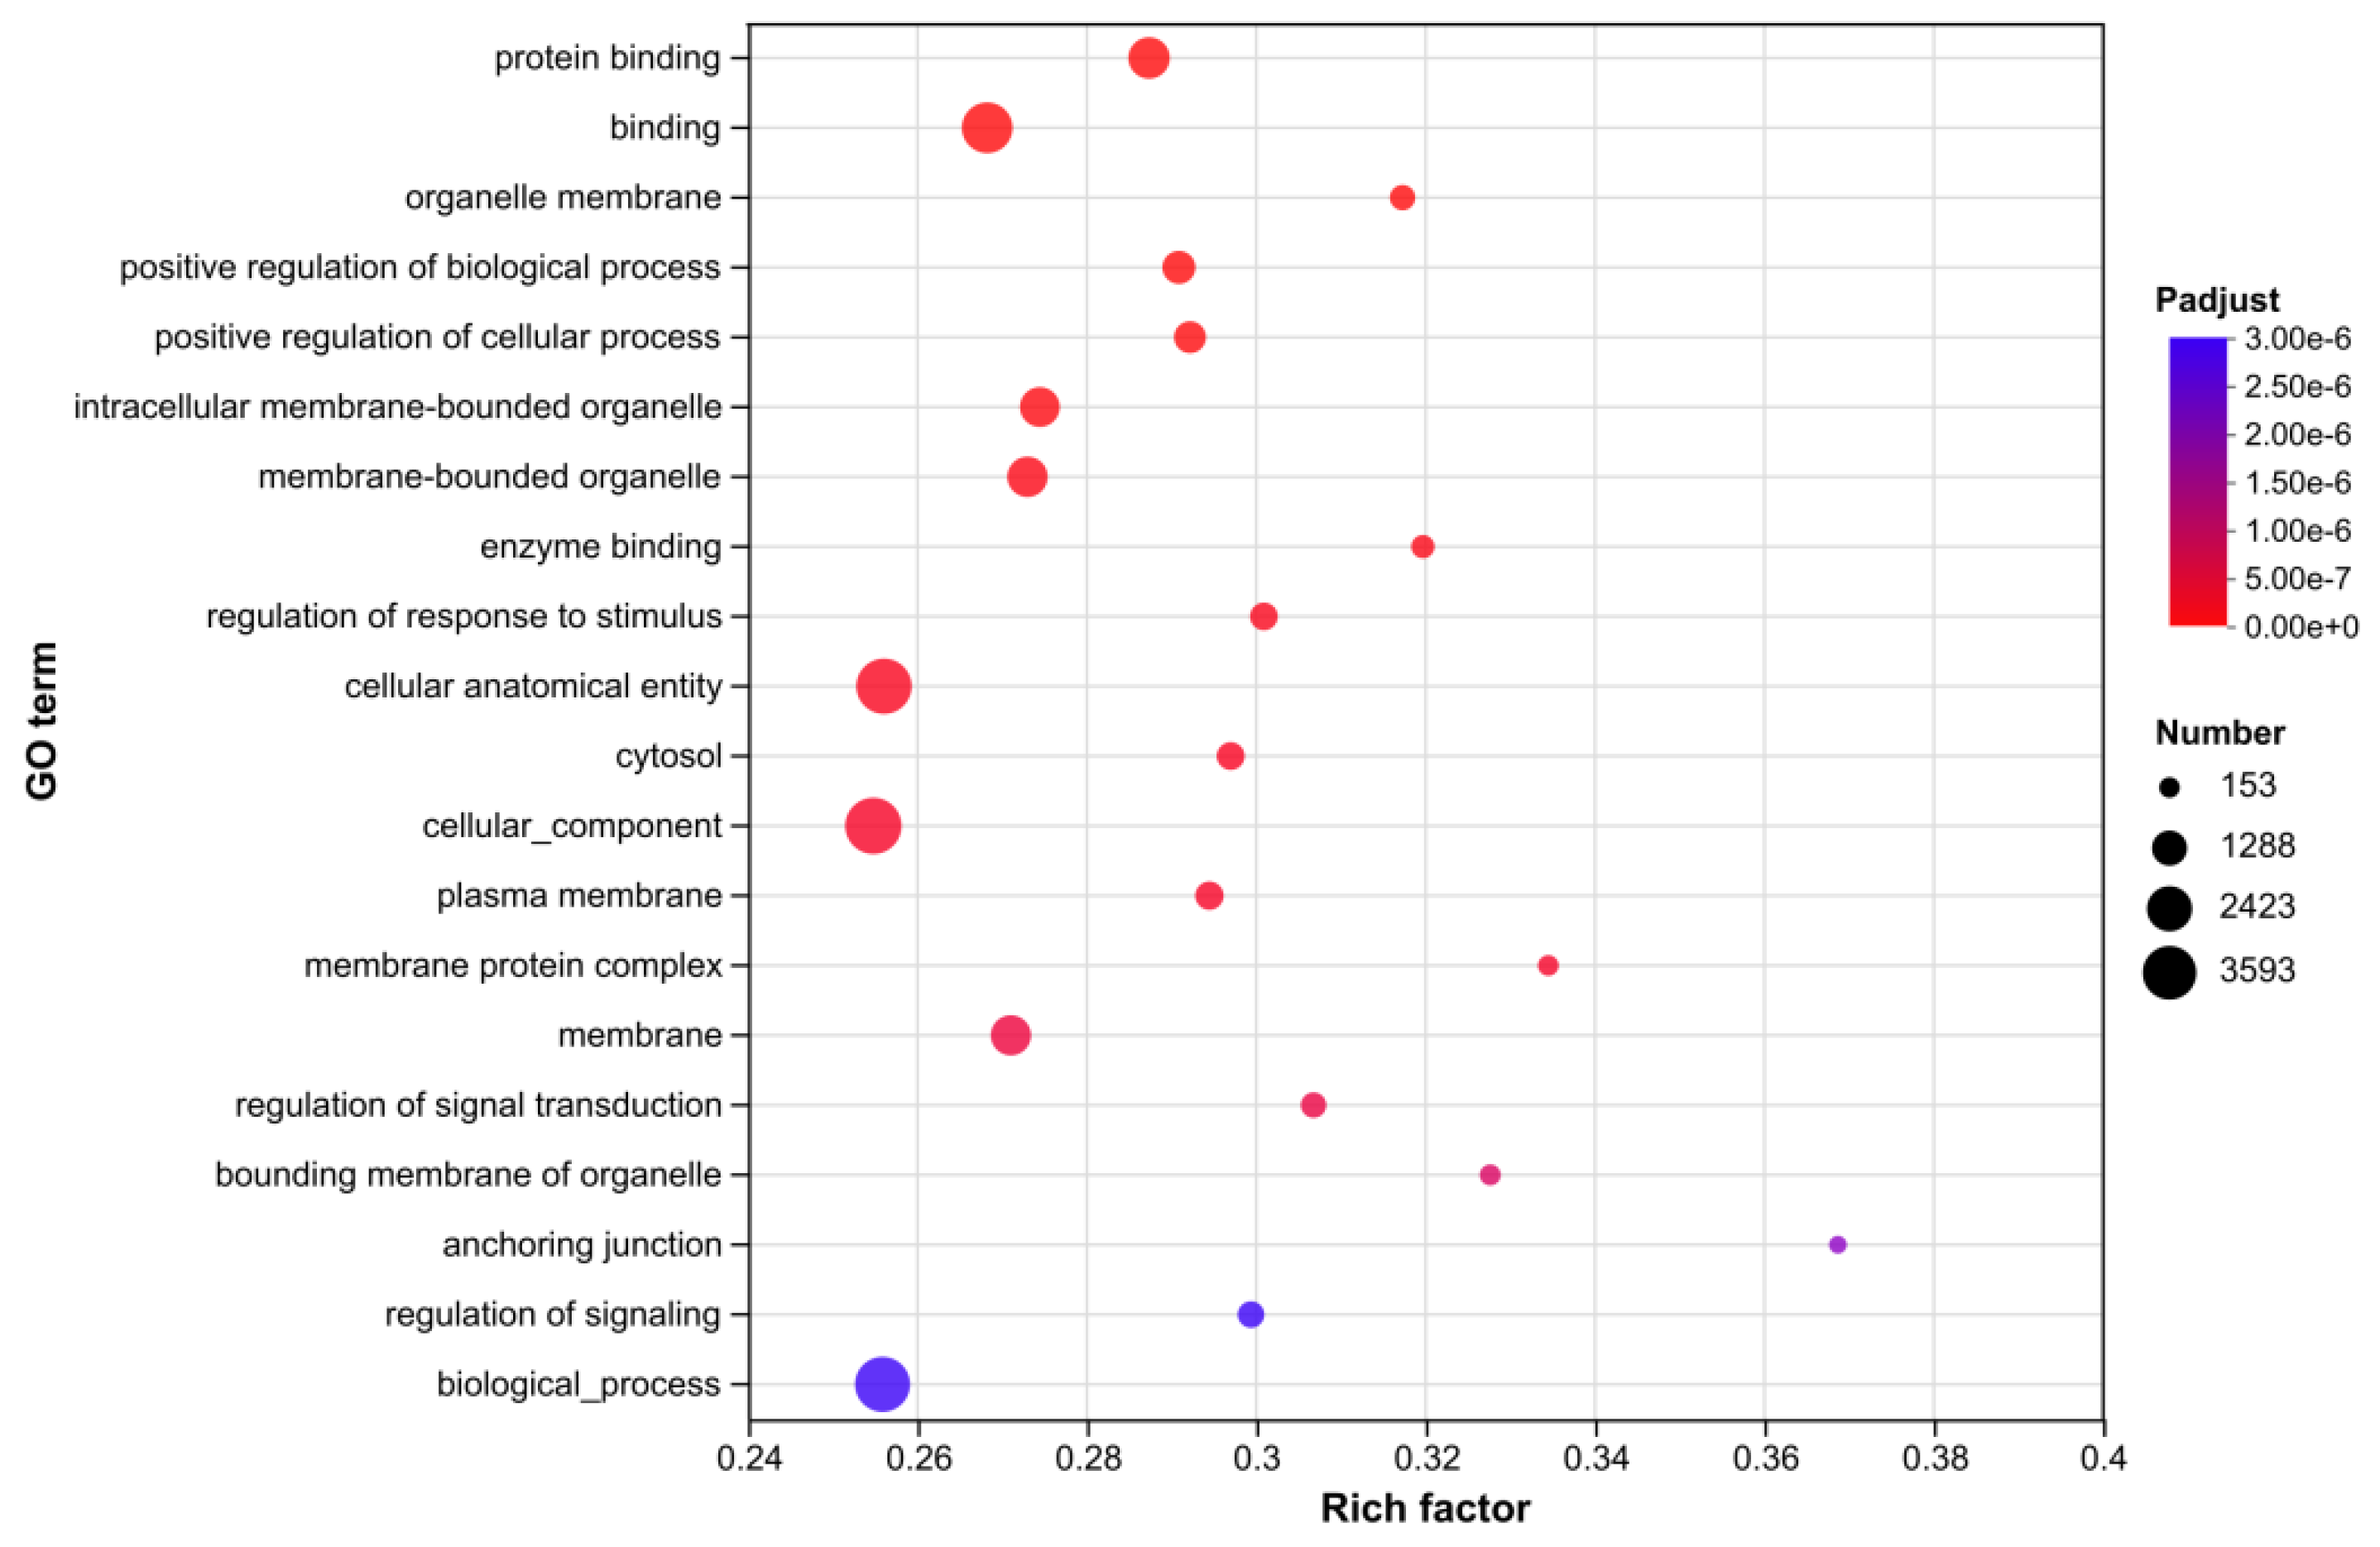
Figure 10.
KEGG Enrichment analysis Results of of Ovarian Transcriptome Differentially Expressed Genes.
Figure 10.
KEGG Enrichment analysis Results of of Ovarian Transcriptome Differentially Expressed Genes.
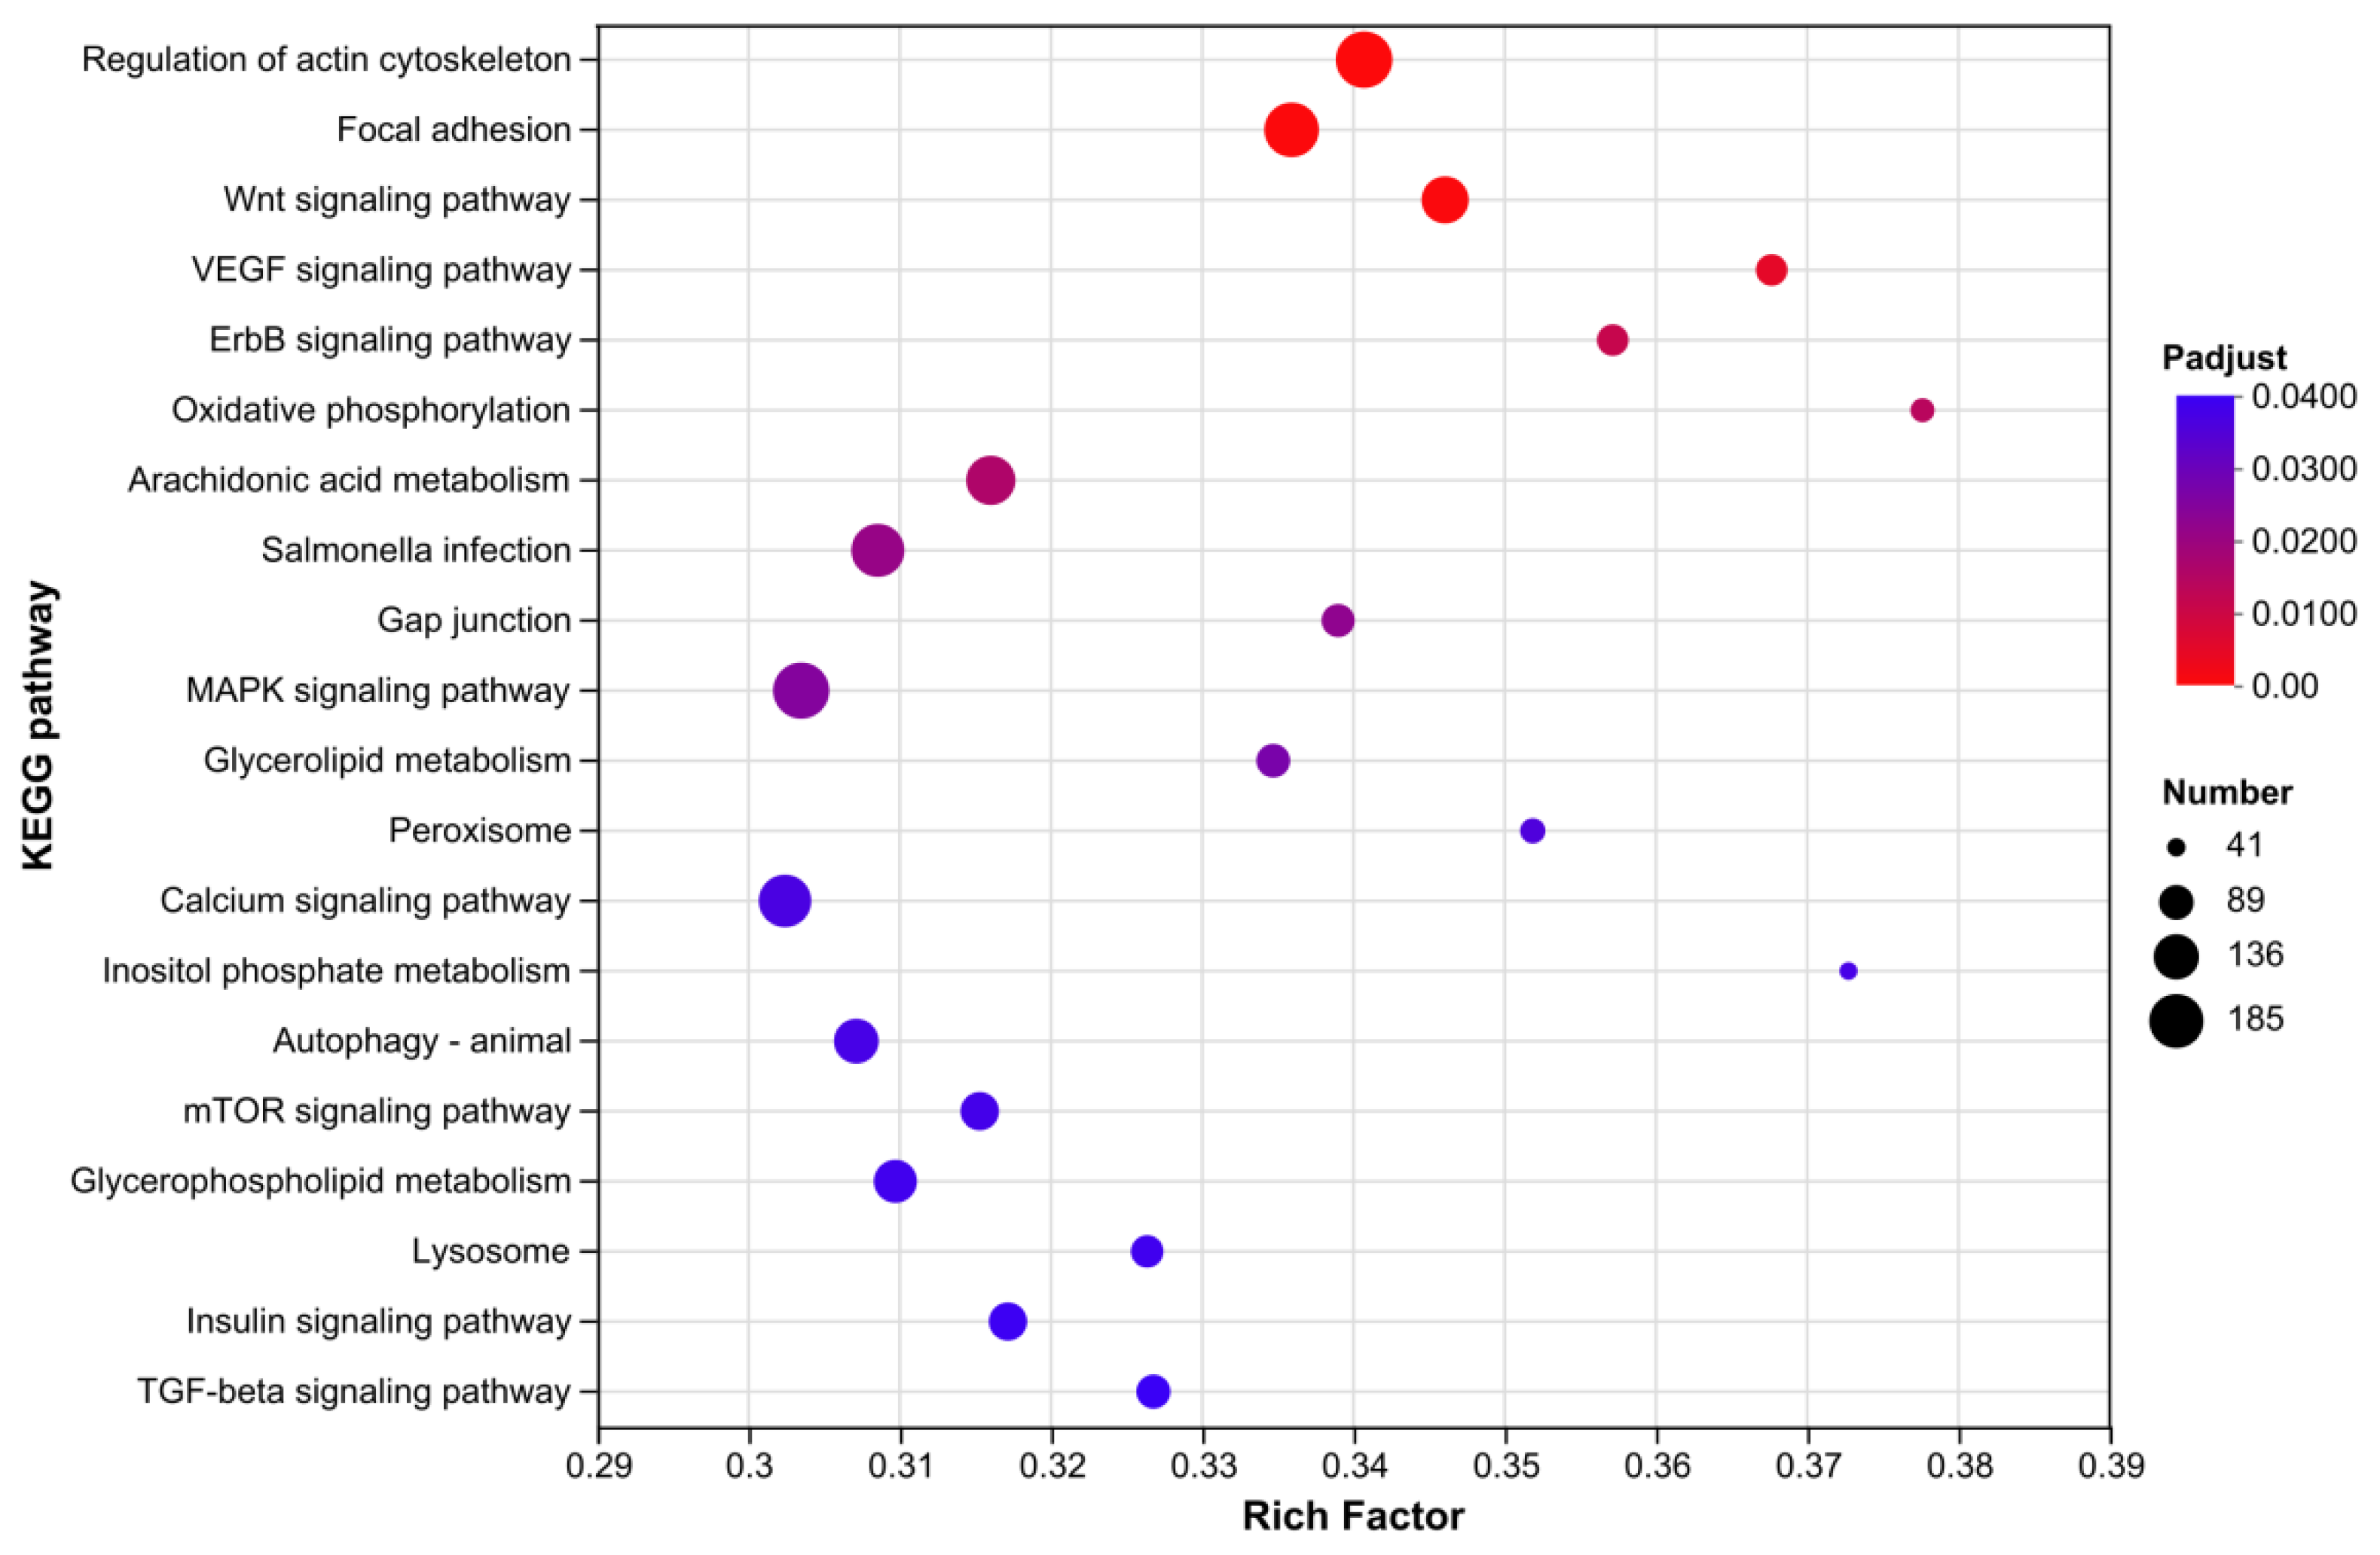
Figure 11.
Differential Expression Analysis Results of Ovarian Proteome.
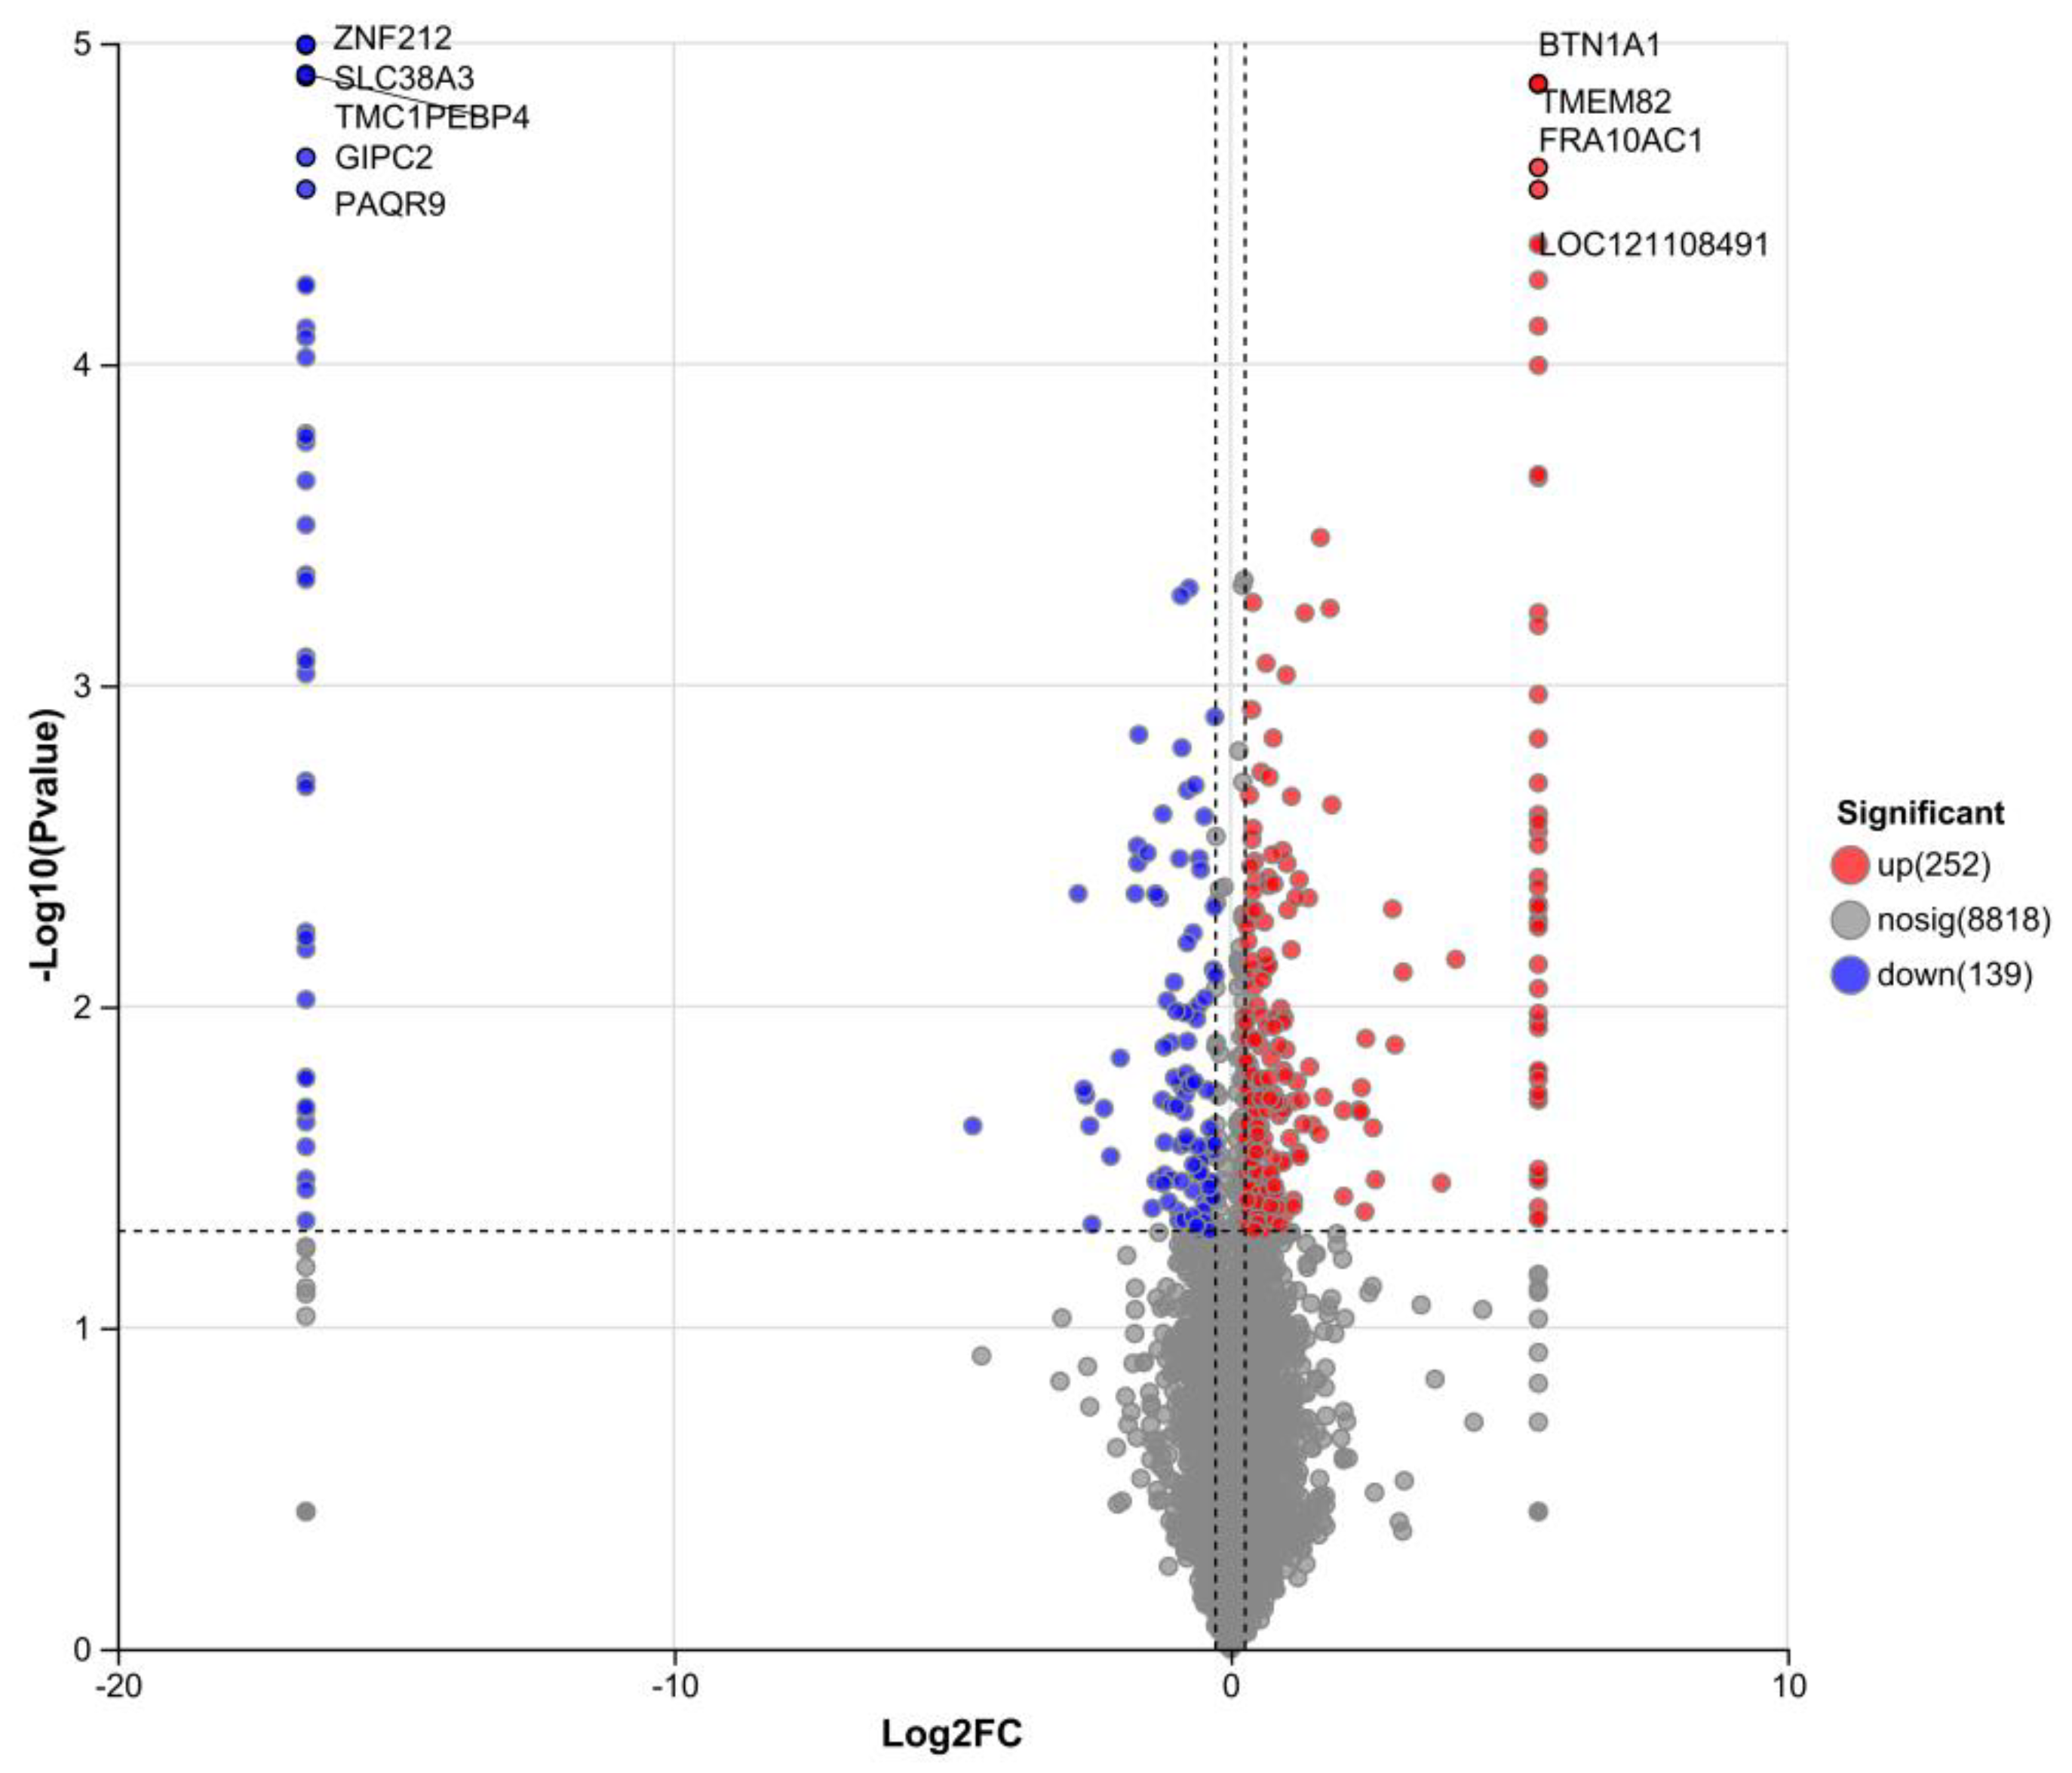
Figure 12.
GO Enrichment Analysis Results of Differentially Expressed Proteins in Ovarian Proteome.
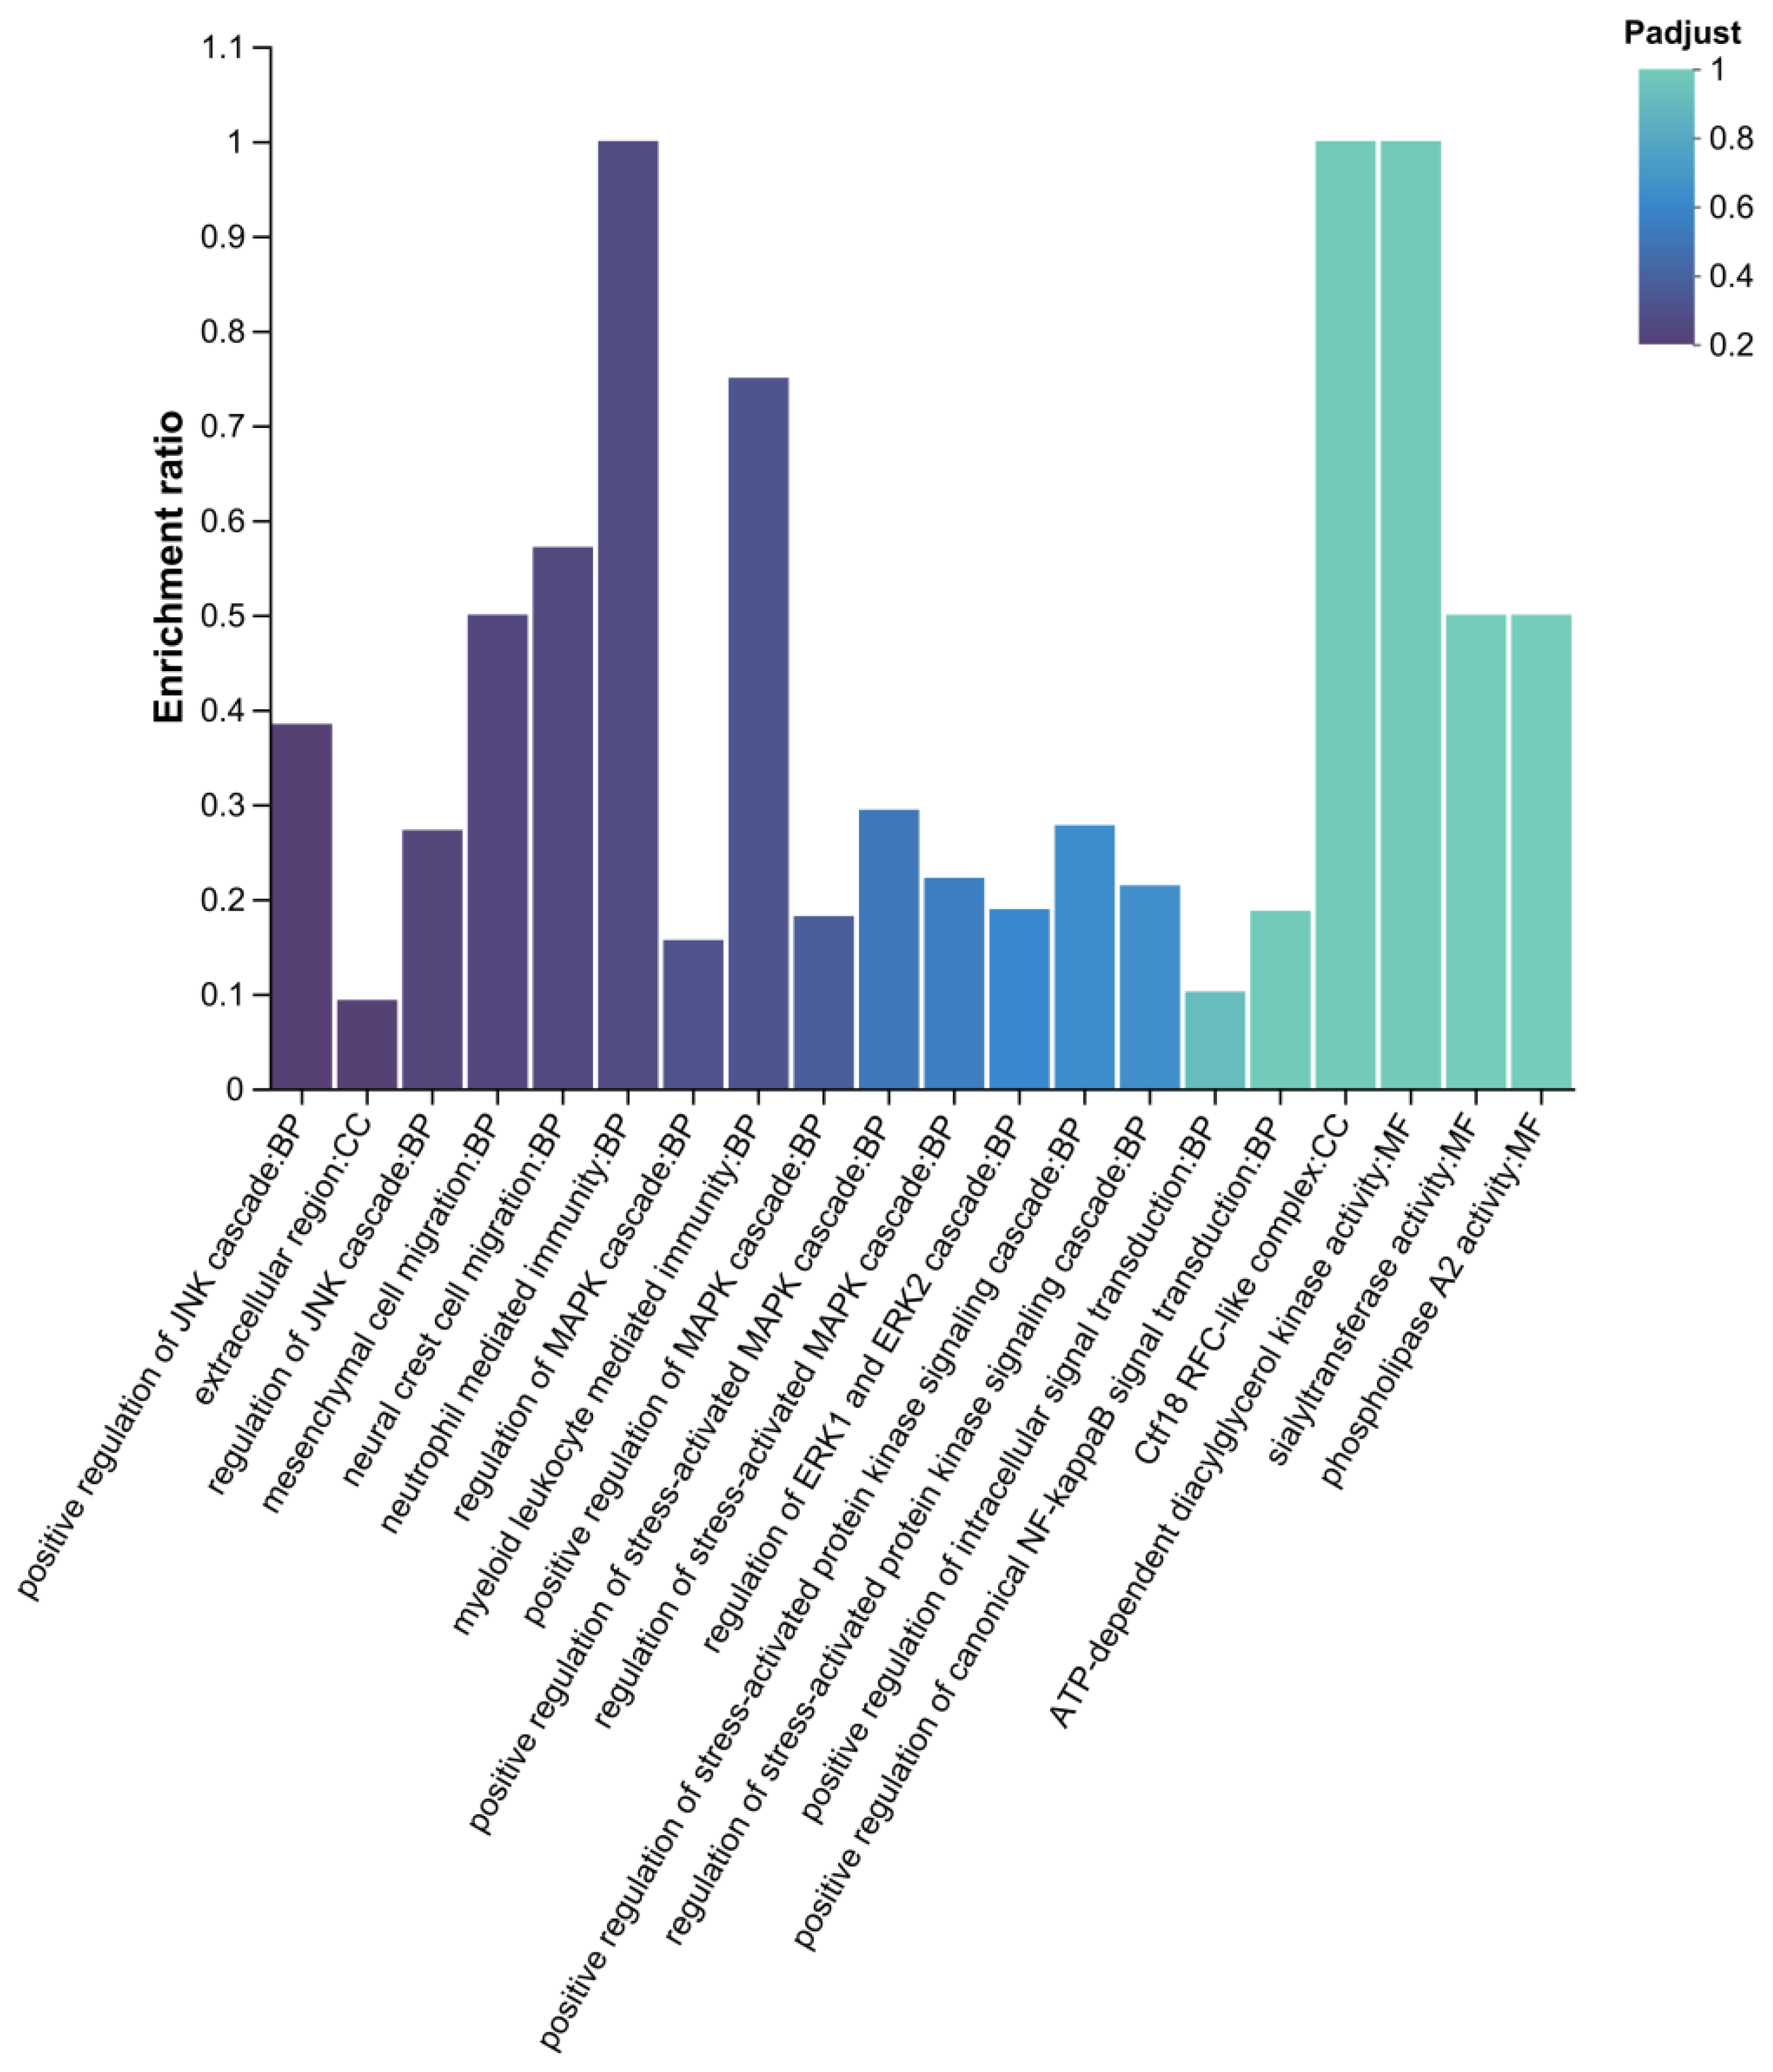
Figure 13.
KEGG Enrichment Analysis Results of Differentially Expressed Proteins in Ovarian Proteome.
Figure 13.
KEGG Enrichment Analysis Results of Differentially Expressed Proteins in Ovarian Proteome.
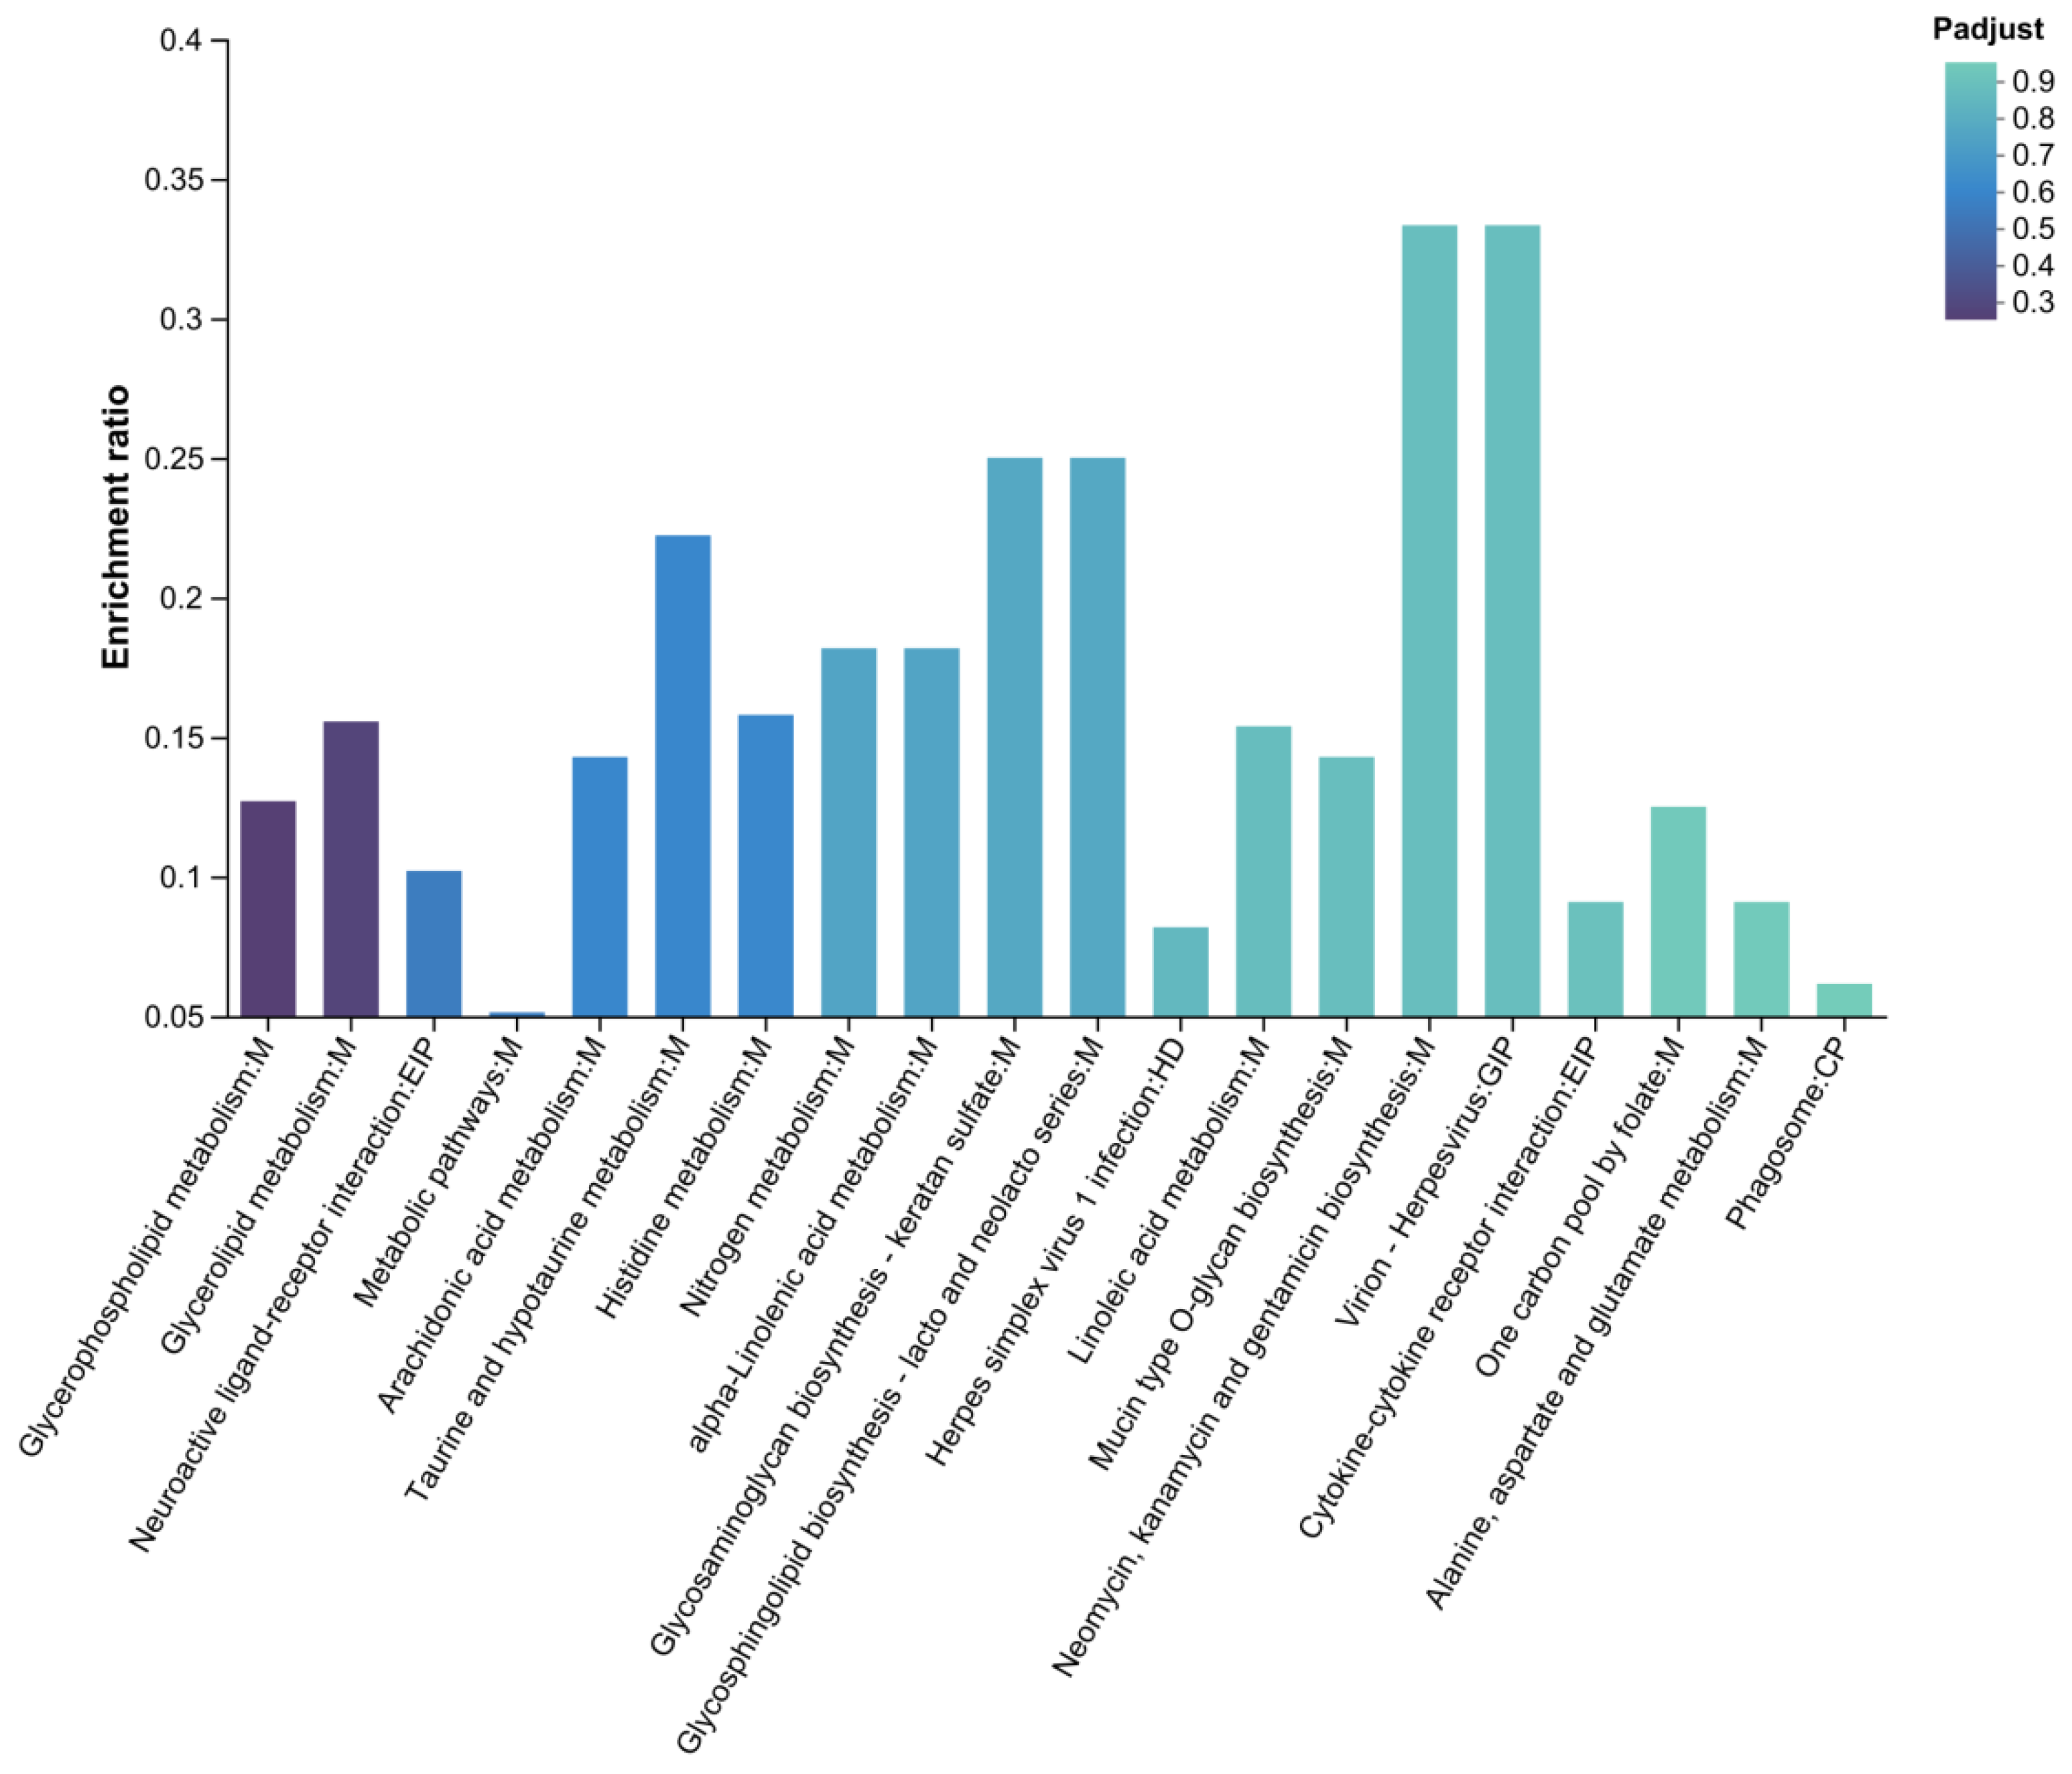
Figure 14.
Integrated Analysis of Ovarian Transcriptomic and Proteomic Common Pathways and Genes.
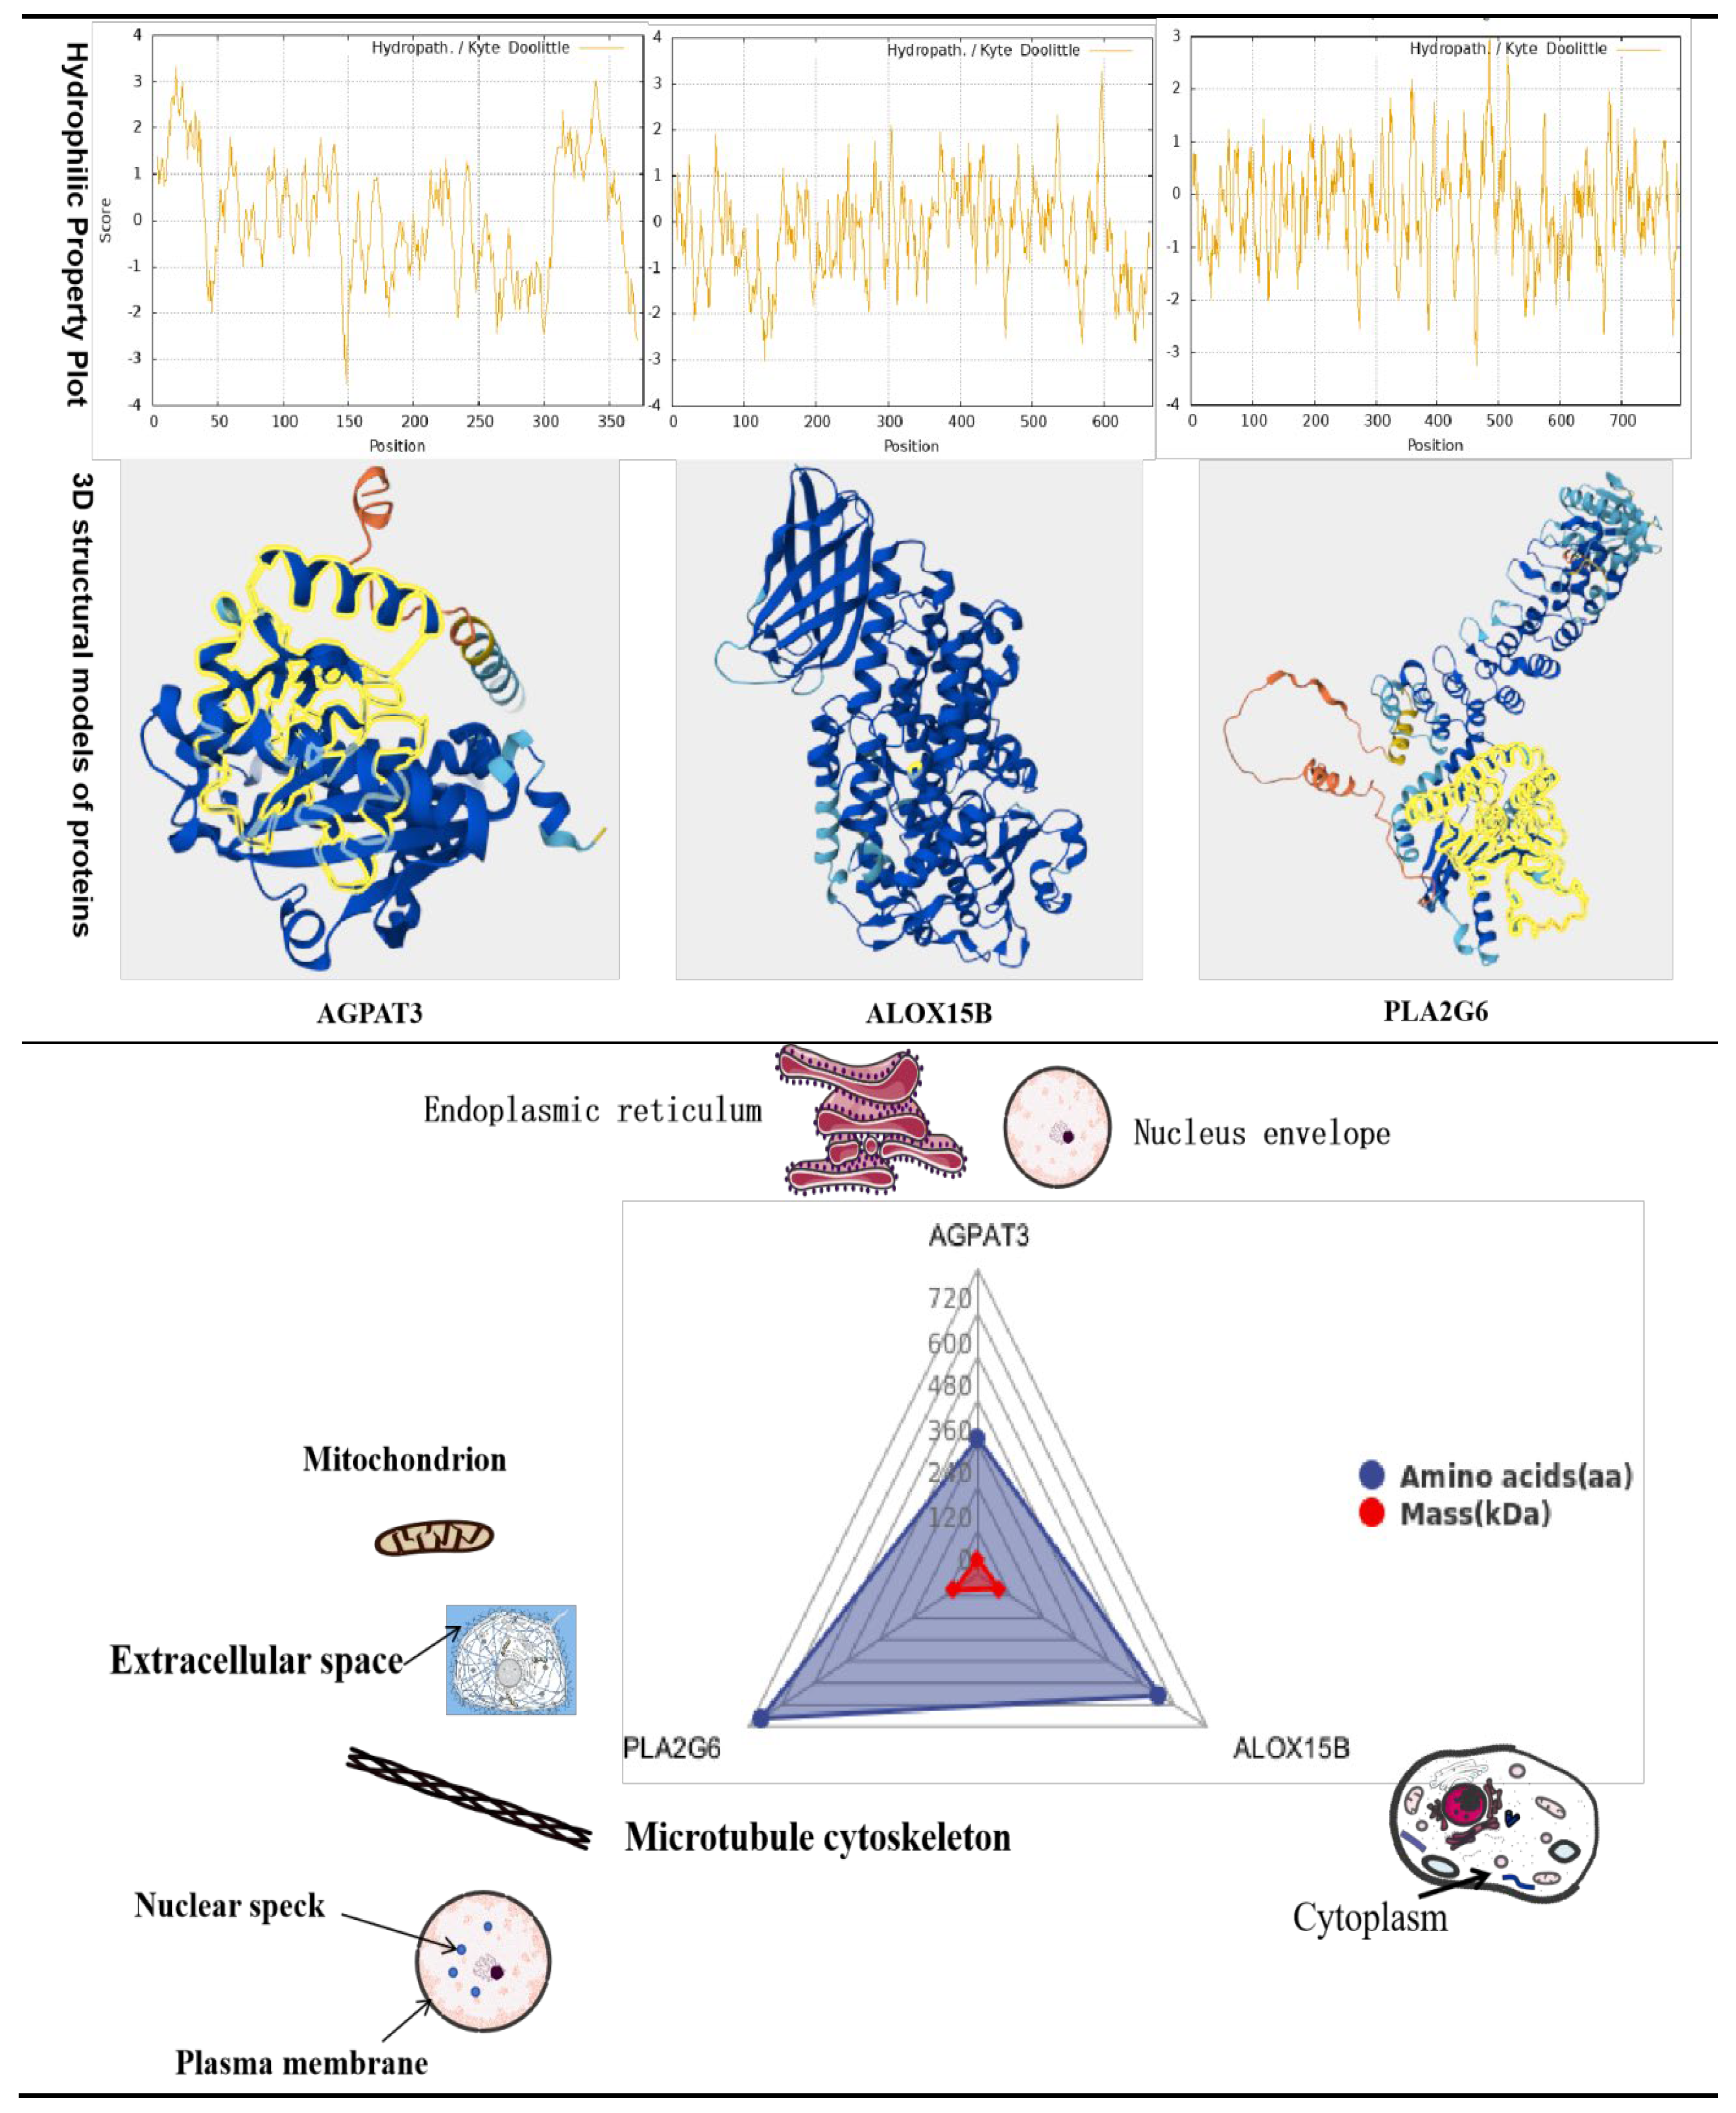
Figure 15.
PLS-DA Score Plot of Ovarian Metabolomic Profiles.
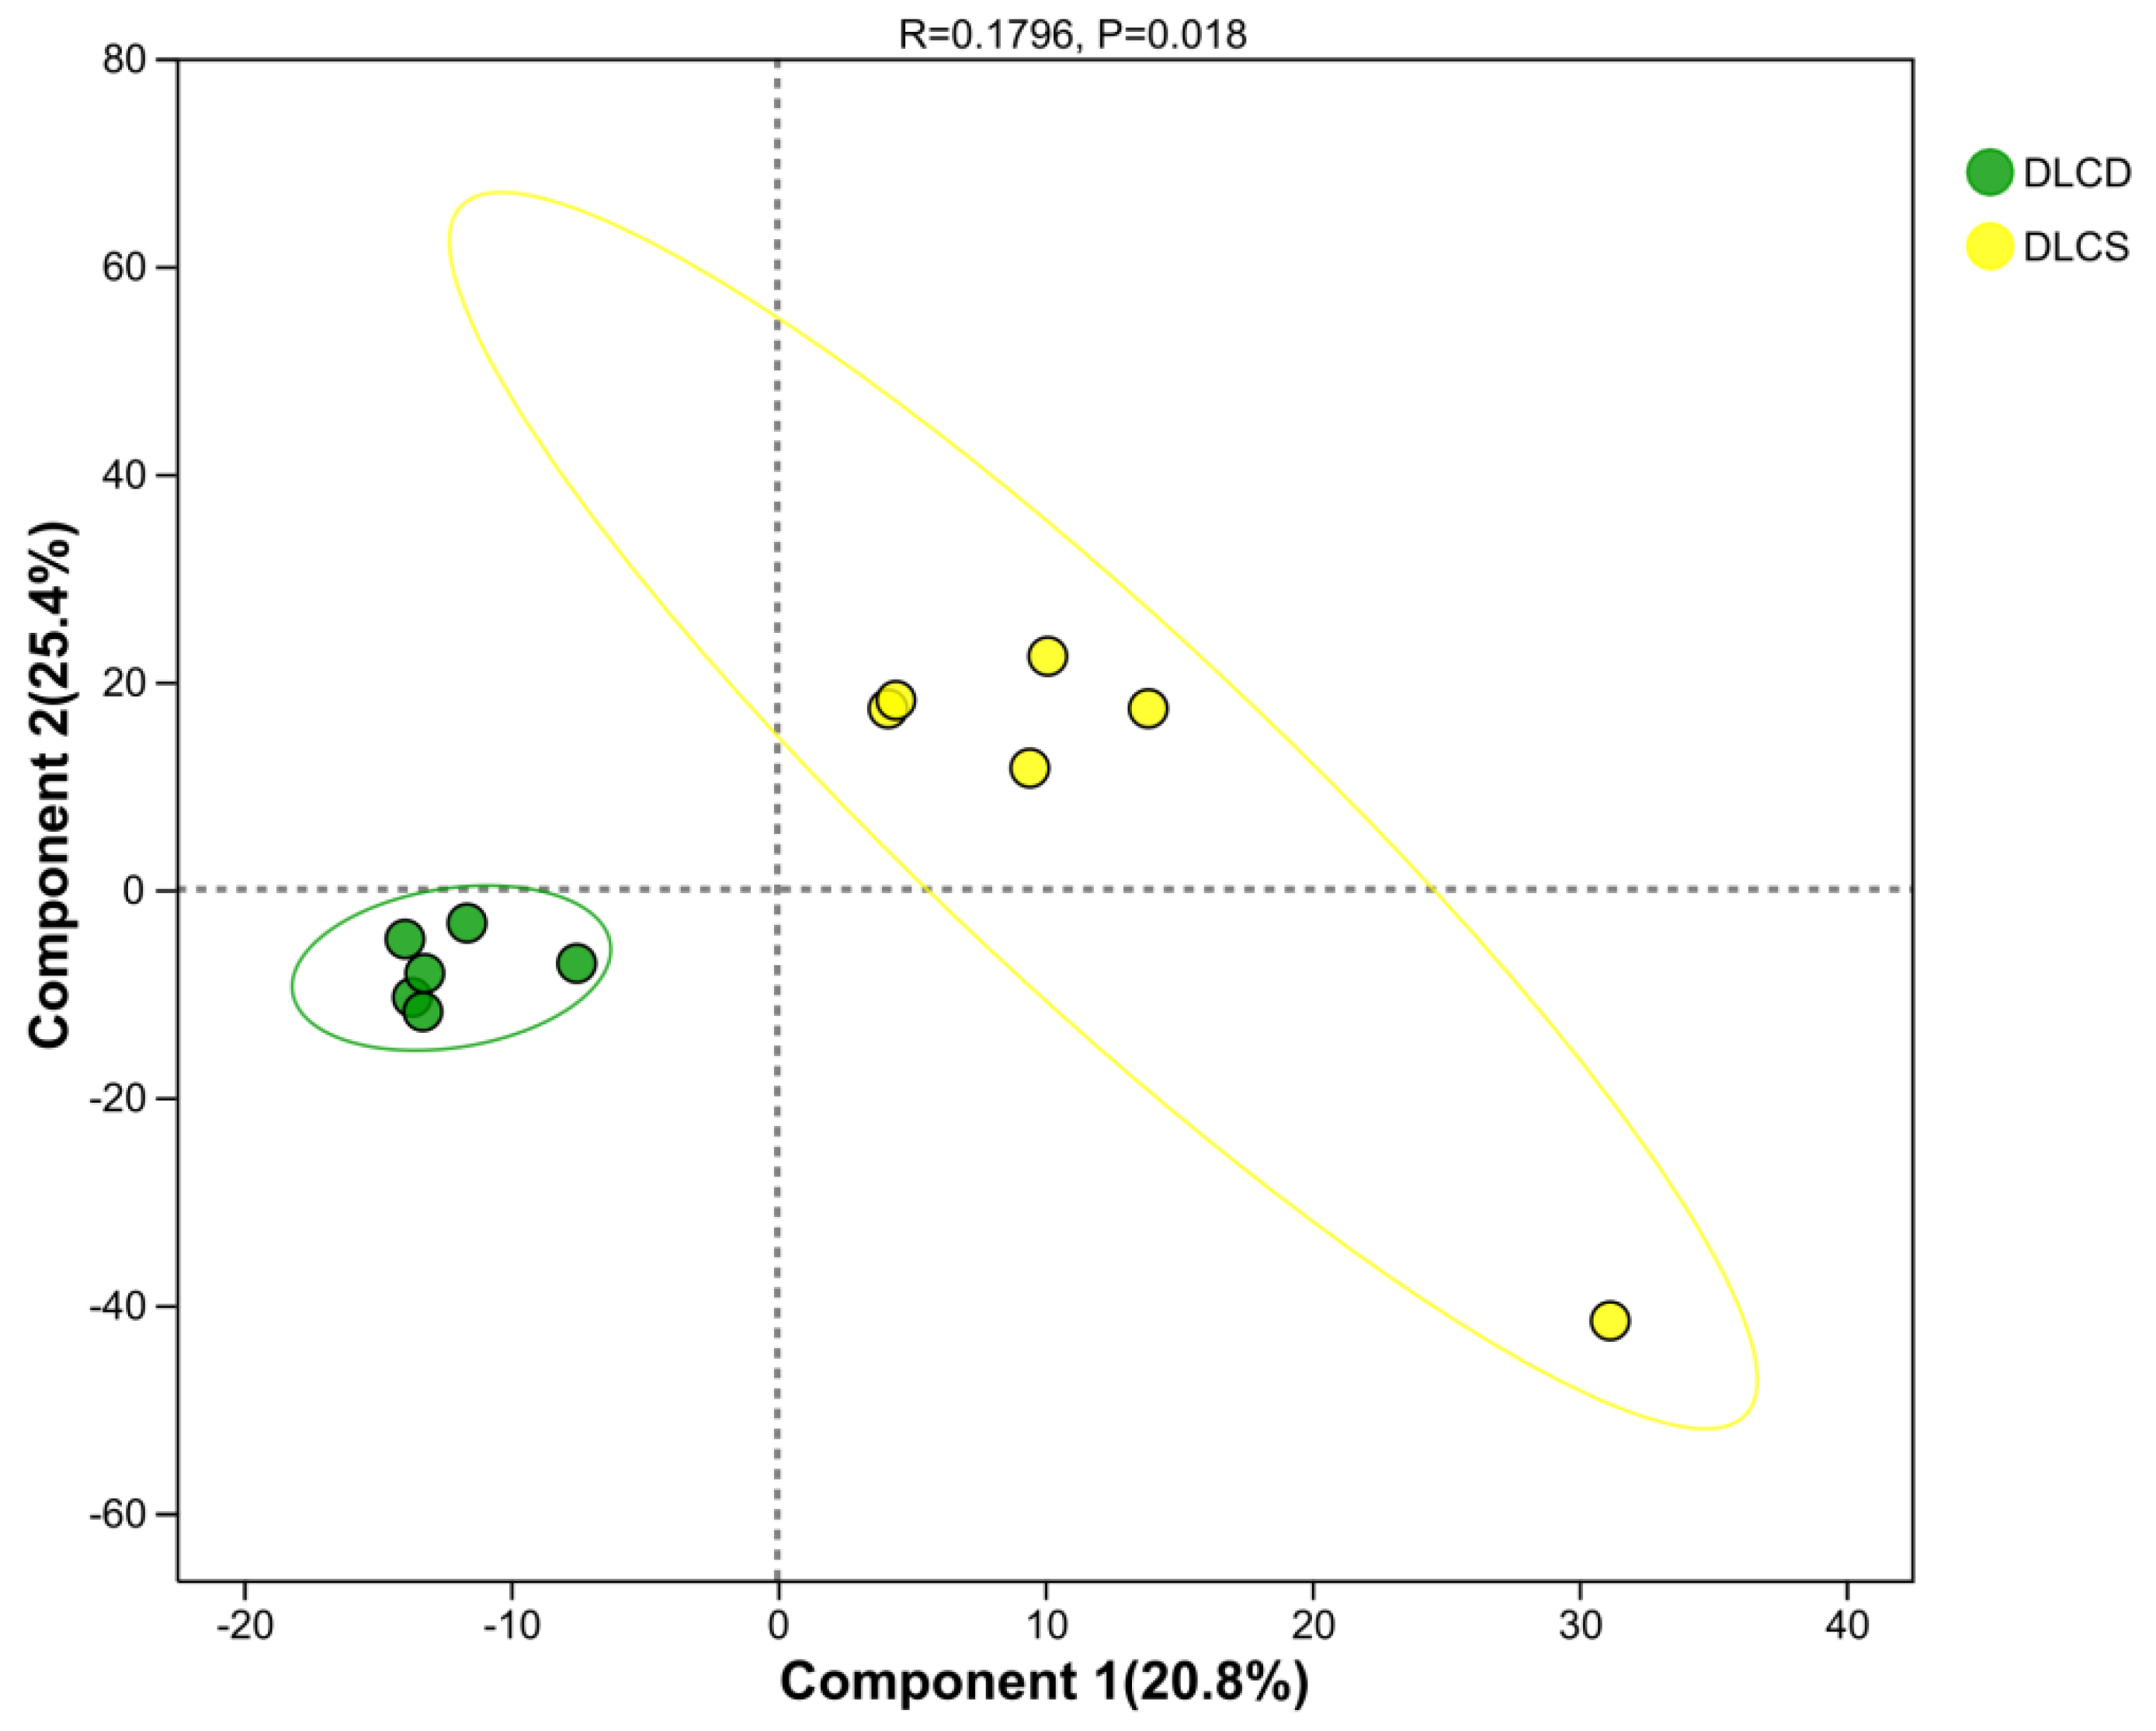
Figure 16.
Volcano Plot of Ovarian Differential metabolites. Note: The horizontal axis represents the logarithmic fold change of metabolite expression between the two groups; the vertical axis represents the statistical significance of expression changes (-log₁₀(P-value)), with higher values indicating more significant differences. Both axes use logarithmic transformation. Each dot denotes a single metabolite, with dot size reflecting the VIP value. By default, red dots represent significantly upregulated metabolites, blue dots represent significantly downregulated metabolites and black dots represent metabolites with non-significant differences.
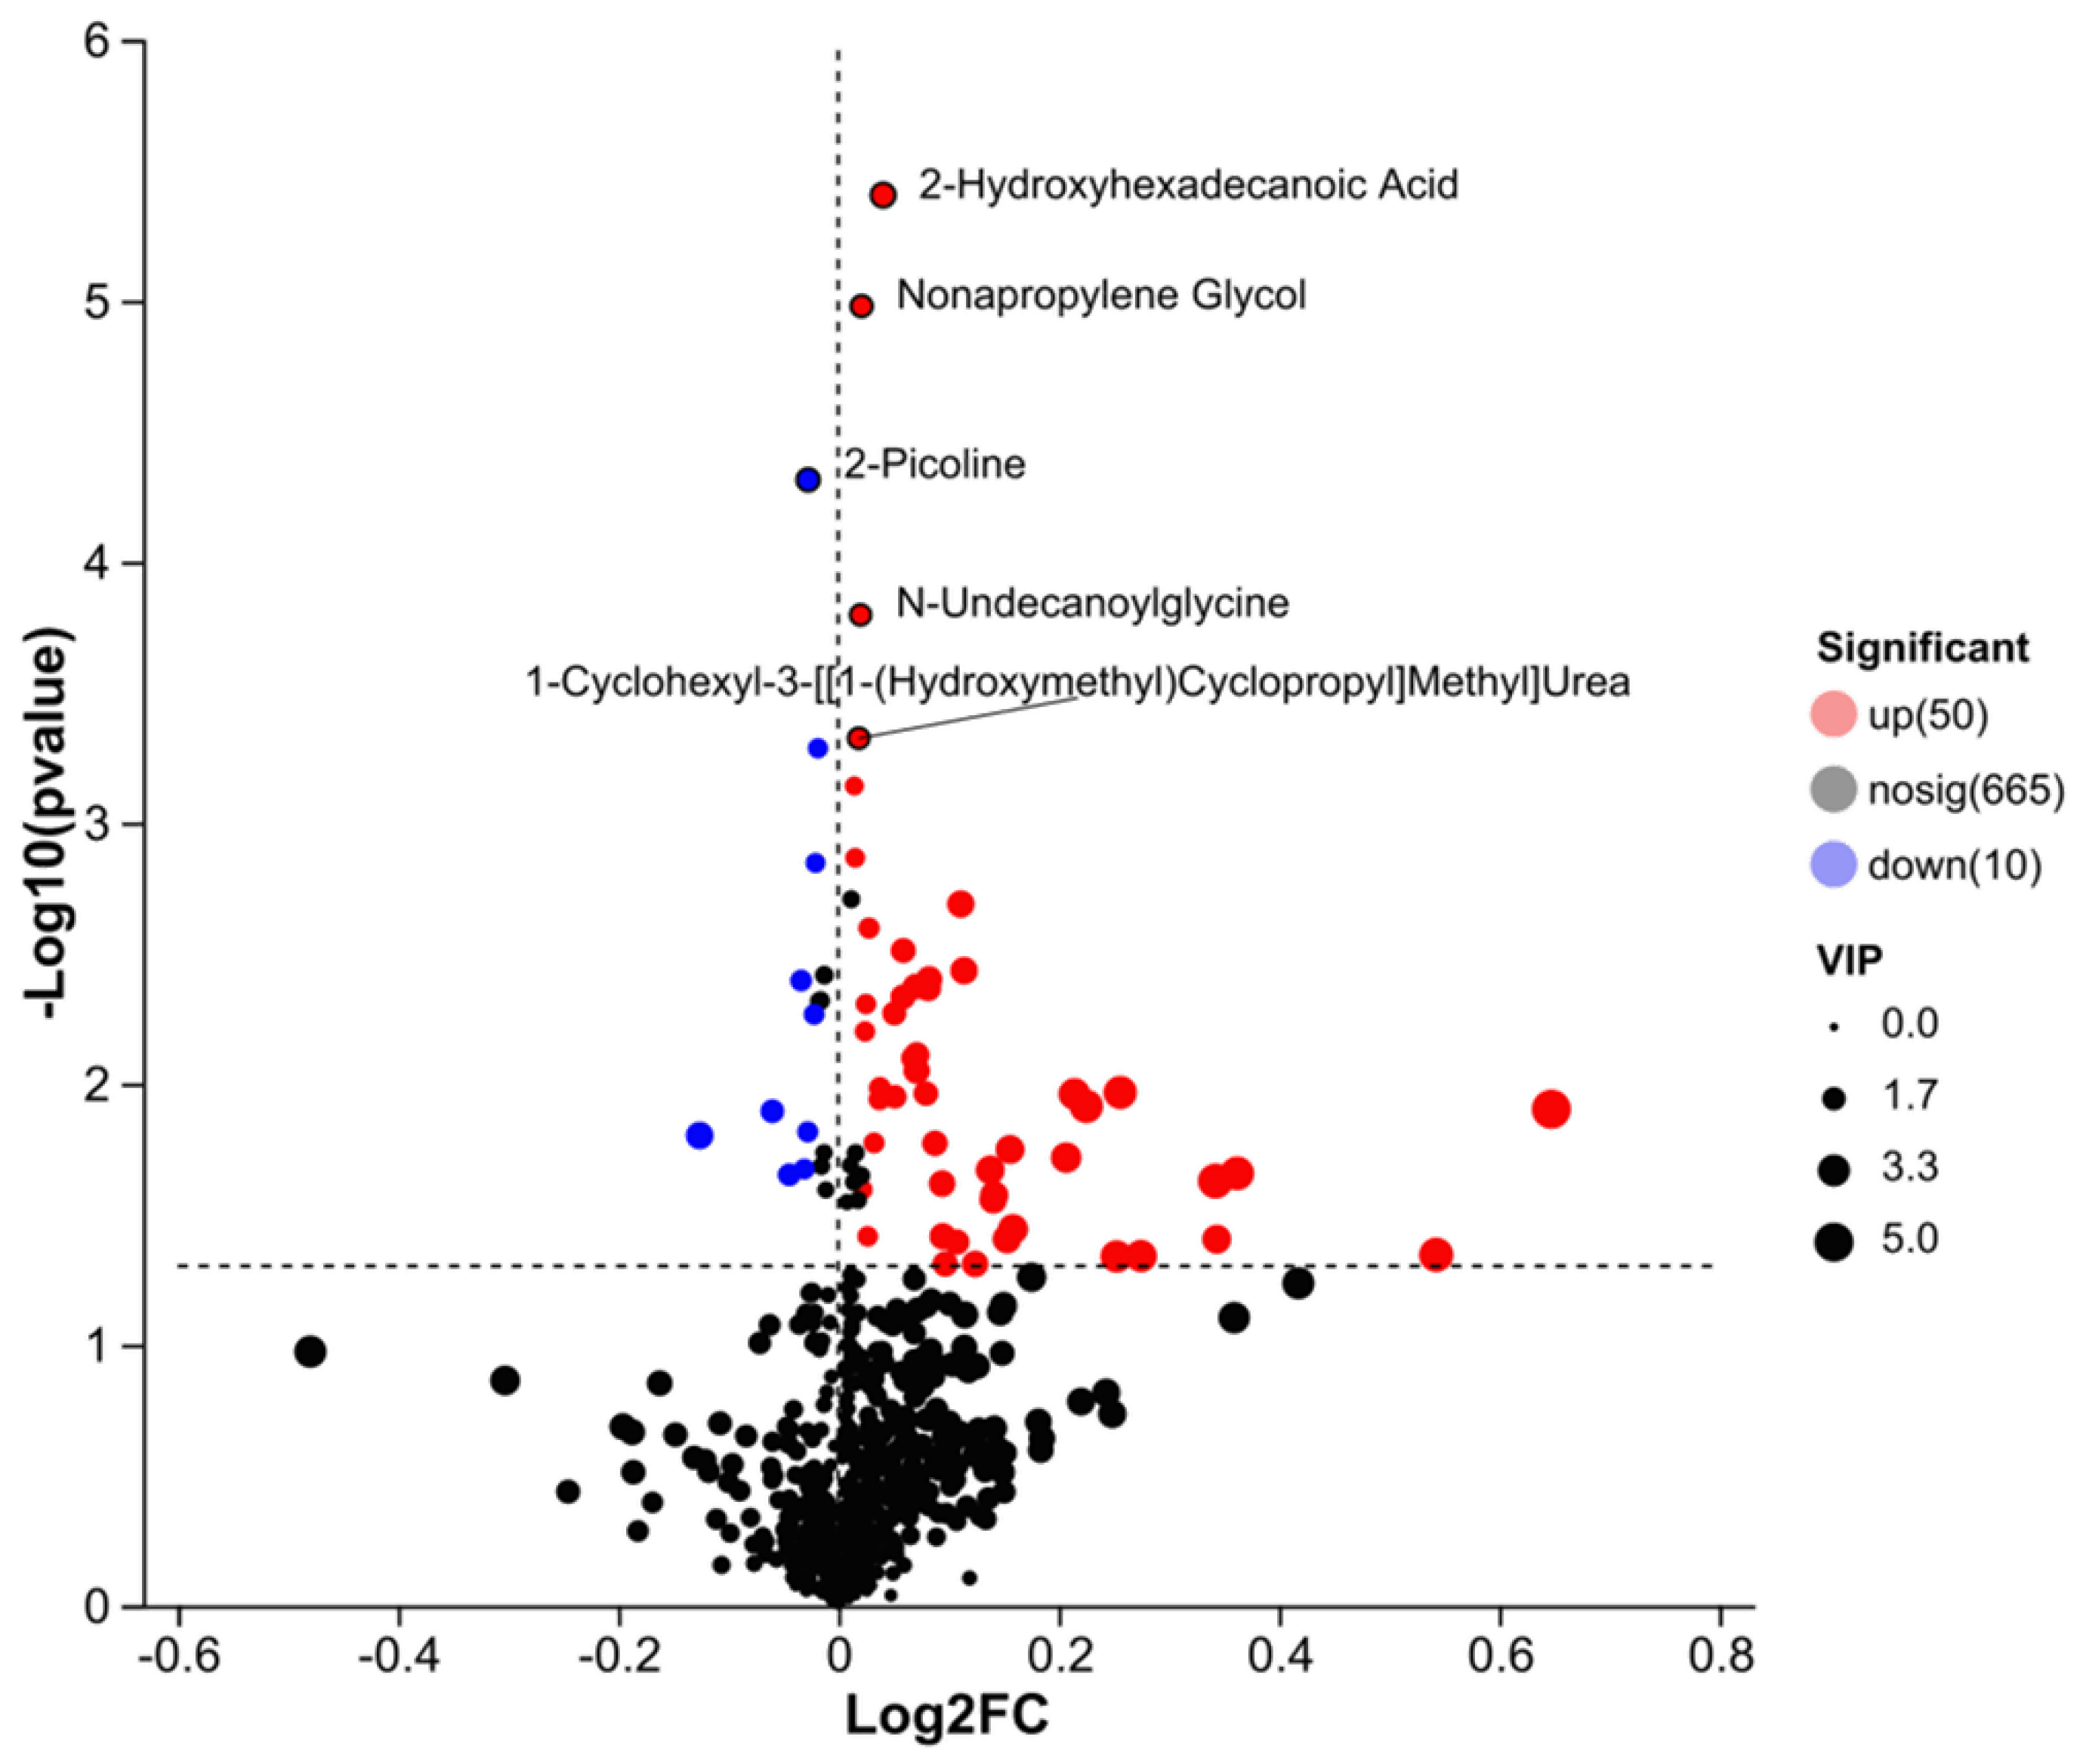
Figure 17.
VIP Score Plot of Ovarian Metabolites for Egg-Laying Clutch Trait Discrimination.
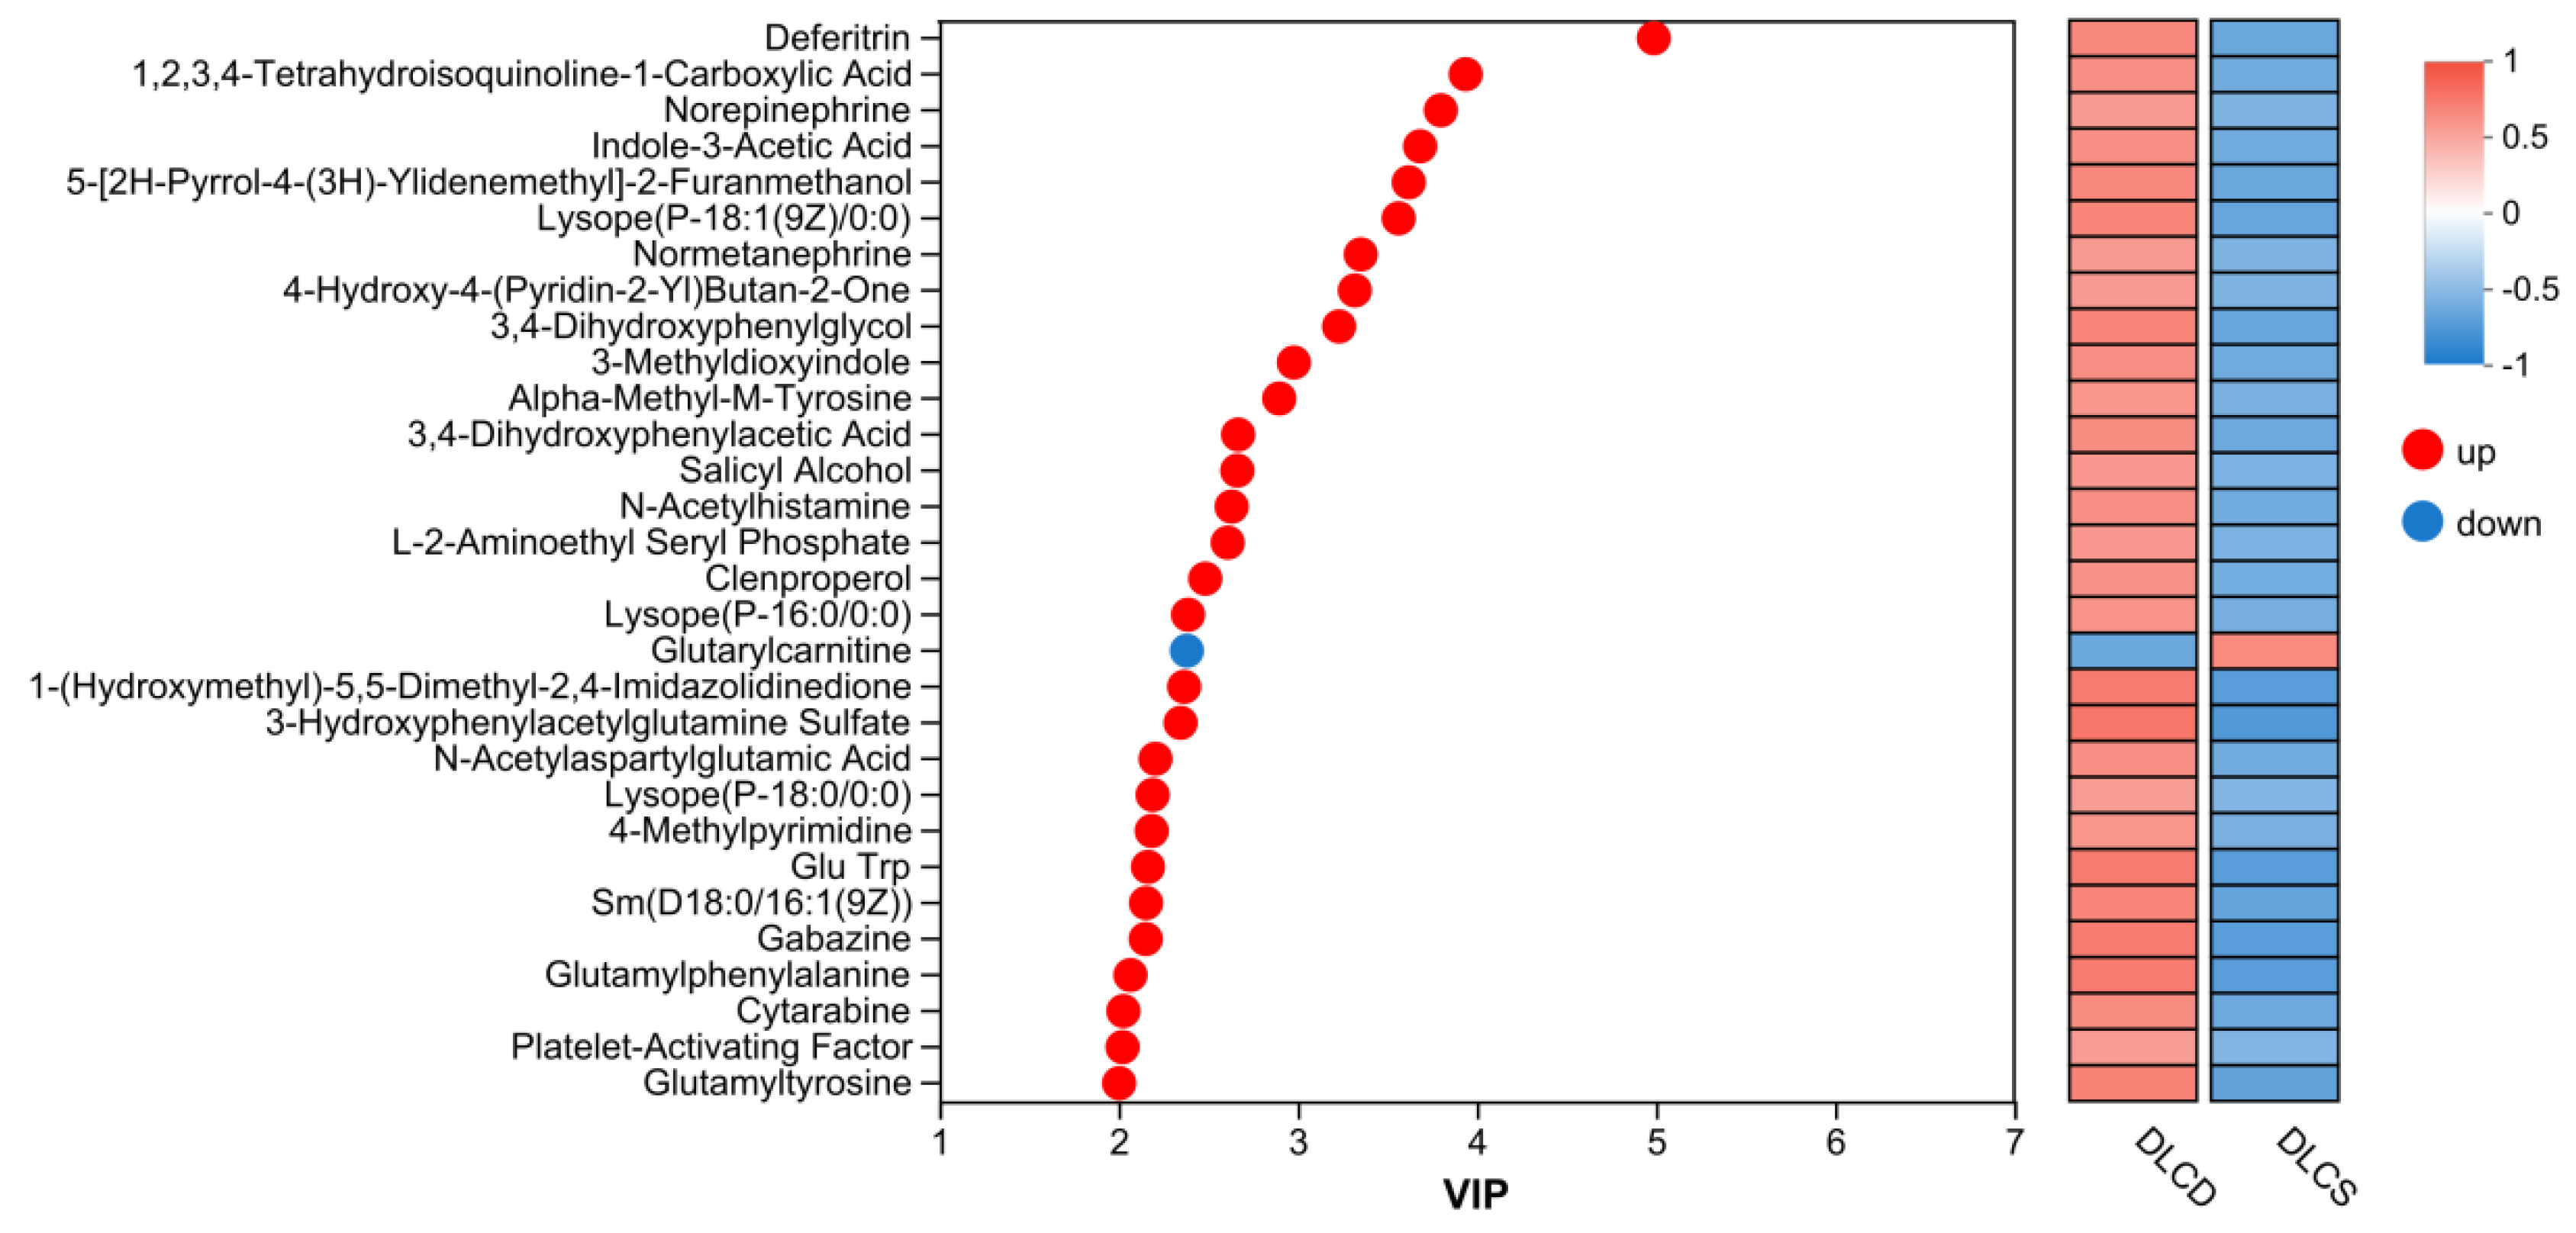
Figure 18.
KEGG Enrichment Plot of Ovarian Metabolomic. The vertical axis denotes KEGG pathways. Bubble size indicates the number of DEMs enriched in the pathway; bubble color represents the statistical significance of enrichment (darker color corresponds to smaller P-value).
Figure 18.
KEGG Enrichment Plot of Ovarian Metabolomic. The vertical axis denotes KEGG pathways. Bubble size indicates the number of DEMs enriched in the pathway; bubble color represents the statistical significance of enrichment (darker color corresponds to smaller P-value).
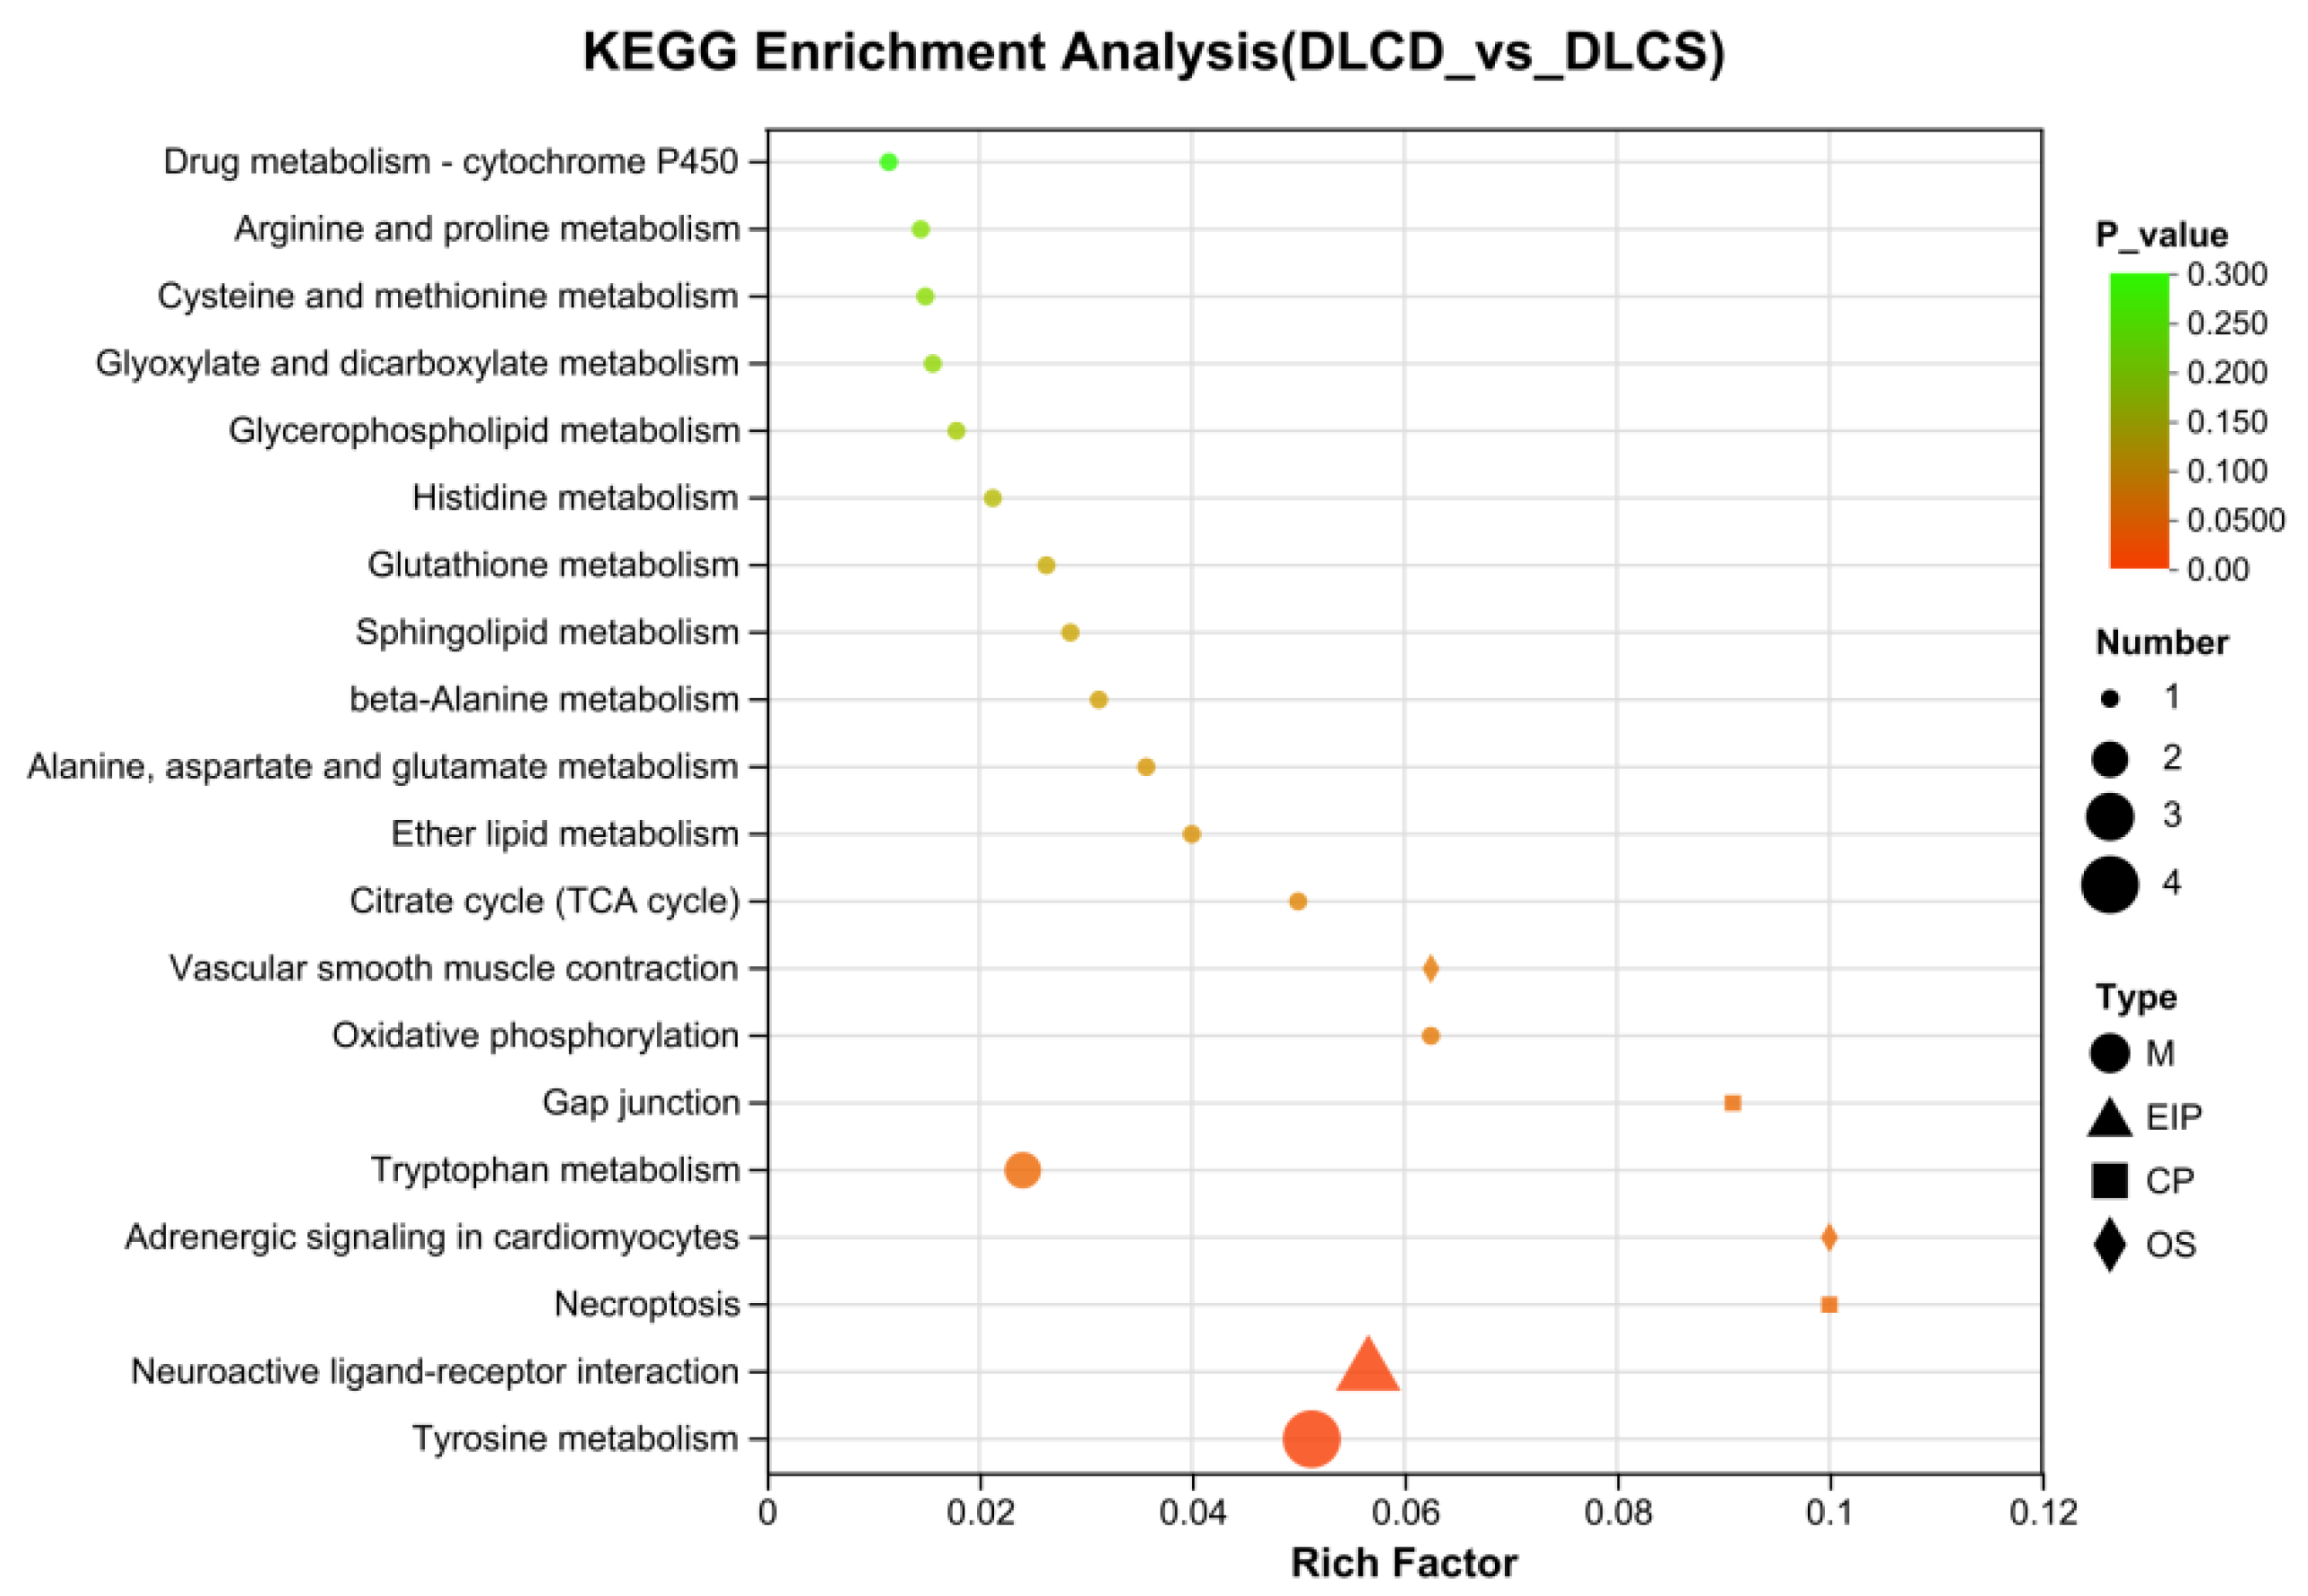
Figure 19.
OPLS-DA Model for DLCD vs. DLCS Serum Metabolic Profiles A. Permutation test plot; B. Score scatter plot.
Figure 19.
OPLS-DA Model for DLCD vs. DLCS Serum Metabolic Profiles A. Permutation test plot; B. Score scatter plot.
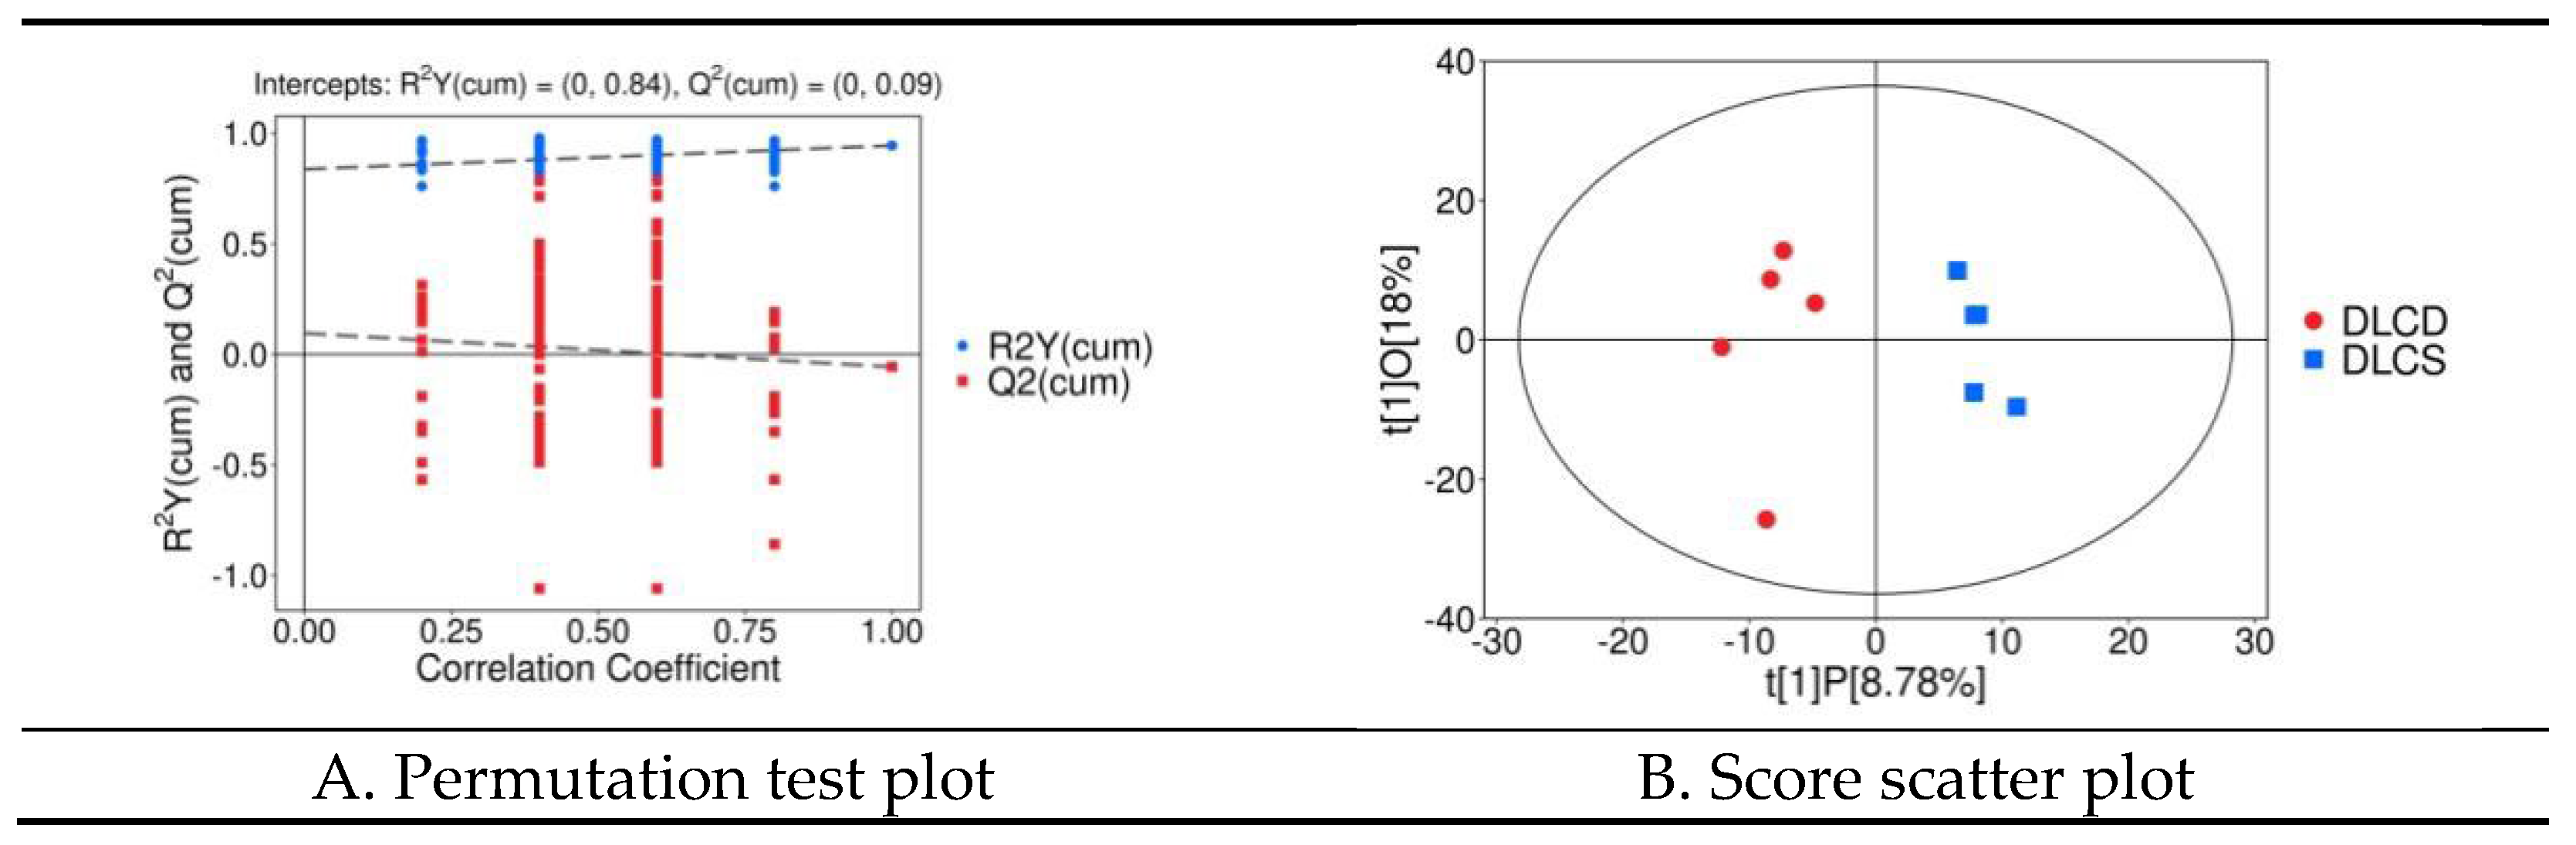
Figure 20.
Volcano Plot of Serum Differential Lipid Mediators. Note: Correct the typo 'logz Fold_ Change' to 'log₂ Fold Change' in the figure.
Figure 20.
Volcano Plot of Serum Differential Lipid Mediators. Note: Correct the typo 'logz Fold_ Change' to 'log₂ Fold Change' in the figure.
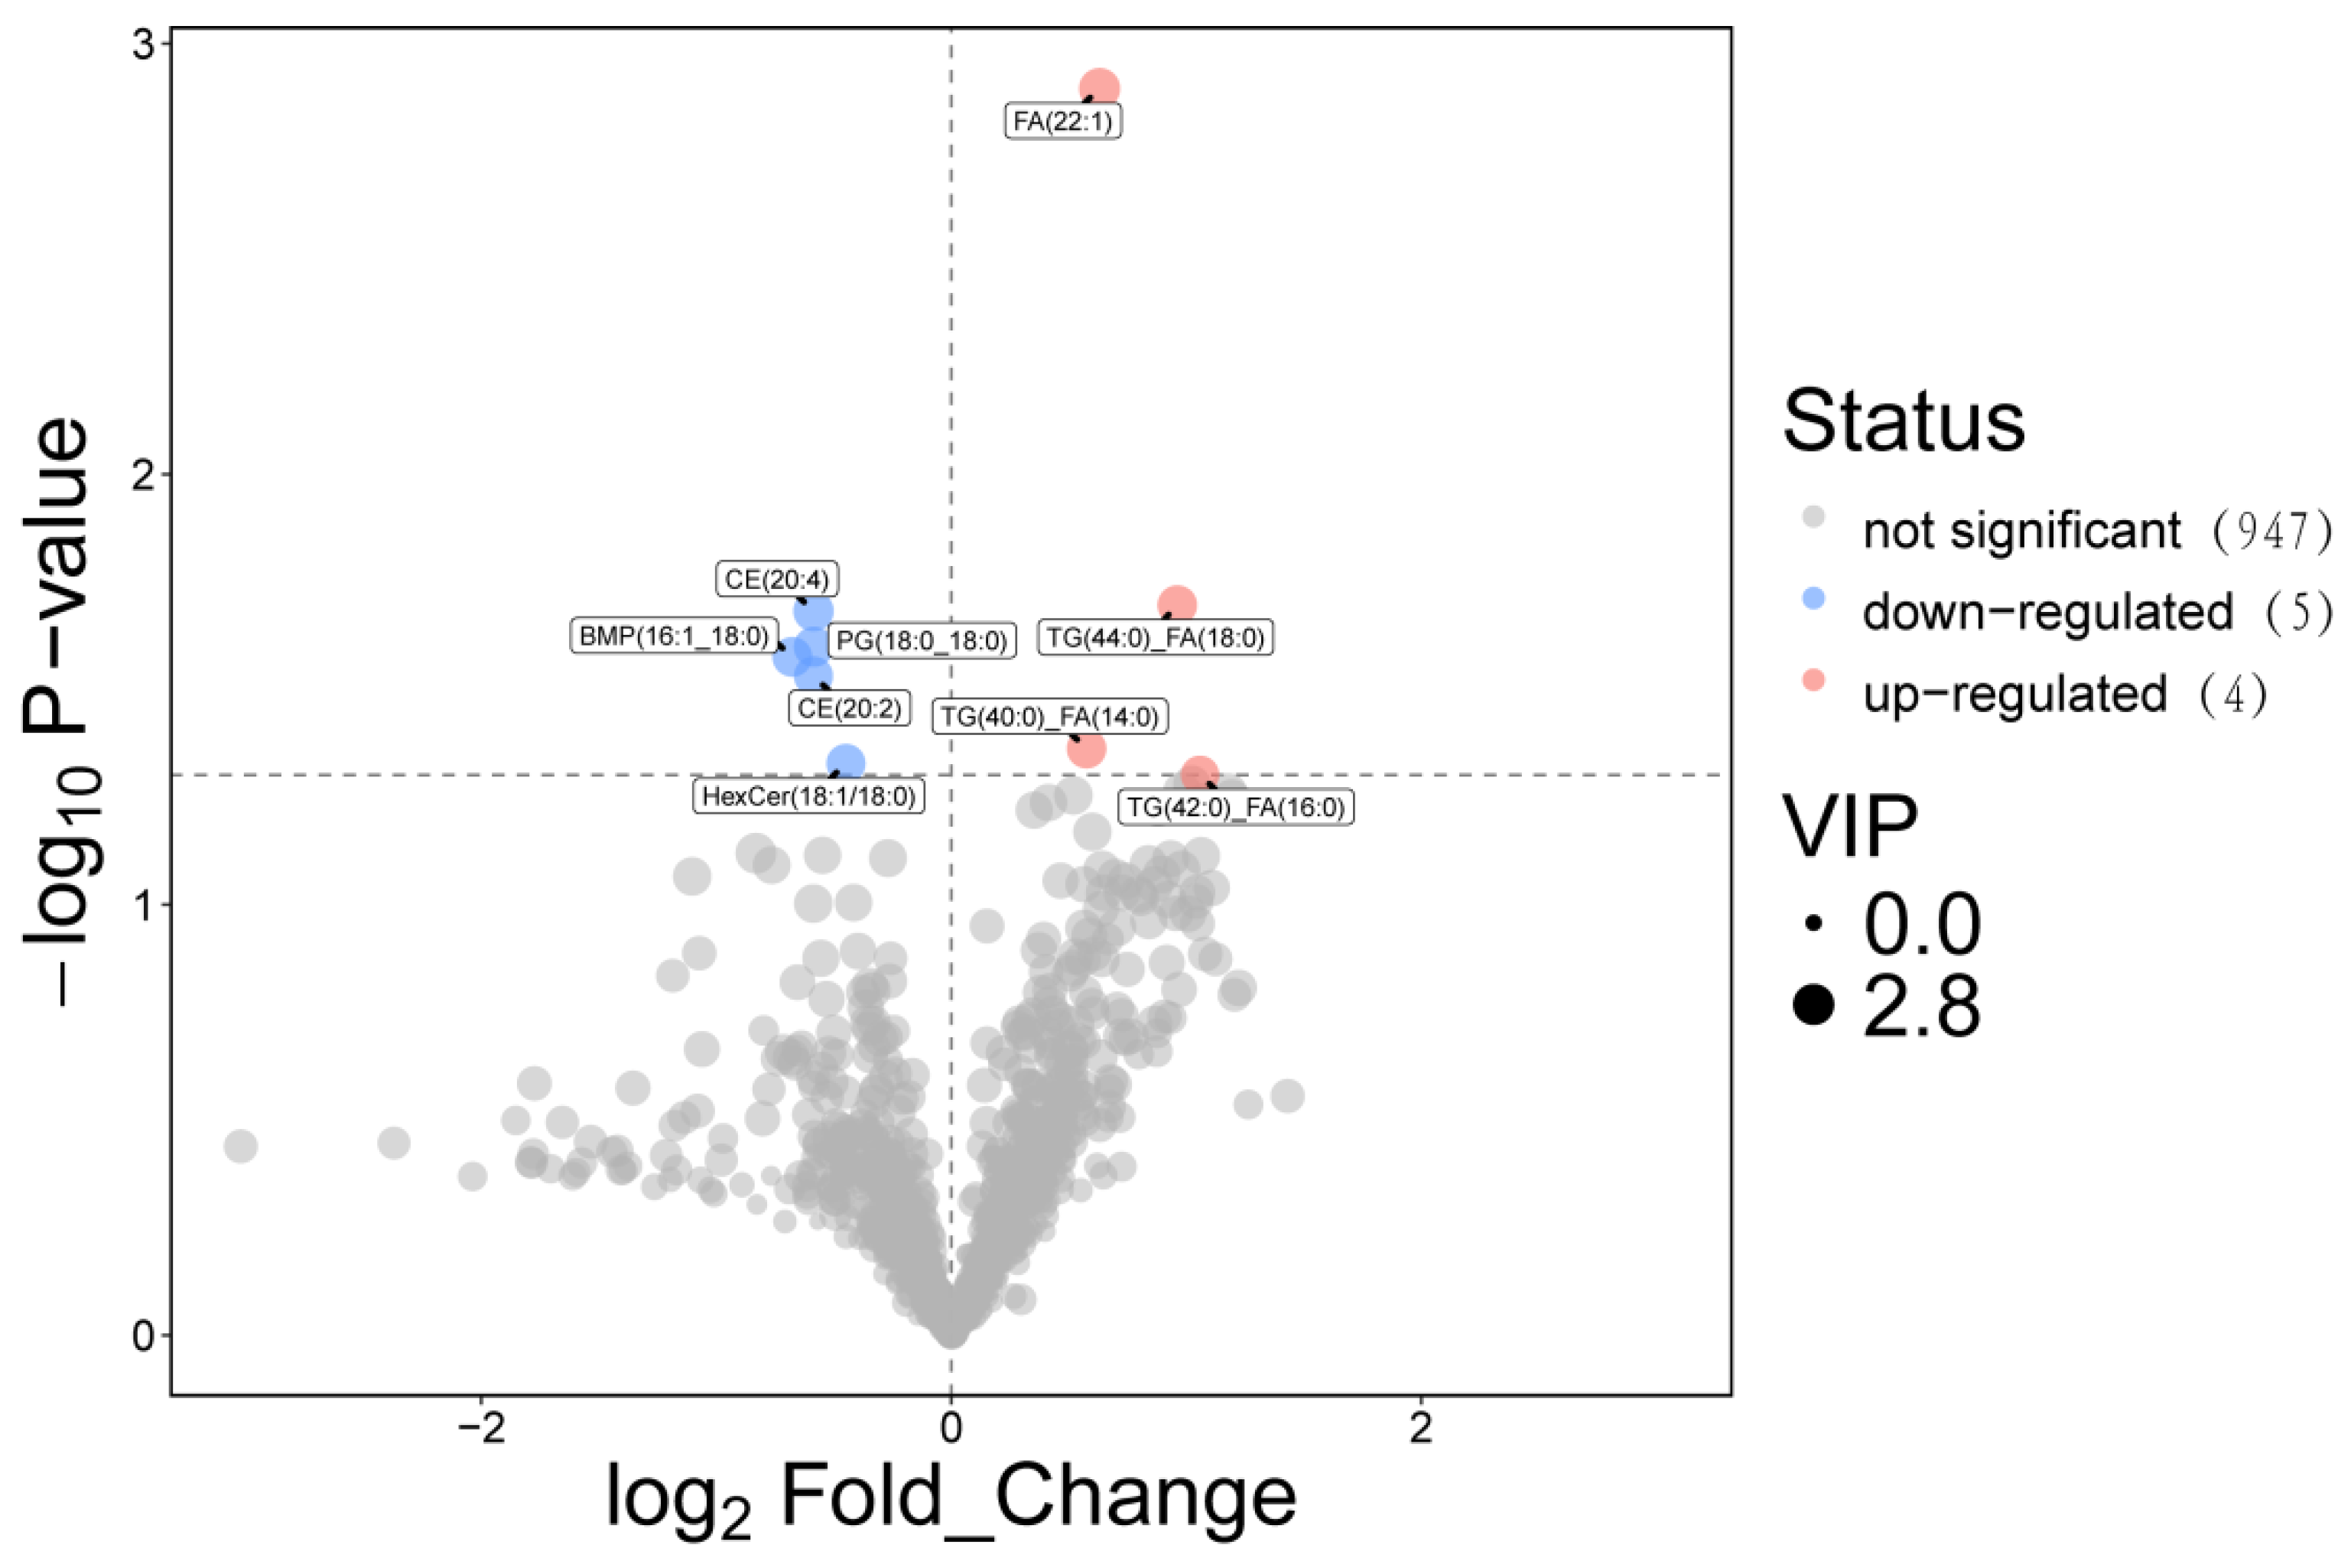
Figure 21.
Hierarchical Clustering Heatmap of Serum Differential Lipids.
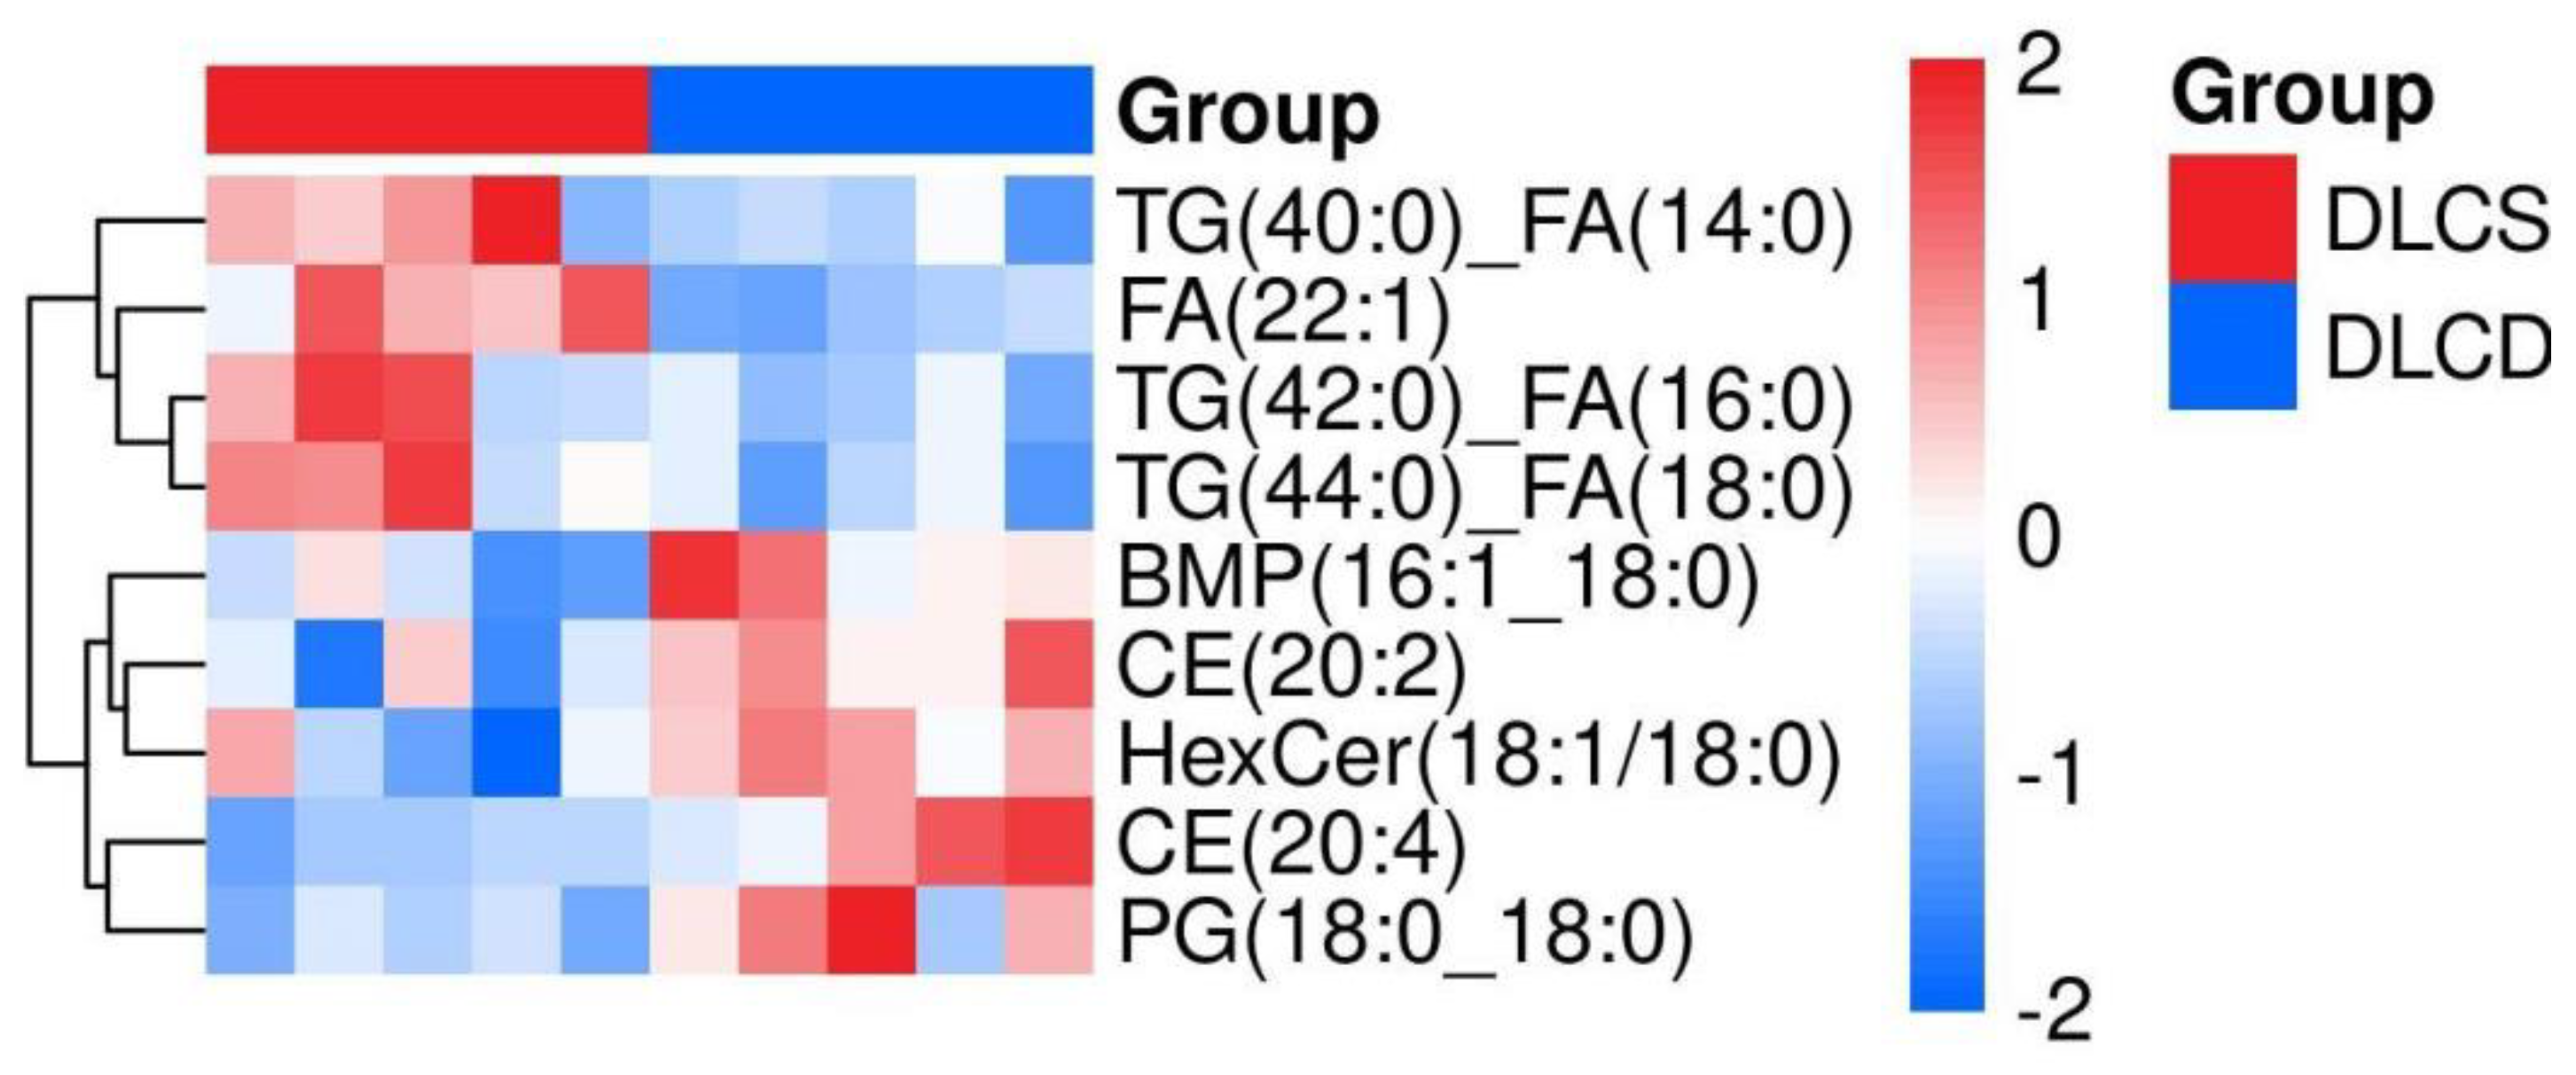

Table 1.
Ovarian Metabolomic Data Preprocessing Results.
| Ion mode | Effective peak(raw) | Identified metabolites(raw) | Proportion(%) | Effective peak(origin) | Identified metabolites(origin) | Proportion(%) |
|---|---|---|---|---|---|---|
| Pos | 4454 | 542 | 12.17% | 3131 | 479 | 15.3% |
| Neg | 4296 | 272 | 6.33% | 3336 | 246 | 7.37% |
| mix | 8750 | 814 | 9.3% | 6467 | 725 | 11.21% |
Note: “Raw” denotes the original unprocessed data table; “Origin” refers to the data table derived from preprocessing of the Raw table. Preprocessing parameters are available for review in the preprocessing interface. The Origin table was used for all subsequent analyses.
Table 2.
Total Ion Count and Metabolite Identification Statistics of Ovarian Metabolome.
| Ion mode | All peaks | Identified metabolites | Unidentified | Metabolites in Library | Metabolites in KEGG |
|---|---|---|---|---|---|
| Pos | 3131 | 479 | 2652 | 381 | 202 |
| Neg | 3336 | 246 | 3090 | 211 | 126 |
| mix | 6467 | 725 | 5742 | 592 | 328 |
Note: (1) Ion mode: ionization mode of analytes detected by mass spectrometry (MS), mainly including Pos and Neg; (2) total peaks: Number of MS peaks extracted by data processing software; (3) Identified metabolites: Number of metabolites finally identified via MS¹/MS² data and library searching; (4) Library-annotated metabolites: Number of metabolites annotated in public databases; (5) KEGG-annotated metabolites: Number of metabolites annotated in the KEGG database.
Disclaimer/Publisher’s Note: The statements, opinions and data contained in all publications are solely those of the individual author(s) and contributor(s) and not of MDPI and/or the editor(s). MDPI and/or the editor(s) disclaim responsibility for any injury to people or property resulting from any ideas, methods, instructions or products referred to in the content. |
© 2026 by the authors. Licensee MDPI, Basel, Switzerland. This article is an open access article distributed under the terms and conditions of the Creative Commons Attribution (CC BY) license (http://creativecommons.org/licenses/by/4.0/).
Copyright: This open access article is published under a Creative Commons CC BY 4.0 license, which permit the free download, distribution, and reuse, provided that the author and preprint are cited in any reuse.


