
Submitted:
20 January 2026
Posted:
22 January 2026
You are already at the latest version
Abstract
Background/Objectives: Functional decline and depression often coexist in older adults, yet local Singapore-based research often lacks detailed temporal resolution due to heterogeneity in ageing. This study employs non-parametric, data-driven longitudinal clustering to analyse functional trajectories and their association with depression, using high-frequency data to pinpoint key intervention periods. Methods: Data were drawn from 4,273 older adults from Singapore Life Panel® (2020–2024). Participants completed quarterly self-reported assessments of ADL, IADL and depressive symptoms (8-item CES-D). We employed k-means longitudinal clustering (kml) to identify functional trajectory groups and Cox regression to evaluate the hazard of worsening depression (≥5-point increase in CES-D). Results: Three trajectories emerged: Stable, Medium (gradual increase in functional difficulty), and High (rapid increase in functional difficulty). The High cluster, comprising older and socioeconomically disadvantaged individuals, exhibited worse baseline health and psychosocial factor scores. Depression scores escalated in the Medium and High groups. Kaplan-Meier analysis revealed a faster rate of symptom worsening in these groups than in the Stable group. The High ADL trajectory predicted a 1.65-fold increased hazard of depression worsening after adjusting for sociodemographic and psychosocial confounders. Conclusions: Rapid functional decline acts as a precursor to worsening depressive symptoms. Routine monitoring of functional trajectories offers a strategic window for proactive mental health interventions in at-risk older adults.
Keywords:
functional decline
; depression
; k-means longitudinal clustering
; ageing population
; superaged societies
1. Introduction
Population ageing and extended lifespans have brought increasing concern about functional decline and mental well-being in later life. Singapore exemplifies this trend; as of June 2025, 20.7% of its citizens are aged 65 and older, and the nation is expected to surpass the super-aged threshold of 21% by 2030 [1]. This demographic shift is accompanied by a rise in chronic health conditions, a loss of functional independence, and an increase in mental health challenges. One particularly salient concern is late-life depression. The recent Well-being of Singapore Elderly (WiSE) national survey reveals that approximately 4.4% of older Singaporeans met the criteria for depression syndrome, while an additional 11.9% experienced subsyndromal depression [2]. Affected individuals often experience higher levels of disability, lower quality of life, and increased healthcare costs compared to their non-depressed peers [2,3]. Although this prevalence appears low, it increases the burden of care for late-life depression in an ageing society. This burden is exacerbated by shrinking family sizes; the Old-Age support Ratio in Singapore has dropped from 6.0 in 2014 to 3.5 in 2024, signalling a looming scarcity of home-based caregivers [4,5]. It is therefore critical to understand how physical functional changes intertwine with mental health, ensuring that increased longevity is accompanied by an extended healthspan.
Numerous longitudinal studies reveal a bidirectional relationship between functional limitations and depressive symptoms in later life. New or worsening difficulties in activities of daily living (ADLs) and instrumental ADLs (IADLs) are linked to subsequent increases in depressive symptoms, while pre-existing depressive symptoms modestly elevate the risk of future functional decline [6,7]. Although functional decline generally predicts depression, existing research in Singapore often lacks the longitudinal resolution to pinpoint exactly when depressive symptoms are likely to worsen in individuals experiencing functional decline. Local studies often rely on limited follow-up time-points, obscuring the temporal dynamics of the ADLs/IADLs–depression link [8,9]. Without granular data on the rate and onset of these changes, it becomes difficult to determine if depression manifests gradually or follows a more acute onset in response to specific types of functional loss. Addressing this requires a shift from simple prevalence statistics towards analyses that capture the precise temporal sequence of decline.
Uncovering these temporal patterns requires a methodological approach that respects the heterogeneity of the ageing process. Functional ageing is not a uniform process; rather, it encompasses a diverse range of trajectories [10,11]. For instance, longitudinal studies in the US and Japan consistently distinguished between a majority maintaining independence and smaller subgroups experiencing progressive or persistent impairment [12,13]. These findings highlight that while many participants remain in the robust category, a minority transition to greater dependency. This decline is rarely a smooth, monotonic process. Instead, it is frequently punctuated by acute health events, such as falls, hospitalisations, or sudden onset of illness, that result in jagged, irregular declines rather than a gradual slope [14]. Capturing these irregularities is essential, but standard trajectory-mixture approaches such as Latent Class Growth Analysis (LCGA) and Group-Based Trajectory Models (GBTM) typically represent each latent class using prespecified parametric functions of time (often linear, quadratic, or spline-based) [11,15]. Consequently, the resulting class trajectories can be artificially smooth, potentially obscuring within-class heterogeneity [16]. This constraint reduces sensitivity to short-term fluctuations or abrupt changes, often causing acute patterns to be absorbed into broader gradual-change categories [17,18]. To avoid these structural constraints and accurately map the diverse reality of functional loss, k-means for longitudinal data (kml) is a nonparametric alternative that applies a hill-climbing algorithm adapted from k-means clustering. This approach analyses full longitudinal trajectories using Euclidean distance on a standardised time grid, allowing it to avoid the limitations of predetermined parametric shapes within-class [19] and capture irregular departures from simple parametric patterns. The kml algorithm enhances robustness by utilising multiple random starts and retaining the solution that optimises an internal clustering criterion, such as the Calinski-Harabasz index [19]. The utility of this method is increasingly recognised in epidemiological research, with successful applications that map distinct clinical phenotypes and symptom trajectories across diverse health domains [20,21].
To address these gaps, the current study employs kml clustering to analyse quarterly ADL and IADL scores, identifying meaningful groups of functional trajectories among older Singaporeans. The pathway from functional loss to depression does not unfold in isolation; it is often shaped by psychosocial and cognitive factors. Social isolation, low social support and engagement and cognitive impairment are associated with both functional disability and depressive outcomes [15,22,23,24,25]. To ensure that our findings capture the unique contribution of functional trajectories to mental health, our models explicitly account for social isolation, social support and engagement, and cognitive status. We hypothesise that both ADL and IADL trajectories will separate into multiple distinct clusters, and that individuals categorised in clusters marked by more rapid functional deterioration will experience a significantly increased risk of worsening depressive symptoms. By integrating this flexible trajectory modelling with prospective depression outcomes, we aim to pinpoint time windows when mental health prevention and support may be most impactful.
2. Materials and Methods
Data
This research utilised data from the Singapore Life Panel® (SLP), a high-frequency longitudinal survey targeting older residents aged 50 to 70 years and their spouses [26]. Participants could complete surveys online, via telephone, or through in-person interviews. To accommodate Singapore’s diverse ethnic composition, surveys were administered in English, Chinese, Malay, and Tamil, with respondents receiving vouchers as compensation. Recruitment commenced in 2015, initially reaching approximately 11,500 households, and the panel has consistently achieved an average response rate of 70% since inception. In 2020, the SLP underwent an infrastructural update, followed by a period of renewal from 2021 to 2023. After accounting for attrition, mortality, and data quality filtering, a cohort of 4,273 respondents consistently provided quarterly responses on activities of daily living (ADL), instrumental activities of daily living (IADL), and depression items from November 2020 through November 2024. Additionally, these participants completed baseline assessments of social support, social engagement, social isolation and cognitive items.
Measurements
Activities of Daily Living (ADL) and Instrumental Activities of Daily Living (IADL)
Participants’ difficulties with ADLs and IADLs were assessed through self-report measures (see supplementary Table S1). For ADLs, participants rated the difficulty of completing six activities (see supplementary Table S1) on a scale from 1 (Not at all difficult) to 4 (Unable to perform). The overall ADL score for each individual was calculated by summing responses across all six ADL items, with higher scores indicating greater difficulty. Similarly, IADLs were evaluated by participants’ self-rated difficulty across eight instrumental activities using the same scale. The total IADL score was obtained by summing the eight items, with higher scores indicating greater difficulty performing these tasks.
Depression
In this research, participants’ levels of depression were assessed through their self-reporting on the eight-item version of the Centre for Epidemiologic Studies-Depression Scale (CES-D), as included in the European Social Survey (ESS) and referenced by Van de Velde et al. (2009) [27]. Participants reflected on the frequency of experiencing various depressive symptoms over the past week (i.e., felt sad, happiness, loneliness, depressed, everything you did was an effort, sleep was restless, enjoyment of life, and could not get going). Item responses were provided on a six-point scale, ranging from 1 (none of the time) to 6 (all of the time). To ensure consistent scoring, the positively worded items were reverse-coded so that higher total scores uniformly indicated more severe depressive symptoms.
For each participant, we calculated the change in the 8-item CES-D score between baseline and follow-up. To identify those with marked worsening of depressive symptoms, we defined ‘increased depression’ as a change of ≥5 points on CES-D between baseline and follow-up, which in our cohort corresponds to the 95th percentile of the observed change-score distribution [28]. This percentile-based definition characterises marked worsening relative to the distribution of change in our sample, rather than a clinically validated cutoff.
Covariates
Covariates included in this study were age, gender, education, marital status, housing, the number of chronic diseases, social support, isolation and engagement, and cognitive failures scores. Demographic covariates (namely age, gender, education, marital status, and housing) were collected at baseline (November 2020). Education was measured on a scale from 1 (No formal schooling/primary education) to 4 (University education). Housing was measured on a scale from 1 (1-3-room HDB flat) to 3 (Private Housing), as housing type is commonly used to approximate socioeconomic status because it correlates with income [29].
Perceived Social Support was measured in November 2020, using seven items from the Medical Outcomes Study Social Support Survey [30] (see supplementary Table S1). These items assessed how often participants felt they were supported emotionally (e.g., “someone to confide in or talk to about your problems”) and in their daily provisions (e.g., “someone to prepare meals if you are unable to do so”) on a five-point scale (1 = none of the time, 5 = all the time). A final social support index was derived by adding the scores of all seven items. Perceived social isolation was measured in November 2020 by asking the respondents, “How often do you feel isolated from others?” using a five-point scale (1 = none of the time, 5 = all the time).
Participants’ social engagement was assessed in November 2020 by recording how often they participated in seven different activities over the previous month (see supplementary Table S1). The selection of items was based on the taxonomy of social activities developed by Levasseur, Richard, Gauvin, and Raymond [31], which classifies six levels of participation according to the degree of interaction with others and the activity’s purpose. Responses were rated from 1 (Daily) to 5 (Less than once a month), and these ratings were subsequently recoded to estimate the number of days per week spent on each activity.
Cognitive failures in daily life were measured in March 2021 using the 10-item short form of the Cognitive Failures Questionnaire (CFQ) [32]. The questions addressed common lapses in attention, perception, and memory, such as confusing left and right when giving directions or not noticing desired items in a supermarket (refer to supplementary Table S1). Participants reported how often they experienced each lapse over the past six months on a 5-point scale (1 = very often, 5 = never). The scores were summed, so lower totals reflected more frequent cognitive failures.
Statistical Analyses
Data analysis was conducted using R software (version 4.4.1, R Foundation). K-means cluster modelling (kml) was used to identify distinct cluster trajectories of total ADL and total IADL scores. The kml algorithm (R package kml) is a non-parametric, iterative hill-climbing method that makes no assumptions about the shape of the trajectories[33]. The analysis was specified to allow between 2 and 6 clusters (trajectories), and for each specified number of clusters, the algorithm was run with 1000 different random starts to ensure stability. The optimal number of clusters was identified by maximising the Genolini variant of the Calinski-Harabasz (CH) index [19]. This metric assesses partition quality by calculating the ratio of between-cluster variance to within-cluster variance; a higher value indicates greater cluster separation and compactness. In addition to the CH index, we evaluated the interpretability of the resulting patterns to ensure the identified trajectories were distinct and non-redundant. Baseline comparisons of demographics and scores (ADL, IADL, depression, social support, social isolation, social engagement, CFQ) across clusters were conducted using the Kruskal–Wallis test for continuous variables and Pearson’s Chi-squared or Fisher’s exact tests for categorical variables, as appropriate.
This study employed linear mixed-effect models to investigate the associations between ADL/IADL clusters (categorised as stable, medium, and high) and both ADL/IADL scores and depression scores over time. All models incorporated random effects for respondents to account for individual variability, as well as fixed effects for the ADL/IADL clusters, time, and their interactions. Additionally, the models were adjusted for relevant covariates to enhance the robustness of the findings. The model estimates were obtained using the maximum likelihood method. Lastly, this study employed time-to-event analysis to quantify the risk of increases in depression (≥5-point increases in the total 8-item CES-D score) by cluster. We plotted Kaplan-Meier survival curves for remaining free of a 5-point increase in CES-D score, stratified by cluster, and compared the clusters using log-rank tests. We then fitted Cox proportional hazards models for the ≥5-point outcome, with cluster membership as the main predictor. Three Cox models were run: (i) adjusted for demographics and chronic disease count; (ii) additionally adjusted for social support, isolation, and engagement; (iii) additionally adjusted for CFQ scores. We report hazard ratios (HR) with 95% confidence intervals for each cluster (Medium and High) relative to the Stable cluster reference. To aid interpretation, we also derived median time-to-event estimates from Kaplan-Meier curves within each cluster when appropriate.
3. Results
3.1. Identification of Functional Trajectories
For total ADL scores, the Genolini variant of the Calinski-Harabasz (CH) index reached its maximum value at three clusters, indicating this was the optimal solution (Supplementary Table S2). For total IADL scores, the CH index suggested a four-cluster solution was optimal. However, upon inspection, the fourth cluster did not represent a meaningfully distinct trajectory; it essentially mirrored the stable trajectory of the lowest group, differing only by a marginally higher initial score (see Supplementary Figure S1). Including this fourth cluster would have yielded two redundant “stable” trajectories. To ensure parsimony and interpretability of the resulting patterns, we selected the three-cluster solution for IADL. Thus, the final analysis proceeded with three distinct trajectory groups for both ADL and IADL domains.
3.2. Trajectory Clusters of Functional Decline
While overall ADL and IADL scores increased during the follow-up period (see supplementary Figure S2), we identified three clear patterns of functional change over a 4-year follow-up using k-means longitudinal clustering. We labelled the clusters Stable, Medium (medium increase in functional difficulties over time), and High (the highest increase in functional difficulties over time) based on their patterns (Table 1). The Stable cluster comprised respondents (N = 4,017 for ADL and N = 3,637 for IADL), who maintained consistently low functional difficulty scores across the entire timeline. The Medium cluster (N = 214 for ADL and N = 556 for IADL) comprised participants with moderate functional difficulty who gradually increased over time. Finally, the High cluster had the fewest participants (N = 42 in ADL; N = 80 in IADL), was characterised by higher initial difficulty, and showed a more rapid increase in functional difficulty. Figure 1 shows the mean trajectories of each cluster.
For ADL (Figure 1A), the stable group’s score remained unchanged (β = 0.000, 95% CI = -0.002 to 0.003), while the Medium group started slightly higher and increased steadily in the ADL difficulty score (β = 0.156, 95% CI = 0.145 to 0.166). The High ADL cluster had the highest baseline functional difficulty score (median score of 15, Table 1) and showed the steepest rise (β = 0.195, 95% CI = 0.171 to 0.218). Between-cluster differences in slope were significant: relative to the stable trajectory, both the Medium and High groups showed a significantly faster increase in ADL difficulty scores across timepoints (Medium vs Stable: β’ = 0.155, 95% CI = 0.145 to 0.166; High vs Stable: β’ = 0.194, 95% CI = 0.170 to 0.218). Even between the High versus Medium increase in ADL difficulty clusters, there was a modestly faster increase in ADL difficulty scores in the High group (β’ = 0.039, 95% CI = 0.013 to 0.065), indicating a significantly accelerated increase in the ADL difficulty for the small subset of respondents. A parallel pattern was observed in IADL scores (Figure 1B): the Stable cluster remained unchanged over time, the Medium cluster increased by 0.119 points quarterly, and the High cluster rose by 0.265 points quarterly. In terms of differences in the rate of increase between clusters, both the Medium and High groups showed a significantly faster increase in IADL difficulty scores compared to the Stable group (medium vs stable: β’ = 0.119, 95% CI = 0.109 to 0.129; high vs stable: β’ = 0.264, 95% CI = 0.239 to 0.289). In summary, the k-means clustering model provided meaningful clusters that clearly represented divergent functional ageing paths: one essentially stable, one with a mild increase in functional difficulties, and one with a severe increase in functional difficulties over the four years.
3.3. Sociodemographic and Baseline Characteristics of Trajectory Groups
Participants in the Medium and High clusters differed significantly from those in the Stable cluster across a range of baseline characteristics, as shown in Table 1. The Medium and High ADL and IADL clusters were significantly older (p < 0.001) and had more chronic diseases (p < 0.001) compared to their respective stable groups. Women were more common in the Medium and High IADL clusters (p < 0.001), while gender distribution was similar among the ADL clusters (p = 0.908). Regarding marital status, in the IADL clusters, participants who were separated, divorced, or widowed were disproportionately represented in the Medium/High clusters (IADL p < 0.001). Lower educational levels and smaller HDB housing types were more prevalent in the Medium/High clusters, whereas university education and private housing were predominantly found in the Stable cluster (p < 0.001). Baseline total ADL and IADL difficulty scores were, as expected, significantly higher in the Medium and High clusters for the respective domains (p < 0.001). Psychosocial measures at baseline reflected the same pattern: higher baseline depression and social isolation scores, along with lowered social support and social engagement, characterised the Medium/High clusters in both domains (p < 0.001). Furthermore, those in Medium and High clusters had lower total CFQ scores, suggesting more frequent cognitive failures compared to those in the Stable cluster. Collectively, these patterns reveal a consistent pattern of socioeconomic, psychosocial, and cognitive disadvantages among participants with higher initial ADL and IADL difficulty levels.
3.4. Depression Trajectories by Functional Clusters
While aggregate depression scores declined (see supplementary Figure S3), stratifying by functional difficulty clusters revealed distinct symptom trajectories (Figure 2). The Stable ADL group exhibited a gradual improvement, with 8-item CES-D scores decreasing significantly by 0.047 points per quarter (95% CI = -0.055 to -0.039). In contrast, the Medium ADL cluster experienced a significant rise in depression scores (β = 0.060, 95% CI = 0.026 to 0.094). The High ADL cluster displayed a similar upward trend, though this increase did not reach statistical significance (β = 0.055, 95% CI = -0.022 to 0.132). When compared to the Stable group, both the Medium and High groups showed significantly faster increases in depression scores; the difference in slope was marked for both Medium (β’ = 0.107, 95% CI = 0.072 to 0.142) and the High (β’ = 0.102, 95% CI = 0.025 to 0.179) clusters.
IADL clusters mirrored these patterns (Figure 2B). Depression scores in the Stable IADL group improved over time (β = -0.054, 95% CI = -0.063 to -0.046). Opposing this trend, the Medium and High IADL clusters experienced an upward trend in depression scores, although the increase in the High IADL group was not statistically significant (Medium: β = 0.041, 95% CI = 0.020 to 0.062; High: β = 0.020, 95% CI = -0.035 to 0.075). Nonetheless, differences between groups were apparent, with both the Medium and High IADL groups showing a significantly faster increase in depression scores compared to the Stable group (Medium vs Stable: β’ = 0.095, 95% CI = 0.073 to 0.118; High vs Stable: β’ = 0.074, 95% CI = 0.019 to 0.130). Collectively, these findings demonstrate that older adults with moderate to high functional difficulties follow a diverging mental health path compared to their peers with stable function. While the functionally stable group saw symptom relief over time, those with moderate or high ADL/IADL difficulties experienced a progressive worsening of depressive symptoms.
3.5. Incidence of Depression by Functional Trajectory Group
Time-to-event analyses showed that the incidence of increased depression (an ≥5-point increase in CES-D scores) occurred more frequently and at earlier time points among participants in the High functional difficulty group (Figure 3). Over the 4-year follow-up period, 58.9% of the participants experienced increased depression, as shown in Table 2. Log-rank tests demonstrated that time-to-event (i.e., increased depression) differed significantly between the three clusters in both ADL and IADL (p < 0.001). In the ADL group, the median time to increased depression was 3.0 years for the Stable group, 1.75 years for the Medium group, and 1.0 year for the High group. Additionally, the proportion of respondents experiencing increased depression rose from 57.7% in the Stable group to 76.2% in the Medium group and 83.3% in the High group. Multivariable analyses, adjusted for demographic factors, demonstrated a stepwise increase in hazard: the hazard ratio (HR) was 1.46 (95% CI = 1.24 to 1.71) for the Medium group and 1.82 (95% CI = 1.30 to 2.57) for the High group compared with the Stable group. Additional adjustment for social support, social isolation, social engagement, and cognitive failure scores (Model 3, see Table 2), these associations persisted but were attenuated, with HRs of 1.35 (95% CI = 1.14 to 1.59) for Medium and 1.65 (95% CI = 1.17 to 2.33) for High clusters. These findings indicate that participants in the Medium group experienced a 35% higher rate of a 5-point increase in CES-D depression score than the Stable group during the follow-up period, whereas the High group demonstrated a 65% higher rate.
For IADL, the median time-to-event was 3.0 years in the Stable group, 2.0 years in the Medium group, and 1.5 years in the High group. The percentage of respondents with increased depression scores rose from 57.4% in the Stable group to 66.7% in the Medium group and 73.8% in the High group. Demographic-adjusted multivariable analyses showed a higher hazard of increased depression scores for the Medium (HR=1.21, 95% CI = 1.07 to 1.37) and High (HR=1.38, 95% CI = 1.05 to 1.80) groups. When social factors and cognition were included in the additional adjusted model (model 3, see Table 2), the Medium group still had a significantly increased hazard (HR=1.16, 95% CI = 1.03 to 1.31), whereas the High group’s hazard was elevated but not statistically significant (HR=1.29, 95% CI = 0.98 to 1.70). Overall, poorer functional trajectory, particularly membership in the High cluster, was consistently associated with higher and earlier incident depression.
4. Discussion
This longitudinal study demonstrates a strong association between functional trajectories in older adults and their mental health outcomes. Even moderate increases in ADL and IADL difficulties were associated with a significantly higher hazard of worsening depressive symptoms over four years. In a population of community-dwelling older adults in Singapore, three ADL and IADL patterns were identified: Stable function, Medium increase, and High increase in difficulties. These patterns were determined using the ‘k-means for longitudinal data’ (kml) clustering method. As kml is non-parametric and does not impose linear or polynomial shapes within clusters, it addresses a key methodological limitation of previous studies and allows for data-driven grouping of individual trajectories. Memberships in the Medium and High groups were associated with a significantly increased rate of worsening depressive symptoms. These associations remained after controlling for baseline demographics, chronic diseases, socioeconomic status, social support, isolation, engagement, and cognitive failure scores. This emphasises a dynamic link between physical and mental health in older adults. Moreover, this relationship was stronger for those who reported lower psychosocial and cognitive scores.
Previous research has demonstrated an association between functional impairment and depression. However, our study contributes further by providing more nuanced findings as we include unobserved heterogeneity in late-life disability progression [15,34,35]. While the majority experienced minimal functional change and stable depressive symptoms, a minority exhibited accelerated functional decline accompanied by substantial mental health burdens. In our study, the High ADL cluster showed a 65% higher hazard of experiencing a ≥5-point increase in CES-D scores, while the High IADL cluster exhibited a 29% increase. Similarly, the Medium cluster demonstrated a 35% higher hazard in the ADL group and a 16% higher hazard in the IADL group relative to the Stable profile. This suggests even moderate functional decline may signal worsening mental health. This is consistent with multi-cohort evidence that transitions into ADL/IADL dependency increase the risk of incident depressive symptoms, reinforcing the value of routine functional monitoring that can also address worsening depressive symptoms [36]. Using a data-driven approach, the study identified distinct patterns, showing that even a moderate increase in functional difficulty is associated with increases in depressive symptoms for older adults.
Using Kaplan–Meier methods, we estimated the time to a ≥5-point increase in depressive symptoms across functional-difficulty clusters. The median time to event differed markedly by group (High: 1.0 year; Medium: 1.75 years; Stable: 3.0 years for ADL), indicating that depressive symptoms increased faster for those with greater functional difficulty, even when we adjust for covariates (i.e., age, gender, social support, etc). This pattern aligns with evidence that functional decline and depression are tightly linked over short time scales. Chang et al. (2009) reported an approximately two-fold concurrent increase in depressive symptoms at the time of increased functional difficulty, alongside a non-significant trend toward higher risk over the subsequent six months [37]. Furthermore, yearly panel data indicated a strong contemporaneous effect of disability change on depressive symptoms, with a weaker reverse lag, supporting functional decline as a leading indicator [6]. Taken together, we provide novel evidence that combines both the data-driven functional categories and critical onset points for when depressive symptoms start to increase. This dual focus offers better predictions of worsening depressive symptoms compared to traditional models that may obscure class heterogeneity, thereby reducing the precision of rate-of-change estimates for health outcomes [16,17,18].
Evidently, declining physical function may restrict social activities and participation, resulting in social isolation, which may contribute to depression in later life [22]. In our cohort, those in the Medium and High clusters were more likely to be socially disadvantaged (i.e., lower education, widowed, older, etc), compounding the loss of social support as disability progresses. This finding aligns with the concept of social determinants of health, emphasising how factors such as social isolation and widowhood can directly influence mental health outcomes [38]. Moreover, when we controlled for baseline social support, isolation, and engagement, the hazard ratios for the Medium and High groups attenuated compared to the model adjusted only for demographic variables. This finding is consistent with earlier gerontological research suggesting that perceived social support partially mediates the relationship between functional decline and depressive symptoms, underscoring the role of social pathways [23]. Furthermore, in community cohorts, greater social participation is associated with more favourable functional trajectories, reinforcing the value of social-role preservation alongside functional rehabilitation [15,24]. Finally, this corroborates broader gerontological findings that maintaining social roles and engagement can buffer the psychological impact of functional decline.
These findings have important implications for public health and clinical practice. Importantly, we found a marked increase in depressive symptoms that first emerge approximately one to two years for those with moderate to high levels of functional disability. This points to a critical window period that can influence policy decisions, especially for identifying older individuals with rapid increases in functional difficulties. Policies should prioritise proactive screening or interventions during the early stages of functional decline, rather than responding after disability and depression become entrenched. Geriatric assessments also should integrate functional and mood evaluations concurrently, enabling timely community-based interventions like assistive technologies, psychosocial support, or integrated care models to disrupt depressive trajectories [39].
Policy responses must also address inequalities in vulnerability and access. Our study found that older adults of lower socioeconomic status (i.e., lower educational attainment, residing in smaller housing) are overrepresented in high functional-difficulty trajectories and exhibit higher baseline depressive symptoms. Evidently, functional decline carries disproportionate mental health consequences for these disadvantaged groups. Outreach efforts should therefore prioritise these populations by ensuring equitable access to subsidised home care, mental health services, and chronic disease management[40,41]. Disability prevention strategies should move beyond physical independence alone and incorporate mental health promotion, but these strategies ought to be tailored to meet the specific needs of lower socio-economic strata of older adults.
This study’s strengths include its high-frequency longitudinal design and large sample size, which enabled the detection of fine-grained changes via robust clustering. The use of seventeen time-points over four years enhanced confidence in trajectory classifications compared to studies with fewer observation points. Furthermore, Singapore’s context of a rapidly ageing population, the study uniquely offers insights for other densely populated urban Asian settings. Examining both ADLs and IADLs revealed similar patterns, strengthening the conclusion that functional decline (whether basic or instrumental) is detrimental to mental health [10]. By employing mixed models and survival analysis with covariate adjustment, we were able to isolate the effects of functional trajectories while controlling for confounders.
Several limitations merit consideration. First, the cohort consisted of older adults in Singapore who were relatively young-old (median age: early 60s) and community-dwelling at baseline. There is also potential selection bias due to mortality and attrition, this likely removed individuals with the steepest health declines. Thus, the generalisability to other frail or disabled populations, institutionalised older adults, or other cultural settings is limited. Future research could validate these patterns in diverse populations and geographic settings to identify context-specific modifiers. Second, ADL and IADL difficulties were self-reported; while its frequency gives good temporal resolution, it may introduce reporting bias. Future work could integrate wearable activity data to validate self-reports and enhance accuracy. Third, the method we used herein cannot account for causality, meaning depressive symptoms can predict subsequent deterioration in function, but that functional disability could also lead to increases in depressive symptoms [42,43]. While our analysis establishes a temporal sequence, this complex feedback loop should be accounted for in future studies using cross-lagged models. Finally, methodological choices in clustering (e.g., selecting three clusters for IADL despite a Calinski-Harabasz score favouring four) and the small sample size of the most impaired group (e.g., the High ADL cluster, n=42) could affect the stability of the estimates. Replicating the analysis with a larger sample size and alternative longitudinal clustering paradigms (such as shape-aware dynamic time warping using the dtwclust package [44]) would help validate and expand on these findings.
5. Conclusions
In a rapidly ageing society, promoting healthy ageing requires addressing both physical and mental dimensions. This study demonstrates that older adults followed distinct ADL and IADL trajectory pathways, and that those on trajectories of greater functional difficulty face a significantly higher risk of worsening depression within about one to two-year period. By using a novel clustering approach, we identified high-risk groups without imposing preconceived model shapes, providing a data-driven perspective on how functional decline unfolds in older adults. Preventing depression in later life may therefore require a dual focus on mental health and functional ability. Early rehabilitation and supportive services for individuals with accelerating ADL and IADL impairments represent a viable strategy to reduce the burden of late-life depression. However, given the shrinking family structures and the declining availability of home-based caregivers, relying solely on traditional family support is increasingly unsustainable. Consequently, there is an urgent need to leverage technologies, ranging from smart home automation and digital assistive tools that support daily tasks to wearable sensors for early detection, to help older adults compensate for functional deficits and bridge the care gap. Ultimately, recognising and addressing emerging functional difficulties is not only vital for preserving independence but serves as a key component of depression prevention in ageing societies.
Supplementary Materials
The following supporting information can be downloaded at: Preprints.org, Table S1. Measurement items; Table S2. Calinski-Harabatsz scores for determining optimal cluster count (ADL and IADL trajectories); Figure S1. Trajectories of total IADL scores by three clusters and four clusters; Figure S2. Overall trajectories of functional difficulty scores (ADL and IADL); Figure S3. Overall trajectories of depression scores over 17 observation points (2020-2024).
Author Contributions
Conceptualisation, K.H.T.S. and P.S.; formal analysis, K.H.T.S.; data curation, K.H.T.S.; writing—original draft review and editing, K.H.T.S., Y.W.T., G.C., P.S. All authors have read and agreed to the published version of the manuscript.
Funding
This research was funded by The Ngee Ann Kongsi and the Ministry of Education through its Academic Research Fund Tier 3 (Award reference number MOE2019-T3-1-006). The opinions, funding, conclusions, or recommendations in this paper are solely those of the authors and do not represent the views of the funding organisations.
Institutional Review Board Statement
The study was conducted according to the guidelines of the Declaration of Helsinki and approved by the Institutional Review Board of Singapore Management University (IRB-20-080-A052(720)).
Informed Consent Statement
Informed consent was obtained from all subjects involved in this study.
Data Availability Statement
As the SLP is an ongoing study, the data are not publicly available and are stored under an independent server managed by SMU. Access may be granted only through specific requests to rosa@smu.edu.sg.
Conflicts of Interest
The author declares that this study received funding from the Ngee Ann Kongsi and by the Singapore Ministry of Education. The funders were not involved in the study design, collection, analysis, interpretation of data, the writing of this article or the decision to submit it for publication.
Abbreviations
The following abbreviations are used in this manuscript:
| WiSE | Well-being of Singapore Elderly |
| ADLs | Activities of daily living |
| IADLs | Instrumental activities of daily living |
| LCGA | Latent Class Growth Analysis |
| GBTM | Group-Based Trajectory Models |
| kml | k-means for longitudinal data |
| SLP | Singapore Life Panel® |
| CES-D | Centre for Epidemiologic Studies-Depression Scale |
| CFQ | Cognitive Failures Questionnaire |
| CH | Calinski-Harabasz |
| CI | Confidence Interval |
| HDB | Housing & Development Board |
References
- Longevity. Available online: https://www.population.gov.sg/our-population/population-trends/longevity/ (accessed on 2 October 2025).
- AshaRani, P.V.; Abdin, E.; Roystonn, K.; Devi, F.; Wang, P.; Shafie, S.; Sagayadevan, V.; Jeyagurunathan, A.; Chua, B.Y.; Tan, B.; et al. Tracking the Prevalence of Depression Among Older Adults in Singapore: Results From the Second Wave of the Well-Being of Singapore Elderly Study. Depression and Anxiety 2025, 2025, 9071391. [Google Scholar] [CrossRef]
- Neo, J.W.; Guo, X.Y.; Abdin, E.; Vaingankar, J.A.; Chong, S.A.; Subramaniam, M.; Chen, C. Excess Costs of Depression among a Population-Based Older Adults with Chronic Diseases in Singapore. BMC Public Health 2024, 24, 3119. [Google Scholar] [CrossRef]
- Singapore’s Old-Age Support Ratio Nearly Halves in 10 Years, but Foreign Workforce Provides Buffer: MOM - The Business Times. Available online: https://www.businesstimes.com.sg/singapore/singapores-old-age-support-ratio-nearly-halves-10-years-foreign-workforce-provides-buffer-mom (accessed on 16 January 2026).
- Proportion of One-Person Homes up amid Shrinking Household Sizes: HDB Survey - CNA. Available online: https://www.channelnewsasia.com/singapore/proportion-one-person-homes-up-shrinking-household-sizes-hdb-survey-5491071 (accessed on 16 January 2026).
- Ormel, J.; Rijsdijk, F.V.; Sullivan, M.; van Sonderen, E.; Kempen, G.I.J.M. Temporal and Reciprocal Relationship between IADL/ADL Disability and Depressive Symptoms in Late Life. J Gerontol B Psychol Sci Soc Sci 2002, 57, P338–347. [Google Scholar] [CrossRef]
- Wang, J.; Luo, N.; Sun, Y.; Bai, R.; Li, X.; Liu, L.; Wu, H.; Liu, L. Exploring the Reciprocal Relationship between Activities of Daily Living Disability and Depressive Symptoms among Middle-Aged and Older Chinese People: A Four-Wave, Cross-Lagged Model. BMC Public Health 2023, 23, 1180. [Google Scholar] [CrossRef]
- Ahn, S.; Visaria, A.; Malhotra, R.; Chan, A. GENDER DIFFERENCES IN DEPRESSIVE SYMPTOMS’ IMPACT ON CHRONIC DISEASES, FUNCTIONAL LIMITATIONS, AND MORTALITY. Innov Aging 2024, 8, 1247. [Google Scholar] [CrossRef]
- Nyunt, M.S.Z.; Lim, M.L.; Yap, K.B.; Ng, T.P. Changes in Depressive Symptoms and Functional Disability among Community-Dwelling Depressive Older Adults. International Psychogeriatrics 2012, 24, 1633–1641. [Google Scholar] [CrossRef]
- Edjolo, A.; Dartigues, J.-F.; Pérès, K.; Proust-Lima, C. Heterogeneous Long-Term Trajectories of Dependency in Older Adults: The PAQUID Cohort, a Population-Based Study over 22 Years. J Gerontol A Biol Sci Med Sci 2020, 75, 2396–2403. [Google Scholar] [CrossRef] [PubMed]
- Saito, J.; Murayama, H.; Ueno, T.; Saito, M.; Haseda, M.; Saito, T.; Kondo, K.; Kondo, N. Functional Disability Trajectories at the End of Life among Japanese Older Adults: Findings from the Japan Gerontological Evaluation Study (JAGES). Age Ageing 2022, 51, afac260. [Google Scholar] [CrossRef] [PubMed]
- Han, L.; Allore, H.; Murphy, T.; Gill, T.; Peduzzi, P.; Lin, H. Dynamics of Functional Aging Based on Latent-Class Trajectories of Activities of Daily Living. Ann Epidemiol 2013, 23, 87–92. [Google Scholar] [CrossRef]
- Osawa, Y.; Abe, Y.; Takayama, M.; Arai, Y. Six-Year Transition Patterns of Activities of Daily Living in Octogenarians: Tokyo Oldest Old in Total Health Study. BMC Geriatrics 2025, 25, 638. [Google Scholar] [CrossRef]
- Gill, T.M.; Allore, H.G.; Gahbauer, E.A.; Murphy, T.E. Change in Disability after Hospitalization or Restricted Activity in Older Persons. JAMA 2010, 304, 1919–1928. [Google Scholar] [CrossRef] [PubMed]
- Wen, C.; Sun, S.; Huang, L.; Guo, Y.; Shi, Y.; Qi, S.; Ding, G.; Wen, Z.; Wang, J.; Ruan, Y.; et al. Effect of Social Participation on the Trajectories of Activities of Daily Living Disability among Community-Dwelling Older Adults: A 7-Year Community-Based Cohort. Aging Clin Exp Res 2024, 36, 104. [Google Scholar] [CrossRef]
- Mésidor, M.; Rousseau, M.-C.; O’Loughlin, J.; Sylvestre, M.-P. Does Group-Based Trajectory Modeling Estimate Spurious Trajectories? BMC Med Res Methodol 2022, 22, 194. [Google Scholar] [CrossRef]
- Peristera, P.; Platts, L.G.; Magnusson Hanson, L.L.; Westerlund, H. A Comparison of the B-Spline Group-Based Trajectory Model with the Polynomial Group-Based Trajectory Model for Identifying Trajectories of Depressive Symptoms around Old-Age Retirement. Aging Ment Health 2020, 24, 445–452. [Google Scholar] [CrossRef]
- Hickson, R.P.; Annis, I.E.; Killeya-Jones, L.A.; Fang, G. Opening the Black Box of the Group-Based Trajectory Modeling Process to Analyze Medication Adherence Patterns: An Example Using Real-World Statin Adherence Data. Pharmacoepidemiol Drug Saf 2020, 29, 357–362. [Google Scholar] [CrossRef]
- Genolini, C.; Alacoque, X.; Sentenac, M.; Arnaud, C. Kml and Kml3d: R Packages to Cluster Longitudinal Data. J. Stat. Soft. 2015, 65. [Google Scholar] [CrossRef]
- Mullin, S.; Zola, J.; Lee, R.; Hu, J.; MacKenzie, B.; Brickman, A.; Anaya, G.; Sinha, S.; Li, A.; Elkin, P.L. Longitudinal K-Means Approaches to Clustering and Analyzing EHR Opioid Use Trajectories for Clinical Subtypes. J Biomed Inform 2021, 122, 103889. [Google Scholar] [CrossRef] [PubMed]
- Demnitz, N.; Anatürk, M.; Allan, C.L.; Filippini, N.; Griffanti, L.; Mackay, C.E.; Mahmood, A.; Sexton, C.E.; Suri, S.; Topiwala, A.G.; et al. Association of Trajectories of Depressive Symptoms with Vascular Risk, Cognitive Function and Adverse Brain Outcomes: The Whitehall II MRI Sub-Study. J Psychiatr Res 2020, 131, 85–93. [Google Scholar] [CrossRef]
- Noguchi, T.; Saito, M.; Aida, J.; Cable, N.; Tsuji, T.; Koyama, S.; Ikeda, T.; Osaka, K.; Kondo, K. Association between Social Isolation and Depression Onset among Older Adults: A Cross-National Longitudinal Study in England and Japan. BMJ Open 2021, 11, e045834. [Google Scholar] [CrossRef]
- Balqis-Ali, N.Z.; Fun, W.H. Social Support in Maintaining Mental Health and Quality of Life among Community-Dwelling Older People with Functional Limitations in Malaysia: A Population-Based Cross-Sectional Study. BMJ Open 2024, 14, e077046. [Google Scholar] [CrossRef]
- Xu, J.; Xu, J.; Chen, Y.; Wang, Y.; Qin, G.; Gao, J. Associations between Trajectories of Social Participation and Functional Ability among Older Adults: Results from the China Health and Retirement Longitudinal Study. Front Public Health 2022, 10, 1047105. [Google Scholar] [CrossRef]
- Yang, J.; Zhang, Y.; Shen, S.; Yu, H.; Yang, L.; Zhao, Y.; Xiong, Y.; Su, J.; Wang, L.; Lei, X. Instrumental Activities of Daily Living Trajectories and Risk of Mild Cognitive Impairment among Chinese Older Adults: Results of the Chinese Longitudinal Healthy Longevity Survey, 2002–2018. Front. Public Health 2023, 11. [Google Scholar] [CrossRef]
- Vaithianathan, R.; Hool, B.; Hurd, M.D.; Rohwedder, S. High-Frequency Internet Survey of a Probability Sample of Older Singaporeans: The Singapore Life Panel®. The Singapore Economic Review 2021, 66, 1759–1778. [Google Scholar] [CrossRef]
- Van de Velde, S.; Levecque, K.; Bracke, P. Measurement Equivalence of the CES-D 8 in the General Population in Belgium: A Gender Perspective. Arch Public Health 2009, 67, 15. [Google Scholar] [CrossRef]
- Su, L.; Wu, X.; Lin, N.; Xie, X.; Cai, M.; Wang, M.; Zheng, L.; Xu, L. Different Cutoff Values for Increased Nuchal Translucency in First-Trimester Screening to Predict Fetal Chromosomal Abnormalities. Int J Gen Med 2021, 14, 8437–8443. [Google Scholar] [CrossRef]
- Ng, C.W.; Tan, W.S.; Gunapal, P.P.; Wong, L.Y.; Heng, B.H. Association of Socioeconomic Status (SES) and Social Support with Depressive Symptoms among the Elderly in Singapore. Ann Acad Med Singap 2014, 43, 576–587. [Google Scholar] [CrossRef]
- Sherbourne, C.D.; Stewart, A.L. The MOS Social Support Survey. Social science & medicine 1991, 32, 705–714. [Google Scholar]
- Levasseur, M.; Richard, L.; Gauvin, L.; Raymond, É. Inventory and Analysis of Definitions of Social Participation Found in the Aging Literature: Proposed Taxonomy of Social Activities. Social science & medicine 2010, 71, 2141–2149. [Google Scholar]
- Broadbent, D.E.; Cooper, P.F.; FitzGerald, P.; Parkes, K.R. The Cognitive Failures Questionnaire (CFQ) and Its Correlates. British journal of clinical psychology 1982, 21, 1–16. [Google Scholar] [CrossRef] [PubMed]
- Genolini, C.; Falissard, B. KmL: K-Means for Longitudinal Data. Computational Statistics 2010, 25, 317–328. [Google Scholar] [CrossRef]
- Milton-Cole, R.; Ayis, S.; O’Connell, M.D.L.; Smith, T.; Sheehan, K.J. Trajectories of Depressive Symptoms Among Older Adults and in Adults With Hip Fracture: Analysis From the English Longitudinal Study of Ageing. J Gerontol A Biol Sci Med Sci 2022, 77, 2453–2458. [Google Scholar] [CrossRef]
- Zhang, T.; Li, S.; Zhu, Z.; Sha, K.; Liu, Y. The Effect of Cognitive Function Heterogeneity on Depression Risk in Older Adults: A Stratified Analysis Based on Functional Status. Front. Public Health 2025, 13. [Google Scholar] [CrossRef]
- Yang, J.; Song, G.; Zhang, M.; Liu, H.; Hou, M. Changes in Daily Living Dependency and Incident Depressive Symptoms among Older Individuals: Findings from Four Prospective Cohort Studies. BMJ Ment Health 2025, 28, e301749. [Google Scholar] [CrossRef]
- Chang, M.; Phillips, C.; Coppin, A.K.; van der Linden, M.; Ferrucci, L.; Fried, L.; Guralnik, J.M. An Association between Incident Disability and Depressive Symptoms over 3 Years of Follow-up among Older Women. Aging Clin Exp Res 2009, 21, 191–197. [Google Scholar] [CrossRef]
- Blanner Kristiansen, C.; Kjær, J.N.; Hjorth, P.; Andersen, K.; Prina, A.M. Prevalence of Common Mental Disorders in Widowhood: A Systematic Review and Meta-Analysis. J Affect Disord 2019, 245, 1016–1023. [Google Scholar] [CrossRef]
- Ernst, J.; Zwinge, E.; König, M. The Relationship between Home Modifications and Frailty among Older Adults: A Scoping Review Protocol. PLOS ONE 2025, 20, e0335822. [Google Scholar] [CrossRef] [PubMed]
- Szanton, S.L.; Xue, Q.-L.; Leff, B.; Guralnik, J.; Wolff, J.L.; Tanner, E.K.; Boyd, C.; Thorpe, R.J.; Bishai, D.; Gitlin, L.N. Effect of a Biobehavioral Environmental Approach on Disability Among Low-Income Older Adults. JAMA Intern Med 2019, 179, 204–211. [Google Scholar] [CrossRef]
- Unützer, J.; Park, M. Strategies to Improve the Management of Depression in Primary Care. Prim Care 2012, 39, 415–431. [Google Scholar] [CrossRef] [PubMed]
- Sun, M.; Sun, X.; Zhang, H.; Jiang, X.; Wang, X.; Zhang, Q. The Vicious Cycle of Depressive Symptoms and Disability in Older Adults. J Nutr Health Aging 2025, 29, 100649. [Google Scholar] [CrossRef]
- Yan, W.; Wang, L.; Li, C.; Meng, Y.; Guo, Q.; Li, H. Bidirectional Association between ADL Disability and Depressive Symptoms among Older Adults: Longitudinal Evidence from CHARLS. Sci Rep 2025, 15, 7125. [Google Scholar] [CrossRef] [PubMed]
- Sardá-Espinosa, A. Time-Series Clustering in R Using the Dtwclust Package. The R Journal 2019, 11, 22–43. [Google Scholar] [CrossRef]
Figure 1.
Trajectories of functional difficulty by cluster group. Estimated mean ADL difficulty score (A) and IADL difficulty score (B) with 95% CI are stratified by functional trajectory clusters identified via kml (red = Stable, blue = Medium increase in functional difficulty, green = High increase in functional difficulty). β coefficients with 95% CIs are derived from linear mixed-effect models adjusted for age, gender, education, housing, marital status, number of chronic diseases, social support, isolation and engagement, and cognitive failures scores. Interpretation: Within each cluster, β represents the increase in functional difficulty over time for either ADL or IADL. Between clusters, β’ represents the difference in the rate of change in ADL or IADL scores between the High/Medium cluster and the Stable cluster. ** p<0.01, *** p<0.001, n.s: not significant. ADLs = Activities of Daily Living, IADLs = Instrumental Activities of Daily Living, CI = Confidence Interval.
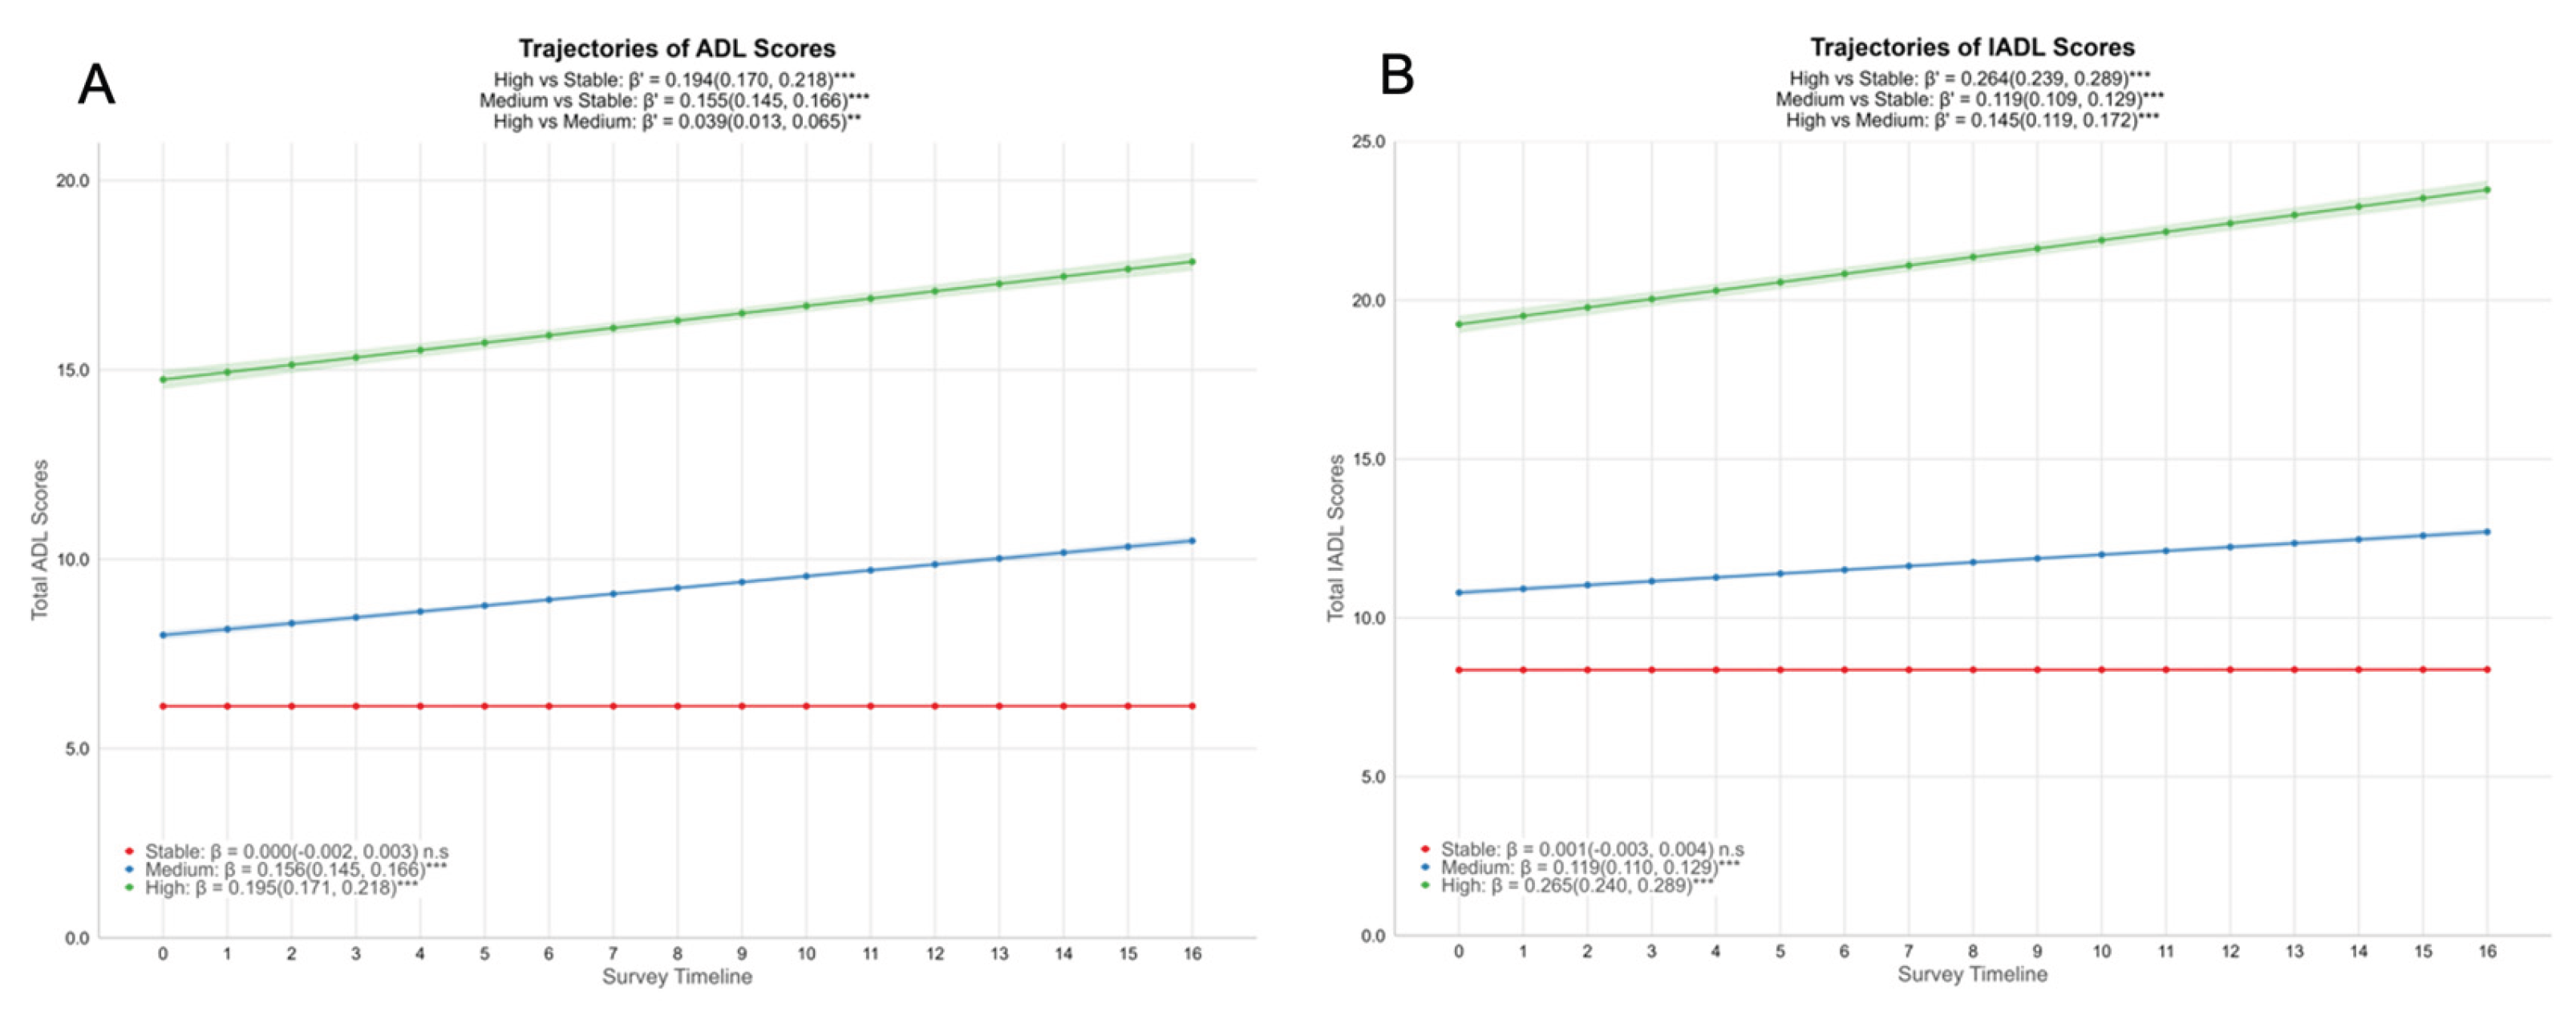
Figure 2.
Associations between functional difficulty trajectory clusters and depression scores of the participants. Estimated mean depression scores by ADL difficulty clusters (A) and IADL difficulty clusters (B) with 95% CI are stratified by functional trajectory clusters identified via kml (red = Stable, blue = Medium increase in functional difficulty, green = High increase in functional difficulty). β coefficients with 95% CIs are derived from linear mixed-effect models adjusted for age, gender, education, housing, marital status, number of chronic diseases, social support, isolation and engagement, and cognitive failures scores. Interpretation: Within each cluster, β represents the increase in depression scores over time for either ADL clusters or IADL clusters. Between clusters, β’ represents the difference in the rate of change in depression scores between the High/Medium cluster and the Stable cluster. ** p<0.01, *** p<0.001, n.s: not significant. ADLs = Activities of Daily Living, IADLs = Instrumental Activities of Daily Living, CI = Confidence Interval.
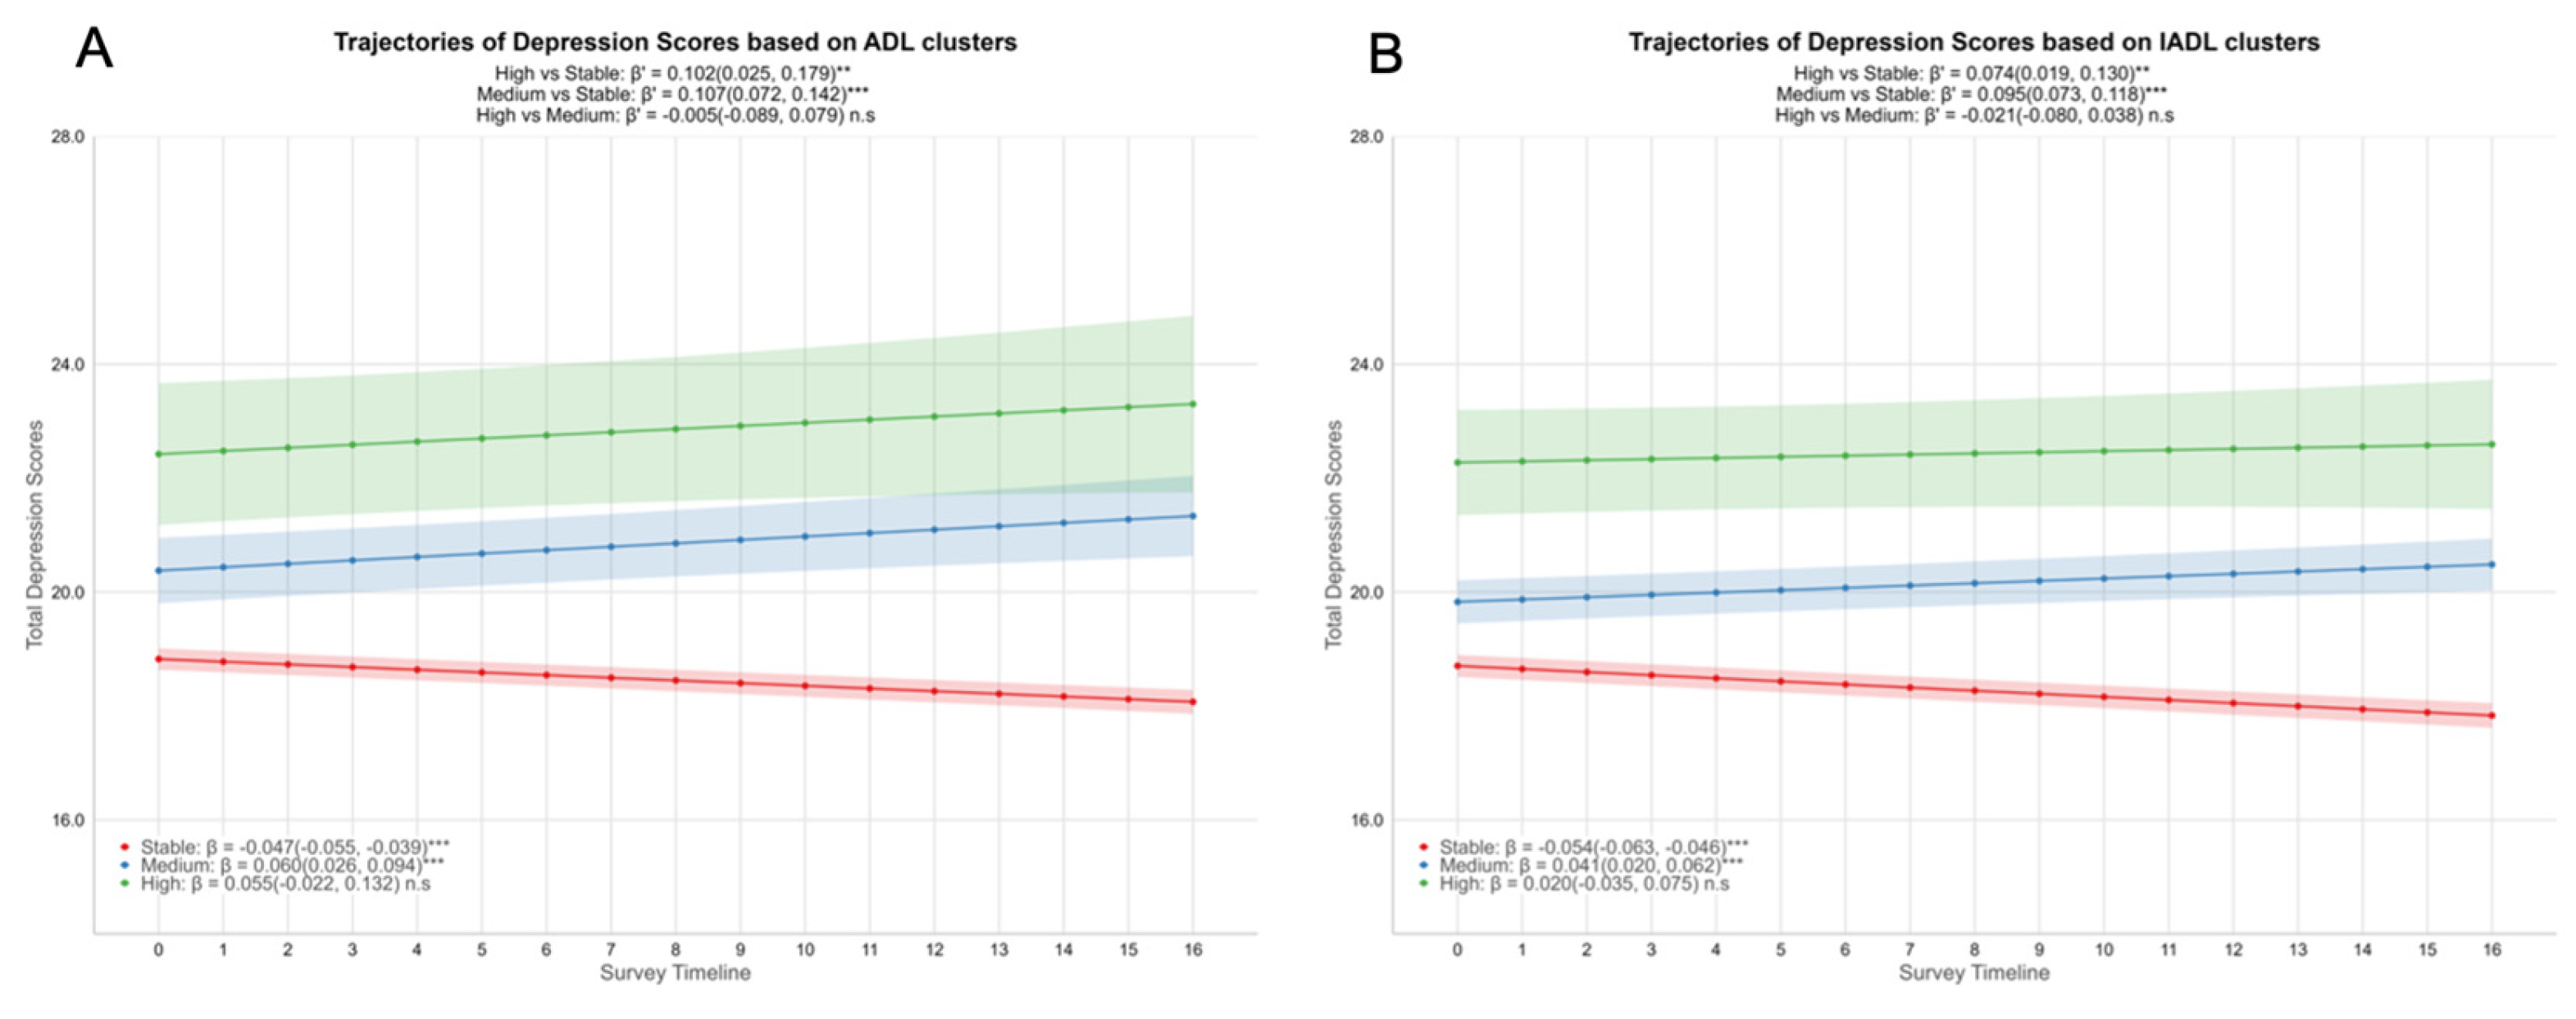
Figure 3.
Kaplan-Meier estimates of time to worsening depressive symptoms by functional trajectory clusters. Plots show the probability of remaining free from increased depression (defined as a ≥5-point rise in 8-item CES-D scores from baseline) stratified by ADL (A) or IADL (B) difficulty trajectory clusters. The Stable cluster (red) maintained the highest survival probability, while Medium (blue) and High (green) clusters exhibited steeper declines, indicating earlier and more frequent worsening of depression. The median time to event occurred significantly earlier for the Medium and High clusters (approximately 1.6 years) compared to the Stable cluster (3 years).
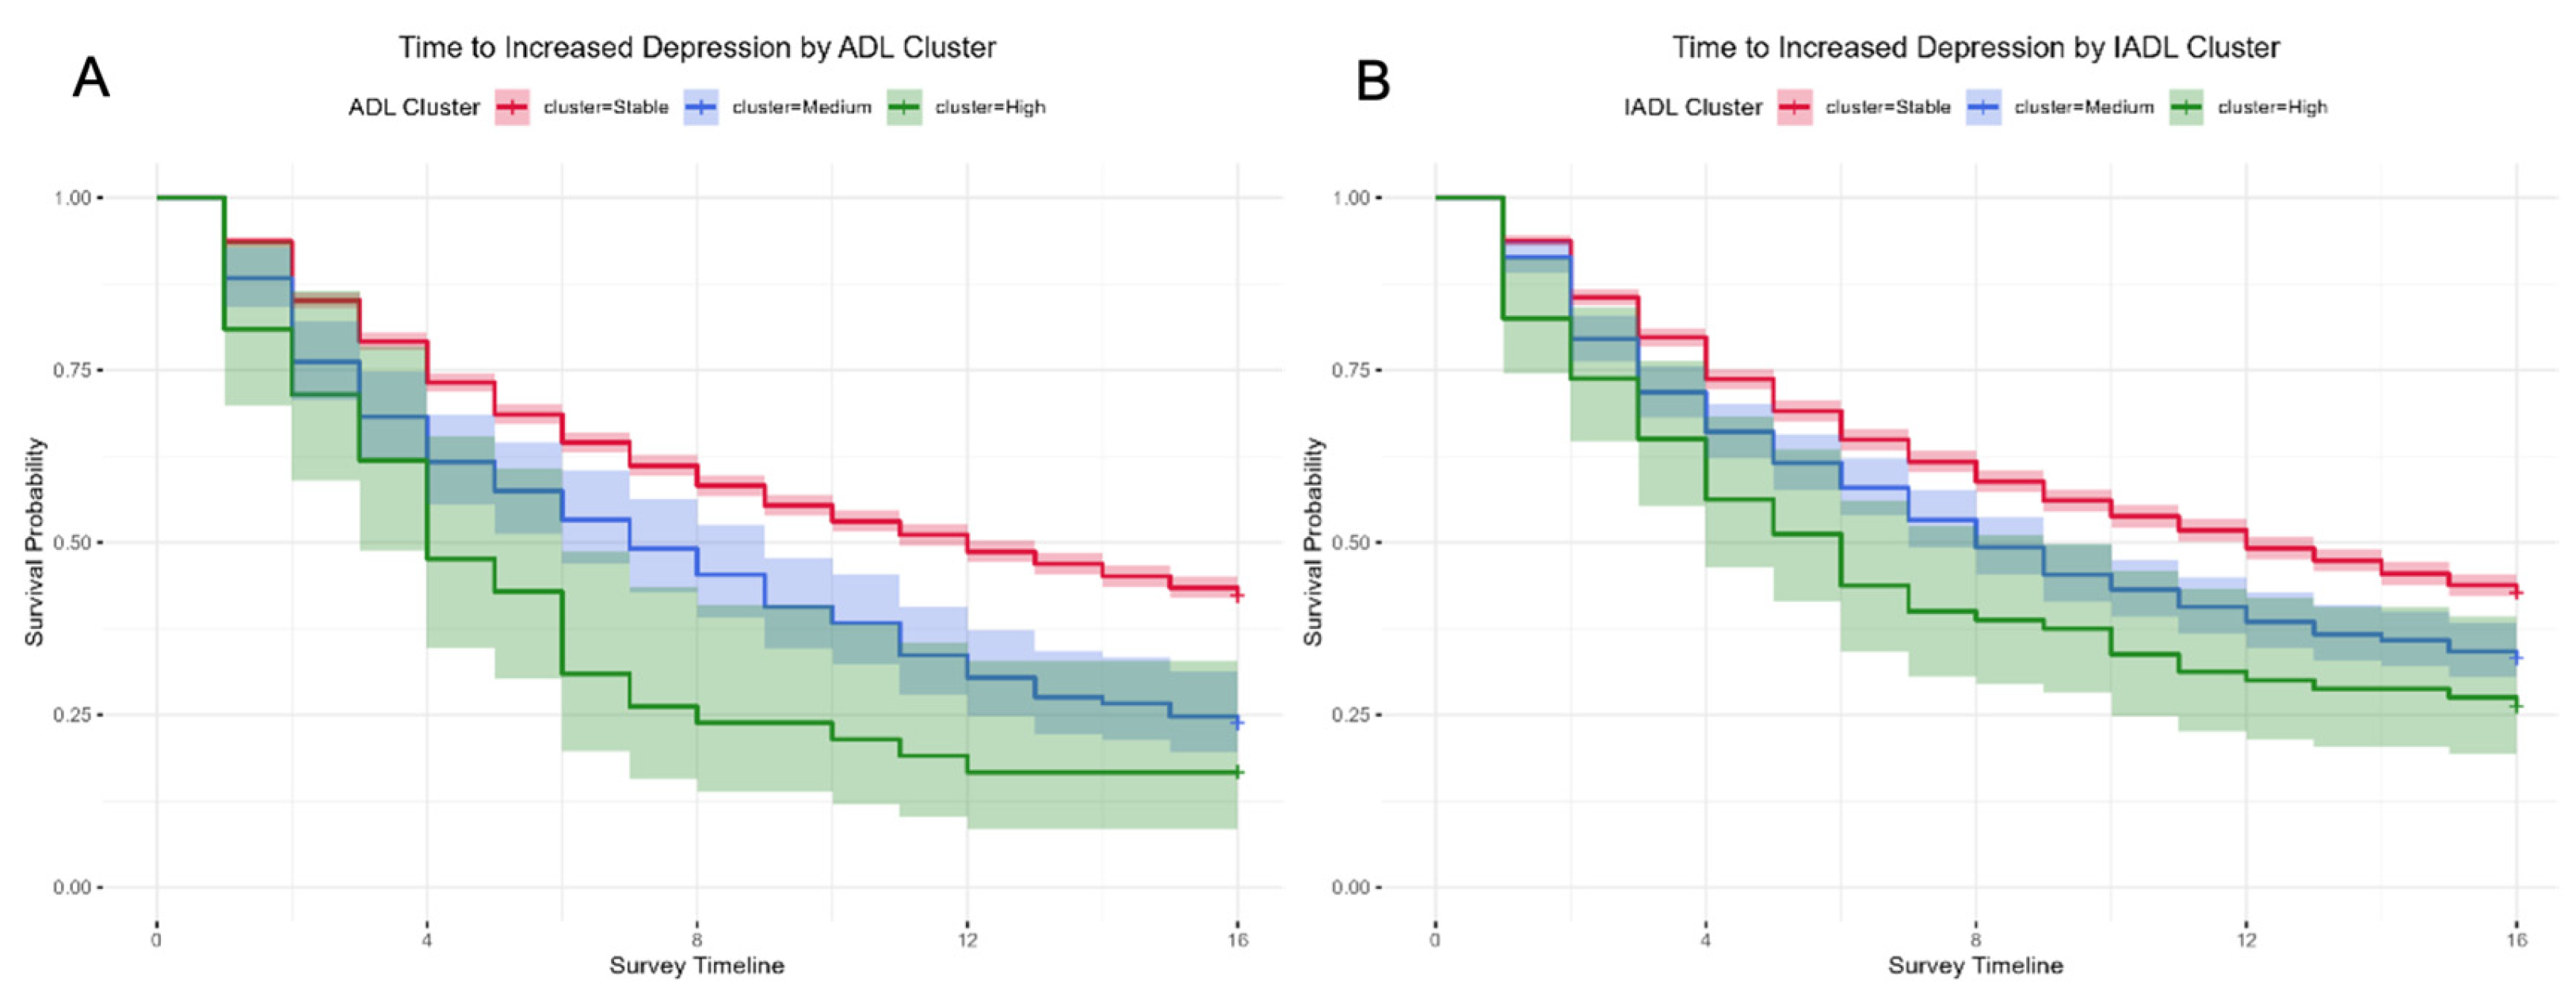

Table 1.
Demographic characteristics of ADL and IADL clusters at baseline.
| Characteristic | ADL Cluster | p-value2 | IADL Cluster | p-value2 | ||||
| Stable | Medium | High | Stable | Medium | High | |||
| N = 4,0171 | N = 2141 | N = 421 | N = 3,6371 | N = 5561 | N = 801 | |||
| Baseline Age | 63 (59, 68) | 66 (62, 72)α | 70 (62, 74) α | <0.001 | 63 (59, 67) | 68 (63, 72) α | 71 (65, 75) α,† | <0.001 |
| Gender | 0.909 | <0.001 | ||||||
| Male | 1,919 (94.2%) | 100 (4.9%) | 19 (0.9%) | 1,791 (87.9%) | 214 (10.5%) | 33 (1.6%) | ||
| Female | 2,098 (93.9%) | 114 (5.1%) | 23 (1.0%) | 1,846 (82.6%) | 342 (15.3%) | 47 (2.1%) | ||
| Marital Status | 0.081 | <0.001 | ||||||
| Married | 3,234 (94.3%) | 164 (4.8%) | 33 (1.0%) | 2,965 (86.4%) | 412 (12.0%) | 54 (1.6%) | ||
| Single | 370 (95.1%) | 15 (3.9%) | 4 (1.0%) | 343 (88.2%) | 37 (9.5%) | 9 (2.3%) | ||
| Separated/Divorced/Widowed | 413 (91.2%) | 35 (7.7%) | 5 (1.1%) | 329 (72.6%) | 107 (23.6%) | 17 (3.8%) | ||
| Education | <0.001 | <0.001 | ||||||
| No/Primary | 1,213 (88.9%) | 124 (9.1%) | 27 (2.0%) | 932 (68.3%) | 374 (27.4%) | 58 (4.3%) | ||
| Secondary | 1,116 (96.0%) | 41 (3.5%) | 6 (0.5%) | 1,055 (90.7%) | 98 (8.4%) | 10 (0.9%) | ||
| Post-Secondary | 944 (95.9%) | 36 (3.7%) | 4 (0.4%) | 912 (92.7%) | 65 (6.6%) | 7 (0.7%) | ||
| University | 744 (97.6%) | 13 (1.7%) | 5 (0.7%) | 738 (96.9%) | 19 (2.5%) | 5 (0.7%) | ||
| Housing | <0.001 | <0.001 | ||||||
| 1-3 room HDB | 689 (89.2%) | 65 (8.4%) | 18 (2.3%) | 569 (73.7%) | 170 (22.0%) | 33 (4.3%) | ||
| 4-5 room HDB | 2,406 (94.3%) | 128 (5.0%) | 18 (0.7%) | 2,182 (85.5%) | 333 (13.0%) | 37 (1.4%) | ||
| Private Housing | 922 (97.2%) | 21 (2.2%) | 6 (0.6%) | 886 (93.4%) | 53 (5.6%) | 10 (1.1%) | ||
| Number of Chronic Diseases | 1 (0, 2) | 2 (1, 3) α | 3 (2, 4) α,† | <0.001 | 1 (0, 2) | 2 (1, 3) α | 3 (2, 4) α,† | <0.001 |
| Baseline ADL Scores | 6 (6, 6) | 7 (6, 10) α | 15 (12, 18) α,† | <0.001 | 6 (6, 6) | 6 (6, 7) α | 11 (6, 15) α,† | <0.001 |
| Baseline IADL Scores | 8 (8, 9) | 11 (8, 15) α | 23 (18, 27) α,† | <0.001 | 8 (8, 8) | 11 (9, 12) α | 19 (15, 24) α,† | <0.001 |
| Baseline Total Depression Scores | 19.0 (15.0, 23.0) | 25.0 (20.0, 29.0) α | 29.0 (25.0, 33.0) α,† | <0.001 | 19.0 (15.0, 23.0) | 22.0 (18.0, 27.0) α | 27.0 (23.0, 32.0) α,† | <0.001 |
| Baseline Social Support Scores | 26.0 (21.0, 29.0) | 21.0 (18.0, 27.0) α | 22.0 (17.0, 28.0) α | <0.001 | 26.0 (21.0, 29.0) | 23.0 (20.0, 28.0) α | 23.0 (17.0, 28.0) α | <0.001 |
| Baseline Social Isolation Scores | 2.0 (1.0, 3.0) | 3.0 (2.0, 3.0) α | 3.0 (3.0, 4.0) α,† | <0.001 | 2.0 (1.0, 3.0) | 2.0 (2.0, 3.0) α | 3.0 (2.0, 4.0) α,† | <0.001 |
| Baseline Social Engagement Scores | 0.9 (0.3, 1.6) | 0.5 (0.1, 1.0) α | 0.1 (0.0, 1.0) α | <0.001 | 0.9 (0.3, 1.6) | 0.6 (0.1, 1.3) α | 0.1 (0.0, 0.9) α,† | <0.001 |
| Baseline Total CFQ scores | 38.0 (33.0, 42.0) | 33.0 (30.0, 39.0) α | 30.0 (23.0, 37.0) α | <0.001 | 38.0 (33.0, 42.0) | 35.0 (30.0, 40.0) α | 30.0 (24.0, 39.0) α,† | <0.001 |
ADLs = Activities of Daily Living, CFQ = Cognitive Failures Questionnaire, HDB = Housing & Development Board, IADLs = Instrumental Activities of Daily Living. 1 Median (Q1, Q3); n (%), 2 Kruskal-Wallis rank sum test; Pearson’s Chi-squared test; Fisher’s exact test. α Significantly different from Stable cluster, † Significantly different from Medium clusters.
Table 2.
Association of functional trajectory clusters with hazard of worsening depressive symptoms (Cox proportional hazards regression). Values represent Hazard Ratios (HR) and 95% CI for experiencing a (≥5-point) increase in total CES-D depression score in those in Medium and High clusters relative to the Stable cluster (reference). Model 1 is adjusted for baseline demographics (age, gender, education, housing, marital status, and number of chronic diseases). Model 2 adds social factors (baseline social support, social isolation and social engagement). Model 3 adds cognitive factors (baseline cognitive failure scores). Event rates (% of participants with outcome within each cluster) and median time-to-event (in waves) are provided for context. Participants in Medium or High clusters showed an increased hazard of depression worsening in all models.
| Cluster | Hazard Ratio (95% CI) | Outcome; overall event rate | Log-rank p-value | Median Time (Waves) | Event Rate | ||
| ADL | Model 1 | Stable | 1 | Depression increased by 5 points or more; 58.9% event rate | <0.001 | 12 (3.0 years) | 57.7% |
| Medium | 1.46 (1.24, 1.71) *** | 7 (1.75 years) | 76.2% | ||||
| High | 1.82 (1.30, 2.57) *** | 4 (1.0 years) | 83.3% | ||||
| Model 2 | Stable | 1 | |||||
| Medium | 1.31 (1.11,1.55) ** | ||||||
| High | 1.57 (1.11, 2.22) ** | ||||||
| Model 3 | Stable | 1 | |||||
| Medium | 1.35 (1.14, 1.59) *** | ||||||
| High | 1.65 (1.17, 2.33) ** | ||||||
| IADL | Model 1 | Stable | 1 | Depression increased by 5 points or more; 58.9% event rate | <0.001 | 12 (3.0 years) | 57.4% |
| Medium | 1.21 (1.07, 1.37) ** | 8 (2.0 years) | 66.7% | ||||
| High | 1.38 (1.05, 1.80) * | 6 (1.5 years) | 73.8% | ||||
| Model 2 | Stable | 1 | |||||
| Medium | 1.13 (1.00, 1.28) * | ||||||
| High | 1.21 (0.92, 1.59) | ||||||
| Model 3 | Stable | 1 | |||||
| Medium | 1.16 (1.03, 1.31) * | ||||||
| High | 1.29 (0.98, 1.70) |
* p<0.05, ** p<0.01, *** p<0.001. ADLs = Activities of Daily Living, IADLs = Instrumental Activities of Daily Living.
Disclaimer/Publisher’s Note: The statements, opinions and data contained in all publications are solely those of the individual author(s) and contributor(s) and not of MDPI and/or the editor(s). MDPI and/or the editor(s) disclaim responsibility for any injury to people or property resulting from any ideas, methods, instructions or products referred to in the content. |
© 2026 by the authors. Licensee MDPI, Basel, Switzerland. This article is an open access article distributed under the terms and conditions of the Creative Commons Attribution (CC BY) license (http://creativecommons.org/licenses/by/4.0/).
Copyright: This open access article is published under a Creative Commons CC BY 4.0 license, which permit the free download, distribution, and reuse, provided that the author and preprint are cited in any reuse.


