
Submitted:
17 January 2026
Posted:
22 January 2026
You are already at the latest version
Abstract
Uncertainty related to climate, energy, and trade impacts the magnitude of economic activity, owing to their evolving attributes. This study introduces a novel CEEMDAN-based multivariate Nyström quantile-on-quantile (C-MN-QQKRLS) methodology to evaluate the relationship of the uncertainty triad (CPU-EUI-TPU) with economic activity in the United States. This next-generation approach not only extends the bivariate setup, but isolates asymmetries over time-frequency spectra, concurrently controlling for other pertinent shocks. Additionally, it solves the computational discrepancies of the traditional kernel designs. The short-term outcomes establish that economic agents exercise instant tactical adjustments, validated by the positive association of EUI and TPU with economic activity (EAC). In contrast, the trilogy of uncertainty and EAC have negative association in their median-to-high quantiles. These outcomes underscore that prolonged uncertainty precludes economic activity. The long-run negative impacts of CPU-EAC, EUI-EAC, and TPU-EAC demands exigent attention. It requires the solution of climate-related issues, balanced energy mix, and appeased trade frictions between the US and its trading partners. The study concludes that unlike temporary policy uncertainty shocks, long-term or sustained uncertainty structurally inhibit economic activity in the USA.
Keywords:
policy uncertainty triad
; CEEMDAN MN-QQKRLS
; economic activity
; United States
1. Introduction
The United States (US) economy is shaped by a triad of intersecting challenges. These include climate mandates, evolving energy-mix preferences, and a volatile trade agenda. This scenario creates a complex environment, influencing both economic and financial stability. Of the three uncertainty factors, climate policy uncertainty (CPU) facet markedly affects the sustained economic activity in the US. A growing body of literature endorses that climate change remains one of the most crucial global issues, prompting governments worldwide to implement green policies to mitigate its adverse effects (Nema, Nema, & Roll, 2012; Pavel, Amina, & Oleg, 2024; Su, Pang, Qin, Lobonţ, & Umar, 2023; Coffé et al., 2026). This issue is pertinent to the case of the United States; as the world’s largest economy second largest carbon emitter1, as the nation is tilted industrial expansion and economic growth rather than preserving environment.2 Interestingly, the U.S. participated in several Conference of Parties (COP) meetings, including the United Nations Framework Convention on Climate Change (UNFCCC), pledging to reach “net-zero carbon emissions” by 2050 (COP 26, 2021). However, it has been slow in taking major action to address climate challenges, largely due to uncertainty surrounding its climate policies (Tam et al., 2023). For example, the current administration of President Trump is inclined towards mild environmental protection policy, while the previous administration of ex-president Biden took a dissimilar course for environmental protection, making climate change a more essential focus. Such conflicting climate policies engender uncertainty and low clarity surrounding the U.S. government regulations, incentives, and commitments to clean energy sources to tackle climate change agenda in recent times.
Evidence suggests that uncertainty mainly revolves around macroeconomic indicators and energy shocks (Jurado et al., 2015; Punzi, 2019; Akadiri et al., 2025). Uncertainty about climate policies (CPU) discourages the development of new technology and stifles innovative initiatives, ultimately slowing down economic growth (Alharbi et al., 2025). The above notion is supported by the fact that CPU compels businesses to remain hesitant of making investments in sustainable or green technologies because of the volatile regulatory environment. To this end, the development or the expansion of clean industries, particularly in energy domain, records a neutral phase, not only impacting job creation, but economic development (Ren et al., 2023). The literature well endorses the negative repercussion of CPU and develops the consensus that the former not only hinders the adoption of cleaner technologies, but impedes financial predictability and other efficiency metrics in emerging green sectors (Li et al., 2021; Niu et al., 2023; Sun et al., 2024). CPU redefines revenue policies e.g., taxes, and alter expenditure policies i.e., subsidies and investments and both policies have cardinal role in combating carbon emissions challenges. One pragmatic aspect of dealing with these climate concerns on behalf of the US is to introduce pragmatic changes in its energy policy, but doing so creates another layer of uncertainty. While some businesses and investors are proponents of the transition from dirty to clean energy, others see it as extra cost burden.
Apart from the climate (CPU) and energy uncertainty (EUI), the US economy is confronted with an additional pertinent and prevalent geopolitical type of uncertainty i.e., trade policy uncertainty (TPU). This type of uncertainty has undoubtedly altered the dynamics of global economic and financial system. Hence, besides CPU and EUI, the element of TPU cannot be placed on the backburner. Besides the 2017 trade war episode (He et al., 2020), another episode emerged when President Trump took charge of the US for the second time. The tariffs implementations from the US, and the retaliatory measures on behalf of US major trading partners became news headlines yet again. Owing to the US tariffs imposition on China, Canada, and Mexico in April 2025, the global economic and financial markets exhibited turbulence and recorded immediate negative spillovers. Such geopolitical constraints not only augment trade policy uncertainty (TPU) among trading partners, but disturb that overall dynamics of the global trade. The TPU shocks also exhibit rebounding behaviour, as it capable produce contractionary impact on the local economy of the United States. This bidirectional transmission mechanism entails that protectionist stances often work as a double-edged sword and escalated international trade frictions inadvertently influence domestic economic activity. This study aims to contributes to the literature by studying the isolated impact of CPU, EUI) and TPU on economic activity (EAC) in the U.S. Specifically the study postulates that; to what extent or varying levels of energy and trade policy uncertainties (henceforth, uncertainty triad) influence the US economic activity is worth probing. Another primal postulation whether the response of the US economic activity remains the same or it evolves over time vis-à-vis the policy uncertainty triad merits further attention.
Theoretically climate policy uncertainty leads to investment hesitation and low aggregate economic activity. This mechanism is well discussed in Real Options Theory (Bernanke, 1983), where regulatory ambiguities tend to stifle innovation and inhibit structural economic growth. Similarly, energy-related uncertainty (EUI) influence economic through cost channel shock, leading to price instability of production inputs (Jo, 2014; Kilian, 2009). Trade policy uncertainty (TPU) disrupts economic activity via protectionism channel, which affect aggregate demand, raising trade barriers, and destabilizing global supply chain integration (Caldara et al., 2020; Handley & Limão, 2017, 2022).
This study develops a background to differentiate its uniqueness from a broader strand of literature in the following manner. Distributional dependency modeling originates from the seminal method Quantile Regression (QR) framework established by Koenker & Bassett Jr (1978), as they moved beyond traditional mean-based estimations. Sim & Zhou (2015) then analyzed the specific distributional points by introducing Quantile-on-Quantile (QQ) uncovering asymmetric association in a bivariate context . Building on this Sinha et al., (2023) and Ozkan et al., (2023) integrated multi-dimensional parameters into QQ framework. The modern wavelet and multivariate dimensions stand on the seminal contributions of (Torrence & Compo, 1998), who introduced wavelets in the time-series analysis. (Aguiar-Conraria & Soares, 2011, 2014), investigated multi-scale co-movements via partial and multiple wavelet coherence. To further push the corners of the envelop, (Polanco-Martínez et al., 2020) developed Wavelet Local Multiple Correlation (WLMC) to gauge co-movements across multiple time-scales simultaneously. This tool simultaneously evaluates multi-frequency shocks and distributional dependencies, effectively delineating nonlinear, ultimately overcoming the conventional time-frequency decompositions. Simultaneously, Troster et al., (2018), Balcilar et al., (2017), Adebayo (2022) and Kumar & Padakandla (2022) introduced non-parametric causality-in-quantiles and Wavelet-based Granger causality to determine quantile-cum time frequency directional nonlinear dependencies. Subsequently Sinha et al., (2025) further studied this domain and introduced quantile causality approach. The spillover foundations of Diebold & Yilmaz, 2012) deepened the tail risks analysis, while Baruník & Křehlík (2018), Gabauer & Gupta, 2018; Gabauer et al., 2025), Chatziantoniou et al., (2021) and Chen et al., (2025) improved the dynamic spectral connectedness. These approaches leverage Lin & Wang (2025) work on economic uncertainty and industrial output in the context of China.
Adebayo et al., (2025) combined frequency-domain and QQ approaches to study the response of Crude Oil and gold towards US-China tension wavelet QQ regression (WQQR). Although Adebayo (2025), studied time-frequency and quantiles dynamics, but this approach suffers from the limitation of the mother wavelets choice and the of linear relationships postulation within quantiles and it is also a bivariate approach. In another study, Özkan et al., (2023) studied frequency decomposition and distributional analysis via WQQR, nonetheless it does not have flexibility in the selection of mother wavelets and is confined to determine bivariate relationships. Furthermore, Adebayo, (2025) utilized Multifrequency Quantile Correlation (MQC) and delved into the scale-dependent co-movements between economic variables, but again it is primarily limited to bivariate linear correlation. The most pertinent study close to our work in terms of methodological application is QQRKRLS approach by (Adebayo, Meo, et al., 2024; Adebayo, Özkan, et al., 2024). They integrated high-dimensional kernels with QQ approach. Although this machine learning approach is quite advanced, it is restricted to bivariate context and it suffers from the constraint of computational complexity pertaining to standard kernel methods. We also acknowledge the recently developed the Rolling Window Wavelet Quantile Correlation (RWWQC) approach by Özkan et al., (2024), which captures time-varying quantile dependencies, it is again fundamentally constrained by correlation estimation and bivariate framework.
Our work transcends the aforementioned methodological limitations by pioneering a CEEMDAN-based MN-QQKRLS framework. This approach is intrinsically novel owing to several structural reasons. Firstly, unlike the bivariate models, our approach adopts a multivariate framework which is capable to isolates the idiosyncratic marginal effects of climate, energy, and trade uncertainties, concurrently keeping concomitant shocks constant. Secondly, we employ CEEMDAN (Complete Ensemble Empirical Mode Decomposition with Adaptive Noise). as a data-adaptive decomposition technique, that coverts a complex, non-linear time series data such as CPU, EUI, TPU and EAC into their natural, data-intrinsic layers of variation. These layers, termed as IMFs (intrinsic mode functions), isolate short-term noise, and delineate medium to long-term trends regardless of predefined filters; showcasing a reliable multi-horizon representation, unlike the fixed wavelet transforms. Thirdly, the high-dimensional characteristic of mapping put forward a unique analytical edge over conventional correlation-based approaches. This feature specifically unravels the asymmetric ‘tipping points’, rendering outcomes to overcome unbiased inferences. Finally, the novel framework integrates Regularized Nyström to Tikhonov regularization expansion. This feature upholds computational reliability of the partially derived estimates. We propose that unlike the conventional rolling-window approaches, which suffers from measurement errors and local biases, this approach effectively deals with the noise found in data, and will serve as a blueprint of reliable outcomes. The critical geopolitical position, the second largest carbon emitting country in the world, and a complex energy mix, tempts the curious minds to have an in-depth evaluation of the repercussion of uncertainty triad (CPU, EUI, and TPU) for the economic activity in the United States; utilizing cutting-edge econometrics tools, capable of providing valuable insights for policymakers and other stakeholders.
2. Literature Review
2.1. CPU and Economic Activity
The literature explores the impact of various forms of uncertainty on various economic scenarios. Fajgelbaum, Schaal, & Taschereau-Dumouchel (2017) used the U.S. economy data, establishing that uncertainty bears negative influence by suppressing investment during a business cycle. They argue that an economy could possibly experience an uncertainty trap where investment would fall due to uncertainty which, in turn, would further augment the uncertainty. Similarly, uncertainty about climate policies may have varied economic implications. This situation is especially concerning for high emitting firms. For example, Ilhan et al. (2021) show that, since most climate-related policies aim to curb emissions, in the presence of uncertainty attached to climate policies, firms may fail to quantify the future influence of regulations and related policy measures on their returns. This is why, whereas the previous attention of researchers has been on evaluating the direct impact of climate related policies on the economics of various countries, there is burgeoning interest in economic response under climate policy uncertainty (Fankhauser & Tol, 2005; Pindyck, 2013). In this context, Gavriilidis (2021) develops a novel CPU index for the U.S. using a text related search technique, which has been used in several studies (Shang et al., 2022; Xu et al., 2022; Zhang et al., 2023).
The extant research explores the potential impact through the lens of the energy sector, being the major contributor to carbon emissions. Limited studies point to the impact of CPU on the emergence of new green technologies. However, there is disagreement among studies regarding this impact. Golub, Lubowski, & Piris-Cabezas (2017) conclude that, due to climate policy uncertainty, a trade-off exists between deferring investment in clean low-carbon-emitting technologies generating greater expected future expenses or spending today, bearing risk associated with future value gains. Somewhat similar results are reported by Hoang (2022), considering the U.S. economy, indicating that CPU has a discouraging impact on R&D investment by high emission firms on their transition to clean technologies. One plausible justification for this result could be the costs attached to this transition. This is also observed in other sectors, where CPU results in a rise in R&D investment. Basaglia, Carattini, Dechezleprêtre, & Kruse (2022) argue that CPU suppresses annual employment levels in the U.S., supporting the findings of Hoang (2022) that CPU is associated with a fall in the level of R&D investment. However, the authors suggest that firms consider regulations related to the climate policy more seriously, in case strict implementation is anticipated in the future. Syed et al. (2023) find that U.S. CPU discourages clean energy consumption and investment in this sector in the long run. Gavriilidis (2021) uses a novel index for measuring CPU in the U.S. economy, indicating that a CPU shock has an amplifying effect on clean energy consumption followed by elevated investment in exploring clean technologies both at the aggregate level and in the majority of sectors. Shang et al. (2022) use quarterly data from the U.S. to investigate the response of renewable and non-renewable sources of demand in the energy sector to CPU. They find that CPU has a negative effect on the demand for non-renewable energy sources. In the long run, CPU affects the demand side of the clean energy sector in a positive manner. Lin & Zhao (2023) develop a CPU index of four major carbon emitting countries, including the U.S., UK, India, and China, showing that a high CPU index encourages the growth of the traditional energy sector using fossil fuels. They also find that CPU has a positive correlation with fluctuations occurring in these economies. It is evident from the results that the U.S. has experienced a rise in CPU after its exit from the Paris Climate Agreement. Oil prices play an important role in determining the cost of production in high emission sectors. Xiao & Liu (2023) show that various uncertainties have a time-varying impact on the crude oil market. They observe that CPU augments oil market fear, thereby having a negative impact on investment in this sector. Zhang et al. (2023) suggest that CPU has an augmenting effect on oil sector volatility, whereas it has a negative impact on the volatility of the renewable energy market over the long run. Other studies consider CPU as a predictor of financial market returns. He & Zhang (2022) use a CPU index based on news data from the U.S., indicating that CPU is a predictor of stock returns of the oil industry. Similar findings exist for other carbon emitting industries, but this predictability strength weakens in the case of lower emission industries.
2.2. ENU and Economic Activity
The academic literature examines the impact of ENU in different sectors of economy; however, the literature on ENU is still unexplored. Uncertainty in energy markets characterised by fluctuations of oil prices obviously has a vast impact on economies, especially those relying more tilted on energy exports (Kuzminov et al., 2017). Energy market uncertainty markedly influences various elements of an economy such investment, trade, and inflation (Chishti & Dogan, 2022). Xie, Ali, Kumar, Naz, & Ahmed (2024) find that energy-related uncertainty introduces volatility into energy prices. Such fluctuations in energy prices impact investment decisions, particularly in the clean or renewable energy sector. Zhang & Guo (2024) investigate the ENU influence the oil market, employing the GARCH-MIDAS model. They find significant evidence of spillover from ENU to the oil market and conclude that governments and corporations must include ENU as element for gauging the risk of market uncertainty. Salisu et al. (2024) link ENU to stock market volatility in both developed and developing countries, indicating that ENU propels stock market volatility. Wang, Huang, & Huang (2024) conclude that the returns of Chinese stock markets are susceptible to energy-related uncertainty.
2.3. TPU and Economic Activity
Handley & Limão (2017) assert that policy uncertainty impedes export market entry and growth, and this phenomenon is prevalent for the markets having no trade accession. According to them, low level of policy uncertainty brings economic prosperity in the shape of lower prices and comparatively high consumer income, highlights the importance of controlled uncertainty. Caldara et al., (2020) constructed a newspaper-based index of TPU and related it to business investment and aggregate economic activity, observing that fluctuations in discourage business investment, as firms anticipate heightened tariffs and this phenomenon ultimately spills on aggregate economic activity. Hassan et al., (2018) obtained that economic policy uncertainty mars the US trade and this impact is profound compared to its trading partners. Studying the TPU-stock markets nexus, Yilmazkuday (2025) empirically affirmed that the US tariffs significantly reduce stock prices. Diverging from direct effects of TPU, Benigno & Groen (2020) argued that both local and foreign economic activities come under the radar of TPU, and even if the TPU shocks appease, it still influence manufacturing and investment activities owing to the untoward attitude of business sentiment. Reduced trade policy uncertainty (TPU) propels domestic entrepreneurial activities, augments industry-level competition and pave the way for better-quality entrants, leading to an enhanced economic performance (Cui & Li, 2023). Gopinath (2021) quantified that TPU tend to negative affect various facets the US agricultural economic indicators such as real value added, loans to the farmers and employment. Trade uncertainty increases shipping costs and it has a long-lasting effect on economic growth compared to policy uncertainty (Melas et al., 2025). Poilly & Tripier (2025) studied the TPU dynamic in various states of the US and observed that states which are more vulnerable to tariff volatility experience low levels of real GDP and are confronted by the issue of unemployment compared to the other US state having level headed tariffs volatility. They explicated this mechanism via precautionary saving behavior defined by high exposure to import tariffs.
3. Data and Methodology
3.1. Data
The study retrieves data of climate policy uncertainty (CPU), energy-related uncertainty (EUI) and trade policy uncertainty (TPU) from the website (www.policyuncertainty.com). The industrial production index is used as a proxy for economic activity3. This data is collected from the Fred database (https://fred.stlouisfed.org/). The CPU, and TPU indices gauges the level of uncertainty pertaining to U.S. climate policy and trade policy as constructed by Gavriilidis, (2021) and Caldara et al., (2019) from news articles mentioning uncertainty terms related to climate and trade policy. These indices have been extensively used in various studies in the areas of economics and finance research (Bai et al., 2023; Bouri et al., 2022; Hoang, 2024; Karim et al., 2023; Sarker et al., 2023; Shang et al., 2022; Yilmazkuday, 2025) . The EUI index, recently introduced by Dang et al. (2023) is based on a three steps approach, measures uncertainty in energy markets, covering twenty-eight developed and developing countries from 1996 to 2023. This metric is based on textual analysis of monthly country reports retrieved from the Economist Intelligence Unit having energy-related keywords accounting for energy uncertainty. It provides insight into how energy uncertainty dynamics reshape economic and financial markets and thus can be used to guide policymakers, investors, and researchers in understanding the response of economic and financial indicators vis-a-via energy market fluctuations. This study specifically uses the country-EUI index for the United States. The sample period of the study spans from February 2001 to October 2023 is based on the data availability.
3.2. Methodology
3.2.1. The CEEMDAN-Based Multivariate RN-QQKRLS Framework
To determine the non-linear, multi-frequency, and distributional nuances of uncertainties and economic activity in the United States, we introduce a hybrid CEEMDAN-based RNQQKRLS estimation approach. Given the non-stationary characteristics of uncertainty shocks, we first resort to the Complete Ensemble Empirical Mode Decomposition with Adaptive Noise (CEEMDAN), which overcomes the “mode-mixing” flaws of traditional EMD, as the former incorporates adaptive white noise during the entire estimation. This allows us to differentiate the long-term structural effects of uncertainty shocks from the short-term. For a given signal , the decomposition is:
where is the intrinsic mode function and showcases the structural trend. These components take the form of three main temporal horizons i.e., Short-Run (SR), Medium-Run (MR), and Long-Run (LR) to disaggregate stochastic fluctuations from the long-run equilibrium.
To capture the nonlinearities in the uncertainties-EAC nexus, we project the multi-frequency signals onto a unified quantile framework, unraveling the distributional dependencies that traditional mean-based frameworks fail to capture. To identify the association at different points of the distribution, the quantile-hit function for the predictor variable, and outcome variable, at quantiles ( and is formalized as follows:
The main estimation operates within a Multivariate KRLS settings. The non-linear mapping of the predictor vector is integrated into the feature space of infinite dimensions through the Gaussian Radial Basis Function (RBF) kernel architecture:
In Equation (3), denotes the multi-dimensional vector of uncertainty facets such as Climate Policy Uncertainty (), Energy Uncertainty Index (), and Trade Policy Uncertainty (), whereas, the term signify the squared Euclidean distance between these predictor vectors in the input space. The term is variance or kernel bandwidth a parameter which serves as a smoothing parameter that calibrates the model’s sensitivity to local distribution fluctuations within the uncertainty and EAC.
Given the computational burden of large kernel matrices, we utilize the Nyström Approximation which is capable of constructing a low-rank approximation of the kernel manifold: . The resulting model parameters are then estimated by minimizing the Tikhonov-regularized loss function, expressed as:
The prime innovation of this framework lies in the derivation of Partial Betas (), which isolate the marginal effect of one uncertainty factor while controlling for orthogonalizing shocks within the nonparametric structure:
To rigorously determine the statistical significance, we utilized a Wild Bootstrap procedure with B = 1,000 iterations. This ensures that our results are robust to distributional tail-instability and heteroscedasticity issue.
4. Results and Discussion
4.1. Descriptive Statistics
Table 1 presents the descriptive statistics for the CPU, EUI, TPU and industrial production used for EAC. The average value is positive for the variables used in the analysis. The highest standard deviation value is for TPU (210.593) followed by CPU (0.6740), indicating the largest dispersion of these variables in the model. EUI has the smallest standard deviation value (0.677) followed by EAC (4.824). The negative values of skewness for EAC suggest a longer tail on the left side of the distribution, whereas the positive skewness of CPU, EUI and TPU suggests longer tails at the right side. Excess kurtosis is noted for TPU, indicating a distribution more peaked than the normal distribution. The Jarque-Bera statistics for EAC, EUI and TPU show that these variables follow non-normal distributions, thereby requiring asymmetric models such as the CEEMDAN-based RN-QQKRLS employed in this study.
Figure 1.
Correlations among EAC, CPU, EUI and TPU.
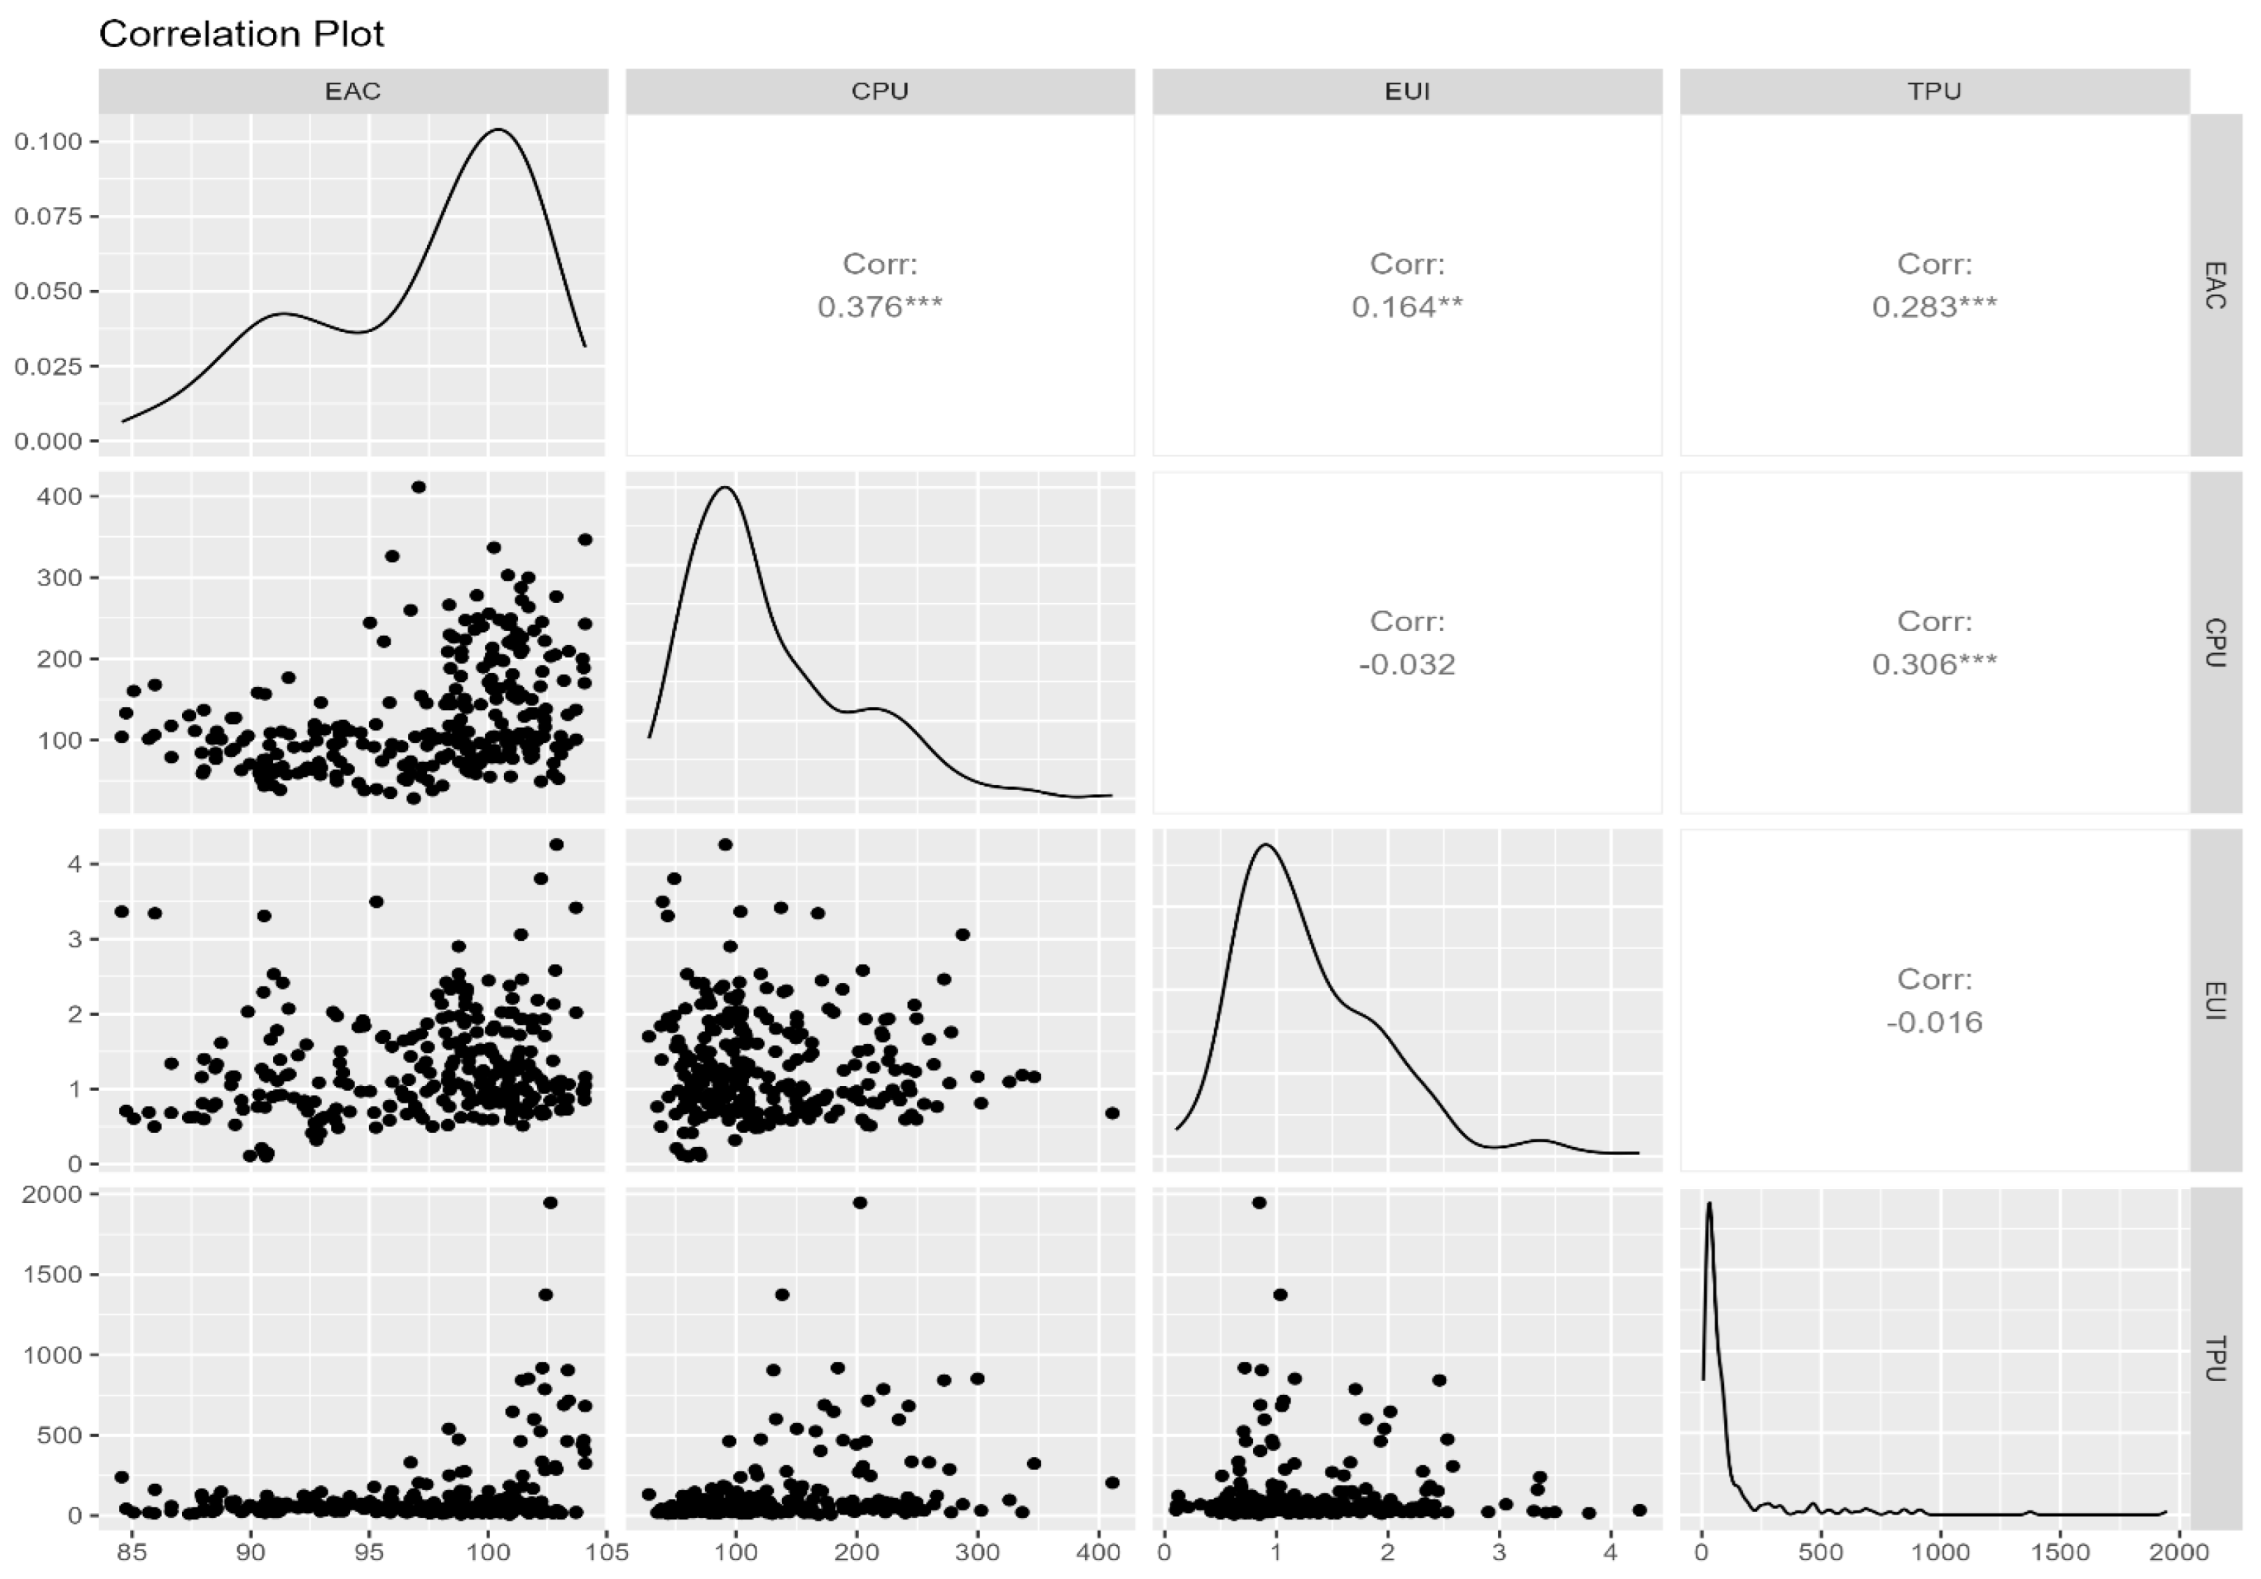
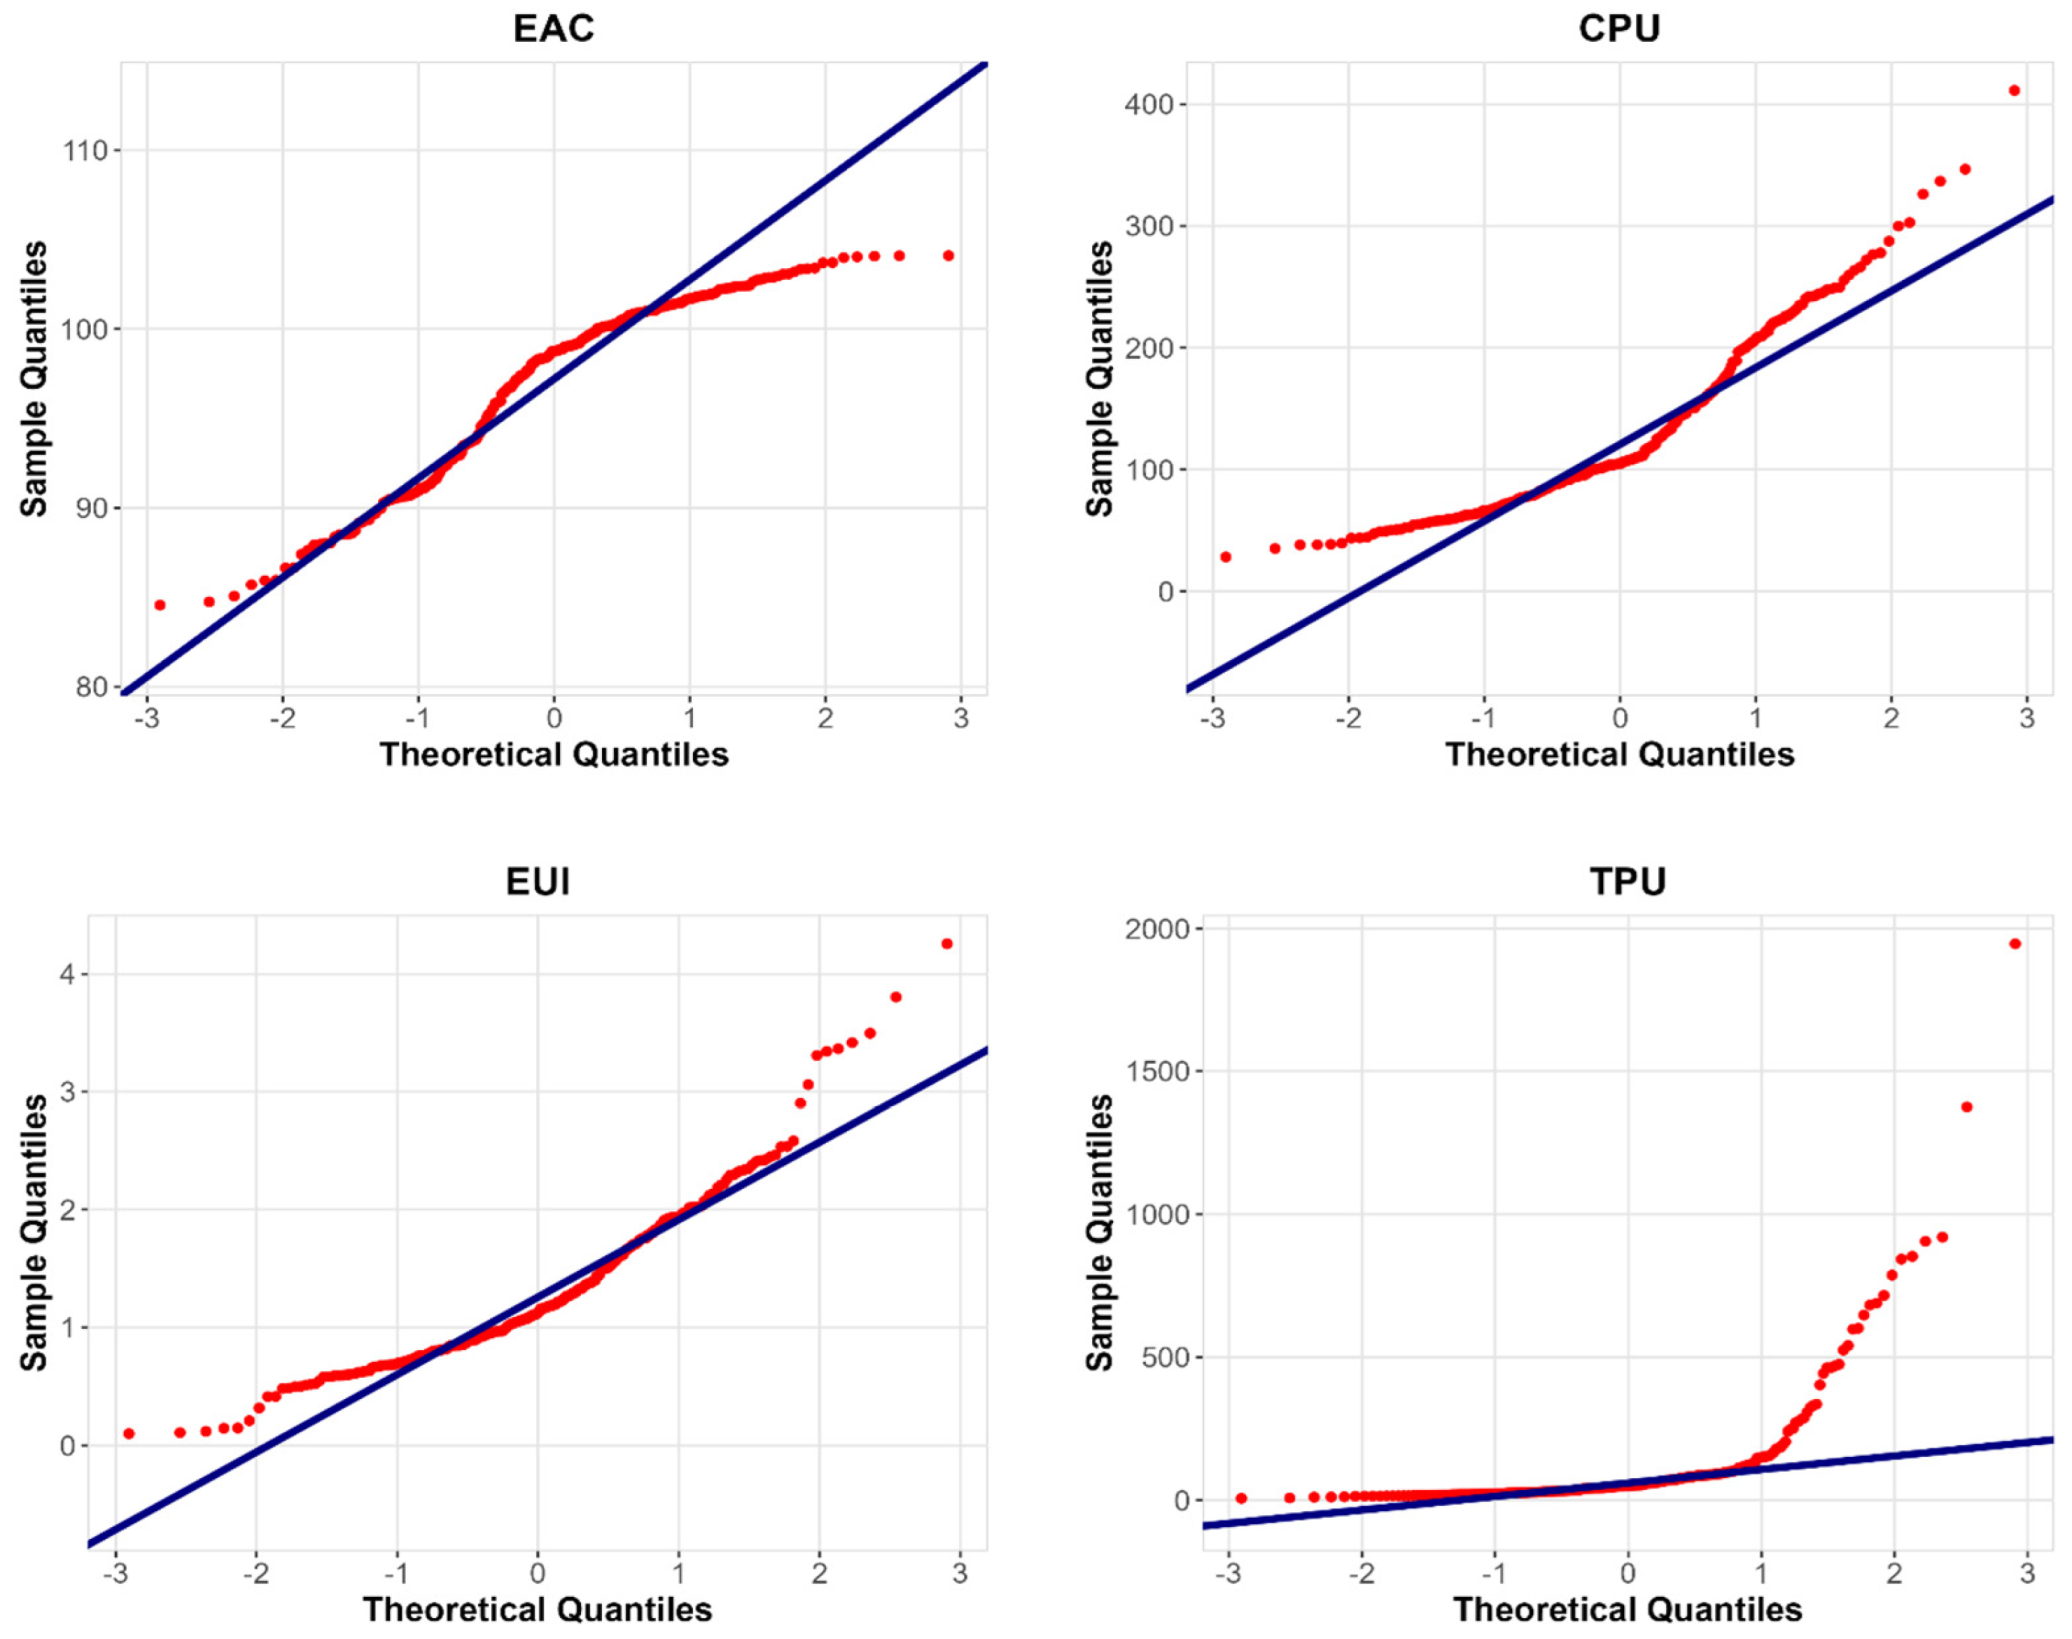
Figure 2.
QQ Plots.
4.2. Nonlinearity Check
To check the nonlinear attributes of the variables, we have employed various individual and combined nonlinear diagnostic tests such as the Bartlet test, Robust Jarque-Bera Test, Bootstrap Symmetry Test, SJ test, Difference Sign Test, Mann-Kendall Rank Test, Runs Test and multivariate Mardia kurtosis normality test. The outcomes are reported in Table 2 and Table 3, respectively. The outcomes of the above individual and combined test suggest that the studied model exhibit nonlinear attributes. Moreover, the Quantile-Quantile (QQ) plot also affirms the nonlinearity attributes of the model. The QQ plots for EAC, CPU, EUI and TPU signify that the points are not aligned and portray deviation from the straight line, suggesting that the data are not congruent to the theoretical distribution. These observations entail that the variables are having non-normal distribution, urging to utilize nonlinear techniques.
4.3. Multi-Variate Normality Test
To check the multivariate normality of the model, we applied the Mardia Kurtosis multivariate normality test. The null hypothesis is multi-variate distribution has zero skewness and multi-variate distribution has normal kurtosis. Since both values are significant hence, we reject the null hypothesis and infer that is Significant multivariate skewness and kurtosis in the model, which confirms non-normal behavior of our model. These outcomes have been reported in Table 3.
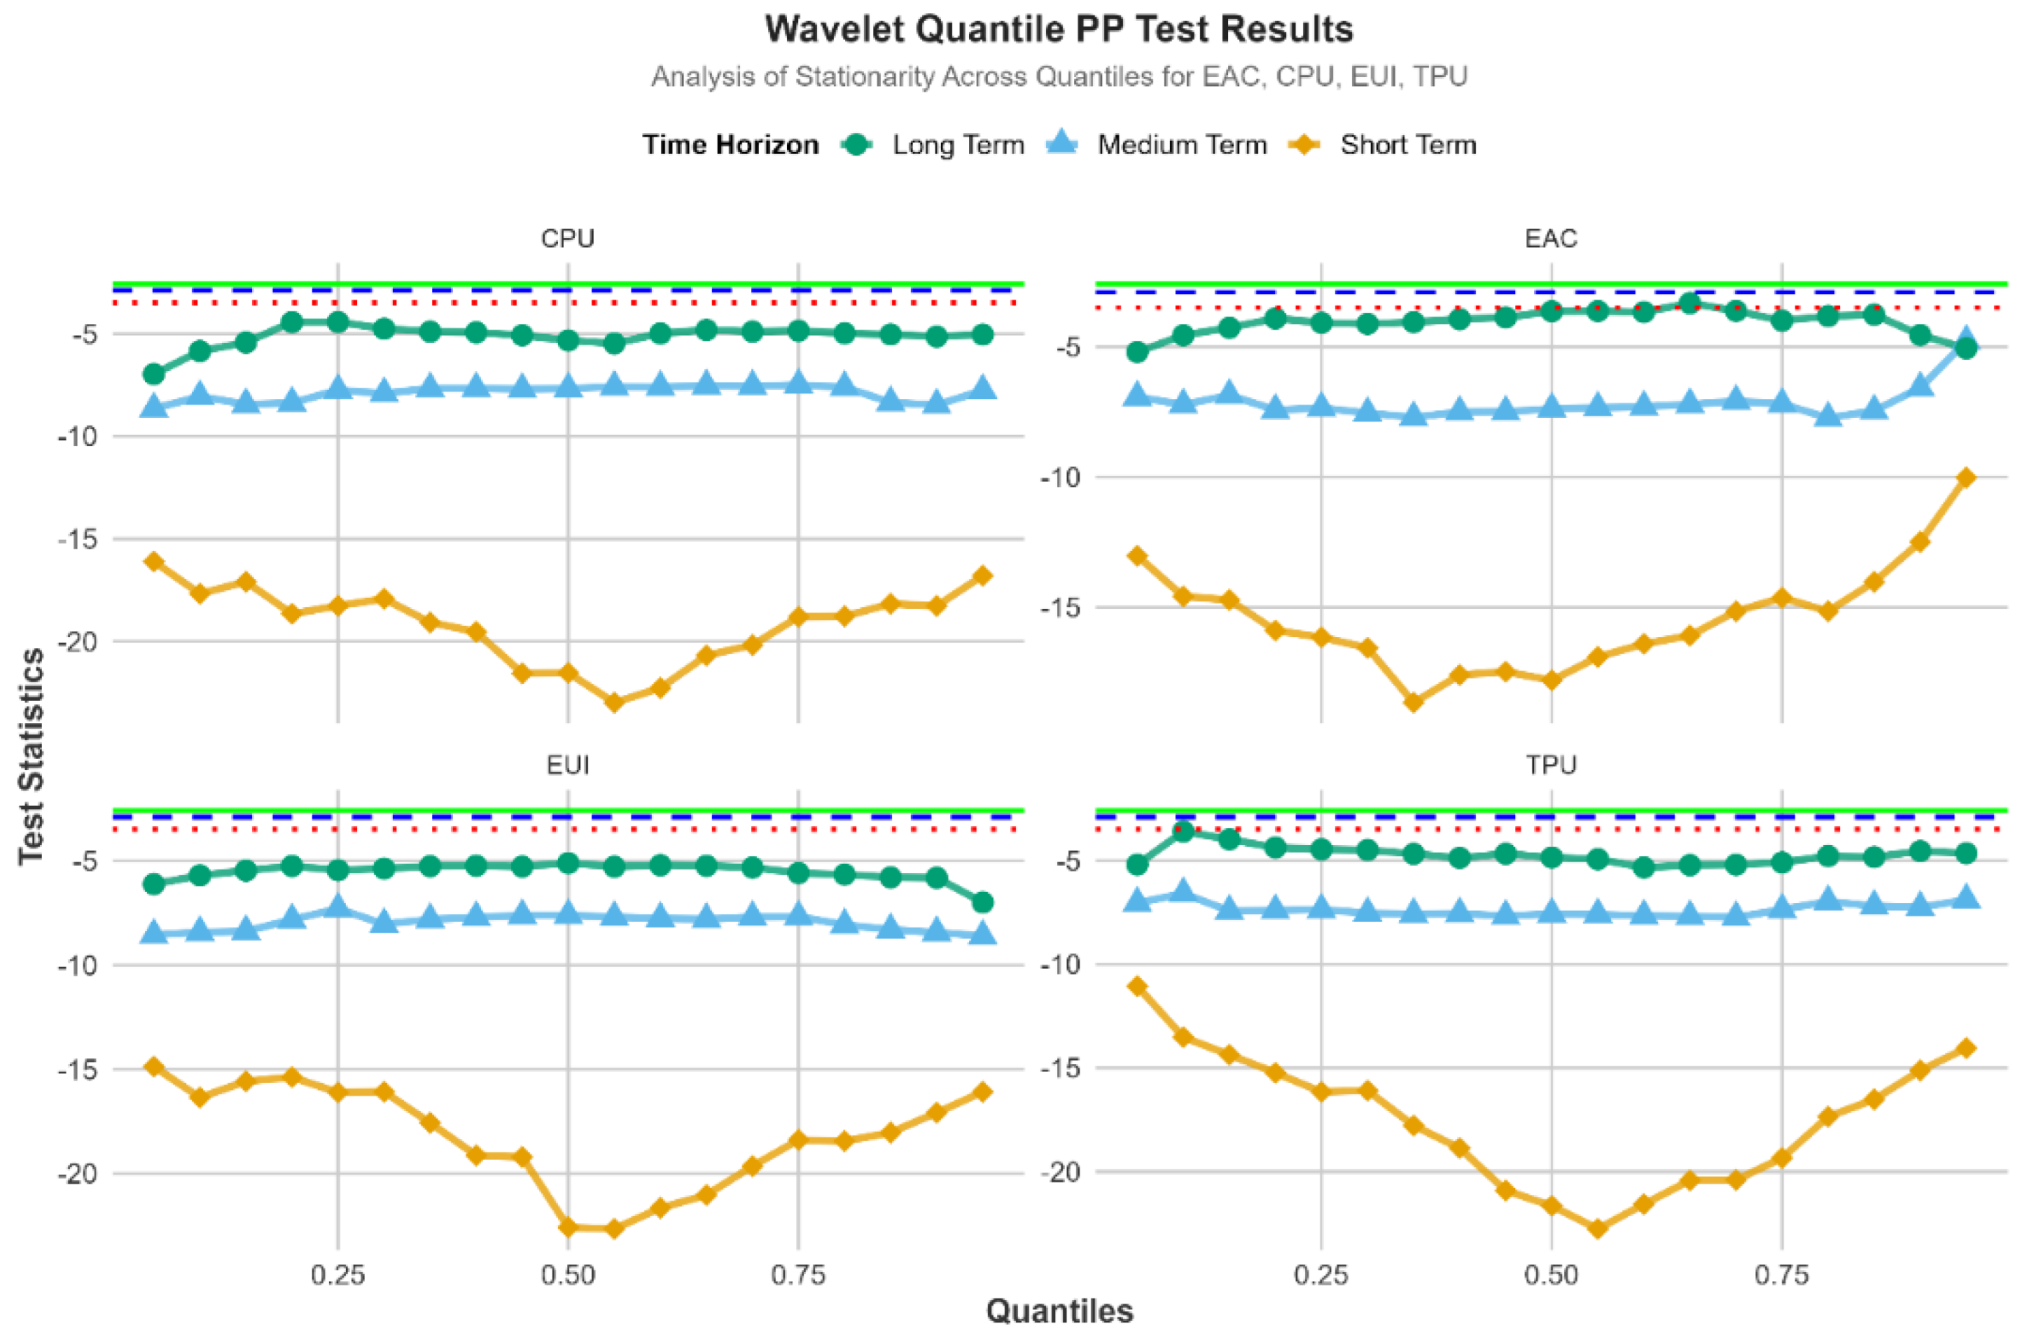
4.4. Wavelet Quantile ADF and Wavelet Quantile PP Test Results
As the above diagnostics tests unravel the nonlinear characteristics of the model, we subsequently utilize the Wavelet Quantile ADF (WQADF) and Wavelet Quantile PP (WQPP) by which determines stationarity in the series across various quantiles/time horizons. The prime advantage of WQADF and WQPP lies in their wavelet-based quantile decomposition, signifying the stationarity features in the short-, medium-, and long run. The WQADF and WQPP reported in Figures 7 and 8 reveal that in the in the short-, medium-, and long run the selected variables (EAC, CPU, EUI, and TPU) exhibit stationarity as their corresponding T-statistics fall below the critical values across majority of the quantiles. These outcomes overturn the null hypothesis (H0) of a unit root existence.
Figure 3.
Wavelet Quantile ADF outcomes.
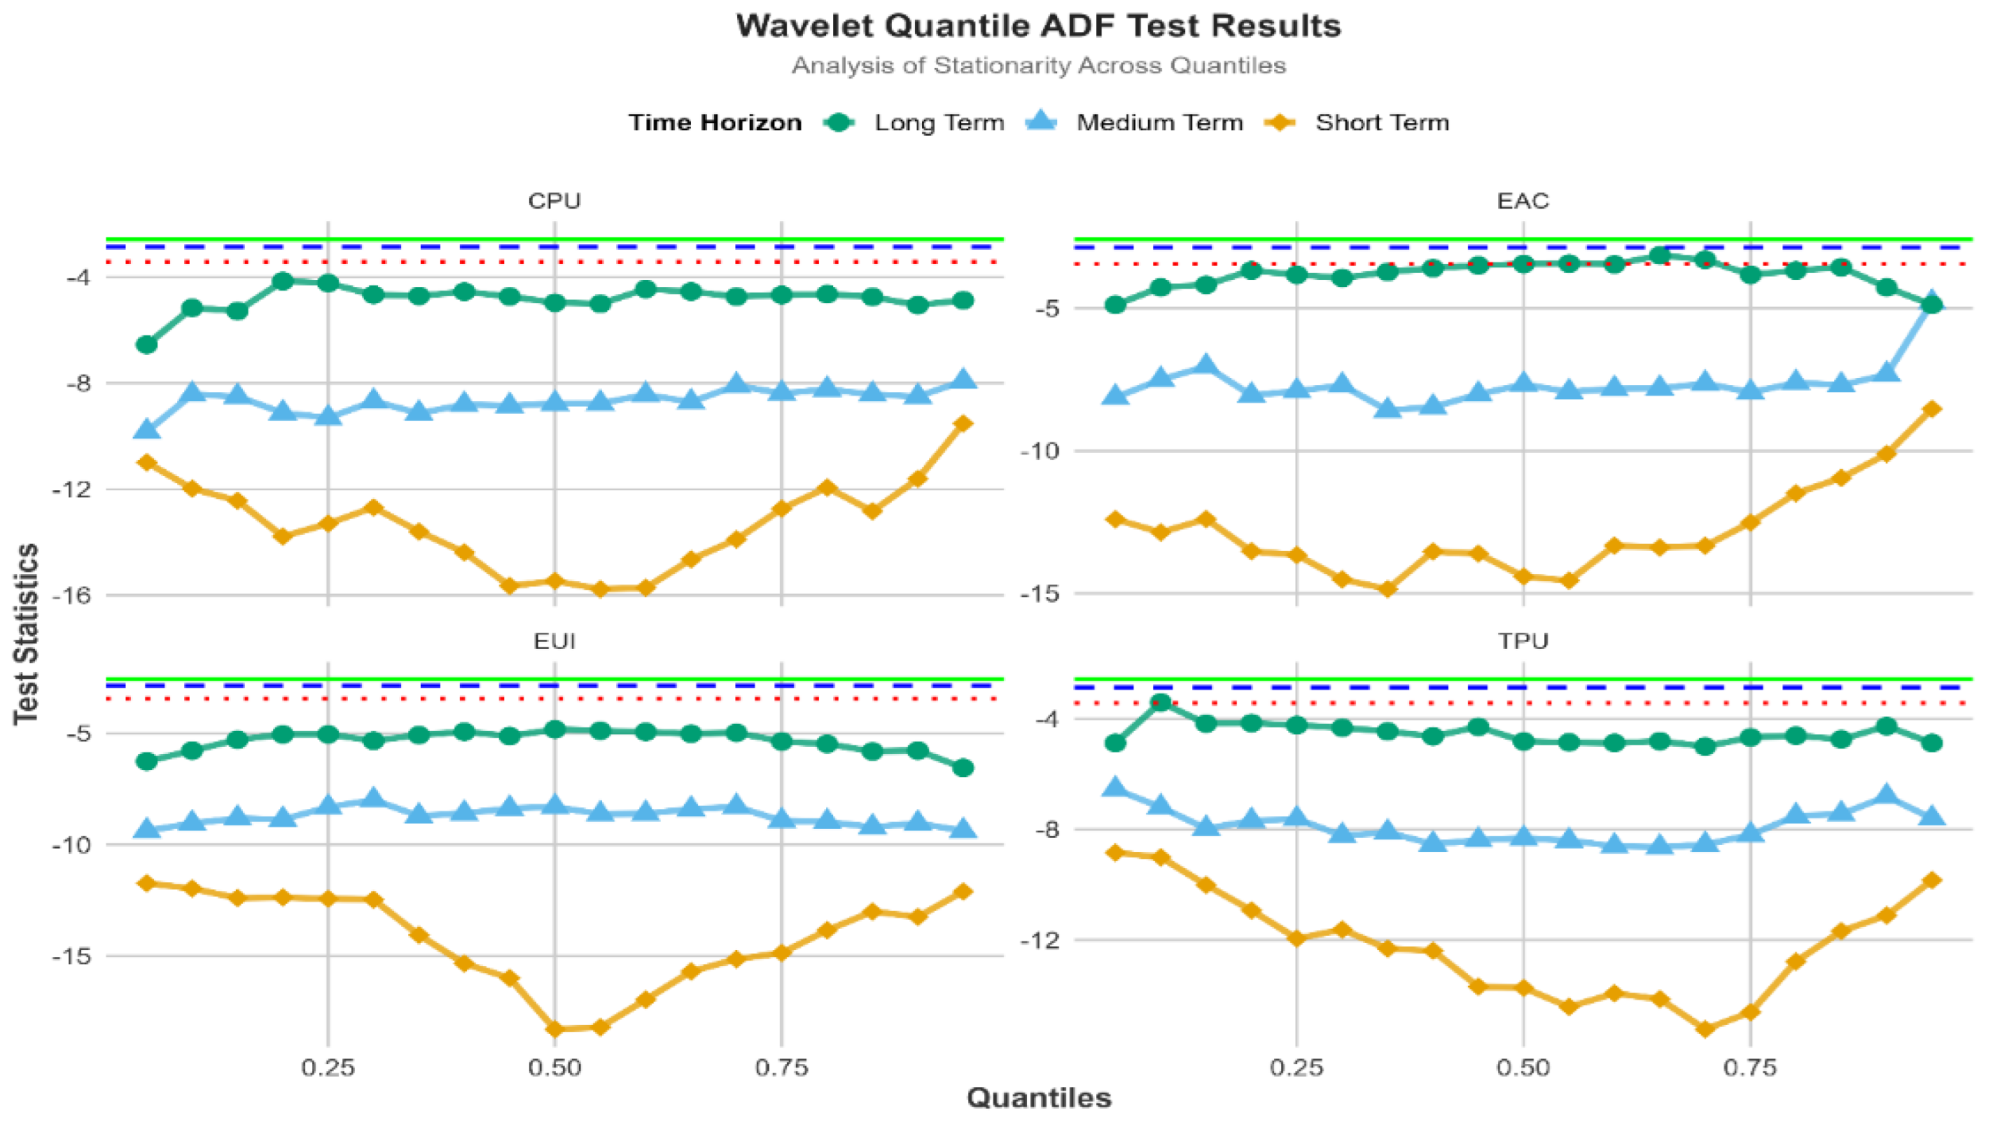
Figure 4.
Wavelet Quantile PP outcomes.
4.5. Results of CEEMDAN-MN-QQKRLS
Figure 5 exhibits the CEEMDAN-Multivariate Nyström QQ (C-MN-QQKRLS) results for Climate Policy Uncertainty (CPU) and economic activity (EAC) in the short-term. The relationship between CPU and EAC in the US, is insignificant in the short-run. However, the heatmap shows negative associations between the two in higher quantiles, when energy and trade uncertainty are held constant in the short-run. These outcomes suggest that despite insignificant outcomes, CPU discourages economic activity in the short run. The long-term results suggest that CPU tend to decrease the economic activity depicted by deep blue colours and significance (0.3 to 0.7) of both variables. These results infer that when economic activity is operating in normal to high levels, high CPU level tend to decelerate its momentum. The heatmap also exhibit that the extreme higher quantile of CPU (0.99) has a marked significant negative impact on the higher quantile of EAC (0.95) in the long-run, suggesting that CPU and economic activity do not go hand-in-hand. Put differently, CPU acts a drag on the US economic activity in the long-run. The negative association in the long-run could be attributed to the fact that investors and companies postpone projects or investments owing to the additional unknown costs or regulations stipulated by potential climate policies. Generally, uncertainty leads to a risk-averse behaviour among businesses, which tend to wait for clearer guidelines before committing resources. Uncertainty about future carbon pricing deters investment in certain energy-related sectors because companies are unsure about the future costs associated with carbon emissions, making the assessment of the profitability of new projects more challenging. These results are in line with the findings of Sheng, Gupta, & Çepni (2022) in the existing literature. The automotive industry, being capital-intensive, exhibit fluctuation with regulatory changes. For instance, Ford and General Motors scale back their electric-related ventures to newly announced regulations. The high initial capital requirements imply that any slight regulatory uncertainty will cause tremendous project delays. Such a scenario retards economic growth, as firms do not initiate projects in the ambiguous regulatory environment. Hence, clear and consistent climate policies are required for sustainable economic progression.
Figure 5.
Climate Policy Uncertainty and EAC (Short-run).
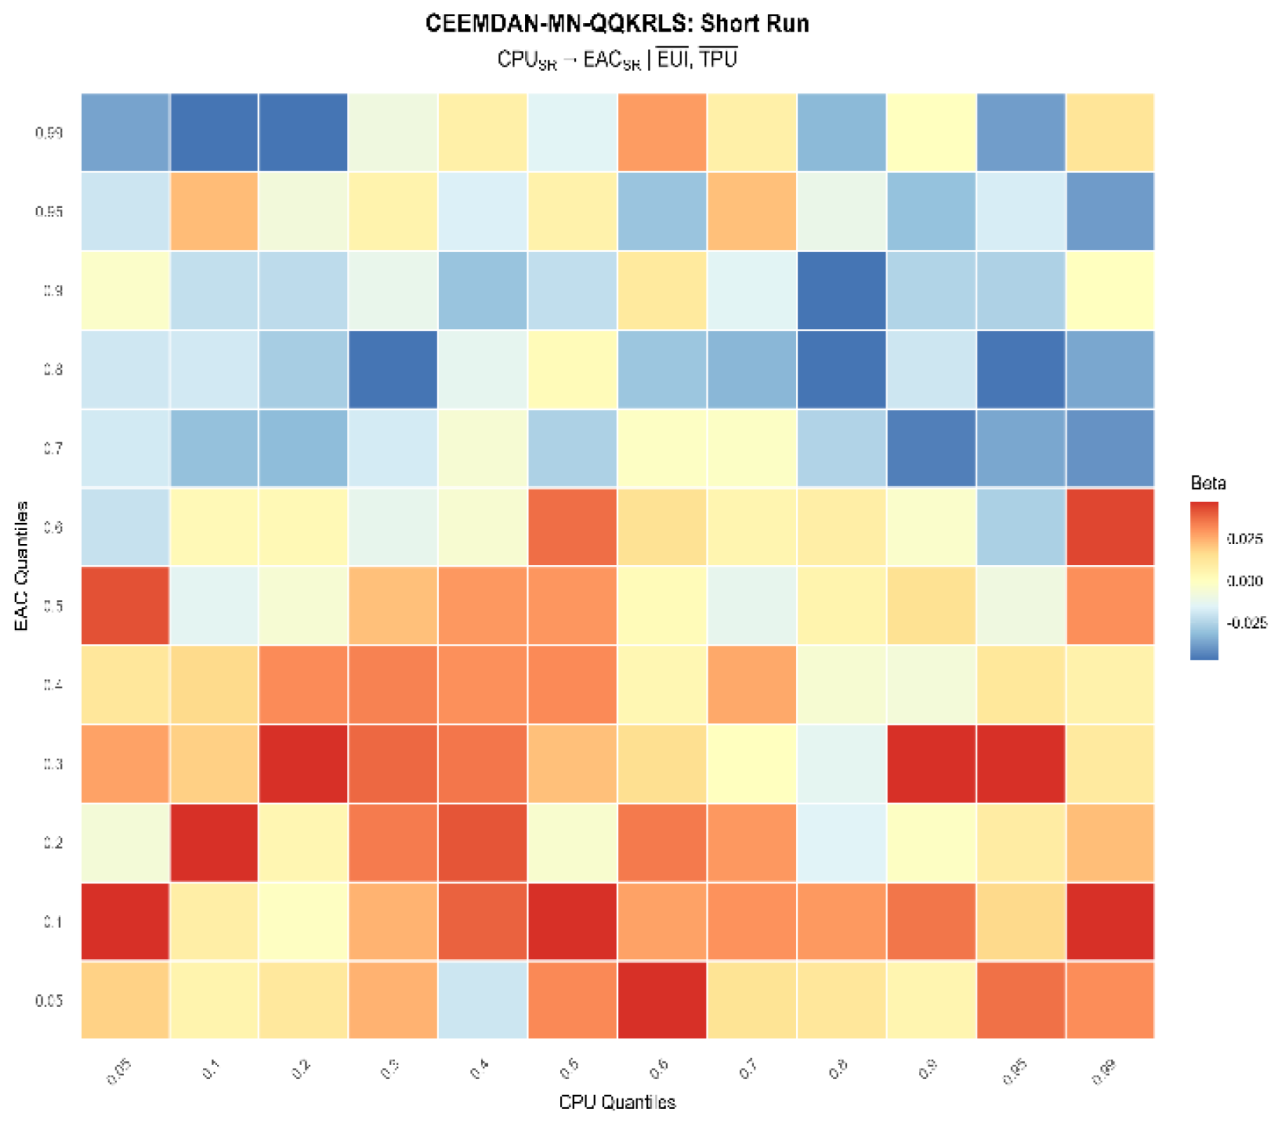
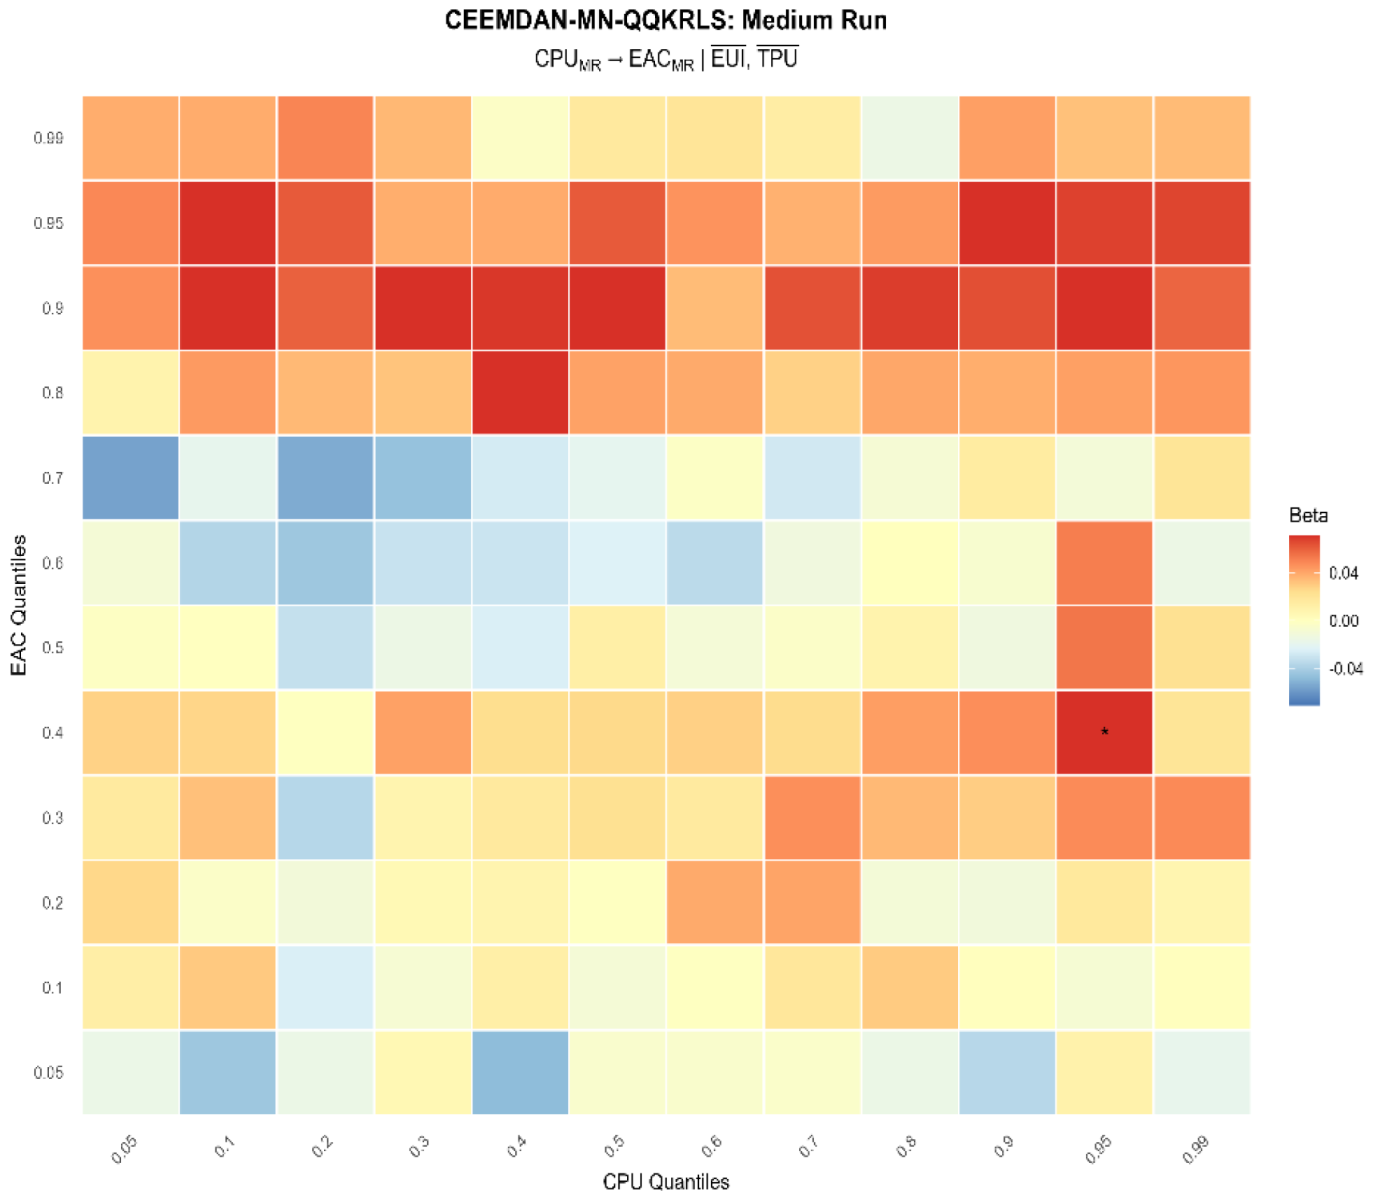
Figure 7 show positive and significant correlation between (0.95) quantile of CPU and the (0.4) quantile of EAC in the medium-run. The heatmap also exhibit red colours in quantiles (0.8 to 0.99) quantiles of both variables despite their insignificance. These outcomes show that CPU may propel investment in renewable energy and encourage companies to opt for energy efficiency technologies, potentially boosting specific sectors of the economy. For example, companies facing regulatory uncertainty may shift their investments to renewable energy projects, which are less likely to be affected by future carbon pricing regulations. This strategic shift helps mitigate risk and opens new growth avenues. CPU leads to innovation in green technologies as businesses tend to bypass regulatory changes with novel technologies, potentially creating more jobs and industries. The push towards green technology is not only a risk mitigation strategy but also an opportunity for growth and competitive advantage. By investing in sustainable solutions, companies can gain early mover advantages, reduce long-term costs, and meet evolving consumer and regulatory demands. It also promotes adaptive strategies that engender sustainability and resilience (Bakhsh et al., 2024; Meo et al., 2024). The asymmetric association between CPU and EAC indirectly endorses the pollution haven and pollution halo hypotheses. These findings suggest that, although CPU slows economic activity, it helps the U.S. become a decarbonized economy by boosting the economic activity via technological and energy innovation. Thus, while the immediate effect of CPU is a slowdown in traditional economic activity, the long-term benefits include a transition to a more sustainable and resilient economy. This transition requires strategic planning and investment in new technologies, as well as policies that support innovation and sustainable growth. The empirical outcomes are akin to the findings of Lin & Zhao (2023) in the extant literature.
Figure 6.
Climate Policy Uncertainty and EAC (long-run).
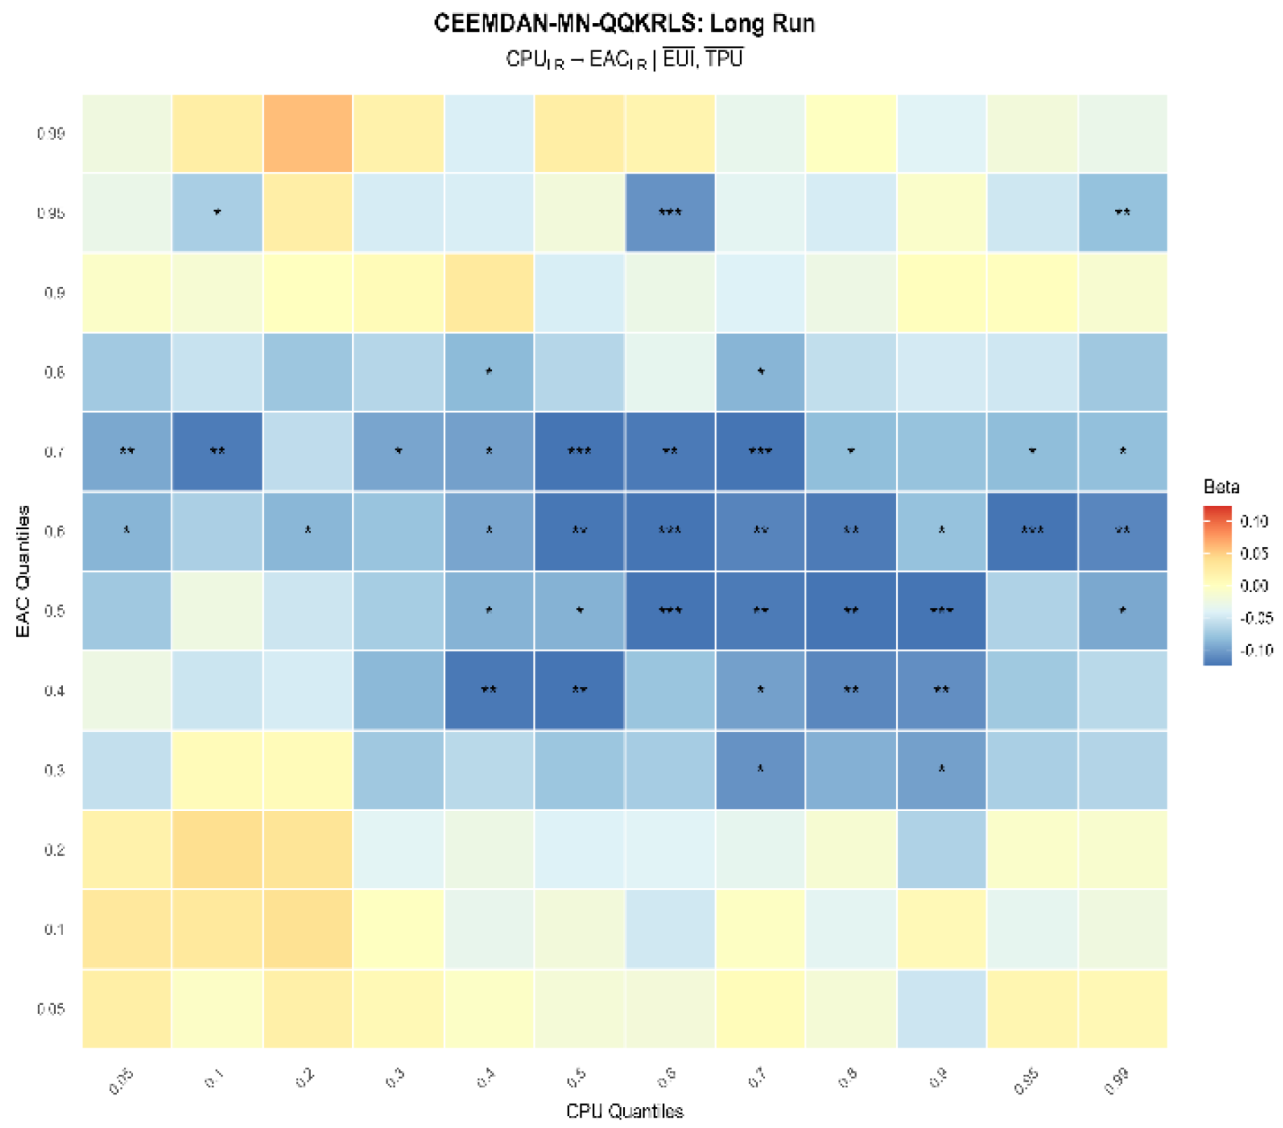
Figure 7.
Climate Policy Uncertainty and EAC (Medium-run).
The MVQQR approach reporting EUI and EAC outcomes, illustrated in Figure 8, show a mixed significant positive and negative association. Firstly, a negative and significant association at a confidence interval of 95% is noted between EUI and EAC in high quantiles (0.8-0.8) for both variables in the short-term. In the medium term the results of both variables were observed to be negative in between high EUI quantile (0.9) and Low EAC quantiles (0.05 and 0.2). Lastly the long-run outcomes again delineate negative and significant association is witness between EUI and EAC in quantiles (0.6 and 0.95; 0.7 and 0.5) quantiles of both variables, respectively. The rationale for high for high and medium levels of energy uncertainty dragging the economic activity in the USA is explicated by the fact that energy prices fluctuations negatively affect economic growth. Fluctuations in energy prices alters the options of resource availability, resulting in production bottlenecks, pushes costs, and render low profitability, ultimately leading to contractionary economic activity. These results back the established findings of (Lu et al., 2021; van Eyden et al., 2019). Both planning and budgeting strategic tools of companies are vulnerable to fluctuations in energy prices making it difficult for them to aptly forecast expenses and revenues. Uncertainty disturbs capital budgeting investment plans, especially in the oil sector and energy-reliant industries (G. Xie et al., 2021; Dai et al., 2025). The regulatory setup concerning energy sources leads to another layer of complexity, as companies utilize clean energy sources for production, which are more costly than traditional fossil fuels in the initial adoption phase. This transition eats up significant investment on new technologies and infrastructure, thereby slowing down economic activity. High EUI also reduces investors’ confidence, as they refrain from investment amidst energy uncertainty, resulting in negative spillover on economic activity (Z. Xie et al., 2024; Yang & Fu, 2025). To minimize their risk, investors prefer stable environments with high levels of predictability. High EUI lead to capital flight, as investors shift their resources to more stable markets. Capital flight can further exacerbate the operations of economic activities (Basher et al., 2023).
Besides negative EUI-EAC relationship, the pictorial representations in Figure 8, Figure 9 and Figure 10 also endorse positive QQ relationship at higher quantile of EUI (0.7) and 0.95 quantile of EAC in the short-term. A positive significant relationship in 0.5 and 0.95 of EUI-EAC quantiles in the medium term. The same positive association is observed in 0.2 quantile of EUI and 0.95-0.99 quantile of EAC in the long-run. These results suggest that, although regulations pertaining to energy tend to induce uncertainty, they also motivate firms to adopt clean energy sources and come up with alternative and innovative tools which are energy efficient and environmentally friendly. These results replicates the findings of Adedoyin & Zakari (2020) and Danish, Ulucak, & Khan (2020). They are of the view that uncertainty can turn into a blessing in disguise. It encourages transfer of energy-efficient technologies via direct foreign investment (FDI), which, in turn, accelerates economic activity. This positive correlation underscores tilting towards sustainable activities, as firms pour in capital into green technologies and energy-efficient processes to tackle energy-related risks. Firms may utilize renewable sources or discover new materials or processes, consuming considerably minimum amount of energy (Tsoutsos & Stamboulis., 2005; Meinhold et al., 2025; Rial, 2024). By doing so, not only commit to regulatory stances but become successful to control long-term operational costs. Such investments redefine industries, promotes job creation, and positively influence economic activity. The asymmetric outcomes between EUI-EAC entails that policymakers should opt for a balanced approach in energy policy design and undertake a gradual transition towards clean energy sources.
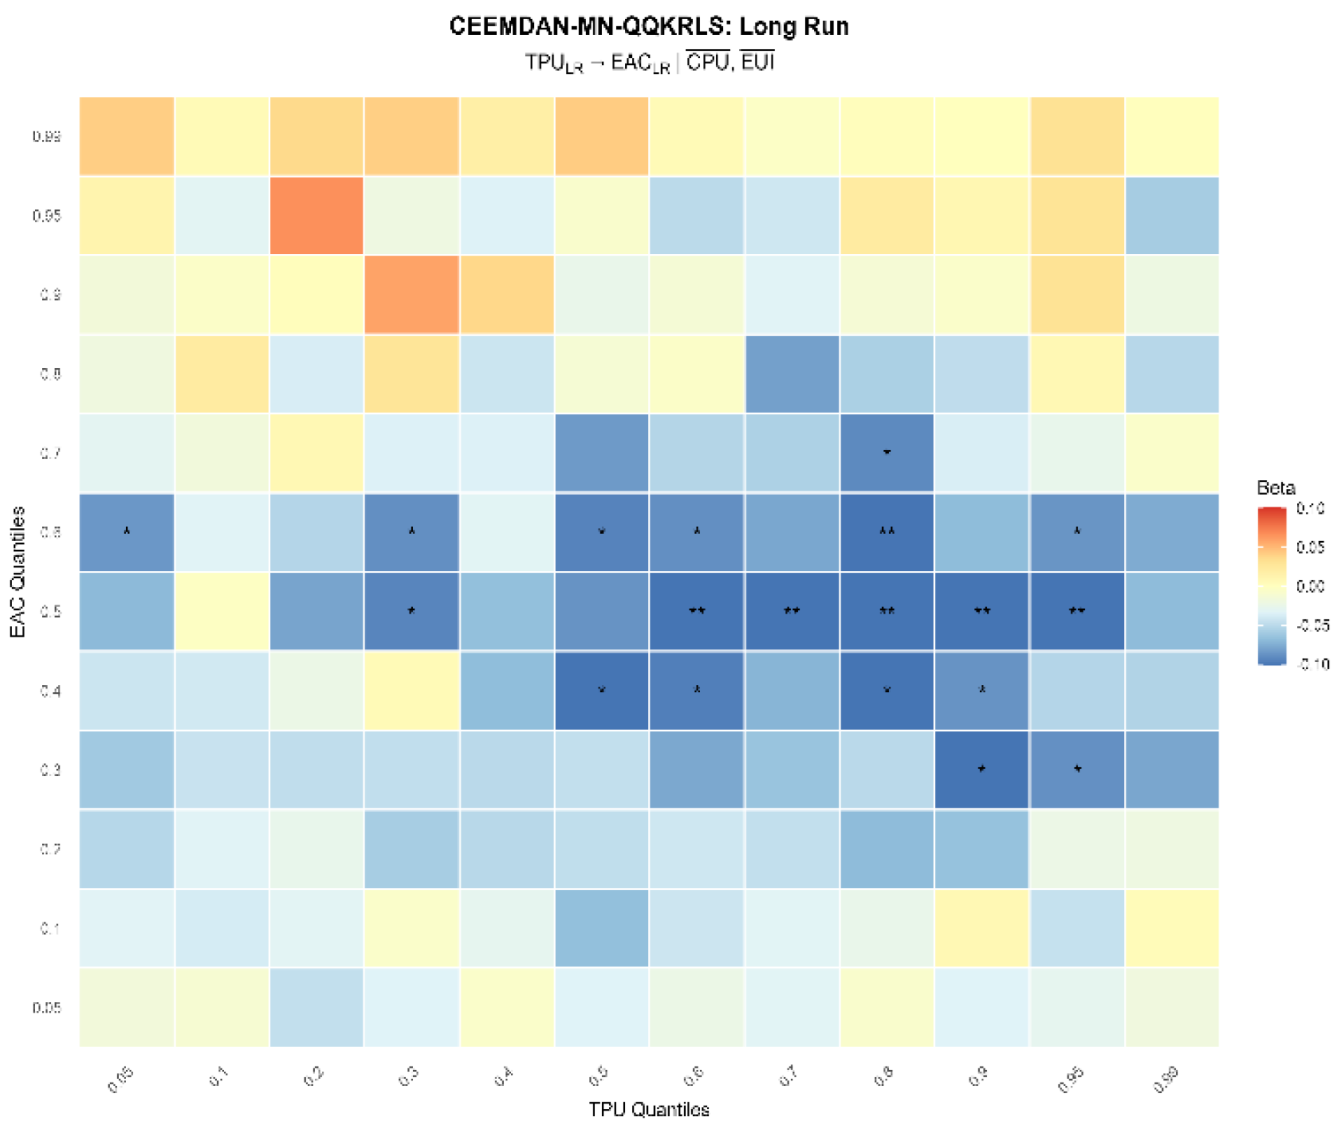
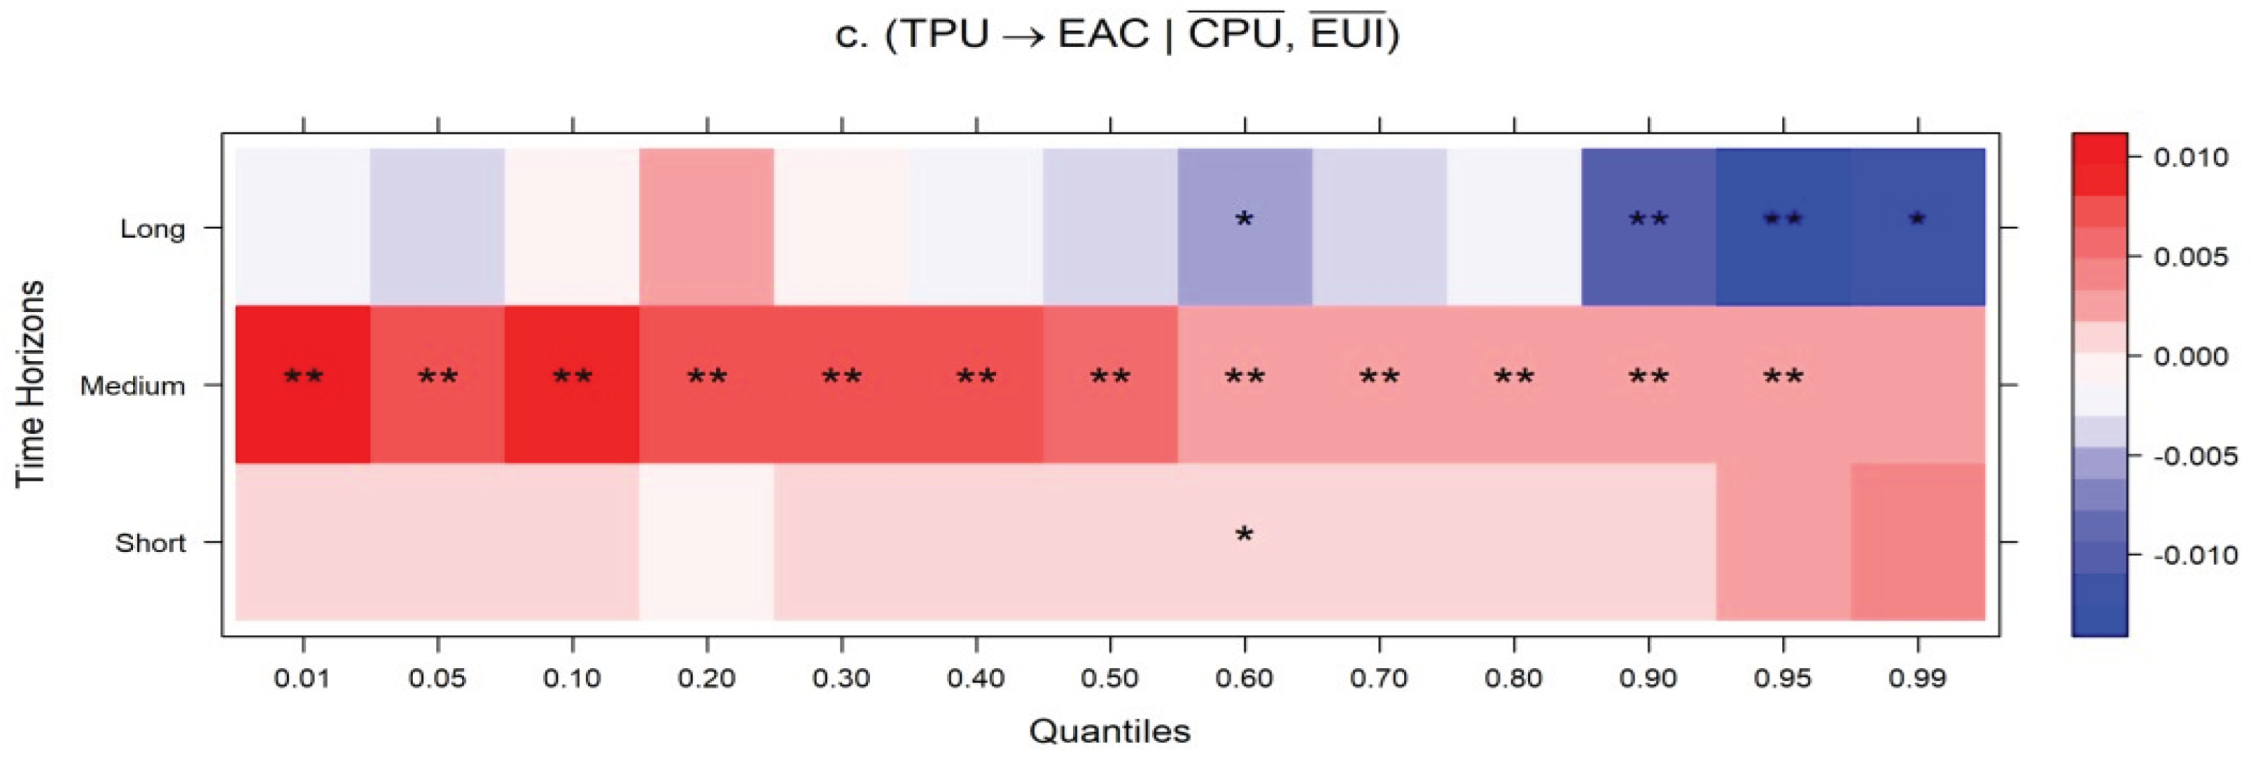
The empirical results affirm time-variant association between TPU and EAC. In the short run, at lower quantiles, the positive and significant coefficients shown in the heatmap depicted by red colors at low EAC quantiles (0.05), entails that the economic activity going through weak phase state exhibit recovery immediately after receiving a TPU shock, as households and firms revisit spending or inventory related decisions, nonetheless these effects becomes also negative subside in the short-run represented by Figure 10, confirmed by (0.99) quantile EAC and (0.05) quantiles of TPU. These outcomes imply that EAC activity has the capacity of building resilience to TPU when it is operating in the medium or normal activity state in the presence of constant climate and energy-related uncertainty. These results affirm the finding of Bloom (2009) study. The macroeconomic repercussion of TPU exhibit asymmetric behavior especially in the very short run as firms augment purchases of capital goods with the notion of anticipatory future tariffs hikes, temporarily boosting economic activity. In the medium run outcomes, the QQ association of TPU-EAC (0.9–0.5) falls in blue shade with a significant marker. The negative beta coefficients infer that as TPU level increases in the medium run; it exerts negative impact on EAC. The long run outcomes presented in pictorial form in Figure 13, the lower (0.05-0.3), medium (0.5-0.7) and upper quantiles (0.8-0.9) of TPU-EAC is dominated by significant deeper blue blocks. These results entail that TPU shocks have persistent negative and sizeable negative impact on EAC in the long-run. These results are congruent to the findings of Caldara et al. (2019), who document that TPU mars business investment and aggregate activity.
Figure 8.
Energy-related Uncertainty and EAC (Short-run).
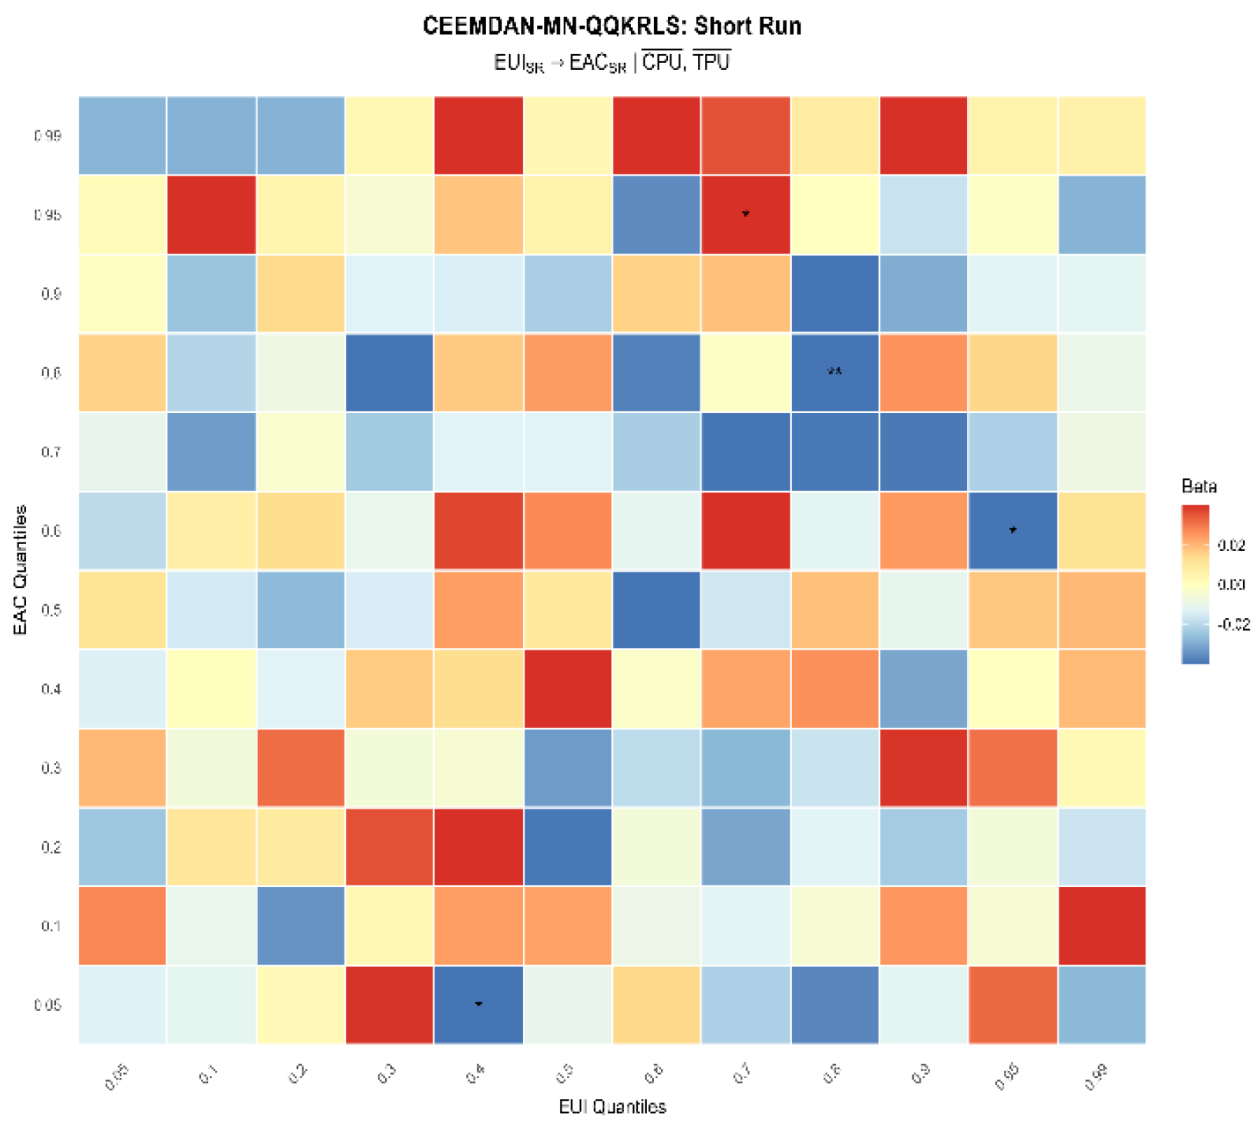
Figure 9.
Energy-related Uncertainty and EAC (Medium-run).
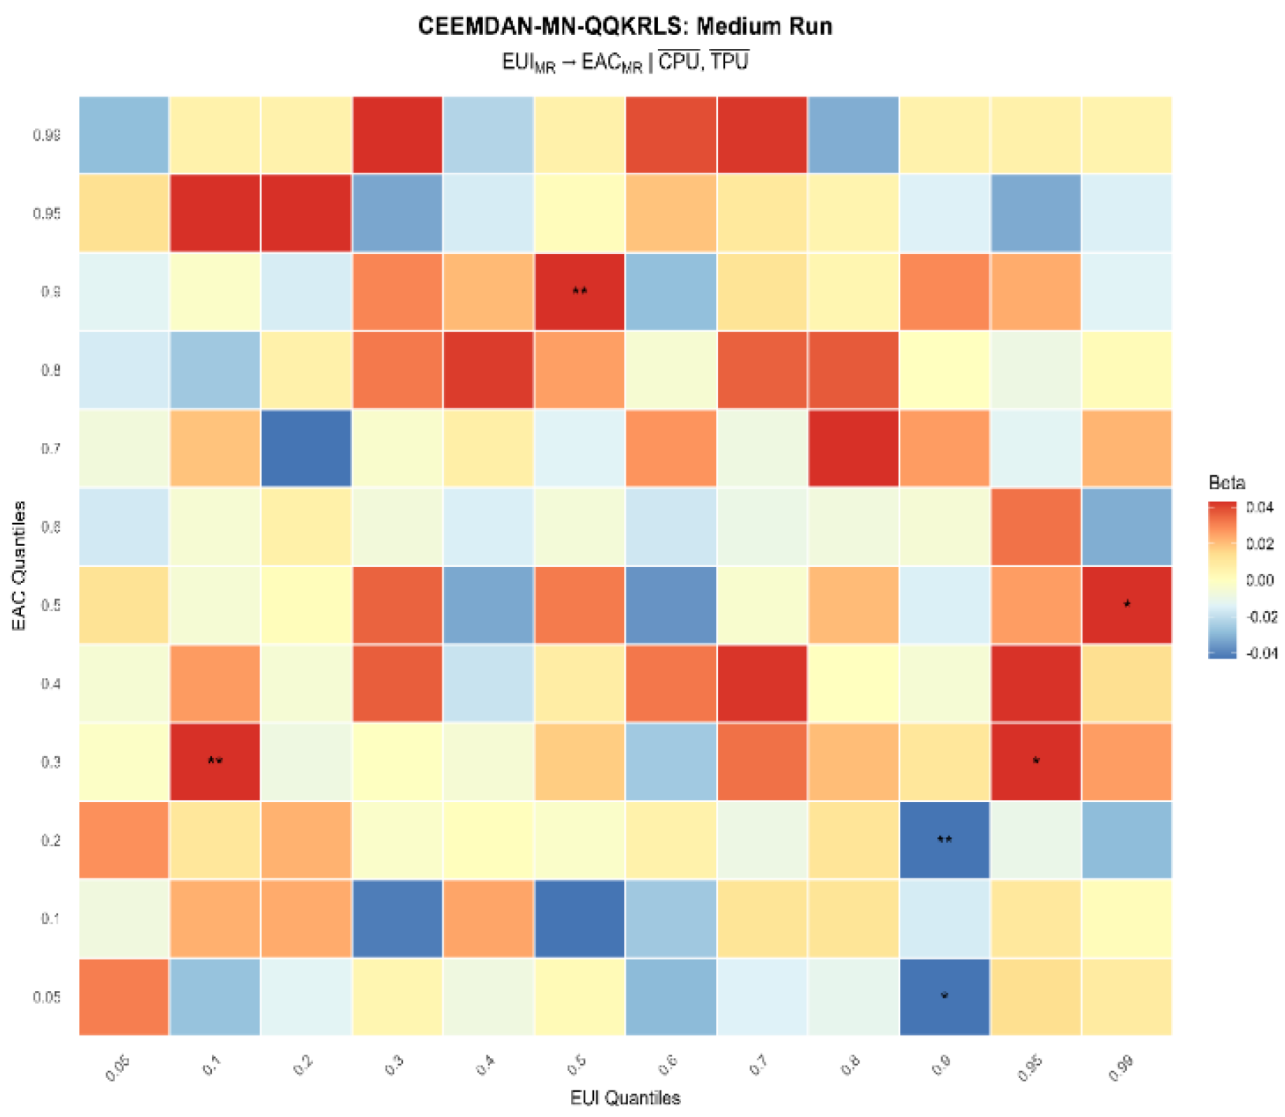
Figure 10.
Energy-related Uncertainty and EAC (long-run).
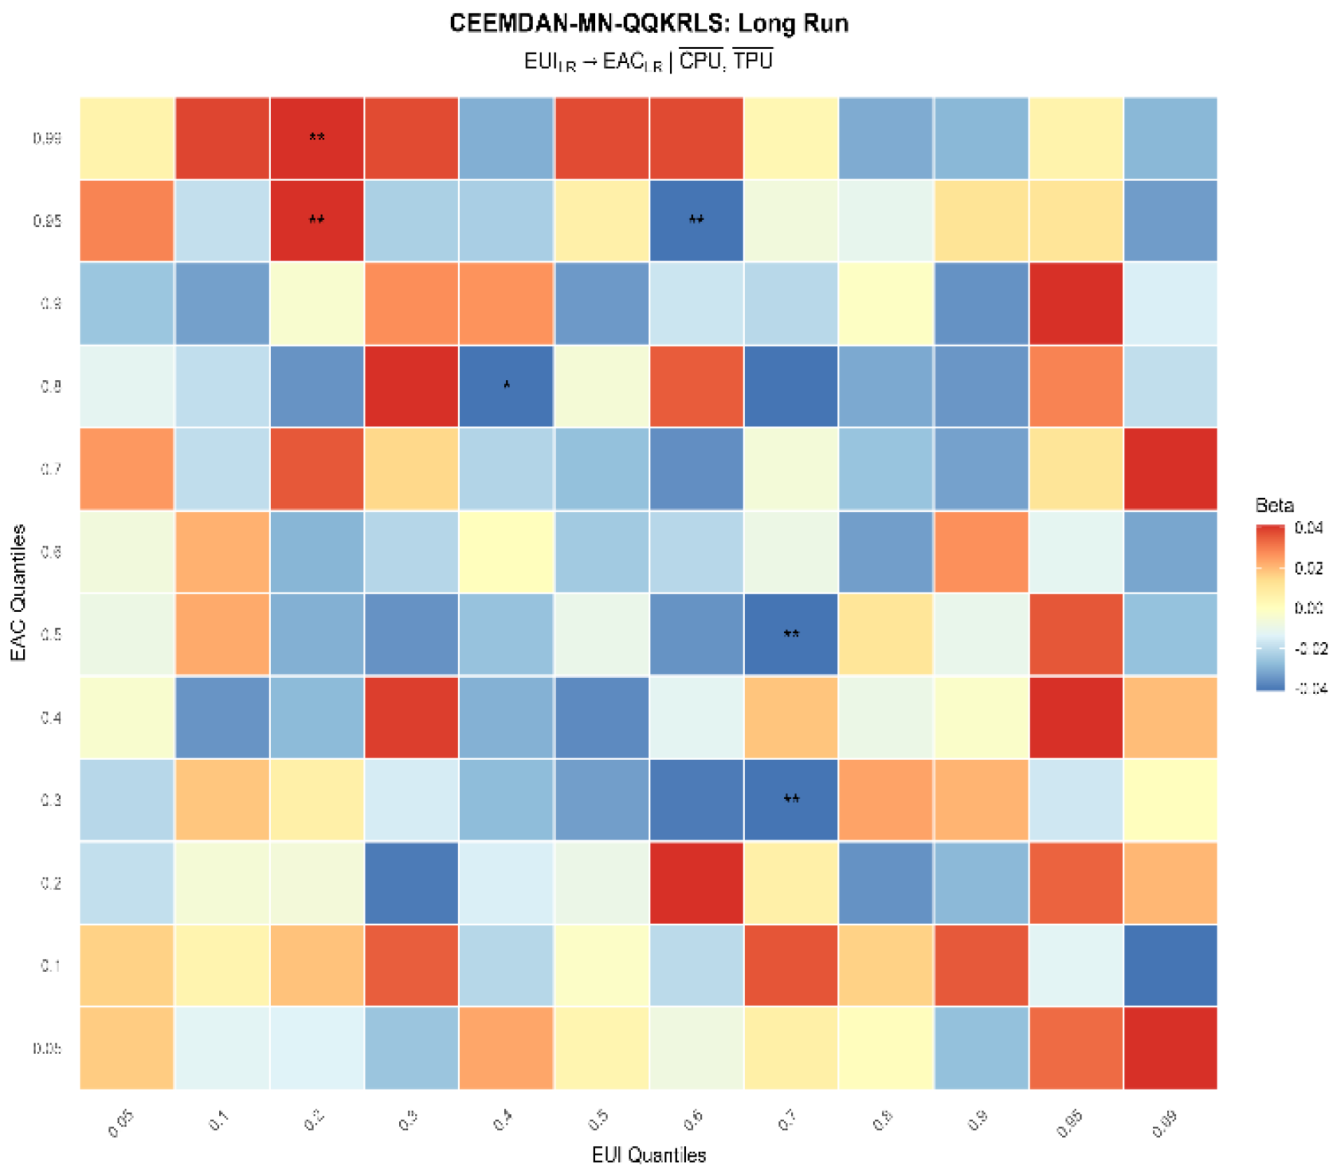
Figure 11.
Trade Policy Uncertainty and EAC (Short-run).
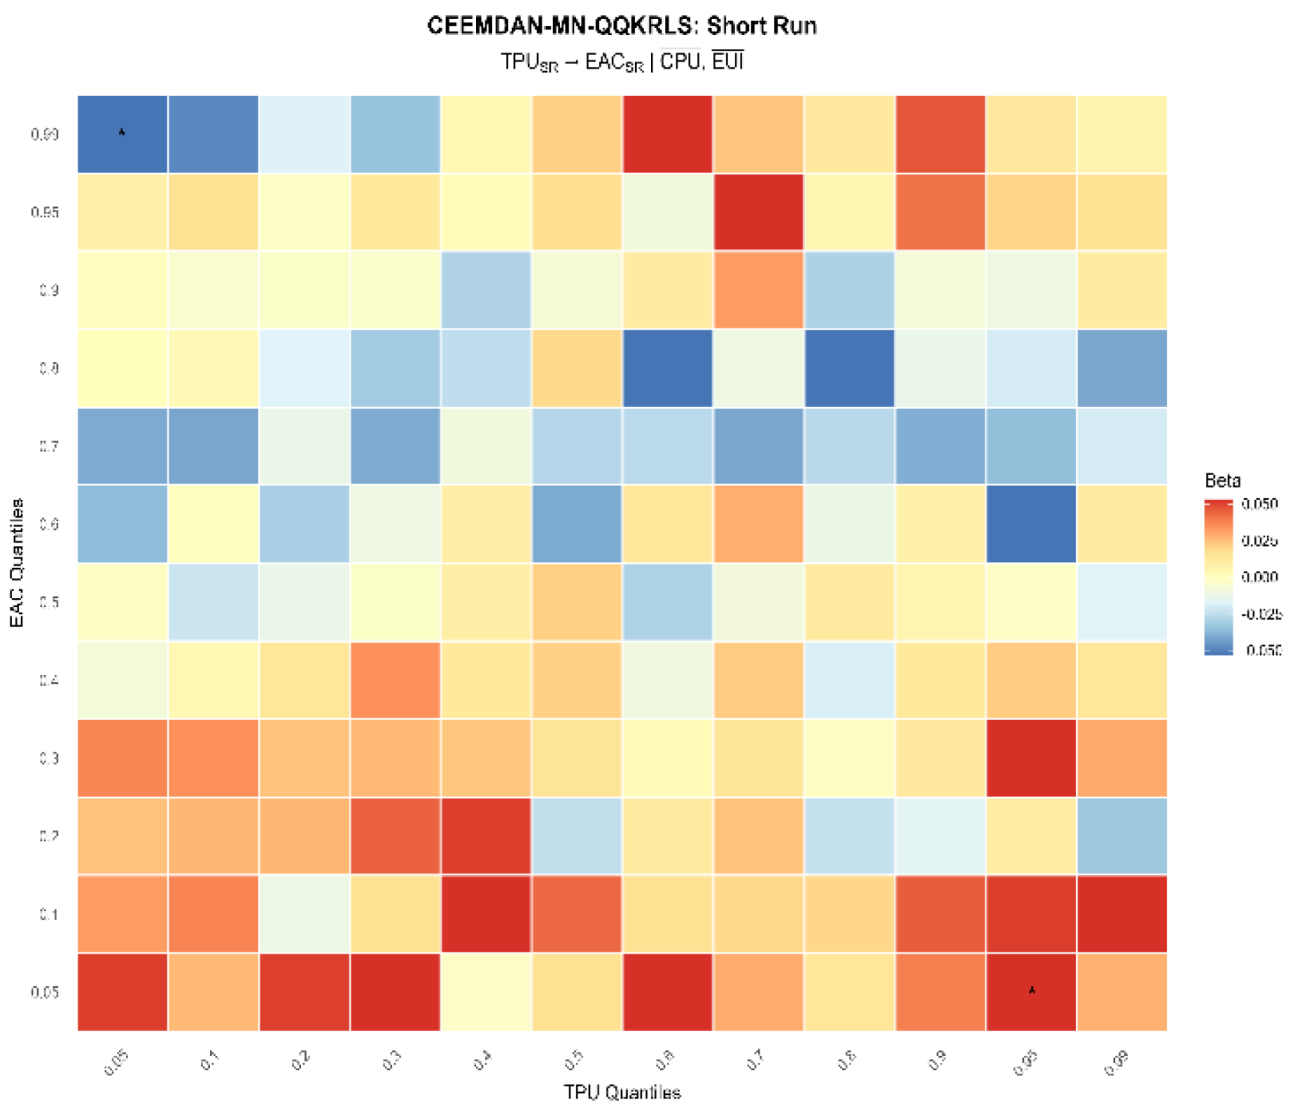
Figure 12.
Trade Policy Uncertainty and EAC (Medium-run).
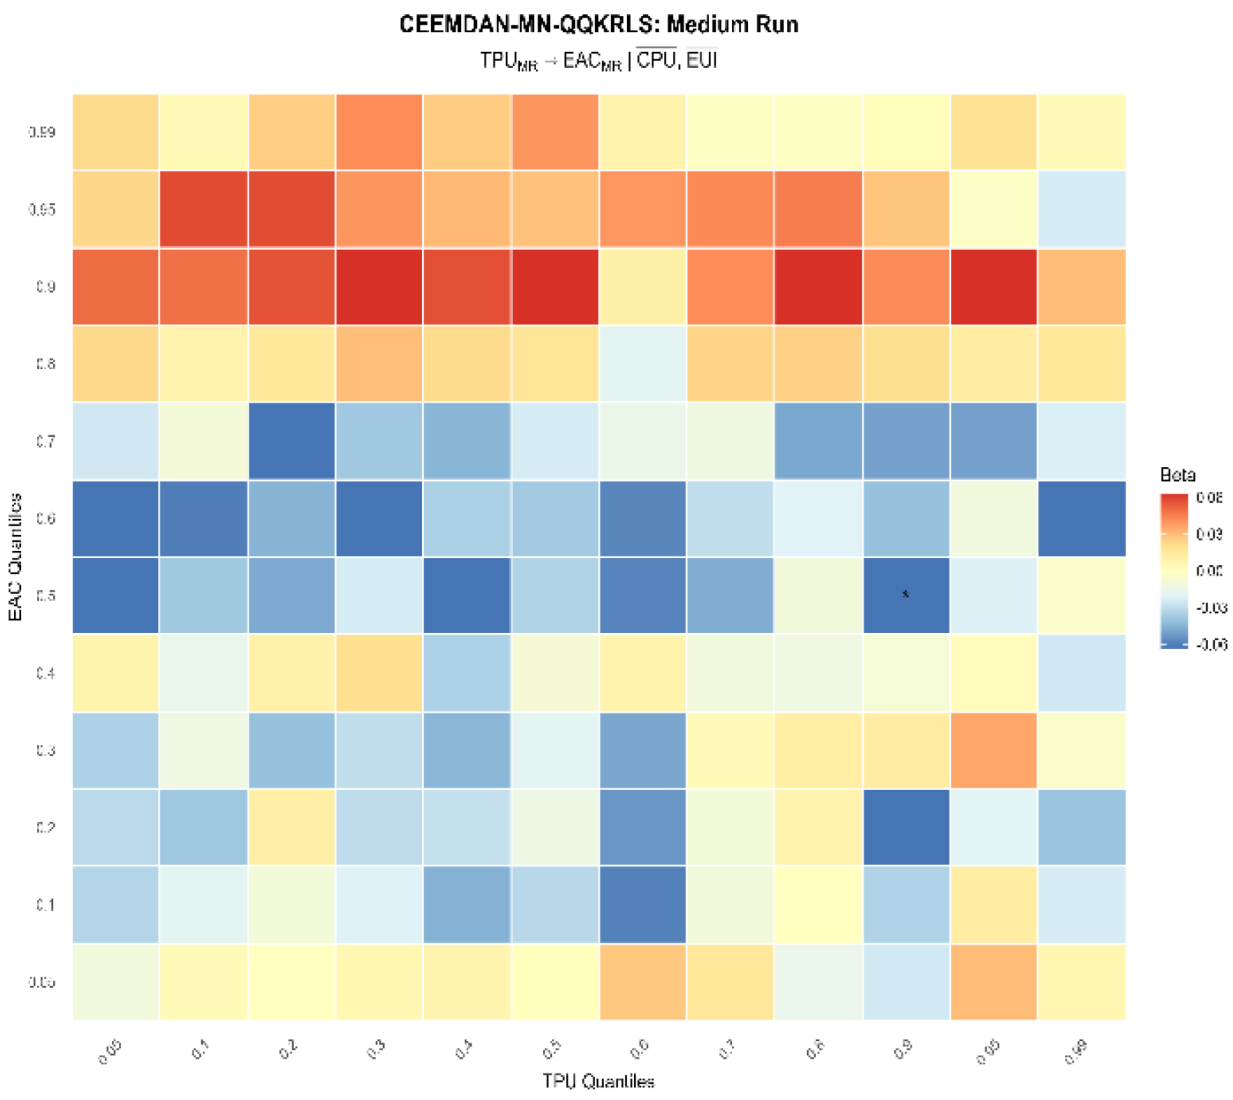
Figure 13.
Trade Policy Uncertainty and EAC (Long-run).
4.6. Robustness Check
To validate our estimations, we utilize the multivariate wavelet quantile regression (MWQR). Figure 14, Figure 15 and Figure 16 showcase these outcomes. These results reported in Figure 8 confirm that high levels of CPU tend to decrease economic activity. This entails that consistent climate policy uncertainty proves to be a structural suppressant of economic activity in the US, especially when the economy is in normal or growth states. The EUI-EAC nexus renders mix results with positive and negative associations in the quantiles of both variables, whereas the positive impact is dominant in the long-run the positive impact is owing to the growing demand of energy in the US where economic activity and the inherent uncertainties pertaining to the complex energy markets move in the same direction in the long-run. Conversely, the heatmap also endorse a significant negative association in high-frequency bands, when the higher economic activity is on boom. This infer while energy uncertainty and economic activity move together in the long run, sudden energy shocks or changes slow down industrial productivity amidst expansionary period. The dual nature (positive and negative influence) of EUI suggest that US economy resilience is buffered by scale and as well as diversification, notwithstanding the growth intensive sectors are highly responsive to short and medium EUI shocks. The TPU-EAC outcomes imply that trade policy uncertainty proves to be a structural headwind for firms, and ambiguity in trade rules discourages firms to opt for global market expansion. This cautious behaviour slowdown economic activity in the long-run. Hence, these outcomes validate our main estimations.
Figure 14.
MVWQR results between CPU and EAC.
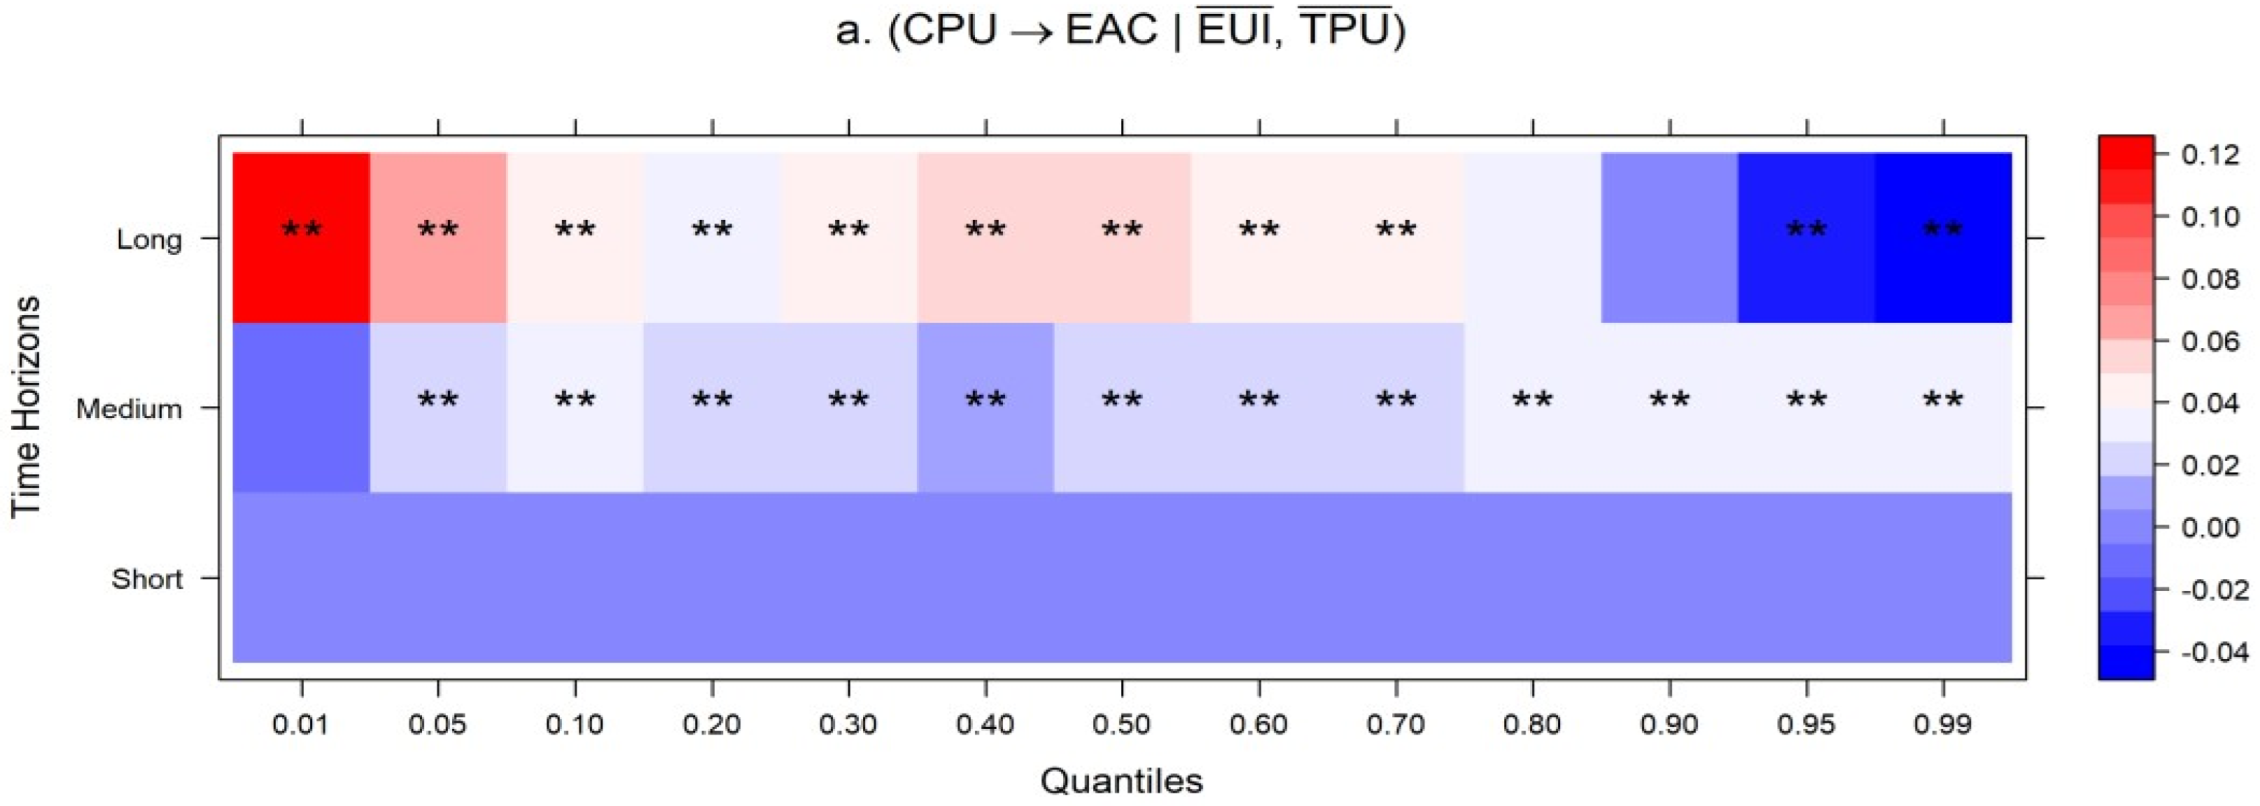
Figure 15.
MVWQR results between EUI and EAC.
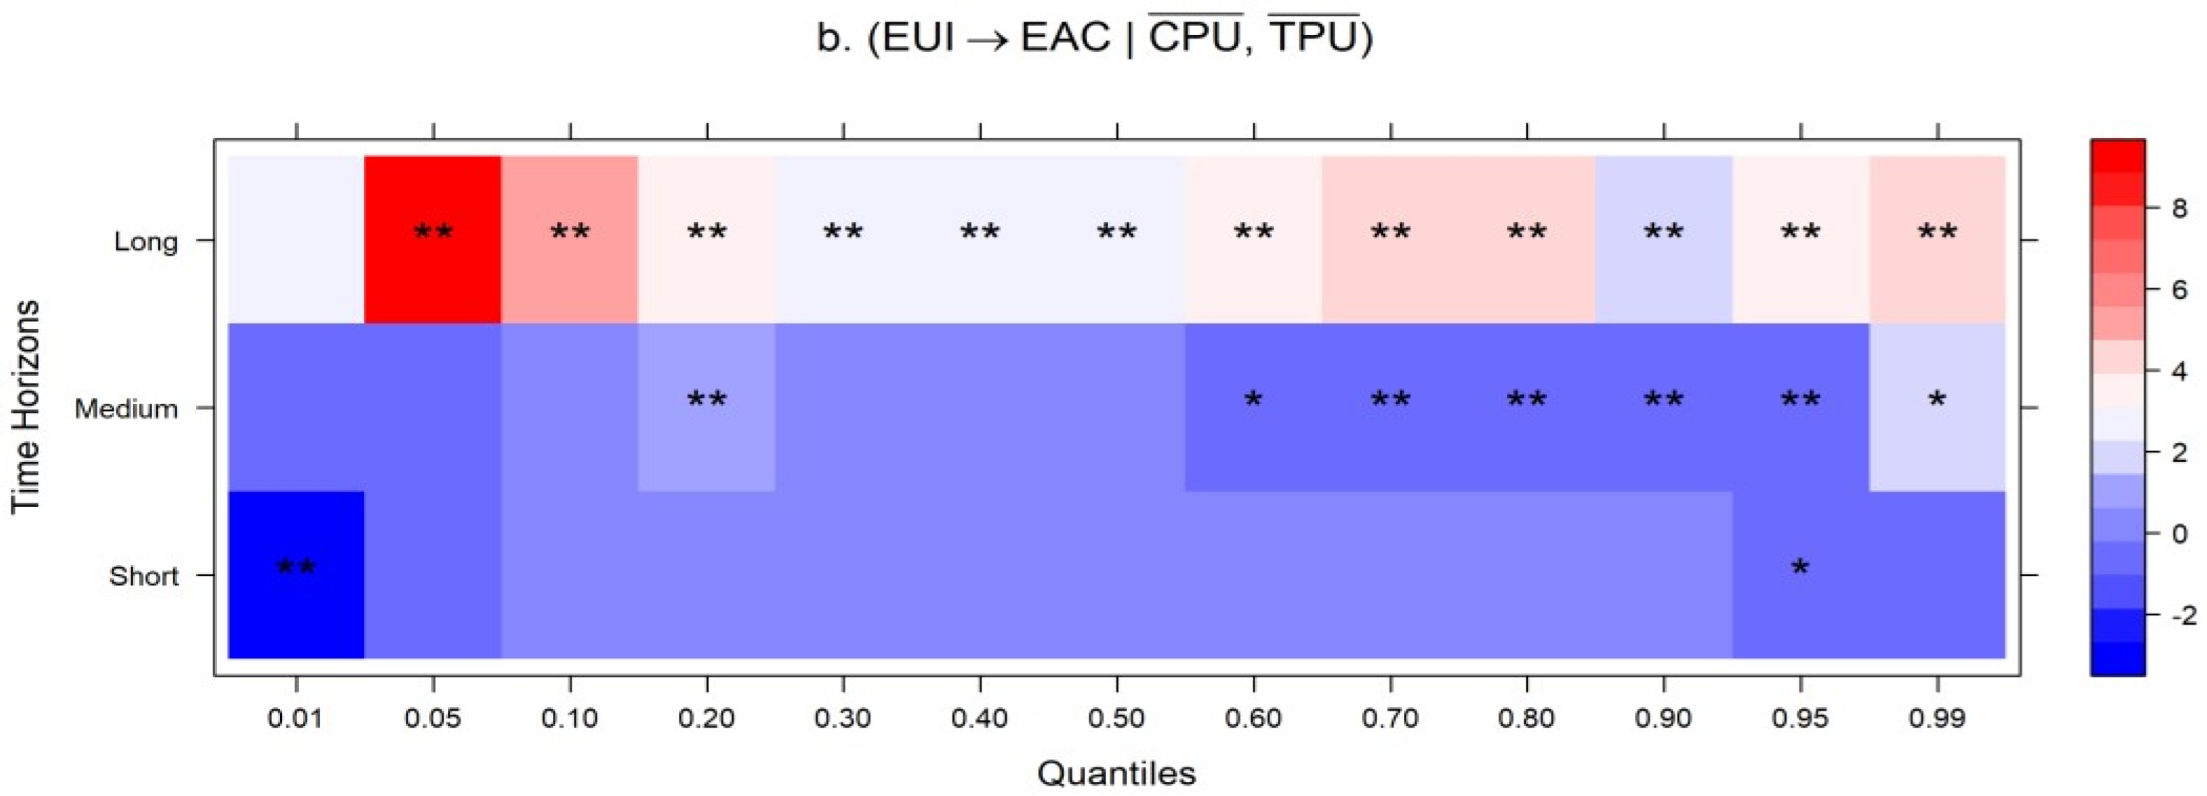
Figure 16.
MVWQR results between TPU and EAC.
5. Conclusions and Policy Implications
The outlook of the US economy is largely predicated on climate policy, energy mix transitions, and a dynamic trade policy. This ‘uncertainty triad’ including CPU, EUI, and TPU does not work in tandem; instead, volatility in one domain, such as spills over to another e.g., change in carbon mandates tariff fluctuations, fundamentally reshaping the U.S. economic performance. This paper contributes to the existing literature by investigating the impact of climate, energy and trade policy uncertainty on economic activity on the U.S economic activity through a novel CEEMDAN-based Multivariate Nyström-quantile-on-quantile (C-MN-QQKRLS) framework. This approach is uniquely capable of being isolating the individual impact of each uncertainty facets in the presence of other uncertainties. Moreover, this approach succinctly unravels the non-linear dependencies between a triad of policy uncertainties including climate policy uncertainty (CPU), energy-related uncertainty (EUI), and trade policy uncertainty (TPU), and economic activity (EAC) in the United States in the time and frequency perspectives, enabling us to identify short-, medium and long-term effects.
The outcomes suggest that in the short-run both CPU and ENU exert localized positive shocks at lower quantiles of EAC reflecting immediate tactical adjustments by economic agents. Conversely, the influence of CPU and TPU becomes profoundly negative over long-run horizons, especially in median-to-high quantiles of EAC proving both to be significant drag on the economic activity. The EUI outcomes exhibits fluctuation exhibiting positive and negative trends and is highly stipulated to the prevailing economic conditions. The study concludes that the U.S. economic output reacts disproportionately to uncertainty ‘triad’ relies across varying time horizons. The economy receives positive influence from CPU EUI and TPU in the short-term, nonetheless cumulative ambiguities pertaining to climate, energy, and trade policies buildup persistent downward pressure, impeding the economic output in the long run. The results highlight the heterogeneous impact of climate, energy and trade policy uncertainties on economic activity, favouring transparent policies pertaining to this triad.
Policymakers should carefully consider the potential impacts of climate policy uncertainty and energy-related uncertainty on economic activity when designing and implementing environmental policies, and take into consideration the disproportionate impact of these uncertainties on the economic activity in the United States. The dual nature of EUI entails that while the size and diversification serve as cushions in the long-run, the high-performance sectors remain exhibit vulnerability to fluctuations in the sudden energy market. Hence, Energy Security (SDG 7) should remain the core objective to the policymakers to cope with short and medium and long-run shocks for steady long-term industrial output. Policymakers should support investment in clean energy projects. Incentives e.g., tax breaks, subsidies, or loan guarantees specifically aimed at augmenting the clean energy sector can reduce uncertainty pertaining to climate. In terms of energy sector, the findings also emphasize on the long-term planning and consistent policy. Frequent or abrupt policy changes or other type of regulatory burden leads to uncertainty and influences firms’ investment decisions. In this regard, sector tailored policies can pave the way for predictable transition from dirty to clean energy sources. The findings also highlight another aspect affirming that EUI can boost innovative activities and act as a blessing in disguise.
As uncertainty about trade is embedded in geopolitical frictions such as trade tensions and economic policy uncertainty, pragmatic measures are required to overcome geopolitical tension between USA and its major trading partners. Predictable trade practices, and geopolitical stability stabilize both local and global economy. Hence minimal trade frictions should be the highest priority of the broader policy objective. As TPU bears positive influence on EAC in the short-term, this observation must be strategically monitored, as the effect becomes negative in the medium to long-run. Based on these findings, a vigilant policy stance is second to none. The Federal Reserve should opt for proper forward-looking guidance to mitigate the medium- to long-run uncertainty about trade. Timely and clear communication about major trade policy change should be conveyed to the stakeholders, as such type communication is indispensable for anchoring market expectations. Doing so will also attenuate the intensity systemic shocks on the US economy. Hence, coordinated structural changes should take place in tandem, with a focus to minimize information asymmetry among stakeholder. Such transparency will appease spikes in TPU and enable policymakers to control the trade-related systematic instability particularly in the medium to long-run.
As the uncertainty triad (CPU, EUI and TPU) is a global challenge, mutually inclusive cooperation for navigating it is the major cry of the day. International integration through effective cooperation will wipe out trade policy frictions, and remove the tag of TPU, which has become a pervasive tool for geopolitical imbalance and economic fragmentation in recent times. Pragmatic global efforts such as appeased geopolitical tension and the adoption of clean energy solutions can abate these uncertainty facets. To maintain steady economic activity, the US must subside policy-induced risks. This objective can be achieved by converting short-term directives to pragmatic and sustained high-quality institutional frameworks; which are capable of absorbing political volatility. By recognizing the nonlinear and frequency-dependent nature of these uncertainty facets vis-a-vis economic output, policymakers can opt for targeted interventions by recalibrating tools and strategies necessary for steady industrial productivity. A more prosperous and balanced future for the U.S. may be achieved with the help of these ideas. The recommendations of the study will serve as a blueprint for other countries grappling with comparable policy uncertainty malaise.
Competing interests
The authors declare not competing interests.
Data Sources
Although this research work uses publicly accessed data, however the data is also available from the corresponding author upon reasonable request.
| 1 | The U.S. emits a total of 5.2 billion metric tons of CO2 equivalents (USEPA, 2022) |
| 2 | The U.S. has become subject to more frequent extreme weather events, such as extreme temperatures, wildfires, floods, and hurricanes. |
| 3 | Shahbaz et al. (2016) argue that industrial production reflects economic growth as it gauges real economic activity. |
References
- Adebayo, T. S. (2022). Environmental consequences of fossil fuel in Spain amidst renewable energy consumption: a new insights from the wavelet-based Granger causality approach. International Journal of Sustainable Development and World Ecology. [CrossRef]
- Adebayo, T. S., Meo, M. S., Eweade, B. S., & Özkan, O. (2024). Examining the effects of solar energy innovations, information and communication technology and financial globalization on environmental quality in the United States via quantile-on-quantile KRLS analysis. Solar Energy, 272, 112450.
- Adebayo, T. S., Özkan, O., & Eweade, B. S. (2024). Do energy efficiency R&D investments and information and communication technologies promote environmental sustainability in Sweden? A quantile-on-quantile KRLS investigation. Journal of Cleaner Production, 440, 140832. [CrossRef]
- Adebayo, T. S., Razi, U., Özkan, O., & Syed, Q. R. (2025). Assessing the Influence of US-China Trade Disputes on Crude Oil and Gold Prices: A Wavelet Quantile-on-Quantile Regression Approach. Computational Economics, 1–21.
- Adedoyin, F. F., & Zakari, A. (2020). Energy consumption, economic expansion, and CO2 emission in the UK: The role of economic policy uncertainty. Science of the Total Environment. [CrossRef]
- Aguiar-Conraria, L., & Soares, M. J. (2011). Oil and the macroeconomy: Using wavelets to analyze old issues. Empirical Economics. [CrossRef]
- Aguiar-Conraria, L., & Soares, M. J. (2014). The continuous wavelet transform: Moving beyond uni- and bivariate analysis. Journal of Economic Surveys. [CrossRef]
- Akadiri, S. Saint, Ozkan, O., Ogbekene, I., & Hamza, F. (2025). Oil shocks and unexpected economic policy uncertainty: evidence from wavelet nonparametric quantile causality. Humanities and Social Sciences Communications. [CrossRef]
- Alharbi, S. S., Tabash, M. I., Farooq, U., & Issa, S. S. (2025). How does climate policy uncertainty determine green innovation adoption? New perspectives from the BRICS. Journal of Economic Asymmetries. [CrossRef]
- Bai, D., Du, L., Xu, Y., & Abbas, S. (2023). Climate policy uncertainty and corporate green innovation: Evidence from Chinese A-share listed industrial corporations. Energy Economics, 127, 107020. [CrossRef]
- Bakhsh, S., Alam, M. S., & Zhang, W. (2024). Green finance and Sustainable Development Goals: is there a role for geopolitical uncertainty? Economic Change and Restructuring, 57(4), 137.
- Balcilar, M., Bekiros, S., & Gupta, R. (2017). The role of news-based uncertainty indices in predicting oil markets: a hybrid nonparametric quantile causality method. Empirical Economics. [CrossRef]
- Baruník, J., & Křehlík, T. (2018). Measuring the frequency dynamics of financial connectedness and systemic risk. Journal of Financial Econometrics. [CrossRef]
- Basaglia, P., Carattini, S., Dechezleprêtre, A., & Kruse, T. (2022). Climate policy uncertainty and firms’ and investors’ behavior Frontiers of climate and nature in macroeconomics and finance, Paris.
- Basher, S., Mamun, A., Bal, H., Hoque, N., & Uddin, M. (2023). Does capital flight tone down economic growth? Evidence from emerging Asia. Journal of Financial Economic Policy. [CrossRef]
- Benigno, G., & Groen, J. J. (2020). Uncertainty about Trade Policy Uncertainty. SSRN Electronic Journal. [CrossRef]
- Bernanke, B. S. (1983). Irreversibility, Uncertainty, and Cyclical Investment. The Quarterly Journal of Economics, 98(1), 85. [CrossRef]
- Bouri, E., Iqbal, N., & Klein, T. (2022). Climate policy uncertainty and the price dynamics of green and brown energy stocks. Finance Research Letters. [CrossRef]
- Caldara, D., Iacoviello, M., Molligo, P., Prestipino, A., & Raffo, A. (2020). The economic effects of trade policy uncertainty. Journal of Monetary Economics, 109, 38–59. [CrossRef]
- Caldara, D., Iacoviello, M., Prestipino, A., Raffo, A., & Steinberg, J. B. (2019). Comment on : “ The economic effects of Trade Policy. xxxx. [CrossRef]
- Chatziantoniou, I., Gabauer, D., & Stenfors, A. (2021). Interest rate swaps and the transmission mechanism of monetary policy: A quantile connectedness approach. Economics Letters. [CrossRef]
- Chen, Y., Bouri, E., & Zhang, L. (2025). Dynamics of co-bubble networks across commodity futures prices and portfolio performance. Energy Economics, 150, 108839. [CrossRef]
- Chishti, M. Z., & Dogan, E. (2022). Analyzing the determinants of renewable energy: The moderating role of technology and macroeconomic uncertainty. Energy and Environment. [CrossRef]
- COP 26. (2021). COP26: Together for our planet | United Nations.
- Cui, C., & Li, L. S. Z. (2023). Trade policy uncertainty and new firm entry: Evidence from China. Journal of Development Economics. [CrossRef]
- Dai, J., Farooq, U., & Alam, M. M. (2025). Navigating energy policy uncertainty: Effects on fossil fuel and renewable energy consumption in G7 economies. International Journal of Green Energy. [CrossRef]
- Dang, T. H.-N., Nguyen, C. P., Lee, G. S., Nguyen, B. Q., & Le, T. T. (2023). Measuring the energy-related uncertainty index. Energy Economics, 124, 106817. [CrossRef]
- Danish, Ulucak, R., & Khan, S. (2020). Relationship between energy intensity and <scp> CO 2 </scp> emissions: Does economic policy matter? Sustainable Development, 28(5), 1457–1464. [CrossRef]
- Diebold, F. X., & Yilmaz, K. (2012). Better to give than to receive: Predictive directional measurement of volatility spillovers. International Journal of Forecasting, 28(1), 57–66. [CrossRef]
- Fajgelbaum, P. D., Schaal, E., & Taschereau-Dumouchel, M. (2017). Uncertainty traps. The Quarterly Journal of Economics, 132(4), 1641–1692.
- Fankhauser, S., & Tol, R. S. J. (2005). On climate change and economic growth. Resource and Energy Economics. [CrossRef]
- Gabauer, D., Dang, T. H. N., & Nguyen, C. P. (2025). The lead-lag relationship of US fiscal policy uncertainty: New evidence from R2 decomposed connectedness measures. Finance Research Letters. [CrossRef]
- Gabauer, D., & Gupta, R. (2018). On the transmission mechanism of country-specific and international economic uncertainty spillovers: Evidence from a TVP-VAR connectedness decomposition approach. Economics Letters. [CrossRef]
- Gavriilidis, K. (2021). Measuring Climate Policy Uncertainty. SSRN Electronic Journal. [CrossRef]
- Golub, A., Lubowski, R., & Piris-Cabezas, P. (2017). Balancing Risks from Climate Policy Uncertainties: The Role of Options and Reduced Emissions from Deforestation and Forest Degradation. Ecological Economics. [CrossRef]
- Gopinath, M. (2021). Does Trade Policy Uncertainty Affect Agriculture? Applied Economic Perspectives and Policy, 43(2), 604–618. [CrossRef]
- Handley, K., & Limão, N. (2017). Policy uncertainty, trade, and welfare: Theory and evidence for China and the United States. American Economic Review. [CrossRef]
- Handley, K., & Limão, N. (2022). Trade policy uncertainty. Annual Review of Economics, 14(1), 363–395.
- Hassan, S., Shabi, S., & Choudhry, T. (2018). Asymmetry, uncertainty and international trade. Swansea University, School of Management.
- He, M., & Zhang, Y. (2022). Climate policy uncertainty and the stock return predictability of the oil industry. Journal of International Financial Markets, Institutions and Money. [CrossRef]
- He, X., Takiguchi, T., Nakajima, T., & Hamori, S. (2020). Spillover effects between energies, gold, and stock: the United States versus China. Energy & Environment, 31(8), 1416–1447. [CrossRef]
- Hoang, H. V. (2024). Environmental, social, and governance disclosure in response to climate policy uncertainty: Evidence from US firms. Environment, Development and Sustainability. [CrossRef]
- Ilhan, E., Sautner, Z., & Vilkov, G. (2021). Carbon Tail Risk. Review of Financial Studies. [CrossRef]
- JO, S. (2014). The Effects of Oil Price Uncertainty on Global Real Economic Activity. Journal of Money, Credit and Banking, 46(6), 1113–1135. [CrossRef]
- Jurado, K., Ludvigson, S. C., & Ng, S. (2015). Measuring uncertainty. American Economic Review. [CrossRef]
- Karim, S., Naeem, M. A., Shafiullah, M., Lucey, B. M., & Ashraf, S. (2023). Asymmetric relationship between climate policy uncertainty and energy metals: Evidence from cross-quantilogram. Finance Research Letters, 54, 103728. [CrossRef]
- Kilian, L. (2009). Not all oil price shocks are alike: Disentangling demand and supply shocks in the crude oil market. American Economic Review. [CrossRef]
- Koenker, R., & Bassett Jr, G. (1978). Regression quantiles. Econometrica: Journal of the Econometric Society, 33–50.
- Kumar, A. S., & Padakandla, S. R. (2022). Testing the safe-haven properties of gold and bitcoin in the backdrop of COVID-19: A wavelet quantile correlation approach. Finance Research Letters, 47, 102707. [CrossRef]
- Kuzminov, I., Bereznoy, A., & Bakhtin, P. (2017). Global energy challenges and the national economy: Stress scenarios for Russia. Foresight, 19(2), 174–197.
- Li, X., Hu, Z., & Zhang, Q. (2021). Environmental regulation, economic policy uncertainty, and green technology innovation. Clean Technologies and Environmental Policy, 23(10), 2975–2988. [CrossRef]
- Lin, B., & Wang, Z. (2025). Economic policy uncertainty, coal price, and industrial output: Evidence from China. Energy. [CrossRef]
- Lin, B., & Zhao, H. (2023a). Tracking policy uncertainty under climate change. Resources Policy, 83, 103699.
- Lin, B., & Zhao, H. (2023b). Tracking policy uncertainty under climate change. Resources Policy, 83, 103699. [CrossRef]
- Lu, Z., Zhu, L., Lau, C. K. M., Isah, A. B., & Zhu, X. (2021). The Role of Economic Policy Uncertainty in Renewable Energy-Growth Nexus: Evidence From the Rossi-Wang Causality Test. Frontiers in Energy Research. [CrossRef]
- Meinhold, R., Wagner, C., & Dhar, B. K. (2025). Digital sustainability and eco-environmental sustainability: A review of emerging technologies, resource challenges, and policy implications. Sustainable Development, 33(2), 2323–2338.
- Melas, K. D., Michail, N. A., & Louca, K. G. (2025). Trade Uncertainty, Economic Policy Uncertainty and Shipping Costs. German Economic Review, 26(1), 15–33. [CrossRef]
- Meo, M. S., Erum, N., & Ayad, H. (2024). Understanding how climate preferences, environmental policy stringency, and energy policy uncertainty shape renewable energy investments in Germany. Clean Technologies and Environmental Policy, 1–21.
- Nema, P., Nema, S., & Roy, P. (2012). An overview of global climate changing in current scenario and mitigation action. In Renewable and Sustainable Energy Reviews. [CrossRef]
- Niu, S., Zhang, J., Luo, R., & Feng, Y. (2023). How does climate policy uncertainty affect green technology innovation at the corporate level? New evidence from China. Environmental Research. [CrossRef]
- Ozkan, O., Haruna, R. A., ALOLA, A. A., Ghardallou, W., & Usman, O. (2023). Investigating the nexus between economic complexity and energy-related environmental risks in the USA: Empirical evidence from a novel multivariate quantile-on-quantile regression. Structural Change and Economic Dynamics. [CrossRef]
- Özkan, O., Meo, M. S., & Younus, M. (2024). Unearthing the hedge and safe-haven potential of green investment funds for energy commodities. Energy Economics. [CrossRef]
- Pavel, T., Amina, A., & Oleg, K. (2024). The impact of economic development of primary and secondary industries on national CO2 emissions: The case of Russian regions. Journal of Environmental Management. [CrossRef]
- Poilly, C., & Tripier, F. (2025). Regional trade policy uncertainty. Journal of International Economics, 155, 104078.
- Polanco-Martínez, J. M., Fernández-Macho, J., & Medina-Elizalde, M. (2020). Dynamic wavelet correlation analysis for multivariate climate time series. Scientific Reports, 10(1), 21277. [CrossRef]
- Punzi, M. T. (2019). The impact of energy price uncertainty on macroeconomic variables. Energy Policy. [CrossRef]
- Ren, X., Li, J., He, F., & Lucey, B. (2023). Impact of climate policy uncertainty on traditional energy and green markets: Evidence from time-varying granger tests. Renewable and Sustainable Energy Reviews, 173, 113058.
- Rial, R. C. (2024). Biofuels versus climate change: Exploring potentials and challenges in the energy transition. Renewable and Sustainable Energy Reviews, 196, 114369.
- Salisu, A. A., Ogbonna, A. E., Gupta, R., & Bouri, E. (2024). Energy-related uncertainty and international stock market volatility. The Quarterly Review of Economics and Finance, 95, 280–293.
- Sarker, P. K., Lau, C. K. M., & Pradhan, A. K. (2023). Asymmetric effects of climate policy uncertainty and energy prices on bitcoin prices. Innovation and Green Development. [CrossRef]
- Shang, Y., Han, D., Gozgor, G., Mahalik, M. K., & Sahoo, B. K. (2022). The impact of climate policy uncertainty on renewable and non-renewable energy demand in the United States. Renewable Energy. [CrossRef]
- Sheng, X., Gupta, R., & Çepni, O. (2022). The effects of climate risks on economic activity in a panel of US states: The role of uncertainty. Economics Letters. [CrossRef]
- Sim, N., & Zhou, H. (2015). Oil prices, US stock return, and the dependence between their quantiles. Journal of Banking and Finance. [CrossRef]
- Sinha, A., Ghosh, V., Hussain, N., Nguyen, D. K., & Das, N. (2023). Green financing of renewable energy generation: Capturing the role of exogenous moderation for ensuring sustainable development. Energy Economics, 126, 107021. [CrossRef]
- Sinha, A., Murshed, M., Das, N., & Saha, T. (2025). Modeling renewable energy market performance under climate policy uncertainty: A novel multivariate quantile causality analysis. Risk Analysis. [CrossRef]
- Su, C. W., Pang, L. D., Qin, M., Lobonţ, O. R., & Umar, M. (2023). The spillover effects among fossil fuel, renewables and carbon markets: Evidence under the dual dilemma of climate change and energy crises. Energy. [CrossRef]
- Sun, G., Fang, J., Li, T., & Ai, Y. (2024). Effects of climate policy uncertainty on green innovation in Chinese enterprises. International Review of Financial Analysis, 91, 102960. [CrossRef]
- Sunday Adebayo, T. (2025). How do energy and precious metals markets respond to climate policy uncertainty? A multi-frequency quantile framework. Applied Economics Letters, 1–7.
- Tam, K.-P., Chan, H.-W., & Clayton, S. (2023). Climate change anxiety in China, India, Japan, and the United States. Journal of Environmental Psychology, 87, 101991.
- The Impact of Uncertainty Shocks. (2009). Econometrica. [CrossRef]
- Torrence, C., & Compo, G. P. (1998). A Practical Guide to Wavelet Analysis. Bulletin of the American Meteorological Society, 79(1), 61–78. [CrossRef]
- Troster, V., Shahbaz, M., & Uddin, G. S. (2018). Renewable energy, oil prices, and economic activity: A Granger-causality in quantiles analysis. Energy Economics. [CrossRef]
- Tsoutsos, T. D., & Stamboulis, Y. A. (2005). The sustainable diffusion of renewable energy technologies as an example of an innovation-focused policy. Technovation, 25(7), 753–761.
- van Eyden, R., Difeto, M., Gupta, R., & Wohar, M. E. (2019). Oil price volatility and economic growth: Evidence from advanced economies using more than a century’s data. Applied Energy, 233–234, 612–621. [CrossRef]
- Wang, Y., Huang, X., & Huang, Z. (2024). Energy-related uncertainty and Chinese stock market returns. Finance Research Letters, 62, 105215. [CrossRef]
- Xie, G., Chen, J., Hao, Y., & Lu, J. (2021). Economic Policy Uncertainty and Corporate Investment Behavior: Evidence from China’s Five-Year Plan Cycles. Emerging Markets Finance and Trade. [CrossRef]
- Xie, Z., Ali, H., Kumar, S., Naz, S., & Ahmed, U. (2024). The Impact of Energy-Related Uncertainty on Corporate Investment Decisions in China. Energies, 17(10), 2368.
- Xu, Y., Li, M., Yan, W., & Bai, J. (2022). Predictability of the renewable energy market returns: The informational gains from the climate policy uncertainty. Resources Policy, 79, 103141. [CrossRef]
- Yang, S., & Fu, Y. (2025). Interconnectedness among supply chain disruptions, energy crisis, and oil market volatility on economic resilience. Energy Economics. [CrossRef]
- Yilmazkuday, H. (2025). U.S. tariffs and stock prices. Finance Research Letters, 83, 107708. [CrossRef]
- Zhang, H., Hong, H., & Ding, S. (2023). The role of climate policy uncertainty on the long-term correlation between crude oil and clean energy. Energy. [CrossRef]
- Zhang, X., & Guo, Q. (2024). How useful are energy-related uncertainty for oil price volatility forecasting? Finance Research Letters, 60, 104953. [CrossRef]

Table 1.
Descriptive Statistics.
| EAC | CPU | EUI | TPU | |
|---|---|---|---|---|
| Mean | 97.132 | 128.008 | 1.295 | 117.803 |
| Median | 98.761 | 104.819 | 1.124 | 50.050 |
| Maximum | 104.100 | 411.289 | 4.257 | 1946.683 |
| Minimum | 84.562 | 28.162 | 0.101 | 6.467 |
| Standard Deviation | 4.824 | 67.940 | 0.677 | 210.593 |
| Skewness | -0.702 | 1.121 | 1.212 | 4.517 |
| Kurtosis | 2.405 | 3.972 | 5.040 | 29.868 |
| Jarque-Bera | 26.427 | 67.939 | 114.154 | 9139.833 |
| Probability | 0.000 | 0.139 | 0.000 | 0.000 |
Note: Economic activity (EAC), climate policy uncertainty (CPU), energy-related uncertainty (ENU). Sample period is February 2001 to October, 2023. The probability values represent the Jarque-Bera test statistics.
| Variable | Test | Statistic | P-Value | Significance | Interpretation | Observations |
|---|---|---|---|---|---|---|
| EAC | Bartels Test | 0.0415 | 0.000 | *** | Non-random | 273 |
| EAC | Robust Jarque-Bera Test | 23.1 | 0.000 | *** | Non-normal | 273 |
| EAC | SJ Test | -0.529 | 0.696 | -- | Normal | 273 |
| EAC | Bootstrap Symmetry Test | -7.32 | 0.000 | *** | Asymmetric | 273 |
| EAC | Difference Sign Test | 5.23 | 0.000 | *** | Non-random | 273 |
| EAC | Mann-Kendall Rank Test | 11.3 | 0.000 | *** | Trend present | 273 |
| EAC | Runs Test | -14.9 | 0.000 | *** | Non-random | 273 |
| CPU | Bartels Test | 0.542 | 0.000 | *** | Non-random | 273 |
| CPU | Robust Jarque-Bera Test | 99.8 | 0.000 | *** | Non-normal | 273 |
| CPU | SJ Test | 3.95 | 0.0014 | *** | Non-normal | 273 |
| CPU | Bootstrap Symmetry Test | 7.94 | 0.000 | *** | Asymmetric | 273 |
| CPU | Difference Sign Test | 0 | 1.000 | -- | Random | 273 |
| CPU | Mann-Kendall Rank Test | 12.8 | 0.000 | *** | Trend present | 273 |
| CPU | Runs Test | -7.53 | 0.000 | *** | Non-random | 273 |
| EUI | Bartels Test | 1.02 | 0.000 | *** | Non-random | 273 |
| EUI | Robust Jarque-Bera Test | 145 | 0.000 | *** | Non-normal | 273 |
| EUI | SJ Test | 3.92 | 0.0015 | *** | Non-normal | 273 |
| EUI | Bootstrap Symmetry Test | 5.88 | 0.000 | *** | Asymmetric | 273 |
| EUI | Difference Sign Test | -0.628 | 0.530 | -- | Random | 273 |
| EUI | Mann-Kendall Rank Test | 0.834 | 0.404 | -- | No trend | 273 |
| EUI | Runs Test | -4.98 | 0.000 | *** | Non-random | 273 |
| TPU | Bartels Test | 0.782 | 0.000 | *** | Non-random | 273 |
| TPU | Robust Jarque-Bera Test | 7.07e+05 | 0.000 | *** | Non-normal | 273 |
| TPU | SJ Test | 56.7 | 0.000 | *** | Non-normal | 273 |
| TPU | Bootstrap Symmetry Test | 13.5 | 0.000 | *** | Asymmetric | 273 |
| TPU | Difference Sign Test | -0.944 | 0.345 | -- | Random | 273 |
| TPU | Mann-Kendall Rank Test | 4.55 | 0.000 | *** | Trend present | 273 |
| TPU | Runs Test | -7.53 | 0.000 | *** | Non-random | 273 |
Table 3.
Multi-variate normality test results for EAC, CPU, EUI and TPU.
| Test | Null Hypothesis | Interpretation | Assessment |
|---|---|---|---|
| Skewness | Reject H0: Significant multivariate skewness present | Non-normal | |
| Kurtosis | Reject H0: Significant multivariate kurtosis present | Non-normal |
Disclaimer/Publisher’s Note: The statements, opinions and data contained in all publications are solely those of the individual author(s) and contributor(s) and not of MDPI and/or the editor(s). MDPI and/or the editor(s) disclaim responsibility for any injury to people or property resulting from any ideas, methods, instructions or products referred to in the content. |
© 2026 by the authors. Licensee MDPI, Basel, Switzerland. This article is an open access article distributed under the terms and conditions of the Creative Commons Attribution (CC BY) license (http://creativecommons.org/licenses/by/4.0/).
Copyright: This open access article is published under a Creative Commons CC BY 4.0 license, which permit the free download, distribution, and reuse, provided that the author and preprint are cited in any reuse.


