Submitted:
09 June 2025
Posted:
10 June 2025
You are already at the latest version
Abstract
The volatility of oil prices poses significant risks for economic stability, energy planning, and climate policy, particularly as the United States transitions toward renewable energy. While prior research has examined how geopolitical and economic forces drive oil price volatility, fewer studies have evaluated the potential moderating role of renewable energy adoption. This paper aims to investigate whether increasing renewable energy consumption is associated with reduced oil price volatility in the U.S. A dataset was constructed from 2002 to 2021 using sources including the U.S. Energy Information Administration, FRED, the World Bank, and Our World in Data. Key variables include WTI oil prices; renewable energy consumption; crude oil production, consumption, imports, and stocks; GDP growth; and the Geopolitical Risk Index. OLS regression, Random Forest, and Logistic Regression models, as well as elasticity calculations for oil supply and demand were applied. The results show that traditional oil market fundamentals remain the most predictive of volatility, while renewable energy consumption has a weak and statistically insignificant effect. Correlation and regression analyses also reveal no strong relationship between renewable energy share and crude oil market elasticities. These findings suggest that although renewables are expanding, their ability to stabilize oil markets is not yet realized, with implications for policymakers seeking energy resilience through diversification.
Keywords:
renewable energy
; crude oil price volatility
; geopolitical risk
; energy transition
; United States
; elasticity
; classification models
; macroeconomic indicators
; fossil fuels
; energy security
The unpredictable nature of oil prices has proven to be a significant economic factor that affects both the United States economy and the worldwide financial system. The price fluctuations in oil trigger chain reactions that affect various sectors through their impact on inflation levels and GDP growth and consumer confidence and business investment decisions. The price fluctuations make it difficult for monetary policy implementation and increase the burden on both energy-importing households and industries (Hamilton, 2009). The main sources of oil price volatility throughout history have consisted of geopolitical tensions combined with production interruptions and market speculation along with unanticipated shifts in worldwide demand patterns (Kilian, 2008; Baumeister & Kilian, 2016). This market volatility continues to be a continuous obstacle for economic stability maintenance and energy price affordability management efforts of policymakers.
During the last several decades the worldwide energy sector experienced a transformative phase because of technological developments and environmental regulations. The market transition from fossil fuels to renewable energy sources such as solar photovoltaics wind power hydroelectric energy and biofuels has introduced new operational patterns. Renewable energy consumption as a percentage of total final energy consumption in the United States has been rising steadily because of federal incentives state mandates decreasing technology costs and increasing public climate change concerns (EIA, 2023). The expanding presence of renewable energy requires evaluation regarding its effects on both environmental sustainability and oil market price volatility.
Theorists believe renewable energy expansion can function as a protective mechanism against price fluctuations in oil markets. The growing presence of domestic renewable energy sources which operate in distributed networks and face fewer geopolitical risks will decrease the U.S. economy’s dependency on volatile worldwide oil market prices. Such changes would stabilize macroeconomic results by decreasing how energy usage reacts to international supply interruptions and market speculation. The integration of various energy sources according to economists enhances security and helps minimize price fluctuations because it minimizes the need for immediate adjustments to global oil supply and demand changes (IEA, 2020; van der Ploeg & Rezai, 2020).
The empirical research regarding how renewable energy adoption affects price volatility shows mixed results along with scarce supporting evidence. The majority of research in this field employs models that analyze oil price volatility through geopolitical indices, structural VAR models and supply-demand elasticity frameworks (Caldara & Iacoviello, 2022; Kilian & Murphy, 2014). These models effectively analyze traditional price stability factors but neglect or diminish the capability of renewables to moderate price volatility. Research studies about clean energy technologies and fossil fuel markets are increasing but remain in an early development phase even though they demonstrate the interaction between these two sectors. There is little research available that uses data to specifically analyze the relationship between renewable energy and oil price volatility within the United States context.
The research seeks to resolve this knowledge deficit by testing whether U.S. renewable energy consumption growth results in decreased crude oil price volatility. The research analyzes data from 2002 to 2021 through classification models combined with linear regressions and elasticity estimations to examine how increased renewable energy use affects oil price volatility in the United States. The analysis uses metrics such as oil price volatility and renewable energy share as well as GDP growth and geopolitical risk and oil market fundamentals (e.g., net imports and domestic production) to test the hypothesis that renewable energy expansion reduces U.S. oil price volatility.
Academic research into this relationship matters because it provides urgent practical value. The transition to cleaner energy systems demands knowledge about how renewable energy affects macroeconomic factors like market stability. Renewable energy adoption as a volatility-reducing factor will strengthen the economic justification for green investments while creating another compelling reason to speed up the energy transition. The obtained knowledge enables policymakers to develop better strategies for energy supply risk management and building resilience in oil-importing economies as well as constructing unified climate and energy frameworks that achieve environmental and economic targets.
This paper continues with the following structure to assess oil price volatility factors in historical context alongside modern energy market developments and renewable energy economic effects. The subsequent sections explain the research methodology before presenting empirical findings together with visualization elements and a comprehensive analysis of implications as well as limitations and proposed future research paths.
Literature Review
The study of how geopolitical events in oil-producing nations affect petroleum prices has received extensive academic attention especially regarding market stability. Oil-importing countries now embrace renewable energy at an increasing rate which transforms the fundamental dynamics of this relationship. The evaluation of this hypothesis within existing academic literature requires examination of five core areas which include the historical impact of geopolitical risks on crude oil prices and the role of renewable energy in reducing oil dependency and market diversification effects on geopolitical risks and emerging risks in renewable energy supply chains and significant research gaps.
Historical Impact of Geopolitical Risks on Crude Oil Prices
The concentration of crude oil production in unstable geopolitical areas such as the Middle East and parts of Africa and South America has traditionally made geopolitical risks a major force behind oil price volatility. Oil markets remain highly susceptible to political turmoil because short-term replacement of crude oil supply remains impossible. The prospect of any supply disruption triggers substantial price changes in the market. The 1973 Arab-Israeli War together with the OPEC oil embargo caused oil prices to increase fourfold while Western economies suffered from stagflation according to Hamilton (2011). The Iran-Iraq War and both the Gulf War of 1990-1991 and the 2003 Iraq invasion caused oil prices to rise dramatically because of real or expected supply interruptions (Baumeister & Kilian, 2016).
The Geopolitical Risk (GPR) Index which combines thousands of newspaper articles to measure geopolitical threats was developed by Caldara and Iacoviello (2022) to systematically evaluate geopolitical effects. The authors demonstrate that rising scores on the GPR Index produce higher levels of oil price volatility. The research demonstrates that both physical attacks on oil facilities and sanctions imposition and geopolitical uncertainty perception trigger price spikes. Traders and investors base their decisions on these perceptions which drive speculative trading that intensifies market volatility according to Caldara and Iacoviello (2022).
Recent occurrences show this pattern in action. The Arab Spring protests in 2011 caused severe disruptions to regional oil production when Egypt and Tunisia along with Libya experienced political instability. The production decline in Libya reached more than 75% during a short period which led to a 20% rise in Brent crude prices while global oil supply remained stable (Fattouh & El-Katiri, 2012). The tensions between Iran and the United States regarding their Joint Comprehensive Plan of Action withdrawal in 2018 caused oil price fluctuations because of concerns about potential supply disruptions in the critical Strait of Hormuz which handles 20% of worldwide oil trade.
The historical relationship between geopolitical risk and oil prices remains robust but studies indicate this relationship has weakened in recent times. Kilian and Murphy (2021) demonstrate that the growth of U.S. shale oil production has established a flexible new supply source that enhances market resilience. The transformation in global oil supply systems has reduced the world’s dependence on politically volatile oil regions while enhancing the ability of markets to handle supply disruptions. According to Smith and Thompson (2021) the role of financial instruments including commodity futures and hedging tools has grown in importance for reducing short-term market responses to geopolitical news. Strategic petroleum reserves maintained by the United States and China together with financial instruments have created additional defense mechanisms against sudden price disturbances.A potential threat continues to exist despite every effort to reduce it. The September 2019 drone strikes on Saudi Aramco’s Abqaiq oil processing facilities temporarily cut 5% of global oil supply leading to a 15% price increase in one day (International Energy Agency, 2019). The market stabilized during the following weeks but the facility disruption demonstrated how physical interruptions at critical sites can create unexpected market disturbances. The Russian invasion of Ukraine during 2022 caused Europeans to worry about extended supply limitations and created new discussions about how geopolitical factors endanger worldwide energy supply networks (Jacks, 2023).
The analysis must consider how oil consumption patterns alongside supply systems continue to transform geographically. The increasing dominance of Asia as the main force behind global oil demand growth has resulted in the expansion of geopolitical risks throughout the region. The South China Sea tensions alongside Indian-Chinese border conflicts and Taiwanese-Taiwanese relations across the strait have emerged as possible triggers that could alter upcoming oil trade patterns. The increased military presence around maritime bottlenecks like the Strait of Hormuz and Bab el-Mandeb Strait and Strait of Malacca shows that oil supply routes continue to be vulnerable to geopolitical disruptions (Yergin, 2020).
Despite the enhanced resilience of the global oil market due to diversification and technological development and risk management capabilities it remains at risk from geopolitical disturbances. The expansion of US shale and unconventional sources reduces the strength of price responses but localized disruptions affecting major producers and transportation systems continue to cause major market reactions. The GPR Index demonstrates its value in tracking how geopolitical stories affect trading sentiment which in turn affects oil price volatility. The nature of geopolitical risk has transformed into an unpredictable force that causes widespread disruptions without being confined to any particular region.
Renewable Energy and the Decline of Oil Dependency
Renewable energy adoption leads to a major market shift which decreases oil consumption across numerous industries. The combination of technological progress and decreasing prices and environmental concerns and strong climate policies has led to this transition. The International Renewable Energy Agency [IRENA] (2022) reports that solar photovoltaics LCOE costs have dropped by 90% while onshore wind generation costs have decreased by more than 70% since the last decade. Renewable energy technologies have reached such cost competitiveness levels that they provide the most affordable power generation solutions throughout numerous regions worldwide. According to Aggarwal and Sharma (2022) renewable energy technologies are changing the way both developed and emerging economies make their energy investment choices.
The transition has largely been driven by governmental policies throughout this process. The European Union’s Green Deal has become a driving force for clean energy infrastructure investments while imposing stricter regulations on fossil fuel consumption to reach a climate-neutral continent by 2050. The world’s biggest energy consumer China has committed to reach its carbon emissions peak by 2030 before achieving complete carbon neutrality in 2060 through comprehensive changes in energy production and urban planning and industrial policy frameworks (Zhang & Chen, 2021). The United States’ Inflation Reduction Act of 2022 contains more than $360 billion worth of energy and climate provisions which include tax incentives for wind and solar infrastructure alongside accelerated electric vehicle deployment (U.S. Department of Energy, 2023). These policy indicators demonstrate a national-scale transition of energy strategies that reduces dependence on petroleum.
The transportation sector presents the most substantial disruption because it uses about 60% of the world’s total oil consumption according to the International Energy Agency [IEA] (2023). The growing number of electric vehicles decreases petroleum usage in this sector. The number of electric vehicle sales increased from 2.1 million in 2019 to reach over 10 million units in 2022 while the International Energy Agency (2023) predicts that EV sales will exceed 40 million annually by 2030. The transportation system in Norway demonstrates an oil-free future because electric vehicles make up more than 80% of new car sales according to IEA (2023). According to Oliver (2019) decentralized energy sources such as home solar charging systems reduce both the direct oil consumption and the macroeconomic sensitivity to oil prices as people shift to independent energy systems.
The transition process differs from one part of the world to another. According to Ramsey and Fischer (2020), a cleavage is forming in the global energy sector where high-income economies quickly adopt renewable energy yet low-income economies continue to depend on oil. In many areas of Sub-Saharan Africa, South Asia, and Latin America, oil is the most affordable energy option which becomes even cheaper when the absence of renewable energy financing and infrastructure support is considered. The split between oil market exposure for high-income nations and ongoing fossil fuel dependence among lower-income nations could result in an “energy dual-speed world”. The division has extensive effects that may reshape international alliances together with global trading systems and investment distributions.
The increasing adoption of renewable energy transforms both the global energy structure and the process of energy source substitution. Early research on renewables mainly concentrated on environmental benefits and economic advantages yet researchers now study their macroeconomic and geopolitical effects. Analyzing renewable adoption effects on traditional oil market structures as well as their context-specific implications will be essential for predicting upcoming energy security patterns and market stability developments.
Market Diversification and Resilience to Geopolitical Risks
The modern energy security framework relies on market diversification strategies because of escalating geopolitical instability and supply chain disruptions. Various initiatives make up this strategy which includes obtaining oil and gas from multiple nations and developing SPFs and renewable energy capacity while strengthening power grids through regional linkages and modern storage facilities. The market dominance of unstable energy-exporting countries diminishes through long-term stability when combined with the economic shock reduction provided by diversification (Aloui and Ben Aïssa, 2019). The shale revolution in the United States during the 2010s created a revolutionary change in the global energy political landscape. Advancements in hydraulic fracturing and horizontal drilling technologies transformed the United States into the world’s leading crude oil producer in 2018 while establishing it as a net exporter of petroleum products for the first time since the 1950s (U.S. Energy Information Administration [EIA], 2020). The transformation in energy production boosted American energy independence while reducing the control OPEC and Middle Eastern major producers exercised over market dynamics.
Similar patterns of diversification are occurring globally. The European Union launched REPowerEU as an initiative which enhanced the speed of renewable energy deployment and LNG import capacity because of Russia’s Ukraine invasion (European Commission, 2022). The countries of Germany, Italy and the Netherlands have swiftly expanded their gas import infrastructure through both building new LNG terminals and signing expanded contracts with suppliers like Qatar, Norway and the United States. The nations in East and South Asia including Japan, India, and South Korea have started implementing extended plans which focus on clean hydrogen along with offshore wind power and bioenergy to reduce their dependence on imported oil and gas from sensitive geopolitical areas.
Strategic petroleum reserves maintain equal significance in developing energy resilience. The United States together with China, India and Japan hold substantial emergency petroleum reserves which function to protect their supply lines from disruptions and price instability. The effectiveness of SPRs according to Yang and Chen (2018) depends on both reserve volume and quick and synchronized release procedures. The coordinated SPR releases by the International Energy Agency (IEA) totaling 60 million barrels demonstrated during the Libyan civil war in 2011 and again during the Russian invasion of Ukraine in 2022 showcase how SPRs function as strategic tools to control market volatility. These market interventions achieved price stability through the first few months before markets recognized the collective action against supply interruptions.
The deployment of renewable energy systems enhances the overall strength of the power network. Perez (2020) explains how battery storage technology advancements specifically lithium-ion and flow batteries have transformed renewable energy reliability. Grid operators utilize these systems to store solar and wind power produced during peak generation times before releasing it during high demand periods or when fossil fuel delivery becomes limited. The reduction of oil-fired “peaker” plant operations occurs because of decreased reliance on these units during both regular peak demand times and emergency shortage situations. The European interconnected transmission network (ENTSO-E) together with other cross-border grid interconnectivity projects enable real-time supply-demand equilibrium across national borders. Regional flexibility proves essential for minimizing supply disruptions and ensuring uninterrupted power distribution during times of geopolitical crises.
The private sector advances energy diversification through long-term investments and energy sourcing commitments which extend beyond public sector initiatives. Major multinational corporations including Google, Amazon, Microsoft and Apple have made commitments to use 100 percent renewable energy for their worldwide operations which creates global supply chain effects (Smith & Thompson, 2021). The company commitments drive clean energy infrastructure investments which boost the market for renewable power purchase agreements (PPAs) to lower fossil fuel-based generation dependence. The implementation of demand response programs together with smart grid technologies has improved the ability of energy systems to adapt. Real-time management tools allow consumers and grid operators to adjust their energy consumption according to current conditions which enhances system operational efficiency and speed during stressful external periods.
These developments show an essential transformation from centralized fossil fuel systems to decentralized flexible energy networks that operate with diversified infrastructure. The combination of SPRs with renewable integration and regional interconnectivity and private sector investment has strengthened modern energy markets against geopolitical risks. The ongoing development of energy systems shows promise to create a more resilient system which can handle external disturbances while ensuring economic stability and environmental protection for the long term.
Emerging Risks in Renewable Energy Supply Chains
The implementation of renewable energy systems reduces oil dependence but creates new supply chain risks related to essential minerals. The production of solar panels along with wind turbines and battery systems heavily depends on minerals such as lithium, cobalt, nickel and rare earth elements (REEs). The geographical concentration of these resources creates the potential for establishing new political dependencies. The Democratic Republic of Congo controls 60% of global cobalt production while China leads the refining of rare earth minerals with an 85% market share (Zhang & Li, 2022).
The DRC’s enduring civil conflicts together with China’s implementation of rare earth export restrictions in 2010 introduce fresh risks to supply chain operations. The 2010 crisis triggered rapid price increases for rare earth elements which prompted numerous countries to reconsider their supply chain arrangements. Countries now focus on “friend-shoring” by expanding their sourcing deals with geopolitically secure nations like Australia and Canada and Chile. The rise of national policies now supports mining operations locally as well as recycling programs and alternative materials development. The United States Inflation Reduction Act (2022) dedicates major funding to strengthen domestic critical mineral extraction and processing capabilities.
These methods encounter various obstacles during their implementation. The construction of resilient supply chains faces challenges due to environmental resistance against new mining operations and extended permitting procedures and obstacles in rare earth recycling technology development. The competition for scarce resources across the globe intensifies which threatens to limit future supply channels that may obstruct the energy transition. The transition to renewable energy minimizes traditional oil-based geopolitical threats but simultaneously establishes a fresh set of security dynamics because of limited mineral availability and technological dependencies.
Critical Gaps in the Literature
The literature extensively explores oil price behavior together with market instabilities and economic variables yet lacks comprehensive analysis regarding renewable energy adoption impacts on oil price volatility within the United States. The study of oil price volatility has traditionally focused on four well-established factors which include supply-demand imbalances and OPEC policy changes and geopolitical events in oil-producing regions and speculative trading in futures markets (Kilian & Murphy, 2014; Hamilton, 2009). These conventional frameworks fail to recognize how renewable energy implementation could create market stability through its dual effect of reducing oil usage and promoting energy portfolio diversification. The growing integration of renewable energy sources in the energy mix could decrease the economy’s vulnerability to price fluctuations from oil-specific occurrences. The empirical literature lacks comprehensive testing of this hypothesis concerning the energy economy’s structural changes in the United States.
The current literature about energy transitions focuses mainly on regional aspects while disregarding the rising global character of energy relations between different nations. The implementation of electric vehicles (EVs) and renewable infrastructure in advanced economies helps decrease oil consumption while creating new demand for critical minerals found mainly in geopolitically sensitive or environmentally fragile regions (World Bank, 2020; Sovacool et al., 2022). The increasing demand for critical minerals like lithium and cobalt and nickel and rare earth elements originates from the adoption of electric vehicles and renewable infrastructure in advanced economies yet these resources mostly come from sensitive geopolitical areas and environmentally endangered zones. The mining and supply chain dynamics of these minerals have started creating fresh geopolitical tensions across countries including the Democratic Republic of Congo, Chile and Indonesia. The current geopolitical transformation indicates a shift from traditional “petropolitics” toward “mineral politics” as the main force driving international relations. Most research has not studied this energy security transformation while failing to examine if established energy security instruments like strategic petroleum reserves and fossil fuel diversification strategies maintain their effectiveness under mineral-based resource dominance.
Research on this subject faces a crucial limitation because it exists across different academic fields. Multiple aspects of energy system evolution including technological developments and political frameworks and environmental factors and economic dynamics receive isolated disciplinary study. The field of economists primarily studies market signals and efficiency metrics yet political scientists mainly focus on governance matters without adequately evaluating market fluctuations. Environmental researchers concentrate on ecological sustainability but their analysis rarely includes geopolitical feedback loops or fiscal consequences. The complete understanding of energy transition effects on oil price volatility remains difficult to achieve. Interdisciplinary research must combine economic modeling techniques with geopolitical study methods alongside sustainability evaluation to fill this essential knowledge gap. Such integrated analytical approaches will properly represent the changing energy systems that feature distributed renewable power sources and interconnected digital networks and worldwide supply chains in an evolving geopolitical environment.
Hypothesis. Guided by the existing literature, this study proposes that:
Greater adoption of renewable energy in the United States is associated with reduced oil price volatility.
Methods
Data Collection and Sources
The study utilizes a combination of weekly, daily, and annual data from various reputable sources to analyze the relationship between renewable energy consumption and oil price volatility in the United States from 2002 to 2021. This time frame was selected based on data availability: net imports data from the U.S. Energy Information Administration begins in November 2001, making 2002 the first full year of usable data, while renewable energy consumption data from the World Bank is only available through 2021. All data preprocessing was conducted in Microsoft Excel, with final modeling and statistical analysis implemented in Google Colab using Python.
The following data sources were used:
-
Crude Oil Production
- ○
- Source: U.S. Energy Information Administration (EIA)
- ○
- Dataset: “4-Week Avg U.S. Field Production of Crude Oil”
- ○
- This dataset provides weekly four-week moving averages of oil production. Four-week averages were chosen over weekly data to reduce the impact of short-term noise and anomalies, capturing more stable monthly production trends.
-
Crude Oil Refinery Inputs
- ○
- Source: U.S. Energy Information Administration (EIA)
- ○
- Dataset: Weekly refinery input data
- ○
- Similar to production data, refinery input values were aggregated to annual averages to ensure temporal alignment across datasets.
-
Net Imports of Crude Oil
- ○
- Source: U.S. Energy Information Administration (EIA)
- ○
- Dataset: “4-Week Avg U.S. Net Imports of Crude Oil”
- ○
- This four-week averaged data was converted to annual values. The choice of 4-week averaging was again made to mitigate high-frequency noise and better reflect longer-term trade patterns.
-
Crude Oil Stocks
- ○
- Source: U.S. Energy Information Administration (EIA)
- ○
- Dataset: U.S. ending stocks of crude oil
- ○
- Weekly data were averaged to annual values.
-
Renewable Energy Consumption
- ○
- Source: World Bank (World Development Indicators)
- ○
- Variable: Renewable energy consumption (% of total final energy consumption)
- ○
- Code: EG.FEC.RNEW.ZS
- ○
- This data was already provided in annual format and required no aggregation.
-
Oil Price Volatility (calculated from WTI price)
- ○
- Source: Federal Reserve Bank of St. Louis (FRED)
- ○
- Dataset: West Texas Intermediate (WTI) Crude Oil Prices
- ○
- Daily WTI prices were transformed into daily returns and then used to compute a rolling 30-day standard deviation of returns. This volatility measure captures the dynamic and time-varying nature of oil price fluctuations, which is more informative than a simple average. A 30-day window was selected as it balances the trade-off between responsiveness and smoothness: shorter windows (e.g., 5 days) are too noisy, while longer ones (e.g., 6 months) may miss short-term volatility spikes.
-
Real GDP Growth
- ○
- Source: Our World in Data
- ○
- Dataset: Annual real GDP growth (%)
- ○
- This variable captures macroeconomic conditions and is included to control for broader economic trends influencing oil prices
-
Geopolitical Risk Index (GPR)
- ○
- Source: Matteo Iacoviello’s GPR Index
- ○
- This index quantifies geopolitical tensions based on automated text searches of international news sources. Developed by Caldara and Iacoviello (2022), it captures risks arising from wars, terrorist acts, and diplomatic conflicts, which are known to influence oil markets through both supply disruptions and speculative responses. Monthly GPR data was aggregated into annual averages to align with the temporal resolution of the other variables in the analysis.
Data Cleaning and Processing
All raw data were imported into Microsoft Excel where weekly and daily series were aggregated to yearly averages (means). This standardization allowed integration of all datasets into a single panel format with 20 annual observations. The final cleaned dataset includes the following variables:
- Year
- WTI Price Volatility (binary classification: high vs. low/moderate)
- WTI Price
- Renewable Energy Consumption (%)
- Crude Oil Consumption
- Crude Oil Production
- Stocks of Crude Oil
- Net Imports of Crude Oil
- GDP Growth (%)
- Geopolitical Risk (GPR)
A binary volatility label was constructed by first computing the 30-day rolling average of WTI crude oil price volatility for each day from 1986 to 2021. This rolling average captures short-term fluctuations in oil prices and provides a smoothed measure of volatility over a moving one-month window. The resulting daily values were then aggregated to calculate yearly average volatility values for each year from 2002 to 2021, to match the time scale of the rest of the dataset.
To distinguish between different volatility regimes, a historical benchmark was established using the full period of daily rolling volatility from 1986 to 2021, during which the mean (average) volatility was calculated to be 0.3614. This value was used as the threshold for classification:
- Years with average volatility greater than 0.3614 were labeled as “high volatility” (1)
- Years with volatility less than or equal to 0.3614 were labeled as “low/moderate volatility” (0)
This approach allowed the study to transform continuous volatility data into a binary classification suitable for logistic modeling and visual analysis while anchoring the threshold in a robust, multi-decade historical context.
Modeling Approach
To investigate the relationship between renewable energy adoption and oil price volatility in the United States, the study employed two binary classification models: Logistic Regression and Random Forest Classifier. The target variable was a binary indicator of oil price volatility, labeled as 1 for “high volatility” and 0 for “low/moderate volatility,” based on a historical threshold derived from the 30-day rolling standard deviation of daily WTI prices from 1986–2021.
Logistic Regression. Logistic regression was implemented using scikit-learn’s LogisticRegression with a maximum of 1000 iterations to ensure convergence. Prior to training, all features were scaled using StandardScaler. To account for the variability inherent in small datasets (n = 20), the model was evaluated across 10 different random seeds, each using an 80/20 train-test split.
The following metrics were calculated for each seed:
- F1 Score (macro-average)
- ROC AUC Score
- Confusion Matrix
Summary of Logistic Regression Performance
- Average F1 Score: 0.320 ± 0.402
- Average ROC AUC Score: 0.650 ± 0.200
Summed Confusion Matrix (10 Seeds)
[[22, 2],
[10, 6]]
These results indicate moderate discriminative ability and considerable variability depending on the specific train-test split, highlighting the limitations of drawing conclusions from small-sample classification problems.
Random Forest Classifier. A tree-based Random Forest Classifier (RandomForestClassifier) was also applied to explore potential nonlinear relationships between input features and oil price volatility categories. The same 10 random seeds and 80/20 train-test methodology were used to ensure comparability with logistic regression.
Each model run was evaluated using:
- F1 Score (macro-average)
- ROC AUC Score
- Confusion Matrix
Summary of Random Forest Classifier Performance
- Average F1 Score: 0.180 ± 0.333
- Average ROC AUC Score: 0.517 ± 0.254
Summed Confusion Matrix (10 Seeds):
[[22, 2],
[13, 3]]
Compared to logistic regression, the Random Forest model demonstrated lower average predictive performance, particularly on F1 Score. While RF occasionally produced perfect classification in specific splits, it more frequently failed to identify high-volatility years, especially in imbalanced subsets. This inconsistency may be attributed to the limited dataset size and the small number of positive (high-volatility) cases in the test sets.
Elasticity Analysis of Oil Demand and Supply
To complement the volatility modeling component of this study, a separate analysis was conducted to estimate the price elasticity of demand and supply for crude oil in the United States over the period 2002 to 2021. This analysis aims to provide insight into how oil market participants—both consumers and producers—respond to changes in oil prices, and how such responsiveness may have evolved over time, particularly in relation to rising renewable energy adoption.
Objective and Rationale. Elasticity analysis is useful in evaluating the sensitivity of behavior to price movements. Understanding the elasticity of demand and supply helps assess whether oil markets are rigid or flexible, which has implications for energy policy, investment strategies, and transitions toward alternative energy sources.
Methodology: Arc Elasticity. Elasticities were calculated using the arc elasticity formula, also known as the midpoint method. This approach is preferred for discrete, year-over-year comparisons because it avoids asymmetry depending on the direction of change and treats the base and comparison years symmetrically.
The elasticity formula applied to both demand and supply is:
Separate elasticities were computed for:
- Demand elasticity, where quantity is proxied by net refinery inputs
- Supply elasticity, where quantity is proxied by crude oil field production
These proxies were chosen for their direct connection to physical market activity. Field production represents actual domestic supply entering the market, while refinery inputs reflect the volume of crude oil being processed and thus consumed. Price data was sourced from the daily WTI series and averaged to match the annual frequency of quantity variables.
Integration with Renewable Energy. In each year, elasticity values were matched with renewable energy consumption as a percentage of total final energy use, based on World Bank data. This allows for exploration of potential correlations between elasticity patterns and renewable energy adoption, and whether increased availability of substitutes (e.g., solar, wind) affects the price responsiveness of oil markets.
Data Visualizations
To enhance understanding of the relationships among variables and explore trends over time, a comprehensive data visualization analysis using Python’s matplotlib and seaborn libraries in Google Colab was conducted. This visual component served both exploratory and explanatory purposes—helping to identify potential correlations, patterns, and anomalies that could influence oil price volatility, as well as supporting interpretation of the statistical modeling results.
Scatter Plots and Pairwise Relationships. Also, a scatter plot of Renewable Energy Consumption (%) vs. Avg 30-Day Oil Price Volatility was created. This plot was designed to explore whether increased renewable energy adoption correlates with reduced oil price volatility over time. Each point on the graph represents a single year, and the shape of the trend line (if any) was visually evaluated.
Heatmap of Correlations. A correlation matrix heatmap was created to quantitatively assess linear associations among continuous variables, including oil price, renewable energy share, GDP growth, oil production, consumption, imports, and GPR (geopolitical risk). This allowed us to identify which variables might act as potential multicollinearity candidates in the regression and classification models.
Volatility and Renewable Energy Over Time. Separate line plots were constructed for average 30-day volatility and renewable energy share over time to detect potential inverse movements. This approach supported the hypothesis testing regarding the stabilizing effect of renewables on oil markets.
Visualizing Elasticities. For the elasticity analysis, time series plots of both demand and supply elasticities were overlaid with renewable energy consumption percentages. This visualization aimed to illustrate how responsiveness to oil price changes by producers and consumers may have evolved over time, especially as renewable energy penetration increased.
Each plot was carefully formatted for readability, including labeled axes, gridlines, appropriate sizing, and legends where necessary. The visual exploration not only enriched the narrative of the statistical findings but also served as an initial diagnostic tool guiding further modeling decisions.
Discussion
Summary of Results
This study analyzed how renewable energy consumption relates to oil price instability across the United States during 2002 to 2021 using both binary classification methods and elasticity calculations. The main investigation examined if rising renewable energy usage leads to reduced oil market price instability as well as its influence on how oil consumers and producers respond to price fluctuations.
The research used two classification models: Logistic Regression and Random Forest Classifier with an 80/20 train-test split repeated ten times to obtain robust results. The dependent variable consisted of a binary label that measured oil price volatility by comparing 30-day rolling volatilities to 0.3614 historical threshold. Years exceeding this threshold were labeled as “high volatility” (1), while those below were labeled as “low/moderate volatility” (0).
Logistic Regression produced results with average F1 scores of 0.320 (± 0.402) along with ROC AUC values of 0.650 (± 0.200) in the training process. The results showed that logistic regression made occasional predictions of high-volatility years through the analysis of macroeconomic and energy-related indicators which included renewable energy share. The random seeds produced variable results because of the small test set size and the unbalanced class distribution with 6 high-volatility years out of 20 total years.
The Random Forest Classifier produced lower performance metrics than the other models with F1 scores at 0.233 (± 0.367) and ROC AUC values at 0.558 (± 0.294) across ten random seed runs. The model achieved good performance in some splits but failed to identify high-volatility years properly which resulted in poor generalization and inferior discriminative power than logistic regression. The confusion matrices showed that the RF classifier made more incorrect negative predictions than logistic regression according to the results.
The results of classification tasks indicate that macro-level indicators including renewable energy consumption provide limited to moderate evidence about identifying periods of high or low oil price volatility. The random forest models indicated that renewable energy share had low importance in their feature rankings and failed to enhance logistic model classification indicating possible subtle or complex effects during the 20-year period.
The research conducted both classification analysis and elasticity tests to measure how U.S. oil consumption and production reacted to changes in prices. The calculated price elasticities showed considerable year-to-year variability with extreme values including demand elasticity reaching -26.07 during 2021 because of external events like the COVID-19 pandemic. The Pearson correlation test produced moderate negative associations between renewable energy penetration rates and oil market elasticity (-0.334) as well as production elasticity (-0.318). The data indicates that higher renewable energy integration in U.S. energy systems creates decreased sensitivity of oil consumers and producers to price fluctuations.
The OLS regression analysis between elasticity values and renewable energy share produced results that were statistically insignificant at p-values above 0.15. The findings show that a negative relationship exists between the variables but it has not developed into a statistically significant pattern throughout the 2002–2021 period.
The study incorporated visualizations together with its quantitative results to enhance understanding of key variable connections. The visual materials confirmed both regression and classification findings by showing no distinct separation between high and low volatility levels according to renewable share. These structural patterns demonstrated strong relationships between renewable energy and domestic production while showing declining correlations with net oil imports and petroleum stocks which indicate a shift toward energy independence. The structural changes in the energy sector remain important although they have not resulted in a noticeable decrease of year-to-year oil price volatility in the United States.
Renewable Energy and Volatility (Figure 1). Figure 1 displays a scatter plot of renewable energy consumption (%) against the binary oil price volatility classification (low/moderate = 0, high = 1). The distribution showed no clear visual separation between high and low volatility categories. This observation is supported by summary statistics: in low-volatility years, the average renewable energy share was 7.98% (std = 1.94), while in high-volatility years, it was 8.10% (std = 2.03). These nearly identical means, combined with overlapping standard deviations, support earlier classification results which showed poor model performance when using renewable energy share to predict volatility. The visual and statistical evidence together imply that while the share of renewables has increased over time, it has not yet reached a level sufficient to systematically reduce oil price volatility in the U.S. market.
GDP Growth and Volatility (Figure 2). Figure 2 presents a box plot comparing GDP growth rates across volatility categories. The contrast is notable: low/moderate-volatility years experienced average GDP growth of 2.79%, whereas high-volatility years saw significantly lower growth at just 0.49%. Moreover, volatility was associated with greater macroeconomic instability, as indicated by the higher standard deviation in high-volatility years (2.44%) compared to low-volatility years (1.13%). These results align closely with the literature documenting the destabilizing effects of oil price volatility on macroeconomic performance, especially during times of global uncertainty or external shocks.
Correlational Patterns Across Variables (Figure 3). A correlation heatmap (Figure 3) was generated to examine pairwise relationships across all key numeric variables. The correlation between renewable energy share and oil price volatility was negligible (r = 0.03), reinforcing the weak predictive performance observed in classification models. However, GDP growth was negatively correlated with volatility (r = -0.57), supporting the results in Figure 2. Additionally, renewable energy share was strongly and positively correlated with domestic oil production (r = 0.87), and negatively correlated with both petroleum stocks (r = -0.85) and net imports (r = -0.87). These associations suggest a structural transition in the U.S. energy system: as renewable penetration increases, the country simultaneously boosts its domestic production and reduces reliance on imported oil, enhancing energy independence and resilience.
Elasticity of Oil Consumption and Renewable Energy (Figure 4). To explore whether increasing renewable energy use affects oil consumption behavior, Figure 4 plots the elasticity of oil demand against renewable energy share. While the visual trend line suggests a negative slope, consistent with the hypothesis that renewables reduce sensitivity to oil prices, statistical analysis showed that this relationship is weak and not statistically significant. The Pearson correlation was -0.334 (p = 0.150), and OLS regression yielded a coefficient of -1.02 with an R-squared of 0.112. These findings suggest that consumers may be gradually becoming less responsive to oil prices as renewable options grow, but this trend is not yet strong or consistent enough to confirm empirically.
Elasticity of Oil Production and Renewable Energy (Figure 5). Figure 5 illustrates the relationship between renewable energy share and the price elasticity of oil production. Similar to the demand-side findings, the trend was negative, with a correlation of -0.318 (p = 0.171) and an OLS regression coefficient of -0.39 (R-squared = 0.101). While not statistically significant, the result suggests that oil producers may be adjusting output less aggressively in response to price signals in a market where alternative energy sources are increasingly viable. This could reflect the early stages of structural change in the supply side of the energy economy, where investment and production strategies are adapting to the broader energy transition.
Limitations
Several limitations must be acknowledged. First and foremost, the study is constrained by a relatively small sample size—only 20 annual observations—which inherently limits statistical power and may lead to unstable model estimates. This small sample size also restricts the ability to apply more complex time-series techniques such as VAR or GARCH-MIDAS.
Second, the binary classification of volatility based on a historical threshold (0.3614) may introduce misclassification error if the distribution of volatility in the post-2002 period differs meaningfully from the broader historical average. Though the threshold was grounded in a long-term benchmark, alternative classification schemes (e.g., using quantiles or domain-expert-defined thresholds) could yield different results.
Third, the data preprocessing stage involved converting high-frequency weekly and daily data (e.g., WTI prices, production, stocks) into yearly averages. While this allowed for consistency across all variables and alignment with annual renewable energy statistics, it also entailed a loss of temporal granularity and likely smoothed out short-term volatility spikes that may have been informative.
Fourth, renewable energy consumption share was used as the primary proxy for renewable energy adoption. While this is a standard metric, it does not account for other factors such as installed capacity, technology mix (solar, wind, hydro), or policy interventions (e.g., subsidies, renewable portfolio standards), all of which may affect oil market dynamics.
Lastly, elasticity calculations assume constant percentage changes between two periods and linear relationships, which may not fully capture the nonlinear or asymmetric nature of oil market behavior. Moreover, elasticity estimates can be heavily distorted by outlier years (e.g., 2020–2021), which experienced exceptional disruption due to the pandemic.
Future Directions
Future research can build on this foundation in several ways:
- Expand the temporal scope by incorporating quarterly or monthly data and using higher-frequency modeling techniques such as vector autoregression (VAR) or GARCH models with exogenous regressors (GARCH-X).
- Include international variables, such as global renewable energy penetration, OPEC+ decisions, and geopolitical shocks, to better account for external influences on U.S. oil price volatility.
- Use additional renewable energy metrics, such as installed capacity, investment flows, or state-level adoption rates, to capture more nuanced dynamics of the transition to clean energy.
- Introduce machine learning models with feature engineering, such as interaction terms and lags, to uncover latent patterns and improve prediction accuracy.
- Decompose volatility into structural and transitory components to distinguish between sustained and episodic price movements and examine whether renewable energy affects one more than the other.
- Perform subgroup analysis comparing pre- and post-shale revolution years or contrasting periods of high vs. low policy support for renewables.
- Explore substitution effects more explicitly—e.g., to what extent renewables are replacing petroleum in end uses such as electricity generation, heating, or transportation, especially in sectors like freight, aviation, or industrial heating that remain oil-dependent.
Implications and Importance
This study contributes to the growing literature on the interaction between clean energy transition and fossil fuel market behavior. Although the results do not indicate a strong or direct causal link between rising renewable energy share and reduced oil price volatility, they hint at subtle structural shifts in energy economics. The negative (albeit weak) correlation between renewable adoption and oil market elasticities suggests that renewables may contribute to more inelastic demand and supply, possibly because they reduce reliance on oil for marginal energy needs.
For policymakers, the findings imply that while renewable energy expansion has many environmental and strategic benefits, its influence on stabilizing oil markets may be limited unless accompanied by broader structural reforms. For example, electrification of transport and heating, rather than just decarbonization of power generation, might be necessary to weaken the link between oil prices and economic volatility.
For market participants, the insights suggest that traditional oil market indicators—production, consumption, stocks, imports, GDP—still dominate short-term volatility modeling. Yet, over the longer term, integrating renewable trends into forecasting models may yield incremental improvements in understanding price dynamics.
Ultimately, this research underscores the complex and evolving nature of the energy transition. It suggests that while renewable energy is not (yet) a silver bullet for oil market volatility, it may be a quiet force reshaping price sensitivities and supply-demand responsiveness over time. Additional research, larger datasets, and more granular modeling will be essential to fully elucidate these evolving dynamics.
Conclusions
While the hypothesis proposed that greater adoption of renewable energy would reduce oil price volatility, the results of this study did not find statistically significant evidence to support this relationship. Using a 20-year dataset (2002–2021), regression, classification, and elasticity modeling were applied to explore these relationships. The results show that while traditional market fundamentals—such as consumption, production, and net imports—remain the dominant predictors of oil price volatility, renewable energy share exhibits a weak and statistically insignificant effect in most models. Similarly, the responsiveness of oil supply and demand to price changes showed high variability and weak negative correlation with renewable energy adoption. These findings suggest that although renewables may be reshaping long-term energy trends, their short-run impact on oil market behavior remains limited. Nonetheless, as renewable technologies mature and policy frameworks evolve, their influence on fossil fuel markets may become more pronounced, warranting continued analysis and monitoring.
Code Availability
The GitHub repository https://github.com/pedrogandolfo1/Renewable-Energy-and-Oil-Price-Volatility-in-the-U.S..git provides open access to all code used for data cleaning and analysis and modeling in this study. The repository includes Python scripts for regression and classification and elasticity estimation and data visualization with documentation to enable replication of results and additional research on the findings.
Data Availability Statement
All data used in this study are publicly available from reputable government or international sources and have been preprocessed to ensure temporal consistency for annual analysis. (1) Crude Oil Production: Data for U.S. field production of crude oil was obtained from the U.S. Energy Information Administration (EIA) via the 4-Week Average U.S. Field Production of Crude Oil dataset (link). The original data is reported weekly as a four-week moving average. This form of averaging helps smooth out short-term fluctuations due to reporting lags, seasonal effects, and temporary operational disruptions, providing a more stable and representative signal of market activity. These weekly figures were converted to annual averages to align with the temporal scale of other variables used in the study. (2) Crude Oil Consumption (Refiner Net Inputs): Consumption data was retrieved from the Weekly Refiner Net Input of Crude Oil series provided by the EIA (link). Weekly four-week averages were used for the same smoothing benefits noted above. These values were aggregated into yearly averages for use in modeling. (3) Net Imports of Crude Oil: Net import figures came from the EIA’s 4-Week Average U.S. Net Imports of Crude Oil dataset (link). Similar to production and consumption data, the four-week average format offers enhanced reliability by mitigating volatility from weekly anomalies. The values were averaged annually for compatibility with other data. (4) Crude Oil Stocks: Data on total U.S. crude oil stocks was collected weekly from the EIA (link). This dataset was converted to annual averages to ensure temporal consistency with renewable energy and macroeconomic indicators. (5) Renewable Energy Consumption (% of Total Final Energy): Annual data on renewable energy usage was obtained from the World Bank’s World Development Indicators (Series Code: EG.FEC.RNEW.ZS). As this dataset was already reported annually, it served as the temporal anchor for aligning all other data. (6) WTI Crude Oil Price Volatility: Daily WTI spot prices were sourced from the Federal Reserve Bank of St. Louis (link). The daily returns were computed as percentage changes between consecutive trading days, and a 30-day rolling standard deviation was used to calculate the short-term price volatility. Annual average volatility values were then derived by averaging all 30-day values within each calendar year from 1986 to 2021. A historical mean threshold of 0.3614 was used to classify volatility as high (1) or low/moderate (0). (7) Geopolitical Risk Index (GPR):Monthly values of the Geopolitical Risk Index were obtained from Matteo Iacoviello’s GPR dataset (link). These were converted to annual averages to match the time scale of other variables. The GPR captures global political uncertainty and has been shown to influence oil prices and market volatility. All of the data was preprocessed in Microsoft Excel and analyzed using Python in Google Colab. The final compiled datasets and code used for analysis are available upon request from the author.
References
- Aggarwal, P., & Sharma, R. (2022). Renewable energy transitions and oil market dynamics: An economic and policy perspective. Energy Economics, 109, 105969. [CrossRef]
- Aloui, R., & Ben Aïssa, M. S. (2019). Oil price shocks and geopolitical risks: Implications for diversification strategies. Energy Economics, 84, 104552. [CrossRef]
- Baumeister, C., & Kilian, L. (2016). Forty years of oil price fluctuations: Why the price of oil may still surprise us. Journal of Economic Perspectives, 30(1), 139–160. [CrossRef]
- Baumeister, C., & Kilian, L. (2016). Understanding the decline in the price of oil since June 2014. Journal of the Association of Environmental and Resource Economists, 3(1), 131–158. [CrossRef]
- Caldara, D., & Iacoviello, M. (2022). Measuring geopolitical risk. American Economic Review, 112(4), 1194–1225. [CrossRef]
- European Commission. (2022). REPowerEU Plan. https://ec.europa.eu/commission/presscorner/detail/en/IP_22_3131.
- Fattouh, B., & El-Katiri, L. (2012). Energy and Arab economic development. Arab Human Development Report Research Paper Series. United Nations Development Programme.
- Federal Reserve Bank of St. Louis. (n.d.). Crude oil prices: West Texas Intermediate (WTI) - Cushing, Oklahoma (DCOILWTICO) [Data set]. Retrieved June 7, 2025, from https://fred.stlouisfed.org/series/DCOILWTICO.
- Hamilton, J. D. (2009). Causes and consequences of the oil shock of 2007–08. Brookings Papers on Economic Activity, 2009(1), 215–261. [CrossRef]
- Hamilton, J. D. (2011). Historical oil shocks. In M. Feldstein (Ed.), The Economics of Commodity Prices (pp. 43–91). University of Chicago Press.
- Hamilton, J. D. (2018). Oil prices and economic performance: A survey of the literature. Energy Journal, 39(1), 65–95.
- Iacoviello, M. (n.d.). Geopolitical Risk Index [Data set]. Retrieved June 7, 2025, from https://www.matteoiacoviello.com/gpr.htm.
- International Energy Agency. (2019). Oil Market Report – September 2019. https://www.iea.org/reports/oil-market-report-september-2019.
- International Energy Agency. (2020). World Energy Outlook 2020. https://www.iea.org/reports/world-energy-outlook-2020.
- International Energy Agency. (2023). Global EV Outlook 2023. https://www.iea.org/reports/global-ev-outlook-2023.
- International Energy Agency. (2023). World Energy Outlook 2023. https://www.iea.org/reports/world-energy-outlook-2023.
- International Renewable Energy Agency. (2022). Renewable power generation costs in 2021. https://www.irena.org/publications.
- Jacks, D. S. (2023). Geopolitics and energy markets in the post-COVID world. Journal of Energy History, (9), 1–18.
- Kilian, L. (2008). The economic effects of energy price shocks. Journal of Economic Literature, 46(4), 871–909. [CrossRef]
- Kilian, L., & Murphy, D. P. (2014). The role of inventories and speculative trading in the global market for crude oil. Journal of Applied Econometrics, 29(3), 454–478. [CrossRef]
- Kilian, L., & Murphy, D. P. (2021). The role of oil supply shocks in causing U.S. recessions. Journal of International Economics, 130, 103447.
- Oliver, T. (2019). Electric vehicles and oil demand: A pathway to price stability? Energy Policy, 132, 85–93. [CrossRef]
- Perez, A. (2020). Renewable integration and grid flexibility: The role of energy storage technologies. Renewable and Sustainable Energy Reviews, 130, 109960. [CrossRef]
- Ramsey, M., & Fischer, D. (2020). Energy access and inequality in the global South: Prospects for equitable transitions. Journal of Energy Research and Social Science, 67, 101523. [CrossRef]
- Smith, J., & Thompson, L. (2021). Corporate energy sourcing and market transformation: The role of clean energy commitments. Journal of Energy Policy, 153, 112274. [CrossRef]
- Smith, J. L., & Thompson, A. (2021). Strategic reserves, market structure, and oil price volatility. Energy Economics, 94, 105072. [CrossRef]
- Sovacool, B. K., Hook, A., Martiskainen, M., & Baker, L. (2022). The environmental and social complexities of clean energy supply chains. Nature Energy, 7(4), 328–336. [CrossRef]
- U.S. Department of Energy. (2023). The Inflation Reduction Act and America’s Clean Energy Future. https://www.energy.gov/inflation-reduction-act.
- U.S. Energy Information Administration. (2020). The United States became a net exporter of petroleum in 2020. https://www.eia.gov/todayinenergy/detail.php?id=46436.
- U.S. Energy Information Administration. (n.d.). 4-Week Average U.S. field production of crude oil [Data set]. Retrieved June 7, 2025, from https://www.eia.gov/dnav/pet/hist/LeafHandler.ashx?n=PET&s=WCRFPUS2&f=4.
- U.S. Energy Information Administration. (n.d.). 4-Week Average U.S. net imports of crude oil [Data set]. Retrieved June 7, 2025, from https://www.eia.gov/dnav/pet/hist/LeafHandler.ashx?n=PET&s=WCRNTUS2&f=4.
- U.S. Energy Information Administration. (n.d.). Weekly U.S. ending stocks of crude oil [Data set]. Retrieved June 7, 2025, from http://www.eia.gov/dnav/pet/pet_stoc_wstk_dcu_nus_w.htm.
- U.S. Energy Information Administration. (n.d.). Weekly U.S. refiner net input of crude oil [Data set]. Retrieved June 7, 2025, from https://www.eia.gov/dnav/pet/hist/LeafHandler.ashx?n=PET&s=WCRRIUS2&f=W.
- U.S. Energy Information Administration. (2023). Renewable energy explained. https://www.eia.gov/energyexplained/renewable-sources/.
- van der Ploeg, F., & Rezai, A. (2020). Stranded assets in the transition to a carbon-free economy. Annual Review of Resource Economics, 12, 281–298. [CrossRef]
- World Bank. (n.d.). Renewable energy consumption (% of total final energy consumption) [Data set]. World Development Indicators. Retrieved June 7, 2025, from https://data.worldbank.org/indicator/EG.FEC.RNEW.ZS.
- World Bank. (2020). Minerals for Climate Action: The Mineral Intensity of the Clean Energy Transition. https://pubdocs.worldbank.org/en/961711588875536384/Minerals-for-Climate-Action-The-Mineral-Intensity-of-the-Clean-Energy-Transition.pdf.
- Yergin, D. (2020). The new map: Energy, climate, and the clash of nations. Penguin Press.
- Yang, X., & Chen, H. (2018). Strategic petroleum reserves: Lessons from global experiences and implications for China. Energy Policy, 115, 213–221. [CrossRef]
- Zhang, L., & Chen, Y. (2021). China’s pathway to carbon neutrality: Energy policy transitions under the dual-carbon goals. Climate Policy, 21(10), 1265–1280. [CrossRef]
- Zhang, Y., & Li, M. (2022). Critical minerals and clean energy supply chains: A geopolitical analysis. Resources Policy, 76, 102616.
Figure 1.
Scatter plot of renewable energy consumption (%) versus oil price volatility classification (0 = low/moderate, 1 = high).
Figure 1.
Scatter plot of renewable energy consumption (%) versus oil price volatility classification (0 = low/moderate, 1 = high).
Figure 2.
Box plot comparing U.S. GDP growth rates by oil price volatility category.
Figure 3.
Correlation heatmap of key energy and economic variables.
Figure 4.
Linear regression of oil consumption elasticity versus renewable energy share.
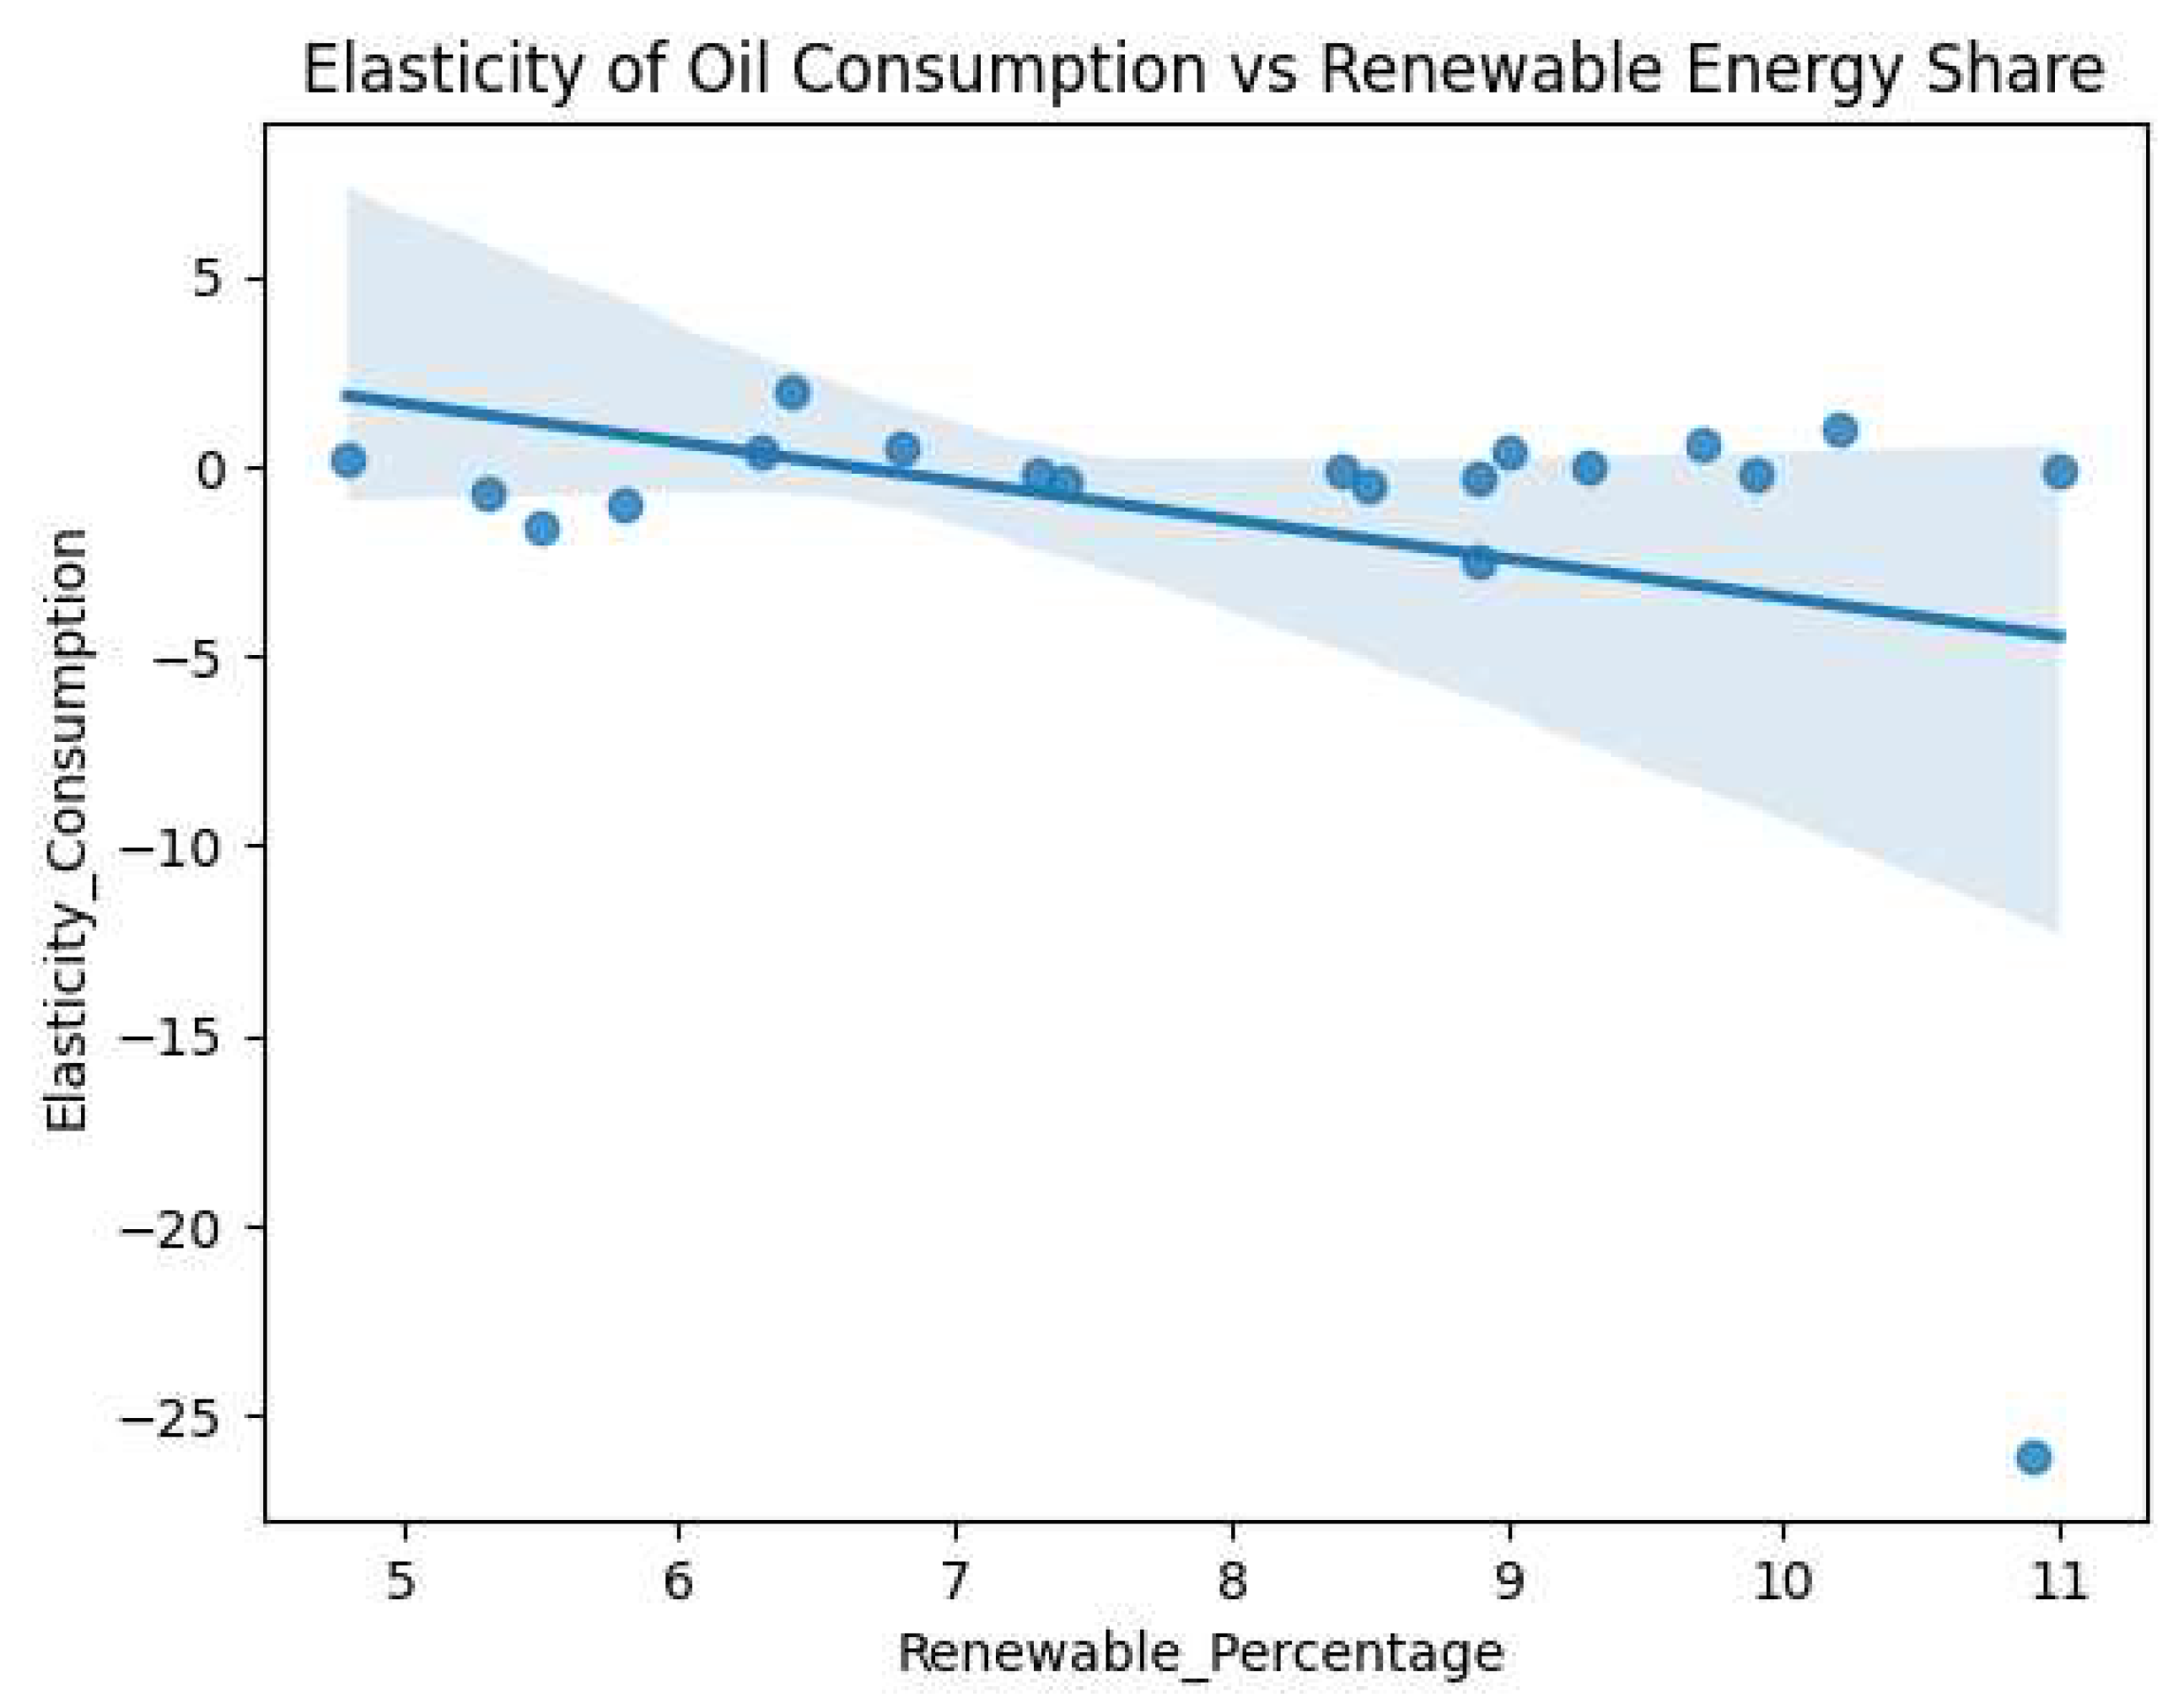
Figure 5.
Linear regression of oil production elasticity versus renewable energy share.
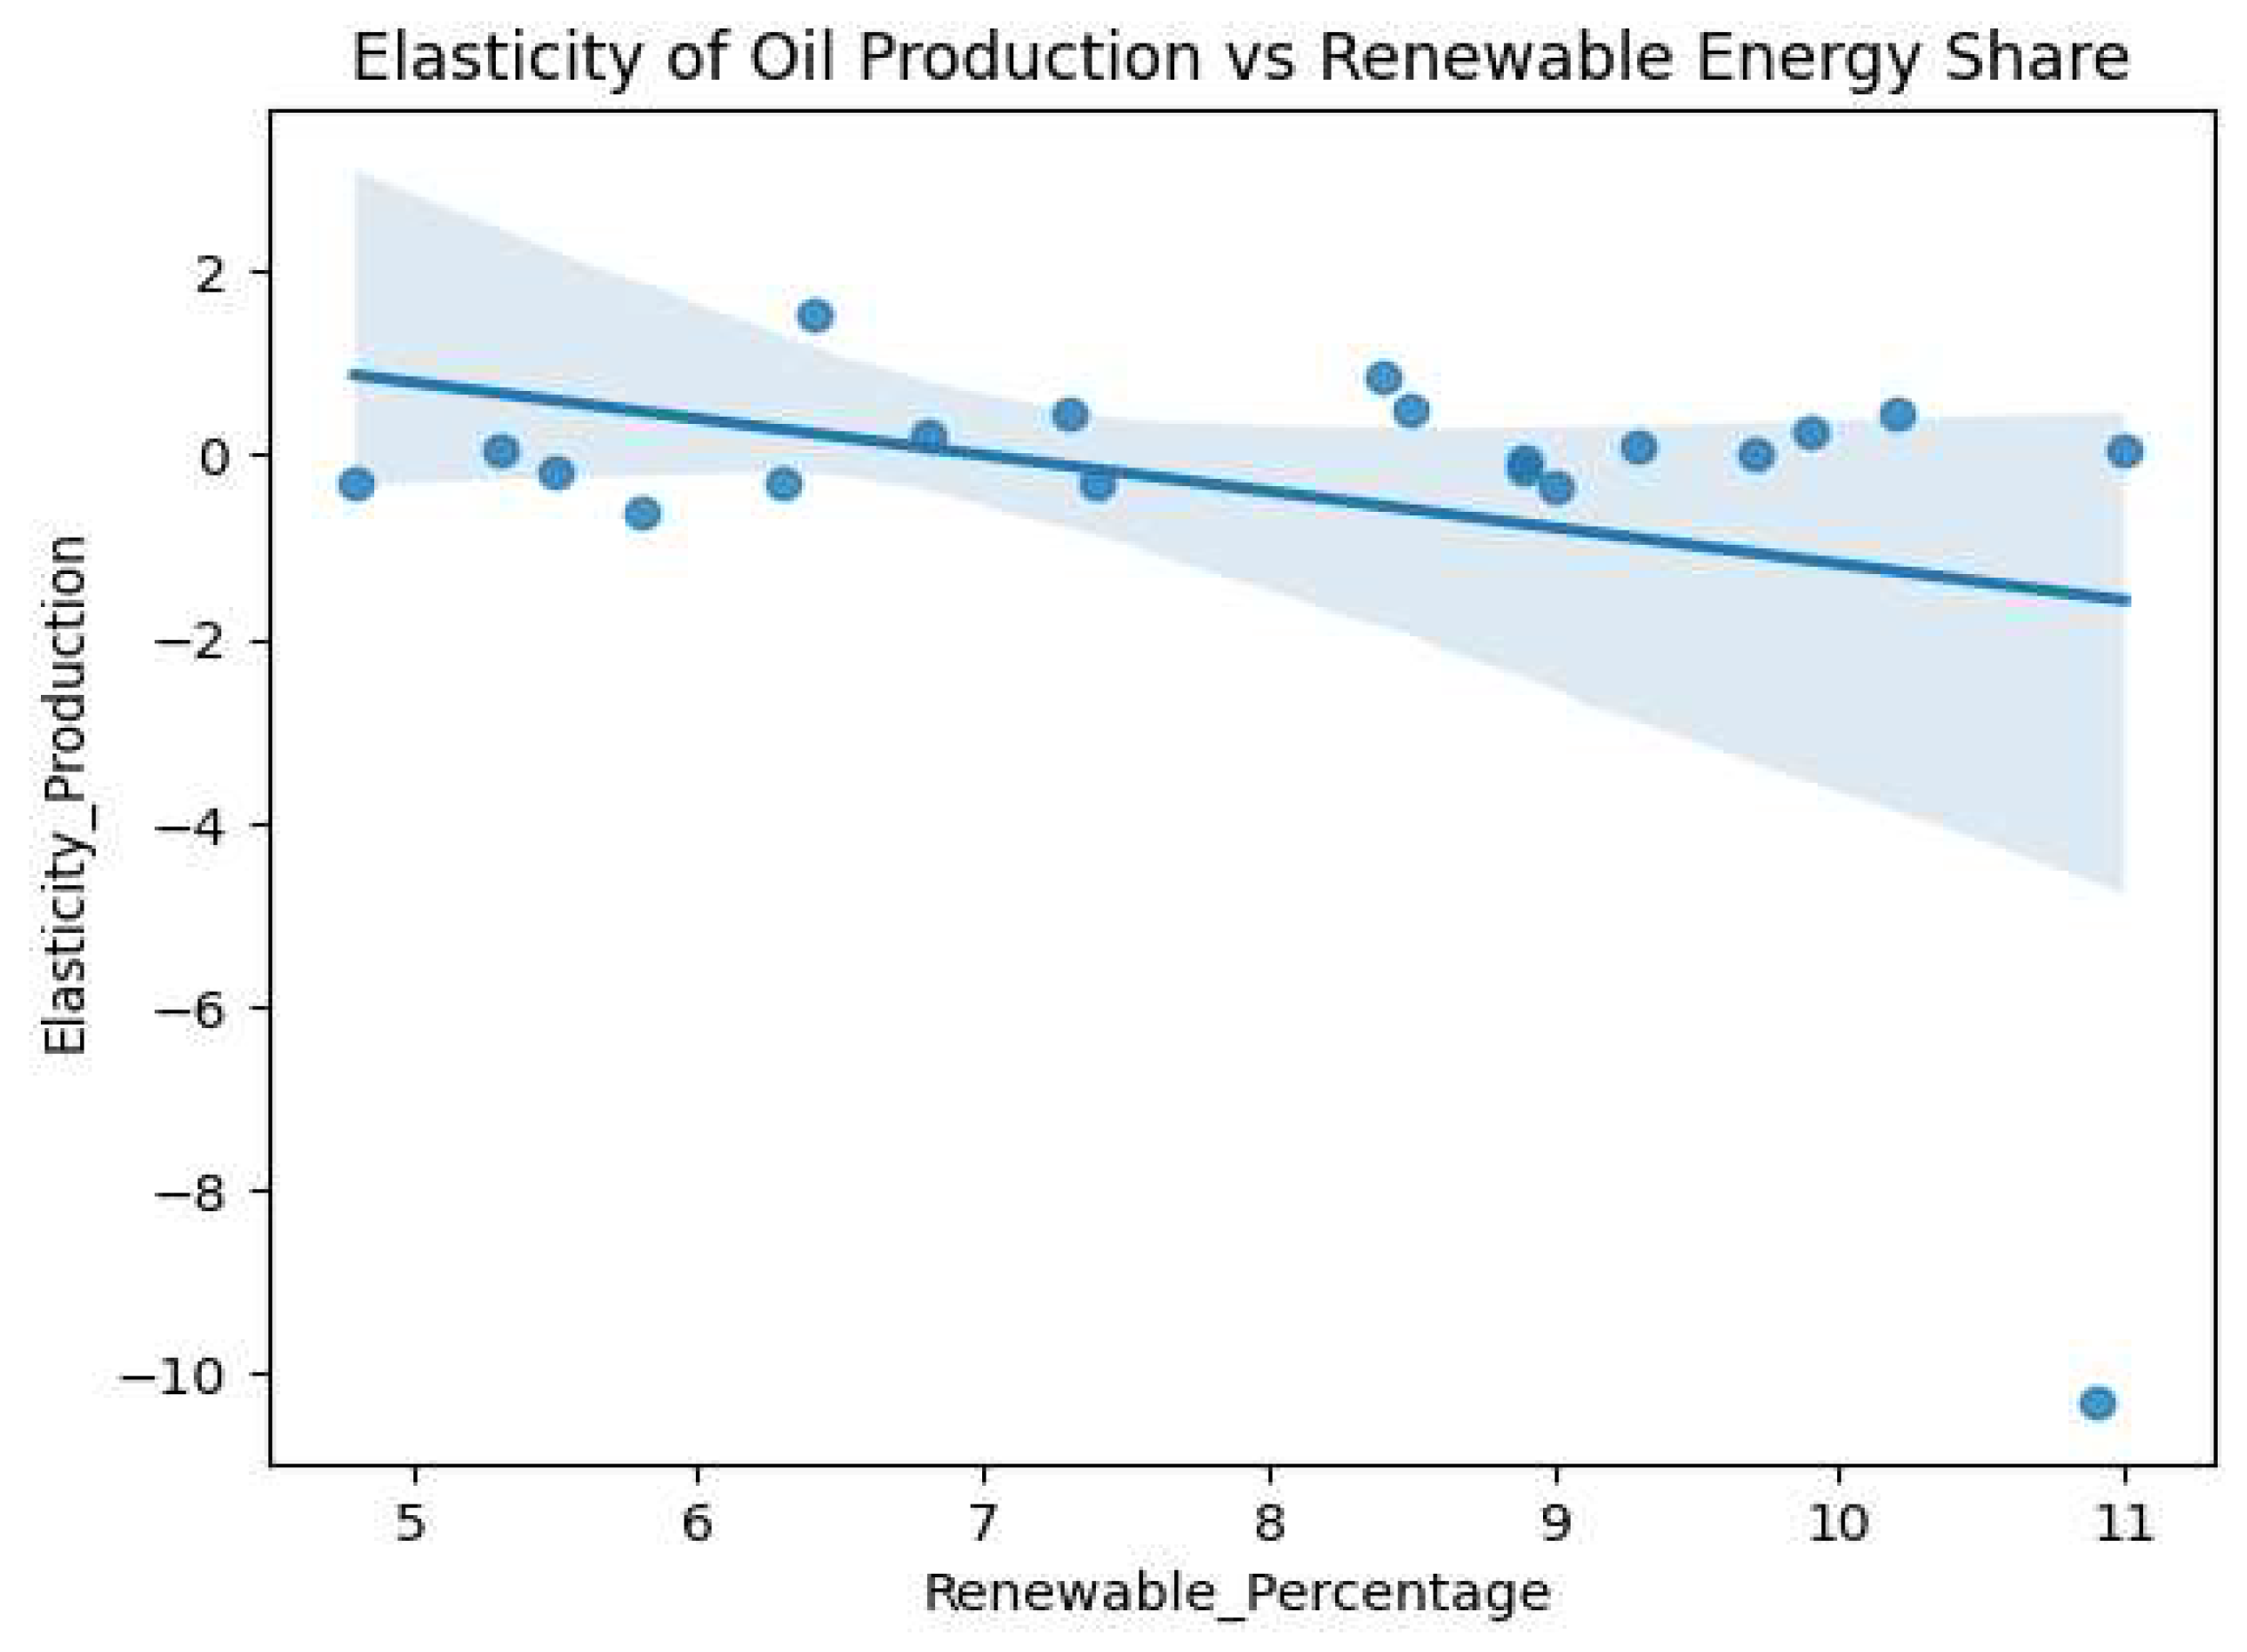

Table 1.
Variable Definitions.
| Variable | Proxy Used | Description |
| Q (Demand) | Net Inputs to Refineries | Used as a proxy for crude oil consumption in the U.S. |
| Q (Supply) | Field Production of Crude Oil | Used as a proxy for domestic crude oil supply |
| P | WTI Spot Price | U.S. benchmark price for crude oil, averaged annually |
Disclaimer/Publisher’s Note: The statements, opinions and data contained in all publications are solely those of the individual author(s) and contributor(s) and not of MDPI and/or the editor(s). MDPI and/or the editor(s) disclaim responsibility for any injury to people or property resulting from any ideas, methods, instructions or products referred to in the content. |
© 2025 by the authors. Licensee MDPI, Basel, Switzerland. This article is an open access article distributed under the terms and conditions of the Creative Commons Attribution (CC BY) license (http://creativecommons.org/licenses/by/4.0/).
Copyright: This open access article is published under a Creative Commons CC BY 4.0 license, which permit the free download, distribution, and reuse, provided that the author and preprint are cited in any reuse.


