
Submitted:
20 January 2026
Posted:
22 January 2026
You are already at the latest version
Abstract
Improving the efficiency of energy consumption, conversion, and transmission on merchant ships has become a critical challenge due to rising fuel costs, increasingly stringent environmental regulations, and the introduction of operational efficiency requirements such as the IMO CII. Existing energy-efficiency metrics are predominantly based on abso-lute or design-oriented indicators and do not adequately capture the latent reserves of energy savings embedded in ship energy systems. This study addresses this gap by proposing a methodological framework for quantifying energy efficiency through the concept of relative energy-saving potential. The proposed approach integrates ship energy balance analysis with a hierarchical assessment of relative theoretical, technical, and economical-ly feasible energy-saving potentials. The methodology is demonstrated through an illustrative case study of a medium-size product tanker, focusing on the main engine, auxiliary generators, pumping systems, and HVAC loads. The results indicate that a significant share of energy losses can be systematically identified and progressively constrained by technical and economic feasibility considerations, providing a transparent basis for prior-itizing energy efficiency measures. The study concludes that relative energy-saving potentials offer an effective and scalable foundation for ship energy management, supporting SEEMP implementation, CII compliance strategies, and integration into digital twin and AI-based energy management systems.
Keywords:
energy efficiency
; energy-saving potential
; merchant ships
; techno-economic assessment
; ship energy management
; digital twin
1. Introduction
In today’s environment of rapidly growing demands for energy efficiency and environmental safety in maritime transport, the issue of rational energy use on board merchant ships is becoming particularly relevant [1]. Consumption [2], conversion [3], and transmission of energy [4] in ship energy systems is a complex process involving the interaction between ship power plants, auxiliary machinery, and automated control systems [5]. The efficiency of these processes directly affects fuel consumption, pollutant emissions, and overall ship performance [6].
Despite the existence of several methods for evaluating the efficiency of energy systems, simplified or fragmentary criteria are often used in maritime operations [7], which do not consider the complex interaction between the elements of the energy cycle [8]. In view of this, there is a need to develop and substantiate a generalized criterion that would allow for a quantitative and qualitative assessment of the efficiency of energy consumption, conversion, and transmission, considering thermodynamic and operational and economic parameters.
The energy systems of modern merchant ships operate under complex operating conditions characterized by load variability, multifunctionality of energy consumers, the need to ensure high reliability, and compliance with international environmental standards [9]. At the same time, energy losses associated with the imperfection of conversion devices, irrational distribution of loads between power plants, and losses during energy transmission account for a significant share in the structure of ship energy processes.
An analysis of existing approaches to assessing the efficiency of ship energy systems shows that certain traditional indicators dominate, such as specific fuel consumption, efficiency coefficients, CO2 emissions, etc., which makes it impossible to cover all aspects of the energy cycle [10]. But these traditional indicators do not capture the internal structure of ship energy losses and are insufficient for adaptive energy management, particularly under variable operating conditions [11,12]. The lack of a single, generalized efficiency criterion makes it impossible to objectively compare the energy efficiency of different systems and technologies, complicating the process of making informed decisions about modernizing or optimizing energy consumption.
This issue is particularly relevant in the context of the digital transformation of the maritime industry [13], where the integration of intelligent energy management systems requires clear, formalized, universal criteria for automated analysis and performance forecasting. Thus, there is an urgent need to develop comprehensive efficiency criteria that would combine technical, economic, and environmental parameters, allowing for a holistic assessment of energy processes on board a ship and decisions to be made regarding their optimization.
The purpose of the study is to substantiate the optimal criterion for the efficiency of energy consumption, conversion, and transmission processes on a merchant ship, which allows for the assessment of energy conservation reserves.
Research objectives:
- Review current scientific publications and technical sources that assess the efficiency of ship energy systems, with a focus on energy consumption, conversion, and transmission.
- Identify the most common efficiency indicators used in maritime transport practice and analyze their advantages and limitations.
- Propose an optimal efficiency criterion combining thermal, economic, and environmental parameters.
- Apply the proposed criterion to evaluate the efficiency of merchant ship power plants.
1.1. Literature Review
The challenge of improving energy efficiency in maritime transport [14] has recently attracted increasing attention from scientists and practitioners. Research focuses on improving energy consumption, conversion, and transmission processes on ships to reduce fuel consumption [15], minimize harmful emissions [16], and ensure compliance with IMO regulatory requirements [17].
In paper [18], the authors presented the concept and simulation modeling of a ship energy efficiency management system based on the analysis of operational data. This approach allows energy consumption to be adapted to the dynamic conditions of the voyage. In turn, in [19], the author assessed the energy efficiency of a passenger ship, pointing to the possibility of improving operational performance even in traditionally built ships.
The paper [20] presents an extended emissions index (EEI) for fishing vessels, which considers not only CO2, but also SOX and NOX, providing a more comprehensive ecological assessment of energy consumption systems. Study [21] is devoted to the methodology for assessing greenhouse gas emissions using Energy Efficiency Design Index (EEDI), Energy Efficiency Operational Indicator (EEOI) and Energy Efficiency Navigational Indicator (EENI) indices and monitoring data in time series.
Authors of the articles [22,23] identified barriers to the implementation of energy efficiency measures in shipping, including information asymmetry, the distribution of responsibility among market participants, and economic barriers to investment in new technologies. In paper [24], scientists investigated the cost-benefit ratio of various ballast water treatment technologies, which is closely related to energy efficiency and electricity consumption on board.
Researchers pay particular attention to innovative technologies such as air cushion systems [25], organic Rankine cycles [26], the use of photovoltaic panels, and the miniaturization of main electrical panels [27]. In article [28], the authors systematized approaches to reducing emissions and improving energy efficiency, in particular methods for optimizing speed and navigation planning.
From the perspective of mathematical analysis methods, [29] proposed the use of multivariate regression and artificial neural networks to evaluate energy consumption efficiency based on trip data.
The work of scientists [30] demonstrates the possibilities of using energy efficiency management plans (SEEMP) in operational efficiency management. Research [31] deepens the analysis of container ships, focusing on the relationship between engine characteristics, energy consumption, and load parameters. Previous studies have demonstrated that detailed subsystem-level modeling of ship power and energy flows provides a more realistic basis for efficiency assessment than aggregated voyage indicators [12,32,33,34].
The introduction of the Carbon Intensity Indicator (CII) with mandatory ship rating classes from A to E by the International Maritime Organization has further highlighted the limitations of absolute and design-based efficiency indicators [35]. Since the CII rating is highly sensitive to operational conditions and year-to-year performance, there is a growing need for relative, normalized indicators capable of quantifying latent energy-saving reserves and supporting adaptive energy management decisions throughout a vessel’s lifecycle.
1.2. The Most Common Energy Efficiency Indicators
Several methods and indices can be used to compare the energy efficiency of merchant ships, each focusing on different aspects of ship operation and design. Table 1 lists the main methods and indices used to date.
Thus, the available scientific literature offers a multi-vector view of the problem, covering:
- performance indicators (EEDI, EEOI, EEI, EENI) described in Table 2;
- simulation modeling methods;
- economic justification of technologies;
- the introduction of digital monitoring systems;
- technological modernization of energy supply systems.
However, none of the reviewed indicators explicitly quantify the latent energy-saving reserves embedded in ship energy systems. This indicates the need to develop optimal efficiency criteria that would make it possible to assess the energy-saving potential of merchant ships by combining the technical, environmental, and economic aspects of ship energy systems.
2. Methodological Framework for Assessing Energy Efficiency and Energy-Saving Potential of Merchant Ships
The effectiveness of energy conservation measures on a merchant ship can be assessed by analyzing the dynamics of energy, operational, and financial indicators. In addition to absolute values of fuel and energy consumption, the dynamics of ship operating costs, particularly in terms of fuel and energy resources, are also important. The main result of implementing energy-efficient measures on board is a reduction in costs and, accordingly, an increase in the profitability of shipping activities. One of the key indicators characterizing the impact of energy conservation is the share of energy costs in the total cost of transportation.
Forecasting changes in transportation costs after implementing energy efficiency measures can be done based on an analysis of operational data from similar vessels, using two main approaches: parametric (considering changes in specific characteristics, such as specific fuel consumption, time spent in port, etc.) and structural analogy (based on statistical models for the fleet).
To assess the effectiveness of such measures, it is advisable to use the concept of a ship’s energy-saving potential. The concept of energy conservation in the fleet proposed by the authors of the article treats this potential as a strategic resource that ensures sustainable and cost-effective operation of the vessel even in conditions of an unstable external environment. The concept of energy-saving potential as a structured reserve of efficiency improvement has previously been explored in transport and energy systems research, emphasizing its suitability for strategic and operational decision-making [33,36,37].
The case study considered in this work corresponds to a representative medium-size product tanker and is employed for illustrative purposes only, with the primary objective of demonstrating the practical implementation of the proposed energy efficiency assessment methodology.
Figure 1 illustrates the integrated methodological framework used in this study to quantify the efficiency of energy consumption, conversion, and transmission on merchant ships. The framework is designed to combine methodological development with illustrative numerical evaluation, where calculated values serve to demonstrate the applicability of the proposed approach rather than to represent standalone experimental results.
The methodology begins with the collection of technical, operational, and energy monitoring data, which are used to construct the ship energy balance and identify the structure of onboard energy consumption. Based on this baseline, the relative theoretical energy-saving potential is determined, representing the maximum share of energy that can be saved under idealized conditions. This indicator establishes an upper bound for further analysis.
Subsequently, the theoretical potential is progressively constrained through the introduction of technical and economic feasibility criteria. The relative technical energy-saving potential reflects the portion of theoretical savings that can be realized using presently available technologies without fundamental modifications to the vessel configuration. The relative economically feasible potential further refines this estimate by accounting for investment costs, fuel prices, and payback criteria.
The numerical calculations presented in the subsequent subsections are therefore embedded within the methodological framework and serve to illustrate the practical implementation of the proposed indicators. This integrated structure ensures consistency between the analytical formulations and their application to a representative merchant vessel, while maintaining the primary focus on methodological advancement.
According to the approaches developed by the authors of the article, the economic potential of a vehicle can be considered as the maximum possible efficiency of the use of technical and organizational resources. In shipping, this means achieving the minimum level of energy consumption per unit of cargo transported for a given route, speed, and schedule.
The energy-saving potential of a ship encompasses not only the technical parameters of its power plant, but also the organizational capabilities of energy consumption management (e.g., optimization of speed, schedule of voyages, use of digital data-based decision support systems). Unrealized but potentially useful resources include, in particular:
- heat from ship engine exhaust gases;
- heat from ship engine cooling systems;
- heat from auxiliary ship equipment exhaust gases;
- energy from sea waves or solar radiation (as part of hybrid ship systems).
Studying the energy-saving potential of a specific vessel allows you to:
- identify available reserves for reducing energy costs;
- justify the investment feasibility of modernizing ship systems;
- build a model of the technical and economic effect of implementing relevant measures;
- organize monitoring of the dynamics of energy costs.
Compared to the traditional method of assessing efficiency based on specific fuel consumption, assessing the dynamics of energy saving potential allows for a comprehensive consideration of the technical, operational, and organizational aspects of a ship’s operation.
According to Figure 2, it is advisable to classify the energy saving potential of a merchant ship according to its participation in the energy process (main/auxiliary mechanisms), by type of resource (fuel, heat, electricity, renewable energy), by calculation method (actual/estimated values), and by management level (engine room, bridge, shore services).
The proposed scheme classifies a ship’s energy-saving potential according to five key criteria covering the technical, organizational, resource, and methodological aspects of its formation and implementation.
In the production process, capacity is distributed among components related to the main power plants (main engines), auxiliary mechanisms (pumps, compressors, generators), and ship life support systems (lighting, ventilation, air conditioning, etc.).
The structure of energy consumption is considered by type of resource: traditional fuels, electricity, thermal energy, and renewable energy sources (solar, wind, wave energy, etc.), which can be used as alternative or additional sources of energy.
Based on the calculation method, potential is divided into actual (measured based on operational data) and estimated (calculated using models, simulations, or analytical methods). Both types are associated with an in-depth classification according to the degree of potential realization: theoretical, technically achievable, economically feasible, and essentially obtained.
In terms of management hierarchy, potential is classified according to where it is implemented or managed: the engine room (operational implementation of measures), the navigation bridge (optimization of speed, routes, ballasting), and the shore-based technical service (analytics, planning of measures, coordination).
In terms of implementation, potential can be:
- engaged (energy efficiency measures already implemented),
- unengaged but available (can be implemented without significant capital investment),
- strategic reserve (implementation requires investment or technological change).
This multidimensional classification allows for systematic analysis of a ship’s energy efficiency, assessment of potential fuel and energy savings, and development of scientifically sound programs for implementing energy efficiency measures in shipping.
It is advisable to begin researching the energy-saving potential of a merchant ships by looking at individual subsystems and energy consumption elements. For example, it is worth analyzing separately the fuel consumption of the main power plant, auxiliary diesel engines, life support systems (HVAC), ballast pumps, inertial navigation systems, etc. If it is necessary to assess the potential of the entire ship’s power plant or the energy efficiency of individual voyages, it is advisable to consider the load factors of mechanisms, the simultaneity factors of consumption, and other analytical indicators that allow the accumulation of data on individual consumers within a single operational structure of the ship.
The economically viable potential for technical energy savings in the fleet is also significant. Like mechanical engineering, its implementation on modern ships can significantly reduce fuel and electricity consumption, which directly affects the cost of transportation and environmental performance in accordance with the requirements of MARPOL Annex VI and SEEMP.
According to the authors of the article, the use of specific fuel consumption indicators on marine vessels has several limitations. In conditions of variable routes, different loads, unstable weather conditions, and various operating modes, specific fuel consumption (e.g., g/ton-mile or g/mile) does not always reflect the actual energy efficiency [37]. Such indicators do not allow for a full assessment of the energy efficiency dynamics of a particular vessel, comparison of different types of vessels, or even comparison of the same vessel under different operating conditions.
Each vessel has its own unique energy configuration, loading regime, and routes. Even vessels of the same type can demonstrate different levels of energy efficiency depending on operating conditions (ballast or loaded voyages, speed regimes, frequency of port calls, etc.). Therefore, a direct comparison of ships based on specific indicators (e.g., fuel consumption per ton-mile) without considering the operational context is methodologically incorrect and does not allow for accurate systematization of ship energy efficiency.
2.1. Relative Theoretical Energy-Saving Potential
The relative theoretical energy saving potential indicator is the optimal criterion for assessing the efficiency of energy consumption, conversion, and transfer on a merchant ship. This indicator allows assessing the share of the ship’s total energy consumption that could theoretically be saved by implementing energy-efficient technical, organizational, or operational measures.
The energy savings potential calculation should be performed over the course of an annual operating cycle. This allows for consideration of seasonal and route-related fluctuations in ship load.
To comparing the energy efficiency of different ships or the same ship in different years, it is advisable to use the relative value of the theoretical energy saving potential, i.e., the share of energy that can be extracted from the loss structure and used efficiently.
Total energy consumption (e.g., in tons of fuel equivalent or kWh) is not representative in terms of energy savings. Instead, it is critically important to assess the number of potential losses that can be avoided – that is, the portion of energy that can theoretically be saved without compromising the functionality or safety of the vessel.
The share of theoretically saved energy in total consumption is, in authors opinion, one of the most objective indicators of a ship’s energy efficiency. It reflects not only the technical condition of the power plant, but also the effectiveness of energy management, the level of automation, the optimality of operational decisions (speed, route, ballasting), and the degree of implementation of innovative technologies (e.g., heat recovery systems or auxiliary sails).
Upon receiving the results of an energy audit with a calculation of relative theoretical potential, the management of a shipowner or ship operator can:
- assess the efficiency of fuel and energy use on a specific ship;
- compare vessels within the fleet using a unified indicator;
- identify areas for concentration of efforts (e.g., modernization of the main engine, optimization of auxiliary mechanisms, revision of the operating strategy, etc.).
The authors of the article propose determining the relative theoretical energy-saving potential using Equation (1):
here: – theoretically possible amount of energy that can be saved on a ship by implementing energy-saving measures (kWh or tons of fuel equivalent); – fuel efficiency of an engine, defined as a function , an example of the function is shown in Figure 3; – total energy consumption by the ship during the relevant period (year, voyage, etc.), including all types of fuel and electricity (kWh or tons of fuel equivalent); – fuel consumption by the vessel for the relevant period (year, voyage, etc.), kg; – lowest calorific value, kJ/kg.
The resulting value is expressed as a percentage and allows estimating the share of irrational energy consumption that can be optimized; conduct a comparative analysis of the energy efficiency of ships regardless of type, tonnage, or voyage duration; justify the economic feasibility of investments in energy-saving measures, in particular in the modernization of equipment, the introduction of automated energy consumption management systems, the transition to alternative energy sources, etc.
In the future, this indicator may become a key indicator in the structure of digital energy management of the fleet, forming the basis for scenario modeling, rating ships for energy efficiency, and building adaptive ship operation strategies in accordance with IMO requirements (SEEMP, EEOI, CII).
Figure 3 illustrates the fuel efficiency of the MAN 6S46MC-C7 main engine as a function of its load level (% MCR). The graph shows the change in specific efficiency (effective efficiency) of the engine within the range from 20% to 110% of the rated power (Maximum Continuous Rating, MCR). The curve has a clearly defined maximum in the range of 80% MCR, where the highest level of fuel efficiency is achieved – about 49%. When the load decreases or increases, efficiency decreases due to an increase in relative heat losses and the inefficiency of combustion processes. A particularly noticeable decrease in efficiency is observed when the engine is operating at low loads (less than 40% MCR), where the efficiency can drop to 42% and below. This characteristic is critically important for justifying ship operating modes and calculating energy saving potential, since operating in the 70–85% MCR range provides the optimal balance between performance and fuel consumption.
The sensitivity of engine efficiency to load variations and operating modes has been previously demonstrated for marine diesel engines, confirming the importance of relative, loss-based indicators [32,38].
Figure 4 shows the typical distribution of the operating time of the main engine of a Chemical/Oil Product Carrier (deadweight tonnage 37,600 tons, with a MAN 6S46MC-C7 main engine) for the main operating modes with the corresponding engine load (% MCR), the parameters of whose propulsion system are given in Table 3. During a typical voyage, the ship spends most of its time in full sea speed mode, which is characterized by an engine load of about 85% of its rated power and accounts for about 75% of the total voyage time. Slow steaming mode with an engine load of about 60% accounts for 10% of the time. Maneuvering (40% MCR), idling (0% MCR), anchoring/drifting (0% MCR), and port operations (0% MCR) account for 5%, 3%, 4%, and 3% of the time, respectively. This distribution of engine operating time is the basis for assessing a ship’s energy efficiency, allowing for the clear identification of modes with the greatest energy-saving potential and the development of optimal strategies for reducing fuel and energy costs.
Table 3 presents the main parameters of the propulsion system of a Chemical/Oil Product Carrier with a deadweight of 37,000 metric tons. The table contains summary information on the geometric characteristics of the hull, the main technical parameters of the main engine, and the design of the propeller. The power plant is a two-stroke low-speed MAN 6S46MC-C7 diesel engine with six cylinders, an effective power of 7860 kW, and a rotation speed of 129 rpm at Maximum Continuous Rating (MCR). The average effective pressure is 19 bar, and supercharging is provided by an ABB TPL73 gas turbine supercharger. The Japanese MAU fixed-pitch propeller has 4 blades, a diameter of 5.6 m, and a pitch of 4.2 m at 70% of the radius. A comprehensive assessment of these characteristics allows modeling the efficiency of the ship’s power plant, calculating fuel consumption, analyzing the energy balance, and justifying measures to improve the energy efficiency of ship operation.
Table 3 contains the results of calculating the theoretical energy saving potential of a merchant ship for a conditional voyage lasting 21 days, considering the main operating modes of the main engine. For each mode, the share of engine operating time, its duration in hours, the corresponding power (defined as a fraction of the nominal power – 7860 kW), and the effective efficiency value according to the dependence shown in Figure 3 are given.
The calculation of theoretical energy saving potential assumes that energy losses that are not converted into useful work can be partially recovered (e.g., in the form of heat from exhaust gases or cooling). The values obtained show that the bulk of the potential (~2.68 MWh) is attributable to full-speed operation due to its duration (75% of total time) and high load. Slow steaming and maneuvering provide relatively smaller amounts of potential energy, but together they provide additional reserves for energy saving (≈340 thousand kWh).

Table 4.
Results of calculating the theoretical energy saving potential of a merchant ship’s main engine for a conditional voyage lasting 21 days.
Table 4.
Results of calculating the theoretical energy saving potential of a merchant ship’s main engine for a conditional voyage lasting 21 days.
| Operating mode (load) | Part of voyage time, % | , % | Working time, hours |
Engine power, kW |
|---|---|---|---|---|
| Full speed ahead (85% MCR) | 75 | 48.75 | 378.0 | 6681 |
| Slow steaming (60% MCR) | 10 | 48.43 | 50.4 | 4716 |
| Maneuvering (40% MCR) | 5 | 47.37 | 25.2 | 3144 |
Table 5 contains the results of calculating the theoretical energy saving potential of commercial ship diesel generators. During a real 21-day voyage, the ship’s diesel generators operates during periods when the main engine is either stopped or does not generate electricity through the shaft generator. This applies to maneuvering, idling, anchoring/drifting, and port operations, which in total amount to 75.6 hours, or 15% of the voyage duration. The remaining 85% of the time, power is supplied by a shaft generator driven by the main engine.
The table considers periods when the main engine does not provide power through the shaft generator and the onboard power supply is provided by diesel generators. For each mode, the duration of operation of the auxiliary engines and the typical value of the brake efficiency depending on the load are determined, and the theoretical energy saving potential corresponding to the proportion of lost heat energy that can be recovered or reduced as a result of optimization is calculated.
The greatest energy saving potential is recorded in maneuvering mode (46.9 thousand kWh), as generators operate at an average load for 25 hours. At the same time, significant energy losses are observed during anchoring/drifting and port operations, where the efficiency of diesel generators varies between 37% and 42%, reflecting a decrease in efficiency when operating in unstable and low-load modes. The total theoretical energy saving potential of auxiliary engines per voyage is approximately 140.3 thousand kWh, which can be used as a benchmark for implementing measures to reduce fuel consumption of the auxiliary power system.
In summary, the total theoretical energy saving potential for a conditional voyage lasting 21 days is approximately 3.15 MWh, which indicates significant reserves for reducing energy consumption even while maintaining the existing operating modes of the vessel.
These results form the basis for further analysis of the technical and economic potential of implementing energy recovery measures, as well as for justifying investments in energy efficiency improvement systems.
2.2. Relative Technical Energy-Saving Potential
Relative technical energy saving potential – is the share of total energy consumption that can be technically saved by implementing achievable energy-saving technologies without changing the purpose or basic configuration of the vessel.
The purpose of introducing a methodology for calculating the relative technical energy saving potential is to assess the amount of energy that can be saved on board a specific vessel, considering:
- the latest technology level;
- the existing design features of the vessel;
- the possibilities for technical integration of energy-efficient solutions without complete reconstruction of the systems.
This indicator allows us to move from ideal (theoretical) conditions to technically achievable results.
Contrary to theoretical potential (subsection 2.1), which considers all possible energy savings without restrictions, technical potential considers the current state of the ship, the technical feasibility of measures, and existing technical barriers: structural, dimensional, energy, etc. Therefore, the relative technical potential for energy saving is determined by formula (2):
here: – technically achievable energy saving potential, i.e., the amount of energy that can be saved using modern available technologies without changing the basic technical parameters or intended purpose of the vessel (kWh or tons of fuel equivalent); – total energy consumption by the ship during the relevant period (year, voyage, etc.), including all types of fuel and electricity (kWh or tons of fuel equivalent); – technical availability coefficient.
The technical availability coefficient of energy saving potential (3) reflects the share of the total (theoretical) energy saving potential that can be technically implemented given the current level of scientific and technical progress. It is defined as the ratio of relative technical potential to relative theoretical potential, i.e.,:
To calculate the technically achievable energy saving potential of a ship (4) using the algorithm shown in Figure 5, it is necessary to conduct a sequential analysis of energy consumption on board the ship, considering:
- the quantitative share of each subsystem in total consumption;
- the technical efficiency coefficient of the measures implemented;
- the achievability coefficient (the actual possibility of implementing a technical measure).
here: – energy consumption by i-th consumer or subsystem (main engine, auxiliary diesel generators, pumps, HVAC, etc.) over a period of time; – estimated share of energy losses for the i-th subsystem (e.g., 1 – engine efficiency); – technically achievable loss reduction factor , which shows what proportion of losses can be offset by implementing achievable technical solutions.
determined based on the results of an energy audit, ship records, modeling, or, as in the case of the authors, using the shipmonitoring.org energy parameter monitoring system (in kWh/year).
depends on the type of subsystem:
- Main engine: 1−ηe, here ηe≈0.42–0.49;
- Generators: 1−ηg, here ηg≈0.2–0.31;
- HVAC: depends on the system, approximately 0.3–0.5;
- Pumps: 1−ηm, here ηm≈0.25–0.4.
statistical values:
- for engine heat recovery systems – 0.2–0.4;
- for optimizing frequency control of pumps – 0.3–0.6;
- for lighting modernization (LED) – дo 0.8;
- for propeller devices – 0.1–0.25.
To enable the analytical estimation of the relative technical energy-saving potential, the proposed methodology requires a set of representative parameters characterizing energy losses and the technical feasibility of their reduction for major onboard subsystems. These parameters include the estimated share of energy losses associated with each subsystem and the technically achievable fraction of loss reduction based on currently available technologies and retrofit practices. The use of technical availability coefficients reflects practical retrofit constraints and aligns with approaches applied in digital monitoring-based ship energy assessments [12,34].
Table 6 summarizes typical ranges of these parameters for the main engine, auxiliary diesel generators, pumping systems, HVAC systems, and lighting. The presented values are derived from published technical data, engineering practice, and results of ship energy audits, and are intended to provide a consistent and transparent basis for the illustrative calculations presented in the subsequent analysis.
Using the parameter ranges defined above, the relative technical energy-saving potential is calculated for the representative merchant vessel considered in this study. The calculation follows the subsystem-based approach introduced in the methodological framework and accounts for the contribution of each major energy consumer to the overall technical potential.
Table 7 presents the results of the technical energy-saving potential assessment for a typical voyage scenario. The values reported in the table illustrate how the theoretical energy-saving potential is progressively constrained by technical feasibility factors, thereby providing a realistic estimate of the portion of energy savings that can be achieved without fundamental modifications to the vessel configuration.
Thus, for this example
Pros of this approach:
- Ability to adapt to the configuration of a specific vessel;
- Suitability for implementation within digital energy management systems;
- Consideration of both the technical structure and the realities of implementation.
Cons:
- Does not take economic factors into account;
- Requires expert assessment of technical feasibility and loss rates;
- Requires accurate data from energy audits or digital monitoring.
2.3. Economically Feasible Energy-Saving Potential
The purpose of this calculation is to estimate the share of energy savings that are not only technically possible but also economically feasible under current conditions, including fuel prices, implementation costs, payback periods, and investment accessibility.
The relative economic potential of energy saving should be determined using Equation (5):
here: – economically feasible energy saving potential, i.e., the amount of energy that can be saved in a technically feasible and economically justified manner under current conditions (cost of energy carriers, cost of measures, payback period) (kWh or tons of fuel equivalent); – total energy consumption by the ship during the relevant period (year, voyage, etc.), including all types of fuel and electricity (kWh or tons of fuel equivalent); – technical availability coefficient.
The economic feasibility coefficient of energy saving potential (6) is an important indicator that characterizes the share of technical energy saving potential that can be economically justified on a specific vessel, considering limited investment resources, market fuel prices, the cost of implementing measures, and the expected payback period.
Assessing the economically feasible potential for energy saving (7) allows determining what proportion of technically feasible energy conservation measures should be implemented under current economic conditions. The methodology is based on calculating, using the algorithm shown in Figure 6, the net present value (NPV), payback period, or ratio of capital expenditures to expected savings.
here: – economic feasibility coefficient – a share of technically achievable potential, the implementation of which is justified by NPV, payback period, or IRR criteria.
2.3.1. Calculation of the Economic Feasibility Coefficient
Each technical measure must be assessed for economic feasibility. To do this, the following calculations are made:
Option 1: Net Present Value (NPV)
here: – annual fuel cost savings (in USD); – cost of implementing the measure; – discount rate; – measurement period.
Option 2: Marginal energy price
here: – average cost of 1 kWh (or 1 ton of fuel equivalent); – technically achievable savings for the subsystem i.
Determining the economic feasibility coefficient:
The results of calculating the economically feasible energy saving potential using the example of a merchant ship are summarized in Table 8.
Pros of this approach:
- Ensures the link between technical capabilities and economic reality;
- Allows the formation of priority investment programs;
- Supports decisions within SEEMP, CII, EEOI through economic optimization.
Cons:
- Requires reliable information about investment costs;
- Does not consider external benefits (social, environmental, image);
- Requires assessment of risks and scenarios (fuel, tariffs, depreciation).
2.4. Techno-Economic Assessment and Prioritization of Energy-Saving Measures
Table 9 contains a systematic list of energy-efficient technologies that can be implemented for each of the ship’s key subsystems with an indicative implementation cost (in USD), based on data from marine engineering practice, SEEMP recommendations, and commercial ship energy modernization projects.
The costs shown in Table 9 are indicative for medium-tonnage vessels (30–60 thousand DWT, e.g., as in Table 3) excluding VAT, logistics, and installation. Complex measures may require electrical wiring upgrades and additional approvals from the classification society (e.g., when installing heat recovery systems). Energy savings are not cumulative, as some measures overlap.
To synthesize the results of the technical and economic assessments and to ensure consistency between the proposed energy-saving indicators and their practical implementation, a consolidated techno-economic model is developed. This model integrates the relative theoretical, technical, and economically feasible energy-saving potentials with subsystem-specific energy consumption, technical availability coefficients, and economic feasibility factors.
Table 10 summarizes the key parameters of this integrated model for the representative merchant vessel considered in the study. The table provides a structured comparison of major onboard subsystems, linking their energy consumption levels with corresponding energy-saving potentials, investment costs, and expected economic benefits. This consolidated representation enables a transparent evaluation of trade-offs between technical feasibility and economic effectiveness and supports the prioritization of energy efficiency measures within the framework of ship energy management and compliance with operational efficiency requirements.
Table 11 shows the break-even points for each energy efficiency measure by subsystem. The fastest return on investment is for the main engine upgrade (1 year), while the payback period for the HVAC system is 27 years.
The conducted techno-economic assessment demonstrates that, for the considered Chemical/Oil Product Carrier, a limited investment budget on the order of 60 000 USD is sufficient to implement a selected set of technically feasible energy efficiency measures targeting the main engine subsystem. As shown in Table 9, such measures belong to the category of medium-scale retrofitting solutions and are characterized by a favorable balance between expected energy savings and capital expenditures. This finding confirms that a substantial portion of the economically feasible energy-saving potential can be realized without extensive modifications to the vessel configuration, thereby supporting incremental and risk-controlled improvement of operational energy efficiency.
3. Conclusions
Calculating the relative theoretical energy saving potential makes it possible to objectively assess the energy efficiency of a merchant ship’s operation. It is advisable to use this indicator as a baseline, since it is the maximum possible among all types of potential (technical, economic, actual) and allows assessing the total reserve for reducing energy consumption without considering current limitations.
The relative technical potential for energy saving () is defined as a value calculated by multiplying relative theoretical energy-saving potential () by the reduction factor for technical availability (). The value of this factor depends on:
- availability of modern energy-saving technologies for the vessel (e.g., heat recovery systems, energy-saving propeller devices, frequency converters);
- technical feasibility of implementing these measures without radical reconstruction of the power plant;
- level of technical qualification of the crew and shore-based engineering personnel responsible for the ship’s energy management.
The relative economic potential of energy saving (), in turn, significantly depends on:
- the volume and cost of the shipowner’s available investment resources;
- approaches adopted for the economic assessment of energy efficiency projects (NPV, IRR, payback period);
- the current market price of fuel, the costs of maintaining and modernizing equipment, and the expected service life of the vessel.
All relative energy saving potentials are directly related to the current structure of energy consumption on board. The higher the share of energy-intensive systems (e.g., main engine, auxiliary generators, compressors, air conditioning systems, etc.), the more likely significant losses are at the stages of energy generation, transmission, and consumption—and the higher the calculated energy saving potential in a specific functional segment may be.
Thus, segment analysis of a ship’s energy consumption (distribution by installations and systems) is an important prerequisite for accurately determining the technical and economic reserves of energy efficiency, and relative potential plays a key role in developing a priority program for the implementation of energy-saving measures.
In a broader perspective, the proposed system of relative energy-saving potentials can be directly integrated into digital twin architectures and AI-based energy management systems, enabling continuous performance monitoring, scenario-based optimization, and adaptive compliance with evolving operational and regulatory requirements.
Author Contributions
Conceptualization, A.H. and I.H.; methodology, A.H. and I.H.; software, A.H.; validation, I.H.; formal analysis, A.H.; investigation, I.H.; resources, I.H.; data curation, I.H.; writing—original draft preparation, A.H. and I.H.; writing—review and editing, A.H. and I.H.; visualization, A.H. and I.H.; supervision, A.H.; project administration, A.H. and I.H.; funding acquisition, A.H. All authors have read and agreed to the published version of the manuscript.
Funding
This research received no external funding.
Data Availability Statement
No new data were created or analyzed in this study. Data sharing is not applicable to this article.
Conflicts of Interest
The authors declare no conflicts of interest.
Abbreviations
The following abbreviations are used in this manuscript:
| AI | Artificial Intelligence |
| CII | Carbon Intensity Indicator |
| EEDI | Energy Efficiency Design Index |
| EEOI | Energy Efficiency Operational Indicator |
| EMS | Energy Management System |
| HVAC | Heating, Ventilation, and Air Conditioning |
| IMO | International Maritime Organization |
| IRR | Investment Return Rate |
| ME | Main Engine |
| MCR | Maximum Continuous Rating |
| NPV | Net Present Value |
| SEEMP | Ship Energy Efficiency Management Plan |
References
- Sardar, A.; Islam, R.; Anantharaman, M.; Garaniya, V. Advancements and obstacles in improving the energy efficiency of maritime vessels: A systematic review. Marine Pollution Bulletin 2025, 214, 117688. [Google Scholar] [CrossRef] [PubMed]
- Wang, K.; Wang, J.; Huang, L.; Yuan, Y.; Wu, G.; Xing, H.; Wang, Z.; Wang, Z.; Jiang, X. A comprehensive review on the prediction of ship energy consumption and pollution gas emissions. Ocean Engineering 2022, 266, 112826. [Google Scholar] [CrossRef]
- Shi, W.; Stapersma, D.; Grimmelius, H. T. Analysis of energy conversion in ship propulsion system in off-design operation conditions; 2009; pp. 461–472. [Google Scholar] [CrossRef]
- Li, F. Energy Efficiency Measurement Method of Operating Ship Based on Data Mining. Journal of Physics: Conference Series 2021, 1802(3), 032144. [Google Scholar] [CrossRef]
- Caprace, J.-D.; Marques, C. H.; Assis, L. F.; Lucchesi, A.; Pereda, P. C. Sustainable Shipping: Modeling Technological Pathways Toward Net-Zero Emissions in Maritime Transport (Part I). Sustainability 2025, 17(8), 3733. [Google Scholar] [CrossRef]
- Barreiro, J.; Zaragoza, S.; Diaz-Casas, V. Review of ship energy efficiency. Ocean Engineering 2022, 257, 111594. [Google Scholar] [CrossRef]
- Hüffmeier, J.; Johanson, M. State-of-the-Art Methods to Improve Energy Efficiency of Ships. Journal of Marine Science and Engineering 2021, 9(4), 447. [Google Scholar] [CrossRef]
- Poulsen, R. T.; Viktorelius, M.; Varvne, H.; Rasmussen, H. B.; Von Knorring, H. Energy efficiency in ship operations—Exploring voyage decisions and decision-makers. Transportation Research Part D: Transport and Environment 2022, 102, 103120. [Google Scholar] [CrossRef]
- García Rodríguez, L.; Castro-Santos, L.; Lamas Galdo, M. I. Feasibility and Limitations of Solar Energy Integration in Merchant Ships: A Case Study on Fire Detection Systems. Journal of Marine Science and Engineering 2025, 13(5), 991. [Google Scholar] [CrossRef]
- Bayraktar, M.; Mollaoglu, M.; Yuksel, O. Scientometric Analysis of Energy Efficiency Indicators in Maritime Transportation: A Systematic State-of-the-Art Review and Implications. Sustainability 2025, 17(8), 3612. [Google Scholar] [CrossRef]
- Golovan, A.; Gritsuk, I.; Honcharuk, I. Reliable Ship Emergency Power Source: A Monte Carlo Simulation Approach to Optimize Remaining Capacity Measurement Frequency for Lead-Acid Battery Maintenance. In SAE International Journal of Electrified Vehicles; Scopus, 2023; 2, p. 13. [Google Scholar] [CrossRef]
- Golovan, A.; Mateichyk, V.; Gritsuk, I.; Lavrov, A.; Smieszek, M.; Honcharuk, I.; Volska, O. Enhancing Information Exchange in Ship Maintenance through Digital Twins and IoT: A Comprehensive Framework. In Computers; Scopus, 2024; 10. [Google Scholar] [CrossRef]
- Ferrarini, L.; Filippopoulos, Y.; Lajic, Z. Digital Transformation in the Shipping Industry: A Network-Based Bibliometric Analysis. Journal of Marine Science and Engineering 2025, 13(5), 894. [Google Scholar] [CrossRef]
- Sagin, S. V.; Karianskyi, S.; Sagin, S. S.; Volkov, O.; Zablotskyi, Y.; Fomin, O.; Píštěk, V.; Kučera, P. Ensuring the safety of maritime transportation of drilling fluids by platform supply-class vessel. Applied Ocean Research 2023, 140, 103745. [Google Scholar] [CrossRef]
- Sagin, S.; Kuropyatnyk, O.; Matieiko, O.; Razinkin, R.; Stoliaryk, T.; Volkov, O. Ensuring Operational Performance and Environmental Sustainability of Marine Diesel Engines through the Use of Biodiesel Fuel. Journal of Marine Science and Engineering 2024, 12(8), 1440. [Google Scholar] [CrossRef]
- Sagin, S.; Haichenia, O.; Karianskyi, S.; Kuropyatnyk, O.; Razinkin, R.; Sagin, A.; Volkov, O. Improving Green Shipping by Using Alternative Fuels in Ship Diesel Engines. Journal of Marine Science and Engineering 2025, 13(3), 589. [Google Scholar] [CrossRef]
- Sagin, S. V.; Sagin, S. S.; Madey, V. Analysis of methods of managing the environmental safety of the navigation passage of ships of maritime transport. Technology Audit and Production Reserves 2023, 4(3(72)), 33–42. [Google Scholar] [CrossRef]
- Zheng, Z.; Zhou, X. Design and Simulation of Ship Energy Efficiency Management System Based on Data Analysis. Journal of Coastal Research 2019, 94(sp1), 552. [Google Scholar] [CrossRef]
- Tokuslu, A. Energy efficiency of a passenger ship in Turkey. Scientific Bulletin of Naval Academy 2020, XXIII(1), 15–21. [Google Scholar] [CrossRef]
- Koričan, M.; Vladimir, N.; Haramina, T.; Alujević, N.; Vučković, K. EXTENDED EMISSION INDEX FOR FISHING VESSELS: ASSESSMENT OF THE ENVIRONMENTAL FRIENDLINESS OF A PURSE SEINER WITH AN ALTERNATIVE POWER SYSTEM 2023, 225–232. [CrossRef]
- A study on estimation methodology of GHG emission from vessels by using energy efficiency index and time series monitoring data. In Maritime-Port Technology and Development, 0 ed.; Ehlers, S., Asbjornslett, B. E., Rodseth, O. J., Berg, T. E., Eds.; CRC Press, 2014; pp. 43–50. [Google Scholar] [CrossRef]
- Rehmatulla, N.; Smith, T. Barriers to energy efficient and low carbon shipping. Ocean Engineering 2015, 110, 102–112. [Google Scholar] [CrossRef]
- Rehmatulla, N.; Smith, T. Barriers to energy efficiency in shipping: A triangulated approach to investigate the principal agent problem. Energy Policy 2015, 84, 44–57. [Google Scholar] [CrossRef]
- Vorkapić, A.; Radonja, R.; Zec, D. Cost Efficiency of Ballast Water Treatment Systems Based on Ultraviolet Irradiation and Electrochlorination. Promet - Traffic&Transportation 2018, 30(3), 343–348. [Google Scholar] [CrossRef]
- Kim, Y.-R.; Steen, S. Potential energy savings of air lubrication technology on merchant ships. International Journal of Naval Architecture and Ocean Engineering 2023, 15, 100530. [Google Scholar] [CrossRef]
- Yang, M.-H.; Yeh, R.-H. Thermodynamic and economic performances optimization of an organic Rankine cycle system utilizing exhaust gas of a large marine diesel engine. Applied Energy 2015, 149, 1–12. [Google Scholar] [CrossRef]
- Krčum, M.; Zubčić, M.; Kaštelan, N.; Gudelj, A. Reducing the Dimensions of the Ship’s Main Switchboard—A Contribution to Energy Efficiency. Energies 2021, 14(22), 7567. [Google Scholar] [CrossRef]
- Jimenez, V. J.; Kim, H.; Munim, Z. H. A review of ship energy efficiency research and directions towards emission reduction in the maritime industry. Journal of Cleaner Production 2022, 366, 132888. [Google Scholar] [CrossRef]
- Öztürk, O. B.; Başar, E. Multiple linear regression analysis and artificial neural networks based decision support system for energy efficiency in shipping. Ocean Engineering 2022, 243, 110209. [Google Scholar] [CrossRef]
- Im, N.; Choe, B.; Park, C.-H. Developing and Applying a Ship Operation Energy Efficiency Evaluation Index Using SEEMP: A Case Study of South Korea. Journal of Marine Science and Application 2019, 18(2), 185–194. [Google Scholar] [CrossRef]
- Aijjou, A.; Bahatti, L.; Raihani, A. Analy sis of container ship energy systems. International Journal of Energy Production and Management 2020, 5(2), 142–156. [Google Scholar] [CrossRef]
- Golovan, A.; Gritsuk, I.; Popeliuk, V.; Sherstyuk, O.; Honcharuk, I.; Symonenko, R.; Saravas, V.; Volodarets, M.; Ahieiev, M.; Pohorletskyi, D.; Khudiakov, I. Features of mathematical modeling in the problems of determining the power of a turbocharged engine according to the characteristics of the turbocharger. In SAE International Journal of Engines; Scopus, 2020; 1, p. 13. [Google Scholar] [CrossRef]
- Golovan, A.; Gritsuk, I.; Kurtsev, M.; Ischuka, O.; Vrublevskyi, R. Aspects of Remote Monitoring of the Transport Vessel Under Operating Conditions. In Lecture. Notes. Intell. Transp. Infrastruct. Vol. Part F1382; Springer Nature; Scopus, 2020; pp. 295–301. [Google Scholar] [CrossRef]
- Holovan, A.; Gritsuk, I.; Verbovskyi, V.; Kalchenko, V.; Grytsuk, Y.; Verbovskiy, O.; Dotsenko, S.; Lysykh, A.; Symonenko, R.; Subochev, O. Algorithmic support and efficiency analysis of comprehensive prescriptive maintenance for cargo ships using predictive monitoring. Eastern-European Journal of Enterprise Technologies 2025, 3(3 (135)), 13–26. [Google Scholar] [CrossRef]
- Braidotti, L.; Bertagna, S.; Rappoccio, R.; Utzeri, S.; Bucci, V.; Marinò, A. On the inconsistency and revision of Carbon Intensity Indicator for cruise ships. Transportation Research Part D: Transport and Environment 2023, 118, 103662. [Google Scholar] [CrossRef]
- Gritsuk, I.; Golovan, A.; Honcharuk, I.; Mickiene, R. Navigating Toward a Greener Future: An Analysis of Emission Reduction in Shipping. In Green Energy and Technology Vol. Part F503; Springer Science and Business Media Deutschland GmbH; Scopus, 2025; pp. 373–380. [Google Scholar] [CrossRef]
- Kalinichenko, Y.; Rudenko, S.; Holovan, A.; Vasalatii, N.; Zaiets, A.; Koliesnik, O.; Santana, L. O.; Dolynska, N. Smart Routing for Sustainable Shipping: A Review of Trajectory Optimization Approaches in Waterborne Transport. Sustainability 2025, 17(18), 8466. [Google Scholar] [CrossRef]
- Golovan, A.; Rudenko, S.; Gritsuk, I.; Shakhov, A.; Vychuzhanin, V.; Mateichyk, V.; Kononova, O.; Kuric, I.; Saga, M.; Evgeny, Z. E. Y. Improving the Process of Vehicle Units Diagnosis by Applying Harmonic Analysis to the Processing of Discrete Signals. In SAE Techni. Paper.; Scopus, 2018. [Google Scholar] [CrossRef]
- Golovan, A.; Gritsuk, I.; Honcharuk, I. PRINCIPLES OF TRANSPORT MEANS MAINTENANCE OPTIMIZATION: EQUIPMENT COST CALCULATION. In Naukovyi Visnyk Natsionalnoho Hirnychoho Universytetu; Scopus, 2023; Volume 5, pp. 77–84. [Google Scholar] [CrossRef]
- Kravchenko, O.; Symonenko, R.; Gerlici, J.; Golovan, A.; Shymanskyi, S.; Gritsuk, I.; Grytsuk, Y. Research on the Use of Biogas as an Additive to Compressed Natural Gas for Supplying Vehicle Engines. Communications - Scientific Letters of the University of Zilina 2025, 27(3), B158–B169. [Google Scholar] [CrossRef]
- Kalinichenko, Y.; Vasalatii, N.; Rossomakha, O.; Koliesnik, O.; Sagaydak, O.; Santana, L. O.; Zaiets, A.; Tomchakovsky, G.; Dolynska, N.; Holovan, A. Some issues of increasing the energy efficiency of ships by improving navigation methods: Monograph; Scientific Route OÜ, 2025. [Google Scholar] [CrossRef]
Figure 1.
Methodological framework for quantifying theoretical, technical, and economically feasible energy-saving potentials of merchant ships.
Figure 1.
Methodological framework for quantifying theoretical, technical, and economically feasible energy-saving potentials of merchant ships.
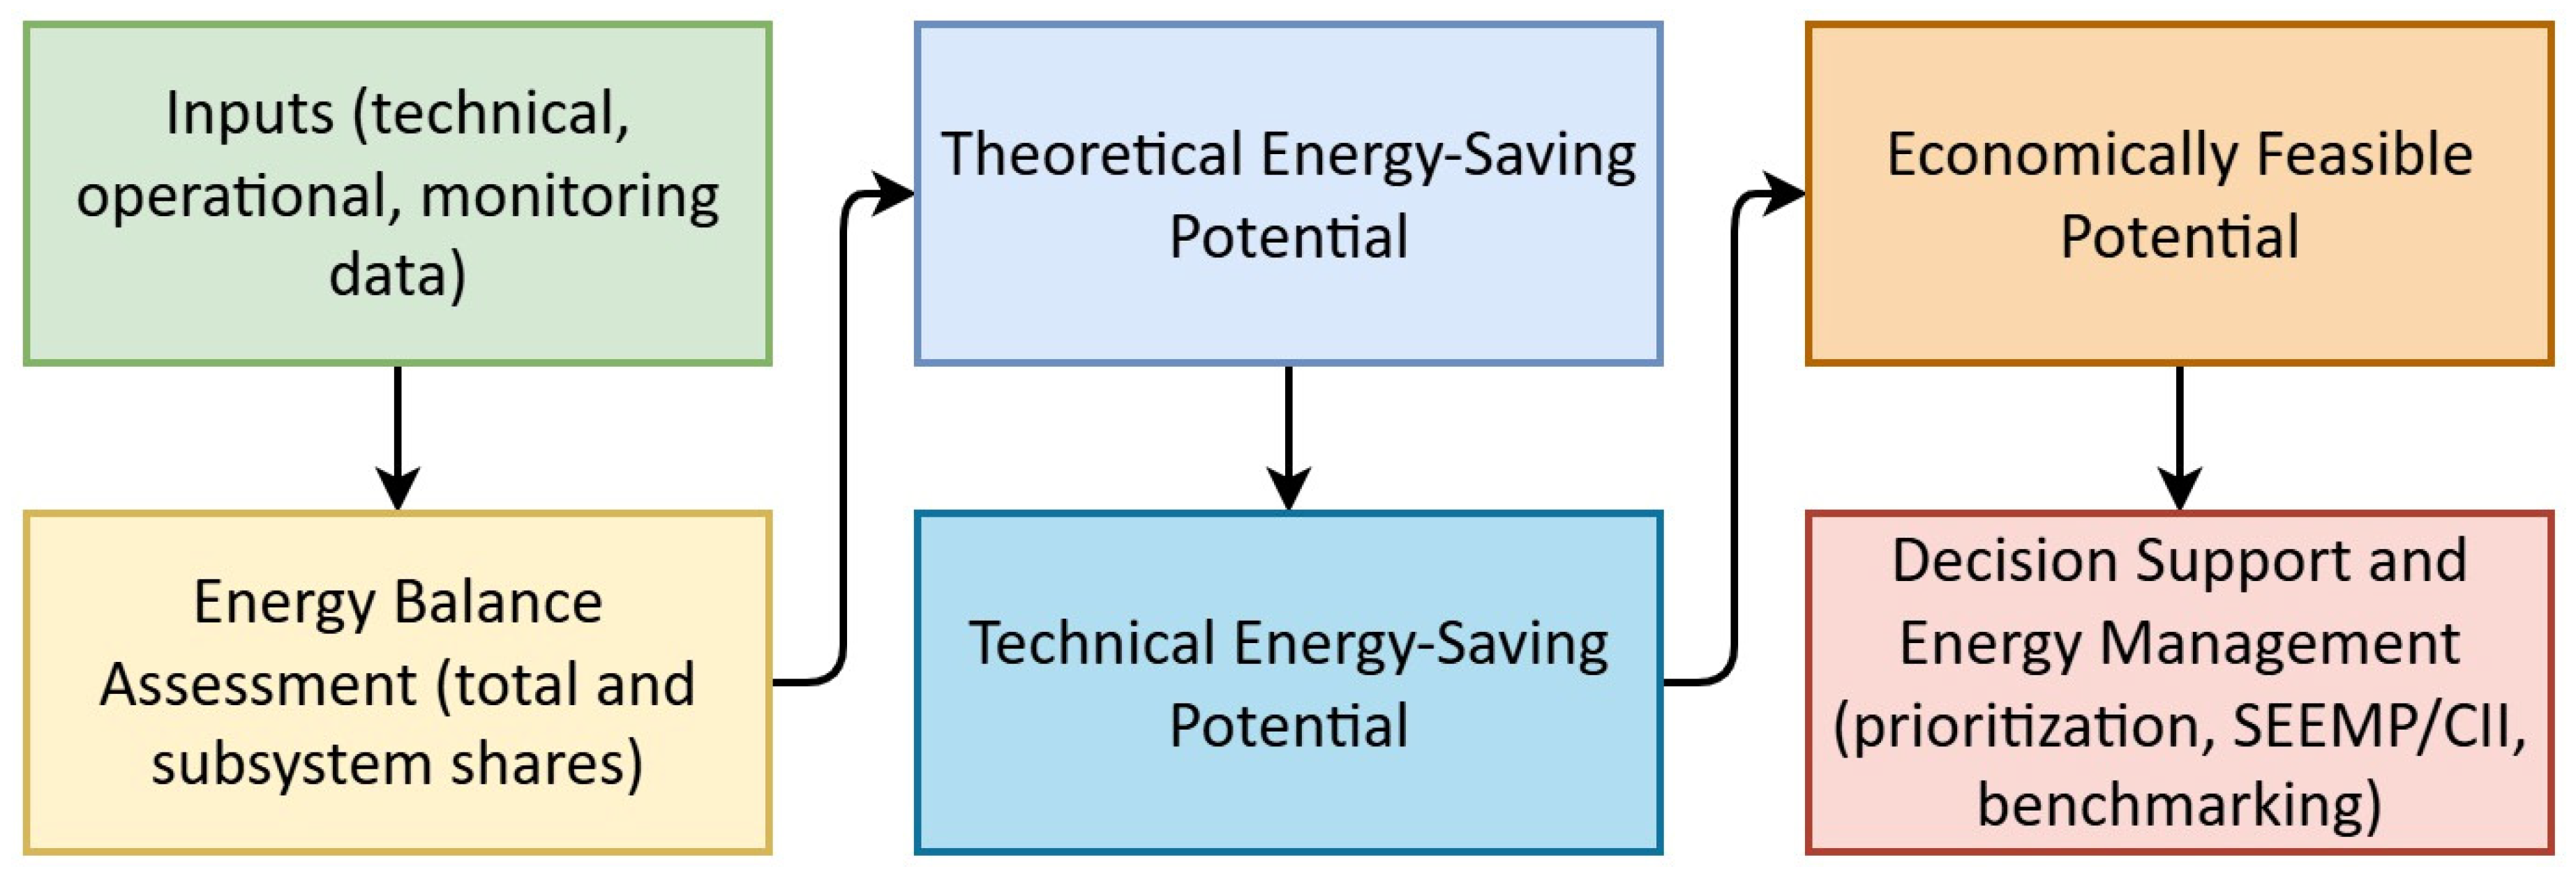
Figure 2.
Classification of the energy saving potential of a merchant ship.
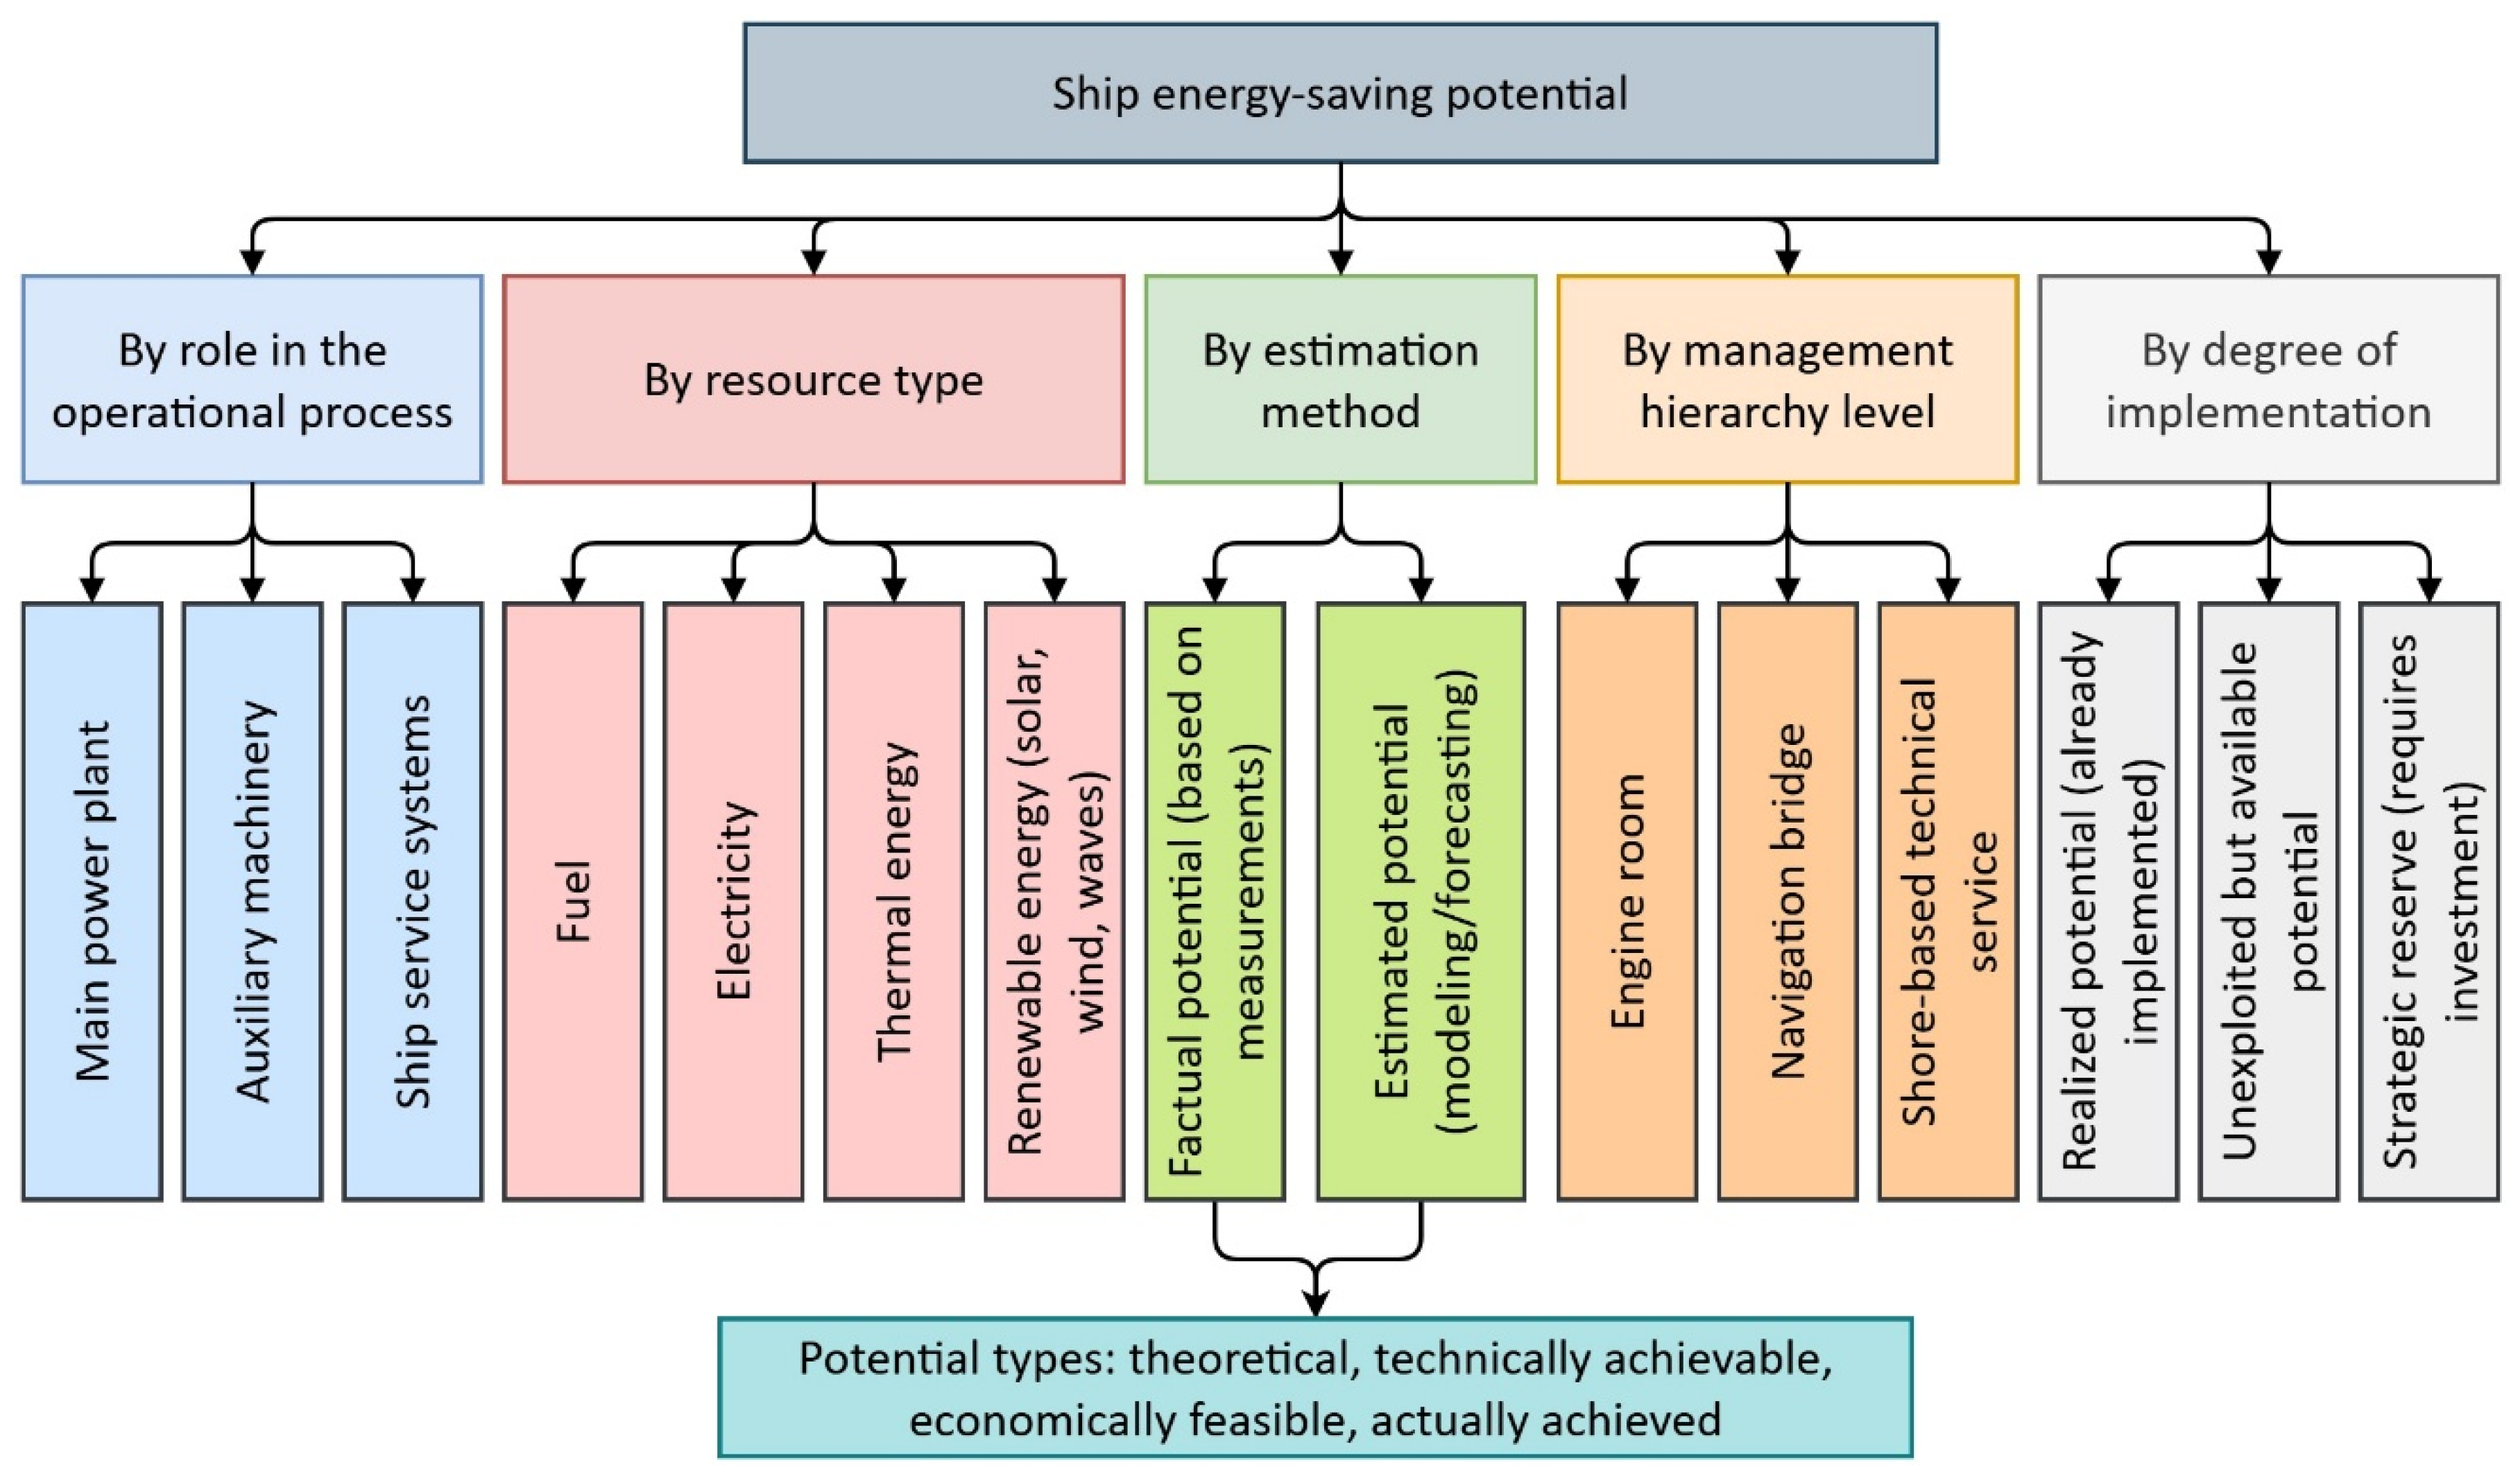
Figure 3.
Dependence of fuel efficiency of the MAN 6S46MC-C7 engine on its load level (% MCR).
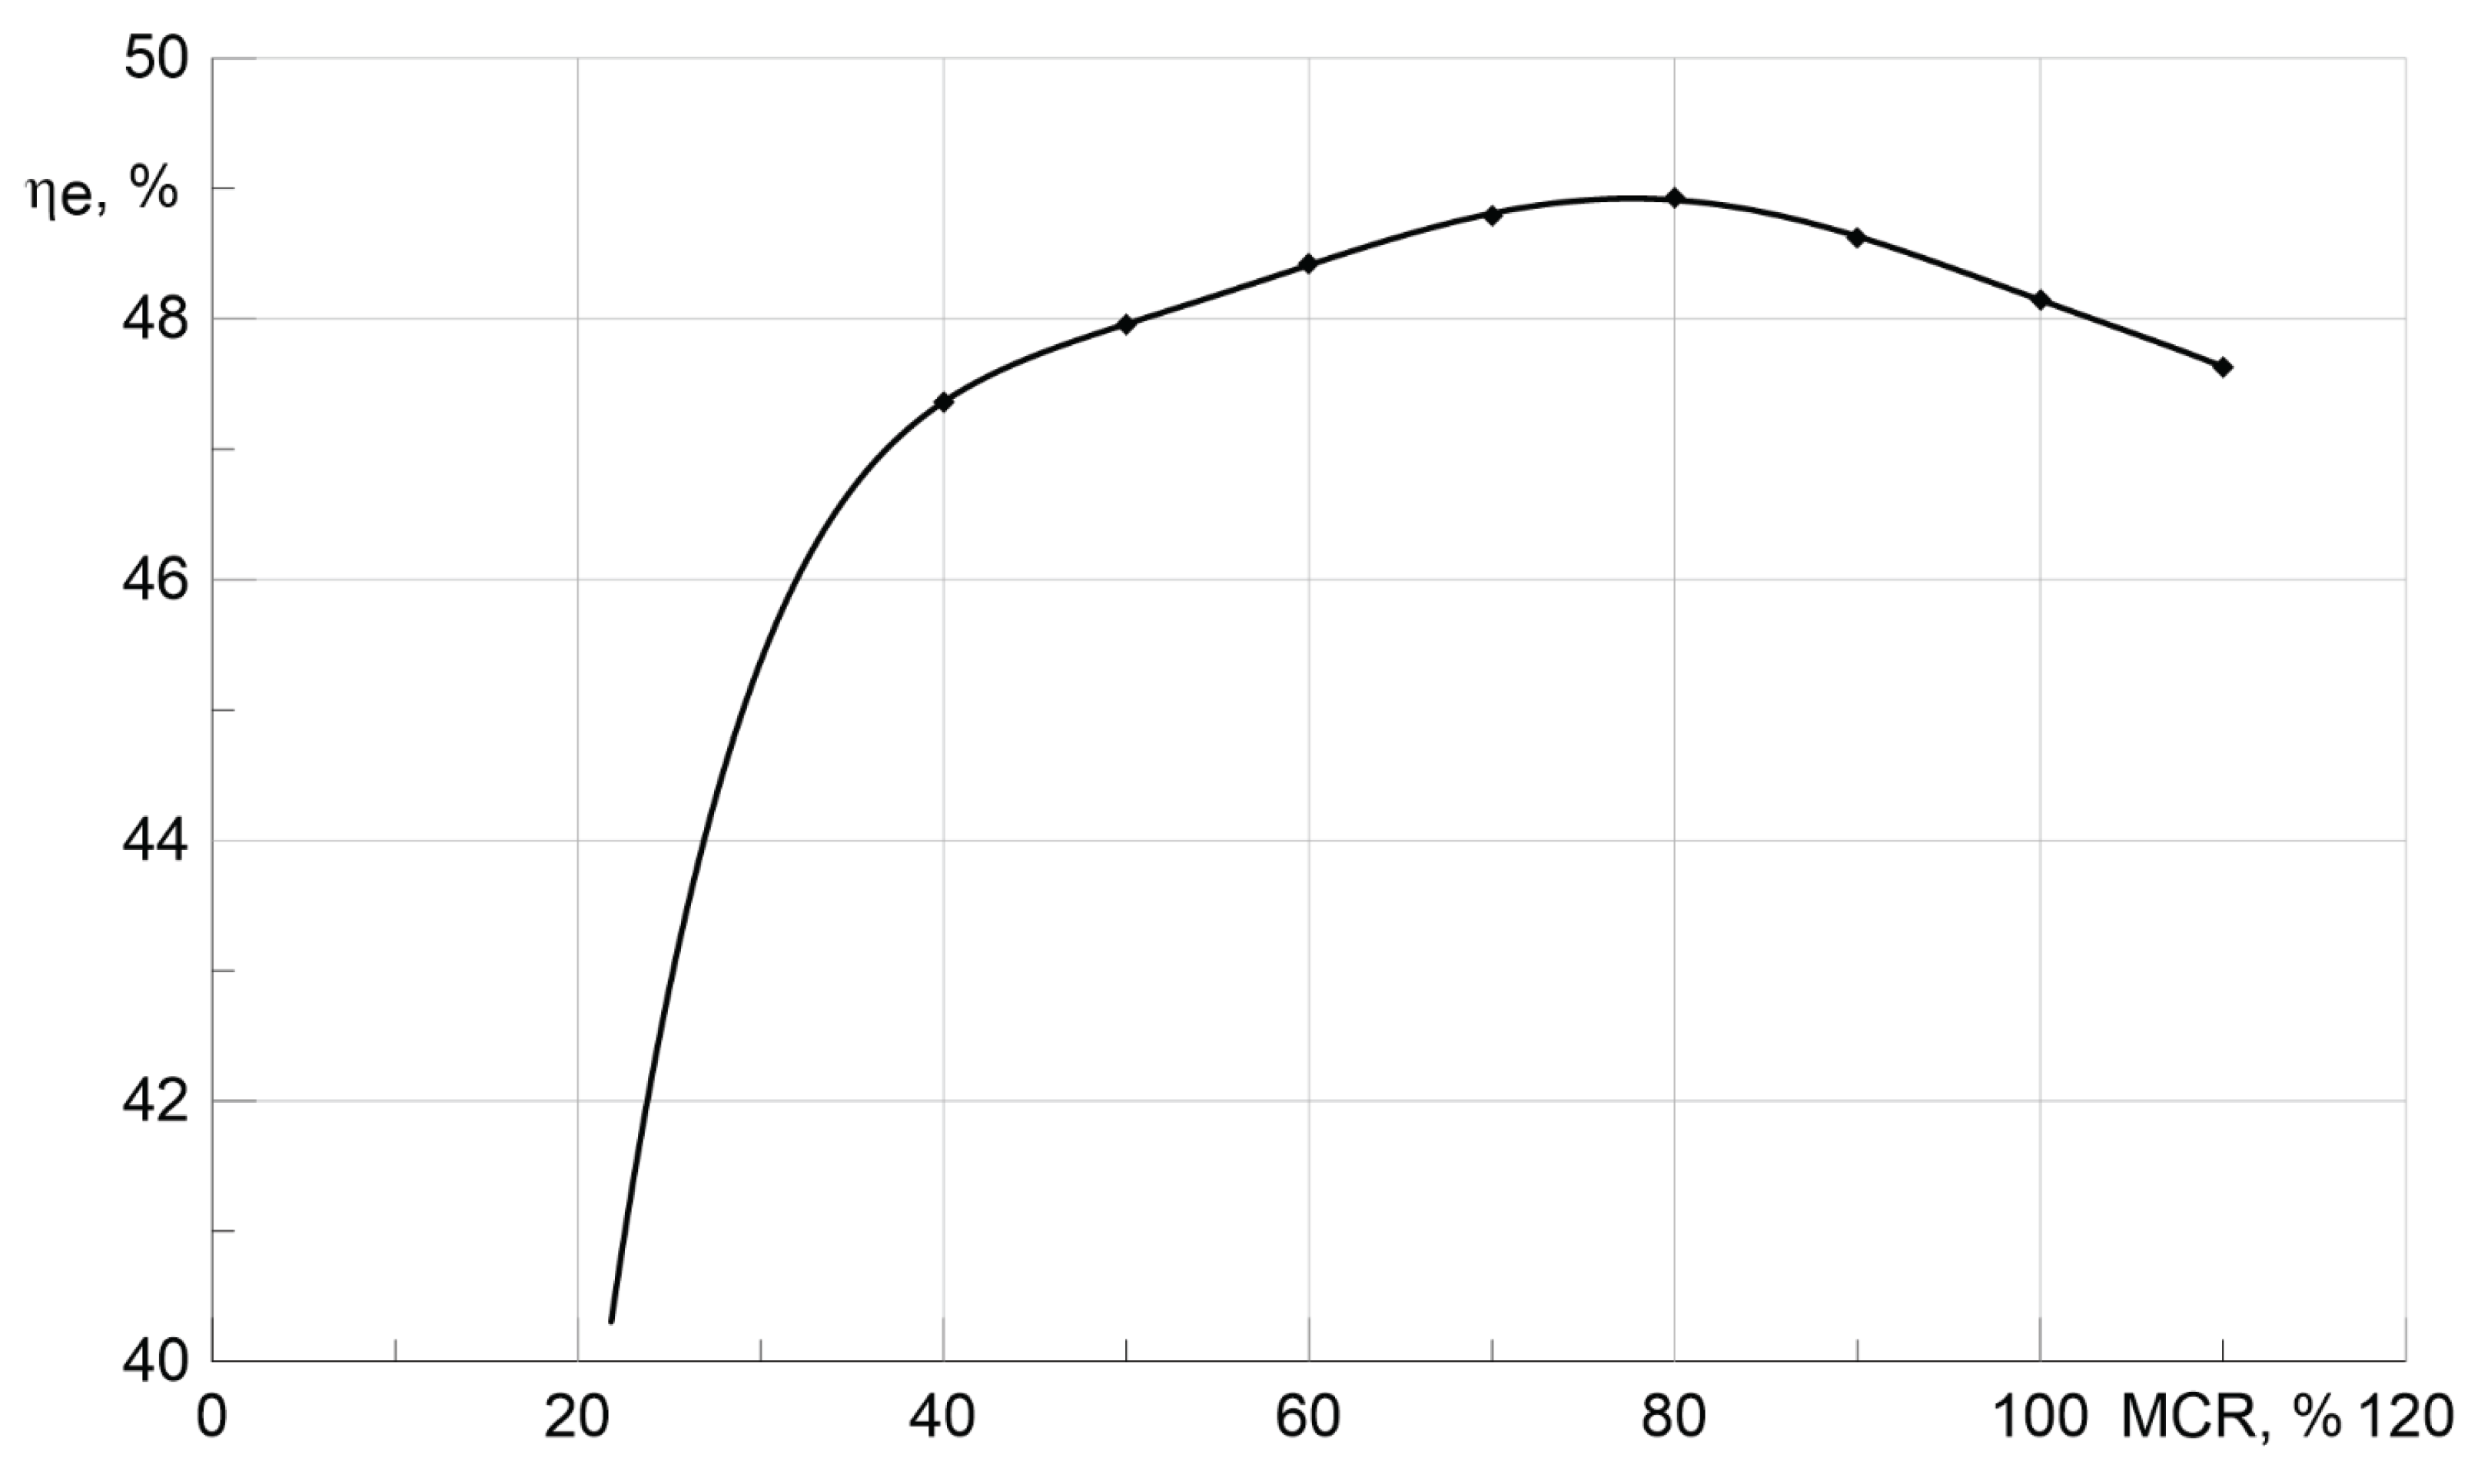
Figure 4.
Typical distribution of operating time of the main engine of a merchant ship, using a Chemical/Oil Product Carrier as an example.
Figure 4.
Typical distribution of operating time of the main engine of a merchant ship, using a Chemical/Oil Product Carrier as an example.
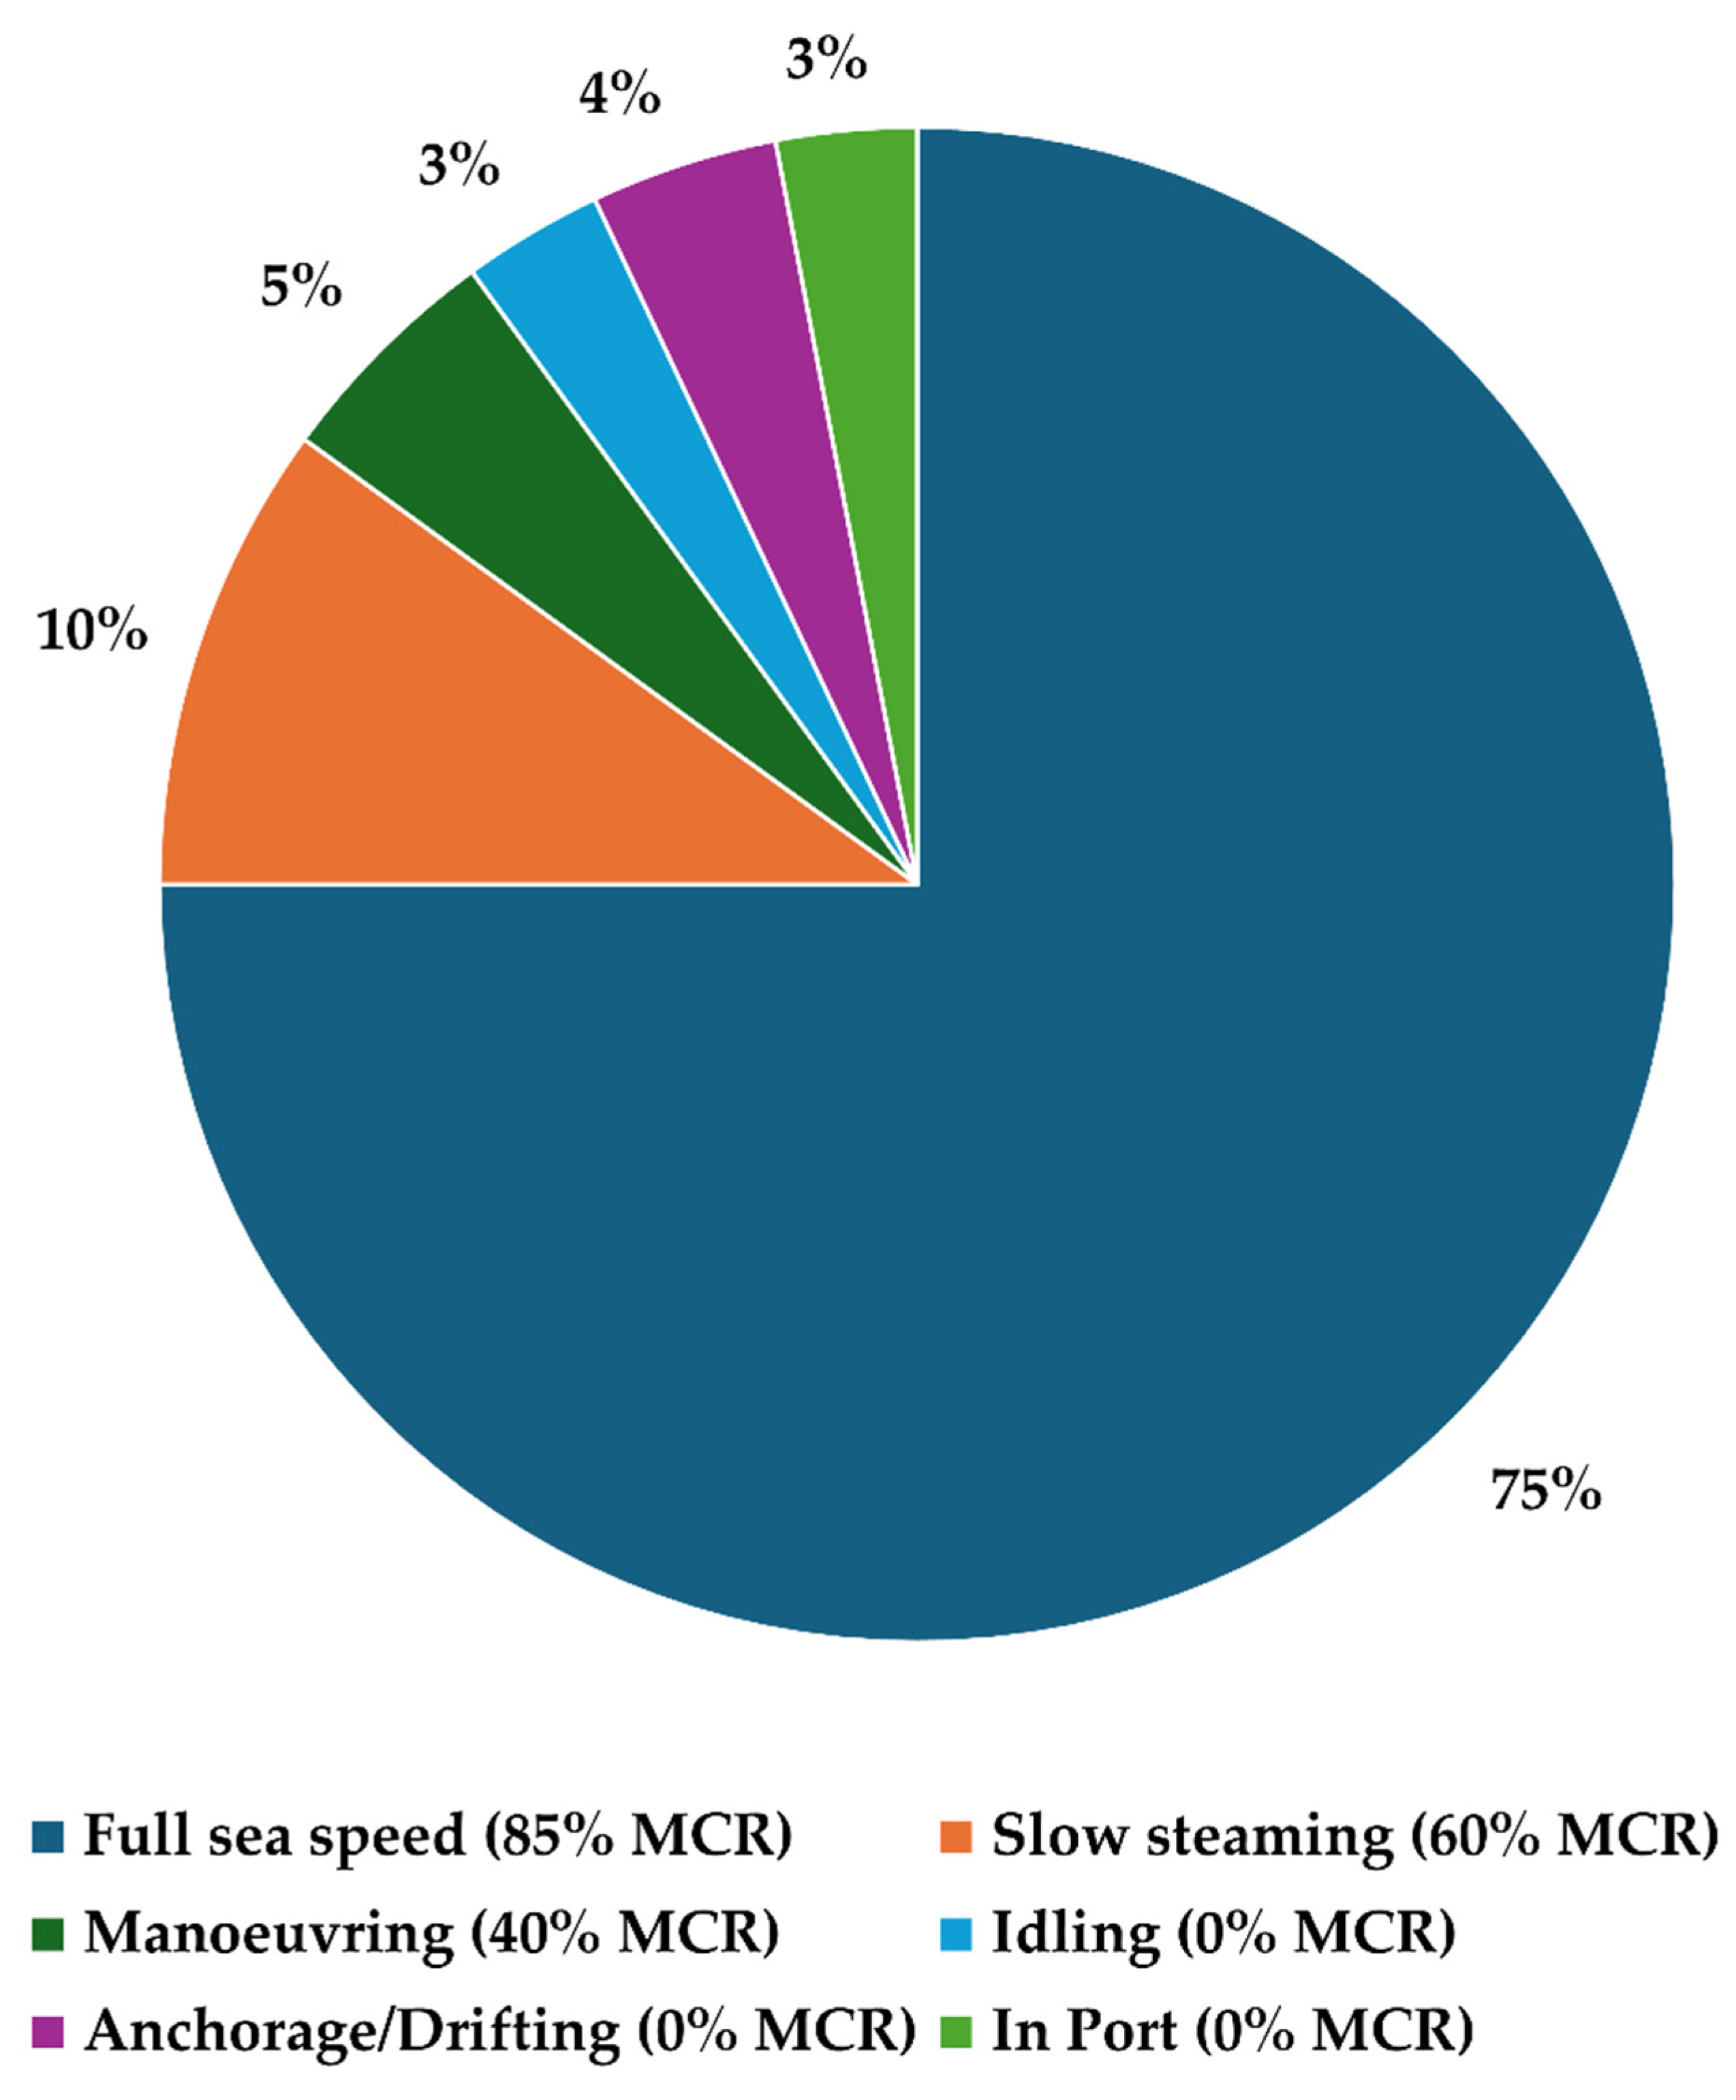
Figure 5.
Algorithm for calculating technically achievable energy saving potential.
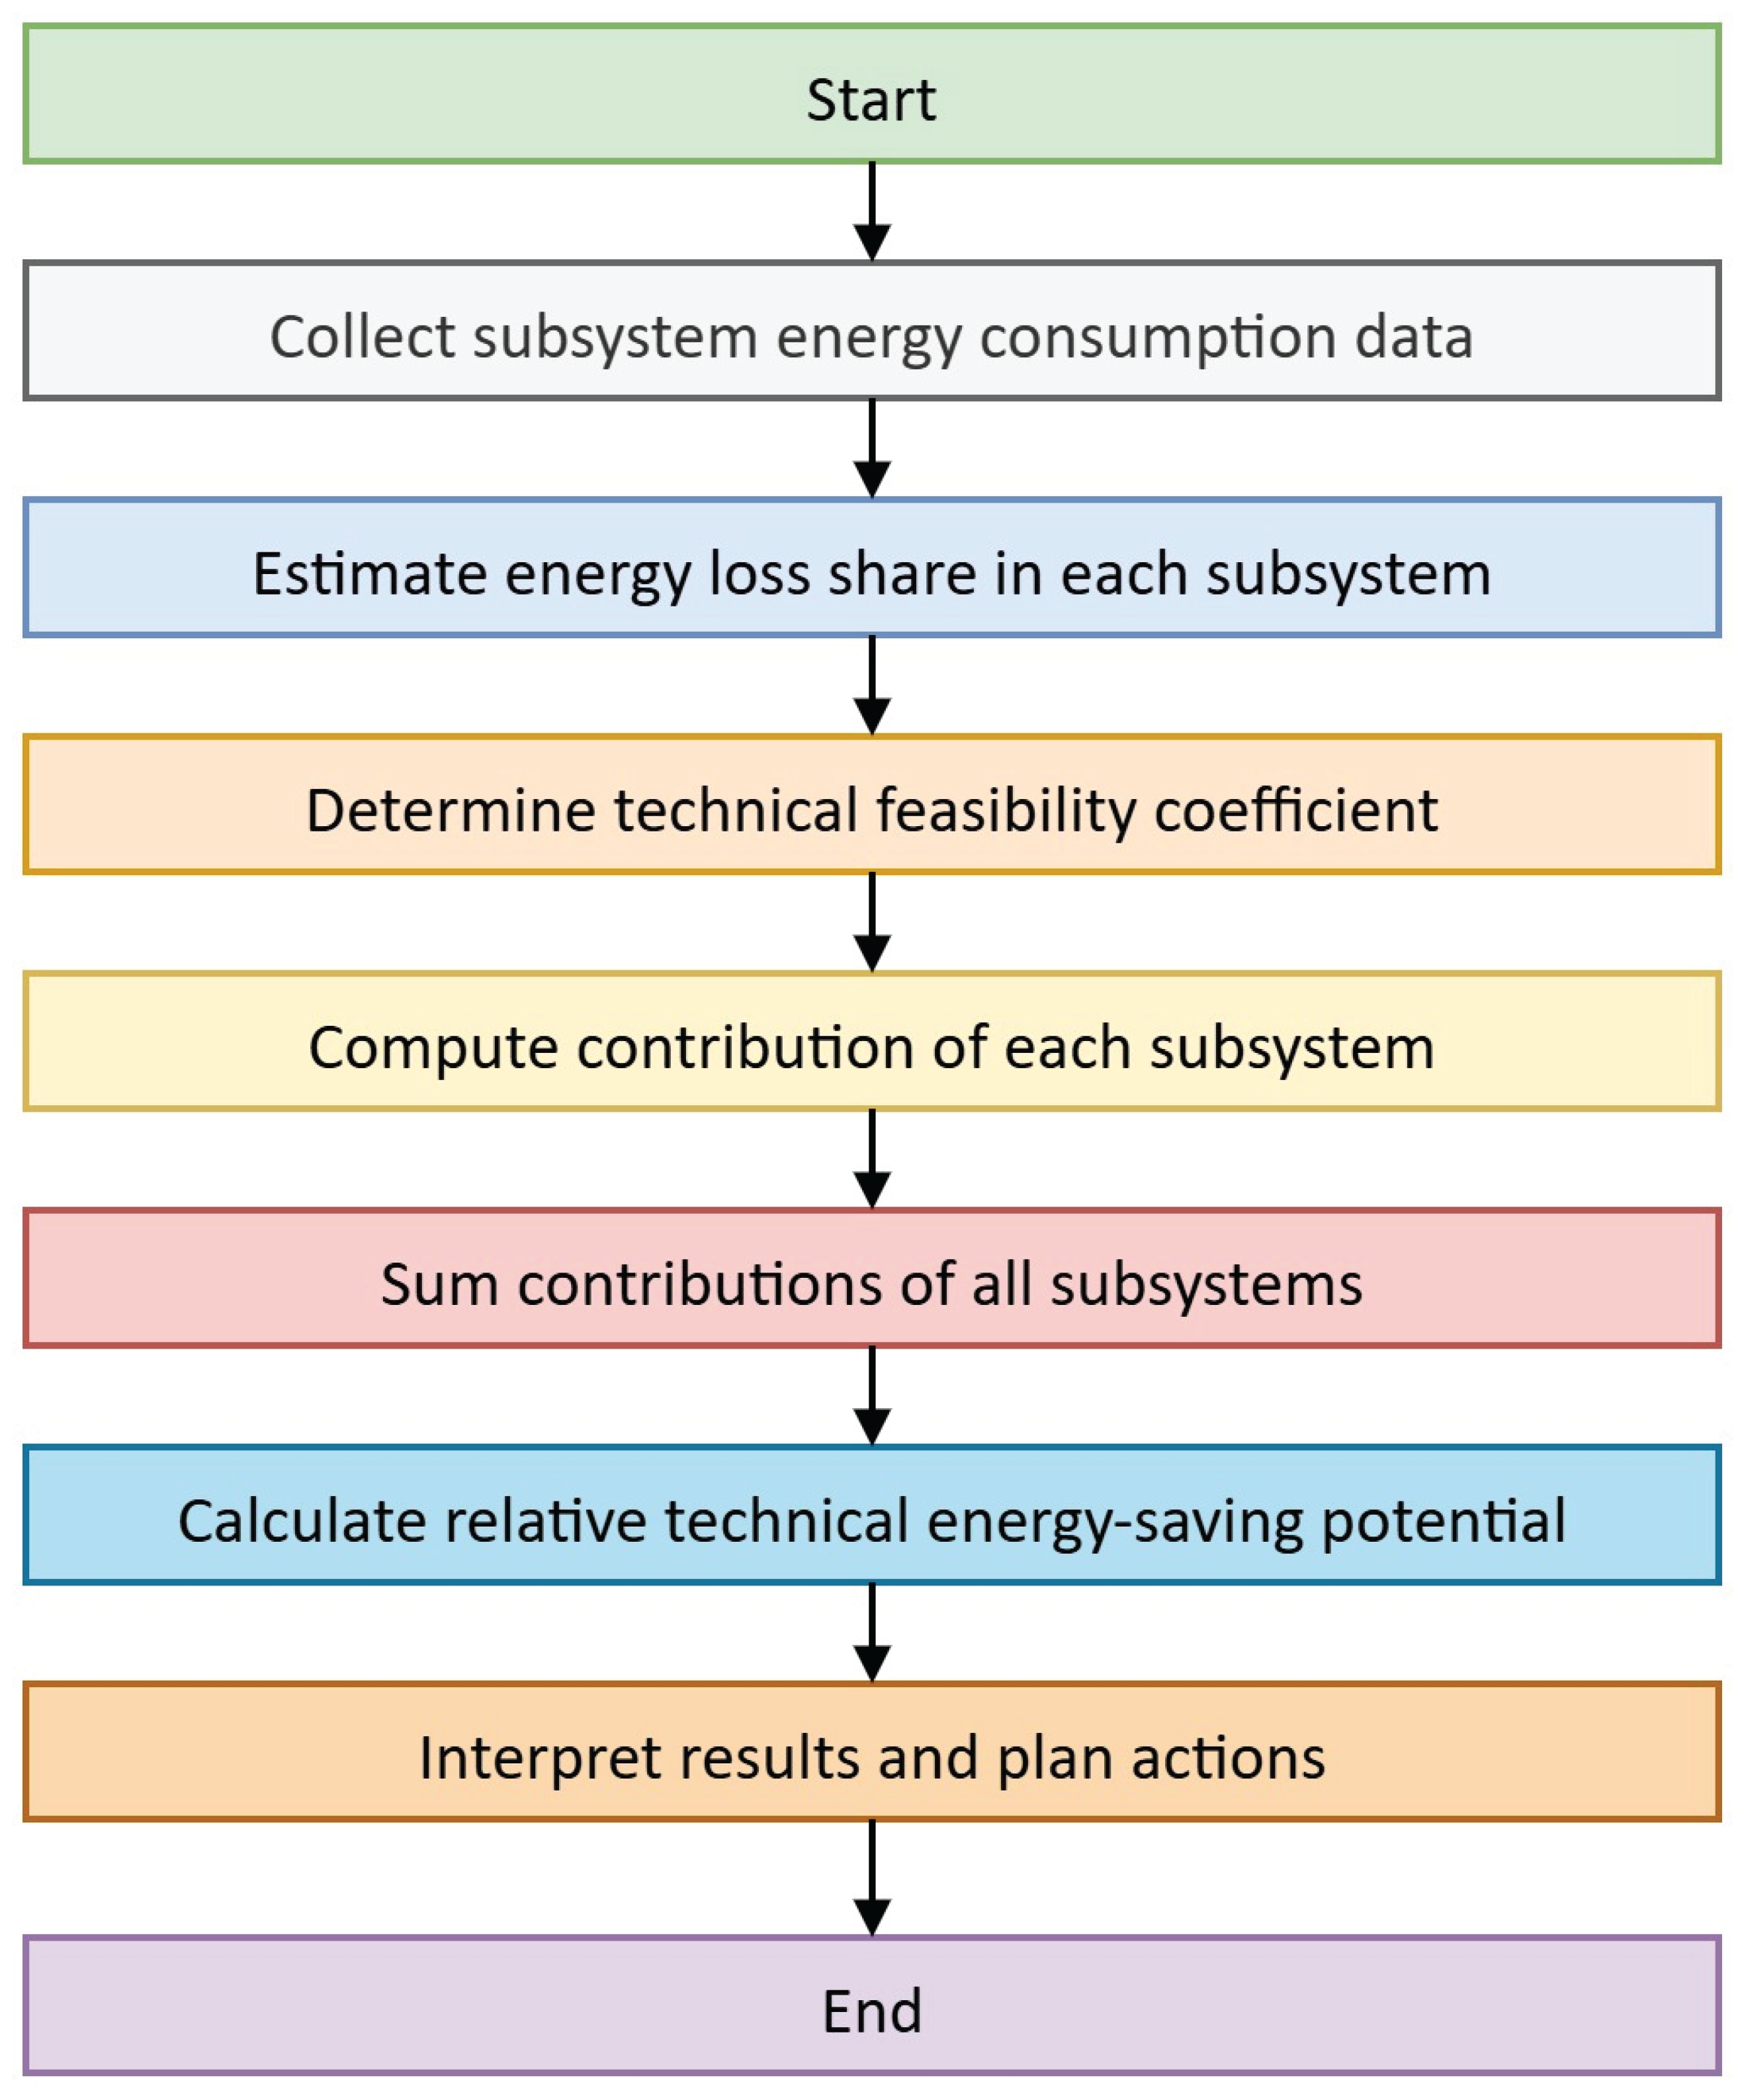
Figure 6.
Algorithm for calculating economically feasible energy saving potential.
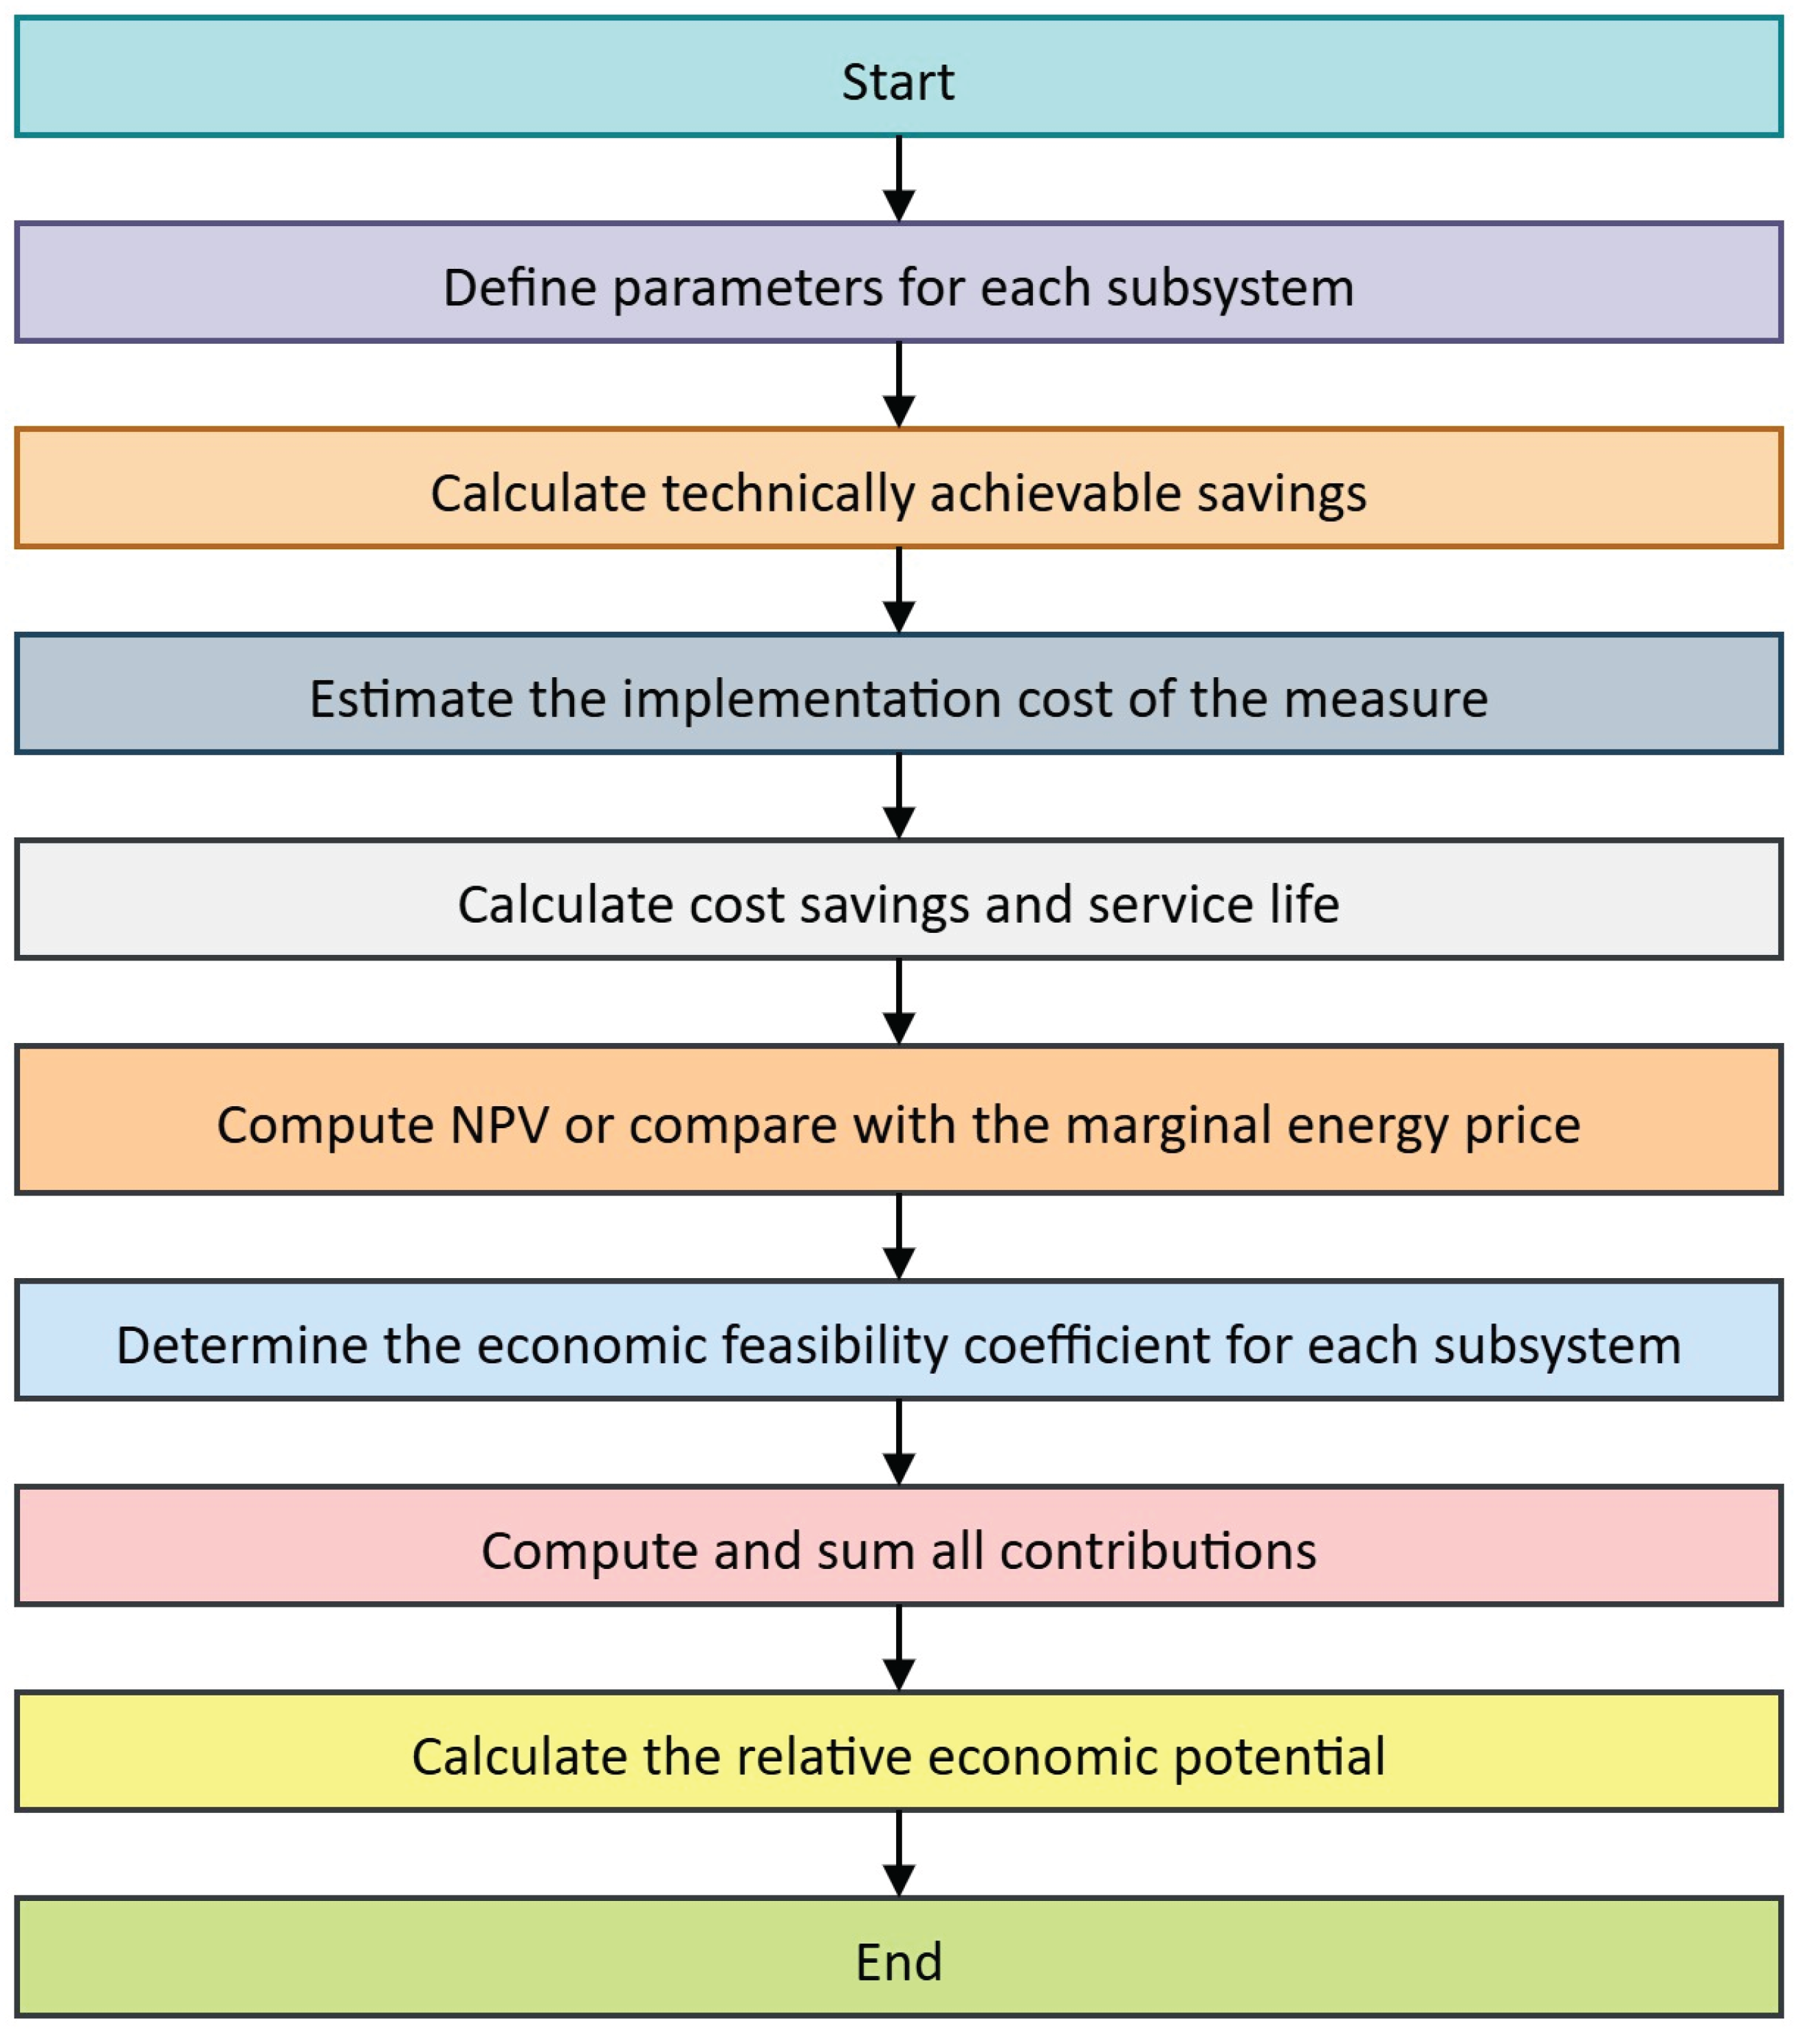
Table 1.
Classification of key indicators of ship energy efficiency and their application.
| Indicator | Purpose | Calculation method/Approach | Scope of application |
|---|---|---|---|
| EEDI | Assesses the energy efficiency of new ships at the design stage | Based on CO2 emissions per unit of transport work (e.g., ton-mile) | Comparison of the design efficiency of different types of ships [18,19]. |
| EEOI | Assesses the operational energy efficiency of ships during operation | Based on actual fuel consumption and CO2 emissions during voyages | Monitoring and improving the operational efficiency of ships [18]. |
| EEI | Considers additional emissions such as SOX and NOX together with CO2 | Calculation includes CO2, SOX and NOX for a comprehensive assessment of environmental impact | Comprehensive environmental impact assessment, in particular for specialized vessels [20]. |
| EENI | Evaluates energy efficiency based on routes and speed plans | Ship routes and speeds are analyzed to optimize fuel consumption | Optimization of routes and speed to reduce fuel consumption and emissions [21]. |
Table 2.
Equations for calculating key indicators of ship energy efficiency.
| Indicator | Equations |
|---|---|
| EEDI [18,19] |
or – engine power i; Capacity - deadweight or gross tonnage (depending on the type of vessel); Speed - design speed of a vessel. |
| EEOI [18] |
- amount of fuel consumed for the voyage j; - fuel conversion factor to CO2; Cargo Carried - tonnage of cargo or number of passengers; Distance – voyage distance. |
| EEI [20] |
- weighting factors reflecting the impact of each type of emission. |
| EENI [21] |
here: - current energy consumption at a given moment in time t; - total voyage time. |
Table 3.
Parameters of the ship’s propulsion system.
| Parameter | Value | Dimension |
|---|---|---|
| Vessel type | Chemical/Oil Product Carrier | - |
| Deadweight | 37000 | metric tones |
| Body length | 185 | m |
| Board height | 27.5 | m |
| Depth | 17 | m |
| Draft (design) | 9.9 | m |
| Water displacement | 39200 | metric tones |
| Engine type | MAN 6S46MC-C7 | - |
| Number of cylinders | 6 | - |
| Cylinder diameter | 460 | mm |
| Piston stroke | 1932 | mm |
| Effective power (at MCR point) | 7860 | kW |
| Engine speed (at MCR point) | 129 | rpm |
| Mean effective pressure (at MCR point) | 19 | Bar |
| Turbocharger | 1 x ABB TPL73 | - |
| Propeller type | Fixed pitch propeller | - |
| Propeller Series | Japanese MAU | - |
| Diameter | 5.6 | m |
| Number of blades | 4 | - |
| Propeller pitch 70% of the radius | 4.2 | m |
| Diesel generators | 3 x 1000 | kW |
| Emergency diesel generator | 118 | kW |
Table 5.
Results of calculating the theoretical energy saving potential of commercial vessel diesel generators for a conditional voyage lasting 21 days.
Table 5.
Results of calculating the theoretical energy saving potential of commercial vessel diesel generators for a conditional voyage lasting 21 days.
| Operating mode of ship diesel generators | Part of voyage time, % | , % | Working time, hours |
Engine power, kW | , kW |
|---|---|---|---|---|---|
| Maneuvering | 5 | 40 | 25.2 | 1200 | 46915 |
| Idling | 3 | 40 | 15.1 | 1200 | 28149 |
| Anchoring/drifting | 4 | 37 | 20.2 | 1000 | 34648 |
| Port operations | 3 | 42 | 15.1 | 1400 | 30581 |
Table 6.
Typical values of estimated energy losses and technically achievable reduction in losses.
| Subsystem | ||
|---|---|---|
| Main engine | 0.50–0.58 | 0.20–0.35 |
| Auxiliary engines | 0.30–0.40 | 0.30–0.50 |
| Pumping equipment | 0.25–0.35 | 0.40–0.60 |
| HVAC systems | 0.40–0.60 | 0.30–0.50 |
| Lighting | 0.20–0.30 | up to 0.80 |
Table 7.
Results of calculating the technical energy-saving potential of a merchant ship for a real voyage lasting 21 days.
Table 7.
Results of calculating the technical energy-saving potential of a merchant ship for a real voyage lasting 21 days.
| Subsystem | , kW | |||
|---|---|---|---|---|
| Main engine | 3016165 | 0.53 | 0.25 | 399642 |
| Auxiliary engines | 140300 | 0.3 | 0.4 | 16836 |
| Pumping equipment | 100000 | 0.35 | 0.5 | 17500 |
| HVAC systems | 50000 | 0.5 | 0.3 | 7500 |
| Total | – | – | – | 441478 |
Table 8.
Results of calculating the economically feasible energy saving potential of a merchant ship for a conditional voyage lasting 21 days.
Table 8.
Results of calculating the economically feasible energy saving potential of a merchant ship for a conditional voyage lasting 21 days.
| subsystem | , kWh | ||||
|---|---|---|---|---|---|
| Main engine | 3016165 | 0.53 | 0.25 | 0.7 | 279749 |
| Auxiliary engines | 140300 | 0.3 | 0.4 | 0.6 | 10102 |
| Pumping equipment | 100000 | 0.35 | 0.5 | 0.5 | 8750 |
| HVAC systems | 50000 | 0.5 | 0.3 | 0.2 | 1500 |
| Total | – | – | – | – | 300101 |
Table 9.
Energy-saving technologies for ship systems with indicative implementation costs and expected effects.
Table 9.
Energy-saving technologies for ship systems with indicative implementation costs and expected effects.
| Subsystem | Technology | Estimated cost (USD) |
Expected effect (%) |
|---|---|---|---|
| Main engine | Heat Recovery Unit (HRU) | 40 000–100 000 | 2–5 |
| Fuel System Optimization | 10 000–20 000 | 1–2 | |
| Load Optimization | 20 000–35 000 | 2–4 | |
| Performance Monitoring | 15 000–40 000 | 1–3 | |
| Turbocharging Modernization | 30 000–60 000 | 2–3 | |
| AI combustion control | 40 000–80 000 | 2–5 | |
| Generators | Automatic generator loading | 15 000–25 000 | 2–4 |
| Frequency converters | 25 000–40 000 | 3–5 | |
| Auto-shutdown at port | 5 000–15 000 | up to 2 | |
| Heat recovery | 30 000–50 000 | 1–3 | |
| Phase monitoring | 10 000–20 000 | up to 1.5 | |
| Pumps | Frequency converters | 10 000–30 000 | 5–15 |
| Automatic pump control | 15 000–25 000 | 10–20 | |
| Energy-efficient electric motors | 20 000–40 000 | 5–10 | |
| Hydraulic optimization | 10 000–20 000 | up to 5 | |
| HVAC | Inverter air conditioners | 20 000–50 000 | 10–30 |
| VSD for fans | 10 000–25 000 | 10–20 | |
| Climate control automation | 10 000–20 000 | up to 15 | |
| Air recuperators | 15 000–30 000 | up to 10 | |
| Lighting | LED lighting | 5 000–15 000 | 50–80 |
| Motion sensors | 3 000–10 000 | up to 5 | |
| Automatic light control | 3 000–8 000 | up to 3 | |
| Renewable sources | Photoelectric panels | 30 000–80 000 | up to 2 |
| Wind turbines | 15 000–40 000 | up to 1 | |
| Thermal solar collectors | 20 000–35 000 | up to 3 | |
| Energy management | Digital energy profile | 20 000–60 000 | 3–5 |
| AI/ML forecasting | 30 000–70 000 | 2–4 | |
| SEEMP integration | 20 000–40 000 | 1–3 |
Table 10.
Consolidated technical and economic model for the implementation of energy-efficient technologies on a merchant ship.
Table 10.
Consolidated technical and economic model for the implementation of energy-efficient technologies on a merchant ship.
| Parameter | Main engine | Generators | Pumps | HVAC |
|---|---|---|---|---|
| (kWh) | 3016165 | 140300 | 100000 | 50000 |
| 0.53 | 0.30 | 0.35 | 0.50 | |
| (tech) | 0.25 | 0.40 | 0.50 | 0.30 |
| (econ) | 0.70 | 0.60 | 0.50 | 0.20 |
| , kWh | 399642 | 16836 | 17500 | 7500 |
| , kWh | 279749 | 10102 | 8750 | 1500 |
| Estimated cost of implementing energy-efficient technologies, USD | 60000 | 20000 | 15000 | 10000 |
| Average energy price (USD/kWh) | 0.25 | 0.25 | 0.25 | 0.25 |
| Annual savings (USD) | 69937 | 2525 | 2188 | 375 |
Table 11.
Break-even points for subsystems.
| Subsystem | Year of reaching the break-even point |
|---|---|
| Main engine | 1 |
| Generators | 8 |
| Pumps | 7 |
| HVAC | 27 |
Disclaimer/Publisher’s Note: The statements, opinions and data contained in all publications are solely those of the individual author(s) and contributor(s) and not of MDPI and/or the editor(s). MDPI and/or the editor(s) disclaim responsibility for any injury to people or property resulting from any ideas, methods, instructions or products referred to in the content. |
© 2026 by the authors. Licensee MDPI, Basel, Switzerland. This article is an open access article distributed under the terms and conditions of the Creative Commons Attribution (CC BY) license (http://creativecommons.org/licenses/by/4.0/).
Copyright: This open access article is published under a Creative Commons CC BY 4.0 license, which permit the free download, distribution, and reuse, provided that the author and preprint are cited in any reuse.


