
Submitted:
09 September 2025
Posted:
10 September 2025
You are already at the latest version
Abstract
This study addresses structural distortions in the IMO Carbon Intensity Indicator (CII) for short-voyage training vessels and proposes corrective strategies combining denominator adjustments with controllable pitch propeller (CPP) mode optimization. Using 2024 operational data from a training ship, we computed monthly and annual CII values, identifying significant inflation when time-at-sea fractions are low due to extensive port stays. Two correction methods were evaluated: a hybrid denominator approach converting port-stay CO₂ to equivalent distance, and a Braidotti functional correction. CPP operating maps for Combination and Fixed modes revealed a crossover point at approximately 12 knots (~50% engine load), where Combination mode shows superior efficiency at low speeds and Fixed mode at higher speeds. The hybrid correction effectively stabilized CII values across varying operational conditions, while speed-band CPP optimization provided additional reductions. Results demonstrate that combining optimized CPP mode selection with hybrid CII correction achieves compliance with required standards, attaining a B rating. The integrated framework offers practical solutions for CII management in short-voyage operations, addressing regulatory fairness while improving operational efficiency for training vessels and similar ship types.
Keywords:
Carbon Intensity Indicator
; controllable pitch propeller
; ship decarbonization
; maritime emissions
; IMO regulations
; operational optimization
; training vessels
; fuel efficiency
; CPP mode selection
; CII correction
1. Introduction
The International Maritime Organization (IMO) has been steadily tightening decarbonization rules for the shipping sector. Since 2023, the Energy Efficiency Existing Ship Index (EEXI) and the Carbon Intensity Indicator (CII) have quantified ships’ energy efficiency and carbon performance and assigned annual ratings (A–E), thereby requiring both technical and operational improvements in ship management. In subsequent MEPC discussions, mid- and long-term measures have been fleshed out, including fuel GHG-intensity management, expanded real-time monitoring and reporting, and assessment on a Well-to-Wake basis. In this environment, operators must go beyond generic fuel-saving measures and pursue data-driven operational optimization alongside compliance strategies[1].
Within this context, the efficient characteristics of controllable pitch propeller (CPP) operating modes are of particular significance. Prior studies have largely described the differences in fuel use and performance between Combinator (Combination) and Fixed (or Constant) modes, but few have quantitatively linked those differences to CII compliance under the interaction of monthly operating data and the regulatory formula. The training vessel considered in this study features short sailing distances and a high share of port stays, which create a structural disadvantage in CII (annual CO₂ divided by transport work): the denominator shrinks while the relative influence of auxiliaries (generators/boilers) remains large, artificially inflating CII regardless of propulsion efficiency. This can lead to regulatory penalties that are operational rather than technical in nature, calling for corrections to the metric together with a redesign of operating strategies.
On the definition of transport work. The IMO’s baseline transport-work definition for most ships is cgDIST = GT × distance. For cruise ships, an alternative cbDIST is defined using available lower berths (ALB) × distance[2]. For the training vessel (GT ≈ 9,196; ALB ≤ 250), replacing GT with ALB would shrink the denominator by an order of magnitude and thus inflate the computed CII; moreover, hotel/leisure loads on a training ship are much smaller than on cruise ships, so cbDIST is not representative for this use-case. Accordingly, in this paper we retain cgDIST as the baseline transport-work definition while adopting cruise-segment coefficients/required lines only for comparability of ratings in the absence of training-vessel-specific factors.
This study addresses three questions. (i) How do speed–load relationships differ by CPP mode, and where does the crossover point (in speed and load) appear in real data? (ii) How can CII distortions arising from short, intermittent voyages be mitigated—via a hybrid denominator (equivalent-distance) correction or a Braidotti functional correction[3]—and what are the limits of each? (iii) Based on these findings, to what extent can a speed-band mode-selection strategy improve annual CII relative to the required line?
To this end, we take a training vessel as a case study and use 2024 ABLOG monthly records (fuel, time, distance). The vessel is not directly subject to MARPOL CII and carries no cargo (up to 250 trainees); therefore, for official CII calculation we adopt cruise-segment coefficients/formulae. In our data-driven modeling, we (1) estimate mode-specific speed–load maps via regression; (2) set SFOC(load) from engine specifications/reference curves and compute speed-wise fuel and CO₂ (ton/nm); and (3) define a hybrid CII by converting port-stay CO₂ into an equivalent distance that is added to the denominator. For comparison, we also apply the Braidotti correction to diagnose distortions in the monthly distribution of ts (time-at-sea fraction) versus CII.
The main findings are as follows. First, in monthly assessments the official CII surges as ts decreases and produces outliers in months with little or no sailing. The hybrid correction stabilizes values even at low ts, while Braidotti is effective on average but exhibits over-correction when ts is very small. Second, regression on observed data reveals a crossover near 12 kn (≈50% load), yielding the operational rule low speed = Combinator, medium/high speed = Fixed; applying speed-band switching yields a modest additional improvement over all-Fixed operation. Third, the optimized mode combined with the hybrid correction (Opt-hybrid) remains below the required line and achieves a B rating.
The contributions of this study are threefold: (1) we compare CPP mode-specific speed–load characteristics and identify the crossover; (2) we propose a CII-optimized operating strategy based on that crossover; and (3) we empirically demonstrate CII distortion for short-distance vessels and discuss remedies. Collectively, the study offers a new analytical framework that links CPP operating strategy to CII compliance and provides a basis for improving the fairness and effectiveness of future IMO regulations.
2. Literature Study
2.1. Escalation of IMO Decarbonization Rules and the EEXI/CII Regime
The IMO’s Initial Strategy on the reduction of GHG emissions from ships (adopted in 2018) laid the foundation for a comprehensive regulatory framework. From 1 January 2023, the EEXI (a one-off, design-based index for existing ships ≥400 GT) and the CII (an annual, operational carbon-intensity rating for ships ≥5,000 GT) entered into force, operationalizing short-term measures toward the 2030 ambition of at least a 40% reduction in carbon intensity versus 2008. The Strategy was revised in 2023 to strengthen ambition and set the workplan toward mid-term measures[4].
EEXI is a design-phase compliance check (one-time approval during a ship’s life), whereas CII is an annual operational metric assigning A–E ratings[5].
At MEPC 83 (April 2025), IMO approved a package of mid-term measures, combining a fuel GHG-intensity standard and a global pricing mechanism; formal adoption is scheduled for an extraordinary session in Autumn 2025, with entry into force in 2027. In parallel, MEPC 83 completed Phase 1 of the review of short-term measures and set CII reduction (Z) factors for 2027–2030 at 13.625%, 16.250%, 18.875%, 21.500% (relative to 2019), tightening the required CII line beyond the earlier annual 2% trajectory[1].
Furthermore, the adoption of guidelines for measuring methane (CH₄) and nitrous oxide (N₂O) emissions and the establishment of a Well-to-Wake life-cycle assessment framework for fuels have been discussed, indicating that the regulatory scope is expanding beyond CO₂ alone toward a comprehensive GHG management regime. [6].
2.2. Efficiency Characteristics and Operating-Mode Studies of CPP
Previous work demonstrated that Combination is superior at low load/speed and Fixed at higher regimes, with a crossover near 0.525 load[7]. This study extends that finding to the CII context, quantifying the annual effect of mode selection.
A controllable pitch propeller (CPP) adjusts blade pitch to match varying operating conditions, offering improved propulsive efficiency and manoeuvrability over fixed-pitch propellers. Geertsma, R.D. has shown that pitch/speed co-ordination and adaptive pitch control can reduce fuel consumption and emissions while preventing engine overload, with reported savings in the 5–15% range under representative transit conditions[8]. A recent case analysis on Yangtze River vessels reports ≈5% fuel-consumption reduction from CPP operation optimization against conventional control, after calibrating the ship-performance model with experimental tests—consistent with the practical gains assumed in our scenarios[9].
Kim and Wang (2022) comparatively analyzed a CPP-propelled vessel equipped with a medium-speed diesel engine under Constant versus Combined operating modes. Kim and Wang reported that near high-load (~3,000 kW) the two modes exhibit broadly similar performance, whereas at medium and lower loads the Combined mode delivers superior brake-specific fuel consumption and CO₂ emission rates. At a low-load point of 1,250 kW, Kim and Wang found that the Combined mode increased distance per unit fuel from 42–45 m/kg to ~70 m/kg, corresponding to a ≈39.4% reduction in CO₂ per ton-mile. Kim and Wang concluded that for vessels with frequent low-speed operations—e.g., survey/research ships and trawlers—adopting the Combined mode is effective for reducing fuel use and emissions[10].
Moon, Je, and Hwang (2024) experimentally investigated a two-stroke diesel with a controllable-pitch propeller under sailing conditions and showed that CPP mode selection materially affects both engine performance and exhaust emissions, with lower specific fuel consumption and reduced CO₂ when operated in the appropriate (combinator) regime.[11].
Across multiple investigations, mode-specific speed–load curves intersect at a crossover where the relative efficiency of Combinator and Fixed modes reverses. Empirically, this occurs around mid-load (≈50%) for many single-screw CPP applications, implying a low-speed advantage for Combinator and a medium/high-speed advantage for Fixed. This crossover provides a principled basis for band-based mode selection in operations and is central to the present study’s optimization scenarios[12].
Gao et al. (2023) introduced the concept of an optimal combinator surface for CPP systems, proposing an efficiency-optimization methodology that maps propeller RPM and pitch set-points as a function of the required thrust. This demonstrates the feasibility of a system that can dynamically track the optimal operating point in real time in response to changing operating conditions. [13].
2.3. Structural Issues in the CII Metric and Disadvantages for Short Voyages
The CII scheme calculated as annual CO₂ emissions divided by transport work has several noted limitations. According to a study by the International Chamber of Shipping (ICS), the current CII metric reflects trade patterns more strongly than a vessel’s actual transport efficiency. In particular, because fuel consumption while the ship is not underway (e.g., port stays/berthing and cargo-handling operations) is included in the calculation, external factors outside the operator’s control are disproportionately represented.[14]. Braidotti et al. (2023) explicitly demonstrate that, for cruise ships, CII may be inconsistent with actual emissions trends due to large hotel loads and extended port times—motivating the functional correction we benchmark in this paper[3].
The reasons short-sea shipping vessels are structurally disadvantaged under the CII regime are threefold. First, short sailing distances increase the share of port-stay time, so CO₂ from generator and boiler operation raises the CII numerator without any increase in distance, inflating the index. Second, if port-waiting time rises by 40%, the CII can increase by about 5 gCO₂/DWT-mile, potentially causing a two-grade downgrade, indicating that port-operations efficiency critically affects CII. Third, for special-purpose vessels such as training ships, operation of educational/training auxiliaries—although unrelated to transport work—is included in the CII calculation, introducing further distortion.
Proposed remedies in the literature include (i) extending accounting boundaries toward Well-to-Wake for fuel GHG intensities[15]; (ii) separating sea-passage from port operations in CII assessment (e.g., “pilot-to-pilot” concepts for sea-only benchmarking)[16]; and (iii) correction models that explicitly account for time at sea (ts) and hotel loads[3]. In this study, we operationalize a pragmatic hybrid denominator using an equivalent-distance construct for port-stay CO₂, and we benchmark it against a functional (Braidotti-type) correction fitted on monthly ts –CII data.
3. Methods
The methodology of this study consists of two main stages:
(1) data collection and baseline CII computation, and
(2) CII correction and CPP simulation.
Figure 1 schematizes the procedural flow: data collection → baseline CII calculation → problem identification → application of correction models (Sea/Port hybrid and functional/Braidotti) → CPP mode simulation → results and recommendations.
3.1. Data Collection and Baseline CII Computation
This study draws on two sources: the annual operating log (ABLOG) of the training ship and dedicated CPP operating data. Key variables include sailing distance, operating hours, and fuel consumption for the main engine, generators, and boiler, all consolidated in ABLOG files. In addition, we directly measured the mode-specific relationships among speed, power, and indicated horsepower (IHP) for Combinator and Fixed CPP modes and merged these measurements into the dataset.

Table 1.
Principal particulars of the case-study vessel.
| Item | Particular |
| Ship name | HANNARA |
| Ship type | Training / education |
| Gross tonnage | 9196 GT |
| Deadweight tonnage | 3671 DWT |
| Length overall (LOA) | 113 m |
| Fuel | MGO |
| Main Engine | Hyundai-MAN B&W 6S40ME-B9.5-LP SCR |
| Speed(MCR) | 146 rpm |
| Maximum continuous rating | 6618 kW (MCR) |
| Propeller | Controllable Pitch Propeller |
The training vessel examined in this study is not subject to MARPOL convention and is, in principle, outside the scope of mandatory CII calculation. Moreover, no dedicated CII formula or coefficients have been proposed for training vessels. Accordingly, considering that the ship carries no cargo and accommodates approximately 250 trainees, we adopt the official coefficients and derivation method proposed for the most analogous segment—cruise ships.
To determine the allowable CII, a vessel-specific reference value must first be established; this reference value is given by Equation (1)
Here, ‘a’ and ‘c’ are coefficients derived from the 2019 IMO DCS data based on each vessel’s capacity and its CII attainment value; for cruise passenger ships, a=930 and c=0.383. By applying the reduction rate ‘Z’ to the vessel’s reference value, the allowable CII is then calculated as shown in Equation (2).
Here, ‘Z’ is the year-by-year CII reduction factor relative to the 2019 reference value, and the reduction factors for 2023–2030 are shown in Table 2 [17].
The attained CII is calculated from annual fuel-consumption data, as shown in Equation (3).
Here, denotes the annual fuel consumption by fuel type j, and is the fuel-specific conversion factor used to convert fuel consumption into emissions. Capacity may be expressed as DWT or GT, and cruise ships use GT. Under IMO guidelines, annual emissions are obtained by multiplying fuel use by the fuel-specific factor (CF; e.g., HFO = 3.114, MDO/MGO = 3.206, LNG = 2.750) [2], and the sailing distance is based on cgDIST. The analysis was conducted using the 2024 attained values.
The issues identified in this process are as follows:
- When the time-at-sea fraction (ts) is low, the denominator shrinks, and the CII is overestimated.
- A high share of generator (G/E) and boiler fuel consumption inflates the CII.
- For short-voyage operations and training vessels, the resulting CII can be unrealistic.
3.2. CII Corrections and CPP Simulation
To address these issues, we apply two correction approaches and then run CPP-mode simulations.
3.2.1. Denominator correction (Sea/Port hybrid model)
CO₂ emitted during port stays is converted into an equivalent distance () and added to the denominator of the official CII. The relationships are:
: annual average speed at sea[kn], :annual sailed distance [nm], : time at sea (sailing hours), : CII component based on port-stay CO₂, : CII component based on at sea CO₂, : at-sea CO₂ emissions, : port-stay CO₂ emissions, gross tonnage used as the capacity term in cgDIST
we explicitly separate at-sea emissions from port-stay emissions and thereby mitigate bias in the official CII for short-voyage, high port-stay operations
3.2.1. Functional Correction (Braidotti Model)
We apply a time-at-sea–dependent correction to the official CII to counter inflation at low ts. The correction factor is
Here, the coefficients a, b, and e are estimated to derive a curve that best approximates the relationship between the sailing time ratio(ts) and the empirically computed CII. Specifically, to account for the tendency of CII to be increasingly overestimated as ts decreases, the optimal coefficients a, b, and e are determined via a nonlinear least-squares regression fitted to the empirical data distribution. In this way, the function f(ts) is designed to reproduce the distortion patterns observed in actual operational data. The revised CII, incorporating the final correction values, is then calculated as follows.
The dashed line in Figure 2 indicates no correction (f(ts)=1). The solid curve shows the fitted form f(ts)=a+b/ts, with parameters estimated by nonlinear least squares on (ts, CIIofficial). A guard band enforces f(ts) ≥ 1+e, and a gate disables the correction above a data-driven threshold ts_min. The curve reproduces the empirically observed pattern: a steep rise as ts → 0 (capturing inflation in months with little or no sailing), a monotone decrease with increasing ts, and an asymptote near a as ts → 1. Thus, Braidotti strongly adjusts low-ts months while leaving typical months nearly unchanged, which explains both its usefulness and its over-correction risk when ts is extremely small.
In this study, we contrast the functional correction proposed by Braidotti with a new denominator correction—the Sea/Port hybrid model—that we introduce. By comparing these two approaches, we evaluate their potential to alleviate the CII distortion that systematically affects short-voyage vessels.
Assuming a 2025 operating scenario, we model mode-specific speed–load relationships for CPP operation (Combinator and Fixed) using regression. On this basis, we compare the official CII with corrected CII values and, exploiting the crossover speed, propose an optimized operating strategy.
The objectives are threefold: (1) to compare official versus corrected CII—specifically Sea-only, Hybrid (denominator), and Revised (functional/Braidotti); (2) to derive CII-minimizing strategies via CPP mode selection; and (3) to underscore the need for institutional denominator corrections to mitigate the structural disadvantage faced by short-voyage training vessels.
4. Results
This section presents the key findings from our data analysis and simulations. The results are organized into three parts: (1) a comparison between the official CII and corrected values, (2) an analysis of the speed–load relationships by CPP operating mode, and (3) the identification of the crossover point and its operational implications.
4.1. ABLOG-Based Annual Operating Data
Table 3 summarizes the 2024 monthly records from ABLOG for the main engine, generator engines, and boiler including fuel consumption, operating hours, and sailing distance.
The generator engines accumulated 4,848 operating hours over the year—short of the 8,760 hours in a full year—because the vessel uses shore power during certain periods alongside port stays. By contrast, the boiler logged 8,112 hours (92.6% of the year), a markedly higher utilization than the generators. This is because the boiler is used not only for main engine warming but also for hotel services, space heating and cooking for trainees and instructors on board. The main engine operated for 1,548 hours (17.7% of the year), reflecting the fact that, as seen in the ABLOG data, there are many months with no sailing. Operations of the training ship follow the academic calendar, with voyages concentrated during semester periods and little to no sailing outside those windows. These patterns reflect the short-voyage, education-and-training nature of the vessel.
Generators account for more than half of total annual fuel consumption, attributable to their long operating hours and their role in supplying electrical power at sea and during port stays when shore power is unavailable. Main-engine fuel use is concentrated in the sailing semesters, and registers as zero in months without voyages. Taken together, these characteristics of operation and energy use help explain why the official CII can diverge from actual propulsive efficiency, and they constitute a primary source of bias in the metric for training ships.
4.1. Comparison Between Official and Corrected CII
Figure 3 plots, monthly, the relationship between the attained CII and the time-at-sea fraction ts computed from ABLOG records (fuel consumption, sailed distance, and time at sea/at port). For each month we show official CII from the IMO formula (blue circles), the Hybrid CII obtained by adding port-stay CO2 as an equivalent distance in the denominator (red triangles), and the Braidotti functional correction f(ts) applied to the official value (gray squares). While at the annual level the time-weighted aggregation tends to dampen monthly fluctuations and bias, the monthly view makes clear how shorter sailing (smaller ts) is associated with greater dispersion and upward bias in the official CII. The Hybrid correction visibly stabilizes low-ts months by reallocating port-stay emissions to the denominator, and the Braidotti curve tracks the empirical trend of inflation at small ts by construction.
The official CII rises sharply as the time-at-sea fraction ts decreases, producing unrealistically high values; in months with no or negligible sailing (ts≈0), the denominator collapses and outliers emerge (see inset). By contrast, the Hybrid correction—by converting port-stay CO2 to an equivalent distance—mitigates this denominator bias, yielding smoother and more stable CII values even at low ts. The Braidotti correction generally lowers the inflated official CII; however, when ts is extremely small, the factor f(ts) becomes very large and over-correction occurs, leading in several low-ts months to CII values that fall unrealistically below the 2024 required line and associated rating thresholds.
In sum, for monthly/short-term assessments, the official formula alone is highly distorted, and the Braidotti approach carries a risk of over-correction at very low ts. The Hybrid method provides more realistic and consistent results across the low-ts range; thus, we recommend using Hybrid as the default for short-voyage/short-cycle data, while applying Braidotti only above a data-driven threshold (e.g., ts≥tsmin) and primarily for cruise-like operations.
4.2. Operating Profile: Speed–Time Distribution
Figure 4 aggregates the log by 0.5-kn speed bins and plots operating hours versus speed. The vertical dashed line marks 12 kn; speeds < 12 kn are shaded blue, and ≥ 12 kn orange. The distribution exhibits a clear two-regime structure around 12 kn: most hours are concentrated in the 12–17 kn band, with a pronounced peak at 12–14 kn. By contrast, dwell time in 10–12 kn is limited, and operations in 2–9 kn occur only intermittently, associated with berthing/unberthing and low-speed training activities.
Figure 5 and Figure 6 compare the speed–load relationships of the two CPP operating modes (Combinator and Fixed). To reduce noise, we first aggregated the raw scatter into bin means by speed (or load) intervals and then fitted cubic polynomials for each mode.
In Figure 5, the two curves intersect near L≈0.5L and V≈12 kn. Below this point, the Combination mode requires less load to achieve the same speed and is therefore advantageous; above it, the Fixed mode becomes comparable or slightly superior.
Figure 6 yields the same qualitative pattern. The high coefficients of determination (R2≈0.99) indicate that the mode-specific regressions explain the observations well.
This crossover provides an operational basis for band-based mode selection: use Combination in low-speed bands and Fixed in medium/high-speed bands.
4.3. SFOC Curve and Fuel-Consumption Model
To quantitatively link ship speed to fuel consumption, we couple the load-ratio SFOC curve with the main-engine specifications. The training ship is fitted with a HYUNDAI–MAN B&W 6S40ME-B9.5-LP SCR two-stroke engine (rated 6,618 kW @ 146 rpm). Using the engine manual’s reference value at 100% load, we set SFOCbaseline=173.4 g/kWh (Tier II, conventional turbocharger). The variation of SFOC with engine load is approximated following[18,19] as Equation (11):
where load is the relative engine load, and SFOCload is the specific fuel-oil consumption at that load [g/kWh].
Equation (11) reproduces the characteristic shallow U-shape, with a minimum in the NCR load≈0.7 − 0.9 range, consistent with typical two-stroke SFOC behavior. Figure 7 visualizes this curve and serves as the basis for computing speed-wise fuel flow and, subsequently, CO2 per nautical mile in the following analyses.
where, CF: fuel-specific CO2 emission factor [tCO2/t fuel], SFOCload: load-dependent specific fuel oil consumption [g/kWh], Lm(v): speed–load function in operating mode m(dimensionless load ratio), Pm(v): Engine power in operating mode m[kW](Pm(v)=Lm(v)×MCR), v: ship speed [kn].
At low speeds, the Combination mode achieves the same speed with lower required engine power and fuel use, yielding lower CO₂ per nautical mile. Near 12 kn the two curves touch (the crossover), and above ~12 kn the advantage shifts to Fixed mode. The dashed bars on the right axis (“Operating hours”) reflect the speed–time profile, showing that most operating time lies in the 12–16 kn band. In practice, this distribution supports a strategy of using Fixed as the default for 12–16 kn passages, switching to Combinator only in segments where low-speed dwelling is unavoidable due to route, weather, or training needs. The optimized schedule (Combination at low speed, Fixed at high speed) delivers a modest yet consistent improvement in annual CII relative to single-mode operation across the whole range.
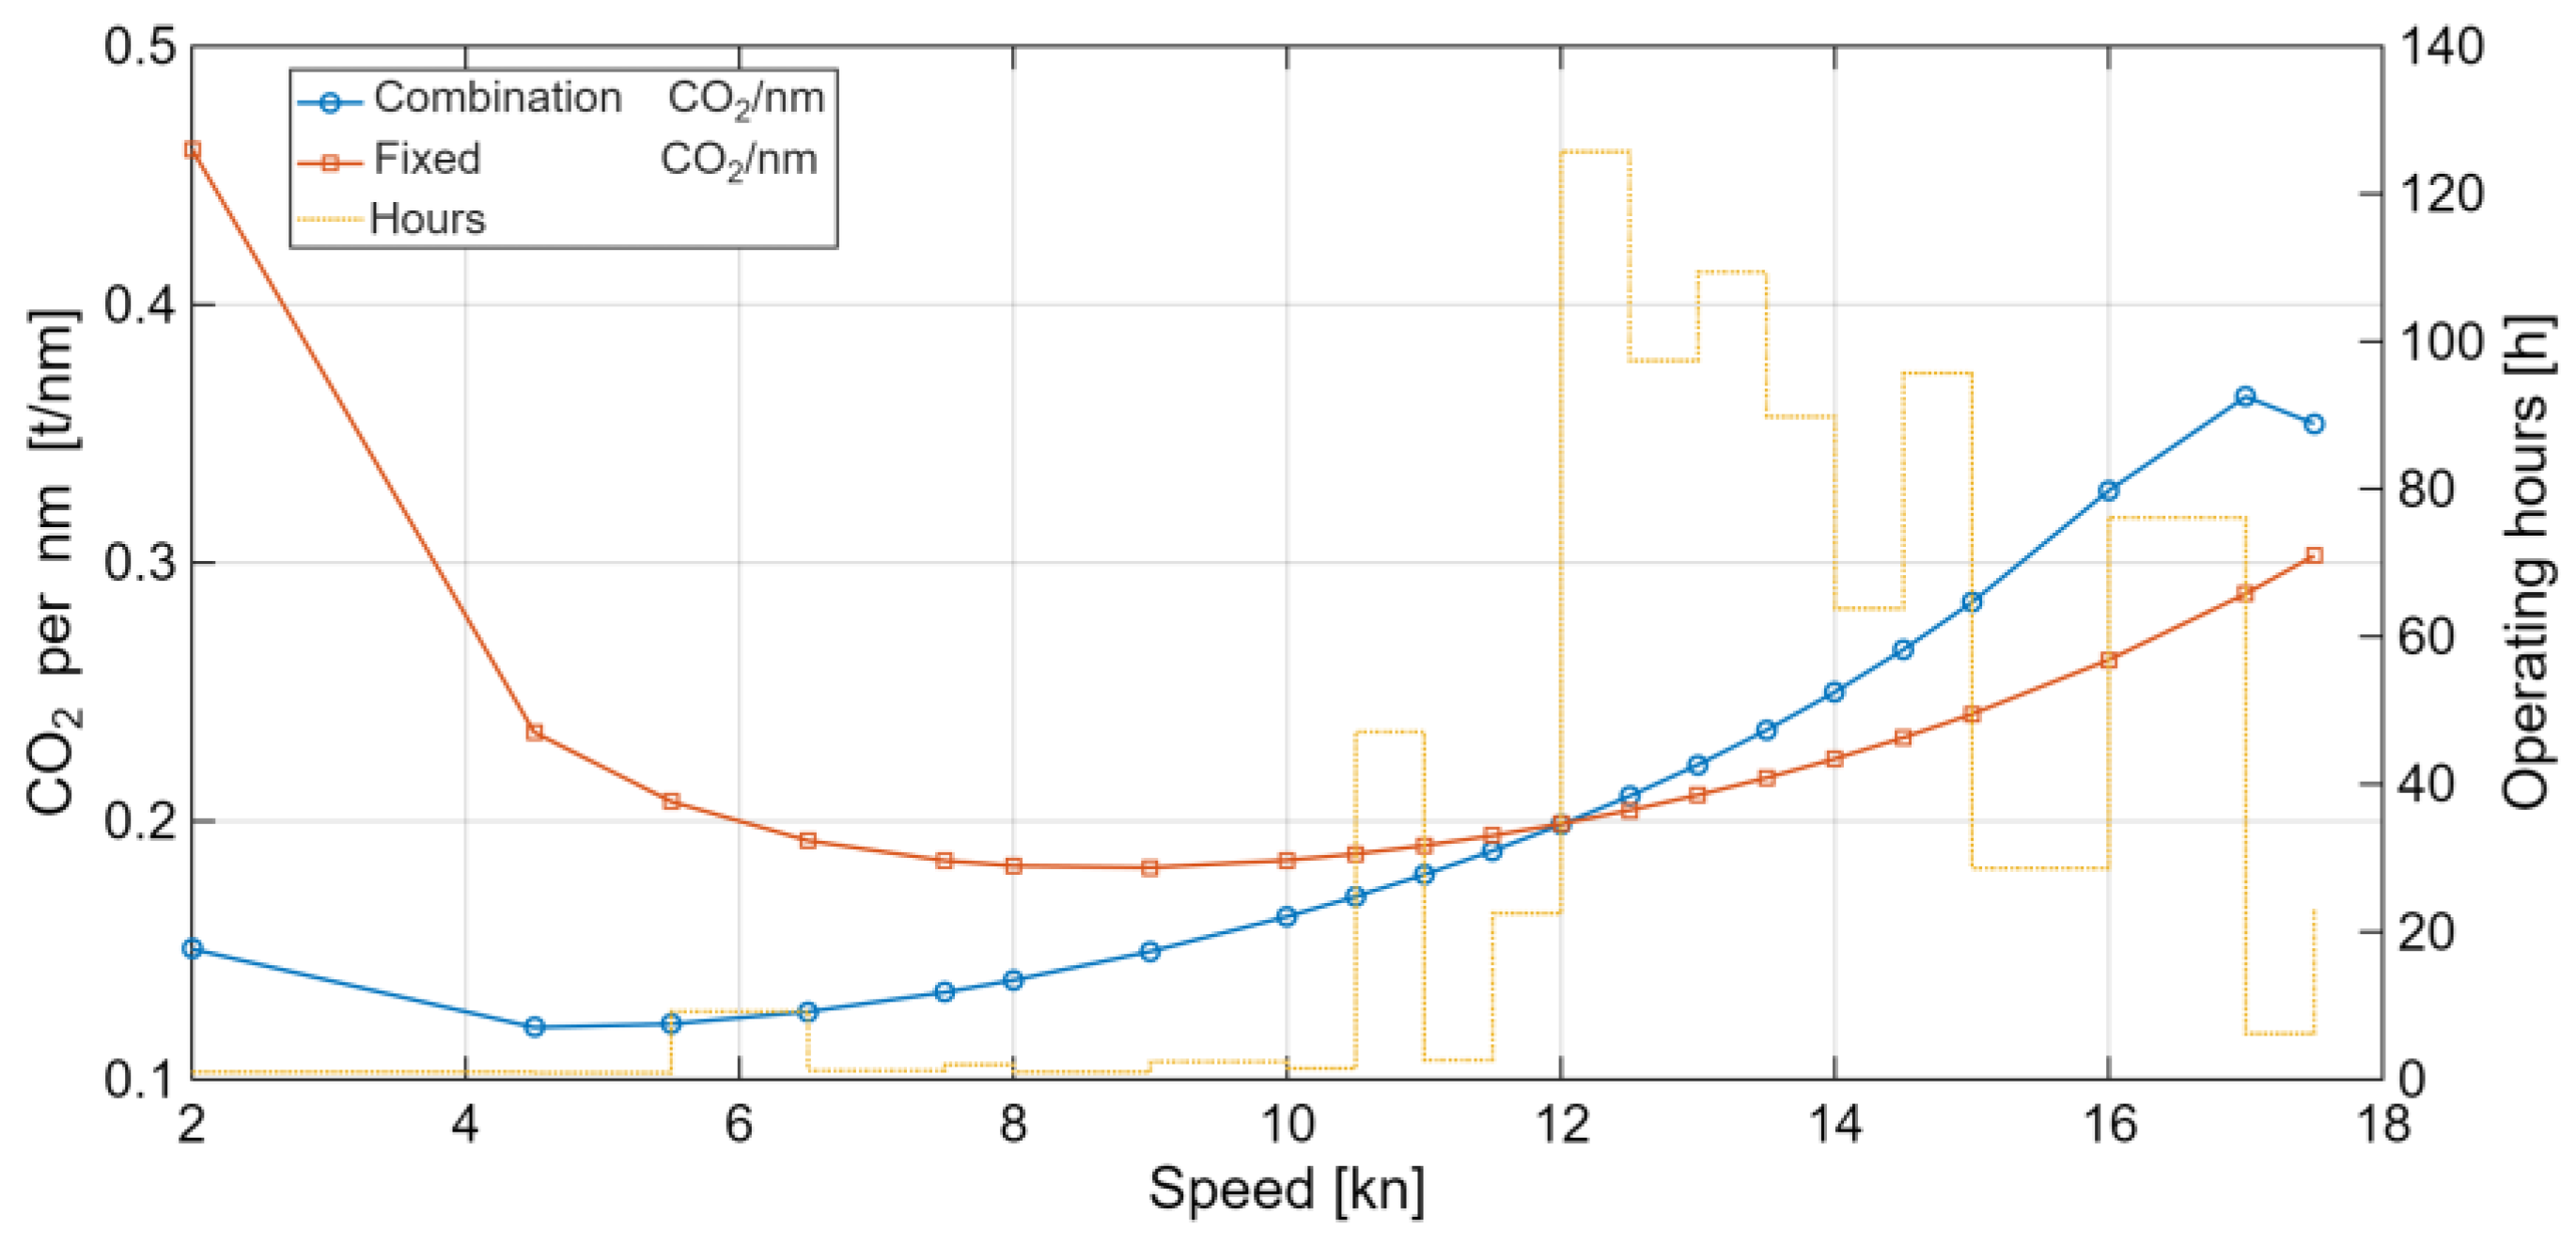
Figure 8.
CO₂ per nautical mile vs. speed by CPP mode (Combinator vs. Fixed).
4.4. Corrected CII Comparison (2024 Attained vs. 2025 Scenarios)
Figure 9 juxtaposes the 2024 attained values with 2025 scenario results to summarize how the choice of correction method and CPP operating mode affects CII. Figure 10 unpacks the same results step-by-step, clarifying the contribution of each adjustment. We start from the official 2024 CII (cgDIST, GT basis), which is inflated relative to the required line because of short voyages and substantial port-stay shares. Applying the sea-only variant (counting at-sea fuel only) partly reduces this bias. Adding the Braidotti functional correction yields a further overall decrease; however, when the time-at-sea fraction ts is very small, the correction factor f(ts) grows large and can over-correct, producing values unrealistically below the 2024 required line and rating thresholds. In contrast, the equivalent-distance denominator adjustment coheres with the operating reality of long port stays; combined with sea-only (Hybrid), it shrinks monthly dispersion and brings the annual value back toward a realistic vicinity of the required line.
For 2025, we recompute main-engine fuel using the 2024 speed–time profile and three CPP strategies: all-Combinator, all-Fixed, and a speed-band Optimized schedule that selects the mode with the lower CO2/nm at each speed. The results are as follows. First, considering the engine alone, all-Fixed is consistently lower in CII than all-Combinator over the year. Second, the Optimized schedule (Combinator at low speeds <~12 kn, Fixed at ≥~12 kn) provides a modest but consistent additional reduction relative to all-Fixed. Third, when the equivalent-distance denominator is added (Comb-hybrid, Fixed-hybrid, Opt-hybrid), the values shift downward in a conservative and consistent way; notably, Opt-hybrid falls below the required line and meets the B-rating criterion.
Overall, the 2024 stepwise analysis shows that the Hybrid approach is the most reasonable remedy for the structural bias of the official formula under short-voyage, high-port-stay conditions. The 2025 simulations demonstrate that crossover-based mode selection yields tangible, if incremental, CII gains. While the Braidotti correction can be effective for longer-ts or cruise-like operations, it risks over-correction when ts is very small; hence, for practical application to short-voyage training ships, we recommend adopting Hybrid as the default and using Braidotti only above a data-driven ts threshold.
5. Discussion
This study quantitatively diagnosed the structural limitations of the official CII formula for a training ship with short-voyage, short-cycle operations, and proposed a practical response that combines a denominator (Hybrid) correction with a CPP mode strategy. In operating patterns with a large share of port stays, separating at-sea and in-port emissions and allocating the latter to an equivalent distance proved effective in alleviating overestimation; moreover, mode selection by speed band further reduced carbon intensity.
Key takeaways. In short-voyage / port-intensive operations, the official CII tends to be systematically high because port-stay fuel is divided by the same transport-work denominator. Converting port-stay emissions to equivalent distance (Dequiv) and using the Hybrid denominator reduced month-to-month dispersion and brought the annual value back toward the required line. CPP mode selection also mattered: combining the measured speed–load regressions with the SFOC model showed that Combination is advantageous at low speeds, while Fixed becomes preferable at medium/high speeds. An optimized schedule that switches modes by speed band delivered a modest additional improvement over all-Fixed operation. However, when ts is extremely small, the Braidotti functional correction can be overcorrect; it is therefore best used as a supplement above a threshold value of ts.
Limitations and uncertainties. The 2024 fuel use in this study was estimated by combining the SFOC curve with speed–load regressions; it may deviate from fuel measured by flowmeters or bunker records. Engine condition (hull fouling, maintenance, intake/exhaust), environmental forces (waves, wind, currents), variability in auxiliary loads, and assumptions on fuel properties and CF can introduce error in SFOC and load estimates. Consequently, the CII values and ratings shown in the figures should not be interpreted as exact absolutes; applying actual fuel data may yield higher CII. Monthly CII for months with little or no sailing is particularly sensitive to denominator shrinkage, so annual or semester-level aggregation is recommended for conservative interpretation.
Policy and operational implications. For ship types and business models with long port-stay shares, a sea/port split in the metric (e.g., the Hybrid / equivalent-distance approach) is needed. On the operations side, it is reasonable to define vessel-specific crossover rules around ~12 kn based on regression fits, planning Fixed as the default for route passages and Combination for low-speed dwelling segments driven by weather, traffic, or training. To raise the reliability of CII reporting, operators should adopt voyage-level analytics that integrate fuel flowmeters, shaft-power meters, AIS, and weather data.
Future work. We will cross-validate against actual fuel measurements to quantify bias in SFOC-based estimates, and bound the effect of variations in SFOC baseline, L-v coefficients, and CF by sensitivity analysis. The framework can be extended to online optimization that recommends real-time mode switching using sea-state/traffic forecasts. Finally, to avoid reliance on cruise-segment surrogates, we aim to propose training ship-specific factors/corrections, thereby improving generalizability and credibility.
6. Conclusions
Within the IMO decarbonization context, this case study on a short-voyage training ship quantitatively examined structural biases in CII calculation and presented a practical framework that combines a Hybrid (denominator) correction with CPP mode scheduling. Our goals were to (1) characterize the size and shape of the time-at-sea (ts) bias in monthly data, (2) compare the efficacy and limits of Hybrid versus Braidotti corrections, and (3) quantify the CII impact of a crossover-based CPP strategy.
The analysis confirmed that in monthly/short-term assessments the official CII rises sharply as ts decreases and can produce outliers when sailing is minimal. The Hybrid correction stabilized values even at low ts. The Braidotti correction reduced overestimation on average but posed an over-correction risk when ts approx 0, suggesting its use as a supplement above a threshold. CPP mode analysis revealed a crossover near 12 kn (≈50% load): Combination at low speed and Fixed at medium/high speed. Under 2025 scenarios using the 2024 operating profile, all-Fixed outperformed all-Combinator, while Optimized (Combination at low, Fixed at high speeds) yielded a further, modest reduction. Notably, Opt-hybrid (optimized + Hybrid denominator) fell below the required line and met the B-rating.
These results imply that for training ships—with high port-stay shares and academic-calendar operations—sea/port separation and speed-band mode selection are key levers for CII management. Despite the absence of a MARPOL CII and of training-ship-specific factors, the framework provides a coherent basis for decision-making by leveraging cruise-segment required lines only for comparability.
Finally, because 2024 fuel use was SFOC-based, the reported CII and ratings should be interpreted conservatively and may be higher with actual fuel data. Future work should include cross-checks with measured fuel, sensitivity studies on SFOC, L-v coefficients, and CF, real-time optimization with sea-state inputs, and training-ship-specific adjustment factors. In sum, the integrated Hybrid + CPP framework offers a practical roadmap for reducing bias and achieving rating compliance for short-voyage vessels, with low data requirements and high potential for extension to other ship types and operating models.
Author Contributions
Conceptualization, Jiwoong Lee; methodology, Jiwoong Lee and Vuong Quang Dao; software, Vuong Quang Dao and Jiwoong Lee; validation, Jiwoong Lee, Vuong Quang Dao and Jae-Ung Lee; formal analysis, Jiwoong Lee and Vuong Quang Dao; investigation, Jiwoong Lee; resources, Jae-Ung Lee; data curation, Jiwoong Lee and Vuong Quang Dao; writing—original draft preparation, Jiwoong Lee; writing—review and editing, Jae-Ung Lee, Vuong Quang Dao and Jiwoong Lee; visualization, Jiwoong Lee and Vuong Quang Dao; supervision, Jae-Ung Lee; project administration, Jae-Ung Lee; funding acquisition, Jae-Ung Lee. All authors have read and agreed to the published version of the manuscript.
Funding
This research is supported by the ‘Development of Autonomous Ship Technology(20200615)’ funded by the Ministry of Oceans and Fisheries(MOF, Korea); This research was supported by Korea Institute of Marine Science & Technology Promotion (KIMST) funded by the Ministry of Oceans and Fisheries (RS-2023-00256331).
Institutional Review Board Statement
Not applicable.
Informed Consent Statement
Not applicable.
Data Availability Statement
Not applicable.
Acknowledgments
During the preparation of this manuscript, the authors used ChatGPT to improve clarity and readability of the text. The authors have reviewed and edited all generated content and take full responsibility for the final version of the manuscript.
Conflicts of Interest
The authors declare no conflict of interest.
References
- IMO Report of the Marine Environment Protection Committee on Its Eighty-Third Session (MEPC 83/24); International Maritime Organization (IMO);
- IMO 2018 GUIDELINES ON THE METHOD OF CALCULATION OF THE ATTAINED ENERGY EFFICIENCY DESIGN INDEX (EEDI) FOR NEW SHIPS; International Maritime Organization (IMO);
- Braidotti, L.; Bertagna, S.; Rappoccio, R.; Utzeri, S.; Bucci, V.; Marinò, A. On the Inconsistency and Revision of Carbon Intensity Indicator for Cruise Ships. Transp. Res. Part Transp. Environ. 2023, 118, 103662. [CrossRef]
- International Maritime Organization EEXI and CII - Ship Carbon Intensity and Rating System.
- International Maritime Organization Improving the Energy Efficiency of Ships.
- ClassNK Preliminary Report of IMO MEPC 83; NIPPON KAIJI KYOKAI;
- Lee, J.; Dao, V.Q.; Jeong, E.-S.; Noh, J.-H.; Lee, J.-U. Efficiency Comparison and Optimal Voyage Strategy of CPP Combination and Fixed Modes Based on Ship Operational Data. Preprints 2025. [CrossRef]
- Geertsma, R.; Visser, K.; Negenborn, R. Adaptive Pitch Control for Ships with Diesel Mechanical and Hybrid Propulsion. Appl. Energy 2018, 228, 2490–2509. [CrossRef]
- Tian, W.; Lang, X.; Zhang, C.; Yan, S.; Li, B.; Zang, S. Optimization of Controllable-Pitch Propeller Operations for Yangtze River Sailing Ships. J Mar Sci Eng 2024, 12, 1579. [CrossRef]
- Sang-Am Kim; Woo-Gyeong Wang A Study of Engine Performance and Exhaust Emission Characteristics of CPP Propulsion Ship with Operating Mode. J. Power Syst. Eng. 2022, 26, 91–100.
- Moon, J.-S.; Je, M.-A.; Hwang, S.-C. A Study on Performance and Exhaust Emission Characteristics According to the Controllable Pitch Propeller Operation of Two-Stroke Diesel Engine in Sailing Condition. J. Adv. Mar. Eng. Technol. 2024, 48, 384–391. [CrossRef]
- Marcelo Borba Understanding Load Calculation in Thrusters: Fixed Pitch (FPT) and Controllable Pitch Propellers (CPP) - Part 2. LinkedIn.
- Gao, F.; Bloch, F.; Brodtkorb, A.H. Novel Combinator Surface Concept for Efficiency Optimization of Ship Propulsion System. Ocean Eng. 2023, 280, 114489. [CrossRef]
- International Chamber of Shipping ENERGY EFFICIENCY OF SHIPS - Key Drivers of the CII Rating System; International Maritime Organization (IMO), 2025;
- Dagmar Nelissen, Anne Kleijn, Denise Hilster CII and EU Maritime Decarbonisation; CE Delft, 2023;
- Stolt-Nielsen Limited The Carbon Battle: Is CII out of Scope with the Real World?; 2024;
- Kim, H. IMO News Flash MEPC 83. Conv. Legis. Serv. Team.
- Lee, J.-U.; Lee, W.-J.; Jeong, E.-S.; Noh, J.-H.; Kim, J.-S.; Lee, J.-W. Algorithm for Monitoring Emissions Based on Actual Speed of Ships Participating in the Korean Vessel Speed Reduction Program. Energies 2022, 15, 9555. [CrossRef]
- International Maritime Organization Fourth IMO Greenhouse Gas Study (2020); London: International Maritime Organization;
Figure 1.
Methodological framework for CII correction and CPP mode optimization.
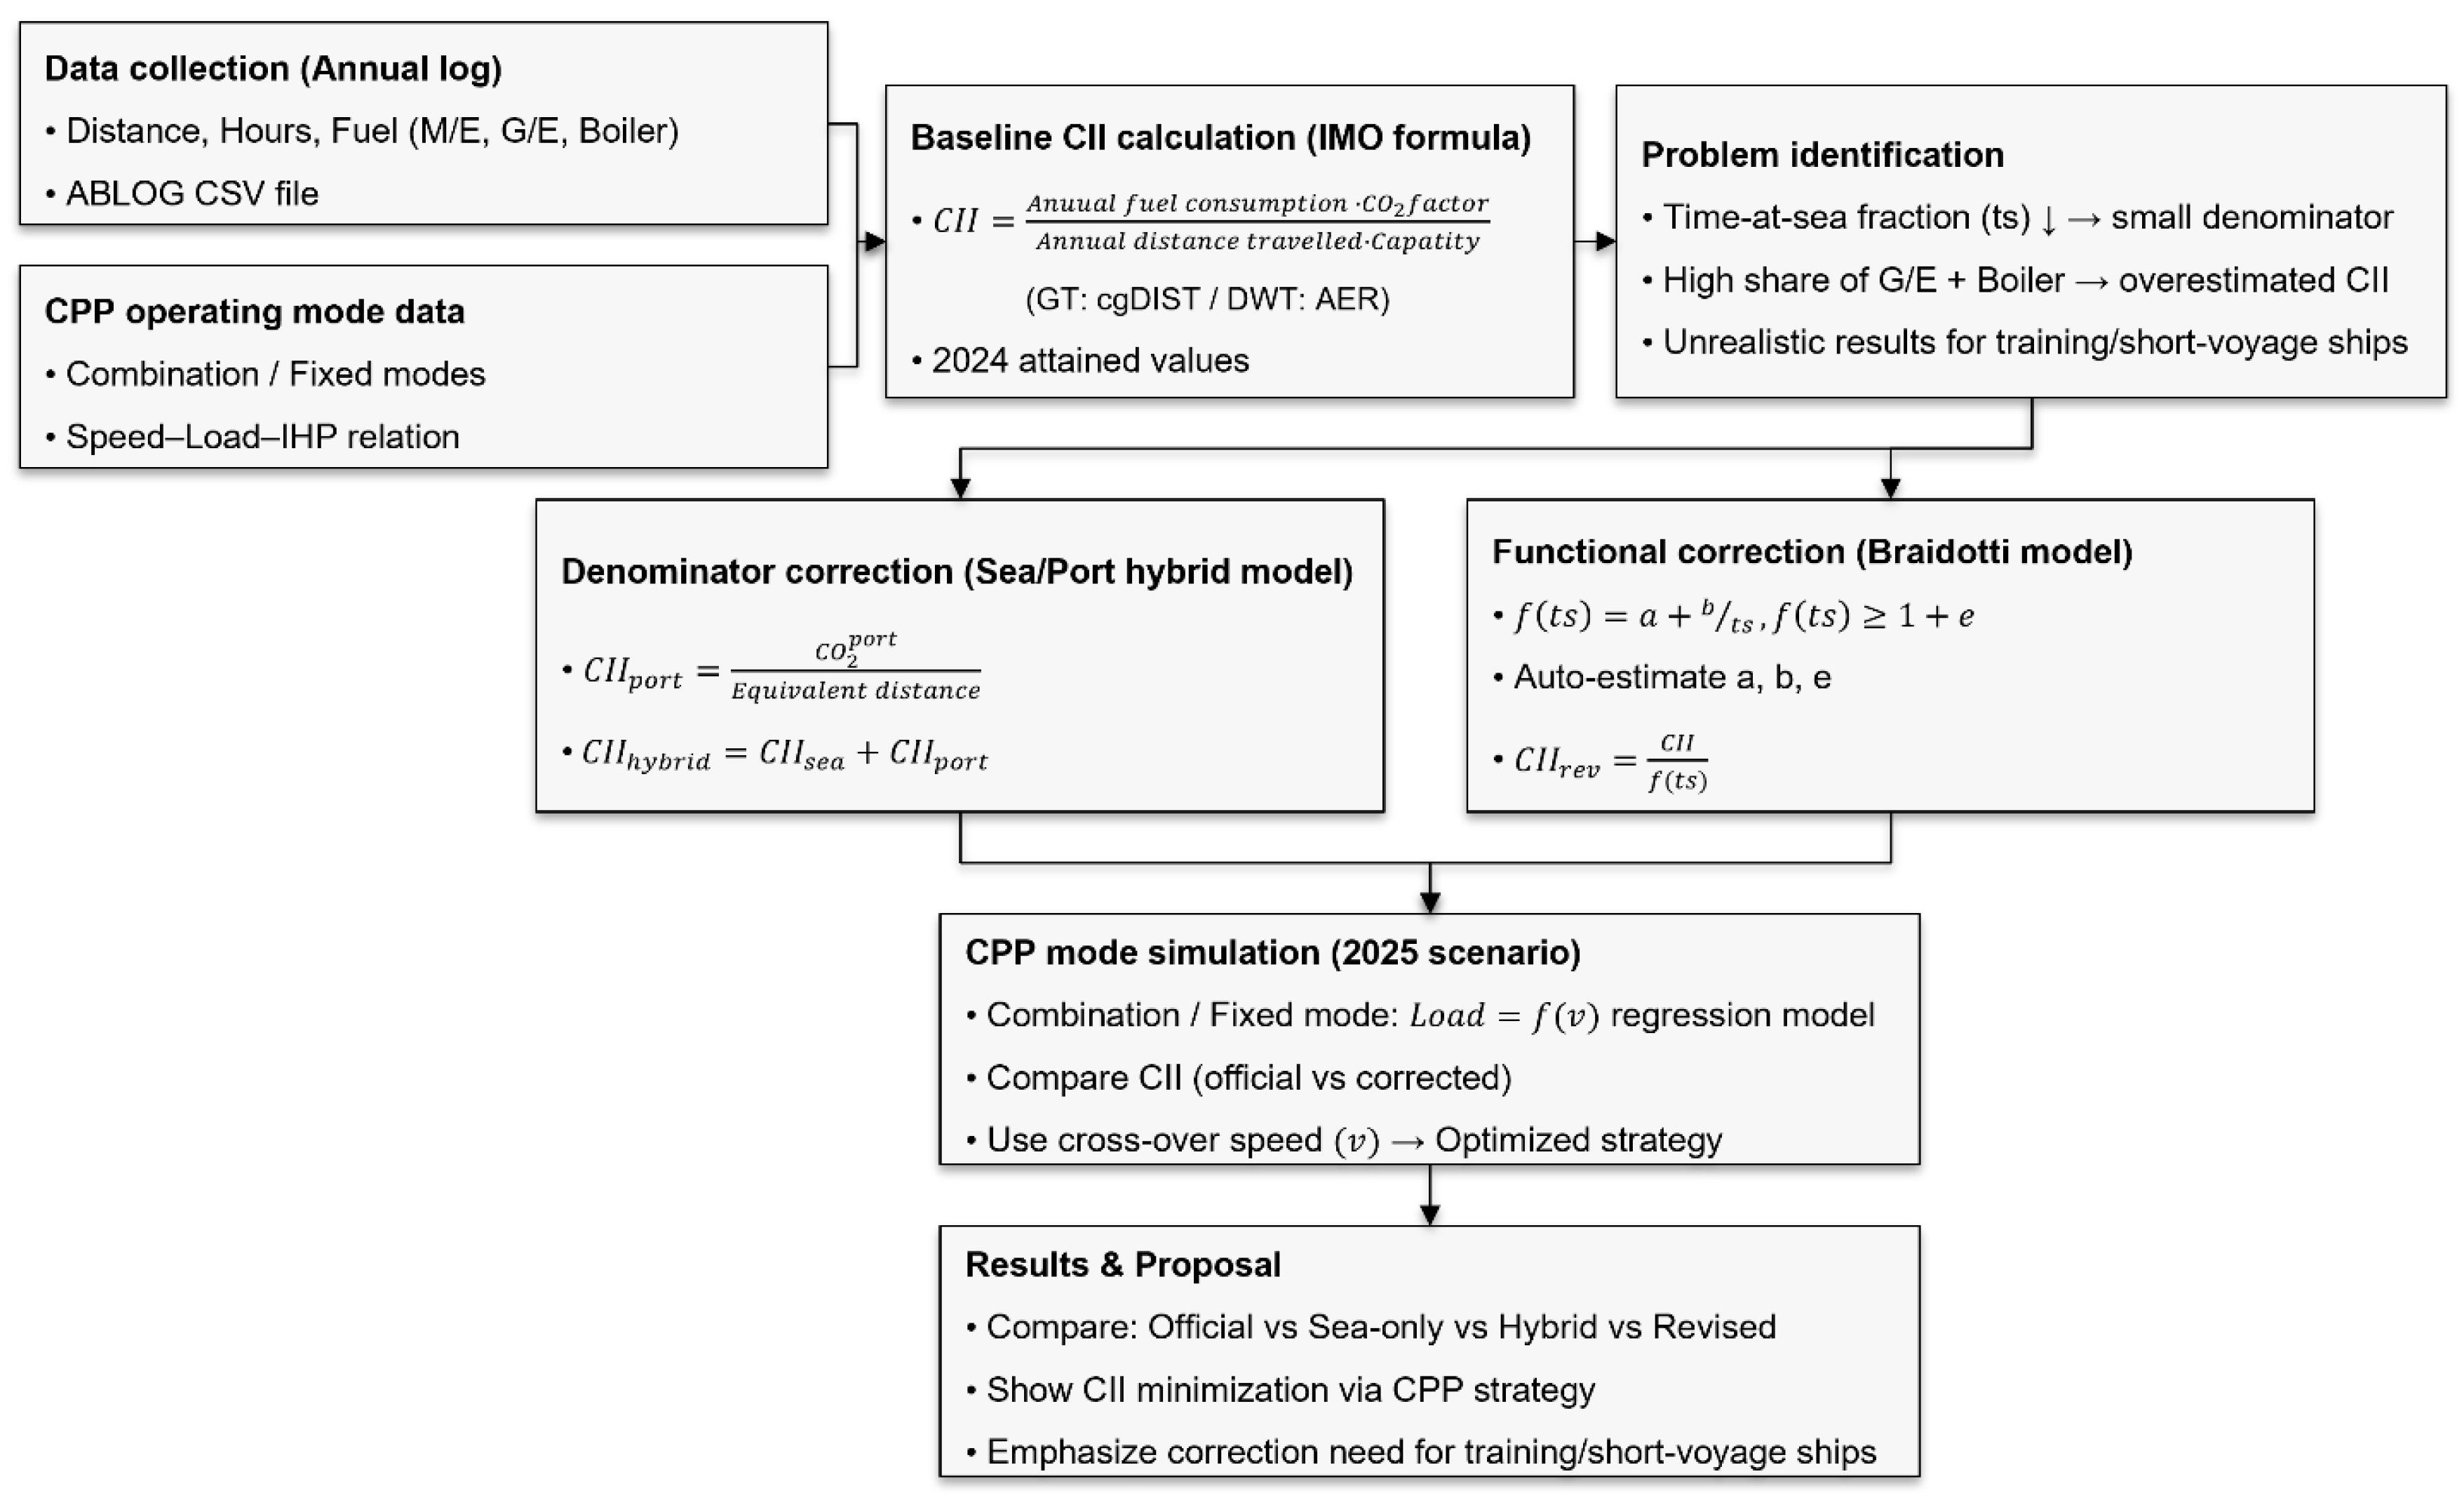
Figure 1.
Fitted functional correction f(ts).
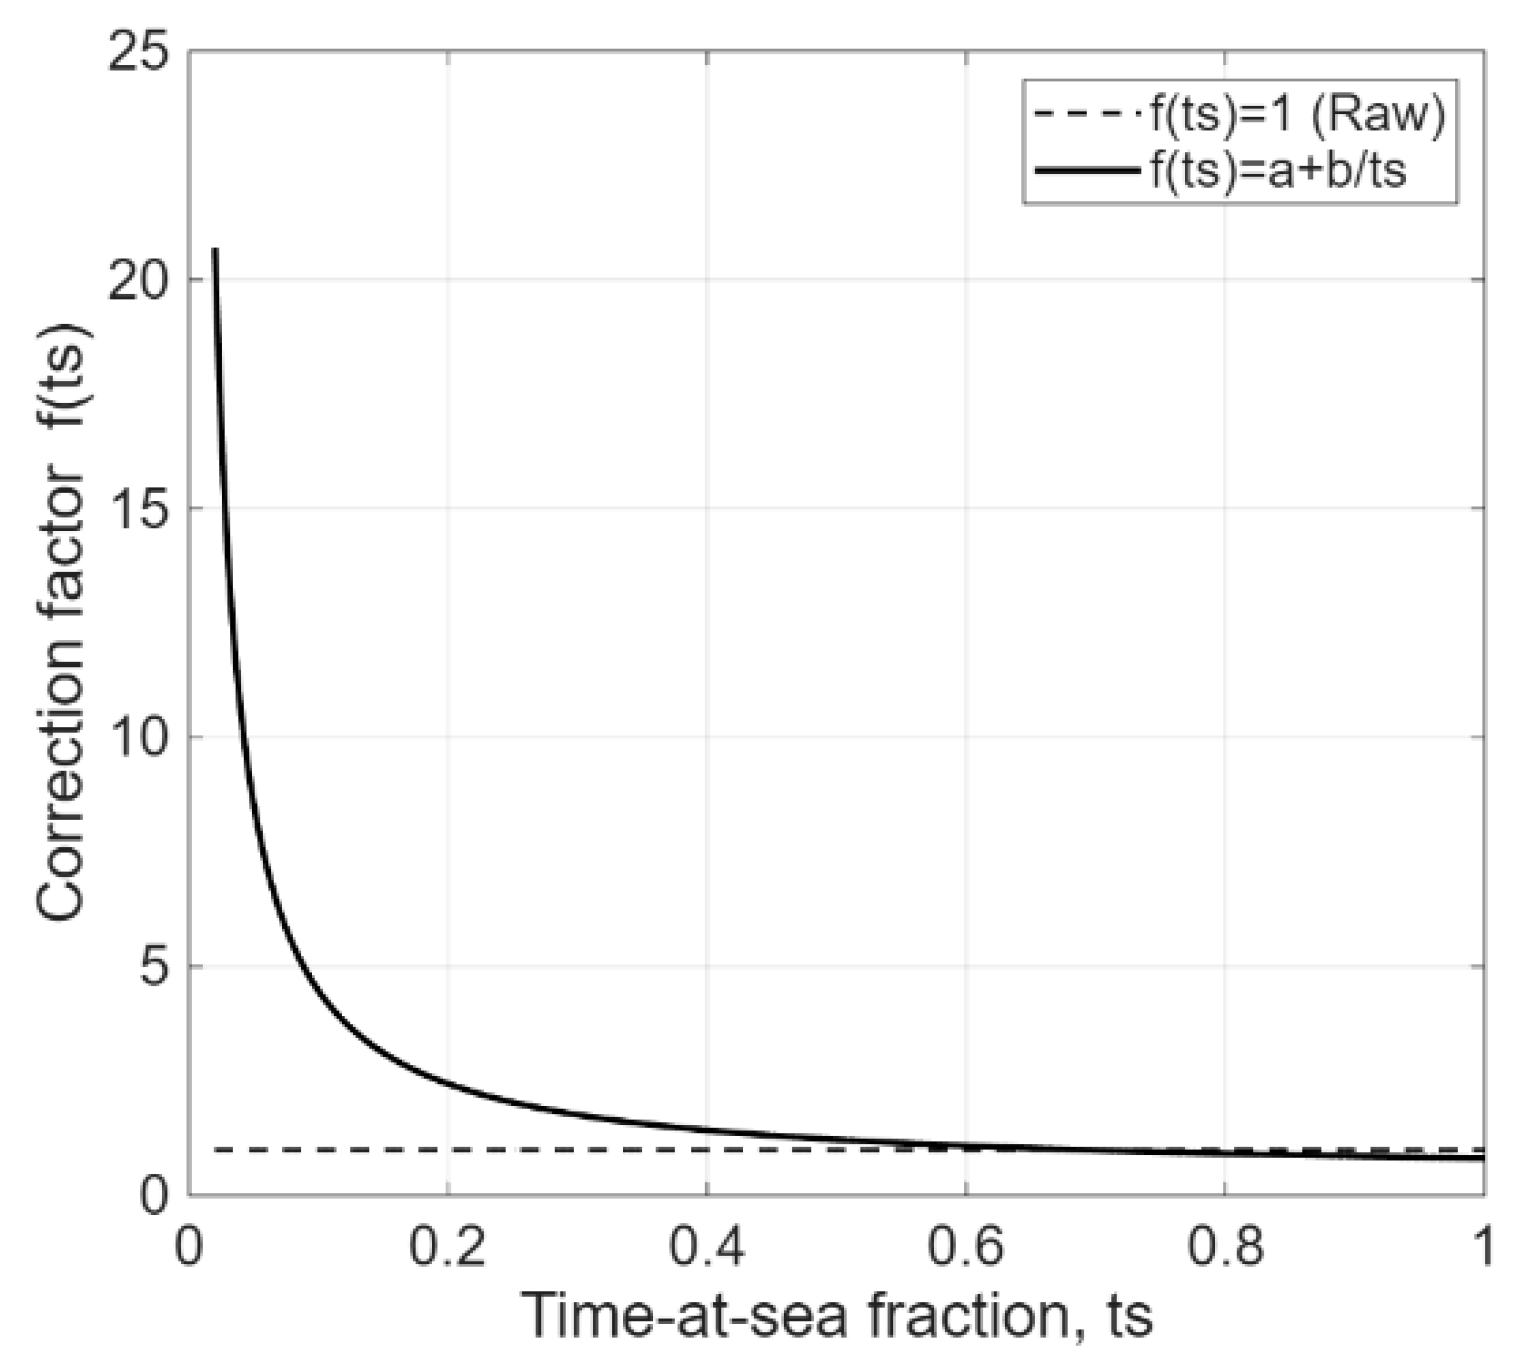
Figure 3.
Monthly attained CII vs time-at-sea fraction.
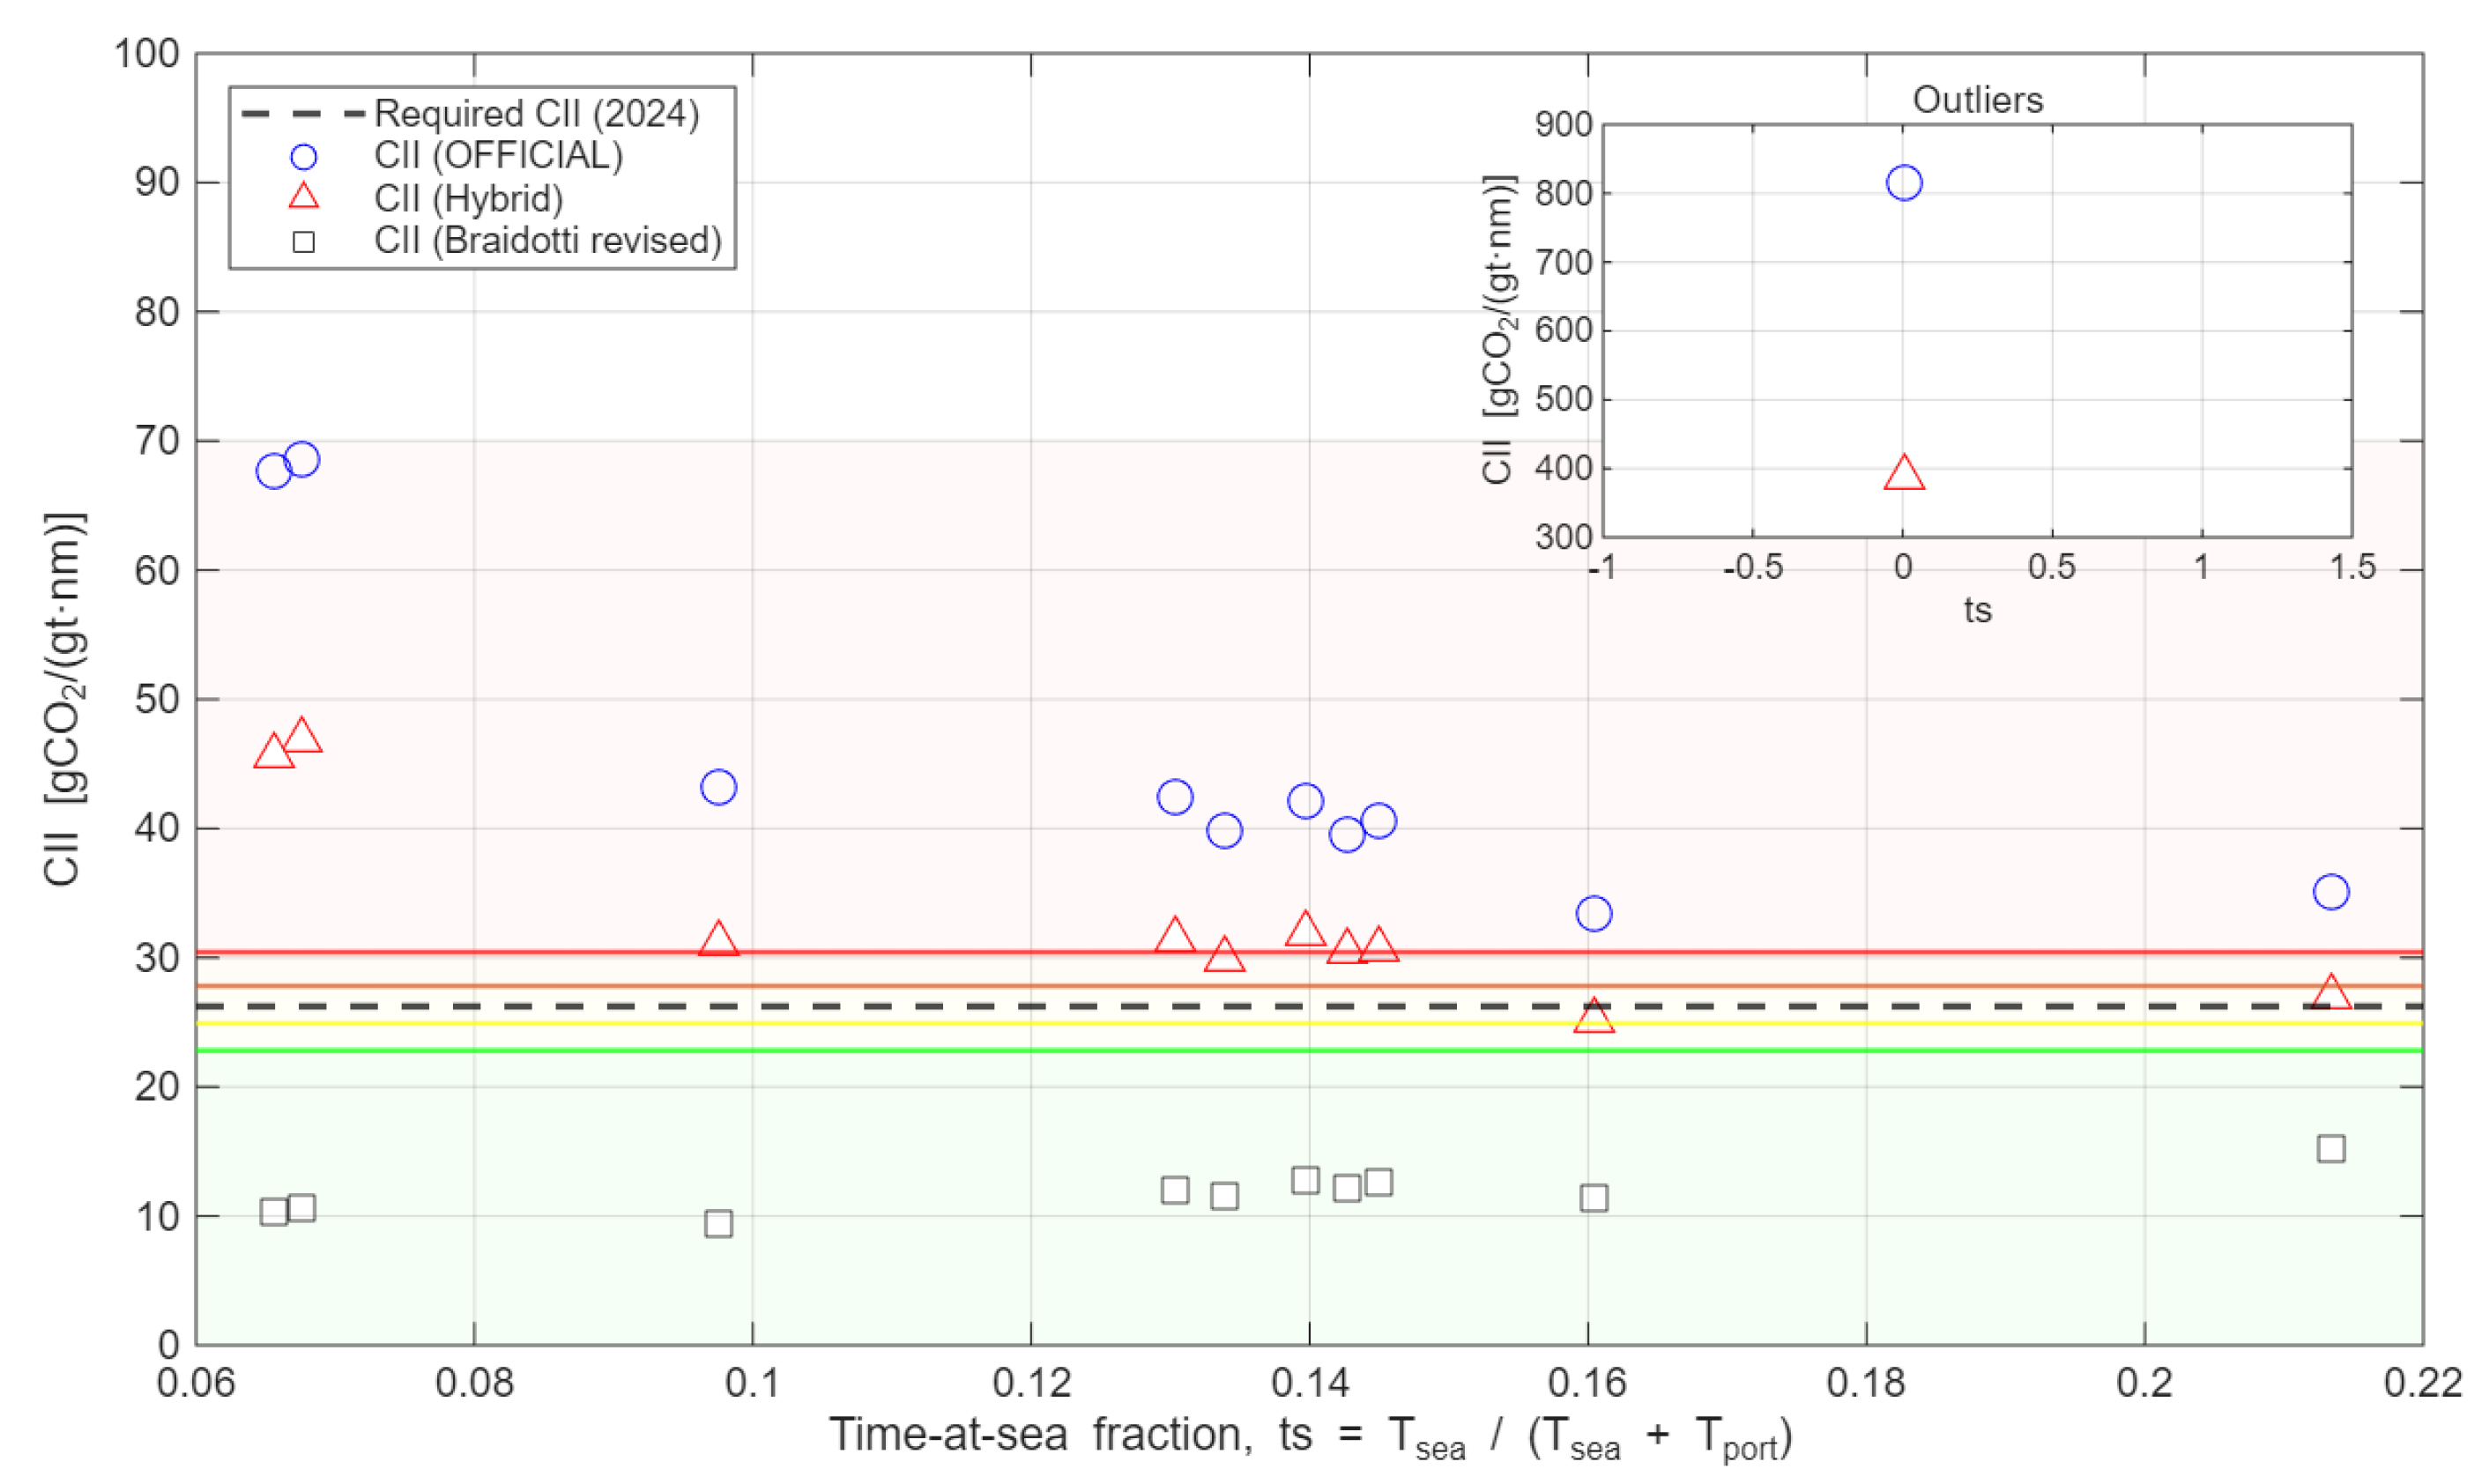
Figure 4.
Annual operating hours by speed.
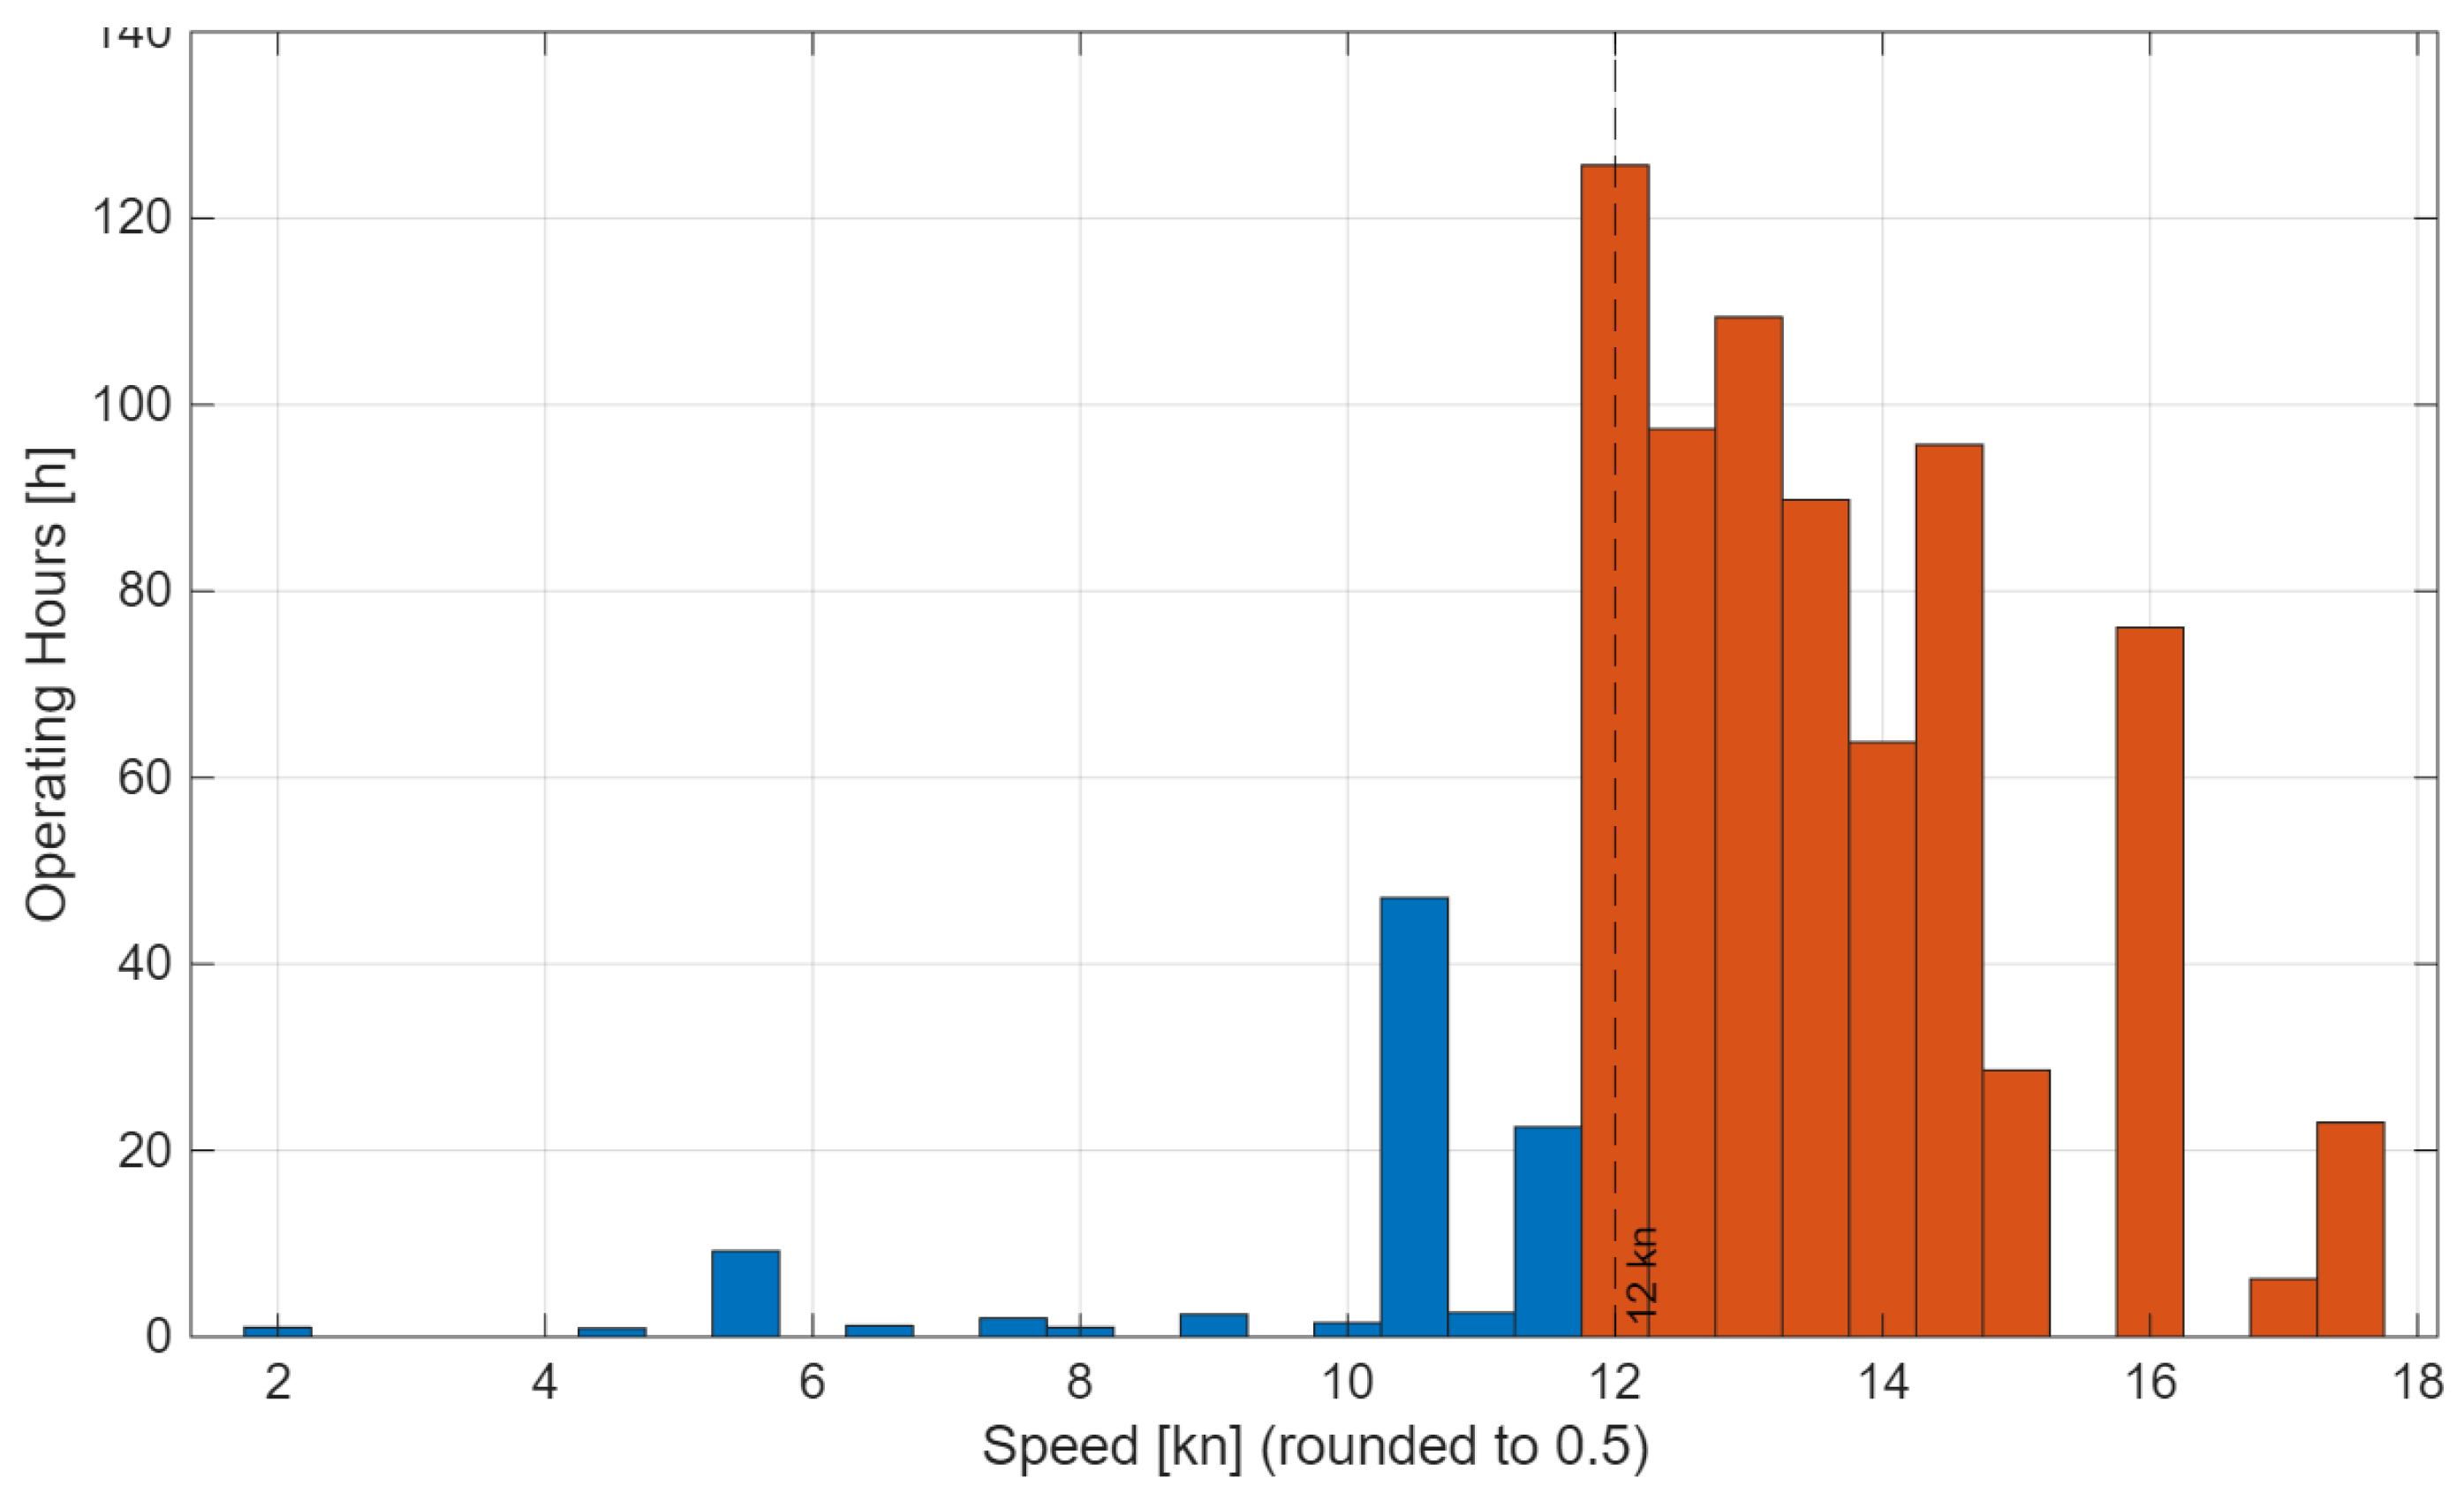
Figure 5.
Speed–load relationships by CPP mode.
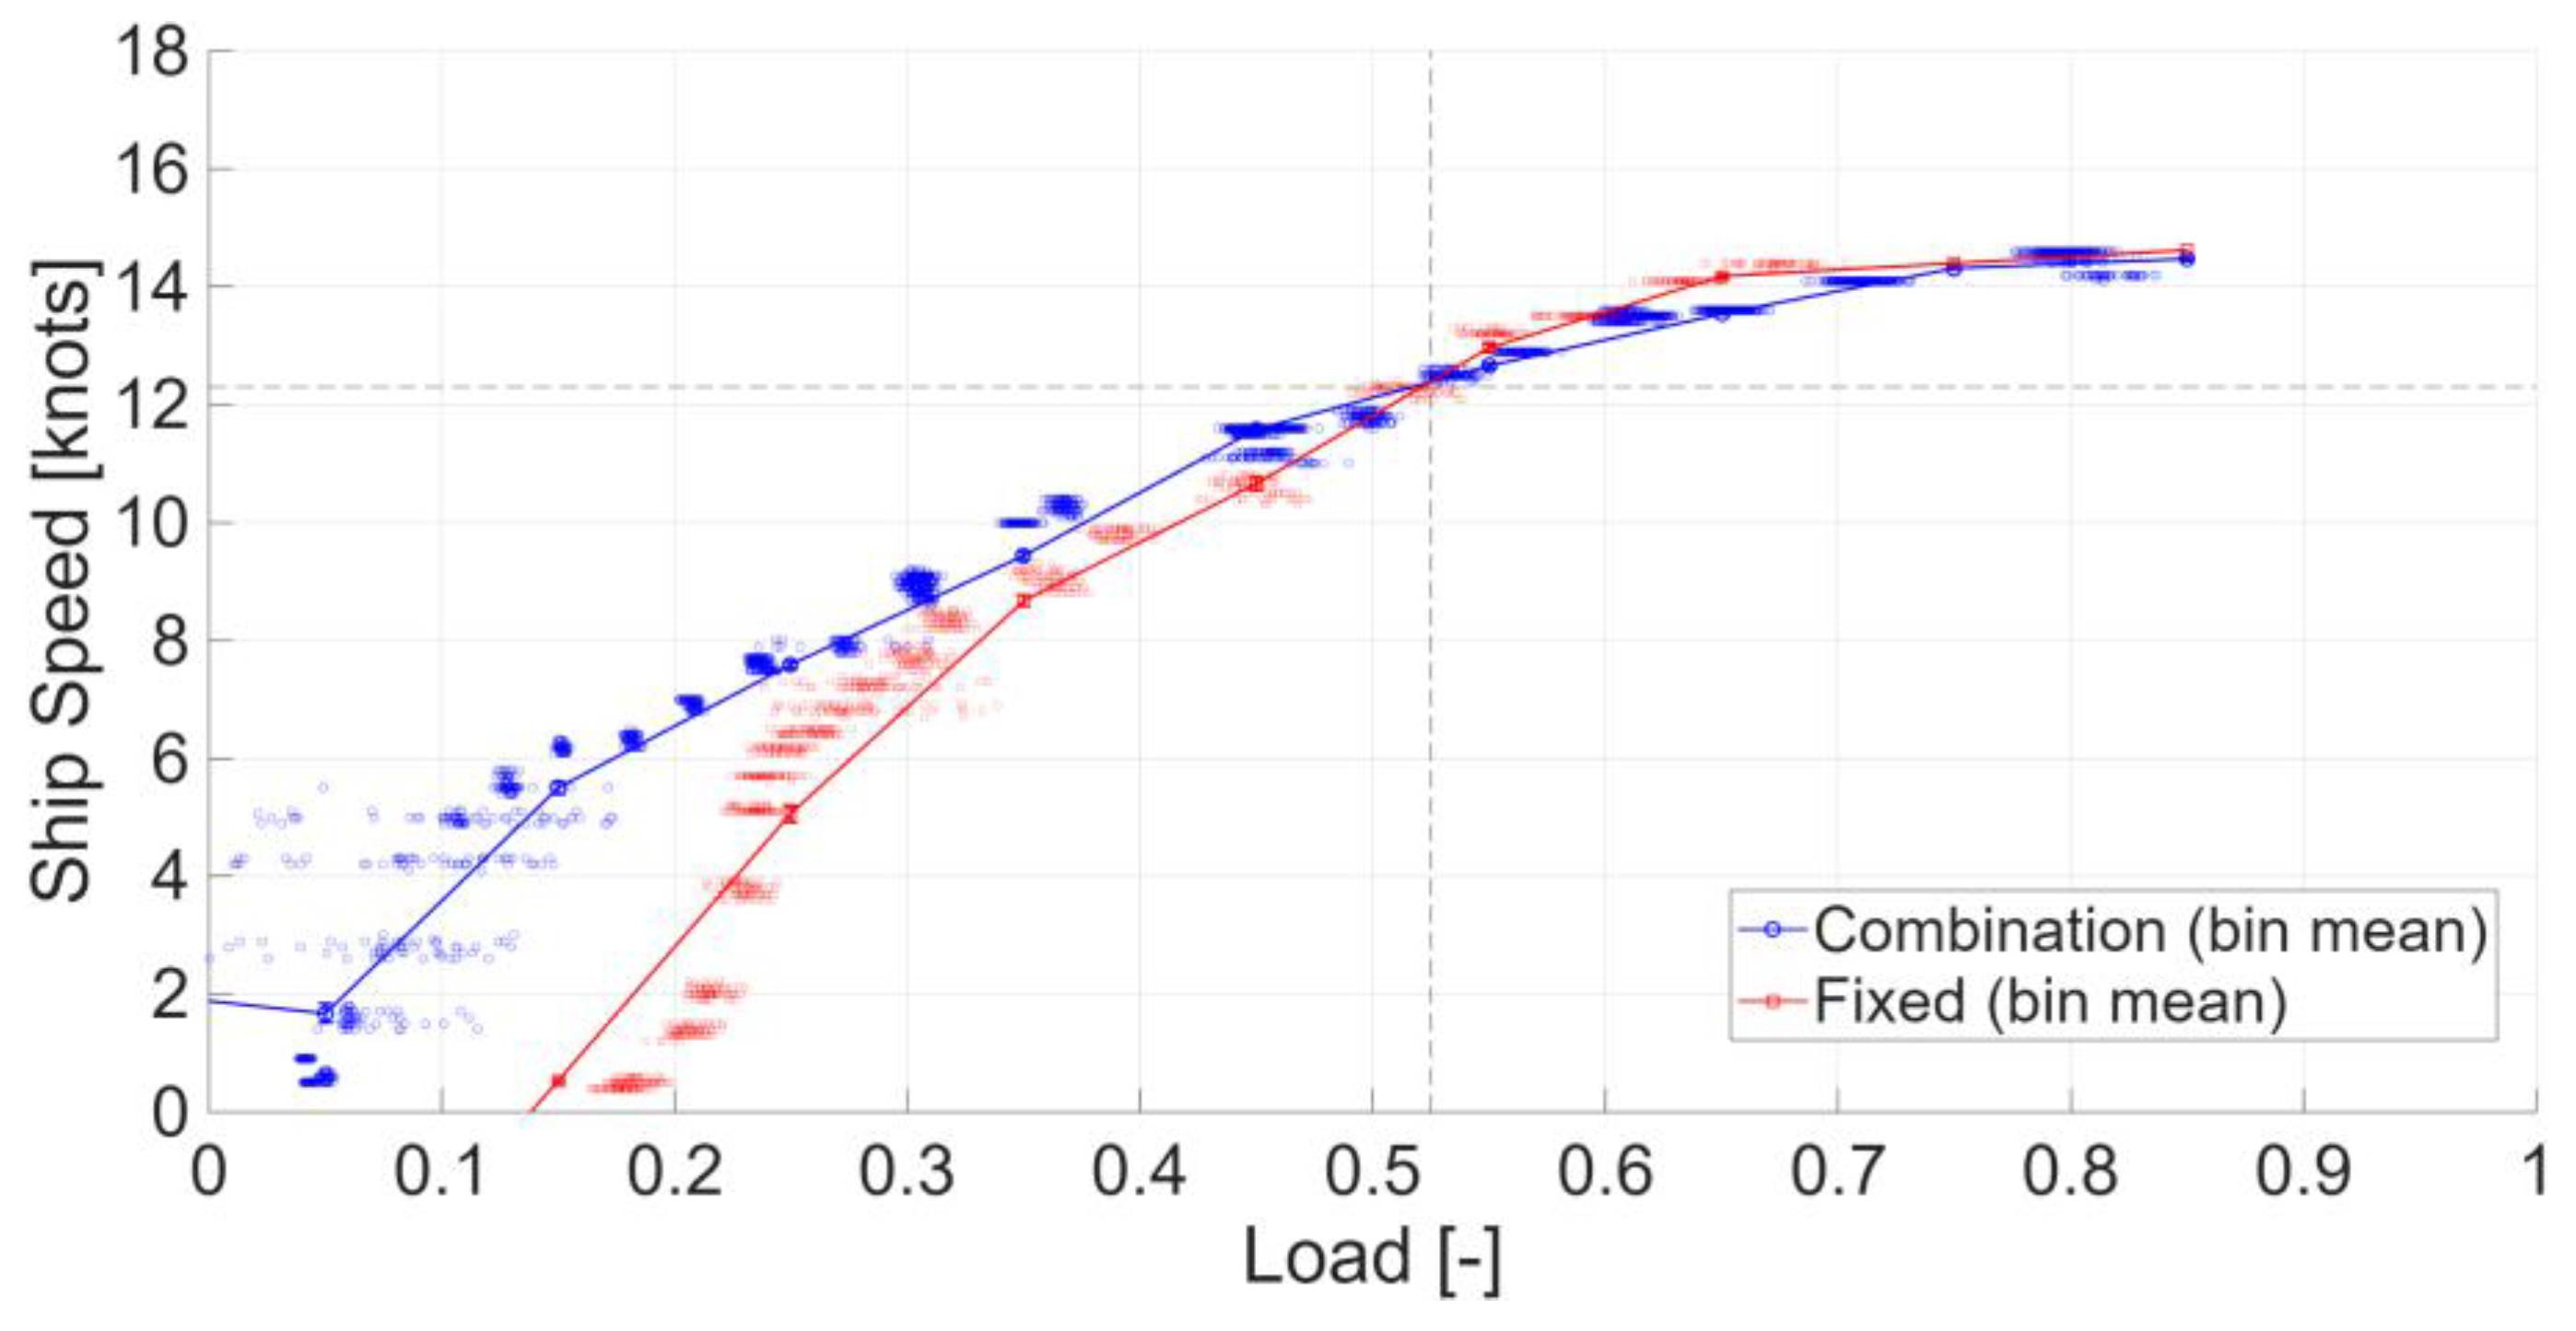
Figure 6.
Load–speed regressions by CPP mode.
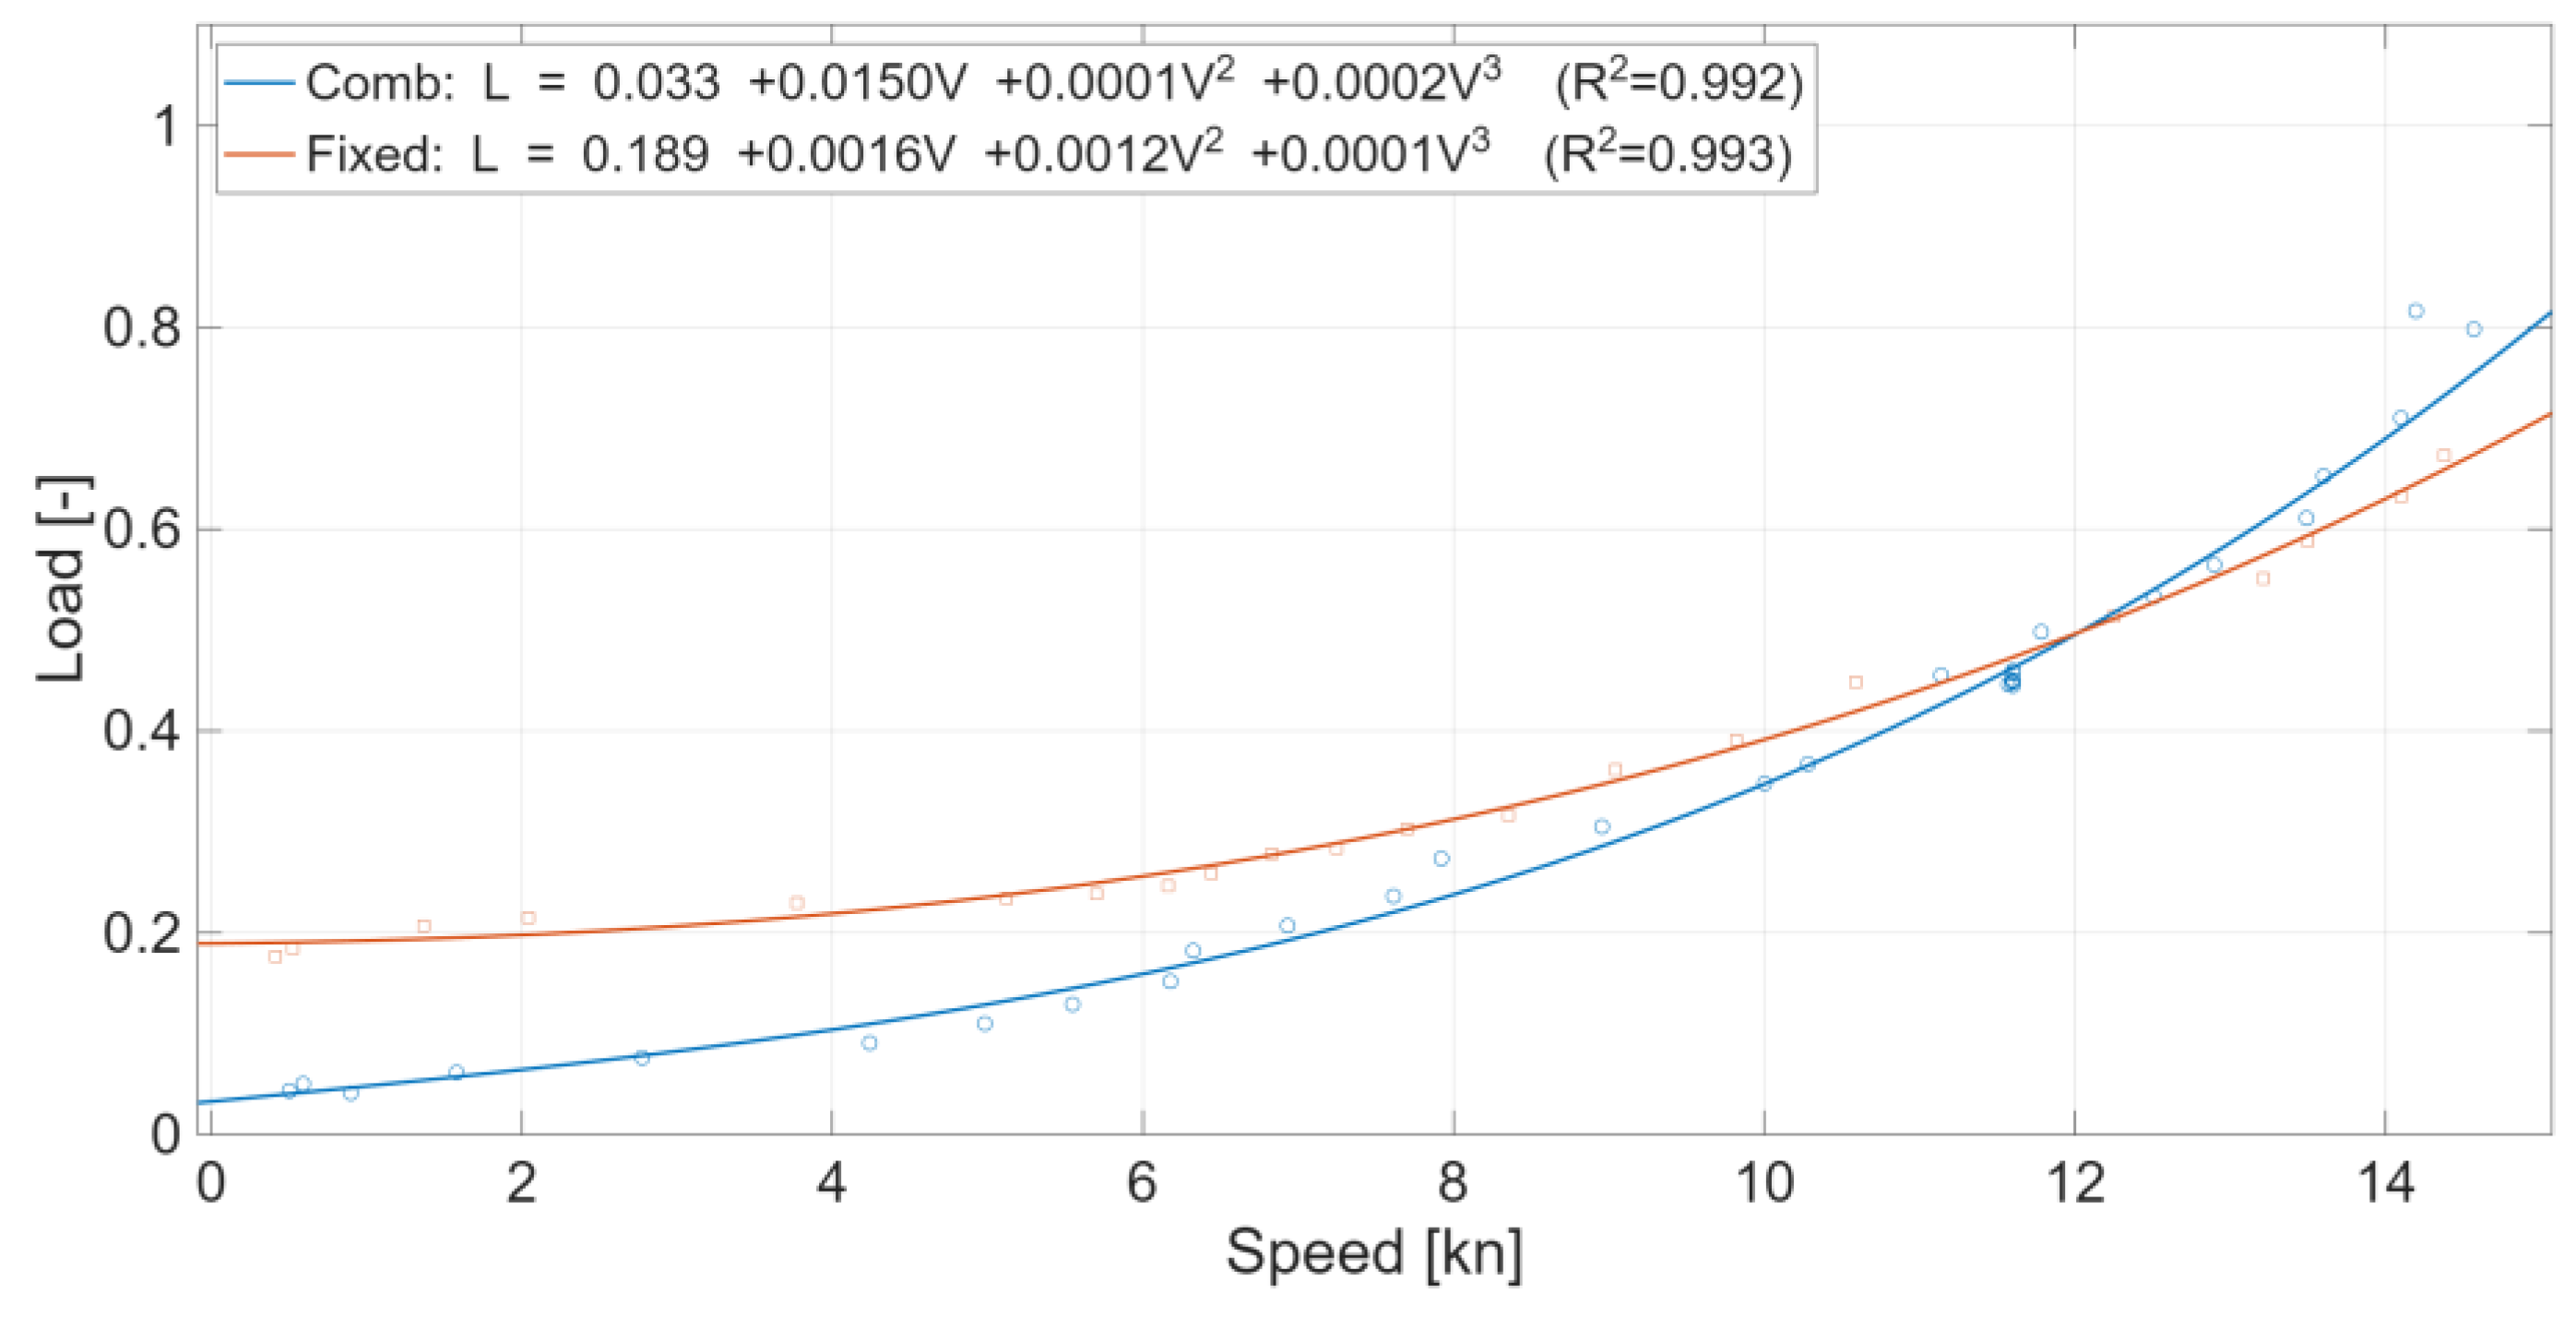
Figure 7.
Specific fuel oil consumption (SFOC) vs. engine load.

Figure 9.
CII comparison—2024 attained vs. 2025 modeled (official; sea-only; Braidotti-adjusted; equivalent-distance hybrid; CPP modes: Combination, Fixed, Optimized; dashed: required line).
Figure 9.
CII comparison—2024 attained vs. 2025 modeled (official; sea-only; Braidotti-adjusted; equivalent-distance hybrid; CPP modes: Combination, Fixed, Optimized; dashed: required line).
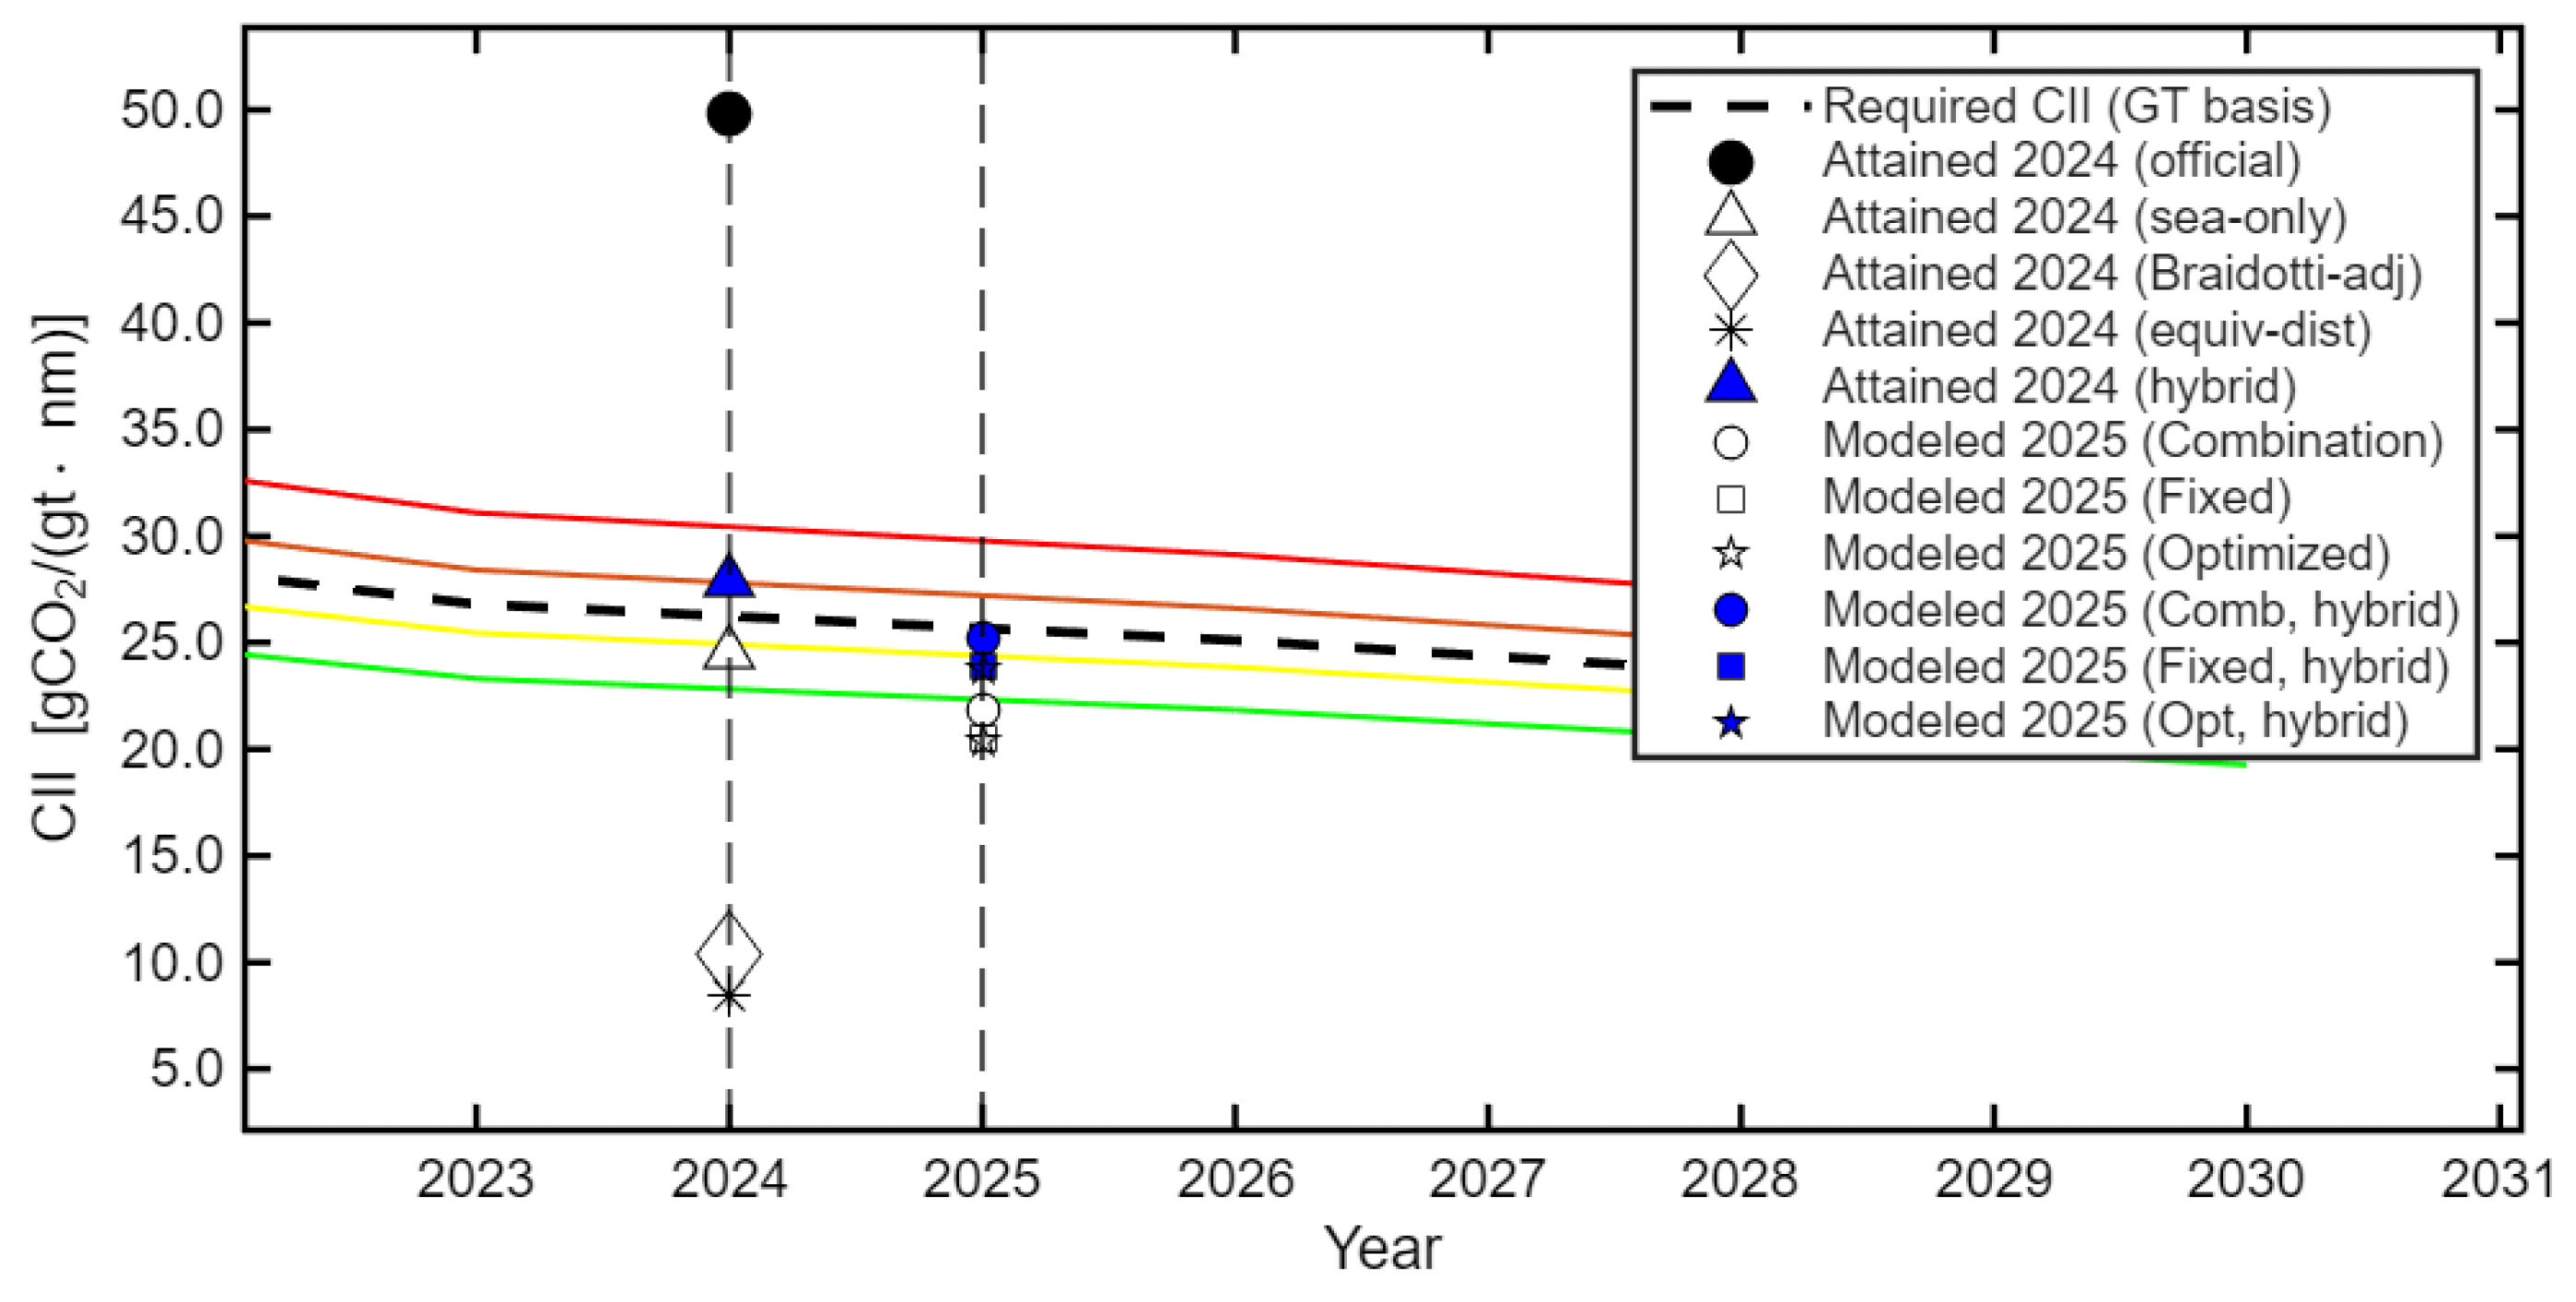
Figure 10.
Stepwise CII adjustments—2024 (official → sea-only → Braidotti → equiv-distance → hybrid) and 2025 CPP scenarios (Combination, Fixed, Optimized; with and without Hybrid).
Figure 10.
Stepwise CII adjustments—2024 (official → sea-only → Braidotti → equiv-distance → hybrid) and 2025 CPP scenarios (Combination, Fixed, Optimized; with and without Hybrid).
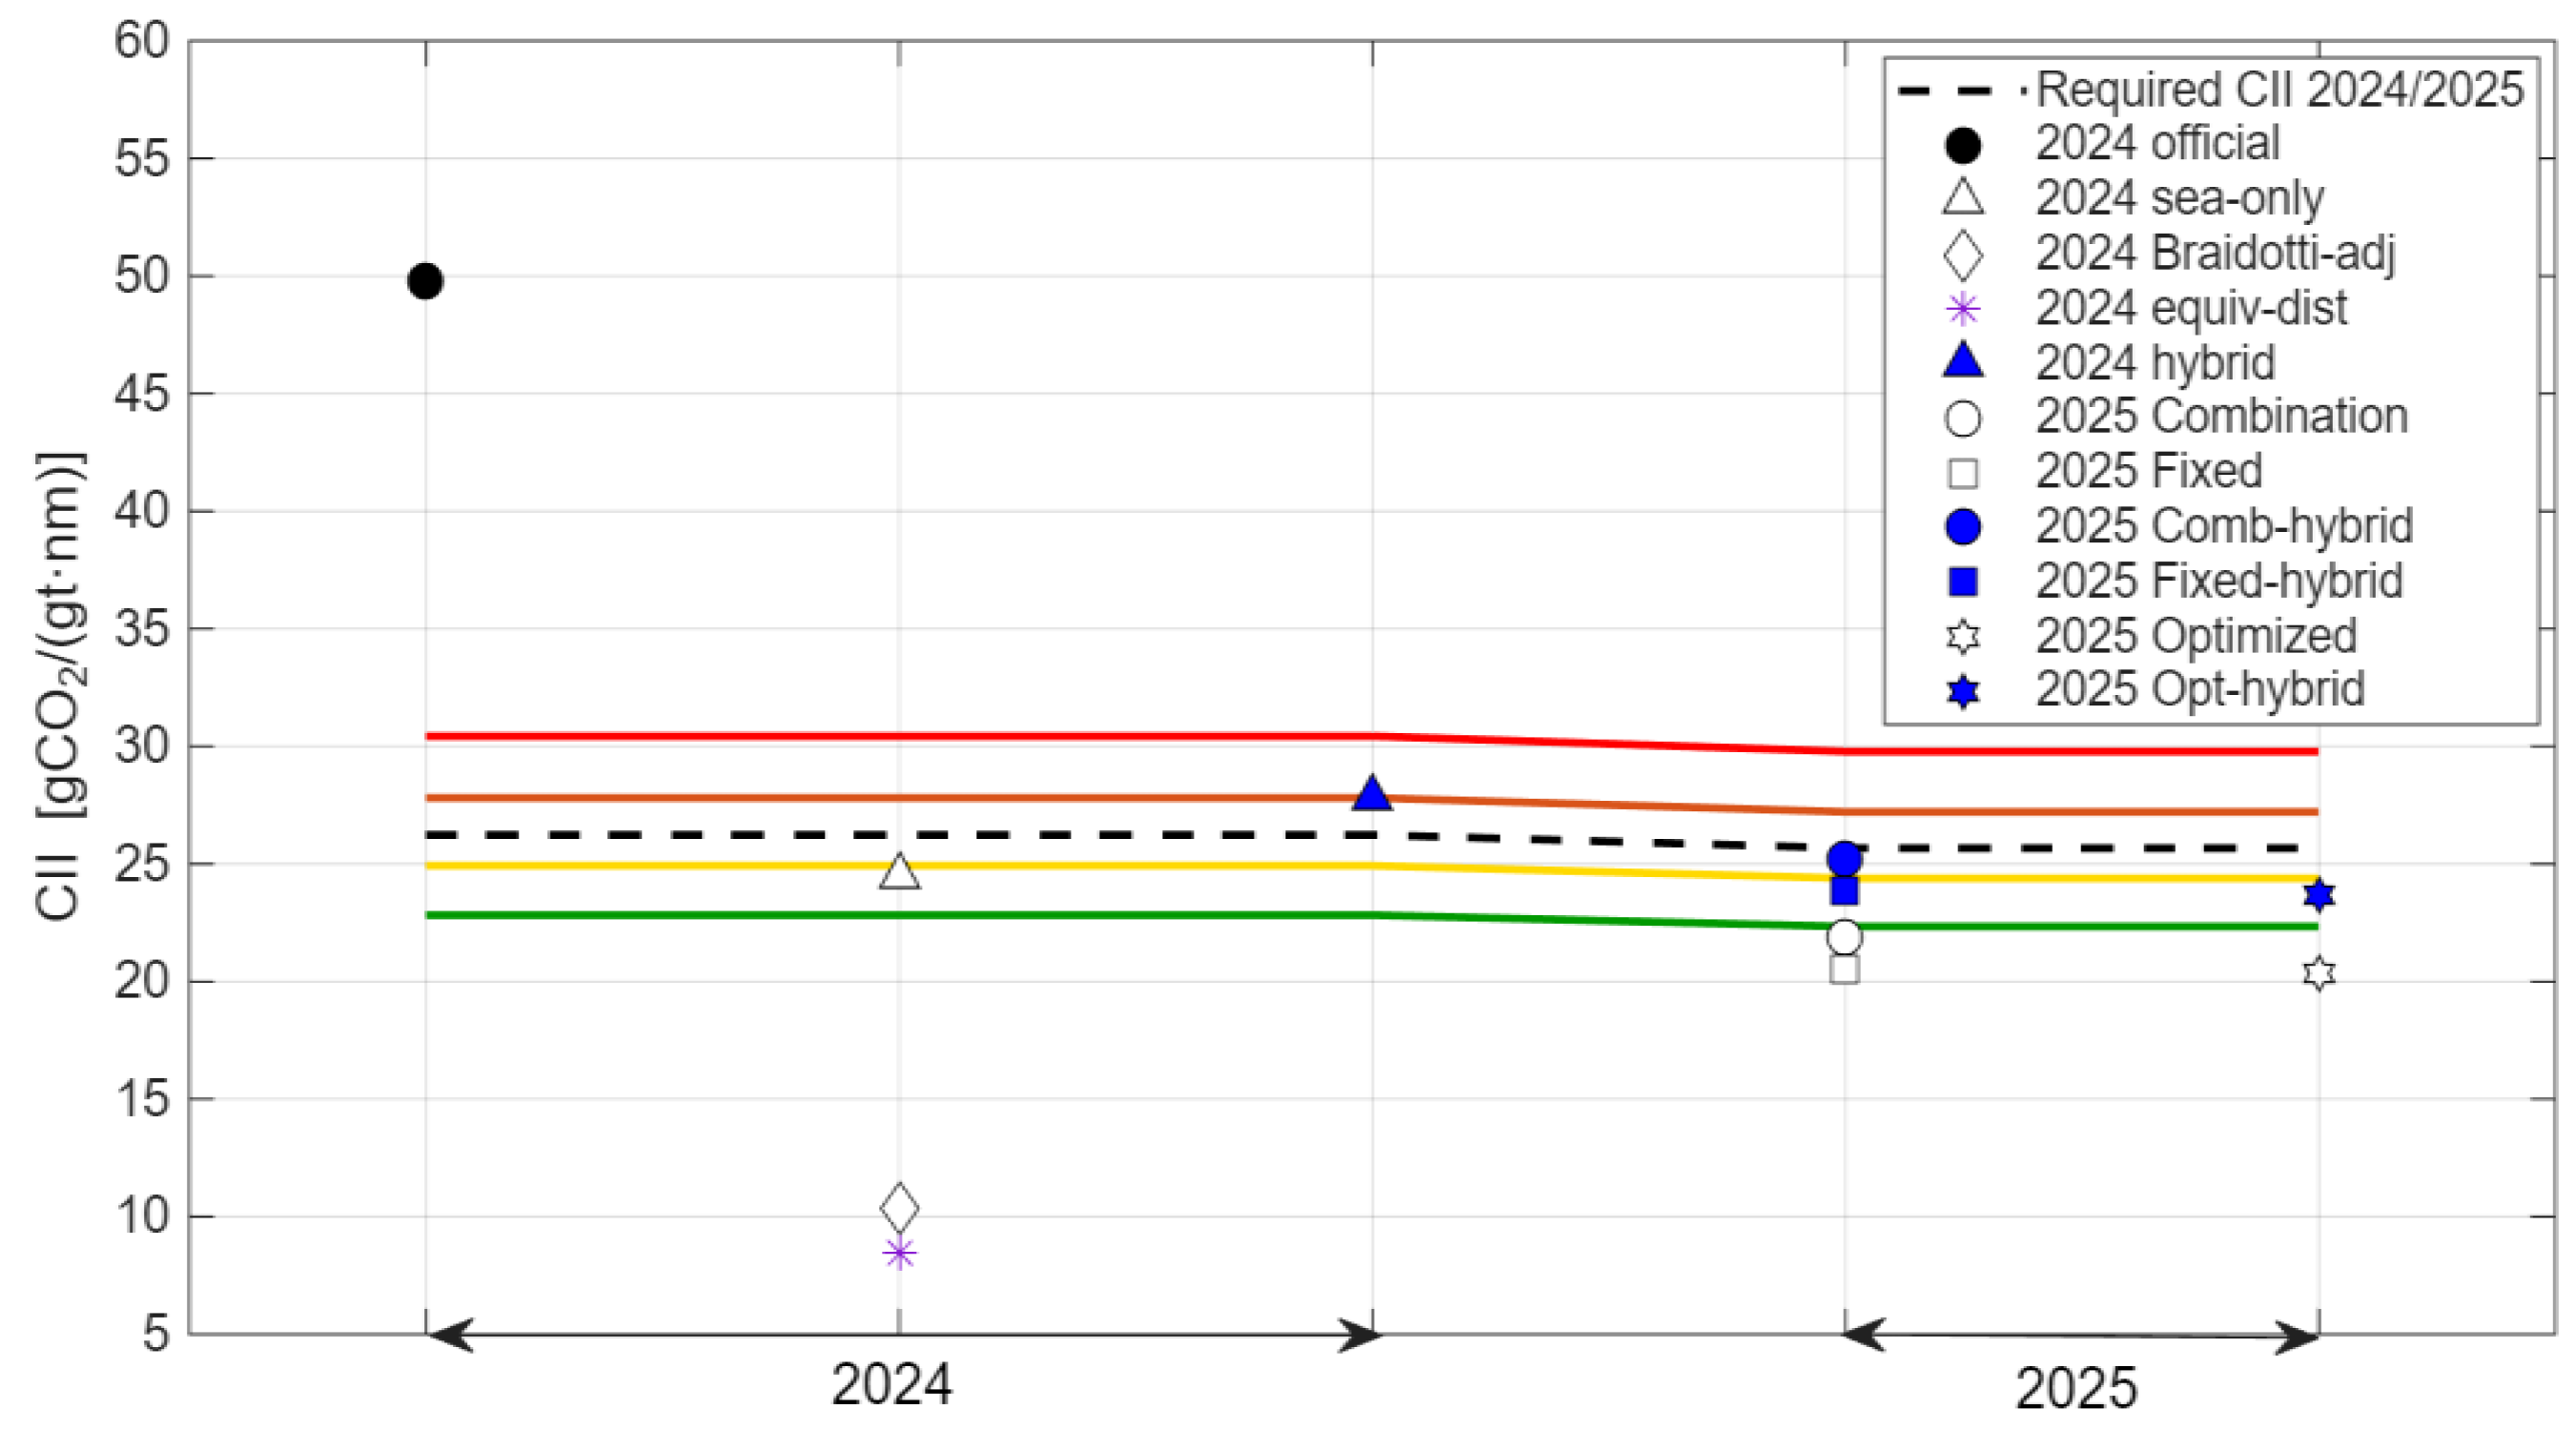
Table 2.
Year-by-year CII reduction factors (Z) relative to the 2019 reference (2023–2030).
| Year | ‘23 | ‘24 | ‘25 | ‘26 | ‘27 | ‘28 | ‘29 | ‘30 |
| Z | 5% | 7% | 9% | 11% | 13.625% | 16.25% | 18.875% | 21.5% |
Table 3.
2024 monthly ABLOG summary.
| unit | Jan | Feb | Mar | Apr | May | Jun | Jul | Aug | Sep | Oct | Nov | Dec | Total | ||
| Main Engine | fuel | ton | 0.0 | 0.0 | 55.5 | 55.5 | 117.5 | 5.5 | 0.0 | 26.2 | 31.6 | 43.7 | 168.9 | 0.0 | 504.3 |
| time | hr | 0 | 0 | 184 | 181 | 382 | 3 | 0 | 73 | 93 | 137 | 495 | 0 | 1548 | |
| distance | nm | 0 | 0 | 2308 | 2341 | 4697 | 15 | 0 | 933 | 992 | 1697 | 7368 | 0 | 20351 | |
| Generator Engine | fuel | ton | 0.2 | 7.0 | 22.4 | 18.9 | 62.9 | 118.3 | 121.3 | 125.8 | 106.1 | 40.5 | 104.5 | 0.3 | 728.3 |
| time | hr | 24 | 72 | 216 | 192 | 360 | 720 | 744 | 744 | 720 | 360 | 672 | 24 | 4848 | |
| Boiler | fuel | ton | 40.8 | 25.7 | 27.5 | 22.8 | 15.7 | 20.4 | 17.6 | 16.9 | 15.4 | 14.1 | 13.5 | 28.9 | 259.2 |
| time | hr | 744 | 672 | 744 | 648 | 648 | 720 | 744 | 600 | 672 | 672 | 504 | 744 | 8112 |
Disclaimer/Publisher’s Note: The statements, opinions and data contained in all publications are solely those of the individual author(s) and contributor(s) and not of MDPI and/or the editor(s). MDPI and/or the editor(s) disclaim responsibility for any injury to people or property resulting from any ideas, methods, instructions or products referred to in the content. |
© 2025 by the authors. Licensee MDPI, Basel, Switzerland. This article is an open access article distributed under the terms and conditions of the Creative Commons Attribution (CC BY) license (http://creativecommons.org/licenses/by/4.0/).
Copyright: This open access article is published under a Creative Commons CC BY 4.0 license, which permit the free download, distribution, and reuse, provided that the author and preprint are cited in any reuse.


