Submitted:
20 January 2026
Posted:
21 January 2026
You are already at the latest version
Abstract
Fire hazard indices are fundamental for mitigating socioeconomic and environmental damage. This study evaluated the performance of the Ängström, FMA, FMA+, EVAP/P, and P-EVAP indices in the Cerrado-Amazon transition region (2010–2022), using data from INMET and reanalysis (Copernicus). The efficiency of the models was validated by the Skill Score and Percentage of Success methods, correlating them with the hotspots from the DBQueimadas (INPE). The results reveal climatic seasonality typical of tropical regions, with rainy summers and severely dry winters, with minimum relative humidity below 30%. Although the average annual rainfall is 1,662.20 mm, spatial heterogeneity and seasonal water reduction drove a 42% increase in the number of fire occurrences, totaling 3.9 million hotspots in the period. The P-EVAP and FMA+ indices showed greater predictive accuracy, with P-EVAP reaching a Skill Score of up to 0.74, especially with reanalysis data. FMA showed intermediate performance, while Ängström and EVAP/P were less reliable. Regionally, the highest sensitivity and accuracy of the indices were observed in Maranhão and Tocantins. It is concluded that regional meteorological variability directly influences the risk of wildfires, with P-EVAP and FMA+ being the most effective tools for monitoring and preventing fires in the region.
Keywords:
forest fires
; hotspots
; rainforest
; Brazilian savanna
; ERA-5 Land
; FMA index
1. Introduction
The transition zone between the Cerrado and Amazon biomes in Brazil, known as the Cerrado-Amazon Ecotone, is the largest interface between tropical forest and savanna in the world. This area stands out for its complex environmental mosaic, resulting from the biological interaction between the biomes, and harbors a rich biodiversity associated with high rates of endemism [1,2]. However, this region has been heavily impacted by anthropogenic activities, especially by the expansion of agriculture.
The conversion of native vegetation into agricultural areas, the opening of new transport routes, and urban growth promote the fragmentation of natural ecosystems, significantly modifying local microclimatic patterns, with increased temperatures and reduced relative humidity [3,4,5,6]. Such changes favor the occurrence and spread of forest fires, which represent a significant threat to the ecological integrity of the region [7,8,9]. In addition to environmental changes resulting from land use, human actions play a central role in the formation of fires [10], as illegal burning can occur, used for the conversion of forests into pastures [11,12], failures in fire management in agricultural practices [13,14] and accidental sources, such as discarded cigarette butts and sparks from vehicle and agricultural machinery exhausts [15,16].
The interaction between natural and anthropogenic factors has resulted in an increase in the frequency and intensity of fires in the Cerrado-Amazon transition region, compromising not only local biodiversity but also climate stability and the safety of human populations that depend on these ecosystems [17]. Vegetation fires cause significant losses of ecosystem services [18,19], affecting fauna, flora and the quality of life of local populations. In addition, they contribute to increased greenhouse gas emissions [5,20] and to the aggravation of air pollution [21].
Global climate change also plays a key role in the region's fire regime. Increased average temperatures, intensified drought periods, and reduced air humidity favor the drying of plant biomass, creating a highly flammable environment [6,17,18,19]. The occurrence of fires in the region is directly related to climatic variables such as air temperature, relative humidity, wind speed, and precipitation, which influence the flammability of combustible material [22,23,24,25]. During the dry season, reduced soil and vegetation moisture favors the spread of flames, and extreme weather events, such as drought periods associated with the El Niño phenomenon, further increase the risks [26,27,28,29].
Wildfires impact the achievement of several Sustainable Development Goals (SDGs) defined in the 2030 Agenda, especially SDG 13 - Climate Action, as the increase in greenhouse gas emissions intensifies climate change and causes environmental degradation, loss of biodiversity, affecting terrestrial ecosystems (SDG 15). Wildfires also promote air pollution, which affects public health, as per SDG 3. In this sense, the use of predictive methodologies, such as vegetation fire danger indices, becomes indispensable to support public policies and fire prevention and control actions, adjusted to socioeconomic and environmental needs, especially in regions with large demographic differences and that suffer the effects of several combined meteorological factors, such as the Cerrado-Amazon transition [30].
The frequency and severity of wildfires have reinforced the need for monitoring systems that allow for faster and more efficient prevention and response. Climatic conditions are directly related to the occurrence of wildfires in certain regions. Therefore, understanding their relationships can help in the development of plans to mitigate and combat vegetation fires, as it indicates the periods and locations with the highest probability of fire occurrence, allowing for the proper targeting of fire prevention and fighting activities [31,32,33].
Two terms widely used in studies on vegetation or forest fires are “fire danger” and “fire risk” [34]. In this case, fire danger is related to factors that directly interfere with fire, such as the characteristics of the combustible material (type, quantity, condition, arrangement, climate, relief and location), which can create special conditions for ignition. Fire risk, on the other hand, is linked to the presence or absence of causative agents, such as forestry activities, agricultural activities near forest areas, and proximity to railways, among others. Specifically regarding climate, its relationship with fires can be understood as a fire production relationship, since according to Nunes et al. [35], climatic conditions (local and regional) are responsible for the occurrence and spread of vegetation fires, while the speed of spread and intensity of the fire is directly related to accumulated precipitation, air temperature, relative humidity, wind speed and direction. In this case, a higher volume of precipitation, lower temperature and lower relative humidity result in a lower number of fires [36].
Constant and variable factors influence the likelihood of wildfires. Among the constant factors, the type and quantity of combustible material (vegetation) and the terrain stand out, as they do not vary or vary little over time (except in crop and pasture areas). Variable factors include the moisture content of the combustible material and climatic conditions, such as air temperature, wind speed and direction, relative humidity, and precipitation, which can vary spatially in short intervals. Each of these factors exerts a distinct influence on the fire danger in a given location, making it necessary to know their seasonality to determine the danger of vegetation fires.
The fire danger index “constitutes an attempt to quantify the probability of a fire occurring and spreading when there is a source of ignition”. In general, this index is represented by a single number and should be evaluated daily based on observed or measured data. For the composition of fire danger indices, a series of environmental factors and conditions is considered. Thus, the suitability of a given index may vary depending on the area in which it will be used; that is, an index that shows good results in area “a” may show unsatisfactory results in another “b”, provided that these areas have differences, especially in their environmental and climatic conditions [37].
As strategies for monitoring and preventing fires, indices based on meteorological information have been developed worldwide to indicate the fire danger. In the context of Brazil, the main indices used are the Monte Alegre Formula (FMA) and its modified version (FMA+), developed under the climatic conditions of the state of Paraná, and the international Angström, Telecyn and Nesterov indices, as well as P-EVAP and EVAP/P [38,39,40,41,42,43]. These formulas have already been applied and tested in several locations in Brazil; however, because they present different responses, it is still important to identify the model that best suits the climatic conditions of each region.
The major limitations to the widespread use of fire danger indices stem from the low density of automatic and/or conventional weather stations monitoring atmospheric conditions. The use of meteorological reanalysis data emerges as an alternative to minimize these difficulties and enable the expansion of regional fire prevention systems. Meteorological reanalysis combines historical observations/measurements with modern forecasting models to create a consistent and continuous record of the state of the atmosphere, oceans, and Earth over time. These datasets provide valuable information on variables such as temperature, precipitation, and wind, allowing for a better understanding of climate evolution and are being made freely available on various digital platforms, such as the Global Precipitation Climatology Centre (GPCC), the European Center for Medium-Range Weather Forecast (ECMWF), the Climatic Research Unit (CRU), the Center for Weather Forecasting and Climate Studies (CPTEC/INPE), as well as many others widely used in Brazil and worldwide. These data are obtained by compiling information from various sources, such as automatic and conventional weather stations, ships, airplanes, radars, and satellites, which can be interpolated using mathematical models, helping to estimate data in regions without measurement means [44].
These databases have been widely used in scientific research around the globe, mainly in environmental studies, without verifying the principles of normality. In this context, the present study analyzes the adequacy of ERA5 (5th Generation of European ReAnalysis - ECMWF) reanalysis data to different vegetation fire danger indices, comparing them with measurements obtained from automatic weather stations. In addition, this work seeks to identify the danger indices that present greater accuracy in predicting the occurrence of fires in this transition region between two important Brazilian biomes.
2. Materials and Methods
This study was developed for the Cerrado-Amazon transition region, considering a buffer zone of 200 km on each side of the confluence between the Cerrado and Amazon biomes. The total area delimited was 1,495,321.78 km² (Figure 1), encompassing regions of six Brazilian states. Among these, the state of Mato Grosso had the largest portion of area within this delimitation, with 728,996.42 km², which corresponds to 81% of the state's territory; Similarly, in the states of Pará, Maranhão, Rondônia, Tocantins, and Piauí, the areas included in the evaluated buffer were 206,152.7, 280,388.6, 65,239.7, 202,220.62, and 12,323.70 km², which represent approximately 17, 84, 27, 73, and 5% of the total area of each state, respectively.
In this research, daily precipitation (rainfall), air temperature (maximum, minimum, and average), relative air humidity (maximum, minimum, and average), and wind speed (measured at 10.0 m height – daily average values) data were used, obtained from automatic and conventional meteorological stations (Figure 1) of the National Institute of Meteorology (INMET), through the Meteorological Database for Teaching and Research (DBMEP – https://terrabrasilis.dpi.inpe.br/queimadas/bdqueimadas/). The study area has 87 automatic and conventional INMET stations, which were subjected to database consistency assessment. Therefore, 13 stations were excluded because they did not cover the study period (2010 to 2022). Of the remaining 74 stations, seven (07) were excluded because they presented more than 30% data gaps and/or sequential gaps for more than 6 months. Thus, 67 meteorological stations were used (Figure 1), of which 49 were automatic, and 18 were conventional (Table S1 - supplementary document).
Based on the locations of each meteorological station, re-analysis data from the ERA5-Land model were obtained from the Copernicus Climate Change Service platform via the C3S Climate Data Store (CDS - https://cds.climate.copernicus.eu/), which are developed and operated by the European Centre for Medium-Range Weather Forecasts (ECMWF); these data correspond to the fifth generation of atmospheric re-analyses developed by the ECMWF and provide estimates of several atmospheric parameters, with a spatial resolution of 0.1° x 0.1° (latitude and longitude) for ERA5-Land [45].
To perform statistical comparisons between meteorological station data and ERA5-Land reanalysis data, the values of all analyzed meteorological variables were extracted based on station coordinates, from 2010 to 2022, on a daily scale. The reanalysis data were subjected to deviation correction, considering the measured data (meteorological station) as a reference, aiming to minimize trends and systematic errors (Eq. 1), since, in the studied region, several geographical factors and distinct atmospheric movements occur, generating significant climatic differences between the states (Equation (1)).
where: refers to the reanalysis data, and are the data from the meteorological stations.
Danger index estimates were based on a baseline height of 2.0 m, since most pastures and crops in this region do not exceed this limit. Furthermore, meteorological elements are measured in accordance with Allet et al. [46], including height. To this end, the wind speed unit of measurement was converted from km/h to m/s, and the height of 2.0 m was adjusted according to the measurements from meteorological stations, since the reanalysis data are provided for a height of 10 meters. For this, a logarithmic adjustment of the wind gradient in height was applied, using a short grass surface roughness coefficient as a correction factor [46] (Equation (2)). This adjustment was performed for both the data from the National Institute of Meteorology (INMET) and the ECMWF reanalyses (ERA5-LAND).
where: u2 wind speed at 2.0 m above the ground surface [m s-1], u10 wind speed at 10.0 m above the ground surface [m s-1], uz is the wind speed measured at z m above the ground surface [m s-1]; Z height of the measurement above the ground surface [m], and ln logarithmic wind speed profile for measurements above a short grass surface.
Rainfall data were adjusted using the Normalized Precipitation Index (SPI), employed in monitoring annual variability [47]. Rainfall has an asymmetrical distribution; in this sense, the data were first transformed into a normal distribution and then calculated according to equation 3.
where: i is the time scale; Pi is the observed precipitation; Pl and σi are, respectively, the mean and standard deviation of the fitted series.
SPI is the reduced variable Zi of the normal distribution of precipitation.
2.1. Filling in Database Gaps
The assessment of fire season indices requires a continuous daily series of meteorological data, and, therefore, for data measured at conventional and automatic weather stations, it was necessary to fill in the gaps. For the climatic variables of air temperature and relative air humidity, the daily gaps were corrected by the regional weighting method, using regressions between the three closest stations [48].
To fill in the gaps in the rainfall data, TRMM (Tropical Rainfall Measuring Mission) data were used, available with a spatial resolution of 0.25° x 0.25° (degrees of latitude and longitude), in the database of the Agrometeorological Monitoring System (AGRITEMPO), coordinated by the Brazilian Agricultural Research Corporation (EMBRAPA). To obtain the TRMM data, the geographic coordinates of the INMET meteorological station were used, prioritizing the surroundings and proximity to the station to be filled in. Four TRMM data points were selected for each INMET meteorological station. After selecting TRMM with daily values from 2010 to 2022, the rainfall data from the local station and TRMM were separated by year and by period (dry and rainy) to obtain the deviations. When deviations greater than 40% were observed between the data measured at the local station and the average TRMM in the monthly totals, the discrepant values from the local station were filled in with average daily TRMM data.
The filling in of the gaps in wind speed data was carried out based on the monthly averages from the INMET station itself [49].
2.2. Fire Danger Indices
After correcting the daily continuous series of meteorological variables for each station, the Angström, FMA, FMA+, P-EVAP and EVAP/P fire danger indices were obtained, considered recommended indices for the Cerrado-Amazon transition region of Mato Grosso [38]. These indices were applied to both meteorological station data and reanalysis data.
The Angström Index is a non-cumulative fire danger index that uses temperature and relative humidity data, measured daily at 13:00, or by the relationships between the daily maximum temperature and the daily minimum relative humidity [38,50]. Initially, the interpretation of the index was based on the value of “B”, so that values below 2.5 indicated a fire danger; that is, the atmospheric conditions of the day would favor the occurrence of fire. Casavecchia et al. (2019) [38] performed the discretization of fire danger classes based on frequency histograms and probabilities of occurrence. They standardized the risk assessments into five classes, similar to those of other danger indices. Obtaining the daily index is given by Equation (3).
where: B is the Ångström index; H is the relative humidity (%); T is air temperaturre (°C).
The Monte Alegre Formula (FMA) is one of the most widely used indices in fire risk studies in Brazil. It is a cumulative index that considers the influence of days without rain, in order to reflect the accumulation or loss of moisture in plant fuels. In addition to days without rain, the FMA index also considers the relative humidity of the air (Equation (4)) [38,50].
where: H is the relative humidity (%), measured at 1:00 PM or the daily minimum value; n is the number of days without rain greater than or equal to 12.9 mm.
To allow for better representations in different climatic conditions and vegetated surfaces, the Modified Monte Alegre Formula (FMA+) was developed, which is also a cumulative index and associates the effects of relative air humidity (H) and wind speed (v), both measured at 13:00h (Equation (5)) [51,52].
where: H is the relative humidity (%), measured at 1:00 PM or the daily minimum value; n is the number of days without rain greater than or equal to 12.9 mm; v is the wind speed (m s-1).
The fire danger indices P–EVAP (Equation (6)) and EVAP/P (Equation (7)) are also cumulative and show the deficit relationships under conditions of a sequential water balance on a microscale, considering the relationship between the daily water depths (mm) of precipitation (P) and the potential reference evapotranspiration (EVAP); in this case, EVAP was obtained by the Camargo model [53] (Equation (8)), as it depends only on the average daily air temperature (Tmed) and presents good results for this study region [53].
where: is the potential evapotranspiration (mm day-1); F is the model correction factor; Ho is extraterrestrial radiation; Tmed is the average daily temperature.
In addition to the formulas presented, the fire danger indices FMA, FMA+, P-EVAP and EVAP/P have application restrictions (Table 1).
After applying the indices, the results were grouped into five classes of danger level: none, low, medium, high, and very high (Table 2).
2.3. Statistics
To verify the performance of the indices, the Skill Score methodology was applied, which evaluates the quality of the forecasting system and validates the indices produced. The Skill Score is obtained by applying a contingency table (Table 3), which compares the observed values to the predicted values for a given event, population or time interval [54].
For the application of the Skill Score method, the observations (days) were associated with their respective fire danger classes, being separated into two groups: i) the high and very high danger classes were considered as days predicted for fire occurrence; ii) the zero, small, and medium danger classes were considered as days with a prediction of no fire occurrence. These groupings allowed for danger predictions. Consequently, for the validation of the Skill Score method, the observed data were obtained from the heat source observation database of the Burning Data Bank (BDQueimadas) of the National Institute for Space Research (INPE), referring to the years 2010 to 2022, for the states (Mato Grosso, Pará, Rondônia, Maranhão, and Tocantins) included in the study area, on a daily time scale.
The burning data from BDQueimadas are available in vector point format. To account for the presence of fire outbreaks in relation to the indices of each station, the outbreak must be less than 50 km from the location of the meteorological station, a point at which the reanalysis data were also considered.
To compare the variables of the meteorological stations with the reanalysis data, as well as their results in the fire danger indices, the following methods were applied to evaluate statistical performance: Willmott's concordance index (d) (Equation (9)), MBE (Mean Bias Error) (Equation (10)), RMSE (Root Mean Square Error) (Equation (11)) and the Mann-Whitney test (Equation (12)).
where: Pi represents the observed data (data from weather stations); Oi represents the estimated data; in this research, it represents the reanalysis data.
Willmott's index of agreement measures the fit between estimated and observed values, ranging from 0 to 1, where 0 indicates the worst fit and 1 the best possible [54]. The MBE (Mean Bias Error) quantifies the average deviation between estimated and observed values, being negative when estimated values are underestimated, positive when they are overestimated, and zero when there is a perfect simulation. The RMSE (Root Mean Square Error) indicates the actual dispersion of errors between estimated and observed values. Unlike the MBE, it does not indicate whether there is underestimation or overestimation, but the smaller its value or the closer to zero, the better the model's performance. The non-parametric Mann-Whitney test evaluates significant differences between the distributions of two datasets. The analysis considers the critical p-value (< 0.05) to validate trends, based on the calculation of the position of the elements between the samples; the result indicates whether or not there are statistically significant differences between the distributions of the two datasets [55].
3. Results
3.1. Meteorological Variables Obtained from Weather Stations and Through Reanalysis
In the comparison between the observed data (weather stations) from INMET and the estimated reanalysis data (ERA5-Land), for the period from 2010 to 2022, using the Mann-Whitney test, it was observed that precipitation showed extreme discrepancies; however, the temperature and relative humidity variables showed varying degrees of agreement. The states of RO, MT, and PA showed the greatest inconsistencies between station and reanalysis data. In the state of Rondônia, the largest number of variables with statistically significant differences was observed, showing a greater discrepancy between the station and reanalysis data, while the states of Maranhão and Tocantins showed a smaller number of discrepant variables (Table 4).
The statistical evaluation demonstrated that, in all states included in the transition, the rainfall variable showed a statistically significant difference (p = 0.00) between the observed and estimated values. Regarding daily air temperature, the maximum temperature (Tmax) showed a statistically significant difference in the state of Rondônia (p = 0.03), while in the other states, the p-values were greater than 0.05. The average temperature (Tmed) did not show statistically significant differences in any of the states in the study area, with variations in the p-value from 0.09 to 0.32, which allows us to infer that the simulated data (reanalysis) are statistically aligned with the observed data (meteorological stations) in the study region. For the minimum temperature (Tmin), statistically significant differences were identified only in the states of Mato Grosso and Pará (p-value of 0.03) and in Rondônia (p-value of 0.04); in the other states, p > 0.05 was obtained, indicating that the observed and estimated data are statistically similar.
For average daily relative humidity, statistically significant differences were observed only in the states of Pará (p = 0.00) and Mato Grosso (p = 0.05). For minimum relative humidity, differences between daily data were observed only in Rondônia (p = 0.04). Regarding average wind speed, statistically significant differences were observed between measured data (meteorological stations) and estimated data (reanalysis) in Rondônia and Piauí (p = 0.01) (Table 4).
The evaluated meteorological elements present monthly climatic variability, with well-defined seasonal patterns throughout the year (Figure 2; Table S2 – supplementary document). Rainfall shows great variation in the first months of the year (January to April), with the highest values, and this is also the period in which the greatest number of extreme monthly total values are recorded, with outliers exceeding 200 mm month-1. From May onwards, a reduction in rainfall is observed, marking the beginning of the dry season, which extends until September, with minimum average values and low dispersion. Rainfall volume gradually increases again from October onwards, indicating the beginning of the rainy season (Figure 2A). Although considered to be the same biome transition region, this seasonality is controlled by mesoscale atmospheric movement systems, which, in turn, are influenced by the Equator, the Atlantic Ocean, and the Andes Mountain range.
Daily maximum temperatures (Figure 2B), daily average temperatures (Figure 2C), and daily minimum temperatures (Figure 2D) show relative stability throughout the year, with temperature ranges between 10 and 25 °C. Maximum temperatures varied between 31°C and 34°C (average values), with a slight reduction between June and August. Average temperatures ranged between 26 °C and 28 °C, while minimum temperatures showed greater variability, with a more pronounced drop between May and July (a period in which the medians reach approximately 18.0 °C). This seasonality is associated with the latitude ranges of the stations and the effects of the apparent movement of the Sun, generated by its revolution, as these are the periods with the largest zenith angles.
The average daily relative humidity values (Figure 2E) are highest between January and April, with medians above 80%, and decrease sharply from May onwards, reaching the lowest values between June and August (medians of 50% to 60%), following the same trend as rainfall distribution (Figure 2A). The seasonality of the minimum relative humidity (Figure 2F) reinforces the severity of the dry season, with values consistently below 30% and several outliers below this limit. Regarding the average wind speed at 2.0 m height, little variation is observed throughout the year, with medians between 1.5 and 2.5 m s-1. However, a slight increase is observed in the driest months (June to September), accompanied by greater data dispersion and extreme values above 5 m s-1 (Figure 2G).
These results highlight the typical climatic seasonality of tropical regions, marked by a rainy season in the summer months and a well-defined dry season in the winter, directly impacting air humidity and thermal variability and, consequently, the risk of vegetation fires.
Figure 3 presents, in the first column, the observed spatial variability (OSMV) based on data from meteorological stations measuring rainfall and air temperature. Total annual rainfall, measured at meteorological stations between 2010 and 2022 in the Cerrado-Amazon transition region, showed values exceeding 1,000 mm year-1 and an annual average of 1,662.20 mm; however, spatial heterogeneity is observed, with an amplitude of up to 1,132 mm (Figure 3). Two regions with maximum precipitation in the studied area are observed: to the west, in the state of Rondônia, represented by the meteorological stations of Cacoal and Vilhena (with 2,125 and 2,114.74 mm year-1, respectively), and to the north, in Pará, where the Rondon do Pará station recorded 2,227 mm year-1. In contrast, the Northeast region of the study area, located in the state of Maranhão, recorded the lowest values, especially represented by Colinas (MA), which presented the lowest regional rainfall index (1,039 mm year-1).
The MBE statistical indicator showed variation between 1 and -35, with 85% of the data indicating that the reanalysis values underestimated the values from the meteorological stations, while 13.5% indicated overestimation. Only the stations of Brasnorte (MT) and Farol de Santana (MA) showed differences between 0.99 and -0.99 in the comparison between the reanalysis and the observed data (Figure 3).
As for the RMSE indicator, the values showed dispersion of less than 40%, considered moderate and within an acceptable error level. The Willmott index revealed low agreement in most of the region (values below 0.5), except in São Luís and Farol de Santana (MA), where the best indices were observed (0.95 in both stations) (Figure 3).
For the maximum, average, and minimum air temperature variables, the results showed MBE close to zero, indicating good estimates of the simulated data through reanalysis. Thus, the RMSE also demonstrates good accuracy in almost the entire study area. The performance in relation to the Willmott index was between 0.5 and 0.8, indicating moderate to good agreement between the reanalysis data and the measurements at the meteorological stations (Figure 3).
In the Cerrado-Amazon Transition region, when analyzing the correlation of spatial variability between rainfall and temperatures throughout the series (201-2022), it is noted that the maximum temperature showed high thermal differences (36 °C) in the North and Northeast regions and lower differences (19 °C) in the Southwest region (Figure 3).
The average temperature smooths the seasonality of maximum and minimum temperatures, showing less spatial variability; however, effects of the South Atlantic and the Caatinga biome are observed, due to the occurrence of higher Tmed values in the states of MA, PI, TO and Sudese of PA. The minimum temperature shows a distribution corroborating the other temperatures, with emphasis on the minimum values in the central and southern regions of the study area, at the meteorological stations of Querência, Gaúcha do Norte, Vila Bela da Santíssima Trindade and Porto Estrela, both in Mato Grosso; In these cases, factors such as altitude/relief and latitude can contribute to lower temperatures, in addition to the possibilities of polar frontal systems directed by the Andes Mountains, popularly known as "cold snaps" (Figure 3).
The evaluation of the average relative humidity (RHmed), minimum relative humidity (URmin), and average wind speed variables revealed several levels of statistical performance between the measured and reanalysis data (Figure 4). Based on the observed spatial variability (OSMV) using data from meteorological stations, the average annual relative humidity varies from 61.62 to 81.01%, with the lowest values found in the southeastern region of the study area, near Palmas (TO), a region influenced by the continental factor (Caatinga and Cerrado biomes); while the highest annual averages of relative humidity occur in the São Luís (MA) region, influenced by humidity from the Atlantic Ocean. Regarding the minimum annual relative humidity, higher values can also be observed in the northern region, where the ocean establishes a more stable humidity dynamic throughout the year (Figure 4).
The model showed low bias (MBE between -0.99% and 0.99%) for average and minimum relative humidity. RMSE values remained between 20% and 60%. However, the Willmott index showed predominantly values below 0.7, indicating the distance between the data measured by the meteorological stations and those of reanalysis, especially in extreme events (minimum unit) (Figure 4).
The average annual relative humidity of the entire region studied, in the period from 2010 to 2022, was 71.66%, with the highest and lowest average values in March (81.47%) and August (56.10%), respectively. Regarding the minimum annual relative humidity, it was 48.74%, while on a monthly scale, the minimum relative humidity varied from August to October between values of 32.76% and 43.33%, respectively, and during the rainy season from December to April, the humidity varied between 55.52% and 57.22% (See Table 2 above).
For the average wind speed, the spatial variability observed in Figure 4 indicated low values, between 0.003 and 2.25 m s-1. Although the model presents low MBE, with values close to zero, characterized as perfect, the RMSE values are high, between 40% and 80%, which indicates a considerable difference between the estimated and observed data. Willmott's index was less than 0.5 in much of the area, revealing that the model has low efficiency in simulating the spatial distribution of average wind, probably due to the influence of microclimates and topography that are not fully captured.
The average annual wind speed during the study period was 0.98 m s-1, with an average monthly variation of 0.80 to 1.16 m s-1, with the highest values between July and December. The highest monthly averages of average wind speed were observed in the region of the states of Maranhão (Preguiças and Farol de Santana, with 4.03 and 3.02 m s-1, respectively) and Piauí (Parnaíba, 3.97 m s-1), due to the predominance of air currents from the Atlantic.
To facilitate understanding of the variations in meteorological elements, normalization index evaluation was adopted, using measurements obtained from meteorological stations as a reference (equation 3). Especially for rainfall, which plays an important role in the availability of water for plants and consequently in the moisture level of vegetation fuel material, analyses of the Normalized Precipitation Index (SPI) were performed, comparing daily precipitation data measured at INMET meteorological stations with re-analysis estimates from the ERA5-Land satellite, for the period from 2010 to 2022. Predominantly, the re-analysis data underestimated the precipitation recorded at the meteorological stations, with large variations in underestimation in the Cerrado-Amazon transition. Overestimations were observed in only 7 stations, with the São Vicente (MT) station showing large overestimations, with a value of 0.832 (Figure 5). These overestimations are associated with geographical factors, especially altitude and terrain configuration, with, for example, the São Vicente station having the highest altitude in the region (786.99 m).
Considering the SPI values considered normal, where the reanalysis data and the station measurements are similar, 5 stations were observed, with 4 located in the western portion of the study area (MT) and 1 in the far north of Maranhão (Figure 5).
When normalizing the air temperature (maximum, average, and minimum), relative air humidity (average and minimum), and average wind speed variables from the reanalysis data in relation to the data measured at meteorological stations, it is observed that, in general, the normalization values vary between 0 and 1.6; however, the behavior of the variables is not uniform. It should be noted that the closer to zero, the smaller the difference between the data observed at the meteorological stations and those estimated by the reanalysis (Figure 6).
For the maximum temperature variable, homogeneity is observed among the normalized values, ranging between 1.0 and 1.2 °C for all meteorological stations, while for average and minimum temperatures, the normalized values vary from 0.8 to 1.2 °C; this indicates that Tmax is the air temperature component with the highest accuracy in reanalysis estimates for local and surface climatological analyses (Figure 6).
For the average and minimum daily relative humidity, normalized values between 0.6 and 1.0 predominate, with a reduction for average relative humidity (HRmed) mainly in the southern part of the study region; for minimum relative humidity (HRmin), the normalized values reach 1.4 in the northeastern region of the studied area (Figure 6). Regarding average wind speed, it was the variable that presented the highest spatial variability index in the normalization categories, with values ranging between 0.0 and 1.6 m/s. However, it was also the variable with the largest number of stations with the smallest difference (between 0.0 and 0.4) between the station data and the reanalysis data (Figure 6).
3.2. Statistical Indicators of Fire Danger Indices, Based on Reanalysis Data and Meteorological Station Data
The performance of the statistical indicators for the FMA, FMA+, Angstrom, P-EVAP, and EVAP/P indices varied across the study region, which encompasses parts of the territories of the states of MA, MT, PA, PI, RO, and TO (Table 5).
For the MBE indicator, the reanalysis data overestimated the data observed at the stations, ranging from 0.0 to 264.61 for the FMA, FMA+, and EVAP/P indices. The Angstrom and P-EVAP indices showed a tendency towards underestimation, ranging from -0.001 to -99.83. The RMSE indicator showed a spread from 0.72 to 609.42. As for the Willmott index of agreement, it presented good results, with values between 0.61 and 0.73 (Table 5).
Angstrom showed consistent performance in the observed and estimated data, with MBE variation from -0.07 (PI) to 0 (RO), evidencing a small systematic error and a low RMSE, which varied between 0.72 (RO) and 1.02 (PI). The Wilmott index, on the other hand, showed significant variability, with the best results in Rondônia (0.79) and Pará (0.75), and the worst performance in Tocantins (0.63). This demonstrates that, despite Angstrom showing stability with low variation, its ability to accurately reproduce observed estimates varies greatly among the states in the region (Table 5).
The FMA index showed a slight tendency to overestimate in almost the entire area, with MBE between 30.85 (RO) and 76.34 (PI), while RMSE values ranged from 105.45 (PA) to 166.05 (PI). The best Willmott values were obtained in the states of Rondônia and Pará (0.74 and 0.76, respectively), indicating good agreement in these states, and the worst performance was in Piauí (0.62). Thus, the FMA proved to be more reliable in the states of Pará and Rondônia and showed lower precision in Piauí (Table 5).
The FMA+ stands out for its better performance, with low MBE values, ranging from 21.66 (RO) to 61.13 (PI), and less bias in the western region of the study area (PA, MT, RO). In RMSE values, the FMA+ also stands out among the other indices, as it presented the lowest values, mainly in the states of Pará (95.03) and Rondônia (91.91), which demonstrates high precision. The Willmott index reinforces this behavior, highlighting the states of Rondônia (0.80), Pará (0.76), and Mato Grosso (0.74). However, the states that showed inferior performance (PI and TO) still obtained acceptable values (0.65 and 0.71, respectively). Thus, the FMA+ proved to be an important and reliable index for analyzing the estimation of vegetation fire danger under different regional conditions (Table 5).
In the P-EVAP index, the statistical performance of MBE was negative in all states within the study area, in the range and transition, from (-6.96 in Rondônia to -88.83 in Piauí), which shows an underestimation of the reanalysis data. The RMSE varied across the region and showed greater error dispersion in the states of the North and West regions of the study area: in Rondônia, 73.88; in Pará, 128.57; and in Piauí, 222.94, which confirms the lower performance in this state. The Willmott values in Rondônia (0.83), Tocantins (0.73), and Mato Grosso (0.73) indicate high agreement with the observed data. The P-EVAP proved to be efficient, especially in states where the bias is lower, being a suitable index for monitoring in tropical regions (Table 5).
The fire danger index that performed worst in the overall analysis was EVAP/P; its MBE values were considerably high, with maximums in Piauí (264.61) and Maranhão (164.27), indicating a strong overestimation. Similarly, the RMSE also followed this trend, with values ranging from 212.80 in Rondônia to 609.42 in Maranhão, indicating high variability. In Willmott's concordance, the least significant values in the analysis ranged from 0.49 (MA) to 0.66 (RO). These results show that EVAP/P is not efficient in adequately representing the danger of vegetation fires, due to its high oscillation and low agreement with the observed data (Table 5).
The graphical distribution of the indices estimated from the meteorological stations and reanalysis data allows visualization and comparison of the behavior of these estimates (Figure 7). In Vilhena, for example, all indices show periods of stability in fire risk, followed by peaks of greater danger, a pattern that directly reflects rainfall variation: during the rainiest months (October to March), the risk decreases, while in the dry period (April to September) it increases significantly (Figura 7b).
It is also observed that the Angstrom index stands out for the lower dispersion of data compared to the other indices (Figure 7a), with an RMSE of 0.66, while FMA, FMA+, P-EVAP and EVAP/P presented RMSEs of 105.39, 110.82, 76.13 and 176.92, respectively. The Angstrom index also showed the lowest bias, with MBE=0 and a Willmott coefficient of 0.83, indicating agreement between the index estimate from the station data and the reanalysis data (Table 3 - supplementary documents).
It is also noted that there is a general tendency for the indices calculated from the reanalysis data to overestimate the stations, particularly during peak times. The Angstrom index is an exception to this pattern, showing systematic underestimation, even during risk peaks (Figure 7a).
3.3. Spatial and Seasonal Distribution of Heat Sources
Based on data from INPE's Fire Database, between 2010 and 2022, 3,936,006 hotspots were recorded in the analyzed region. During these 12 years, the lowest number of hotspots was observed in 2011, with a total of 55,399 occurrences, while the highest was in 2020, with 555,866 hotspots. The years with the highest number of hotspots were 2020 and 2022, totaling 1,034,223 occurrences (Figure 8).
Throughout the historical series, an interannual fluctuation in the number of fire outbreaks is observed, with successive decreases and increases. However, despite these seasonal variations, the data reveal a growing trend in the number of occurrences, which becomes evident when comparing the initial and final years of the analyzed period: while between 2010 and 2014 the annual average was approximately 190,000 outbreaks, in the last three years (2020-2022), the average jumped to about 452,000 annual occurrences, an increase of 42% in outbreaks (Figure 8).
The seasonality of heat spots throughout the year clearly shows the influence of the precipitation regime, with a greater concentration of occurrences in the period of lowest rainfall (from May to September) (Figure 2A). Peaks are observed mainly in August and September, months that mark the end of the dry season and are characterized by lower values of relative air humidity (Figure 2E and 2F; Figure 9). This relationship becomes particularly evident when comparing the meteorological variables in Figure 2 with the spatial distribution of hotspots in Figure 9, especially in the states of Rondônia and Mato Grosso. Distinct patterns are observed in the states of Pará, Tocantins, and Maranhão, where the months of greatest occurrence extend from August to October, a variation attributed to the latitudinal distribution of meteorological stations and the different rainfall regimes at these latitudes. In Piauí, represented by only two stations, the seasonality of rainfall shows a well-defined dry season between July and November, a period that coincides entirely with the season of greatest incidence of hotspots (Figure 9).
In the states of Mato Grosso and Maranhão, the highest accumulation of hotspots is found, standing out for its more significant values, greater dispersion, and the presence of outliers, indicating the occurrence of extreme events with multiple simultaneous hotspots (Figure 9). These results can be explained by the greater number of meteorological stations that each state has in this study and by the sum of the coverage area of each of these stations, which serves to account for the quadrant of hotspots, according to the methodology already described.
Figure 10 illustrates the spatial and temporal distribution of hotspots in the Cerrado-Amazon transition region, highlighting seasonal patterns and heterogeneity in the occurrence of fires. While lighter shades indicate less fire activity, darker shades highlight critical areas, mainly from May onwards, corroborating the quantitative data presented in Figure 9. It is noted that the distribution is not uniform throughout the year, with marked variations between periods of higher and lower incidence. Between February and April, the reduction in hotspots in the northern and northeastern portions of the study area coincides with the peak of precipitation in the region, reinforcing the inverse relationship between humidity and the occurrence of fires.
In addition, Figure 10 shows that, although Figure 9 groups the hotspots by state, their spatial distribution is not entirely homogeneous. This pattern is particularly evident in the state of Maranhão, where the increase in hotspots begins in June and persists until December. However, even during this period, the intensity of the fires is not uniformly distributed throughout the territory; this spatial and temporal heterogeneity influences the state that presents the highest accumulated number of hotspots (Figure 10).
In Mato Grosso, the months of August and September concentrate the highest accumulated number of hotspots. However, a distinct pattern is observed in the northeastern region of the state, bordering Tocantins, where the increase in hotspots begins early in June and intensifies significantly in July, unlike the rest of the state, which only begins to decrease from November onwards. This scenario is particularly worrying, as the area in question encompasses the Araguaia State Park region, an important biodiversity conservation unit, where fires can severely compromise ecological processes and the preservation of local biota (Figure 10).
Figure 11 shows the spatial distribution of hotspots in the study area. The map shows the density of hotspots, represented by a color scale ranging from yellow, with an average of 10,000 hotspots, considered the lowest concentration, to dark red, with a high concentration, up to 220,000 hotspots.
The highest intensity of hotspots is concentrated in the states of Maranhão, the eastern portion of Tocantins, and northeastern Mato Grosso. Regions that show the darkest red hue, evidencing a high number of fires, may be associated with regional climate dynamics and anthropogenic activities. While the western regions of Mato Grosso and the southern part of Tocantins show a yellow hue, characterized by a lower density of hotspots. This spatial diversity reflects the dynamics of land use and land cover and the condition of forest preservation, considering the lower number of fires identified (Figure 11).
3.4. Performance of Fire Danger Indices
3.4.1. Accuracy in Predictions and Success Rate
The accuracy of fire danger forecasts (AP) in the Cerrado-Amazon transition region ranged from 0% to 100%. Overall maximums were 63% to 100%, while minimums ranged from 0% to 33.1% (Figure 12).
At the weather stations, the EVAP-P index showed maximum values of 0.100 and the Angström index of 0.634. With the reanalysis data, the maximum values were 0.898 for the P-EVAP index and 0.000 for the EVAP-P. The minimum values ranged from 0.0 to 0.279 at the stations and from 0.0 to 0.331 in the reanalysis. The P-EVAP index obtained the best overall performance, standing out as the most efficient with both station data and reanalysis data. The best and worst results were recorded in the western part of the study area, more specifically at the Diamantino (0.0%) and Padre Ricardo Remetter (100%) stations, both in the state of Mato Grosso. Considering the reanalysis data, the best AP was also observed at Padre Ricardo Remetter (100%) in Mato Grosso, while the worst performance was associated with the Araguaína station (0.0%), in the state of Tocantins (Figure 12). These results highlight the variability in the accuracy of predictions among the analyzed indices.
Analysis of the FMA index revealed accuracy rates in fire danger (FA) predictions between 26.6% and 82.5% in the study region. In meteorological station data, values ranged from 27.9% to 81.6%, with the best performance recorded at the Chapadinha station and the worst at the Farol de Santana station, both located in Maranhão. In reanalysis data, FA results ranged from 26.6% to 82.5%, with the highest accuracy observed in Pedro Afonso and the lowest, again, in Farol de Santana (MA). The FMA reanalysis results for FA showed a variation from 27% to 80%, with success percentages between 54.5% and 78.2% (Figure 12). The accuracy of the FMA+ index predictions ranged from 0% to 85% at the station and from 30% to 86% in the reanalysis data. The FMA+ forecast accuracy was 0% in Chapadinha (MA) and 85% in Pedro Afonso (TO), both in the Northeast region of the study area. In the reanalysis results, the worst success percentage was 30% in Farol de Santana (MA) and the best, 86%, in Pedro Afonso (TO) (Figure 12).
In the Angström index, for the entire study area, the accuracy in the forecasts (AP) ranged from 18.7 to 63.4% based on data from meteorological stations; the lowest and highest percentages were recorded in Farol de Santana and Grajaú (MA), respectively. When considering the reanalysis data, the observed variation was from 18.5 to 63.4%, with representative locations being Farol de Santana and Colinas, both in the state of Maranhão (Figure 12). The P-EVAP index showed wide variation in the accuracy rate of fire danger predictions. Based on data from INMET meteorological stations, the values ranged from 0 to 89.2%, with the extreme values recorded in Chapadinha (MA) and Pedro Afonso (TO). Using reanalysis data, the accuracy rates ranged from 33.1 to 89.8%, with the lowest values observed in Farol de Santana (MA) and the highest in Chapadinha (MA) (Figure 12).
The best results in the evaluation of fire danger indices were obtained in the northern region of the study area, based on data from meteorological stations and reanalysis. The P-EVAP, FMA, and FMA+ indices stood out, with P-EVAP showing the best performance in the reanalysis data. During the period from 2010 to 2022, these indices also recorded the highest number of correct predictions, with P-EVAP leading, followed by the FMA and FMA+ indices (Figure 12).
The success rate (SR) in the Cerrado-Amazon transition ranged from 18% to 89% throughout the period, across the entire study area (Figure 13). In the EVAP/P index, considering station and reanalysis data for the region, the SR values ranged from 40.0 to 77.4%. The best percentages were found in Chapadinha (MA) and Palmas (TO), while the worst were recorded in Porto Nacional (TO) and Chapadinha (MA), respectively, for both station and reanalysis data. In the FMA index, the states of Maranhão and Tocantins stood out as having the best success rates (SR) in the station data. In the reanalysis data, the results obtained in the same region were 81.8% and 56.1%. In the western portion of the territory, including the state of Mato Grosso, the success rate varied between 50% in the station results and 68% in the reanalysis (Figure 13).
The index obtained by the Modified Monte Alegre Formula (FMA+) showed a success percentage (PS) that varied from 39% to 77%, with better percentages for the stations that are in the northern region of the study area, in the states of Maranhão, Tocantins and Piauí, however for the reanalysis data the values obtained were from 56% to 82% with the best in Chapadinha (MA) and the worst PS for Sorriso (MT) (Figure 13). For the Angstrom index, the success percentage ranged from 19.6% to 63.4% when using INMET data, recorded in Farol de Santana and Grajaú (MA). On the other hand, in the reanalysis, the values ranged from 18.5% to 65.2%, with Farol de Santana and Colinas (MA) standing out (Figure 13). In the P-EVAP index, the success rate (PS) showed a wide variation in the accuracy rate of fire danger predictions, ranging from 38.9% to 78.7% in the station data, with Chapadinha (MA) showing the lowest index and São Félix do Araguaia (MT) the highest. For the reanalysis data, the PS showed a variation between 58.1% and 80.3%, highlighting the locations of Juara and São Félix do Araguaia, both in the state of Mato Grosso (Figure 13).
The success rate of the danger indices indicated that the best performances were obtained by the FMA+, FMA and P-EVAP models, especially in the northern and northeastern portion of the region, which includes the states of Tocantins and Maranhão. The highest values were obtained with data from reanalysis, for the P-EVAP index, which achieved a success rate of 70% when using both reanalysis data and data from INMET meteorological stations (Figure 13).
3.4.2. Skill Score in the Study Region in the Cerrado-Amazon Transition
The Modified Monte Alegre Formula (FMA+) and the P-EVAP index presented the best results in the Skill Score in the fire danger analysis in the study area (Table 6). The Skill Score (SS) of the station and reanalysis indices showed a variation from -0.57 to 0.74 throughout the Cerrado-Amazon transition, with the maximum value observed in the P-EVAP index, in São Vicente/MT, with reanalysis data, and the minimum in Angstrom, in Campo Novo dos Parecis/MT, with station data (Table 6).
The average EVAP-P index (Skill Score) across the study area was 0.34 with station data and 0.30 with reanalysis data (Table 6). The maximum values were observed at the São Vicente (MT) station, reaching 0.73 in the index calculation based on the station's meteorological variables and 0.74 when considering the reanalysis data. The minimum values of -0.37 at the station and -0.43 in the reanalysis, both in Campo Novo dos Parecis (MT) (Table 6). In the observed data, the EVAP-P index presented a skill score of 0.43 for the states of Mato Grosso, Pará (0.37), Maranhão and Tocantins (0.26), Piauí (0.17) and Rondônia (0.14), while, in the reanalysis, the values ranged between 0.39 and 0.16, being Mato Grosso (0.39); Pará (0.34); Maranhão (0.24); Tocantins (0.22); Piauí (0.16) and Rondônia (0.17) (Table 6).
For FMA+, a skill score of 0.38 was obtained with data from the stations and 0.40 with reanalysis data. The maximum values were 0.53 at the station and 0.62 in the reanalysis; the minimum values were -0.40 and -0.42, respectively. The maximum values were obtained in Chapadinha (MA) and Palmas (TO), and the minimum values, both at the station and in the reanalysis, were in Campo Novo dos Parecis (MT). Considering the indices with data obtained at the station and in the reanalysis, the states obtained average Skill Scores from FMA+ in Mato Grosso (0.32 and 0.30), Pará (0.45 and 0.50), Maranhão (0.40 and 0.48), Tocantins (0.47 and 0.50), Piauí (0.43 and 0.51) and Rondônia (0.38 and 0.47) (Table 6).
The P-EVAP, the average Skill Score index, was 0.40 with the station data and 0.45 with the reanalysis data. Maximum values were 0.52 at the station in Chapadinha (MA), and 0.59 in the reanalysis in Palmas (TO), and minimum values were -0.34 and -0.37, for the station and reanalysis, both in Campo Novo dos Parecis (MT). The average skill score of the indices obtained at the station and in the reanalysis by states included in the study area was 0.38 for Mato Grosso, 0.43 and 0.51 for Pará, 0.40 and 0.52 for Maranhão, 0.45 and 0.50 for Tocantins, 0.46 and 0.54 for Piauí, and 0.38 and 0.47 for Rondônia (Table 6).
The calculated Angstrom skill score was 0.01 based on station data and 0.08 when considering reanalysis data. The maximum values were 0.11 at the Colinas (MA) station and 0.20 in the Imperatriz (MA) reanalysis; however, the lowest values observed at the station and in the reanalysis (-0.34 and -0.37) were in Campo Novo dos Parecis (MT). The Angstrom skill score for the states of Mato Grosso (0.00 and -0.01), Pará (0.01 and 0.01), Maranhão (0.02 and 0.04), Tocantins (0.03 and 0.00), Piauí (0.02 and 0.03), and Rondônia (0.01 and 0.03). These results highlight the influence of different data sources on the performance of the Angström index and on fire prediction estimates (Table 6).
The average skill score on the FMA was 0.35, calculated based on station and reanalysis data from the region. The maximum values ranged from 0.53 at the station and 0.57 in the reanalysis, both for the Chapadinha locality, and the minimum values were -0.46 and -0.49, respectively, at the station and in the reanalysis, for the Campo Novo dos Parecis (MT) locality. In the FMA analysis for the states included in the ecotone, we have Mato Grosso (0.25 and -0.22), Pará (0.43 and 0.47), Maranhão (0.41 and 0.43), Tocantins (0.45 and 0.47), Piauí (0.42 and 0.42) and Rondônia (0.37 and 0.43) (Table 6).
4. Discussion
The Cerrado-Amazon transition in Brazil is considered the largest savanna-forest transition in the world [1], identified as an Ecological Tension Zone (ETZ) due to permanent instability and climatic variation and the hyperdynamics of the vegetation [25]. Fires occurring in the Cerrado-Amazon transition region equally threaten both biomes, the Cerrado and the Amazon [1]. In addition to these particularities, the region is located on the Brazilian agricultural frontier and is internationally known as the “Arc of Deforestation” [1]. In this context, the FMA (Monte Alegre Formula), FMA+ (Modified Monte Alegre), Ängström, P-EVAP and EVAP/P indices are used as essential tools to predict and monitor the occurrence of wildfires [38,51].
The analysis of these indices in the Cerrado-Amazon Transition showed that the combination of low humidity, high temperatures and intense wind speed contributes to the increased risk of vegetation fires [56,57]. In the study area, when evaluating the performance of the indices, P-EVAP stood out as the best and most reliable predictive model for fire danger, followed by the FMA and FMA+ indices, considered to have the highest accuracy in predicting the occurrence of fires.
Beu (2022) [58], when evaluating the fire risk in the Ipanema National Forest (Flona de Ipanema/SP) with meteorological data from the INMET automatic station, indicated that the modified Monte Alegre Formula (FMA+) is the appropriate tool for forest fire prevention and control activities. In the research developed by Casavecchia et al. (2019) [38], the index that presented the best performance was Ängström, followed by FMA and FMA+ in the Sinop-MT region, a transition area between the Amazon and Cerrado. While in our study area, the FMA index can be an intermediate alternative, and Angstrom and EVAP/P show high variability, indicating lower reliability, and should be used with caution due to lower precision and lower reproducibility in the region.
This superiority can be attributed to specific meteorological conditions in the region, such as reduced precipitation, low air humidity, and high temperatures, factors that contribute to the drying of fuel material. This combination, associated with heat sources, provides insight into the determining factors of fires in the Cerrado-Amazon Transition [56,57].
A study conducted by Casavecchia et al. (2019) [38] observed that the risk indices obtained in the Monte Alegre Formula (FMA) and modified Monte Alegre (FMA+), in the Cerrado-Amazon transition, showed cumulative dependence on the number of days without rain, which could cause prediction errors when lower accumulated precipitation occurs; changes in rainfall regimes and relative humidity are the factors that most interfered with the performance of the indices. The FMA, as well as other fire risk indices that use climate data, is important and effective; however, depending on the study region, there is a need to adjust the danger classes [38].
Through local climate analysis, it is possible to determine the periods with the highest probability of fire occurrence [56,57]. This demonstrates that, when analyzing the influence of climate on fires, it is necessary to understand the behavior of all climatic variables [25,59], since the explanation for the increase or decrease in fires may be related to the set of these variables [56,57]. For this reason, it is important to know the main meteorological variables and their relationships with fires, which increases the efficiency in the analysis of fire danger indices and in the development of mitigation and firefighting plans for forest fires [25,60].
Hot spots, detected by satellite sensors, represent points of high temperature on the Earth's surface, often associated with wildfires and forest fires. The analysis of meteorological indices, together with data on hot spots, allows for more efficient monitoring of the areas of greatest risk, assisting in the planning of preventive strategies and firefighting actions [60]. In the present study, 88% of the hotspots were recorded between July and November, with August standing out as the month with the highest number of occurrences. Of this total, 36% of the hotspots occurred in September and 24% in October, mainly concentrated in the months of August, September, and October (Figure 9). This behavior is directly related to the prevailing climatic conditions during this period, characterized by low relative humidity and high temperatures in the analyzed region. These factors contribute to the increased incidence of hotspots (Figure 2).
Lima [40] also observed that the incidence of hotspots increases in the drier months, with the months of August to November being the most critical between 2016 and 2019 in the state of Pará. However, there is no annual pattern; climatic factors, such as the El Niño phenomenon, should be considered when making decisions about wildfires and forest fires [7,26,29]. In analyzing the hotspots recorded over the years in the study area, it was observed that, from January to May, the hotspots are scattered and have low intensity, justified by humidity, due to the greater availability of rain and relative air humidity, factors that contribute to the spread of fire.
In June, there is a progressive increase in the number of hotspots, which intensifies in the following months. Between July and October, the highest number of records is observed, with significant spatial distribution and high density of hotspots, especially in the south and center of the state of Pará, the north of Mato Grosso, Maranhão and Tocantins, regions that are identified with the highest number of occurrences, which can exceed 50,000 monthly records in some points of these regions. With peak activity in August and September, characterized by the driest months of the severe drought period, when the combination of high temperatures, low humidity, and anthropogenic activities (deforestation and land management with the use of fire) substantially contributes to the spread of fires [7,40,59].
Although parts of the states of Maranhão, Tocantins, and Piauí still show a high concentration of hotspots in the month, there is a reduction compared to previous months, indicating the return of the rains. In December, there is a radical decrease in hotspots, with a distribution close to the beginning of the year, marking the annual closing of the hotspot cycle.
The demonstrated seasonality reinforces the region's vulnerability during the dry season, as well as the need for efficient and rigorous legislation, with continuous monitoring strategies, in order to mitigate the risks of fires and the environmental, social, and economic impacts resulting from vegetation fires. The high concentration of hotspots in this region demonstrates the need for efficient public policies aimed at mitigating deforestation and controlling wildfires, integrating environmental monitoring and enforcement, to preserve natural resources, as well as maintain ecosystem services in the region.
All meteorological parameters varied throughout the analyzed period. The Mann-Whitney test result demonstrated that, although some variables are statistically compatible between the observed (weather stations) and estimated (reanalysis) data, there are significant divergences for different variables and states, which highlights the importance of considering regional characteristics in evaluating the performance of the reanalysis product, since the fidelity of the simulations can present considerable variation, according to the variable and the location studied, as there are periods of the year in which meteorological elements contribute decisively to the occurrence and spread of fire [60].
For all states in the study area, the rainfall variable showed a statistically significant difference, indicating low agreement between the estimated and observed data. This result is consistent with the high RMSE values and the low Willmott indices, which indicate that the estimated rainfall model has low reliability.
In maximum and minimum temperatures, there was greater variation between the states. The maximum temperature (Tmax) showed a significant difference only in the state of Rondônia, while the minimum temperature (Tmin) showed a significant difference in the states of Rondônia, Mato Grosso, and Pará, revealing heterogeneous performance of the model for these variables. As for the average temperature (Tmed), statistically, there was no difference between the states, suggesting that the model has a good capacity to simulate regional temperature averages. Air temperature also influences fires by altering other meteorological elements, such as wind speed and direction and air humidity [61]. Prolonged high temperatures can worsen drought [41,62].
In general, in the analysis of the estimated meteorological data, the ERA5-Land reanalysis data confirm that the months with the highest temperatures in the study area are from August to October; June has the lowest average temperature, and July has the lowest average minimum temperature. Thus, the results demonstrated that reanalysis is viable for estimating air temperature in regions without monitoring stations.
Regarding average relative humidity (Urmed), the states of Pará and Mato Grosso showed statistically significant differences, while minimum relative humidity (RHmin) showed a statistically significant difference only in Rondônia, indicating that the model, despite showing coherence in humidity estimates, is still limited for extreme values in some regions. Rainfall and relative air humidity stand out among the most used meteorological variables, while high temperatures and low relative humidity are key to the ignition of fires [25,59].
In the study area located in the Cerrado-Amazon transition zone, the average wind speed was statistically different between Rondônia and Piauí, while in the other states, the model did not show differences. The average wind speed is higher in August and September, coinciding with the driest months, while the average and minimum relative humidity are low during this period, which increases the risk of fires. Due to the large short-term variation, determining wind behavior is a challenge in fire studies [56,63]. However, due to the low values of the Willmott index, it is observed that the model's performance for the wind variable is almost always unsatisfactory, due to the structural limitations of this variable.
Souto et al. [25] studied fire behavior in the State of Minas Gerais, correlated wind speed with fire variables and other meteorological variables, finding a predominantly positive and significant correlation, and observed that the higher the wind speed, the greater the number of heat spots, since wind is the main element for fire propagation.
Gonçalves and Dias [39] evaluated the correlation between meteorological elements and the number of fire occurrences in the municipality of Jataí, in Goiás, and found, however, a low correlation with wind speed. According to the authors, the non-significance of the correlation between fires and wind speed can be explained by the greater wind movement in the summer; however, during this period, rainfall is frequent, which prevents fires. Furthermore, according to the authors, it cannot be stated that wind does not influence the occurrence of fires, as the analysis applied may not be sufficient to detect this influence [39]. Climatic conditions are responsible for the occurrence and spread of vegetation fires [25,59,60].
The normalization of the data allowed comparisons between variables with different scales, using average values and standard deviation, with the aim of standardizing the data, indicating the ratio between the averages of the observed data (from meteorological stations) and the estimated data (from reanalyses) made it possible to analyze the relative distribution of meteorological variables, through spatialization by categorization, allowing to qualify how close or far the model is from the observed reality at each point in the study area.
The comparison of time series between the averages of variables obtained from meteorological stations and reanalysis data (ERA5-Land), generated from these sources, revealed substantial differences, particularly in the daily average rainfall and the mean bias error (MBE). It was observed that the reanalysis data underestimate the amount of rainfall recorded at the stations, which can be attributed to limitations in the spatial resolution of the sensors and in the calibration of the models. This discrepancy affects the accuracy of climate studies and environmental monitoring, hindering weather forecasts and the modeling of vegetation fire risk. Strategies such as the integration of multiple data sources and adjustments to the models can improve the accuracy of satellite estimates [64].
The results indicated an underestimation of the reanalysis data, evidenced by the fact that the values estimated based on these data were consistently lower than the values recorded at meteorological stations for the same variable. This discrepancy can be attributed to several limitations inherent in the remote sensing estimation process, which cannot always accurately capture the actual amount of rain that reaches the ground, and may include insufficient spatial resolution of satellite sensors and possible inadequacies in the models used for data calibration [62,64]. In addition, meteorological factors and specific environmental characteristics of the analyzed regions may also contribute to the observed difference between in situ measurements and estimates based on reanalysis data.
From a methodological point of view, the underestimation of rainfall data can compromise the accuracy of climate studies, fire hazard studies, and environmental monitoring, directly impacting research related to the forecasting of extreme weather events and the modeling of vegetation fire risk. Thus, it becomes essential to develop strategies that allow improving the accuracy of satellite estimates, such as the integration of multiple data sources, the adjustment of numerical forecasting models and the application of statistical techniques to correct observed biases [64]. It is also important to emphasize that rainfall, relative air humidity and air temperature are the meteorological factors that most influence the moisture content of fuel material and, therefore, must be constantly monitored to determine the danger of forest fires [25].
The study by Moraes et al. [65] used data from the ECMWF reanalysis in the estimation of precipitation and temperature and demonstrated that it is accurate and able to redistribute prediction patterns in the Brazilian Amazon and that the higher concentrations of surface meteorological stations in the eastern/southeastern portion of the Amazon region were decisive for the model's performance. For rainfall, the model data were considered averages, with better values at the weather station, as it determines precipitation in a point-by-point manner, while the ECMWF measurements cover an area of 0.25° x 0.25° [64]. It is concluded that models can be used as a reliable source of data when information from surface stations is not available [64,66].
The use of concise meteorological data is important for the development of a prevention program and for fighting vegetation fires, as well as for making quick and assertive decisions [57,58]. Precipitation and relative humidity stand out among the most used meteorological variables [25], while high temperatures and low relative humidity are key to the ignition of fires [25,60].
The average wind speed showed great variation; however, when observing this heterogeneous distribution, it can be inferred that there is a different behavior of this variable throughout the analyzed territory, which highlights the need for caution in its use in local analyses. This condition may be related to the limitations of reanalysis data in accurately capturing wind dynamics near the surface. These products tend to provide a better representation of the middle and upper layers of the atmosphere. However, local characteristics such as relief, land cover, and surface roughness directly influence wind behavior in the lower layers, which, in reanalysis models, are considered a challenge due to the constraints imposed by the spatial scale used.
5. Conclusions
For the entire study area, the FMA+ and P-EVAP indices stand out for their greater ability to estimate the risk of vegetation fires more accurately and consistently under different climatic conditions, as well as greater agreement and lower errors. The FMA index can be an intermediate alternative, while Angstrom and EVAP/P show high variability, indicating lower reliability, and should be used with caution due to lower accuracy and lower reproducibility in the region. Their efficiency and applicability depend on observations of local and point climatic characteristics for a better response and greater representativeness of these indices. All indices, even the most consistent in the literature, showed variation by season, both in the data obtained on the surface and in the reanalysis.
The P-EVAP index stands out in the study area as a reliable model for predicting fire risk. However, Angstrom is the index with the most limited performance. When comparing the weather station conditions with the reanalysis data, it is observed that the reanalysis data tend to present slightly superior results, except for EVAP-P, which showed a slight reduction. The choice of the ideal method depends on the specific characteristics of each weather station.
The results demonstrated that the ERA5 Land reanalysis data are reliable and can be used when there is no data from local weather stations.
Given the observed local climatic conditions and their variation throughout the area, our study highlights the importance of using indices capable of performing a fire hazard assessment based on models that utilize climatic variables such as rainfall, temperature, relative humidity, and wind, derived from weather stations or reanalysis, thus contributing to fire prevention and control.
Thus, the application of indices that enable the fight against fire events not only in the transition zone, but also throughout the Amazon and Cerrado ecotone, considering the similar climatic characteristics, is crucial. Furthermore, it is necessary to emphasize that preserving these areas and monitoring them, based on a proposed fire hazard assessment, can contribute to the development of targeted public policies with short- and long-term actions, as well as global actions aimed at reducing greenhouse gas emissions.
Supplementary Materials
The following supporting information can be downloaded at website of this paper posted on Preprints.org, Tables 12 to 20 – show the behavior of the residuals of the Hg estimates by the empirical models (EM, FAN and CHEN) and by the machine learning techniques SVM.
Author Contributions
Conceptualization, A.P.S.; methodology, L.S.B., D.C., D.R.B. and A.P.S.; software, D.C. and R.S.D.P.; validation, D.R.B. and A.P.S.; formal analysis, L.S.B. and D.C.; investigation, L.S.B., D.C., D.R.B. and A.P.S.; resources, L.S.B., D.C., R.S.D.P., D.R.B. and A.P.S.; data curation, L.S.B. and A.P.S.; writing—original draft preparation, L.S.B. and D.C.; writing—review and editing, D.R.B. and A.P.S.; visualization, R.S.D.P., D.R.B. and A.P.S.; supervision, A.P.S.; project administration, A.P.S.; funding acquisition, A.P.S. All authors have read and agreed to the published version of the manuscript.
Funding
This research was funded by Coordenação de Aperfeiçoamento de Pessoal de Nível Superior – Brazil (CAPES) – Finance Code 001; The National Council for Scientific and Technological Development (CNPq) - Process 308784/2019-7; and the Foundation for Research Support of Mato Grosso State (FAPEMAT) - Research Project Process 0182944/2017.
Institutional Review Board Statement
Not applicable.
Informed Consent Statement
Not applicable.
Data Availability Statement
Databases used in this study can be accessed by the Instituto Nacional de Meteorologia (INMET) databanks website: i) https://portal.inmet.gov.br/paginas/catalogoaut for automatic weather stations; ii) https://portal.inmet.gov.br/paginas/catalogoman for the conventional weather stations (accessed on 01 Feb 2024).
Acknowledgments
The authors also thank all the students of the Tecnologia em Recursos Hídricos no Centro-Oeste” research group (dgp.cnpq.br/dgp/espelhogrupo/2399343537529589, accessed on 15 January 2026).
Conflicts of Interest
The authors declare no conflicts of interest. The funders had no role in the study's design, data collection, analysis, or interpretation, manuscript writing, or decision to publish the results.
References
- Marques, E.Q.; Marimon-Junior, B.H.; Marimon, B.S.; Matricardi, E.A.T.; Mews, H.A.; Colli, G.R. Redefining the Cerrado–Amazonia Transition: implications for conservation. Biodiversity and Conservation 2020, 29, 1501–1517, . [CrossRef]
- Marimon, B.S.; Marimon-Junior, B.H.; Feldpausch, T.R.; Oliveira-Santos, C.; Mews, H.A.; Lopez-Gonzalez, G.; Lloyd, J.; Franczak, D.D.; de Oliveira, E.A.; Maracahipes, L.; Miguel, A.; Lenza, E.; Phillips, O.L. Disequilibrium and Hyperdynamic Tree Turnover at the Forest–Cerrado Transition Zone in Southern Amazonia. Plant Ecology & Diversity 2014, 7, 281–292, . [CrossRef]
- Lapola, D.M.; Pinho, P.; Barlow, J.; Aragão, L.E.; Berenguer, É.; Carmenta, R.; Liddy, H.M.; Seixas, H.; Silva, C.V.; Silva-Junior, C.H.L.; et al. The Drivers and impacts of Amazon Forest degradation. Science 2023, 379, eabp8622, . [CrossRef]
- Oliveira, U.; Soares-Filho, B.; Bustamante, M.; Gomes, L.; Ometto, J.P.; Rajão, R. Determinants of fire impact in the Brazilian biomes. Frontiers in Forest Global Change 2022, 5, e735017. [CrossRef]
- Brando, P.M.; Balch, J.K.; Nepstad, D.C.; Morton, D.C.; Putz, F.E.; Coe, M.T.; Silvério, D.; Macedo, M.N.; Davidson, E.A.; Nóbrega, C.C.; Alencar, A.; Soares-Filho, B.S. Abrupt increases in Amazonian Tree mortality due to drought–fire interactions. Proceedings of the National Academy of Sciences 2014, 111, 6347–6352, . [CrossRef]
- Marengo, J.A.; Jimenez, J.C.; Espinoza, J.-C.; Cunha, A.P.; Aragão, L.E.O. Increased climate pressure on the agricultural frontier in the Eastern Amazonia–Cerrado Transition Zone. Sci Rep 2022, 12, e457, . [CrossRef]
- Silva-Junior, C.H.L.; Buna, A.T.M.; Bezerra, D.S.; Costa, O.S.; Santos, A.L.; Basson, L.O.D.; Santos, A.L.S.; Alvarado, S.T.; Almeida, C.T.; Freire, A.T.G.; Rousseau, G.X.; Celentano, D.; Silva, F.B.; Pinheiro, M.S.S.; Amaral, S.; Kampel, M.; Vedovato, L.B.; Anderson, L.O.; Aragão, L.E.O.C. Forest Fragmentation and Fires in the Eastern Brazilian Amazon–Maranhão State, Brazil. Fire 2022, 5, e77, . [CrossRef]
- Lima, C.F.; Torres, F.T.P.; Minette, L.J.; Lima, F.A.; Lima, R.C.A.; Sato, M.K.; Silva, A.A.; Schettini, B.L.S.; Ferreira, F. de A.C.; Machado, M.X.L. Is there a relationship between forest fires and deforestation in the Brazilian Amazon? Plos One 2024, 19, e0306238, . [CrossRef]
- Tavares, P.A.; Ferreira, J.; Silva, C.V.J.; Berenguer, E.; Barlow, J. Exploring the role of deforestation and cropland expansion in driving a fire-transition in the Brazilian Amazon. Land 2022, 11, e2274, . [CrossRef]
- Pivello, V.R. The use of fire in the Cerrado and Amazonian Rainforests of Brazil: past and present. Fire Ecology 2011, 7, 24–39, . [CrossRef]
- Barlow, J.; Berenguer, E.; Carmenta, R.; França, F. Clarifying Amazonia’s Burning Crisis. Global Change Biology 2020, 26, 319–321, . [CrossRef]
- Libonati, R.; Pereira, J.M.C.; Da Camara, C.C.; Peres, L.F.; Oom, D.; Rodrigues, J.A.; Santos, F.L.M.; Trigo, R.M.; Gouveia, C.M.P.; Machado-Silva, F.; Enrich-Prast, A.; Silva, J.M.N. Twenty-first century droughts have not increasingly exacerbated fire season severity in the Brazilian Amazon. Sci Rep 2021, 11, e4400, . [CrossRef]
- Cano-Crespo, A.; Oliveira, P.J.C.; Boit, A.; Cardoso, M.; Thonicke, K. Forest Edge burning in the Brazilian Amazon Promoted by escaping fires from managed pastures. Journal of Geophysical Research: Biogeosciences 2015, 120, 2095–2107, . [CrossRef]
- Salame, C.W.; Queiroz, J.C.B.; de Miranda Rocha, G.; Amin, M.M.; da Rocha, E.P. Use of spatial regression models in the analysis of burnings and deforestation occurrences in the Forest Region, Amazon, Brazil. Environmental Earth Sciences 2016, 75, e274, . [CrossRef]
- Silva, C.F.A.; Alvarado, S.T.; Santos, A.M.; Andrade, M.O.; Melo, S.N. Highway Network and Fire Occurrence in Amazonian Indigenous Lands. Sustainability 2022, 14, e9167, . [CrossRef]
- Hoki, V. de S.P.; Sanches, L.; Junior, G.N.R.C.; Junior, O.B.P. Analysis of heat sources in different areas of influence of the BR-242 highway in the Nova Ubiratã-MT, Brazil. Nativa 2023, 9, 129–134, . [CrossRef]
- Ribeiro, A.F.S.; Santos, L.; Randerson, J.T.; Uribe, M.R.; Alencar, A.A.C.; Macedo, M.N.; Morton, D.C.; Zscheischler, J.; Silvestrini, R.A.; Rattis, L.; Seneviratne, S.I.; Brando, P.M. The Time since land-use transition drives changes in fire activity in the Amazon-Cerrado Region. Communications Earth & Environment 2024, 5, e96, . [CrossRef]
- Roces-Díaz, J.; Santín, C.; Martínez-Vilalta, J.; Doerr, S.H. A global synthesis of fire effects on ecosystem services of forests and woodlands. Frontiers in Ecology and the Environment 2022, 20, 170–178, . [CrossRef]
- Pereira, P.; Bogunovic, I.; Zhao, W.; Barcelo, D. Short-Term effect of wildfires and prescribed fires on ecosystem services. Current Opinion in Environmental Science & Health 2021, 22, e100266, . [CrossRef]
- Kelly, L.T.; Giljohann, K.M.; Duane, A.; Aquilué, N.; Archibald, S.; Batllori, E.; Bennett, A.F.; Buckland, S.T.; Canelles, Q.; Clarke, M.F.; et al. Fire and biodiversity in the anthropocene. Science 2020, 370, eabb0355, . [CrossRef]
- de Moura, F.R.; Machado, P.D.W.; Ramires, P.F.; Tavella, R.A.; Carvalho, H.; da Silva Júnior, F.M.R. In the Line of Fire: Analyzing Burning impacts on air pollution and air quality in an Amazonian City, Brazil. Atmospheric Pollution Research 2024, 15, e102033, . [CrossRef]
- Silva, P.S.; Libonati, R.; Schmidt, I.B.; Nogueira, J.; DaCamara, C.C. Climate Change and Fire: The Case of Cerrado, the Brazilian Savanna. In: Climate Change and Regional Socio-Economic Systems in the Global South: Resilience Strategies for Sustainable Development; Mishra, M., de Lucena, A.J., Maharaj, B., Eds.; Springer Nature: Singapore, 2024; pp. 87–105.
- Santana, M.M.M. de; Vasconcelos, R.N. de; Mariano-Neto, E. Fire Propensity in Amazon Savannas and rainforest and effects under Future climate change. International Journal of Wildland Fire 2022, 32, 149–163, . [CrossRef]
- Pinto, D.L.; Spletozer, A.G.; Barbosa, S.G.; Lima, G.S.; Torres, C.M.M.E.; Torres, F.T.P. Periods of highest occurrence of forest fires in Brazil. Floresta 2021, 51, 484–491, . [CrossRef]
- Souto, C.A.; Freitas, A.C.V.; Martins, G. Influence of current and future meteorological conditions on the occurrence of burnings and forest fires in the State of Minas Gerais. Revista Brasileira de Geografia Física 2021, 14, 2755–2770, . [CrossRef]
- Aragão, M. de A.; Fiedler, N.C.; Ramalho, A.H.C.; Menezes, R.A.S.; Silva, E.C.G. da; Juvanhol, R.S.; Biazatti, L.D.; Silva, E.F. da; Pereira, R.S.; Guanaes, G.M. da S.; Lucas, F.M.F. Risk of Forest fires occurrence on a Transition Island Amazon-Cerrado: where to act? Forest Ecology and Management 2023, 536, e120858, . [CrossRef]
- de Andrade, C.F.; Delgado, R.C.; Barbosa, M.L.F.; Teodoro, P.E.; Junior, C.A. da S.; Wanderley, H.S.; Capristo-Silva, G.F. Fire Regime in Southern Brazil Driven by atmospheric variation and vegetation cover. Agricultural and Forest Meteorology 2020, 295, e108194, . [CrossRef]
- Singh, M.; Zhu, X. Analysis of how the spatial and temporal patterns of fire and their bioclimatic and anthropogenic drivers vary across the Amazon Rainforest in El Niño and Non-El Niño years. PeerJ 2021, 9, e12029, . [CrossRef]
- Barni, P.E.; Rego, A.C.M.; Silva, F. das C.F.; Lopes, R.A.S.; Xaud, H.A.M.; Xaud, M.R.; Barbosa, R.I.; Fearnside, P.M. Logging Amazon Forest increased the severity and spread of fires during the 2015–2016 El Niño. Forest Ecology and Management 2021, 500, e119652, . [CrossRef]
- Oliveira, U.; Soares-Filho, B.; Bustamante, M.; Gomes, L.; Ometto, J.P.; Rajão, R. Determinants of fire impact in the Brazilian Biomes. Frontiers in Forest Global Change 2022, 5, e735017, . [CrossRef]
- Soares, R.V.; Batista, A.C. Forest fires: control, effects and use of fire. FUPEF: Curitiba, 2007; 264p.
- Torres, F.T.P.; Roque, M.P.B.; Lima, G.S.; Martins, S.V.; Faria, A.L.L. de Mapeamento do risco de incêndios florestais utilizando técnicas de geoprocessamento. Floresta & Ambiente 2017, 24, e25615, . [CrossRef]
- de Andrade, A.S.R.; Ramos, R.M.; Sano, E.E.; Libonati, R.; Santos, F.L.M.; Rodrigues, J.A.; Giongo, M.; da Franca, R.R.; Laranja, R.E. de P. Implementation of fire policies in Brazil: an assessment of fire dynamics in Brazilian Savanna. Sustainability 2021, 13, e11532, . [CrossRef]
- Cheney, N.; Gould, J. Fire growth in grassland fuels. International Journal of Wildland Fire 1995, 5, 237–247, . [CrossRef]
- Nunes, J.R.S.; Soares, R.V.; Batista, A.C. FMA+ - A new forest fire hazard index for the state of Paraná, Brazil. Revista Floresta 2006, 36(1), 75-91, . [CrossRef]
- de Sousa, J.A.P.; do Nascimento Lopes, E.R.; Duarte, M.L.; Ewbank, H.; Lourenço, R.W. Forest Fire Risk Indicator (FFRI) Based on Geoprocessing and Multicriteria Analysis. Natural Hazards 2022, 114, 2311–2330, . [CrossRef]
- Torres, F.T.P.; Ribeiro, G.A. Efficiency of indices of risk of forest fire in Juiz de Fora/MG. Floresta e Ambiente 2008, 15(2), 24-34.
- Casavecchia, B.H.; Souza, A.P. de; Stangerlin, D.M.; Uliana, E.M.; Melo, R.R. Fire danger indices in the transition area of Cerrado-Amazônia. Revista de Ciências Agrárias 2019, 42, 842–854, . [CrossRef]
- Gonçalves, D.M.; Dias, D.P. Efficiency of five fire risk index for Jataí - GO. Scientia Forestalis 2020, 48(127), e3362,. [CrossRef]
- Lima, M.B.; Costa, G.B.; Pereira, W. dos S.; Silva, D.T.C. da; Matias, L.V. dos S.; Macambira, A.C. da S.; Heidemann, M. de A.; Almada, N.B. Seasonal aspects of a forest fire risk index in Northern Brazil using meteorological data. Biodiversidade Brasileira 2021, 11, 46–59, . [CrossRef]
- Delgado, R.C.; Wanderley, H.S.; Pereira, M.G.; Almeida, A.Q. de; Carvalho, D.C. de; Lindemann, D. da S.; Zonta, E.; Menezes, S.J.M. da C. de; Santos, G.L. dos; Santana, R.O. de; et al. Assessment of a new fire risk index for the Atlantic Forest, Brazil. Forests 2022, 13, e1844, . [CrossRef]
- Corrêa, T.R.; Souza, L.M. de; Cabral, D.F. de O.; Júnior, S.M.B.; Tavares, A.P.C.; Dias, D.P. Forest fire risk indexes in five municipalities with different meteorological characteristics. Nativa 2024, 12, 118–123, . [CrossRef]
- Silva, W.C. da; Souza, A.P.; Jasper, A. Vegetation fires and hydroclimatic relationships in watersheds in southeastern Amazonia. Revista Brasileira de Geografia Física 2024, 17, 4206–4228, . [CrossRef]
- Santos Junior, E.P. dos; Blain, G.C.; Xavier, A.C.F. On the suitability of data from the Climatic Research Unit (CRU) and 5th Generation of European Reanalysis (ERA5) for monitoring drought events under a probabilistic framework. Rev. bras. meteorol. 2022, 37, 243–260, . [CrossRef]
- Muñoz-Sabater, J.; Dutra, E.; Agustí-Panareda, A.; Albergel, C.; Arduini, G.; Balsamo, G.; Boussetta, S.; Choulga, M.; Harrigan, S.; Hersbach, H.; Martens, B.; Miralles, D.G.; Piles, M.; Rodríguez-Fernández, N.J.; Zsoter, E.; Buontempo, C.; Thépaut, J.N. ERA5-Land: A State-of-the-Art Global Reanalysis Dataset for Land Applications. Earth System Science Data 2021, 13, 4349–4383, . [CrossRef]
- Allen, R.G.; Pereira, L.S.; Raes, D.; Smith, M. Crop Evapotranspiration: Guidelines for Computing Crop Water Requirements. Rome: FAO - Food and Agriculture Organization of the United Nations. 1998. Available at: https://www.fao.org/4/x0490e/x0490e00.htm (accessed on 15 Feb 2026).
- Santos, S.R.Q. dos; Braga, C.C.; Santos, A.P.P. dos; Campos, T.L. de O.B.; Brito, J.I.B. de Classificação de eventos extremos de precipitação em múltiplas escalas de tempo em Belém-PA: utilizando o índice de precipitação normalizada. Revista Brasileira de Geografia Física 2014, 7, 628–635, . [CrossRef]
- Sabino, M.; Souza, A.P. de; Almeida, F.T. de; Zolin, C.A.; Lisboa, L. Disaggregation of daily rainfall in the state of Mato Grosso. Revista Brasileira de Meteorologia 2022, 37, 427–439, . [CrossRef]
- Souza, A.P.; Mota, L.L.; Zamadei, T.; Martin, C.C.; Almeida, F.T.; Paulino, J. Climate classification and climatic water balance in Mato Grosso state, Brazil. Nativa 2013, 1, 34–43, . [CrossRef]
- Soares, R.V. Perfil dos incêndios florestais no Brasil, de 1983 a 1987. Floresta 1984, 58, 31–42.
- Souza, A.P.; Casavecchia, B.H.; Stangerlin, D.M. AAssessment of the risks of forest fires in the North and Northwest regions of the Amazon in Mato Grosso. Scientia Plena 2012, 8, e059904.
- Camargo, Â.P. de; Marin, F.R.; Sentelhas, P.C.; Picini, A.G. Adjustment of the Thornthwaite equation to estimate potential evapotranspiration in arid and superhumid climates, based on daily temperature range. Revista Brasileira de Agrometeorologia 1999, 7, 251–257.
- Tanaka, A.A.; Souza, A.P. de; Klar, A.E.; Silva, A.C. da; Gomes, A.W.A. Reference evapotranspiration estimated with simplified models for the state of the Mato Grosso, Brazil. Pesquisa Agropecuária Brasileira 2016, 51(2), 91–104, . [CrossRef]
- Willmott, C.J. Some Comments on the evaluation of model performance. Bulletin of the American Meteorological Society 1982, 63(11), 1309-1313. [CrossRef]
- Mabude, K.; Malela-Majika, J.C.; Castagliola, P.; Shongwe, S.C. Distribution-Free Mixed GWMA-CUSUM and CUSUM-GWMA Mann–Whitney charts to monitor unknown shifts in the process location. Communications in Statistics - Simulation and Computation 2022, 51, 6667–6690, . [CrossRef]
- Ramalho, A.H.C.; Silva, E.F. da; Silva, J.P.M.; Fiedler, N.C.; Maffioletti, F.D.; Biazatti, L.D.; Moreira, T.R.; Juvanhol, R.S.; Santos, A.R. dos. Allocation of Water reservoirs to fight forest fires according to the risk of occurrence. Journal of Environmental Management 2021, 296, e113122, . [CrossRef]
- Sari, F. Forest fire susceptibility mapping via multi-criteria decision analysis techniques for Mugla, Turkey: a comparative analysis of VIKOR and TOPSIS. Forest Ecology and Management 2021, 480, e118644, . [CrossRef]
- Beu, C.M.L. Modified Monte Alegre Formula applied to the Flona Ipanema data, MERRA-2 and remote sensing products. Revista Brasileira de Climatologia 2022, 31, 857–878, . [CrossRef]
- Alves, J.M.B.; da Silva, E.M.; de Araújo, F.C.; da Silva, L.L. A Study of heat outputs in the Caatinga biome and its relationships with meteorological variables. Revista Brasileira de Meteorologia 2021, 36, 513–527, . [CrossRef]
- Vicente-Serrano, S.M.; Quiring, S.M.; Peña-Gallardo, M.; Yuan, S.; Domínguez-Castro, F. A Review of environmental droughts: increased risk under global warming? Earth-Science Reviews 2020, 201, e102953, . [CrossRef]
- Fiedler, N.C.; Lacerda, G.R.; Ramalho, A.H.C.; Berude, L.C.; das Neves, F.P.; Rodrigues, C.K. Firefighting combat with fire retardants at different concentrations. Floresta 2020, 50, 1107–1112, . [CrossRef]
- Xu, X.; Jia, G.; Zhang, X.; Riley, W.J.; Xue, Y. Climate regime shift and forest loss amplify fire in Amazonian Forests. Global Change Biology 2020, 26, 5874–5885, . [CrossRef]
- Cachoeira, J.N.; da Silva, A.D.P.; Souza Júnior, M.R.; Batista, A.C.; Giongo, M.; Ganassoli Neto, E.; Batista, D.B. Prediction of the Variables of fire behavior at Sensu Stricto Cerrado in Southern Tocantins. Advances in Forestry Science 2020, 7(2), 939–946, . [CrossRef]
- Pampuch, L.A.; Negri, R.G.; Loikith, P.C.; Bortolozo, C.A. A Review on clustering methods for climatology analysis and its application over South America. International Journal of Geosciences 2023, 14, 877-894. [CrossRef]
- de Moraes, J.R. da S.C.; Rolim, G. de S.; Martorano, L.G.; Aparecido, L.E. de O.; Bispo, R.C.; Valeriano, T.T.B.; Esteves, J.T. Performance of the ECMWF in Air temperature and precipitation estimates in the Brazilian Amazon. Theoretical and Applied Climatology 2020, 141, 803–816, . [CrossRef]
- Galvao, W.F.; Querino, C.A.S.; de Souza, A.L.; da Silva, J.K.A.; Moura, M.A.L.; Alves, L.S.; Gomes, B. Validation of Global Solar Radiation from ERA5-Land for the Municipality of Humaitá-Amazonas. E&S Engineering and Science 2024, 13, 1–9, . [CrossRef]
Figure 1.
Representation of the 200 km buffer zone from the Cerrado-Amazon transition zone (considered the study area) and the location of the evaluated conventional and automatic weather stations.
Figure 1.
Representation of the 200 km buffer zone from the Cerrado-Amazon transition zone (considered the study area) and the location of the evaluated conventional and automatic weather stations.
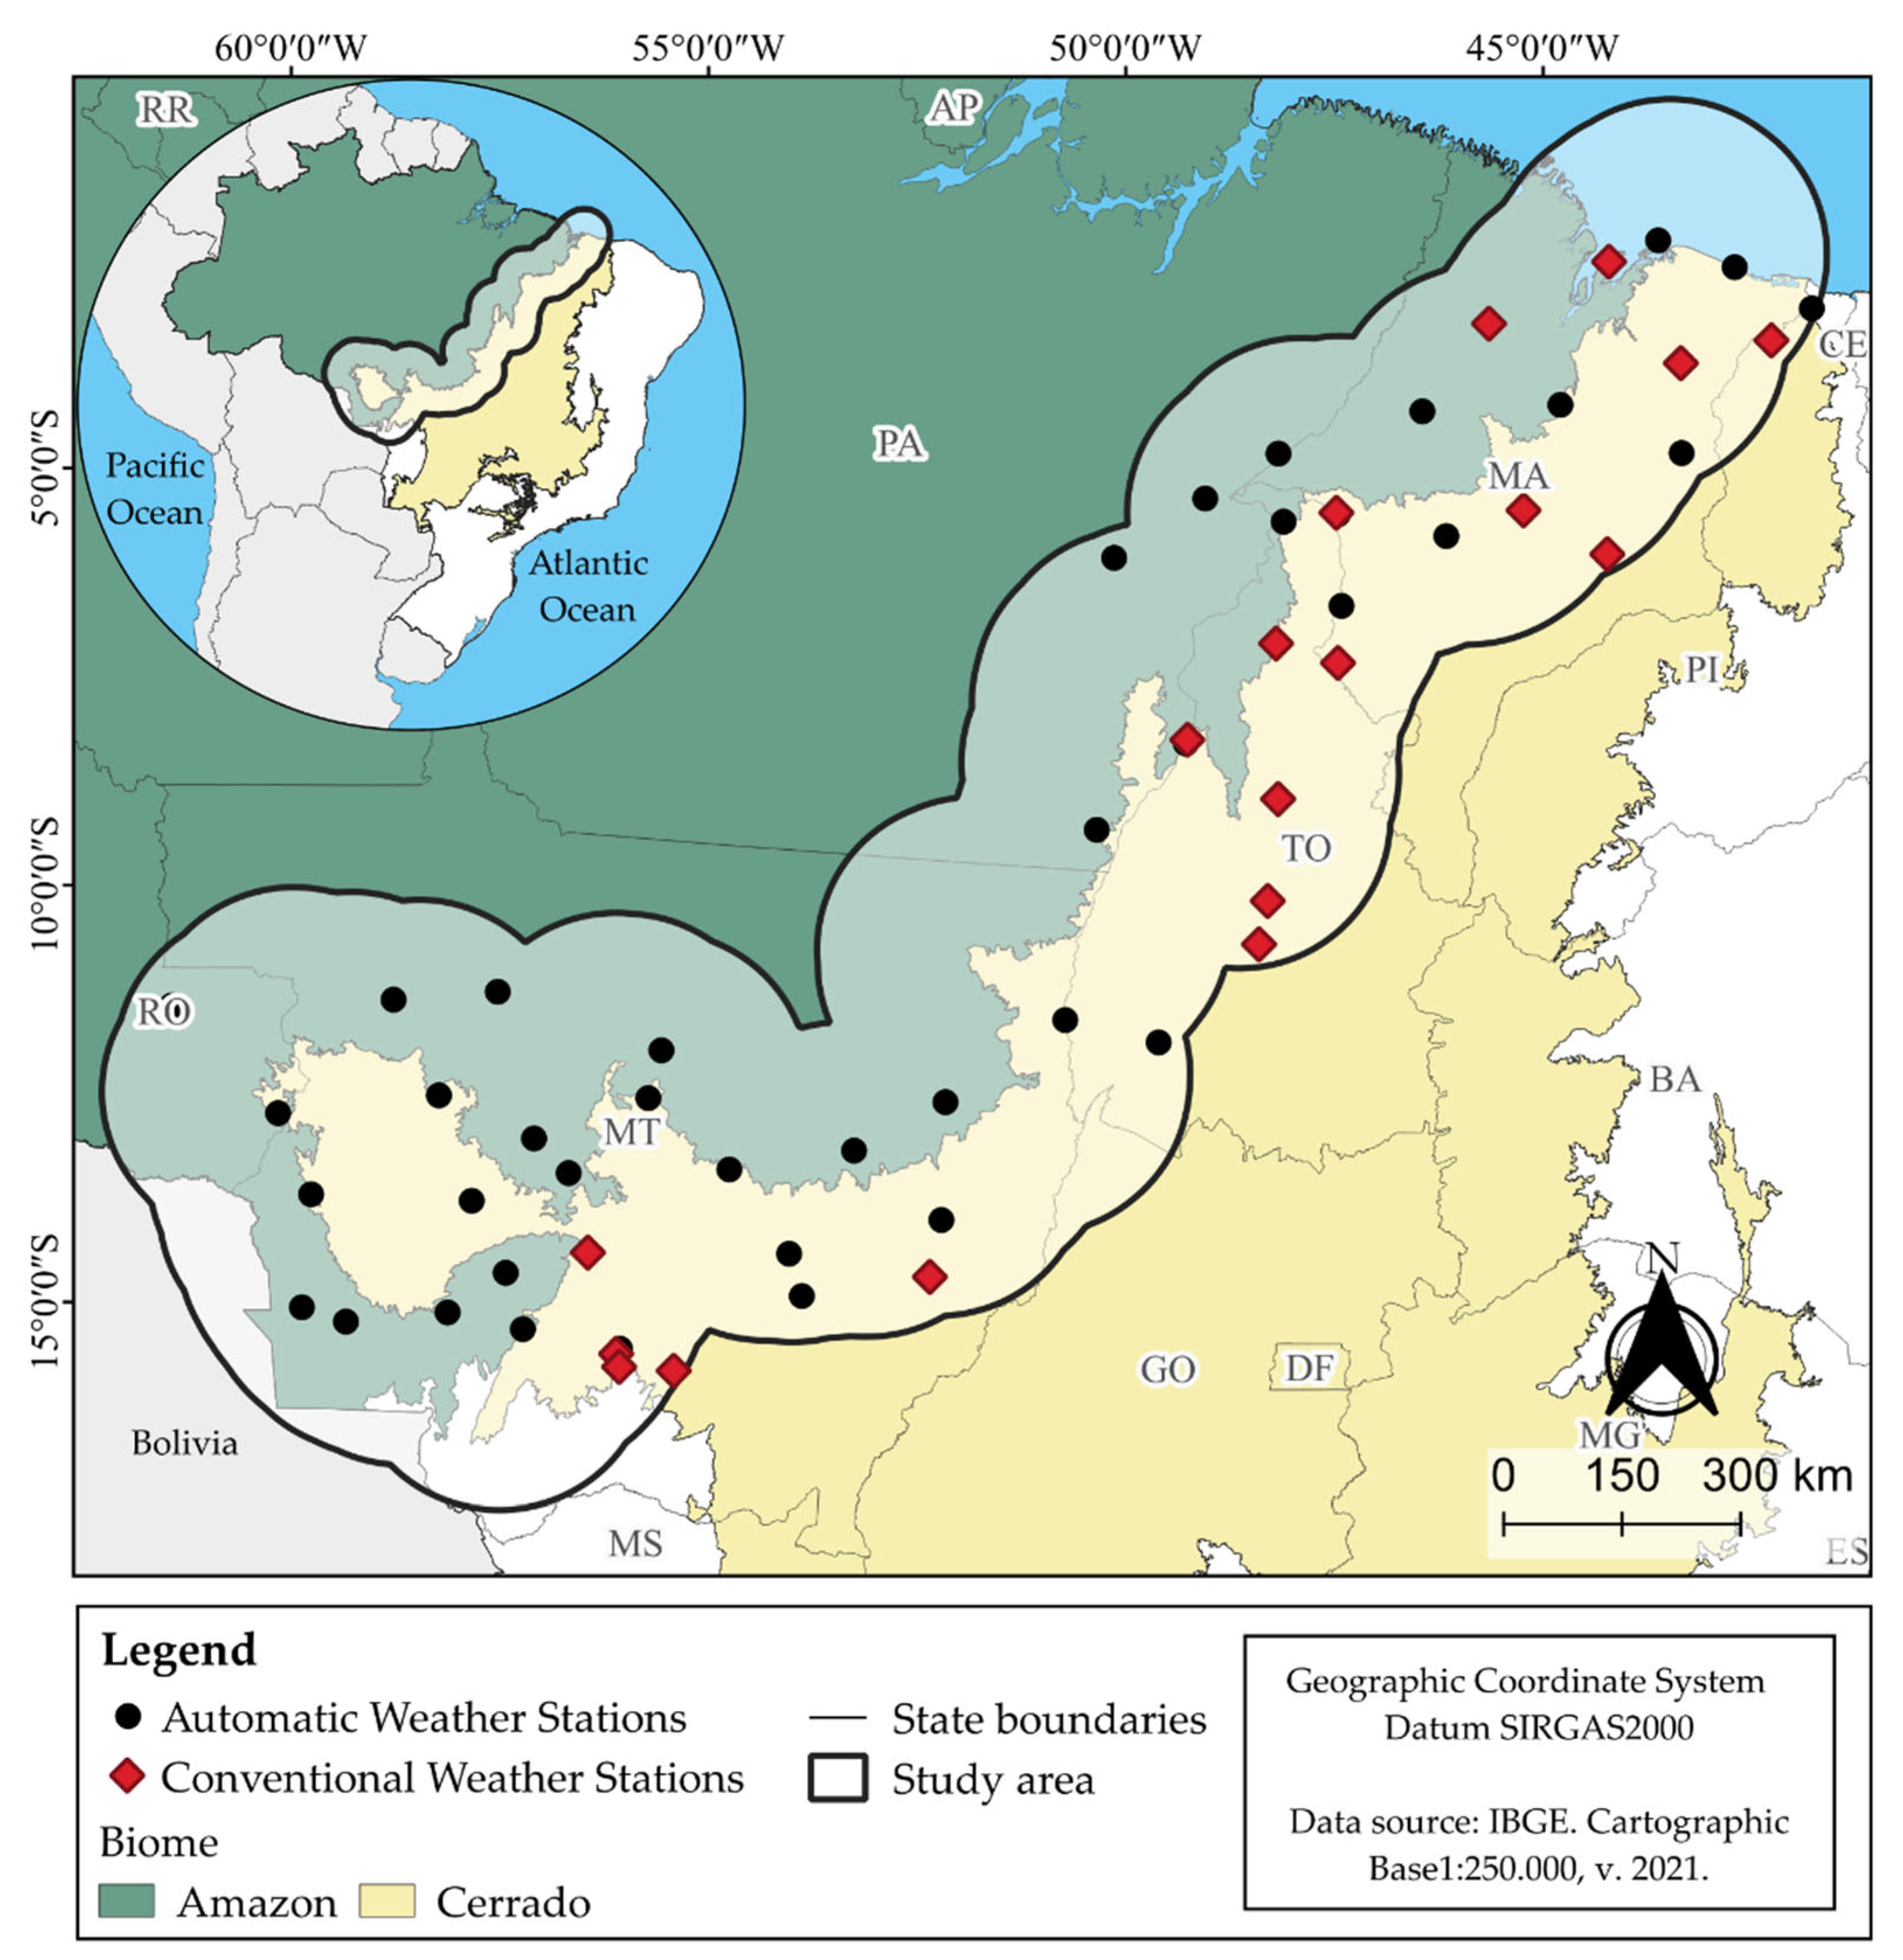
Figure 2.
Meteorological variables throughout the year measured at meteorological stations in the Cerrado-Amazon transition zone, from 2010 to 2020: (A) total monthly rainfall, (B) daily maximum air temperature, (C) daily average air temperature, (D) daily minimum air temperature, (E) daily average relative humidity, (F) daily minimum relative humidity, and (G) daily average wind speed – 2.0 m height. The box in the Boxplot represents the interquartile range; the line inside the box is the median; the stems are the lower and upper limits; the points outside the box are the outliers; and the point inside is the mean.
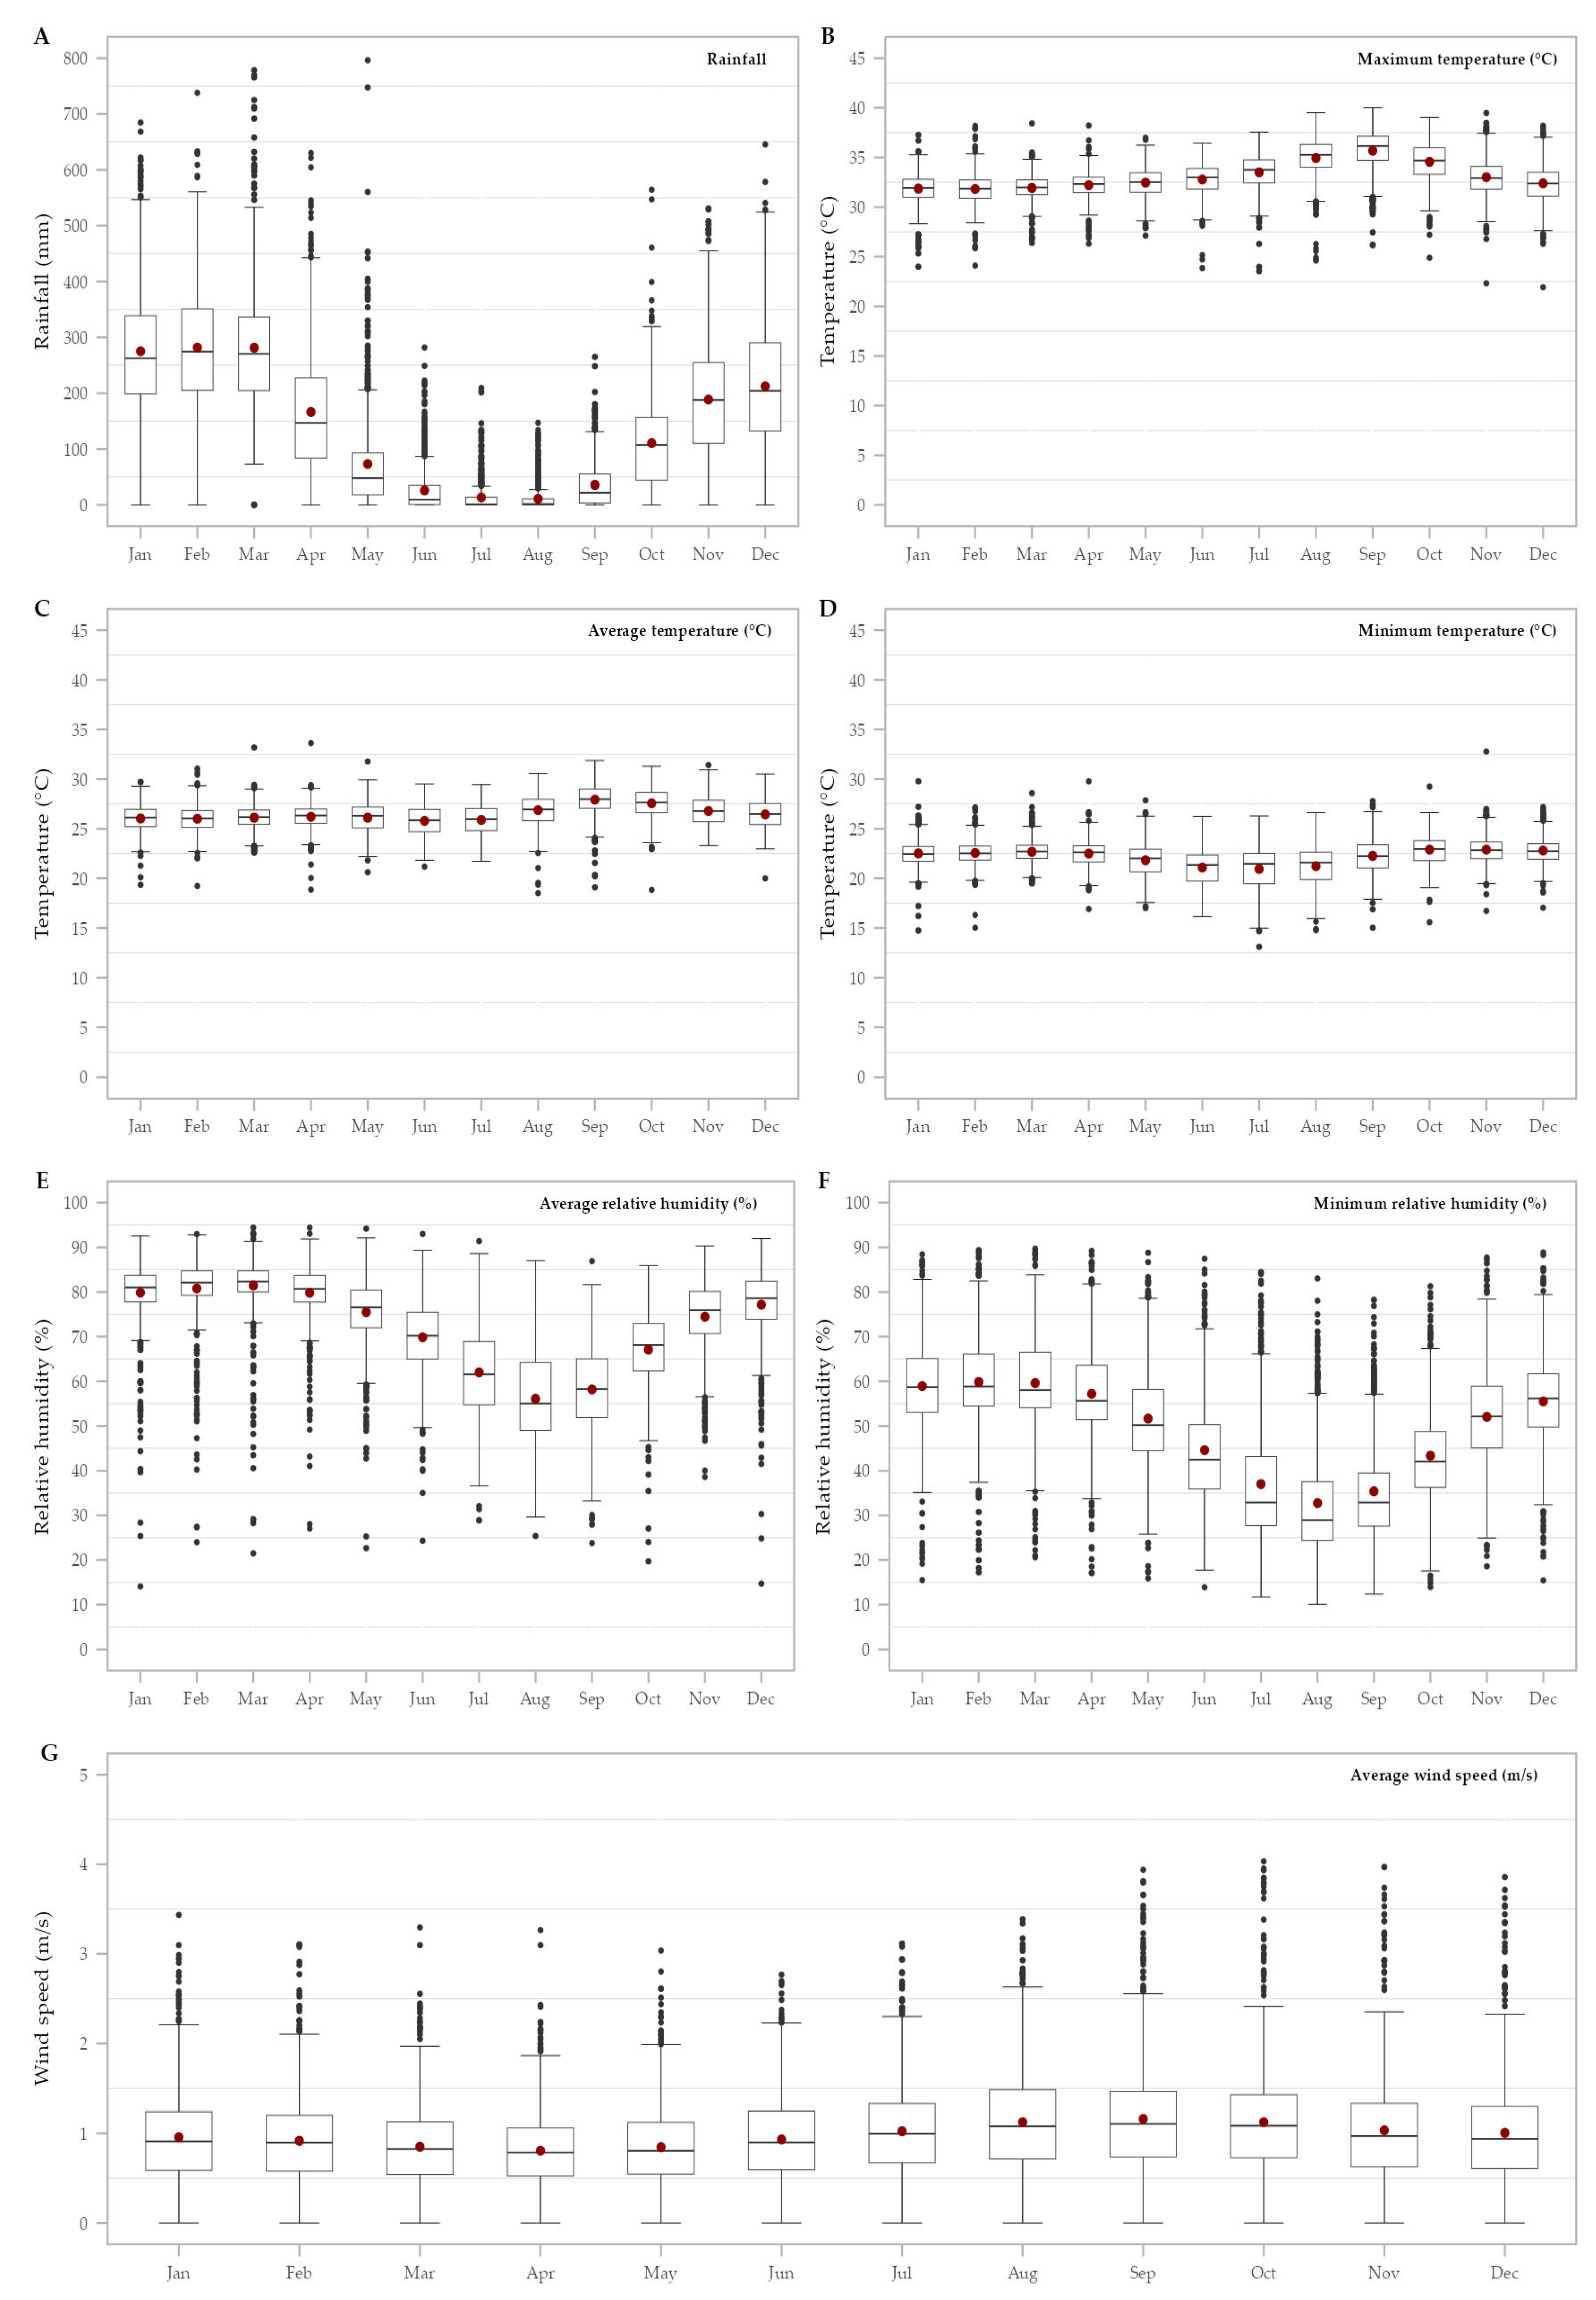
Figure 3.
Observed spatial variation (OSMV) of meteorological elements (average annual total rainfall; average daily maximum, average and minimum temperatures) and statistical indicators Mean Bias Error (MBE), Root Mean Square Error (RMSE) and Willmott's index of agreement, between data measured at meteorological stations (INMET) and reanalysis (ERA5 Land), in the Cerrado-Amazon transition, from 2010 to 2022. Represented by symbols (circles and triangles). The reference is the data measured at meteorological stations and for the interpretation of the statistical indices, we have: i) MBE - circles represent values from 0.99 to -0.99, considered perfect; red triangle, values of 1 > 20%, indicate underestimation; and the inverted triangle, blue color, values of -1 < -35% overestimation; ii) RMSE, the color variation from yellow to red (0 to 20 excellent dispersion; 20 to 60 moderate dispersion; 60 to 100 large spread of errors); iii) Willmott's d, varies on a scale of 0 to 1 from yellow to red (0.9 to 1.0 excellent; 0.8 to 0.9 very good; 0.7 to 0.8 good; 0.5 to 0.7 fair, and < 0.5 poor). *The acronym OVMS refers to Observed Spatial Variability in Weather Station Data
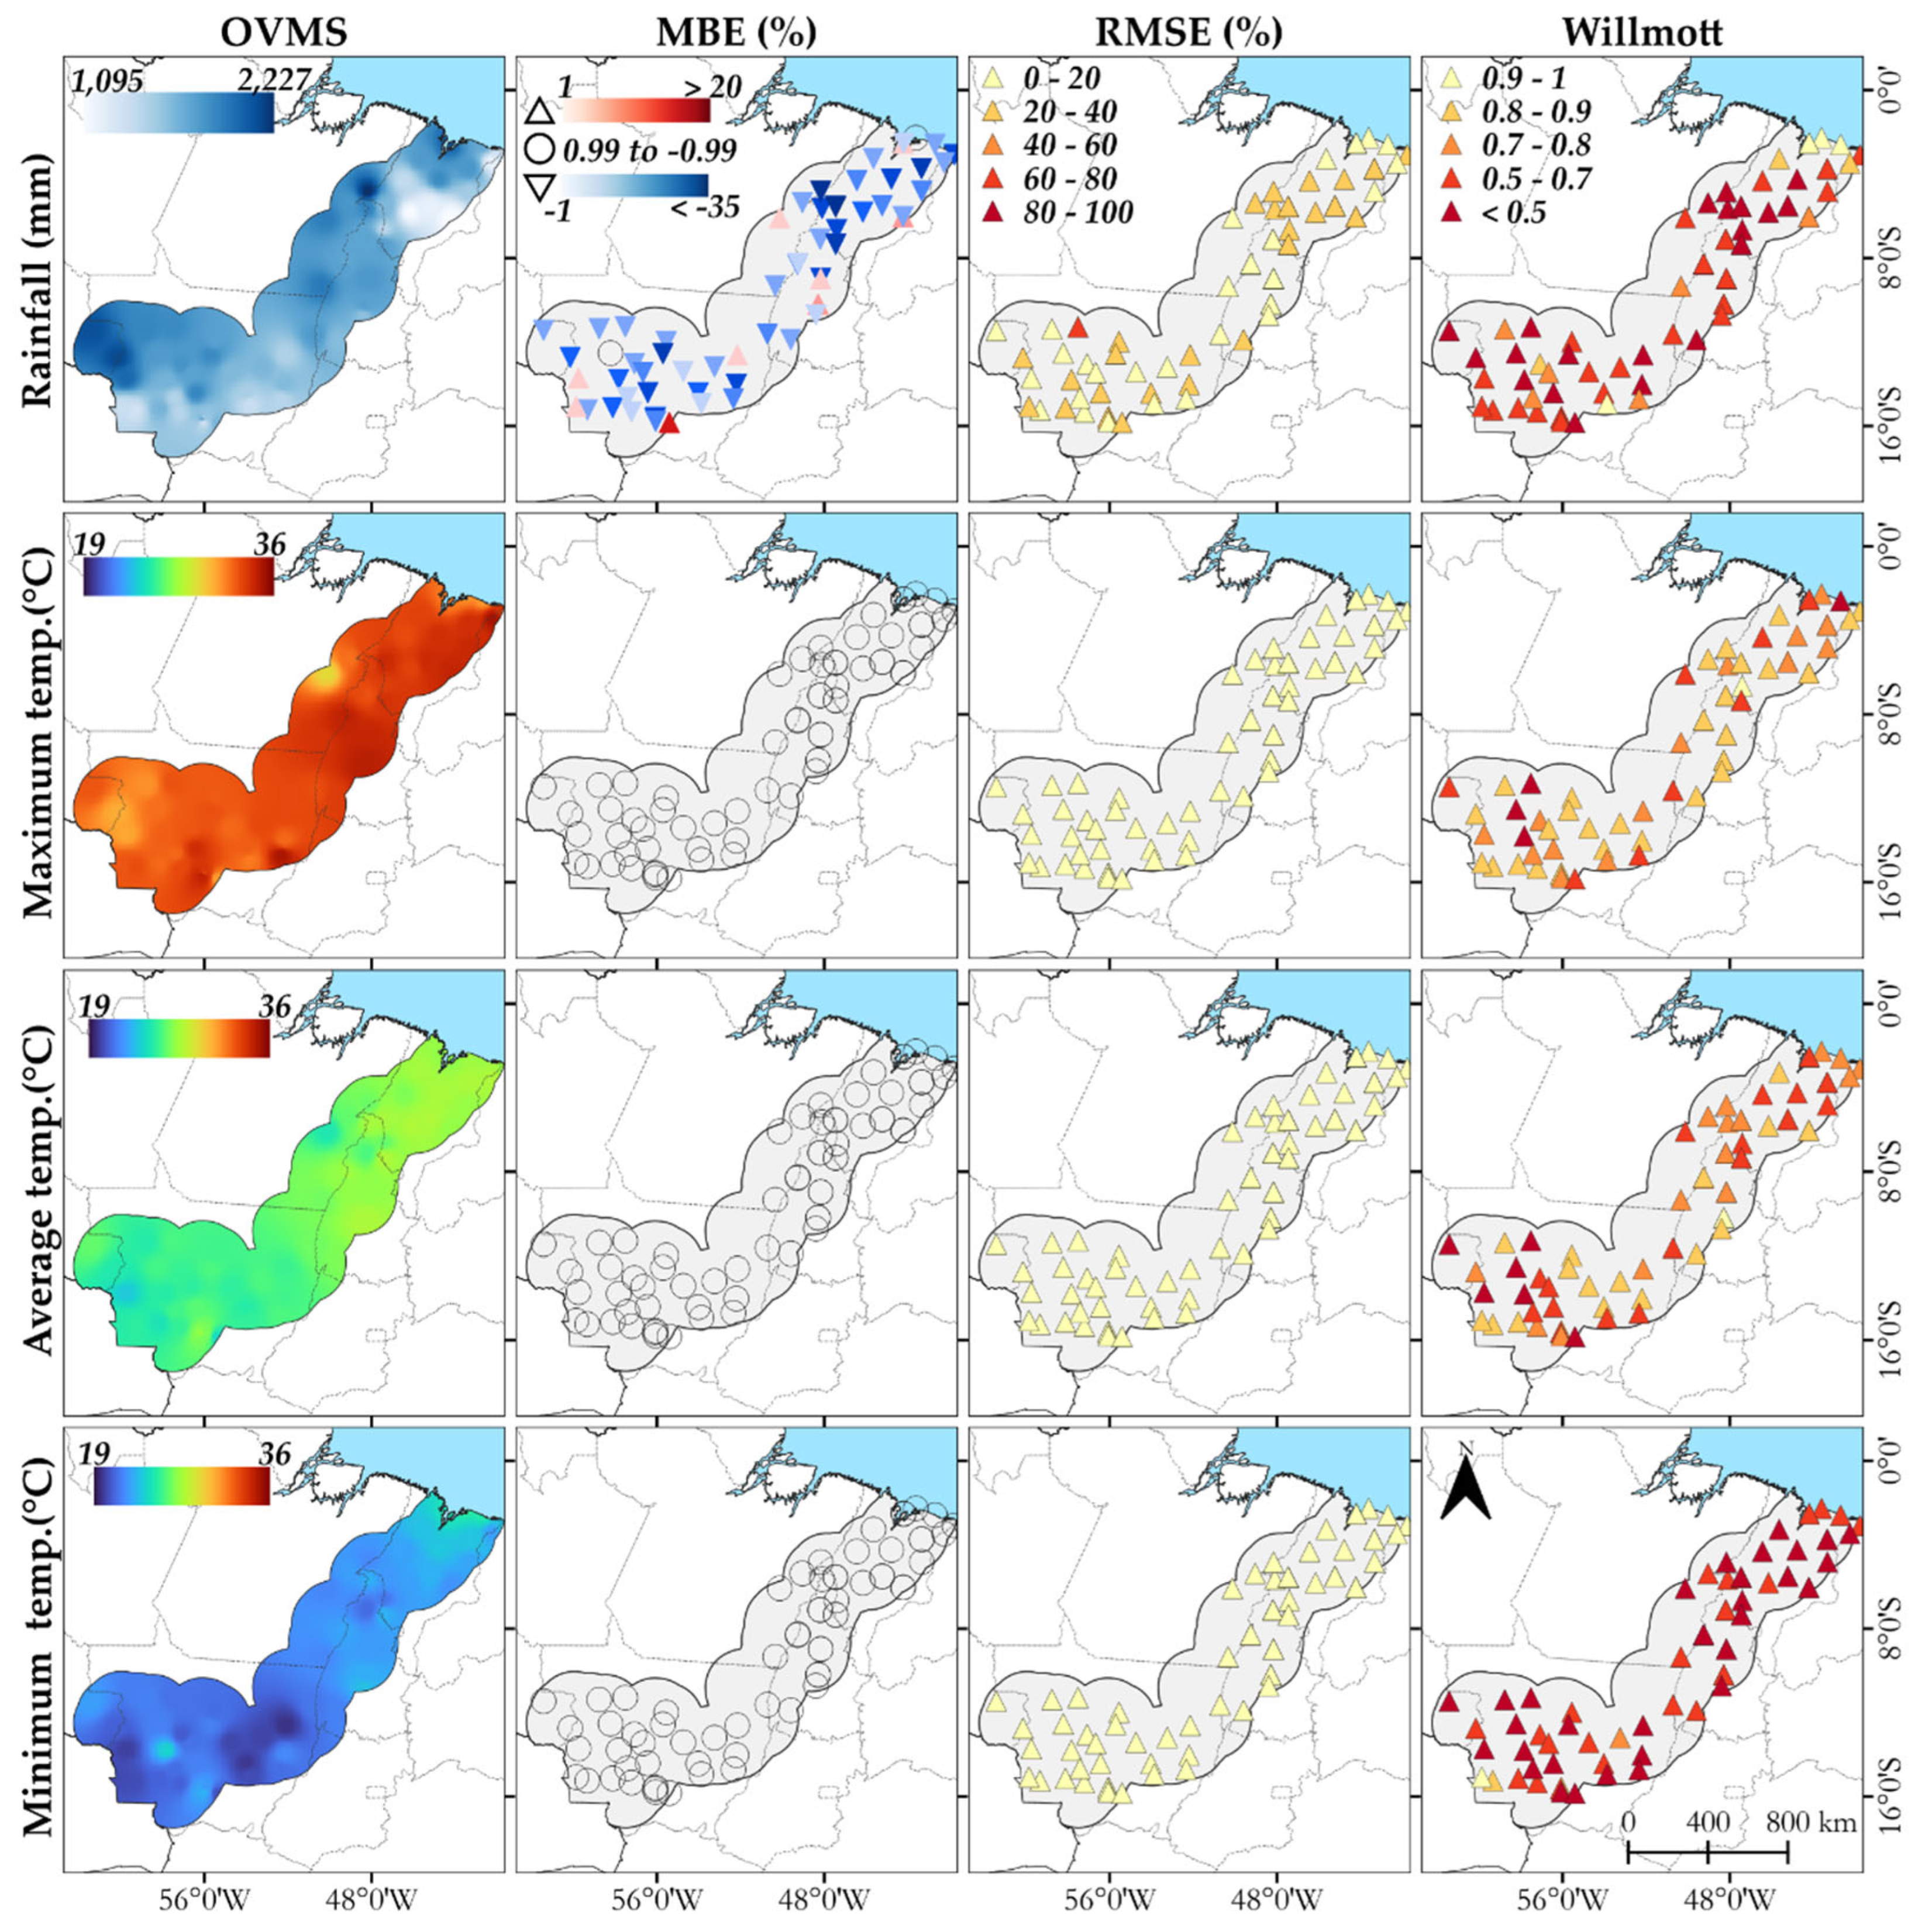
Figure 4.
Observed spatial variation (OSMV) of meteorological elements in annual averages of daily data (average and minimum relative air humidity and average wind speed) and statistical indicators Mean Bias Error (MBE), Root Mean Square Error (RMSE), and Willmott's concordance index, between data measured at meteorological stations (INMET) and reanalysis (ERA5 Land), in the Cerrado-Amazon transition, from 2010 to 2022. Variability is represented by a color gradient, and statistical indicators (MBE, RMSE, and Willmott) are indicated by symbols (circles and triangles). The reference is the data measured at meteorological stations, and for the interpretation of the statistical indices, we have: i) MBE - circles represent values from 0.99 to -0.99, considered perfect; red triangle, values of 1 > 20%, indicate underestimations; and the inverted triangle, blue color, values of -1 < -35% overestimation; ii) RMSE, the color variation from yellow to red (0 to 20 excellent dispersion; 20 to 60 moderate dispersion; 60 to 100 large spread of errors; iii) Willmott's d, varies on a scale of 0 to 1 from yellow to red (0.9 to 1.0 excellent; 0.8 to 0.9 very good; 0.7 to 0.8 good; 0.5 to 0.7 fair, and < 0.5 poor). *The acronym OVMS refers to Observed Spatial Variability in Weather Station Data*
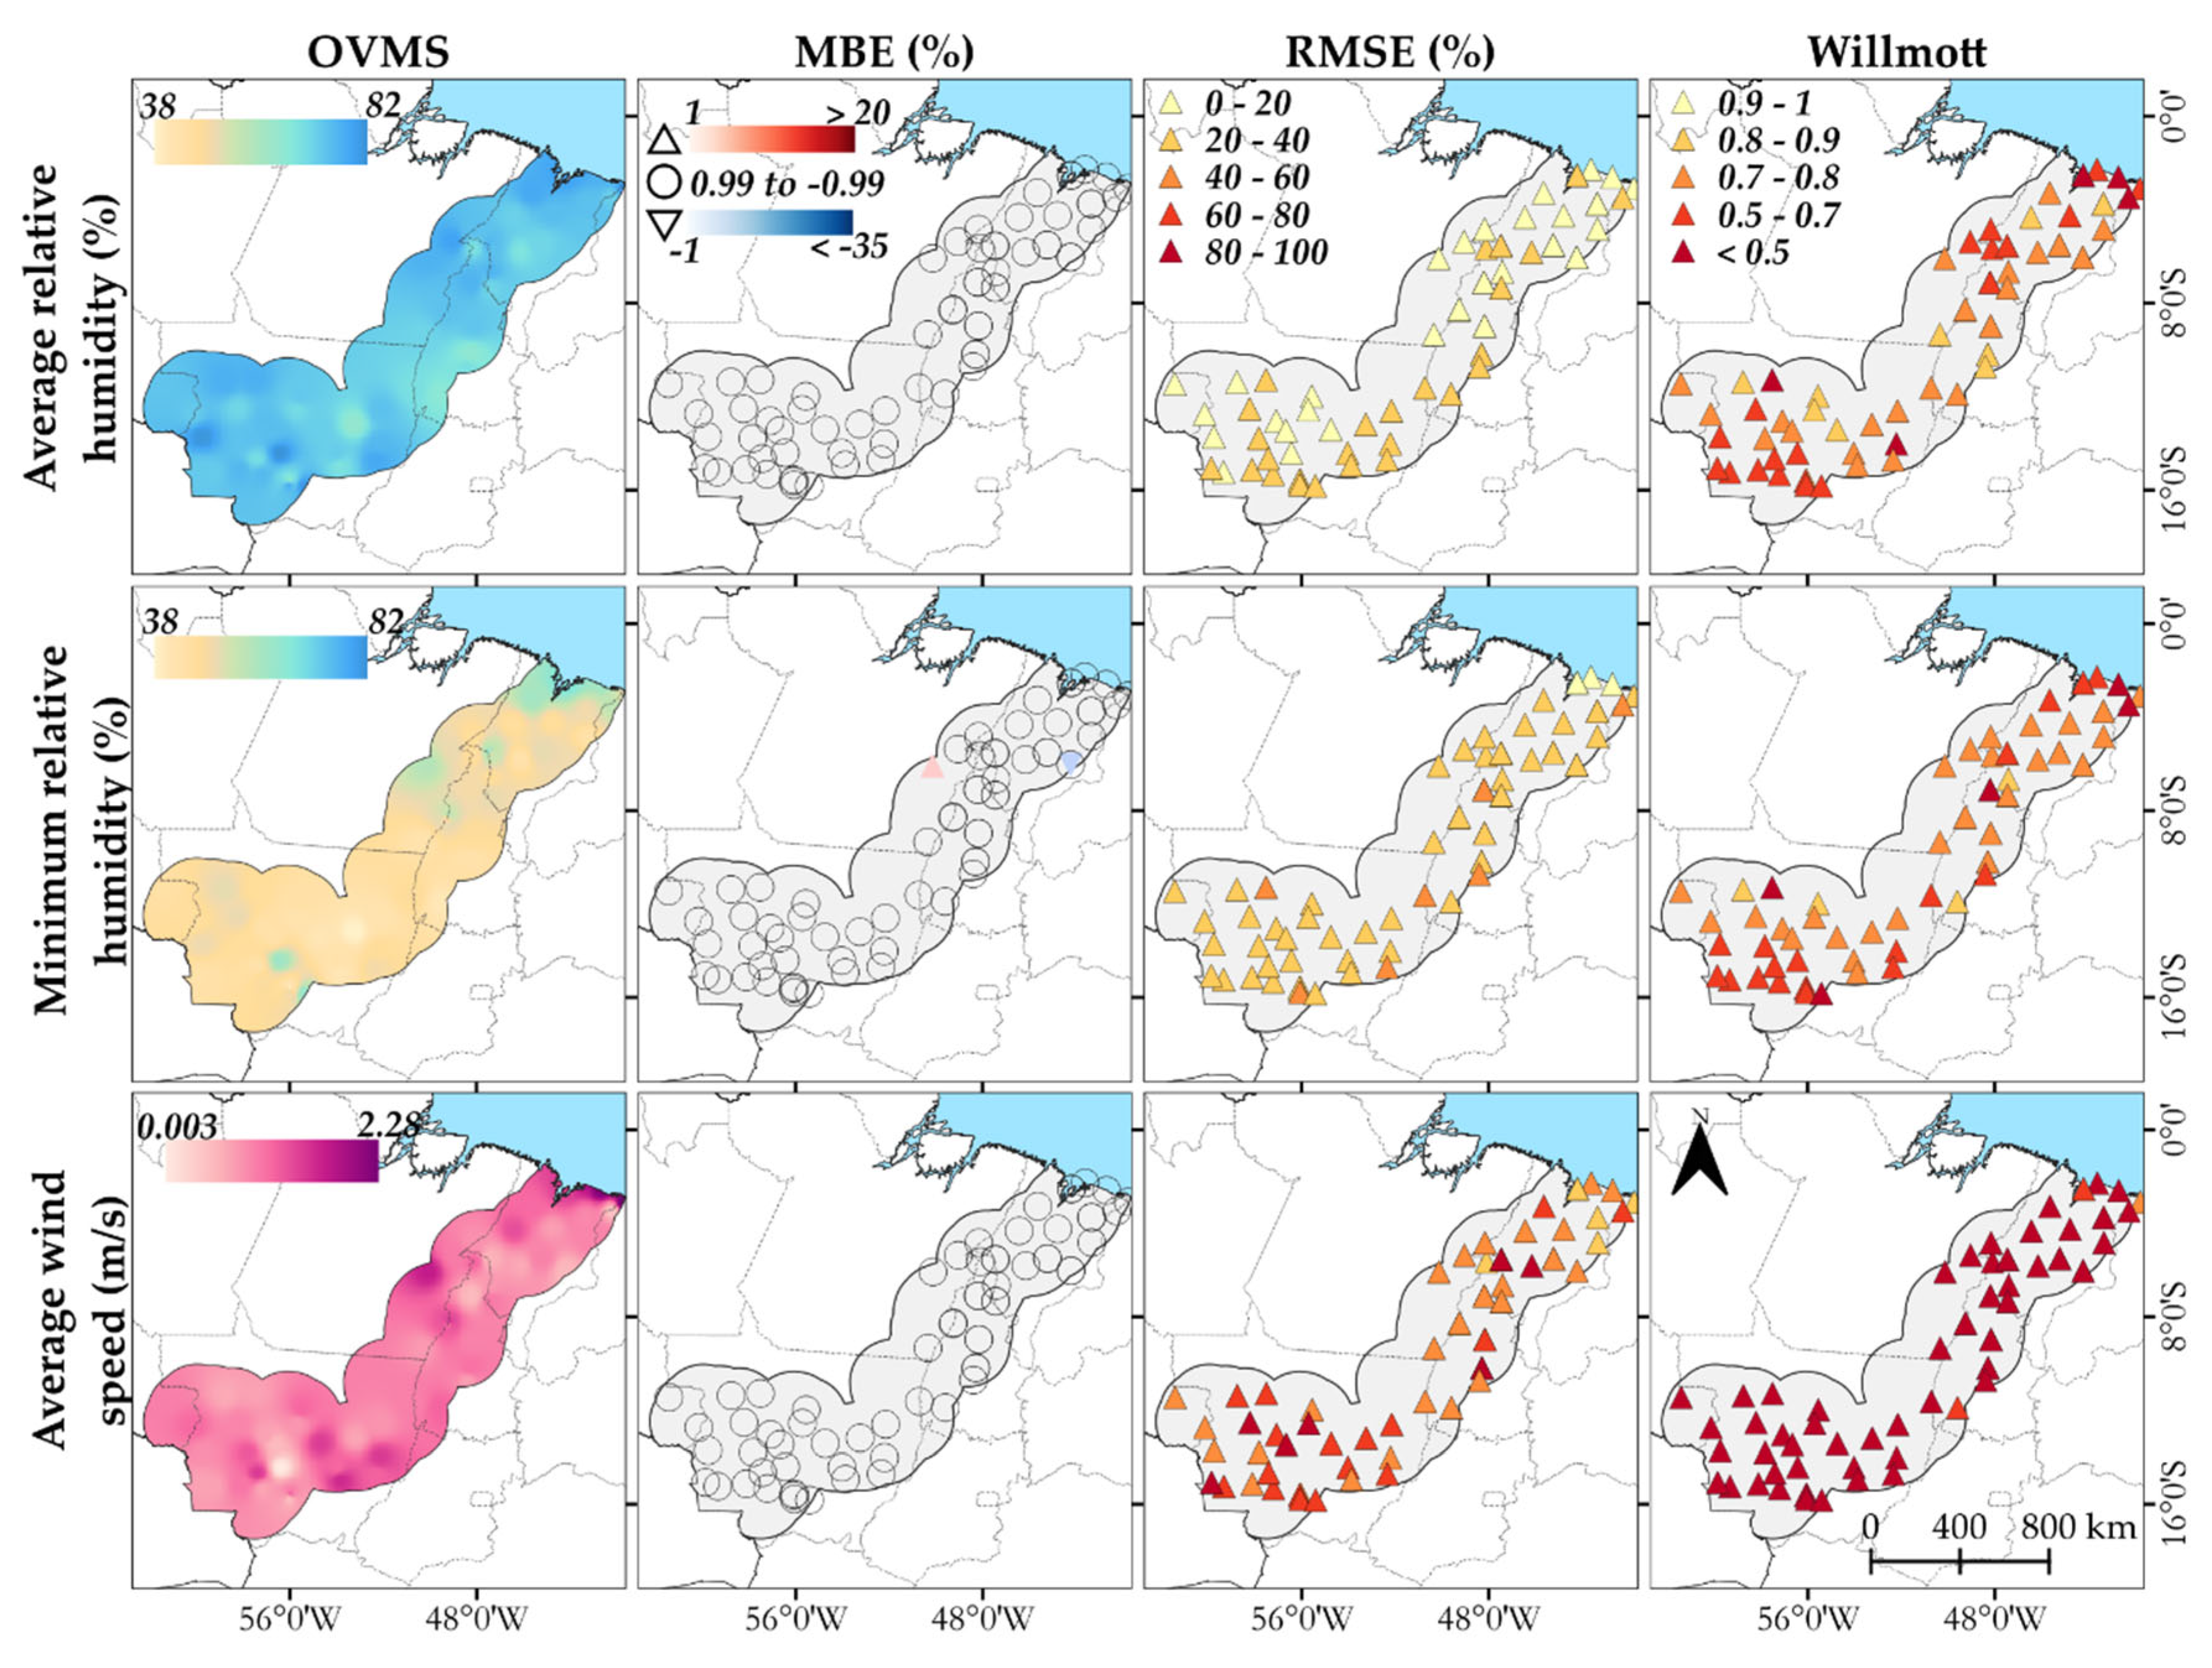
Figure 5.
Normalized Precipitation Index in the Cerrado-Amazon Transition, presented by symbols, in a color gradient, with inverted blue triangles representing underestimated values (< -1.0 large, -1.0 to -0.40 medium; -0.40 to -0.10 small), circles without color filling (-0.10 to 0.10 normal) and red triangles representing overestimated values (0.10 to 0.40 small; 0.40 to 1.0 medium; and ≥ 1.0 large).
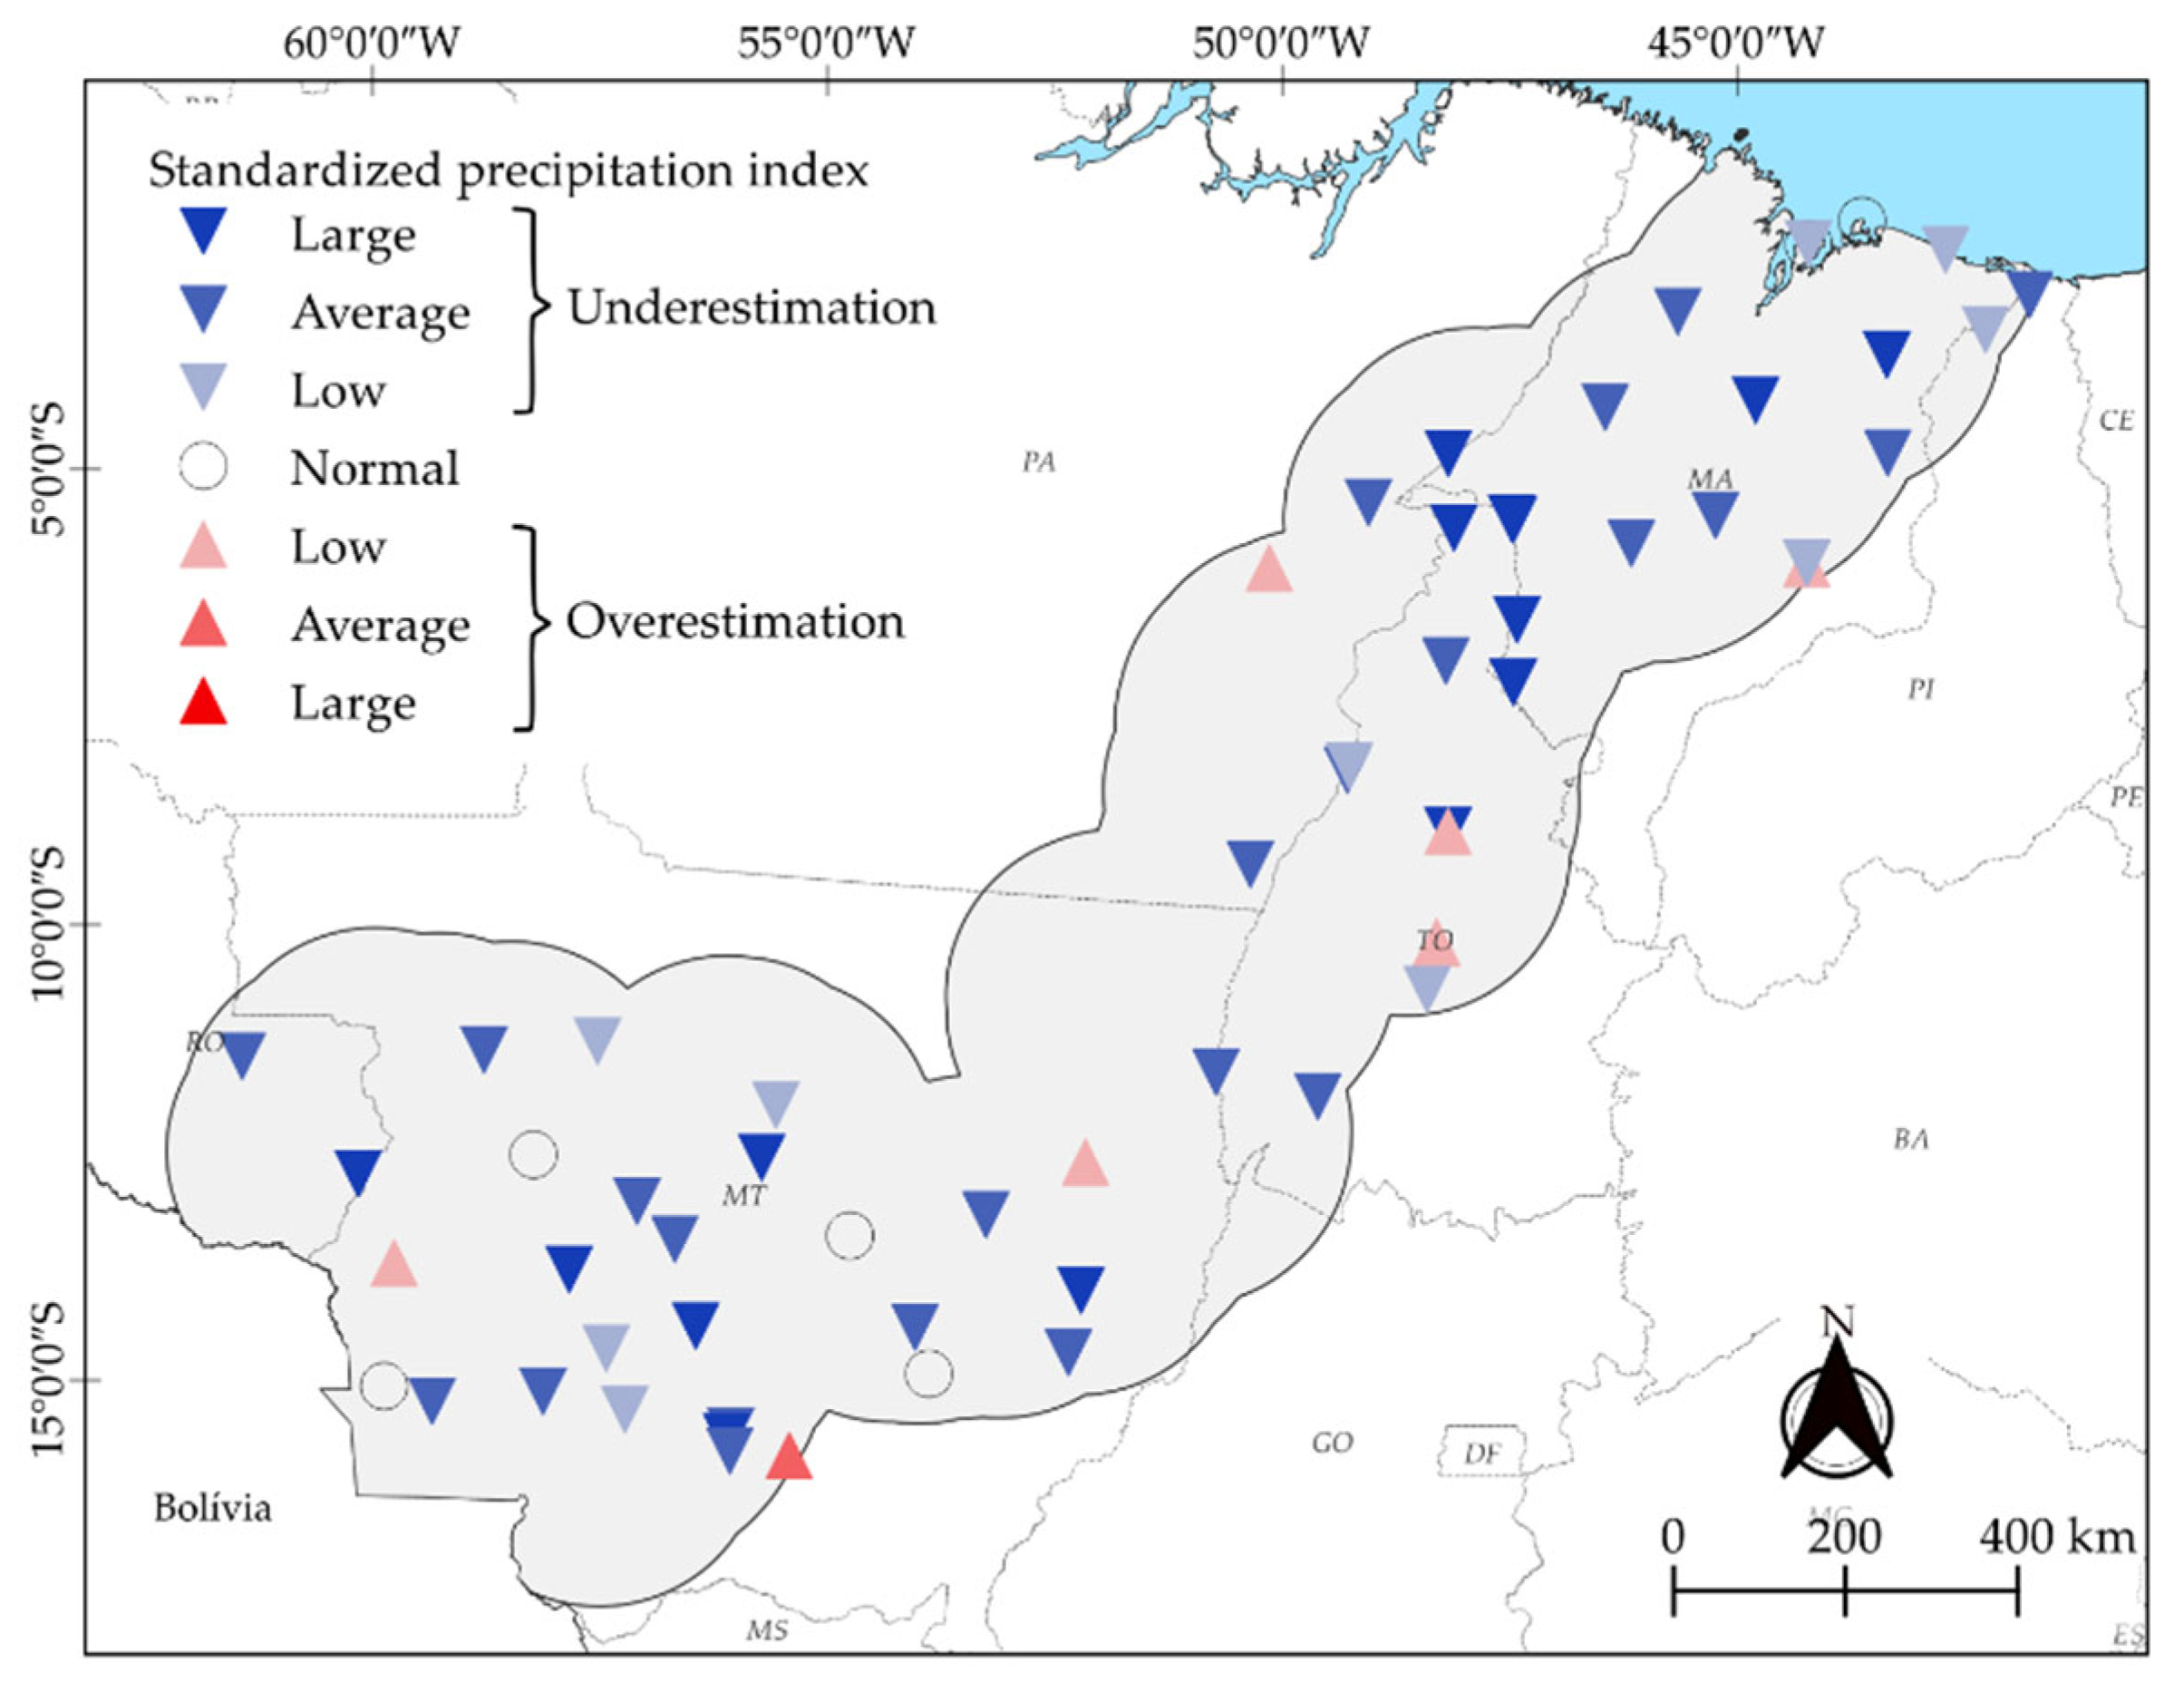
Figure 6.
Normalization categories (ratio) of meteorological variables between the averages obtained at meteorological stations and the ERA-5 reanalysis data, in the Cerrado-Amazon transition. Index categorized on a color scale.
Figure 6.
Normalization categories (ratio) of meteorological variables between the averages obtained at meteorological stations and the ERA-5 reanalysis data, in the Cerrado-Amazon transition. Index categorized on a color scale.
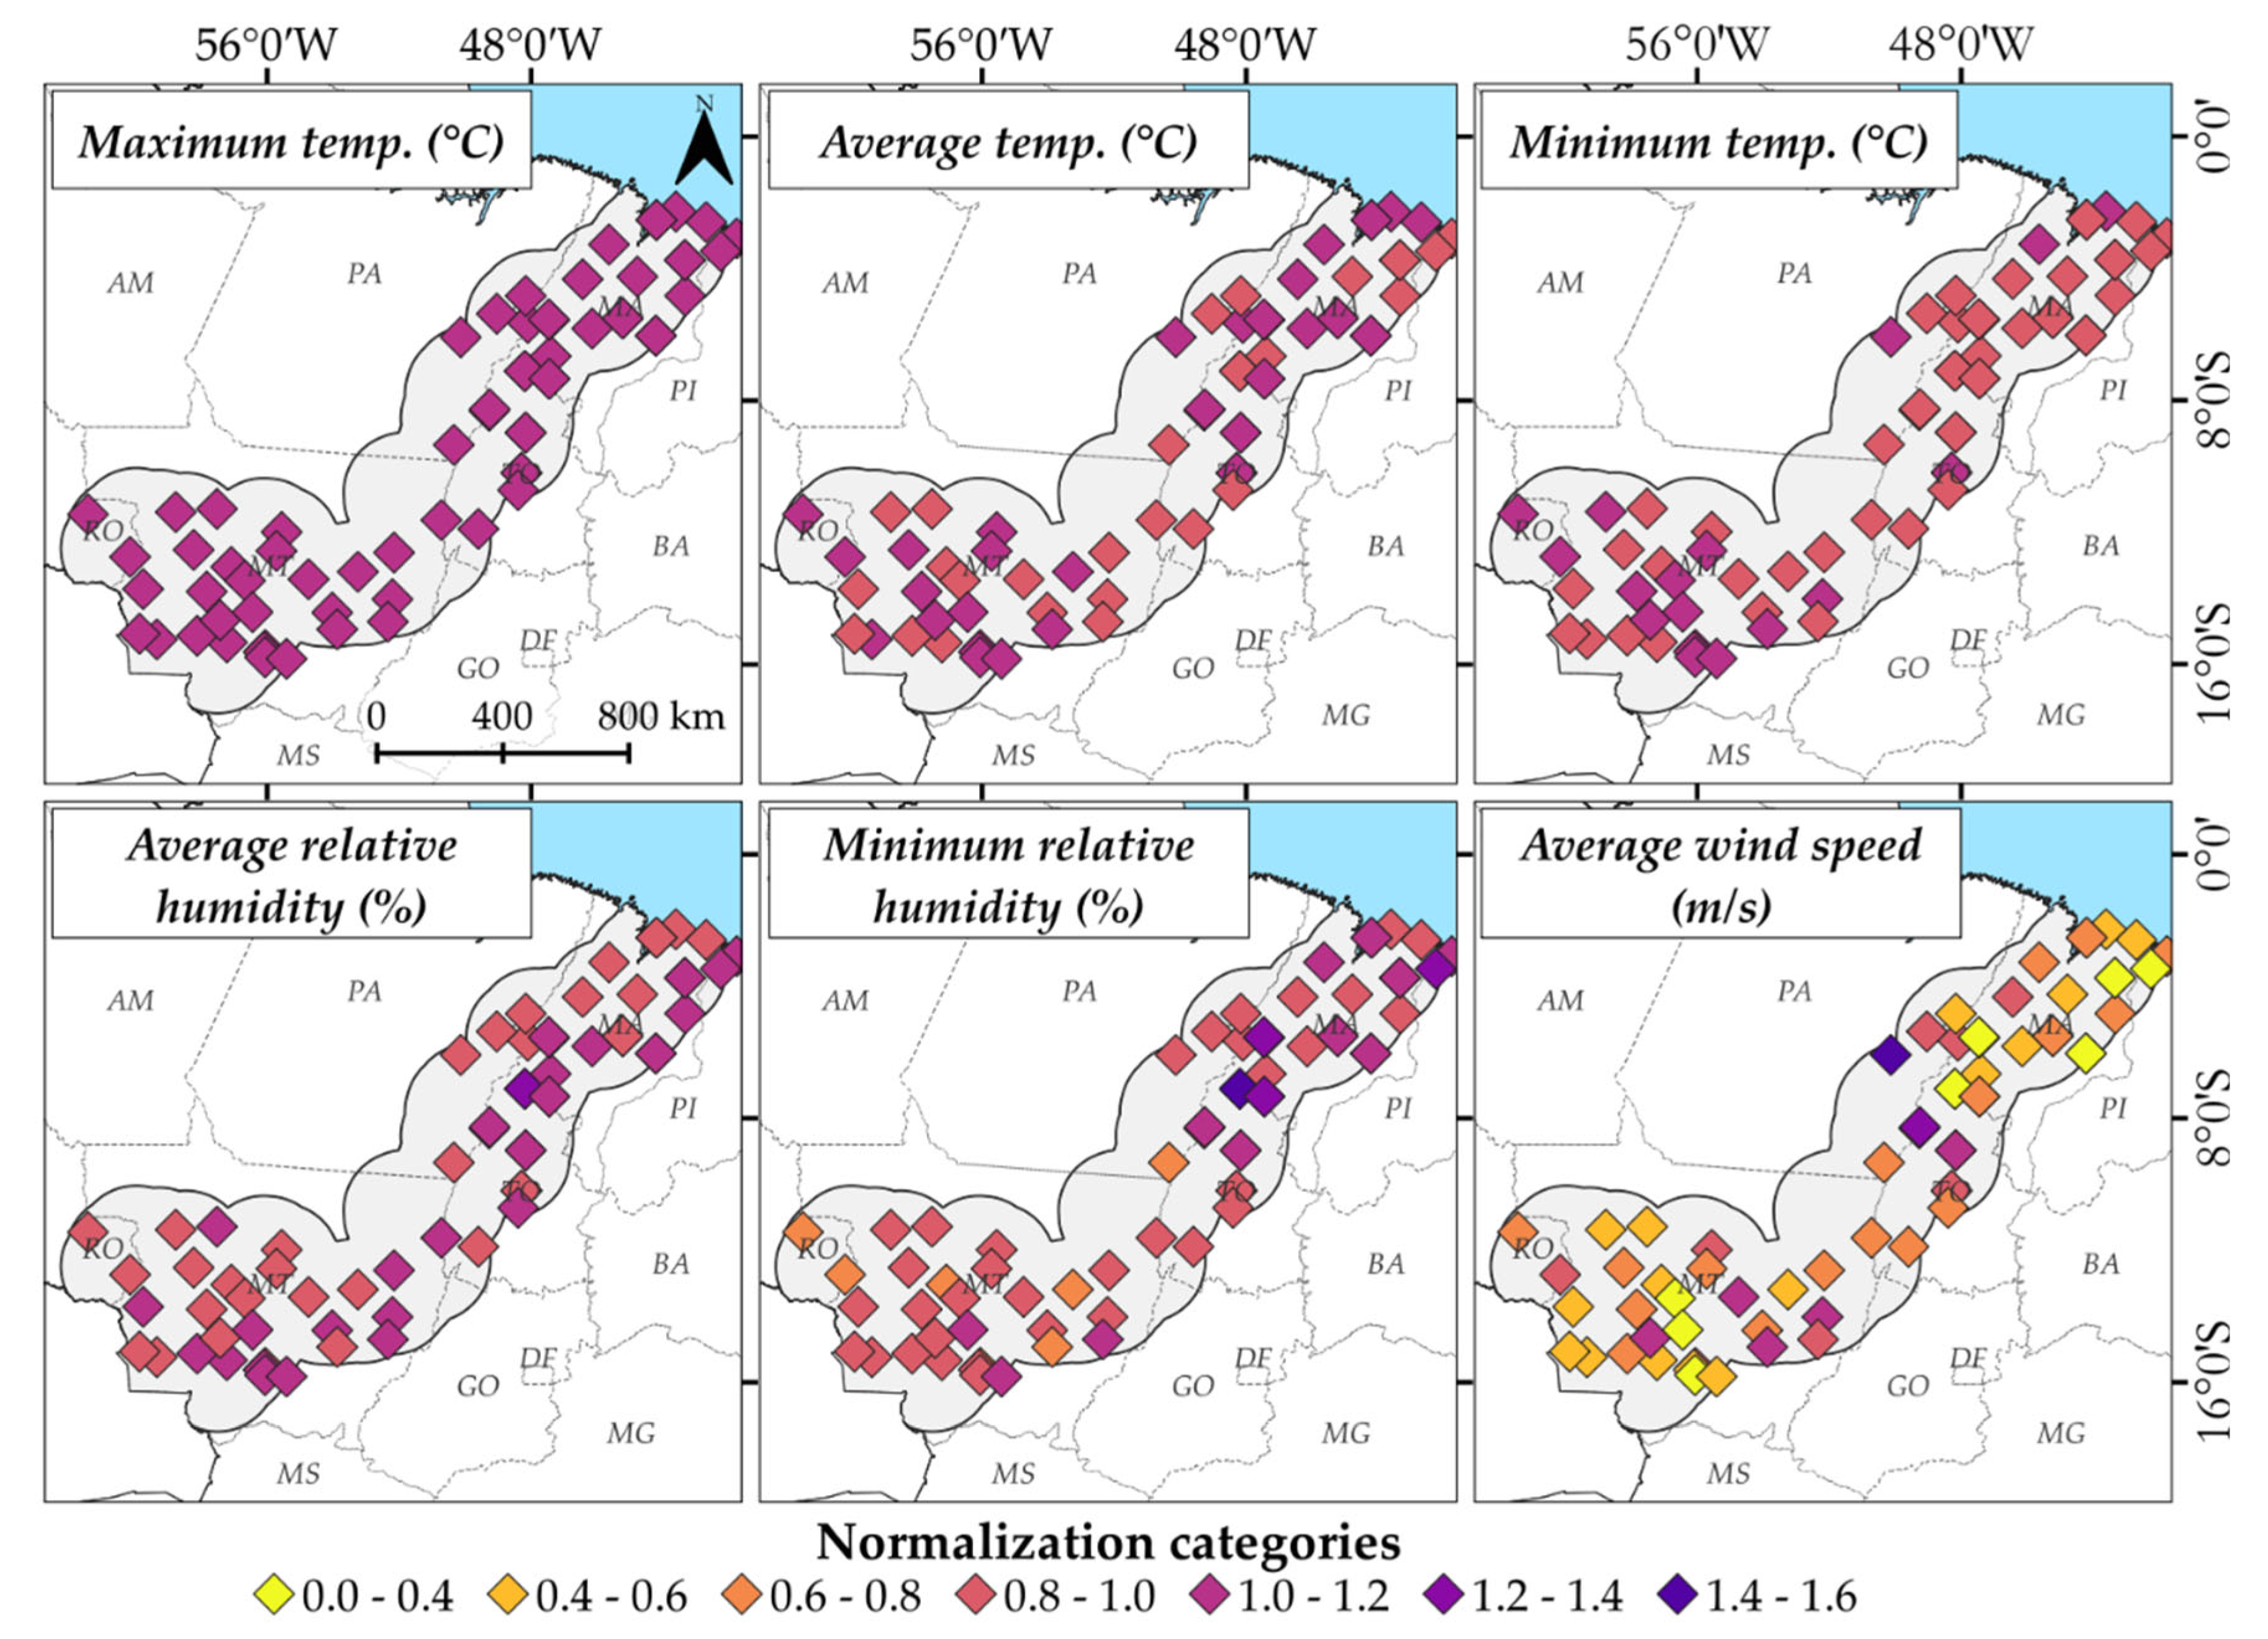
Figure 7.
Dispersion (a) and interannual variation (b) of fire danger indices obtained with data measured by the meteorological station and by reanalysis for the Vilhena (RO) station, in the Cerrado-Amazon Transition. Graphs from other meteorological stations can be viewed in Figure S1 of the supplementary document.
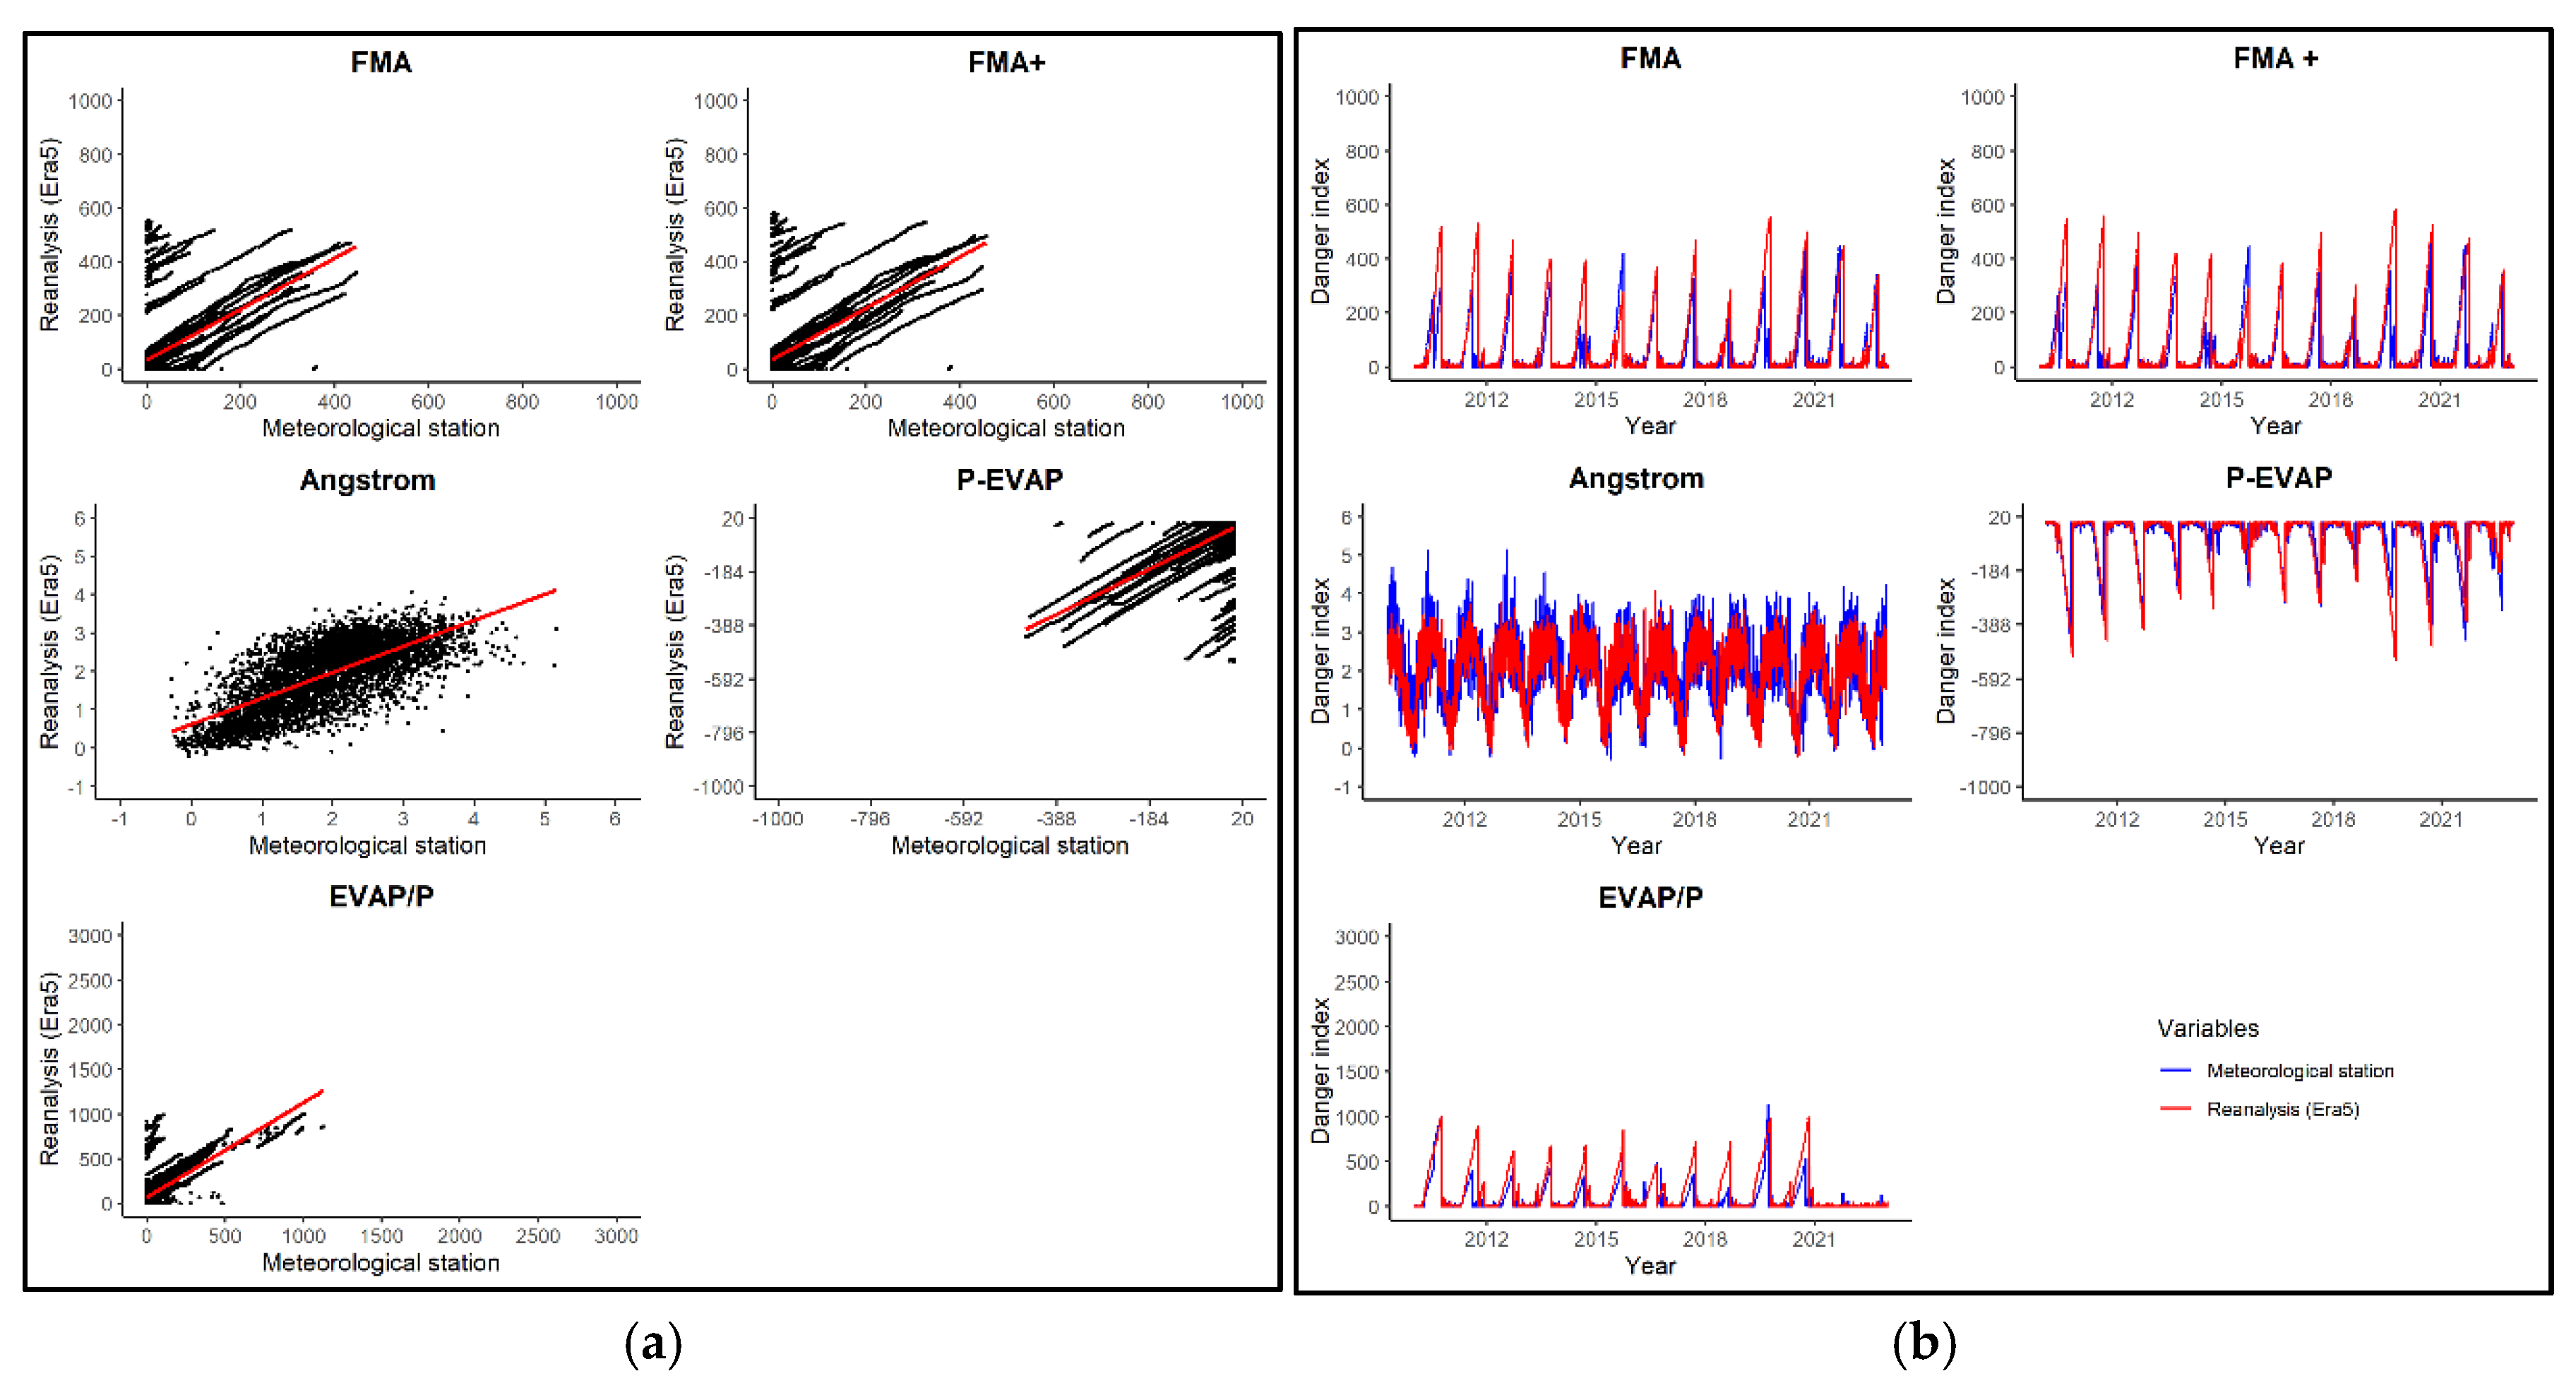
Figure 8.
Annual totals and hotspots in the Cerrado-Amazon transition region, between 2010 and 2022.
Figure 8.
Annual totals and hotspots in the Cerrado-Amazon transition region, between 2010 and 2022.
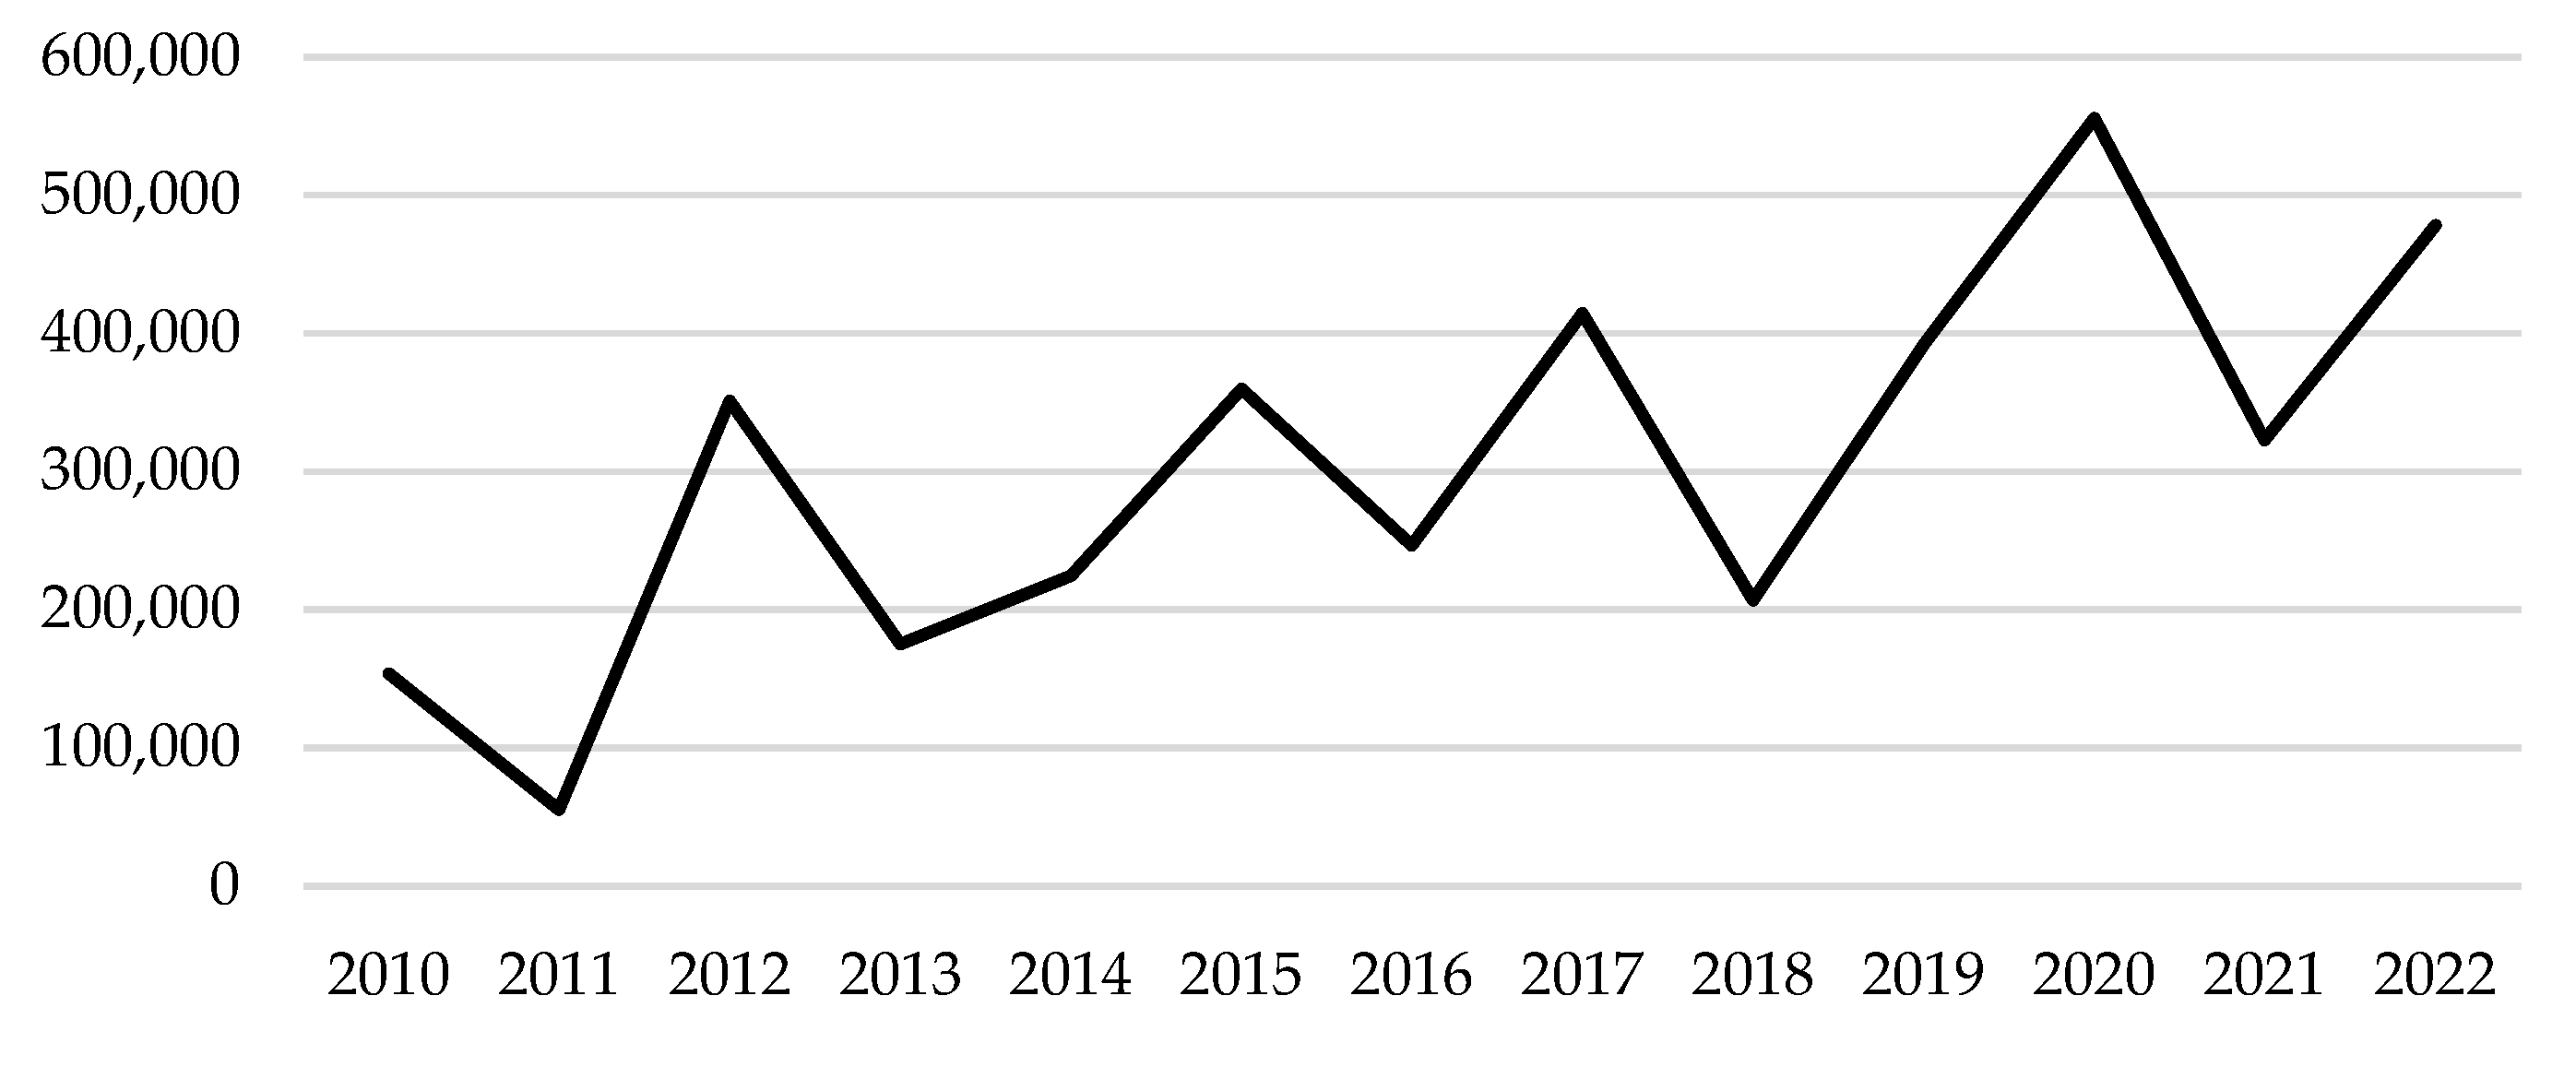
Figure 9.
Boxplots of the monthly distribution of the number of hotspots recorded in the states of the region that belong to the buffer area in the Cerrado-Amazon transition: Rondônia (A), Mato Grosso (B), Pará (C), Tocantins (D), Maranhão (E) and Piauí (F) in the period from 2010 to 2022. In the boxplot, the box represents the interquartile range; the line inside the box is the median; the stems are the lower and upper limits; the points outside the box are the outliers; and the point inside is the average of the hotspots throughout the months of the year, in the period from 2010 to 2022, for the states. * n - number of hotspots and the number of stations per state.
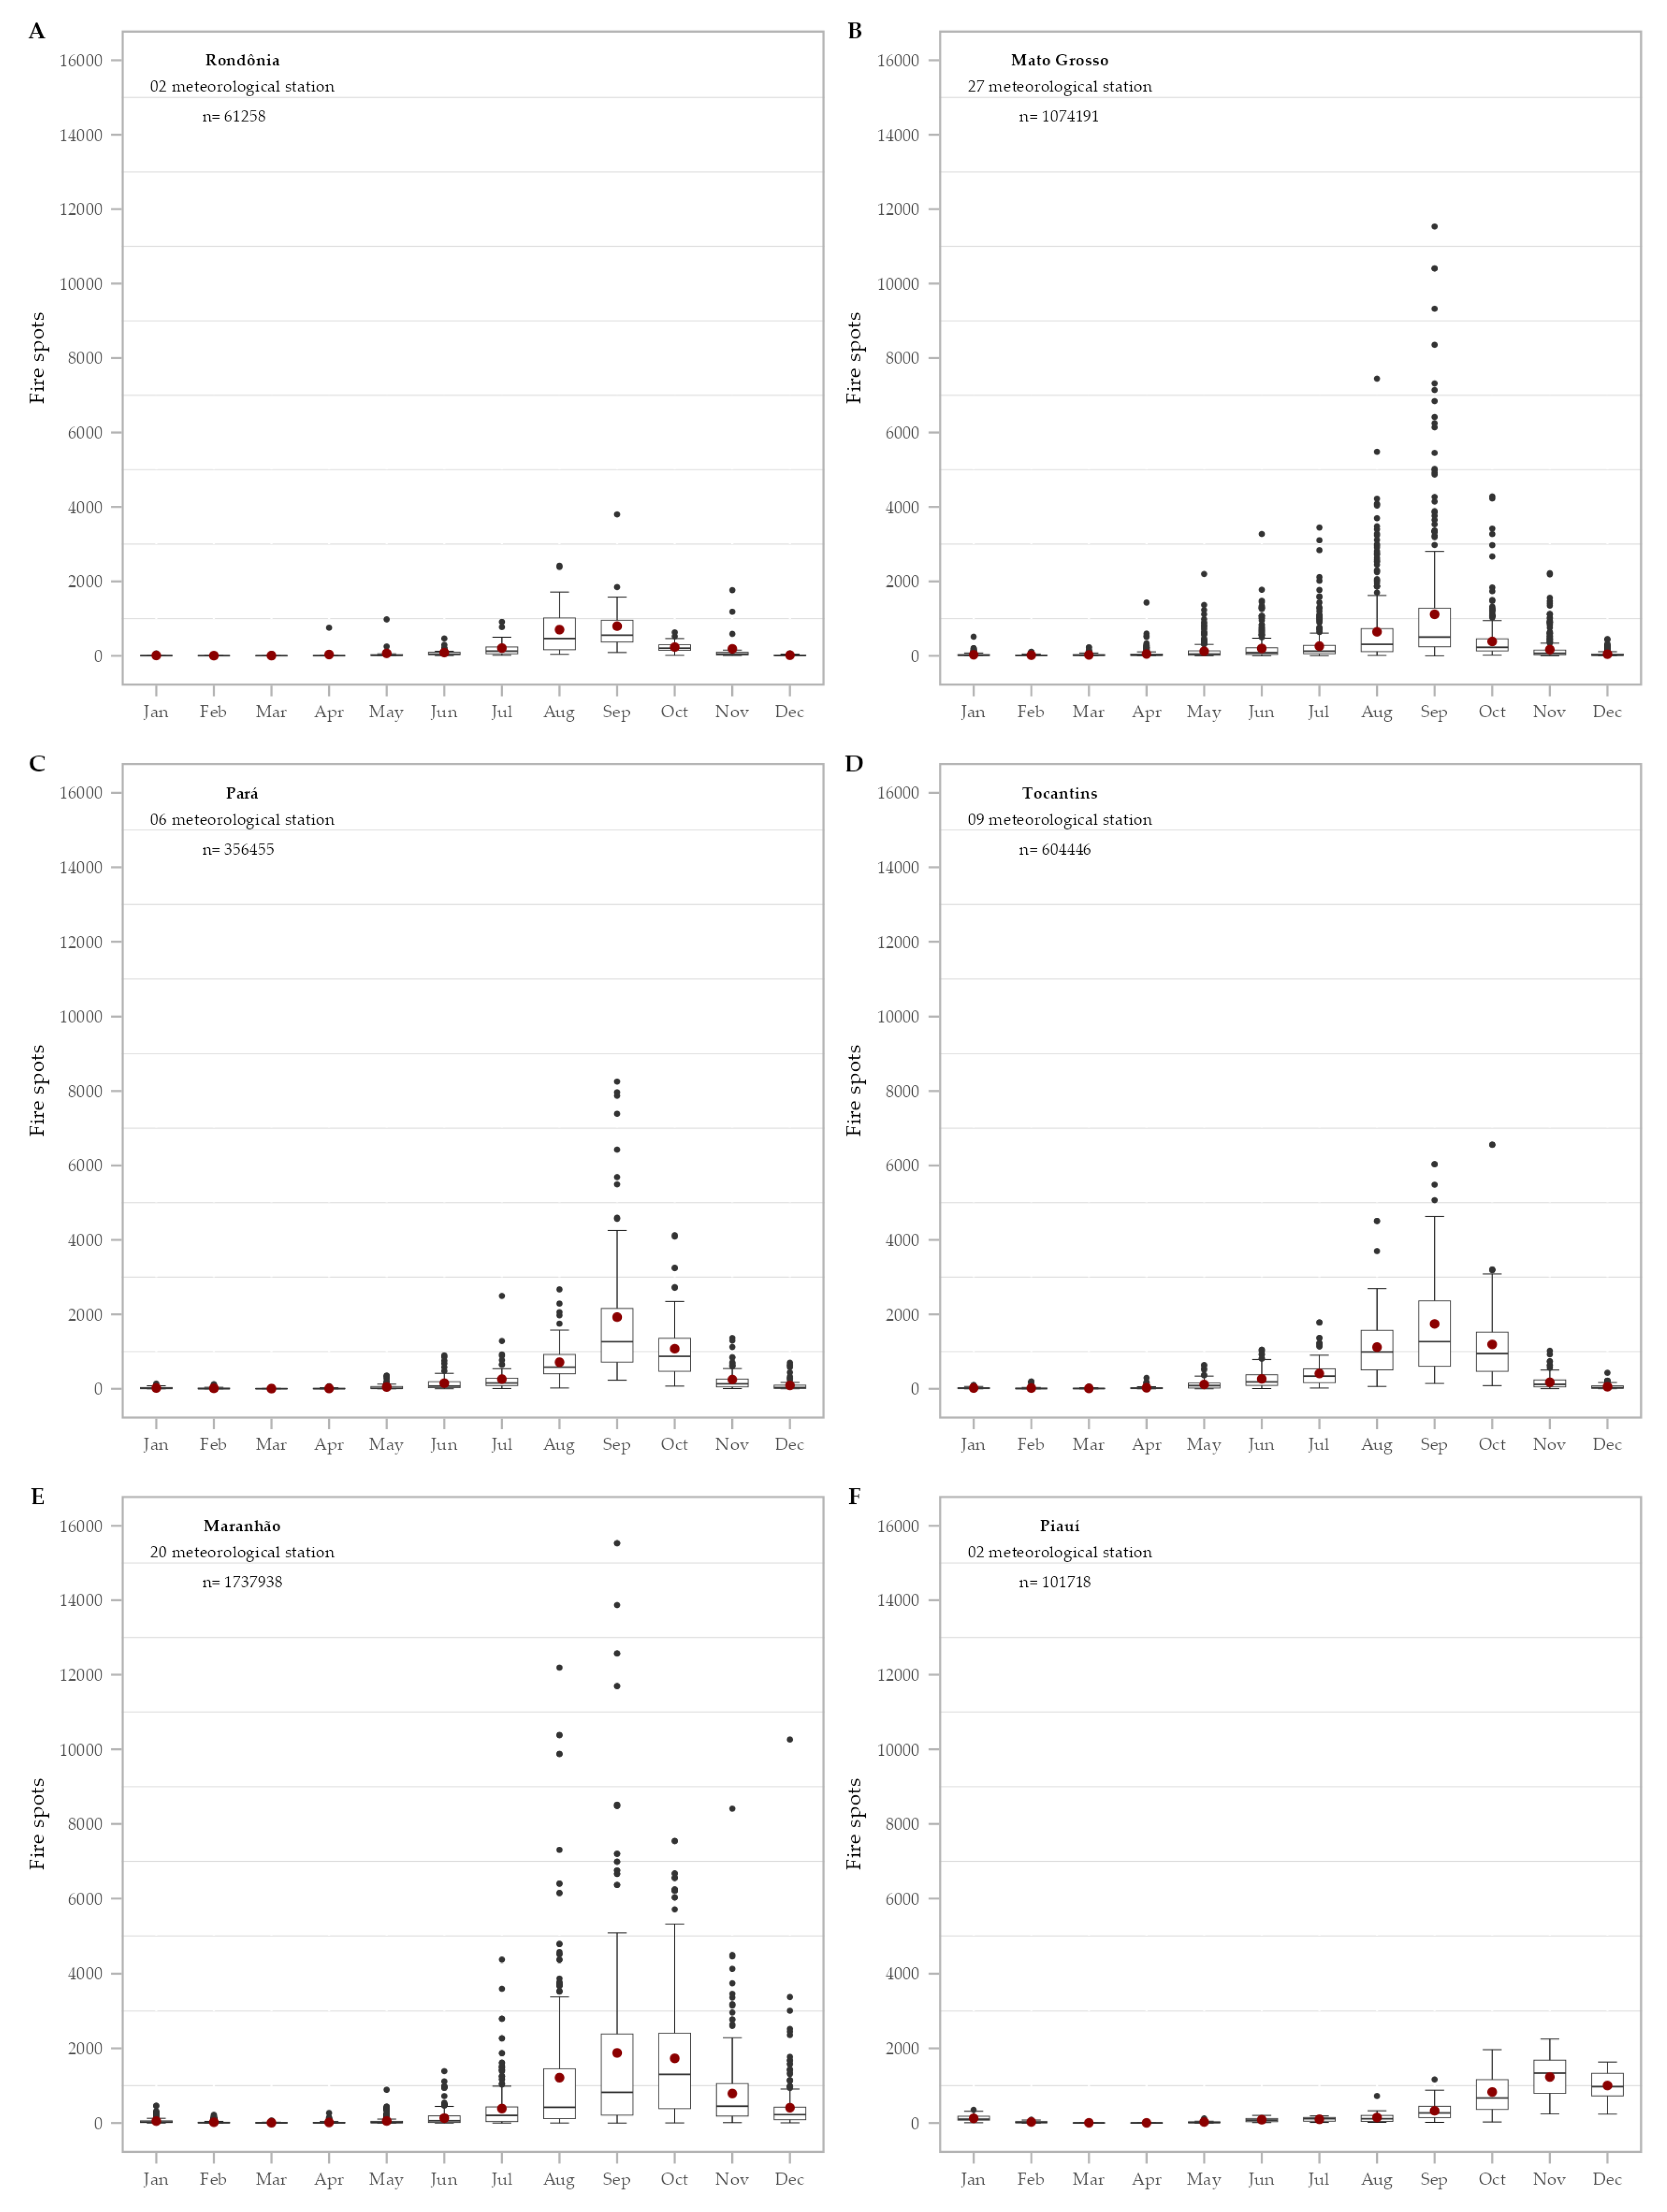
Figure 10.
Monthly distribution of hotspots in the Cerrado-Amazon transition zone from 2010 to 2022.
Figure 10.
Monthly distribution of hotspots in the Cerrado-Amazon transition zone from 2010 to 2022.
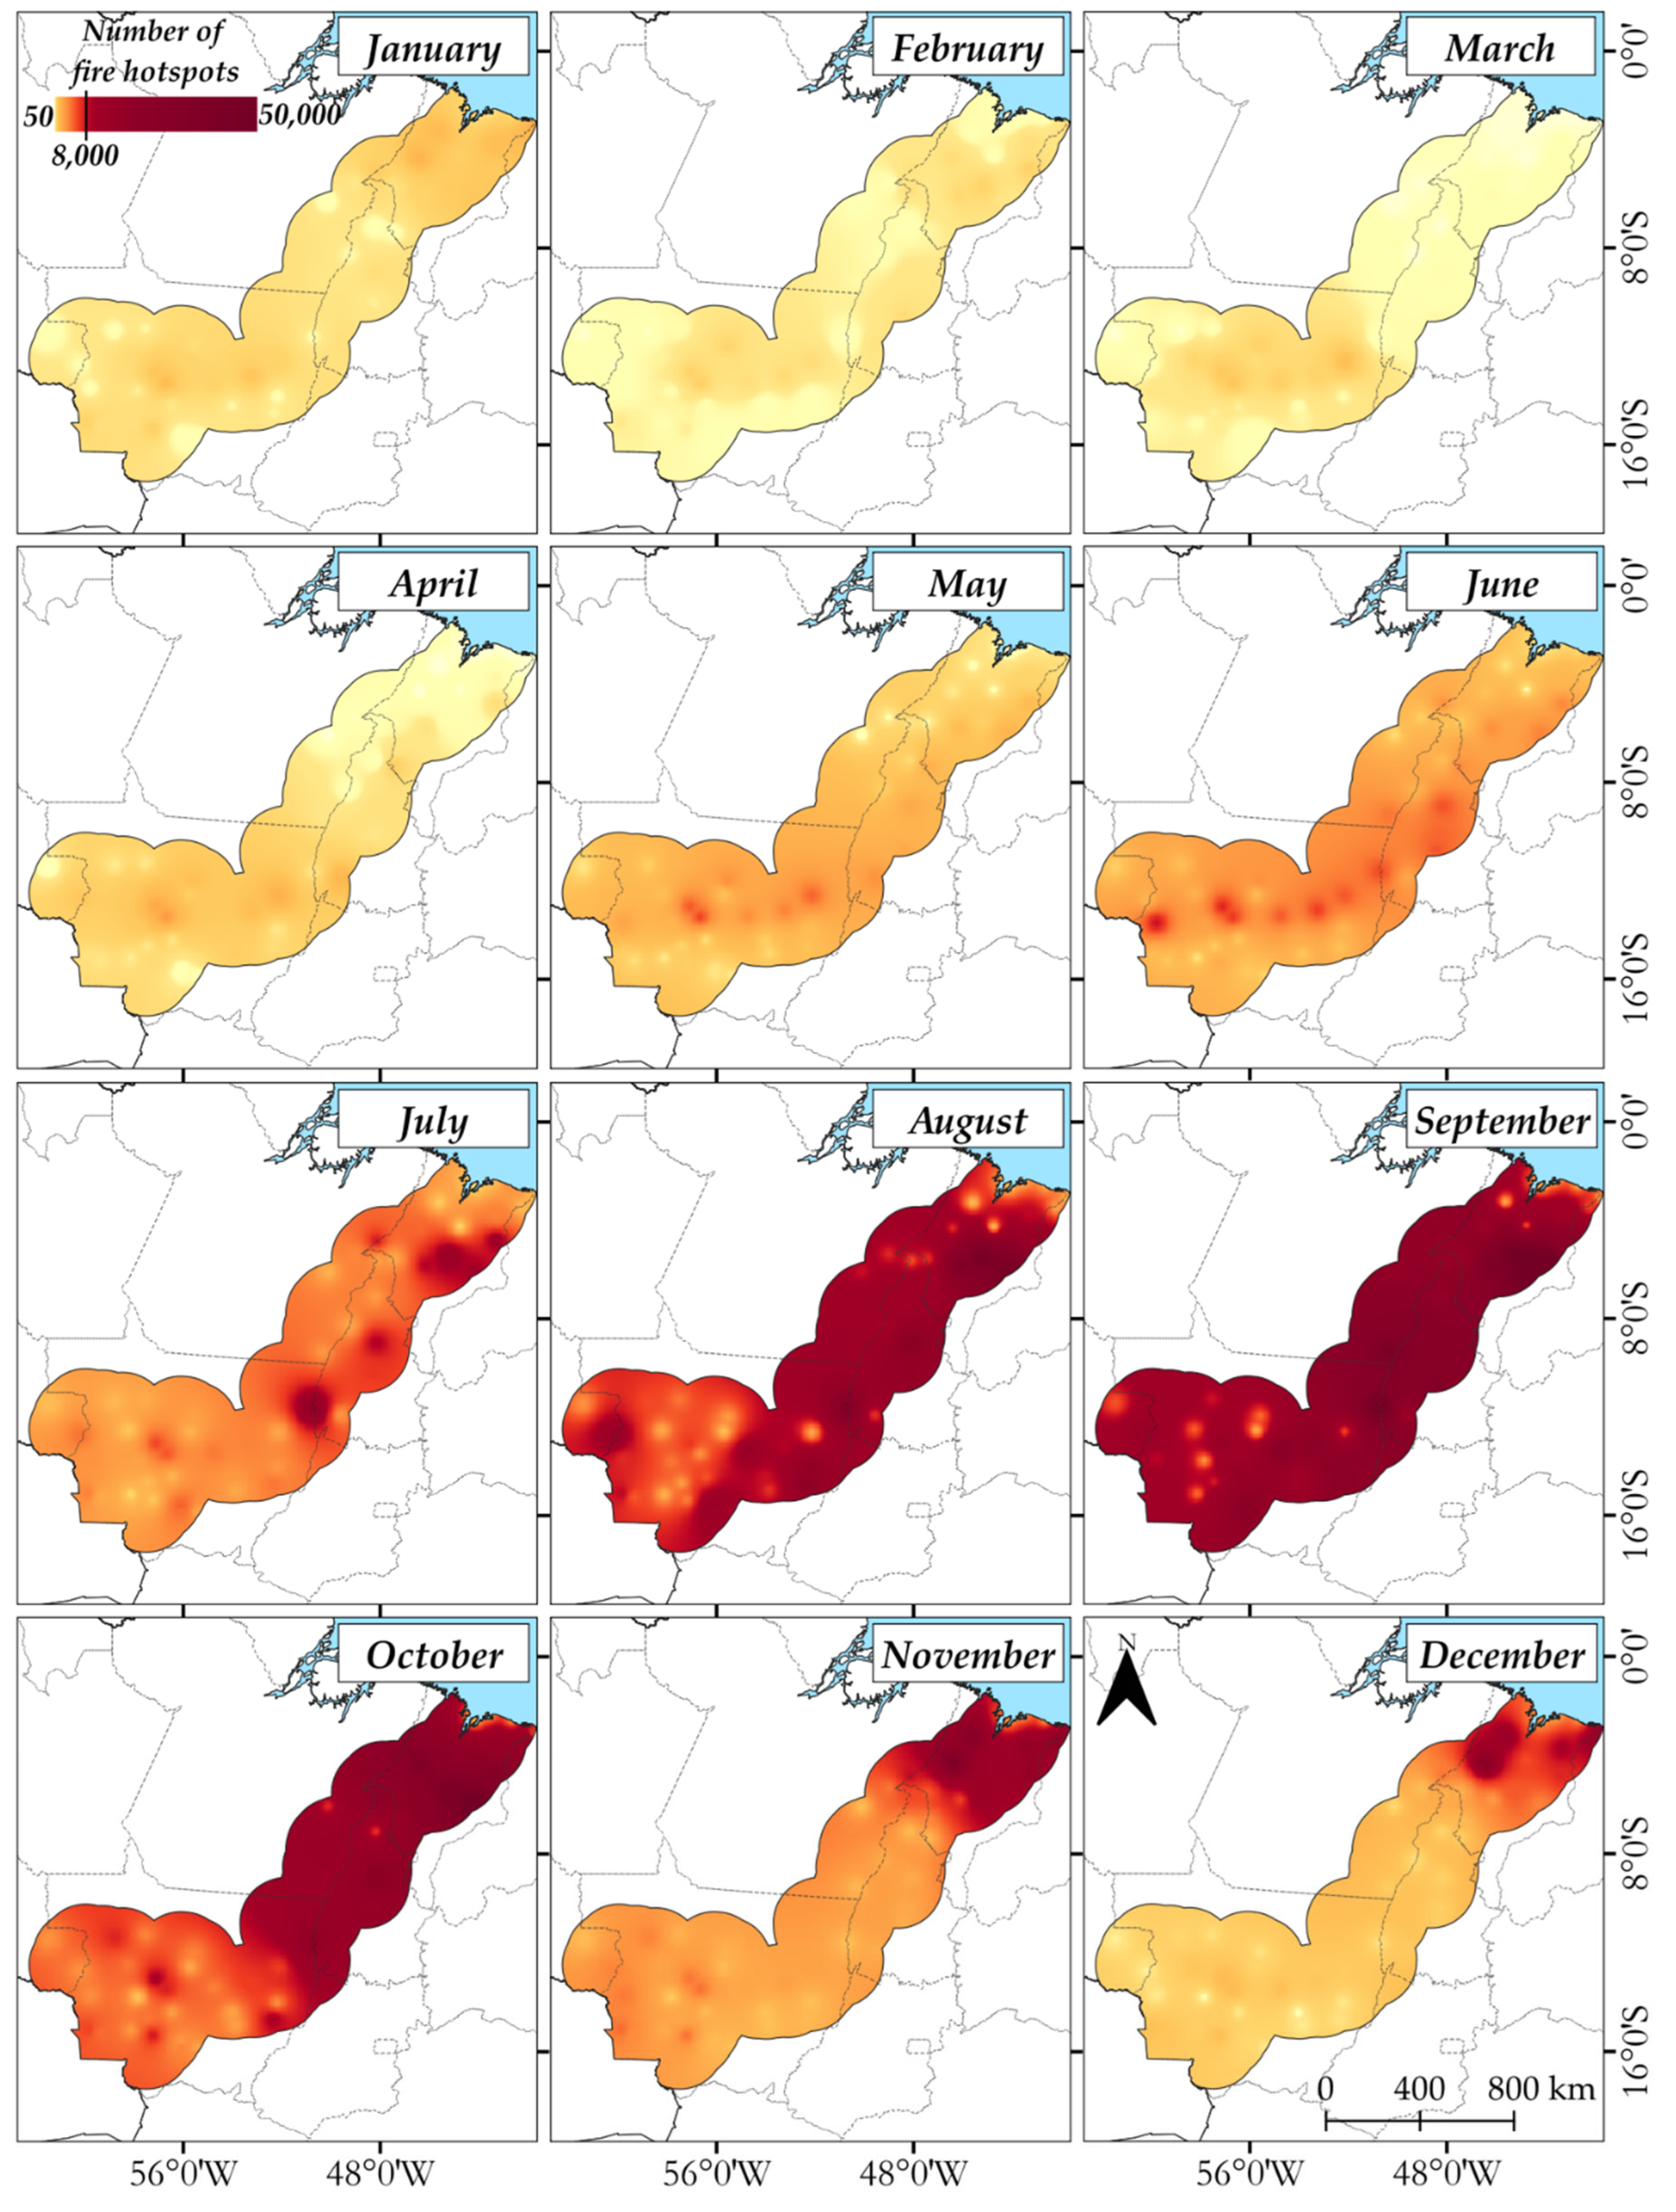
Figure 11.
Spatial distribution of the total number of hotspots from 2010 to 2022 in the Cerrado-Amazon Transition Zone.
Figure 11.
Spatial distribution of the total number of hotspots from 2010 to 2022 in the Cerrado-Amazon Transition Zone.
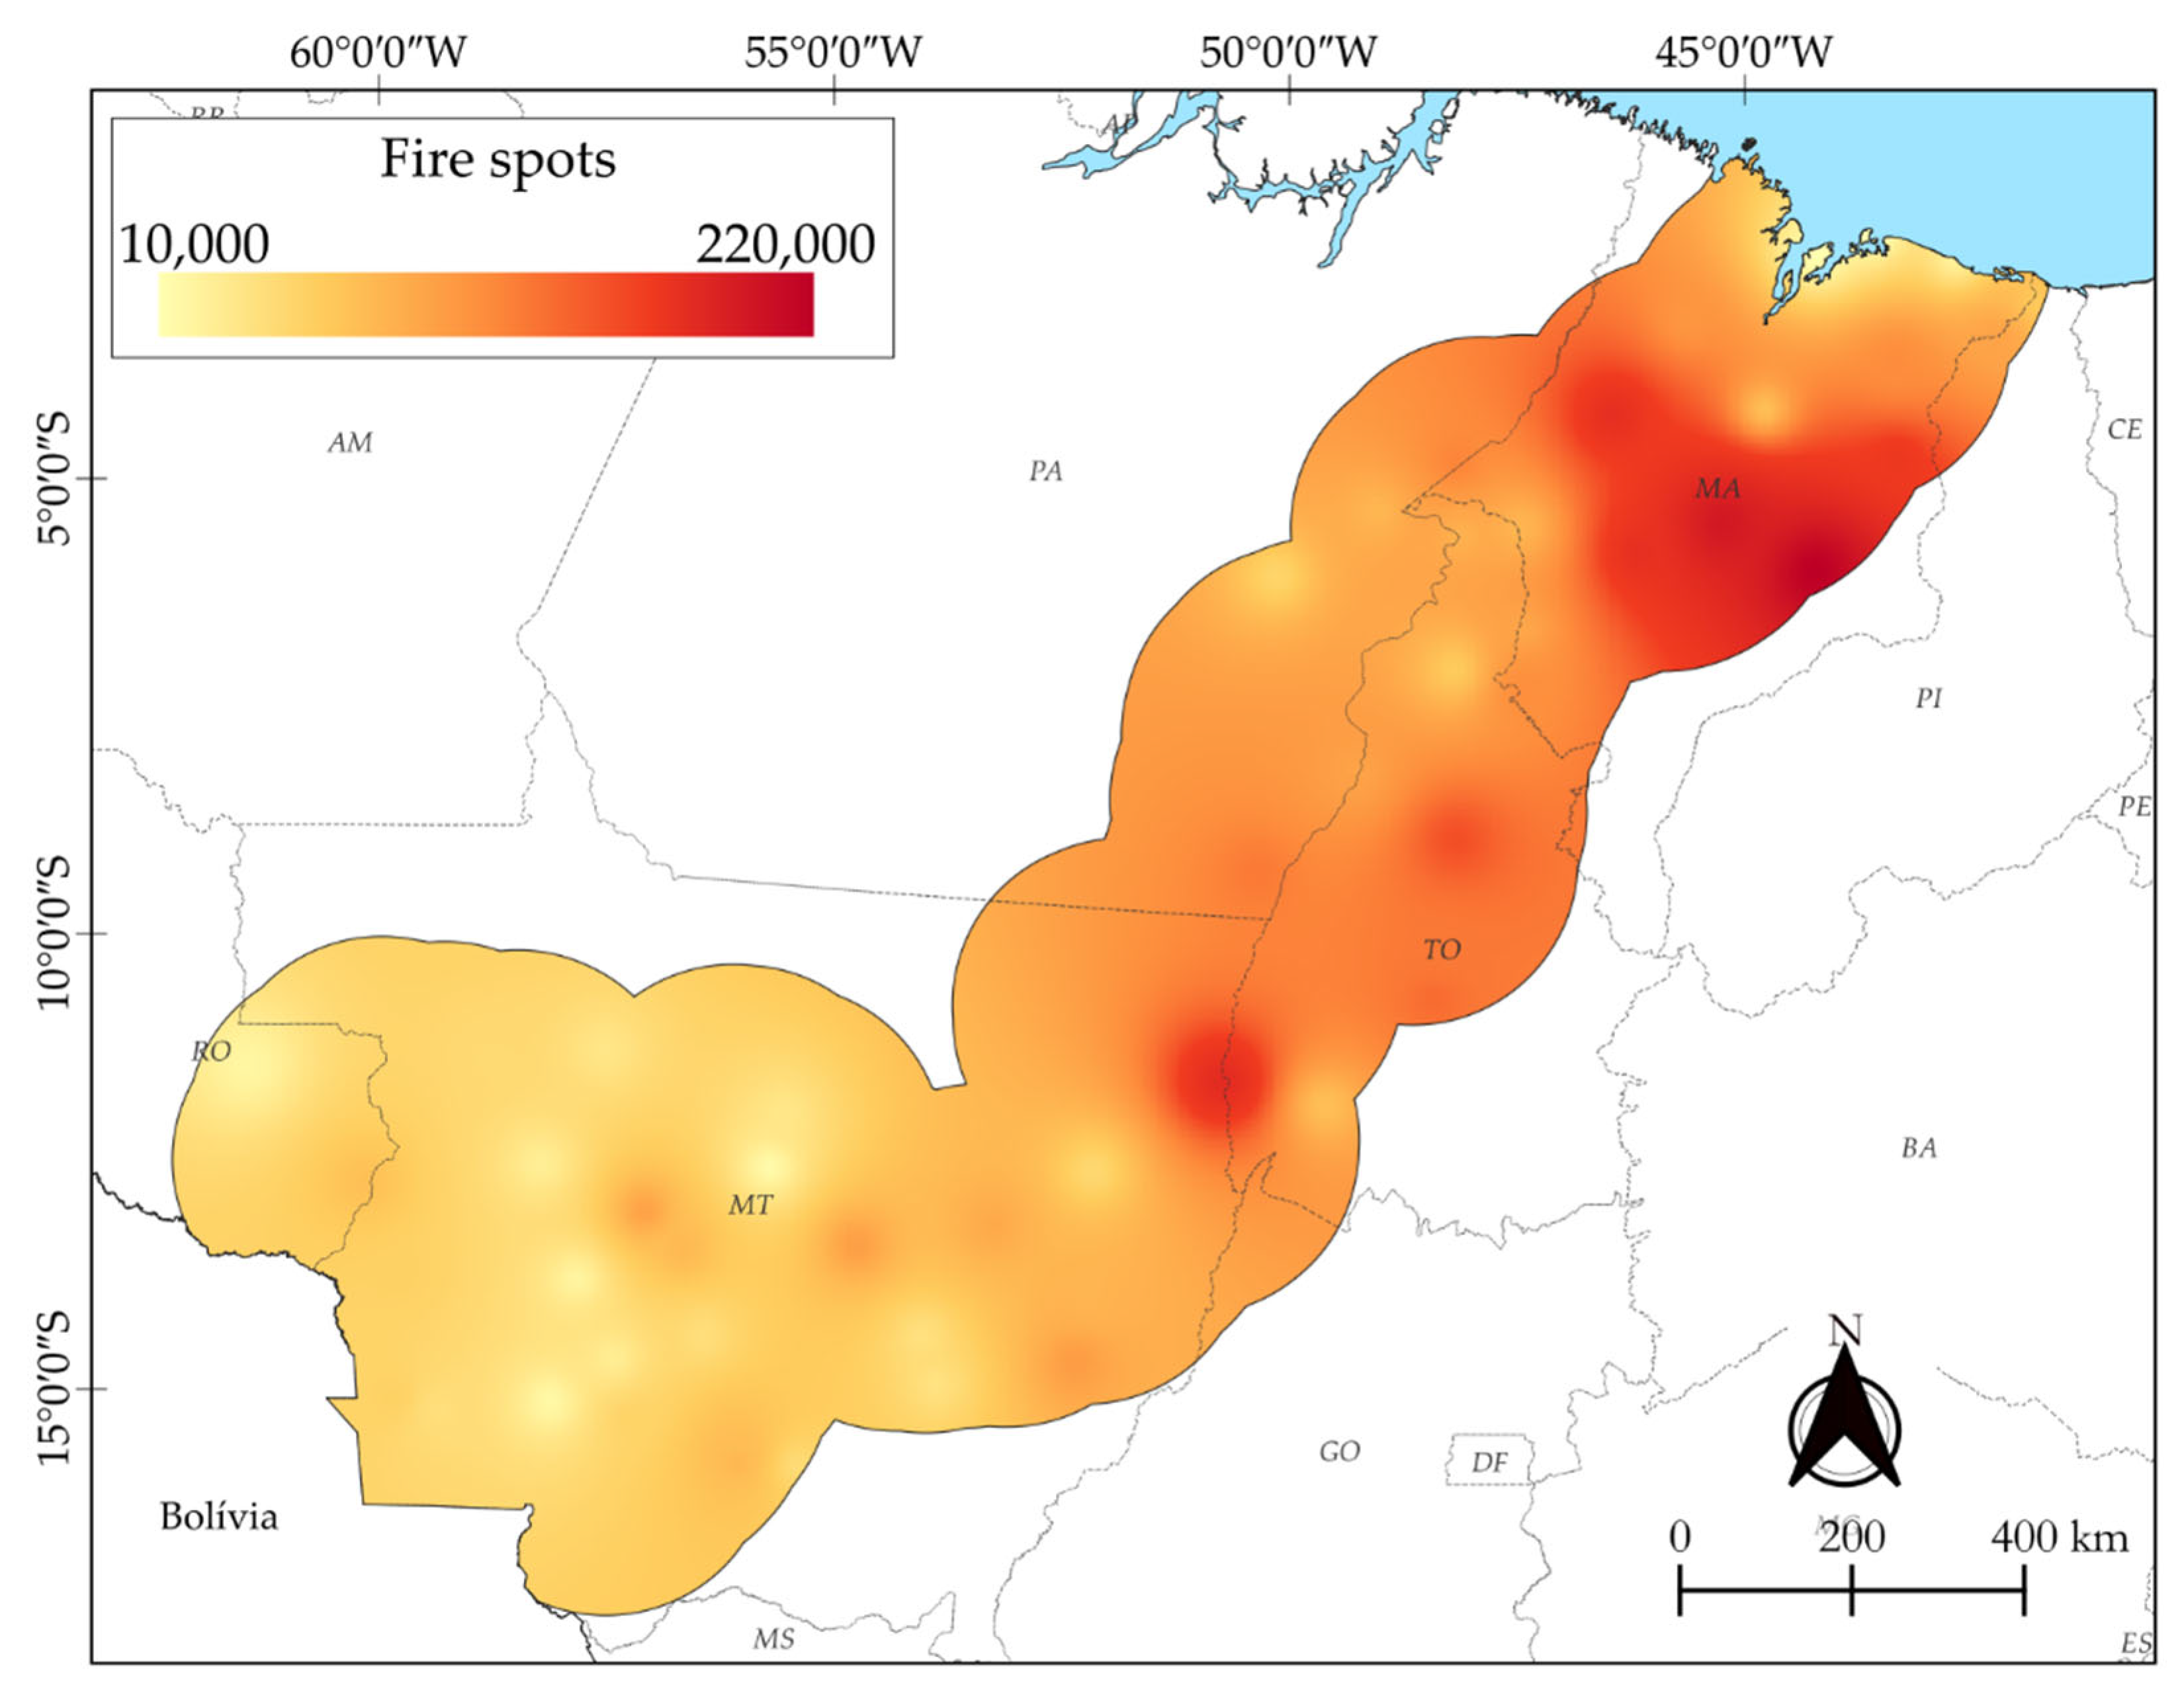
Figure 12.
Spatialization of accuracy in fire occurrence predictions (AP), according to the skill score method, of the relationship between fire indices and fire hotspots, using variables from meteorological stations and reanalysis data.
Figure 12.
Spatialization of accuracy in fire occurrence predictions (AP), according to the skill score method, of the relationship between fire indices and fire hotspots, using variables from meteorological stations and reanalysis data.
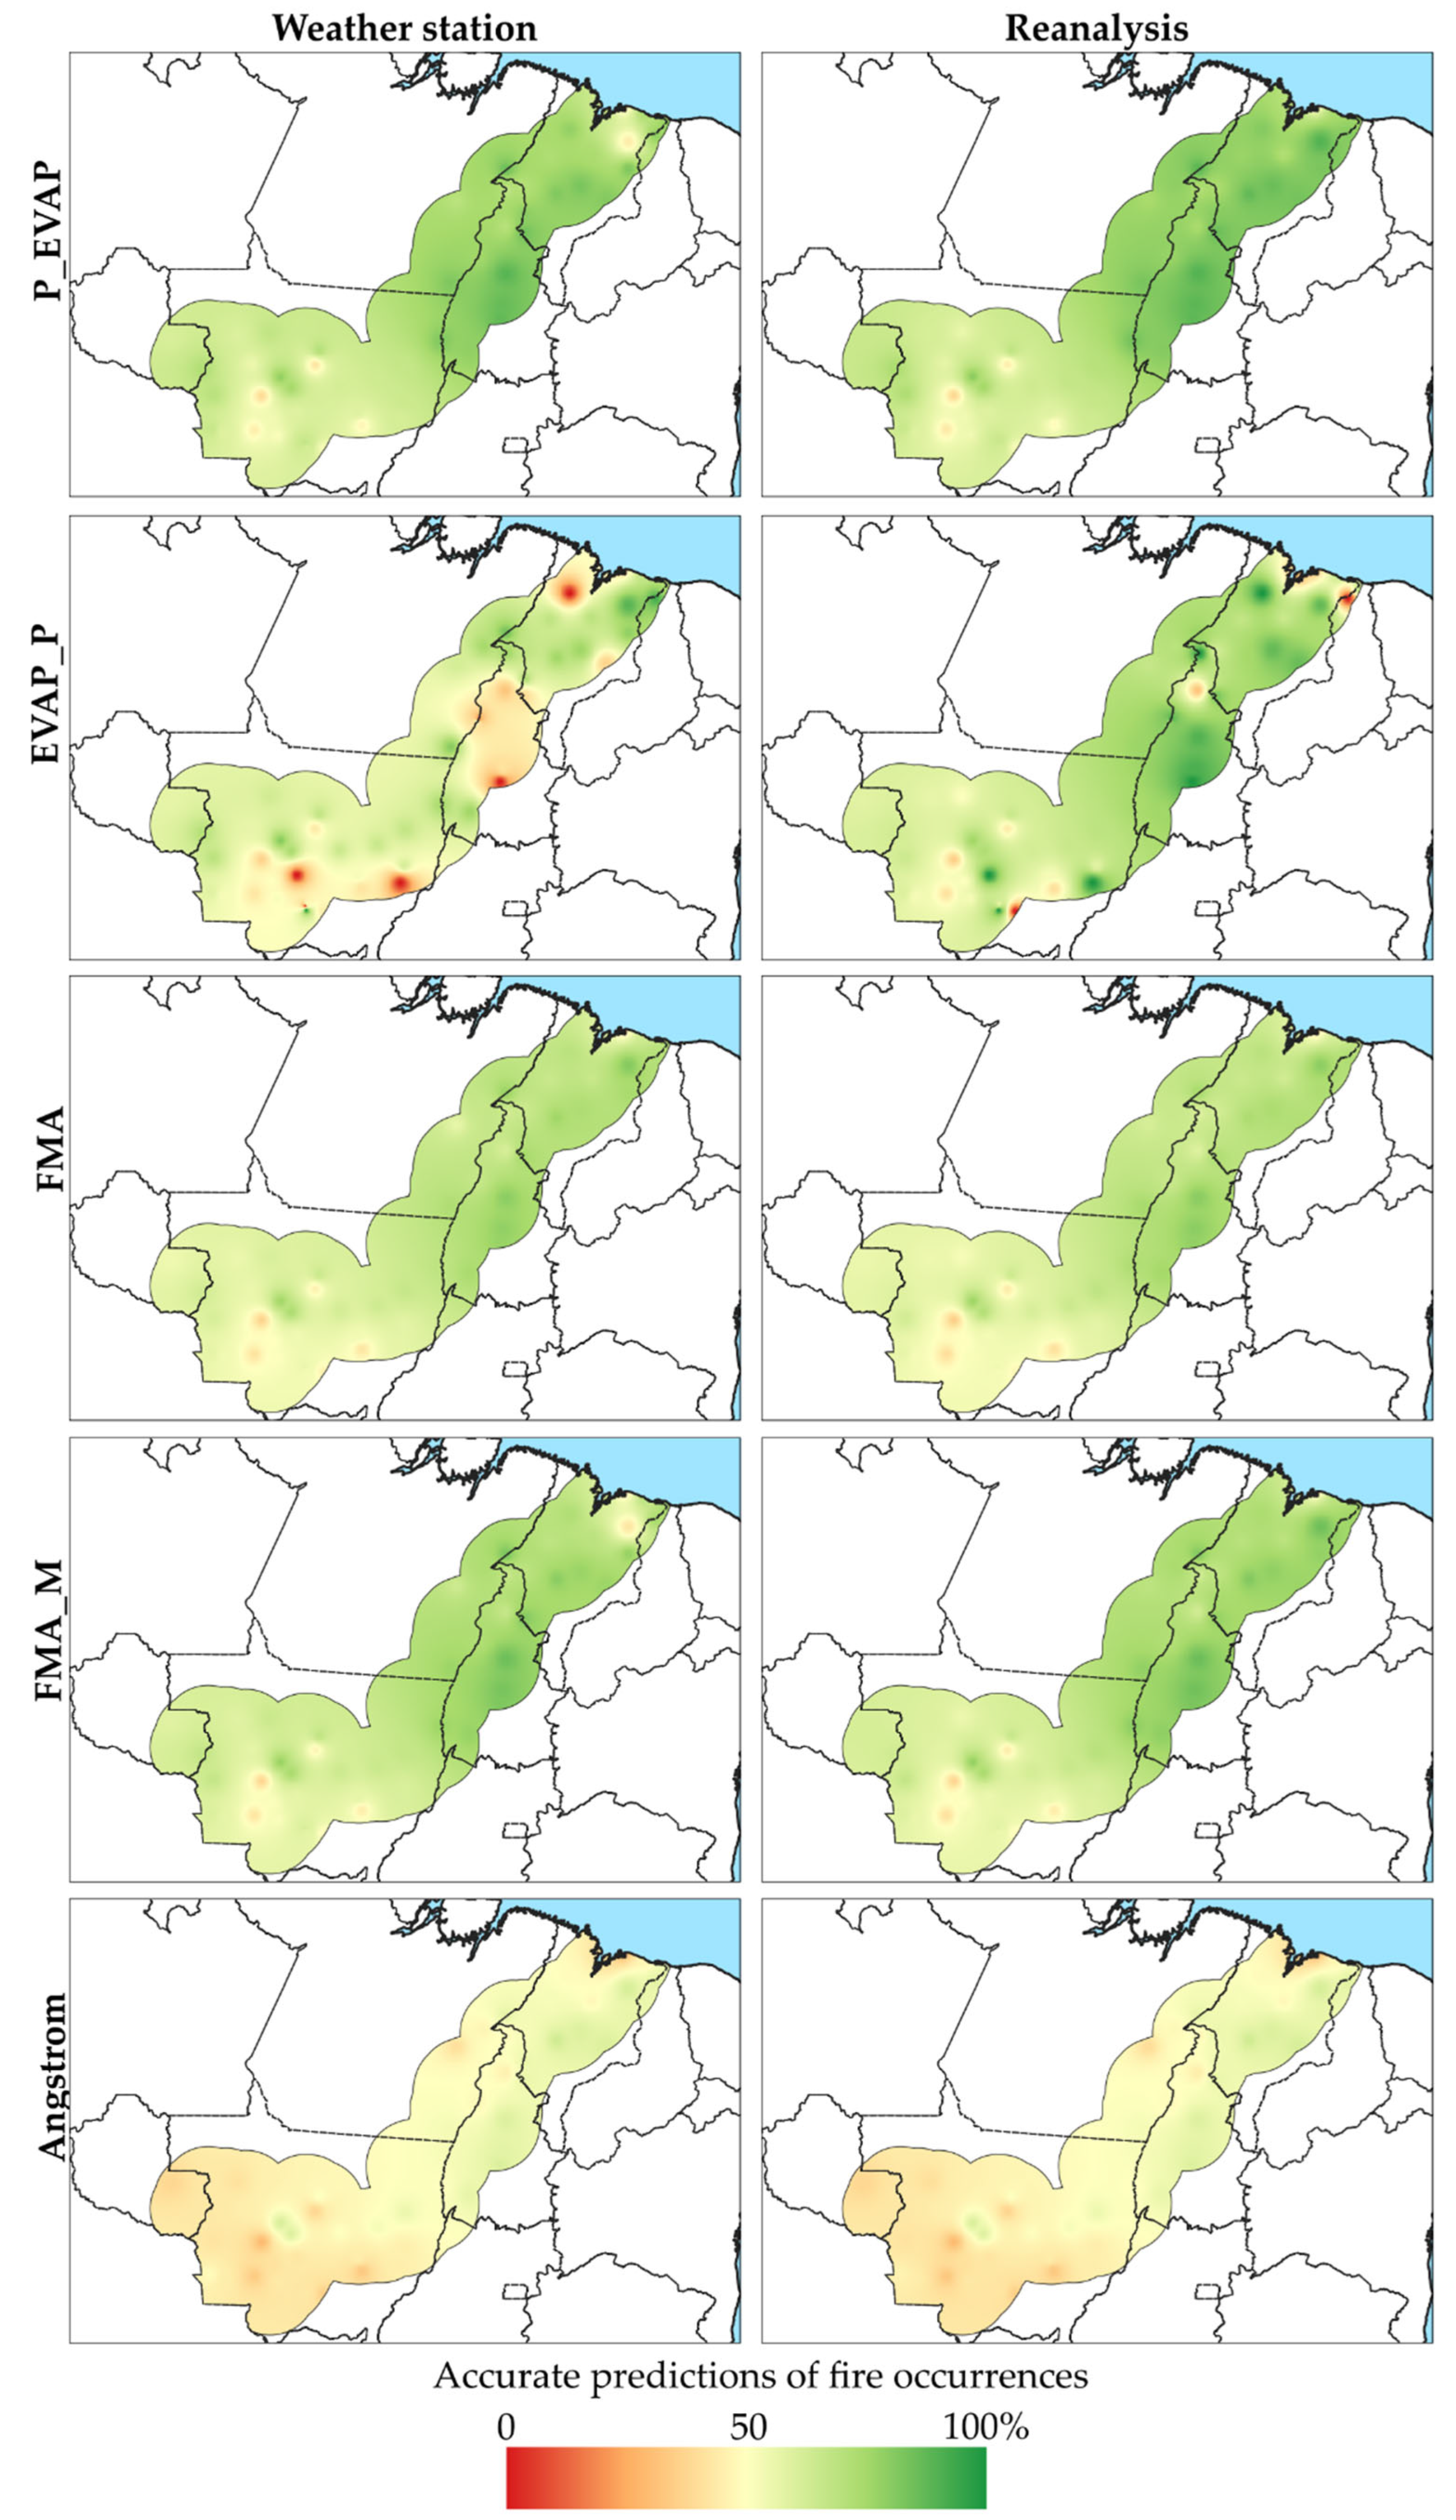
Figure 13.
Spatialization of the Success Percentage (SP) of the relationship between fire danger indices and fire outbreaks, using variables from meteorological stations and re-analysis data.
Figure 13.
Spatialization of the Success Percentage (SP) of the relationship between fire danger indices and fire outbreaks, using variables from meteorological stations and re-analysis data.
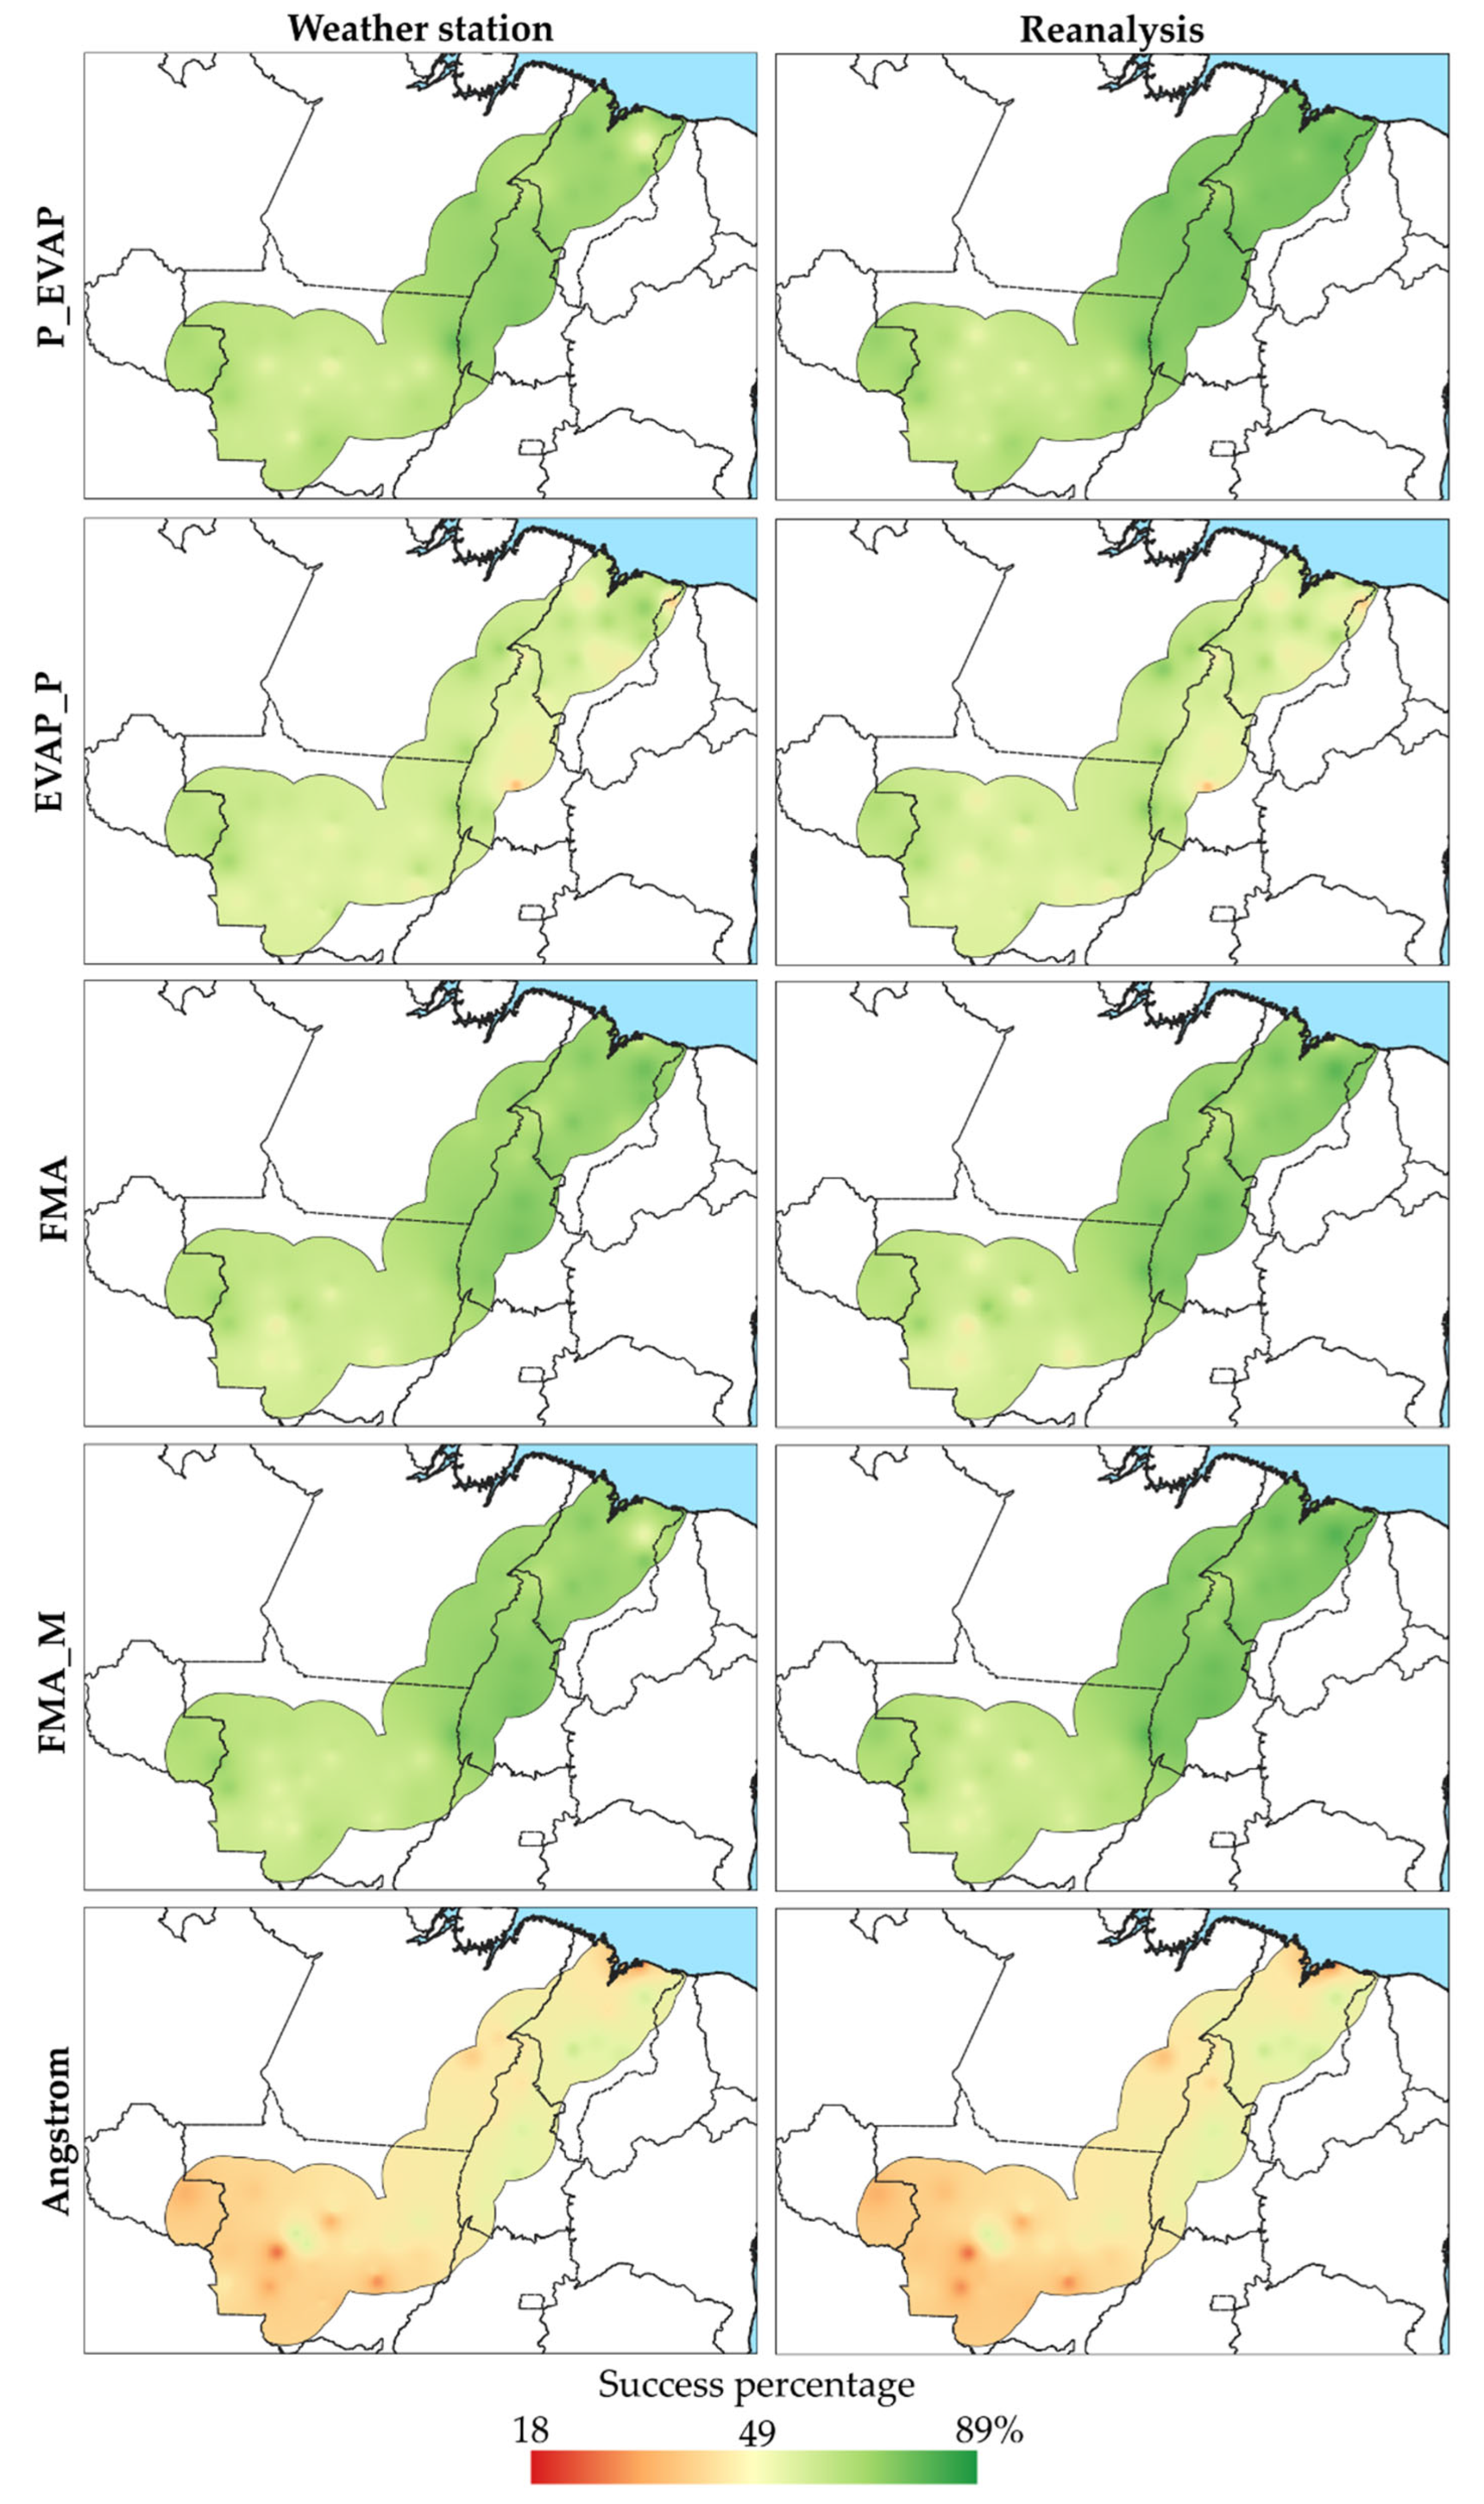

Table 1.
Restrictions on the application of fire danger indices: FMA, FMA+, P-EVAP and EVAP/P.
| Daily rainfall (mm) | Changes to the calculations |
| FMA and FMA+ | |
| ≤ 2.4 | None |
| 2.5 a 4.9 | Subtract 30% of the FMA calculated the previous day, and add (100/H) for the day |
| 5.0 a 9.9 | Subtract 60% of the FMA calculated the previous day, and add (100/H) for the day |
| 10.0 a 12.9 | Subtract 80% of the FMA calculated the previous day, and add (100/H) for the day |
| > 12.9 | Stop the calculation (FMA = 0) and restart the summation the following day |
| P-EVAP | |
| ≤ 2.0 | None |
| 2.1 a 5.0 | Subtract 25% from the value of G calculated the previous day, and add (d.t) for the current day |
| 5.1 a 8.0 | Subtract 50% from the value of G calculated the previous day, and add (d.t) for the current day |
| 8.1 a 10.0 | Abandon the previous summation and restart the calculation, that is, G = (d.t) of the day |
| EVAP/P | |
| < 1.0 | It's not included in the calculation |
| 1.0-15.0 | Divide the previous day's EVAP/P by the day's rainfall. |
| >15 | Interrupt the calculation and restart the next day or when the rain stops. On the day of the rain, EVAP/P = 0.00 |
Table 2.
Grouping into fire danger classes according to the danger index.
| Danger classes | FMA | FMA+ | P-EVAP | EVAP/P | Ängstrom |
| Null | ≤ 1.0 | ≤ 3.0 | ≤ -5 | <11 | < 4.5 |
| Low | 1.1 to 3.0 | 3.1 to 8.0 | -5 to -15 | 11 to 30 | 4.5 to 4.2 |
| Medium | 3.1 to 8.0 | 8.1 to 14.0 | -15 to -35 | 30 to 56 | 4.2 to 4 |
| High | 8.1 to 20.0 | 14.1 to 24.0 | -35 to -75 | 56 to 93 | 4 to 3.5 |
| Very High | > 20.0 | > 24.0 | < -75 | > 93 | < 3.5 |
Table 3.
Contingency of Skill Score.
|
Forecast |
Observed |
Total Forecast |
|
| Fire | No Fire | ||
| Fire | A | b | N2 = a + b |
| No Fire | C | d | N4 = c + d |
| Total Forecast | N1= a + c | N3 = b + d | N = a + b +c + d |
*The variables needed to perform the calculations are: N - Total number of observations. N = a + b + c + d; G - Number of correct predictions. G = a + d; p - Probability of having at least one event per day. p = N1 / N; q - Probability of exceeding the index limit value. q = N2 / N; H - Expected number of correct predictions. H = N * (1 – p) * (1 – q) + N * p * q; SS - Skill Score. SS = (G – H) / (N – H); PS - Success rate. PS = G / N; Accuracy in predicting fire occurrences = a / N2; Accuracy in predicting non-occurrences = d / N4. Based on: Torres and Ribeiro [37]; Casavecchia et al. [38].
Table 4.
Mann-Whitney test for meteorological variables obtained from measurements at weather stations (observed) and reanalysis (estimated), in the states located in the Cerrado-Amazon transition zone.
Table 4.
Mann-Whitney test for meteorological variables obtained from measurements at weather stations (observed) and reanalysis (estimated), in the states located in the Cerrado-Amazon transition zone.
| By state in the study area | ||||||||
| States / Variables | MT | TO | MA | PA | PI | RO | ||
| Rainfall | 0.00 | 0.00 | 0.00 | 0.00 | 0.00 | 0.00 | ||
| Maximum air temperature (Tmax) | 0.28 | 0.31 | 0.16 | 0.15 | 0.24 | 0.03 | ||
| Average air temperature (Tmed) | 0.14 | 0.21 | 0.19 | 0.19 | 0.09 | 0.32 | ||
| Minimum air temperature (Tmin) | 0.03 | 0.06 | 0.16 | 0.03 | 0.10 | 0.04 | ||
| Medium relative humidity (RHmed) | 0.05 | 0.08 | 0.20 | 0.00 | 0.19 | 0.31 | ||
| Minimum relative humidity (RHmin) | 0.30 | 0.38 | 0.31 | 0.20 | 0.10 | 0.04 | ||
| Medium wind speed (WS) | 0.12 | 0.15 | 0.19 | 0.14 | 0.01 | 0.01 | ||
| By variables | ||||||||
| Values | Chuva | Tmax | Tmed | Tmin | Urmed | Urmin | Vvento | |
| Average | 0.00 | 0.23 | 0.17 | 0.08 | 0.10 | 0.29 | 0.14 | |
| Maximum | 0.00 | 0.98 | 0.99 | 0.92 | 1.00 | 0.98 | 0.91 | |
| Minimum | 0.00 | 0.00 | 0.00 | 0.00 | 0.00 | 0.00 | 0.00 | |
Table 5.
Statistical performance (MBE, RMSE and d'Willmot) of the FMA, FMA+, Angstrom, P-EVAP and EVAP/P indices, estimated with meteorological station and reanalysis data, for the Cerrado-Amazon Transition, which covers parts of the territories of the states of MA, MT, PA, PI, RO and TO.
Table 5.
Statistical performance (MBE, RMSE and d'Willmot) of the FMA, FMA+, Angstrom, P-EVAP and EVAP/P indices, estimated with meteorological station and reanalysis data, for the Cerrado-Amazon Transition, which covers parts of the territories of the states of MA, MT, PA, PI, RO and TO.
| States | |||||||
| Indexes | MA | MT | PA | PI | RO | TO | |
| MBE | |||||||
| Angstrom | -0.014 | -0.052 | -0.040 | -0.070 | 0 | -0.007 | |
| EVAP/P | 164.268 | 66.911 | 123.403 | 264.61 | 72.445 | 109.011 | |
| FMA | 46.487 | 32.503 | 33.045 | 76.34 | 30.855 | 31.149 | |
| FMA+ | 35.940 | 22.248 | 22.208 | 61.13 | 21.66 | 28.407 | |
| P-EVAP | -40.736 | -15.864 | -35.695 | -88.835 | -6.965 | -37.881 | |
| RMSE | |||||||
| Angstrom | 0.764 | 0.916 | 0.815 | 1.02 | 0.72 | 0.91 | |
| EVAP/P | 609.426 | 281.324 | 340.758 | 554.9 | 212.805 | 290.754 | |
| FMA | 132.657 | 129.974 | 105.455 | 166.055 | 106.565 | 126.481 | |
| FMA+ | 121.0984 | 120.350 | 95.028 | 154.565 | 91.910 | 130.037 | |
| P-EVAP | 169.284 | 115.452 | 128.575 | 222.945 | 73.88 | 140.871 | |
| d Willmott | |||||||
| Angstrom | 0.747 | 0.730 | 0.758 | 0.71 | 0.795 | 0.635 | |
| EVAP/P | 0.496 | 0.577 | 0.608 | 0.54 | 0.665 | 0.613 | |
| FMA | 0.699 | 0.728 | 0.762 | 0.62 | 0.74 | 0.732 | |
| FMA+ | 0.716 | 0.741 | 0.765 | 0.65 | 0.8 | 0.718 | |
| P-EVAP | 0.728 | 0.737 | 0.725 | 0.7 | 0.83 | 0.736 | |
Table 6.
Average Skill Score of fire hazard indices in the study area.
| Danger Indices | Meteorological station | Reanalysis |
| FMA | 0.35 | 0.35 |
| FMA+ | 0.38 | 0.40 |
| Angstron | 0.01 | 0.08 |
| P-EVAP | 0.40 | 0.45 |
| EVAP-P | 0.34 | 0.30 |
Disclaimer/Publisher’s Note: The statements, opinions and data contained in all publications are solely those of the individual author(s) and contributor(s) and not of MDPI and/or the editor(s). MDPI and/or the editor(s) disclaim responsibility for any injury to people or property resulting from any ideas, methods, instructions or products referred to in the content. |
© 2026 by the authors. Licensee MDPI, Basel, Switzerland. This article is an open access article distributed under the terms and conditions of the Creative Commons Attribution (CC BY) license (http://creativecommons.org/licenses/by/4.0/).
Copyright: This open access article is published under a Creative Commons CC BY 4.0 license, which permit the free download, distribution, and reuse, provided that the author and preprint are cited in any reuse.


