
Submitted:
20 January 2026
Posted:
22 January 2026
You are already at the latest version
Abstract
To improve the efficiency of injecting intensifying chemical slugs into injection wells, new formulations have been proposed. These compositions are based on high-tonnage surfactants combined with industrially produced nanoparticles. Experiments show that adding silica- or carbon-based nanoparticles to surfactant compositions doubles the oil displacement coefficient from Pashian sandstones. Carbon nanoparticles derived from shungite mineral were also tested. Regardless of nanoparticle type, a specific surfactant composition was highly effective. This composition contains anionic and nonionic surfactants in a 1:2 ratio at a 1% concentration in fresh water, with a 1% nanoparticle additive. It increases the oil displacement coefficient by 19.0-23.2% after waterflooding. It has been established that in the proposed technology for near-wellbore formation treatment, the role of nanoparticles lies in a transport function due to the formation of nanoparticle aggregates with surfactant micelles, representing dynamic structures sized 25-75 μm. These aggregates break apart when passing through narrow pore throats. This delivers surfactants directly to the oil-rock interface, mobilizing residual oil and improving displacement. Nanoparticles of silica with different wettability, during filtration, are deposited in pore channels, leading to intra-pore flow redistribution. Together with the increased microscopic sweep efficiency from surfactants, it results in lower residual oil saturation.
Keywords:
enhanced oil recovery
; surfactant
; nanoparticles
; sandstone
; laboratory studies
; oil displacement coefficient
; residual resistance factor
1. Introduction
The application of nanotechnology in the oil industry represents one of the most promising and rapidly developing avenues for enhancing the efficiency of oil production processes [1]. In this sector, the use of nanoparticles in enhanced oil recovery (EOR) technologies accounts for 32% of the focus, while the remaining 68% pertains to other areas of petroleum engineering: drilling [2], well completion [3], oil and water treatment [4], among others. Significant attention is devoted to enhancing reservoir recovery using chemical methods with nanoparticle additives, as their combinations can multiplicatively increase oil production (according to laboratory evaluations [5]).
Let us consider in more detail the application of surfactants with nanoparticles in reservoir waterflooding. A substantial body of literature is dedicated to this topic. At the current stage, the primary focus lies on studying the mechanism of reservoir stimulation [6,7], as well as the interaction of nanoparticles with surfactant molecules (micelles) [8], and with oil and rock [9].
Since losses due to surfactant adsorption [10,11] and their precipitation as calcium and magnesium salts upon contact with formation water [12,13,14], alongside the high cost of reagents, represent major negative factors affecting the economics of surfactant flooding projects, most researchers agree on the following. The ability of nanoparticles to form associates with surfactants and to flow through porous media enables the transport and subsequent release of surfactants at targeted locations within the reservoir [15,16,17]. This process minimizes losses from both adsorption and precipitation with hardness ions.
Work [8] demonstrated that, due to shielded Coulomb interaction, approximately 14 micelles of a nonionic surfactant adsorb on average onto each 20 nm silica nanoparticle. Many studies emphasize the role of nanoparticles in reducing surfactant adsorption onto the rock by being preferentially adsorbed themselves. For instance, research [18] established that a composition of 0.2% sodium dodecyl sulfate and 0.2% hydrophilic silica nanoparticles (SiO₂ size 15 nm) doubles the oil displacement coefficient, primarily due to reduced surfactant adsorption on the rock. In article [9], both hydrophilic and hydrophobic silica nanoparticles were studied in mixtures with anionic surfactants. In both cases, a decrease in surfactant adsorption and an increase in the oil displacement coefficient were observed.
Compositions based on surfactants and inorganic nanoparticles [19] alter rock wettability and enhance surfactant transport efficiency [20,21,22]. Electrostatic interactions between the system's components play a crucial role in these processes. When the surface charges of the reservoir rock and the nanoparticles are similar, predominant adsorption of surfactants onto the rock surface occurs, without a significant impact on interfacial tension. In cases where strong associates form between surfactants and nanoparticles, a reduction in interfacial tension and a decrease in adsorption magnitude are observed [20,23,24]. In this mechanism, nanoparticles effectively transport surfactants to the water/oil interface with minimal adsorption losses. When both the nanoparticles and the reservoir rock carry a negative charge, electrostatic repulsion takes place. This causes surfactant micelles to localize at the phase interface, significantly lowering the interfacial tension [24,25].
The role of electrostatic interactions is also highlighted in works [26,27]. When similarly charged nanoparticles of nanosilica and anionic surfactants interact, a more negative zeta potential arises due to the adsorption of surfactants onto the nanoparticle surface in a "head-up, tail-down" orientation, as the polar head group of the surfactant is repelled by the SiO₂ surface. This type of interaction reduces nanoparticle agglomeration and enhances dispersion stability, since the presence of anionic surfactant adsorbed on the nanoparticle surface leads to significant repulsive interactions. These effects depend on the pH and ionic strength of the solution, which allows for predicting the behavior of nanoparticle-surfactant micelle systems under reservoir conditions. The association of similarly charged particles leads to the transport of a greater amount of nanoparticles and surfactant to the interface.
The paper [28] also corroborates the conclusion about a synergistic mechanism of interfacial tension reduction due to the repulsion between similarly charged surfactants and nanoparticles, which facilitates the diffusion of surfactants to the liquid/liquid and liquid/rock interfaces. In the case where a composition of an anionic and a nonionic surfactant (alkylarylsulfonic acid and oxyethylated C₁₂–C₁₃ alcohols) as well as a carrier – TiO₂ nanoparticles (concentration 2000 ppm) – was used, both the interfacial tension and surfactant adsorption in the porous medium were reduced by half [11].
Addressing the issue of synergistic interfacial tension reduction in surfactant-nanoparticle systems, it should be noted that this mechanism for enhancing displacement efficiency is not always realized. For instance, the study [29] demonstrated that a system comprising sodium dodecyl sulfate, Tween-20, and nanosilica did not show a significant reduction in interfacial tension; however, when acting on a porous medium, the oil displacement coefficient increased manifold.
An important observation regarding the specific behavior of nanoparticles during filtration under reservoir conditions was made in the study [30]: specifically, fluids containing nanoparticles exhibit Newtonian behavior at low shear rates and non-Newtonian behavior at high shear rates. This property must be taken into account both when designing well operations and when preparing injection fluids.
Carbon-based nanoparticles (nanotubes, fullerenes, carbon blacks, graphene) can be successfully employed as carriers for surfactants [19,31,32]. In this case, the hydrophobic tail of the surfactant interacts with the nanoparticles via van der Waals forces. Furthermore, nanoparticles stabilize microemulsions by preventing their coalescence [33,34], which results in synergistic enhancements of the oil displacement coefficient.
Studies [34,35] have highlighted the potential of using sulfonated graphene oxide in reservoirs with high formation water salinity, which is attributed to its stability against mineral aggression. In particular, it was found that at a concentration of 2 mg/L of sulfonated graphene, an increase in the displacement coefficient of 16–19% is achieved, whereby the interfacial tension decreases, but not to ultralow values, and the predominant effect is attained due to a change in wettability.
An interesting report is presented in paper [10] on the use of cyclodextrins for surfactant delivery deep into the reservoir. In this case, the surfactant forms a molecular "host-guest" complex with cyclodextrin due to the cavity in the center of the oligosaccharide molecule. However, the practical application of this elegant solution is hindered – it is costly and inefficient in terms of transport: a single cyclodextrin molecule carries only one surfactant molecule.
The article also described problems with the stability of molecular complexes in carbonate reservoirs. It should be noted that for carbonate reservoir conditions, zwitterionic surfactants in combination with hydrophobic nanosilica [36], as well as the anionic surfactant sodium dodecyl sulfate with hydrophilic nanosilica [37], have demonstrated good efficiency. In the latter case, the increase in the displacement coefficient amounted to 15.1% at nanosilica and sodium dodecyl sulfate concentrations of 0.03% and 0.16%, respectively.
Thus, according to the results of laboratory studies, the application of nanoparticles in conjunction with surfactants for waterflooding to enhance oil recovery demonstrates the undeniable promise of this approach. The main mechanisms of synergistic action have been identified: they consist of the transport role of nanoparticles, the reduction of surfactant adsorption, the alteration of wettability, as well as the reduction of interfacial tension (though not in all cases).
However, to date, the industrial piloting of the method remains very limited. This is due to high economic risks associated with the lack of reliable data on the costs of surfactant-nanoparticle flooding compared to the profit from incremental oil production [38]. For example, field trials have been conducted in Colombian heavy oil fields using anionic surfactants at a concentration of 1000 mg/L and hydrophilic nanosilica at a concentration of 100 mg/L. According to laboratory study results, surfactant adsorption decreased by 40%, and the incremental production during the field test amounted to 78 barrels per day, with a cumulative incremental production of 30,035 barrels [30]. A review paper [39] notes that, despite significant research progress, the application of nanomaterials combined with chemical agents in enhanced oil recovery technologies involves risks of failing to achieve project profitability. A synthesis of field test results described in the review [40] allows us to conclude that for high-viscosity Colombian fields, the use of nanofluids combined with steam injection at 250 °C ensured an effect duration of up to 269 days for one project, as well as the overall profitability of the conducted pilot. In Saudi Arabia, the injection of carbon nanoparticles in diesel fuel into a reservoir with a temperature of 100 °C also proved cost-effective, and a rapid response to the injection was observed.
It should be noted that assessments by different research groups range from cautious [41,42] to highly encouraging – for the additional recovery of residual reserves in mature fields and the effective development of hard-to-recover reserves [43]. Nevertheless, publications on field trials or pre-project preparation for field operations [44,45,46] underscore the promise of nanotechnology application and the necessity of continuing both laboratory and field research.
In conclusion of the literature review, it is pertinent to highlight the effectiveness of combining low-salinity waterflooding with the injection of surfactant-nanoparticle solutions into sandstone and carbonate reservoirs. Since, in the absence of salt aggression, the dynamic adsorption-desorption of surfactant micelles on the nanoparticle surface is not complicated by issues related to hard ions [47], the delivery of surfactants deep into the reservoir by nanoparticles is achieved without impediment in this case.
Returning to the issue of the economic efficiency of chemical flooding projects, it should be noted that achieving a positive economic outcome is typically accompanied by tax incentives from the state (a prime example is the PRC [48]). Without tax stimulation, projects, even those with fairly good technological efficiency, are generally unprofitable [49]. At the same time, if surfactant injection is carried out using small-volume slugs with high reagent concentration, especially when combined with gel treatments for conformance control [50,51], high project profitability is achieved.
Based on these a priori conditions, we formulate the objective of the present work, which is to provide experimental justification for the injection of slugs of highly concentrated surfactant-nanoparticle compositions to intensify oil production, utilizing readily available reagents.
In justifying the composition of surfactants and nanoparticles for investigation in this work, we took into account information from the following literature sources. In particular, the publication [52] established that sodium dodecyl sulfate solutions increase the oil displacement coefficient by altering the wetting contact angle; therefore, we believe that one component of the surfactant composition should be of an anionic nature. In paper [51], based on field studies, we established that treatment with a small-volume, highly concentrated (2%) surfactant composition [53], consisting of alkyl- and arylsulfonates and oxyethylated nonylphenol with an oxyethylation degree of 6 (commercial name Neonol AF9-6), leads to good specific injection efficiency (285.74 tons of oil per 1 ton of the commercial form of the surfactant composition). The mass ratio of nonionic surfactant (NS) to anionic surfactant (AS) was 2:1 – at this ratio, the detergency of the surfactant mixture is maximal [54,55]. Publication [9] investigated a composition of anionic surfactants with hydrophilic and hydrophobic nanosilicas for oil reservoir flooding, resulting in a significant reduction in surfactant adsorption due to nanoparticle additives at a mass ratio of surfactant to nanosilica of 1:1, which leads to a substantial increase in the oil displacement coefficient. According to work [56], an increase in nanoparticle content in the displacing agent from 0.01 to 3.00% causes a uniform increase in the oil displacement coefficient.
In our work, several types of industrially produced nanosilicas, gas black, graphene, as well as micro-sized aggregates of the natural mineral shungite were studied as nanoparticles.
Thus, based on literature sources as well as our own experience, we have chosen to study the displacement efficiency of a surfactant composition consisting of a mixture of alkyl- and arylsulfonates and oxyethylated nonylphenol with an oxyethylation degree of 6, with the addition of hydrophilic and hydrophobic nanoparticles.
2. Materials and Methods
2.1. Tested Compositions and Additives
The target object of the study was the Pashian sandstones from one of the fields in the Volga-Ural petroleum province. The sandstone bodies of the Pashian horizon are represented by high-permeability reservoirs within the Devonian terrigenous sequence [57,58]. The residual oil saturation after waterflooding of the Pashian sandstones consists of both capillary-trapped and film-bound oil, with an increase in the water cut of the production leading to a higher proportion of heavy polar components in the oil (according to photometric studies described in [58]).
For filtration experiments, drilled sandstone core plugs 3 cm in length and 3 cm in diameter were used, from which linear models with permeabilities ranging from 200.3 to 262.3 mD were assembled.
As the base of the intensifying composition, the formulation obtained according to[53], containing anionic and nonionic surfactants, was studied.
The nanosilica fillers added to the surfactant composition were: white carbon black "Filler BS-120, uncompacted" ("BS-120 NU") (JSC "Bashkir Soda Company", Sterlitamak, Russia); hydrophilic nanosilica grade HCSIL200 (Shandong Haochuang Material Co, Ltd., Dezhou, China); and hydrophobic nanosilica – modified amorphous silica grade RX380, Technical Specifications TU 2458-010-3851 8981-2012 TU2458-010-3851 8981-2012 (with revision № 1) (RDC “InTechService”, Ufa, Russia). The specific surface area of the nanosilica samples of grades HCSIL200 and RX380 was determined by the manufacturers using the Brunauer–Emmett–Teller (BET) method; that of the white carbon black BS-120 NU – by the phenol adsorption method. The primary particle size was recalculated based on the numerical value of the filler's specific surface area provided in the technical data sheets (Equation 1, Table 1).
where d is the calculated particle size, nm; ρ - density of silicon dioxide, taken as 2.2 cm3/g; s - specific surface of the additive, m2/g.
The following materials were used as carbon-based fillers: graphene, gas black (gas black), and the mineral shungite. The manufacturer-specified characteristics of the graphene powder RG-S1 (LLC “RUSGRAFENE”, Moscow, Russia) are: carbon content not less than 99%; micro-particle thickness – from 3 to 10 nm; micro-particle diameter – from 0.5 to 10 μm; specific surface area (by BET analysis) – 15 cm²/g. The gas black was represented by a pigment sample used for artistic works (LLC "Sibirskaya Palitra", Novosibirsk, Russia, TU-20.12.24-008-03877465-2017), with a particle size of 10–30 nm. The micro-sized aggregates of the carbonaceous mineral shungite were mechanoactivated and elutriated according to the procedure described in [59].
2.2. Determination of Interfacial Tension
The interfacial tension of surfactant-nanoparticle composition solutions at the bound-ary with kerosene was determined using a DSA-25S tensiometer (KRÜSS GmbH, Hamburg, Germany) at 40 °C. The measurement method involved analyzing the shape of a pendant drop using the ADVANCED software (KRÜSS GmbH, Hamburg, Germany) based on the Young–Laplace method.
2.3. Determination of the Wetting Contact Angle
Experiments to assess the wetting ability of surfactant solutions were conducted using a digital video microscope with an Insein LiFung camera (Shenzhen Insein Li Fung Trade Co. Limited, Shenzhen, China), which allows for photo-graphing liquid droplets on the rock surface with subsequent measurement of the wetting contact angle magnitude in the ImageJ editor (National Institutes of Health, Bethesda, Maryland, USA). The angle between the tangent line to the droplet surface at the three-phase contact line (air, liquid, and rock sample surface) was determined from the photograph (the wetting contact angle is measured into the liquid phase).
The preparation of a hydrophobic surface from disaggregated core material of the Pashian horizon for contact angle measurement involved the following steps:
- Preparation of synthetic oil, consisting of 50% deasphalted crude oil and 50% deposits of heavy components with the following composition: 22.48% asphaltenes, 11.40% resins, 18.02% paraffins, and 48.10% petroleum residue – followed by normalization, which involved thermostating at 90 °C for 4 hours;
- Thorough grinding in a porcelain mortar of an equal amount of disaggregated core and synthetic oil until a homogeneous wax-like mass was obtained;
- Placing the wax-like mass into a hand press and molding a pellet with a diameter of 20 mm and a thickness of 3 mm.
As an alternative hydrophobic surface for determining the contact angle of the surfactant-nanoparticle composition, a Teflon substrate with uniform roughness was used (Figure 1).
2.4. Determination of Particle Size
The particle size distribution and average particle size were determined using a SALD-2300 laser diffraction particle size analyzer (Shimadzu, Kyoto, Japan) with a flow cell SALD-MS23, which allows for measuring particle sizes in the range from 17 nm to 2500 μm. For calculating the size of carbon particles and nanosilicas, their refractive indices were taken as 1.50 [60] and 1.48 [61], respectively.
2.5. Determination of Pore Size Distribution
The geometric characteristics of pore channels in the Pashian sandstones were evaluated based on capillary pressure data. Capillary pressure curves were obtained using a V32-32 instrument (LLC "Amplituda R&D Center", Zelenograd, Russia) in accordance with the industry standard [62]. Cylindrical rock samples prepared according to the state standard [63] were used to establish the relationship between water saturation and capillary pressure. Prior to testing, the semi-permeable ceramic membrane and the samples were saturated with formation water of specified mineralization. The obtained curves of water saturation versus capillary pressure allowed for determining the pore size distribution.
2.6. Determination of Sedimentation Stability of Colloidal Solutions
The stability of the colloidal solution samples was determined at the reservoir temperature of 40°C. A method based on the use of the Formulaction Turbiscan Tower (Formulaction SA, Toulouse, France) was applied, which allows for a comprehensive characterization of the colloidal stability of the solutions under study. The Turbiscan technologies for the direct analysis of the physical stability of dispersed systems comply with the International Organization for Standardization (ISO) guidelines for dispersion stability characterization (ISO/TR 13097). The measurements provide a complete picture of particle migration and size changes.
Technical specifications: static multiple light scattering (SMLS) technology; radiation source: laser diode (λmax = 880 nm); detected signals: transmission (180° relative to the radiation source) and backscattering (45° relative to the radiation source); vertical scanning step 20 μm; maximum resolution 5 μm.
The Turbiscan technology involves repeated optical scanning of a vial containing the sample along its height, recording two profiles: transmission and backscattering of the laser radiation. This method enables, regardless of the nature of the dispersed system, obtaining from direct measurements a single parameter characterizing the sedimentation stability of the studied dispersed systems – the Turbiscan Stability Index (TSI). The index calculation sums all accumulated changes in the sample, yielding a single numerical parameter for each measurement that characterizes the rate of all destabilization processes. The higher this number, the less stable the sample is: while a typical unstable system (e.g., a barite suspension) has a TSI in the tens, for stable suspensions it tends toward zero.
The transmission and backscattering signals for each sample were recorded for 1 hour. This time is required to record more than 30 profiles, which are necessary for correctly calculating the TSI. By comparing the TSI parameter for different dispersed systems, they can be ranked by sedimentation stability and the most stable samples identified.
2.7. Methodology of Filtration Studies
The experiments were conducted on a filtration unit SMP FES-2R (LLC «Kortekh», Mytishchi, Russia); its technical specifications are provided in Table 2.
Core material preparation and filtration studies were conducted in accordance with the requirements of [64] at a reservoir temperature of 40 °C and with a model isoviscous oil viscosity of 6.74 mPa·s.
The first stage of the filtration experiment involved preparing the composite model and the fluids. The composite core model was placed into the core holder of the SMP FES-2R unit, resaturated with kerosene, and maintained for at least two hours under reservoir temperature and pressure. After this period, oil was filtered through the composite porous medium (at least 3 pore volumes) at a filtration rate not exceeding 5 m/day. The saturated composite model was maintained under reservoir temperature and pressure for 16 hours to complete adsorption processes and restore natural wettability.
Second experimental stage: waterflooding with water from the reservoir pressure maintenance system, determination of oil displacement (Kdis) and post-flood displacement (Kpost-dis) coefficients. The process of oil displacement by water was carried out until the complete cessation of oil production at the core holder outlet (100% water cut), but for no less than 5 pore volumes (PV), with determination of Kdis and the model's permeability. Following this, a surfactant slug of 0.1 PV was injected, succeeded by water filtration until the produced fluid was completely watered out, but for no less than 5 PV, with determination of Kpost-dis.
The oil displacement and post-flood displacement coefficients were calculated using the following formulas:
where: Кdis, Кpost-dis are the oil displacement and post-flood displacement coefficients by water, respectively; Voil,dis, Voil,post-dis are the volumes of oil recovered in the displacement and post-flood displacement experiments; Voil,init is the volume of oil initially contained in the sample.
Upon stabilization of the pressure gradient at the end of the experiment, the water permeability was determined, and the residual resistance factor (RRF) was calculated as the ratio of the water pressure drop after injection of the composition to the pressure drop prior to reagent treatment:
where dPi—pressure drop after treatment with the intensifying composition at the corresponding filtration stage; dP1 is the water pressure drop prior to composition treatment.
2.8. Qualitative Determination of Surfactants Adsorbed on Nanoparticle Aggregate Surfaces
Sample preparation was carried out as follows. Samples of nanoparticle suspensions in the aqueous surfactant composition solution were maintained at a temperature of 40 °C for 24 hours under static conditions (to allow adsorption processes to proceed). Thereafter, the dispersed phase was separated from the filtrate using a Büchner funnel No 1 (GOST 9147-80, LLC Oyatskaya Keramika, Saint Petersburg, Russia) with a "blue ribbon" filter (pore size 1–2 μm) and dried at 90 °C to constant weight.
The filtered nanoparticle aggregates were dispersed in distilled water, and the resulting suspension was placed in a quartz cuvette for UV spectrum acquisition (using a suspension of the initial (unmodified) nanoparticles in distilled water as the reference solution). Absorption spectra were recorded on a UV-2400PC Series spectrophotometer (Shimadzu, Kyoto, Japan). The presence of surfactants adsorbed on the nanoparticle surface was assessed by UV absorption in the 260–290 nm region (aromatic moieties of surfactant molecules) [65].
2.9. Electron Microscopy for Determining the Size of Nanoparticle Aggregates with Surfactants
Particle size was assessed from images obtained using a Tescan Vega 3LMN scanning electron microscope (Tescan, Brno-Kohoutovice, Czech Republic) in secondary electron mode. The results were processed using the Scale software [66]. For each sample, 20 to 30 measurements were performed.
3. Results and Discussion
3.1. Justification of the Surfactant-Nanoparticle Composition
In accordance with the objective of our study, a key requirement for the surfactant composition components and nanoparticles is their industrial-scale producibility and availability for field operations. From this perspective, it was most expedient to select a composition from among anionic and nonionic surfactants, based on large-tonnage petrochemical products.
For a more rigorous justification of the nanoparticle content in the surfactant composition, we performed interfacial tension measurements using the pendant drop method. In the test for determining interfacial tension, three types of nanoparticles were considered: hydrophobic nanosilica, uncompacted white carbon black, and gas black. Upon addition of the aforementioned nanoparticles up to a content of 1.0% to the surfactant composition solution in fresh water, a gradual decrease in the interfacial tension value from 1.36 to 1.02, 0.91, and 0.67 mN/m, respectively, was observed in all cases. Graphs of interfacial tension versus nanoparticle content in the 1% surfactant composition are presented in Figure 2.
As can be seen from the figure, when gas black is used as an additive (1%), a twofold reduction in interfacial tension occurs. Therefore, it can be stated that a reduction in interfacial tension has been recorded, but it is far from reaching ultralow values.
The next series of experiments was devoted to determining the contact angle using the sessile drop method. Experiments with the oil-saturated core from the Pashian horizon (the target development object) showed that a water droplet does not wet the surface of the oil-saturated core pellet, which is entirely expected; whereas a droplet of the surfactant composition solution instantly spreads and imbibes into the porous medium. That is, the wetting properties of the surfactant composition are so pronounced that determining the contact angle using the sessile drop method on the surface of a core pellet from Pashian sandstones becomes virtually impossible. It should be noted that deasphalted oil with a viscosity of 232 mPa·s was used for saturating the core pellet, serving as a simple model of residual oil [67].
Due to this circumstance, the methodology for preparing porous media to assess the wetting ability of the surfactant composition was modified. Specifically, porous media with significantly greater hydrophobization were prepared by increasing the proportion of heavy oil components. For this purpose, disaggregated Pashian sandstone was used as the porous medium, and a (1:1) mixture of deasphalted oil and asphaltene-resin-paraffin deposits (ARPD) from the subsurface equipment of the corresponding field was chosen as the oil phase. The mass ratio of the normalized oil phase to the Pashian sandstone was 1:1. The results of experiments on determining the contact angle as a function of surfactant concentration in the composition are presented in Figure 3.
As can be seen from Figure 3, the critical micelle concentration (CMC), determined from the contact angle isotherm, is 0.13%. The primary reduction in the contact angle from 91.0° to 41.1° occurs with an increase in surfactant concentration up to 0.4%. A further increase in surfactant concentration to 1.0% leads to a slight decrease in the contact angle: to 29.2°.
The addition of nanoparticles to the surfactant composition (1.0%) led to an even greater reduction in the contact angle of the hydrophobized Pashian sandstone surface (Figure 4). Thus, at a content of 0.6% of white carbon black and gas black, the contact angle decreased to approximately 20°, while in the case of adding hydrophobic nanosilica, the contact angle was 10.3°.
A further increase in nanoparticles (white carbon black and gas black) to 0.8% resulted in a leveling-off of the dependence, whereas with the addition of hydrophobic nanosilica, the contact angle even increased to 13.2°.
The obtained experimental results indicate that the surfactant composition reduces the contact angle by a factor of three, and the addition of nanoparticles to the composition further enhances the wetting ability.
As another test object for contact angle determination, the hydrophobic material Teflon was chosen. To simulate the rough surface of rock, a sample of corrugated Teflon was used, and for better reproducibility, a plate with uniform roughness [68] was selected.
Experiments using the Teflon substrate showed that the water contact angle is 89.05° (i.e., close to 90°), whereas upon application of the surfactant composition, the contact angle decreases to 73.84°. The addition of 0.2% of all studied nanoparticles (namely, hydrophobic nanosilica, white carbon black, and gas black) reduces the contact angle to 54–58°. Experiments with the Teflon substrate confirmed the high wetting ability of the surfactant-nanoparticle composition.
3.2. Description of Filtration Experiments
Based on the results of the interfacial tension determination, a composition containing 1% surfactant and 1% nanoparticles was chosen for the filtration experiments (Table 3).
As a baseline for comparison, an experiment on post-waterflood residual oil displacement by injecting a surfactant composition (1.0% concentration of the commercial form in water) with a volume of 1.0 PV was adopted. The increase in the displacement coefficient upon injection of this composition and subsequent post-flood displacement with water amounted to 11.9% (Table 3, Experiment 1, Figure 5).
The pressure gradient, in turn, decreased, which indicates good surface activity of the surfactants and a reduction in residual oil saturation. When hydrophilic nanosilica grade HSIL-200 was added to the surfactant composition slug, the increase in the post-waterflood oil displacement coefficient rose to 14.3%. The pressure gradient during injection of this composition increased more than 2.5-fold (Table 3, Experiment 2, Figure 6), while upon switching to water, it decreased; however, a small residual resistance factor of 1.3 was maintained.
In the case of using hydrophobic nanosilica RX-380, the increase in the displacement coefficient reached 23.1%, and the pressure gradient during injection of this composition increased more than 3.5-fold; the residual resistance factor after the subsequent water injection increased 2.4-fold compared to the waterflooding in the first stage of the experiment (Table 3, Experiment 3, Figure 7).
Upon introduction of uncompacted white carbon black into the surfactant composition (for reference: white carbon black is a precipitated nanosilica – as opposed to the fumed varieties of nanosilica grades HSIL-200 and RX-380), the increase in the displacement coefficient reached 19.0%; here, the pressure gradient doubled, while the residual resistance factor was entirely negligible (1.1) (Table 3, Experiment 4, Figure 8).
The switch to carbon-based nano-additives in the surfactant composition for reagent slug injection and subsequent waterflooding was marked by a completely different pressure gradient dynamic. Thus, with the addition of 1% graphene to the surfactant composition, the pressure gradient during injection of the resulting composition decreased, as in the baseline case, while the increase in the displacement coefficient reached 20.7%. During the subsequent waterflooding, the pressure gradient returned to practically the same level as during the primary waterflooding (Table 3, Experiment 5, Figure 9).
When using an additive of the carbonaceous material shungite, the increase in the displacement coefficient reached 23.2%, and the pressure gradient dynamic was similar to that in the case of graphene, with the only difference being that the final gradient during water injection even decreased compared to the initial waterflooding (Table 3, Experiment 6, Figure 10).
In the case of adding gas black to the surfactant composition, the increase in the displacement coefficient was 21.1%, and the pattern of pressure gradient change repeated that observed in the experiment with shungite (Table 3, Experiment 7, Figure 11).
As can be seen from Figure 6, Figure 7, Figure 8, Figure 9, Figure 10 and Figure 11, a slight increase in the displacement coefficient is observed during the injection of the surfactant-nanoparticle slug, which is apparently associated with a low-salinity waterflooding effect; the main post-flood oil displacement occurs during the water displacement stage following the injection of the reagent composition, which indicates the occurrence of dynamic adsorption processes in the oil/water/rock/surfactant micelles/nanoparticles system. The obtained results from the filtration study of surfactant compositions with various nanosilica samples unequivocally indicate that a significant resistance factor appears during slug injection, and a residual resistance factor remains after the final water injection stage. It should be noted here that the dynamic viscosity of all surfactant-nanoparticle compositions ranges from 0.7307 to 0.7530 mPa·s, which could not possibly account for such a substantial difference in the pressure gradient dynamic. The porous medium's response to the injection of nanosilicas with surfactants is apparently related to the structuring of nanosilica particles and surfactant micelles in the solution, which will inevitably lead to an increase in the sweep efficiency. Published results from the study [69], conducted on reservoir micromodels, corroborate this conclusion. Such filtration behavior of nanofluids is due to the agglomeration of nanoparticles with surfactants, with agglomerate sizes up to 200 nm allowing them to pass freely through the porous medium [70]. It should be noted that the interaction of sodium dodecyl sulfate with metal nano-oxides also leads to a high degree of aggregation, and the aging of such dispersions has an insignificant effect on the zeta potential and the degree of aggregation [71].
To elucidate the role of surfactant composition components when used in conjunction with nanoparticles, experiments on post-waterflood oil displacement by colloidal solutions of the following compositions were conducted: anionic surfactant with graphene, anionic surfactant with white carbon black, and nonionic surfactant with graphene (Table 3, Experiments 8–10). As it turned out, the anionic surfactant with graphene composition yields an increase in the displacement coefficient of 17.1% (for comparison: the anionic + nonionic surfactant + graphene composition provides an increase of 20.7%). With the addition of white carbon black to a 1.0% anionic surfactant solution, the increase in displacement coefficient reaches only 11.9%. An even smaller increase (9.4%) was produced by the nonionic surfactant + graphene solution. Finally, the control experiment (No. 11) on oil displacement by a suspension of 1.0% white carbon black in fresh water without surfactants did not result in any post-flood oil displacement, and the residual resistance factor in this case was 1.03. Comparing the results of the control experiment with the experiment using the surfactant and white carbon black composition, it should be noted that in the latter case, the residual resistance factor was 1.1 (Figure 8), which indirectly confirms the aggregation of surfactant micelles with nanoparticles.
The synergistic action of nanoparticles and surfactants, noted by the authors of a number of publications and confirmed in our work, is, in our opinion, due to the transport functions of nanoparticles and the reduction of surfactant adsorption on the rock surface. We have previously shown that for the studied composition, the use of sacrificial surfactants reduces the adsorption of the target surfactant, which multiplicatively increases the oil displacement coefficient [72]. A review paper [73] comprehensively examines the mechanism of reducing surfactant adsorption through the transport properties of nanosilica and the dynamic adsorption-desorption of surfactants. In this case, the adsorption reduction reaches 40%, and the displacement coefficient doubles, which coincides with the results of our experiments.
Thus, based on the results of the filtration experiments, it can be stated that the anionic and nonionic surfactant composition with nanoparticles provides an increase in the displacement coefficient of about 20%, which can be considered a good result even in comparison with CO₂ injection into a terrigenous reservoir [74]. The composition's components – anionic and nonionic surfactants – form mixed micelles, which, upon aggregation with nanoparticles, lead to a substantial increase in the displacement coefficient – significantly greater than that achieved by anionic or nonionic surfactants individually in combination with nanoparticles.
Filtration of the nanosilica samples and the surfactant composition occurs with a resistance factor and a residual resistance factor, which indicates an increase in reservoir sweep efficiency. Moreover, the most significant practical result from the conducted filtration experiments should be recognized as the experiment with hydrophobic nanosilica (Figure 7). The appearance of a residual resistance factor in this experiment warrants a more detailed consideration of the behavior of nanocomposite agglomerates with surfactants in aqueous solutions.
To better understand the structure formation of nanoparticles with surfactants, particle size determination experiments were conducted. Specifically, using a Shimadzu SALD-2300 laser diffraction analyzer with a SALD-MS23 flow cell, the sizes of hydrophobic nanosilica aggregates with surfactant composition micelles were measured. As it turned out, the hydrodynamic diameter value for the majority of particle aggregates falls within the range of 20–45 μm (Figure 12).
Since the particle aggregate sizes were clearly larger than the pore sizes of the porous medium, to confirm the results, we employed an alternative method for determining particle sizes, namely, electron microscopy. For comparison, electron micrographs of filtered and dried particle aggregates of gas black and hydrophobic nanosilica with the surfactant composition were taken (Figure 13, a and b). For clarity, bar charts of the particle size distribution were constructed (Figure 13, c and d).
As can be seen from the figure, the particle morphology changed after interaction with surfactant micelles in an aqueous environment: aggregation of nanoparticles into micro-sized structural formations occurred, with gas black particles increasing in size with diverse shapes, while hydrophobic nanosilica particles predominantly assumed an elongated crystallographic form. Among the hydrophobic nanosilica aggregates, very large formations sized 107–140 μm are encountered, although the primary sizes fall within the 25–70 μm range. The size of gas black aggregates with surfactant micelles is also in the range of 25–70 μm. Thus, both employed particle size determination methods show close results, with the aggregate sizes of hydrophobic nanosilica and gas black having similar indicators for the primary range of structural formations. From Figure 14, it is evident that the proportion of pores in the porous medium with a diameter > 9.13 μm is 33.50%, while 43.50% falls within the 2.92–9.13 μm range. By comparing the pore size distribution of the core model, determined by capillary pressure measurements, and the particle aggregate size, an unequivocal conclusion can be drawn that the sizes of all aggregates are larger than the pore throat sizes.
3.3. Determination of Comparative Adsorption of Surfactant Components on Nano-particle Surfaces by UV Spectroscopy
For UV spectroscopy application, homogeneous solutions where solute molecules absorb light are preferable. This reduces the risks of registering artifacts and noise caused by light scattering by particles. Indeed, an opaque aggregatively stable suspension (such as that formed by gas black) does not allow for studying absorption by this method. However, the dispersed phase of suspensions based on the surfactant composition and certain nanoparticles (hydrophobic nanosilica and white carbon black) undergoes sedimentation in an aqueous solution. In this process, exchange occurs between the nanoparticles and the aqueous dispersion medium: surfactant molecules adsorbed on the nanoparticle surface desorb into the aqueous solution, and the absorption of the aromatic groups comprising the surfactants is reliably detected. Thus, in Figure 15, intense absorption of nanoparticle suspensions with the surfactant composition adsorbed on their surface can be seen in the 260–290 nm region. Regardless of the nanoparticle type or the disaggregated core sample, we observe absorption for which the surfactant composition is specifically responsible (with a maximum at λmax = 274 nm). To account for the specific light scattering by nanoparticles to the maximum extent, an aqueous suspension with unmodified nanoparticles was used as the reference solution.
The significant differences in the UV spectra of nanoparticle suspensions in water after modification with the surfactant composition are due to the presence of aromatic groups in the applied anionic and nonionic surfactants. Consequently, nanoparticles with surfactants adsorbed on their surface exhibit intense absorption in this spectral region, whereas the initial/unmodified nanoparticles do not (see Figure 15b-d).
Thus, based on the obtained data, we can confidently assert that in an aqueous environment, surfactants previously adsorbed on the nanoparticle surface desorb into the aqueous solution. We reliably detect an absorption maximum at λmax = 274 nm when studying aqueous suspensions of modified nanoparticles versus suspensions of the initial nanoparticles. We did not aim for quantitative analysis (since we are not working with homogeneous solutions); however, we can state that regardless of the nanoparticle type (or disaggregated core), absorption for which the surfactant composition is specifically responsible is detected in the aqueous solution (Figure 15a). The differences are apparently due to varying degrees of surfactant redistribution between nanoparticles and the aqueous solution, as well as different wettability and sorption capacities of the various nanoparticles (when adding an identical mass of the dispersed phase (for different nanoparticles), the absorption intensity differs by several fold).
Considering that the filtration of aggregated nanoparticles under a pressure gradient proceeds without attenuation, it can be hypothesized that nanoparticle aggregates with surfactants are mobile dynamic formations that disintegrate when passing through a pore throat and reassemble when space for aggregation is available.
From the available experimental results, the reason for the emergence of a residual resistance factor of 2.4 units in the case of hydrophobic nanosilica filtration (Figure 7) remained unclear. To answer this question, experiments were conducted to determine the sedimentation stability of the displacing agents using the Turbiscan instrument. A comprehensive parameter, Turbiscan Stability Index, characterizing the sedimentation stability of the dispersed systems over 4 hours while placed in the measurement vial, was determined. As it turned out, surfactant compositions with an additive of gas black and shungite dispersion have the lowest TSI parameter, equal to 0.9 and 1.1, respectively. The colloidal solution of hydrophobic nanosilica in the surfactant composition is much less stable: its TSI is 12.1. Thus, the reason for the emergence of the residual resistance factor during the filtration of the surfactant composition with hydrophobic nanosilica became clear. It can be confidently stated that the residual resistance factor is caused by particle deposition during filtration through the porous medium. It is important to note that, according to [56], particle deposition promotes internal flow redistribution by temporarily plugging some pore channels; that is, it leads to an increase in microscopic sweep efficiency by the displacing agent's action, while the transport of surfactant micelles to the oil-rock contact boundary facilitates post-flood displacement of residual oil. Recalling the control experiment with the filtration of an aqueous white carbon black dispersion, it becomes evident that in the absence of surfactants, nanosilica particles deposited within the pores do not contribute to post-flood oil displacement, at least in the case of Pashian sandstones.
4. Conclusions
As a result of the work performed, we have obtained, with laboratory experimental justification, formulations of surfactant-nanoparticle compositions for intensifying oil production by treating the near-wellbore zone of injection wells.
The intensifying compositions consist of a mixture of alkylsulfonates and alkylated arylsulfonates, as well as oxyethylated nonylphenol with an oxyalkylation degree of 6, at a concentration of 1%, with an additive of silica/carbon nanoparticles at a content of 1%. These compositions enable an increase in the oil displacement coefficient by 19–23% after waterflooding. The primary contribution to the reduction of residual oil saturation is made by the wetting ability of the surfactant compositions, which is further enhanced upon the introduction of nanoparticles.
The experiments were conducted using actual samples of Pashian sandstones, and it can be confidently stated that for the treatment of injection wells in terrigenous Devonian reservoirs of the Volga-Ural petroleum province, a promising technology for oil production intensification has been substantiated.
An analysis of the experimental protocols for oil displacement by surfactant compositions with nanoparticles of different natures was conducted. It was established that the values of the increase in displacement coefficients for systems with nanosilicas and carbon particles are comparable. However, the dynamics of pressure gradient change in these experiments differ radically. For instance, injection of the surfactant composition with carbon particles occurs with a decrease in the pressure gradient, whereas injection of the surfactant composition with nanosilicas, regardless of their wettability, is accompanied by an increase in the pressure gradient and results in a residual resistance factor after subsequent waterflooding. The cause of this phenomenon is explained by the deposition of nanosilicas from the colloidal solutions of the intensifying composition during their filtration in pore channels. In this process, surfactant micelles are released from the nanoparticle aggregates at the oil-rock interface and act on the residual oil, reducing oil saturation. It was established that the sizes of the dynamic formations of silica and carbon nanoparticles with surfactant micelles fall within the same range: 25-70 μm (according to electron microscopy data), which is much larger than the pore throat sizes. Nevertheless, the filtration of such large structures occurs without attenuation, which can be explained by the lability of these aggregates, which disintegrate when passing through pore throats. Thus, we are dealing with dynamic physical structural formations of nanoparticles and surfactant micelles, with the primary role of nanoparticles being the transport function of delivering surfactant micelles to their site of action, i.e., to the residual oil-rock interfaces.
Author Contributions
Conceptualization, A.V.; methodology, F.S., A.P. (Anatoly Politov), A.V. and L.L.; software, R.Y.; validation, V.D.; formal analysis, R.G., A.P. (Artem Pavlik), E.G. and N.S.; investigation, A.R., F.S., A.F., A.P. (Artem Pavlik), E.G. and N.S.; resources, A.V. and V.D.; data curation, A.F. and R.Y.; writing—original draft preparation, F.S., A.V. and A.T.; writing—review and editing, V.D. and A.P. (Anatoly Politov); visualization, V.D., R.D. and F.S.; supervision, L.L.; project administration, L.L. and A.V.; funding acquisition, A.V. All authors have read and agreed to the published version of the manuscript.
Funding
This research was funded by the research project the State Assignment of the Ufa Institute of Chemistry of the Ufa Federal Research Centre of the Russian Academy of Sciences (Project No. 125020601629-0).
Data Availability Statement
The original contributions presented in this study are included in the article. Further inquiries can be directed to the corresponding authors.
Acknowledgments
Not applicable.
Conflicts of Interest
Authors Farit Safarov, Aleksey Telin, Andrey Fetisov, Artem Ratner, Natalia Sergeeva and Ekaterina Gusarova were employed by the company Ufa Scientific and Technical Center. The remaining authors declare that the research was conducted in the absence of any commercial or financial relationships that could be construed as a potential conflict of interest. The authors declare no conflicts of interest.
Abbreviations
The following abbreviations are used in this manuscript:
| NS | nonionic surfactant |
| AS | anionic surfactant |
| BET | Brunauer–Emmett–Teller |
| ISO | International Organization for Standardization |
| SMLS | static multiple light scattering |
| TSI | Turbiscan Stability Index |
| PV | pore volume |
| ARPD | asphaltene-resin-paraffin deposits |
| CMC | critical micelle concentration |
References
- Alsaba, M.T.; Al Dushaishi, M.F.; Abbas, A.K. A Comprehensive Review of Nanoparticles Applications in the Oil and Gas Industry. J Petrol Explor Prod Technol 2020, 10, 1389–1399. [CrossRef]
- Hajiabadi, S.H.; Aghaei, H.; Kalateh-Aghamohammadi, M.; Sanati, A.; Kazemi-Beydokhti, A.; Esmaeilzadeh, F. A Comprehensive Empirical, Analytical and Tomographic Investigation on Rheology and Formation Damage Behavior of a Novel Nano-Modified Invert Emulsion Drilling Fluid. J. Pet. Sci. Eng. 2019, 181, 106257. [CrossRef]
- Thakkar, A.; Raval, A.; Chandra, S.; Shah, M.; Sircar, A. A Comprehensive Review of the Application of Nano-Silica in Oil Well Cementing. Petroleum 2020, 6, 123–129. [CrossRef]
- Sriram, S.; Kumar, A. Separation of Oil-Water via Porous PMMA/SiO2 Nanoparticles Superhydrophobic Surface. Colloid Surf. A-Physicochem. Eng. Asp. 2019, 563, 271–279. [CrossRef]
- Torsæter, O. Application of Nanoparticles for Oil Recovery. Nanomaterials 2021, 11, 1063. [CrossRef] [PubMed]
- Maia, K.C.B.; Densy Dos Santos Francisco, A.; Moreira, M.P.; Nascimento, R.S.V.; Grasseschi, D. Advancements in Surfactant Carriers for Enhanced Oil Recovery: Mechanisms, Challenges, and Opportunities. ACS Omega 2024, 9, 36874–36903. [CrossRef] [PubMed]
- Ivanova, A.A. Dynamic Modelling and Experimental Evaluation of Nanoparticles Application in Surfactant Enhanced Oil Recovery. PhD Thesis, Skolkovo Institute of Science and Technology: Moscow, Russia, 2020.
- Sharma, K.P.; Aswal, V.K.; Kumaraswamy, G. Adsorption of Nonionic Surfactant on Silica Nanoparticles: Structure and Resultant Interparticle Interactions. J. Phys. Chem. B 2010, 114, 10986–10994. [CrossRef]
- Zargartalebi, M.; Kharrat, R.; Barati, N. Enhancement of Surfactant Flooding Performance by the Use of Silica Nanoparticles. Fuel 2015, 143, 21–27. [CrossRef]
- Alhassawi, H.; Romero-Zerón, L. New Surfactant Delivery System for Controlling Surfactant Adsorption onto Solid Surfaces. Part I: Static Adsorption Tests. Can J Chem Eng 2015, 93, 1188–1193. [CrossRef]
- Nourafkan, E.; Hu, Z.; Wen, D. Nanoparticle-Enabled Delivery of Surfactants in Porous Media. J. Colloid Interface Sci. 2018, 519, 44–57. [CrossRef]
- Amirianshoja, T.; Junin, R.; Kamal Idris, A.; Rahmani, O. A Comparative Study of Surfactant Adsorption by Clay Minerals. J. Pet. Sci. Eng. 2013, 101, 21–27. [CrossRef]
- Budhathoki, M.; Barnee, S.H.R.; Shiau, B.-J.; Harwell, J.H. Improved Oil Recovery by Reducing Surfactant Adsorption with Polyelectrolyte in High Saline Brine. Colloid Surf. A-Physicochem. Eng. Asp. 2016, 498, 66–73. [CrossRef]
- Chang, H.L.; Zhang, Z.Q.; Wang, Q.M.; Xu, Z.S.; Guo, Z.D.; Sun, H.Q.; Cao, X.L.; Qiao, Q. Advances in Polymer Flooding and Alkaline/Surfactant/Polymer Processes as Developed and Applied in the People’s Republic of China. J. Pet. Technol. 2006, 58, 84–89. [CrossRef]
- Islam, R. Economically and Environmentally Sustainable Enhanced Oil Recovery; John Wiley & Sons, Inc: Hoboken, NJ, USA, 2020; 816 p, ISBN 978-1-119-47909-3.
- Pereira, M.L.D.O.; Maia, K.C.B.; Silva, W.C.; Leite, A.C.; Francisco, A.D.D.S.; Vasconcelos, T.L.; Nascimento, R.S.V.; Grasseschi, D. Fe3 O4 Nanoparticles as Surfactant Carriers for Enhanced Oil Recovery and Scale Prevention. ACS Appl. Nano Mater. 2020, 3, 5762–5772. [CrossRef]
- Rosestolato, J.C.S.; Pérez-Gramatges, A.; Lachter, E.R.; Nascimento, R.S.V. Lipid Nanostructures as Surfactant Carriers for Enhanced Oil Recovery. Fuel 2019, 239, 403–412. [CrossRef]
- Wu, Y.; Chen, W.; Dai, C.; Huang, Y.; Li, H.; Zhao, M.; He, L.; Jiao, B. Reducing Surfactant Adsorption on Rock by Silica Nanoparticles for Enhanced Oil Recovery. J. Pet. Sci. Eng. 2017, 153, 283–287. [CrossRef]
- Massarweh, O.; Abushaikha, A.S. The Use of Surfactants in Enhanced Oil Recovery: A Review of Recent Advances. Energy Rep. 2020, 6, 3150–3178. [CrossRef]
- Almahfood, M.; Bai, B. The Synergistic Effects of Nanoparticle-Surfactant Nanofluids in EOR Applications. J. Pet. Sci. Eng. 2018, 171, 196–210. [CrossRef]
- Eltoum, H.; Yang, Y.-L.; Hou, J.-R. The Effect of Nanoparticles on Reservoir Wettability Alteration: A Critical Review. Pet. Sci. 2021, 18, 136–153. [CrossRef]
- Sircar, A.; Rayavarapu, K.; Bist, N.; Yadav, K.; Singh, S. Applications of Nanoparticles in Enhanced Oil Recovery. Pet. res. 2022, 7, 77–90. [CrossRef]
- Cheraghian, G.; Hendraningrat, L. A Review on Applications of Nanotechnology in the Enhanced Oil Recovery Part A: Effects of Nanoparticles on Interfacial Tension. Int Nano Lett 2016, 6, 129–138. [CrossRef]
- Tavakkoli, O.; Kamyab, H.; Shariati, M.; Mustafa Mohamed, A.; Junin, R. Effect of Nanoparticles on the Performance of Polymer/Surfactant Flooding for Enhanced Oil Recovery: A Review. Fuel 2022, 312, 122867. [CrossRef]
- Le, N.Y.T.; Pham, D.K.; Le, K.H.; Nguyen, P.T. Design and Screening of Synergistic Blends of SiO2 Nanoparticles and Surfactants for Enhanced Oil Recovery in High-Temperature Reservoirs. Adv. Nat. Sci: Nanosci. Nanotechnol. 2011, 2, 035013. [CrossRef]
- Gowtham V, M.; Deodhar, S.; Thampi, S.P.; Basavaraj, M.G. Association in Like-Charged Surfactant–Nanoparticle Systems: Interfacial and Bulk Effects. Langmuir 2024, 40, 17410–17422. [CrossRef] [PubMed]
- Correia, E.L.; Thakur, S.; Ervin, A.; Shields, E.; Razavi, S. Adsorption of Surfactant Molecules onto the Surface of Colloidal Particles: Case of like-Charged Species. Colloid Surf. A-Physicochem. Eng. Asp. 2023, 676, 132142. [CrossRef]
- Xu, F.; Zhong, X.; Li, Z.; Cao, W.; Yang, Y.; Liu, M. Synergistic Mechanisms Between Nanoparticles and Surfactants: Insight Into NP–Surfactant Interactions. Front. Energy Res. 2022, 10, 913360. [CrossRef]
- Betancur, S.; Carrasco-Marín, F.; Franco, C.A.; Cortés, F.B. Development of Composite Materials Based on the Interaction between Nanoparticles and Surfactants for Application in Chemical Enhanced Oil Recovery. Ind. Eng. Chem. Res. 2018, 57, 12367–12377. [CrossRef]
- Agi, A.; Junin, R.; Gbadamosi, A. Mechanism Governing Nanoparticle Flow Behaviour in Porous Media: Insight for Enhanced Oil Recovery Applications. Int Nano Lett 2018, 8, 49–77. [CrossRef]
- Chen, W.; Schechter, D.S. Surfactant Selection for Enhanced Oil Recovery Based on Surfactant Molecular Structure in Unconventional Liquid Reservoirs. J. Pet. Sci. Eng. 2021, 196, 107702. [CrossRef]
- Chen, C.; Wang, S.; Kadhum, M.J.; Harwell, J.H.; Shiau, B.-J. Using Carbonaceous Nanoparticles as Surfactant Carrier in Enhanced Oil Recovery: A Laboratory Study. Fuel 2018, 222, 561–568. [CrossRef]
- Liu, Y.; Liang, F.; Wang, Q.; Qu, X.; Yang, Z. Flexible Responsive Janus Nanosheets. Chem. Commun. 2015, 51, 3562–3565. [CrossRef] [PubMed]
- Radnia, H.; Rashidi, A.; Solaimany Nazar, A.R.; Eskandari, M.M.; Jalilian, M. A Novel Nanofluid Based on Sulfonated Graphene for Enhanced Oil Recovery. J. Mol. Liq. 2018, 271, 795–806. [CrossRef]
- Cao, J.; Chen, Y.; Wang, X.; Zhang, J.; Li, Y.; Wang, S.; Wang, X.; Liu, C. Janus Sulfonated Graphene Oxide Nanosheets with Excellent Interfacial Properties for Enhanced Oil Recovery. Chem. Eng. J. 2022, 443, 136391. [CrossRef]
- Rezvani, H.; Binks, B.P.; Nguyen, D. Surfactant-Nanoparticle Formulations for Enhanced Oil Recovery in Calcite-Rich Rocks. Langmuir 2024, 40, 24989–25002. [CrossRef]
- Alhuraishawy, A.K.; Hamied, R.S.; Hammood, H.A.; AL-Bazzaz, W.H. Enhanced Oil Recovery for Carbonate Oil Reservoir by Using Nano-Surfactant:Part II. In Proceedings of the SPE Gas & Oil Technology Showcase and Conference, Dubai, UAE, 21-23 October 2019. [CrossRef]
- Al-Asadi, A.; Rodil, E.; Soto, A. Nanoparticles in Chemical EOR: A Review on Flooding Tests. Nanomaterials 2022, 12, 4142. [CrossRef]
- El-Masry, J.F.; Bou-Hamdan, K.F.; Abbas, A.H.; Martyushev, D.A. A Comprehensive Review on Utilizing Nanomaterials in Enhanced Oil Recovery Applications. Energies 2023, 16, 691. [CrossRef]
- Kandiel, Y.E.; Attia, G.M.; Metwalli, F.I.; Khalaf, R.E.; Mahmoud, O. Nanoparticles in Enhanced Oil Recovery: State-of-the-Art Review. J Petrol Explor Prod Technol 2025, 15, 66. [CrossRef]
- Hosny, R.; Zahran, A.; Abotaleb, A.; Ramzi, M.; Mubarak, M.F.; Zayed, M.A.; Shahawy, A.E.; Hussein, M.F. Nanotechnology Impact on Chemical-Enhanced Oil Recovery: A Review and Bibliometric Analysis of Recent Developments. ACS Omega 2023, 8, 46325–46345. [CrossRef]
- Behera, U.S.; Poddar, S.; Deshmukh, M.P.; Sangwai, J.S.; Byun, H.-S. Comprehensive Review on the Role of Nanoparticles and Nanofluids in Chemical Enhanced Oil Recovery: Interfacial Phenomenon, Compatibility, Scalability, and Economic Viability. Energy Fuels 2024, 38, 13760–13795. [CrossRef]
- Jia, H.; Kang, Y. A Comprehensive Review on Application and Perspectives of Nanomaterials in Enhanced Oil Recovery. Energy Fuels 2025, 39, 2916–2942. [CrossRef]
- Franco, C.A.; Franco, C.A.; Zabala, R.D.; Bahamón, Í.; Forero, Á.; Cortés, F.B. Field Applications of Nanotechnology in the Oil and Gas Industry: Recent Advances and Perspectives. Energy Fuels 2021, 35, 19266–19287. [CrossRef]
- Kaito, Y.; Goto, A.; Ito, D.; Murakami, S.; Kitagawa, H.; Ohori, T. First Nanoparticle-Based EOR Nano-EOR Project in Japan: Laboratory Experiments for a Field Pilot Test. In Proceedings of the SPE Improved Oil Recovery Conference, Virtual, 25-29 April 2022. [CrossRef]
- Kanj, M.Y.; Rashid, Md.H.; Giannelis, E.P. Industry First Field Trial of Reservoir Nanoagents. In Proceedings of the SPE Middle East Oil and Gas Show and Conference, Manama, Bahrain, 25-28 September 2011. [CrossRef]
- Olayiwola, S.O.; Dejam, M. A Comprehensive Review on Interaction of Nanoparticles with Low Salinity Water and Surfactant for Enhanced Oil Recovery in Sandstone and Carbonate Reservoirs. Fuel 2019, 241, 1045–1057. [CrossRef]
- Sheng, J.J. Status of Surfactant EOR Technology. Petroleum 2015, 1, 97–105. [CrossRef]
- Volokitin, Y.; Shuster, M.; Karpan, V.; Koltsov, I.; Mikhaylenko, E.; Bondar, M.; Podberezhny, M.; Rakitin, A.; Batenburg, D.W.; Parker, A.R.; et al. Results of Alkaline-Surfactant-Polymer Flooding Pilot at West Salym Field. In Proceedings of the SPE EOR Conference at Oil and Gas West Asia, Muscat, Oman, 26-28 March 2018. [CrossRef]
- Altunina, L.K.; Kuvshinov, V.A. Fundamental and Applied Aspects of Physical and Chemical Methods for Enhanced Oil Recovery, Created at the Institute of Petroleum Chemistry SB RAS. Surfactant-Based Compositions for Enhancing Oil Recovery. Chemistry for Sustainable Development 2025, 33, 89–116. [CrossRef]
- Safarov, F.; Telin, A.; Vezhnin, S.; Fakhreeva, A.; Akhmetov, A.; Lenchenkova, L.; Yakubov, R.; Ovchinnikov, K.; Podlesnova, E.; Latypova, L. Integrated Reservoir Stimulation with Polyacrylamide Hydrogels and Surfactant Solutions for Oil Recovery Enhancement. Pet. Explor. Dev. 2025, 52, 1593–1608. [CrossRef]
- Esfandyari, H.; Shadizadeh, S.R.; Esmaeilzadeh, F.; Davarpanah, A. Implications of Anionic and Natural Surfactants to Measure Wettability Alteration in EOR Processes. Fuel 2020, 278, 118392. [CrossRef]
- Ovchinnikov, K.A.; Podlesnova, E.V.; Telin, A.G.; Safarov, F.E.; Sergeeva, N.A.; Ratner, A.A. Composition for Enhanced Oil Recovery and Method of Its Application. Russian Patent RU2800175, 1 July 1989.
- Wang, Z.; Dai, C.; Liu, J.; Dong, Y.; Liu, J.; Sun, N.; Li, L. Anionic-Nonionic and Nonionic Mixed Surfactant Systems for Oil Displacement: Impact of Ethoxylate Chain Lengths on the Synergistic Effect. Colloid Surf. A-Physicochem. Eng. Asp. 2023, 678, 132436. [CrossRef]
- Ovchinnikov, K.A.; Podlesnova, E.V.; Safarov, F.E.; Sergeeva, N.A.; Telin, A.G.; Kleimenov, A.V. Selection of Surfactant Compositions for Extraction Residual Oil Reserves in the Conditions of High-Temperature Reservoirs of The Neocomian Deposits of the BS Group Formations of Western Siberia. Pet. Eng. 2023, 21, 29–43. [CrossRef]
- Li, K.; Wang, D.; Jiang, S. Review on Enhanced Oil Recovery by Nanofluids. Oil Gas Sci. Technol. – Rev. IFP Energies nouvelles 2018, 73, 37. [CrossRef]
- Silantiev, V.V.; Validov, M.F.; Miftakhutdinova, D.N.; Morozov, V.P.; Ganiev, B.G.; Lutfullin, A.A.; Shumatbaev, K.D.; Khabipov, R.M.; Nurgalieva, N.G.; Tolokonnikova, Z.A.; et al. Sedimentation Model of the Middle Devonian Clastic Succession of the South Tatar Arch, Pashyian Regional Stage, Volga-Ural Oil and Gas Province, Russia. Georesursy 2022, 24, 12–39. [CrossRef]
- Burkhanov, R.N.; Lutfullin, A.A.; Ibragimov, I.I.; Maksyutin, A.V. Core Column Filtration Testing Supplemented by Measurements of Oil Optical Properties. In Proceedings of the SPE Russian Petroleum Technology Conference, Virtual, 26-29 October 2020. [CrossRef]
- Meshalkin, V.; Asadullin, R.; Vezhnin, S.; Voloshin, A.; Gallyamova, R.; Deryaev, A.; Dokichev, V.; Eshmuratov, A.; Lenchenkova, L.; Pavlik, A.; et al. Engineering and Technological Approaches to Well Killing in Hydrophilic Formations with Simultaneous Oil Production Enhancement and Water Shutoff Using Selective Polymer-Inorganic Composites. Energies 2025, 18, 4721. [CrossRef]
- Levashenko, G.I.; Simonkov, V.V. Determination of the Optical Constants of Soot in Hydrocarbon Fuel Combustion Products at λ = 10.6 Μm. Physics of Combustion and Explosion 1995, 31, 70–73.
- Khlebtsov, B.N.; Khanadeev, V.A.; Khlebtsov, N.G. Determination of the Size, Concentration, and Refractive Index of Silica Nanoparticles from Turbidity Spectra. Langmuir 2008, 24, 8964–8970. [CrossRef]
- OST 39-204-86. Oil. Laboratory Method for Determining the Residual Water Saturation of Oil and Gas Reservoirs Based on the Dependence of Saturation on Capillary Pressure. Moscow, Minnefteprom, 1986.
- GOST 26450.0-85. Mineral Rocks. General Requirements for Sampling and Sample Preparation for the Determination of Reservoir Properties. Moscow, USSR State Committee for Standards (GOST), 1985.
- OST 39-195-86 Oil. Method of Determining the Coefficient of Displacement of Oil by Water in the Laboratory. Moscow, Minnefteprom, 1986.
- Mansurov, R.R.; Safronov, A.P.; Lakiza, N.V.; Leiman, D.V. Adsorption of TX-100 and SDBS on the Surface of Alumina and Maghemite Nanoparticles from Aqueous Solutions. Chim.Tech.Acta 2014, 1, 50–55. [CrossRef]
- Scale Software. Available Online: https://Antropol.Narod.Ru/Scale.Zip (Accessed on 12 November 2025).
- Startseva, R.Kh.; Parfenova, M.A.; Zaripov, R.N.; Blinov, S.A.; Fakhretdinov, R.N.; Lyapina, N.K. Modeling the Composition and Properties of Residual Oil. Pet. Chem. 1998, 38, 96–101.
- Razavifar, M.; Abdi, A.; Nikooee, E.; Aghili, O.; Riazi, M. Quantifying the Impact of Surface Roughness on Contact Angle Dynamics under Varying Conditions. Sci Rep 2025, 15, 16611. [CrossRef]
- Minakov, A.V.; Pryazhnikov, M.I.; Pryazhnikov, A.I.; Yakimov, A.S.; Denisov, I.A.; Lobasov, A.S.; Nemtsev, I.V.; Rudyak, V.Y. Application of Micro- and Nanofluidic Technologies in Enhanced Oil Recovery Tasks. Oil. Gas. Innovations 2022, 68–73.
- Kanj, M.Y.; Funk, J.J.; Al-Yousif, Z. Nanofluid Coreflood Experiments in the ARAB-D. In Proceedings of the SPE Saudi Arabia Section Technical Symposium, Al-Khobar, Saudi Arabia, 9-11 May 2009. [CrossRef]
- Ruchomski, L.; Mączka, E.; Kosmulski, M. Dispersions of Metal Oxides in the Presence of Anionic Surfactants. Colloids Interfaces 2018, 3, 3. [CrossRef]
- Safarov, F.E.; Telin, A.G.; Fakhreeva, A.V.; Bayanov, R.R.; Sergeeva, N.A.; Ovchinnikov, K.A.; Podlesnova, E.V.; Kleimenov, A.V. The Use of Sacrificial Reagents to Increase the Efficiency of Surfactant Compositions in Oil Recovery Enhancement Technologies in Conditions of High-Temperature Reservoirs of the Neocomian Deposits of the Bs Group of Western Siberia. Oil. Gas. Innov. 2024, 37–45.
- Rahman, A.F.A.; Arsad, A.; Vo, D.-V.N.; Bahari, M.B. Nano-Silica to Reduce of Surfactant Adsorption in Oil Recovery: A Review. Environ Chem Lett 2025. [CrossRef]
- Bondor, P.L. Applications of Carbon Dioxide in Enhanced Oil Recovery. Energy Convers. Manag. 1992, 33, 579–586. [CrossRef]
Figure 1.
Schematic illustration of the end face of the Teflon substrate.

Figure 2.
Interfacial tension versus nanoparticle content in the surfactant composition solution.
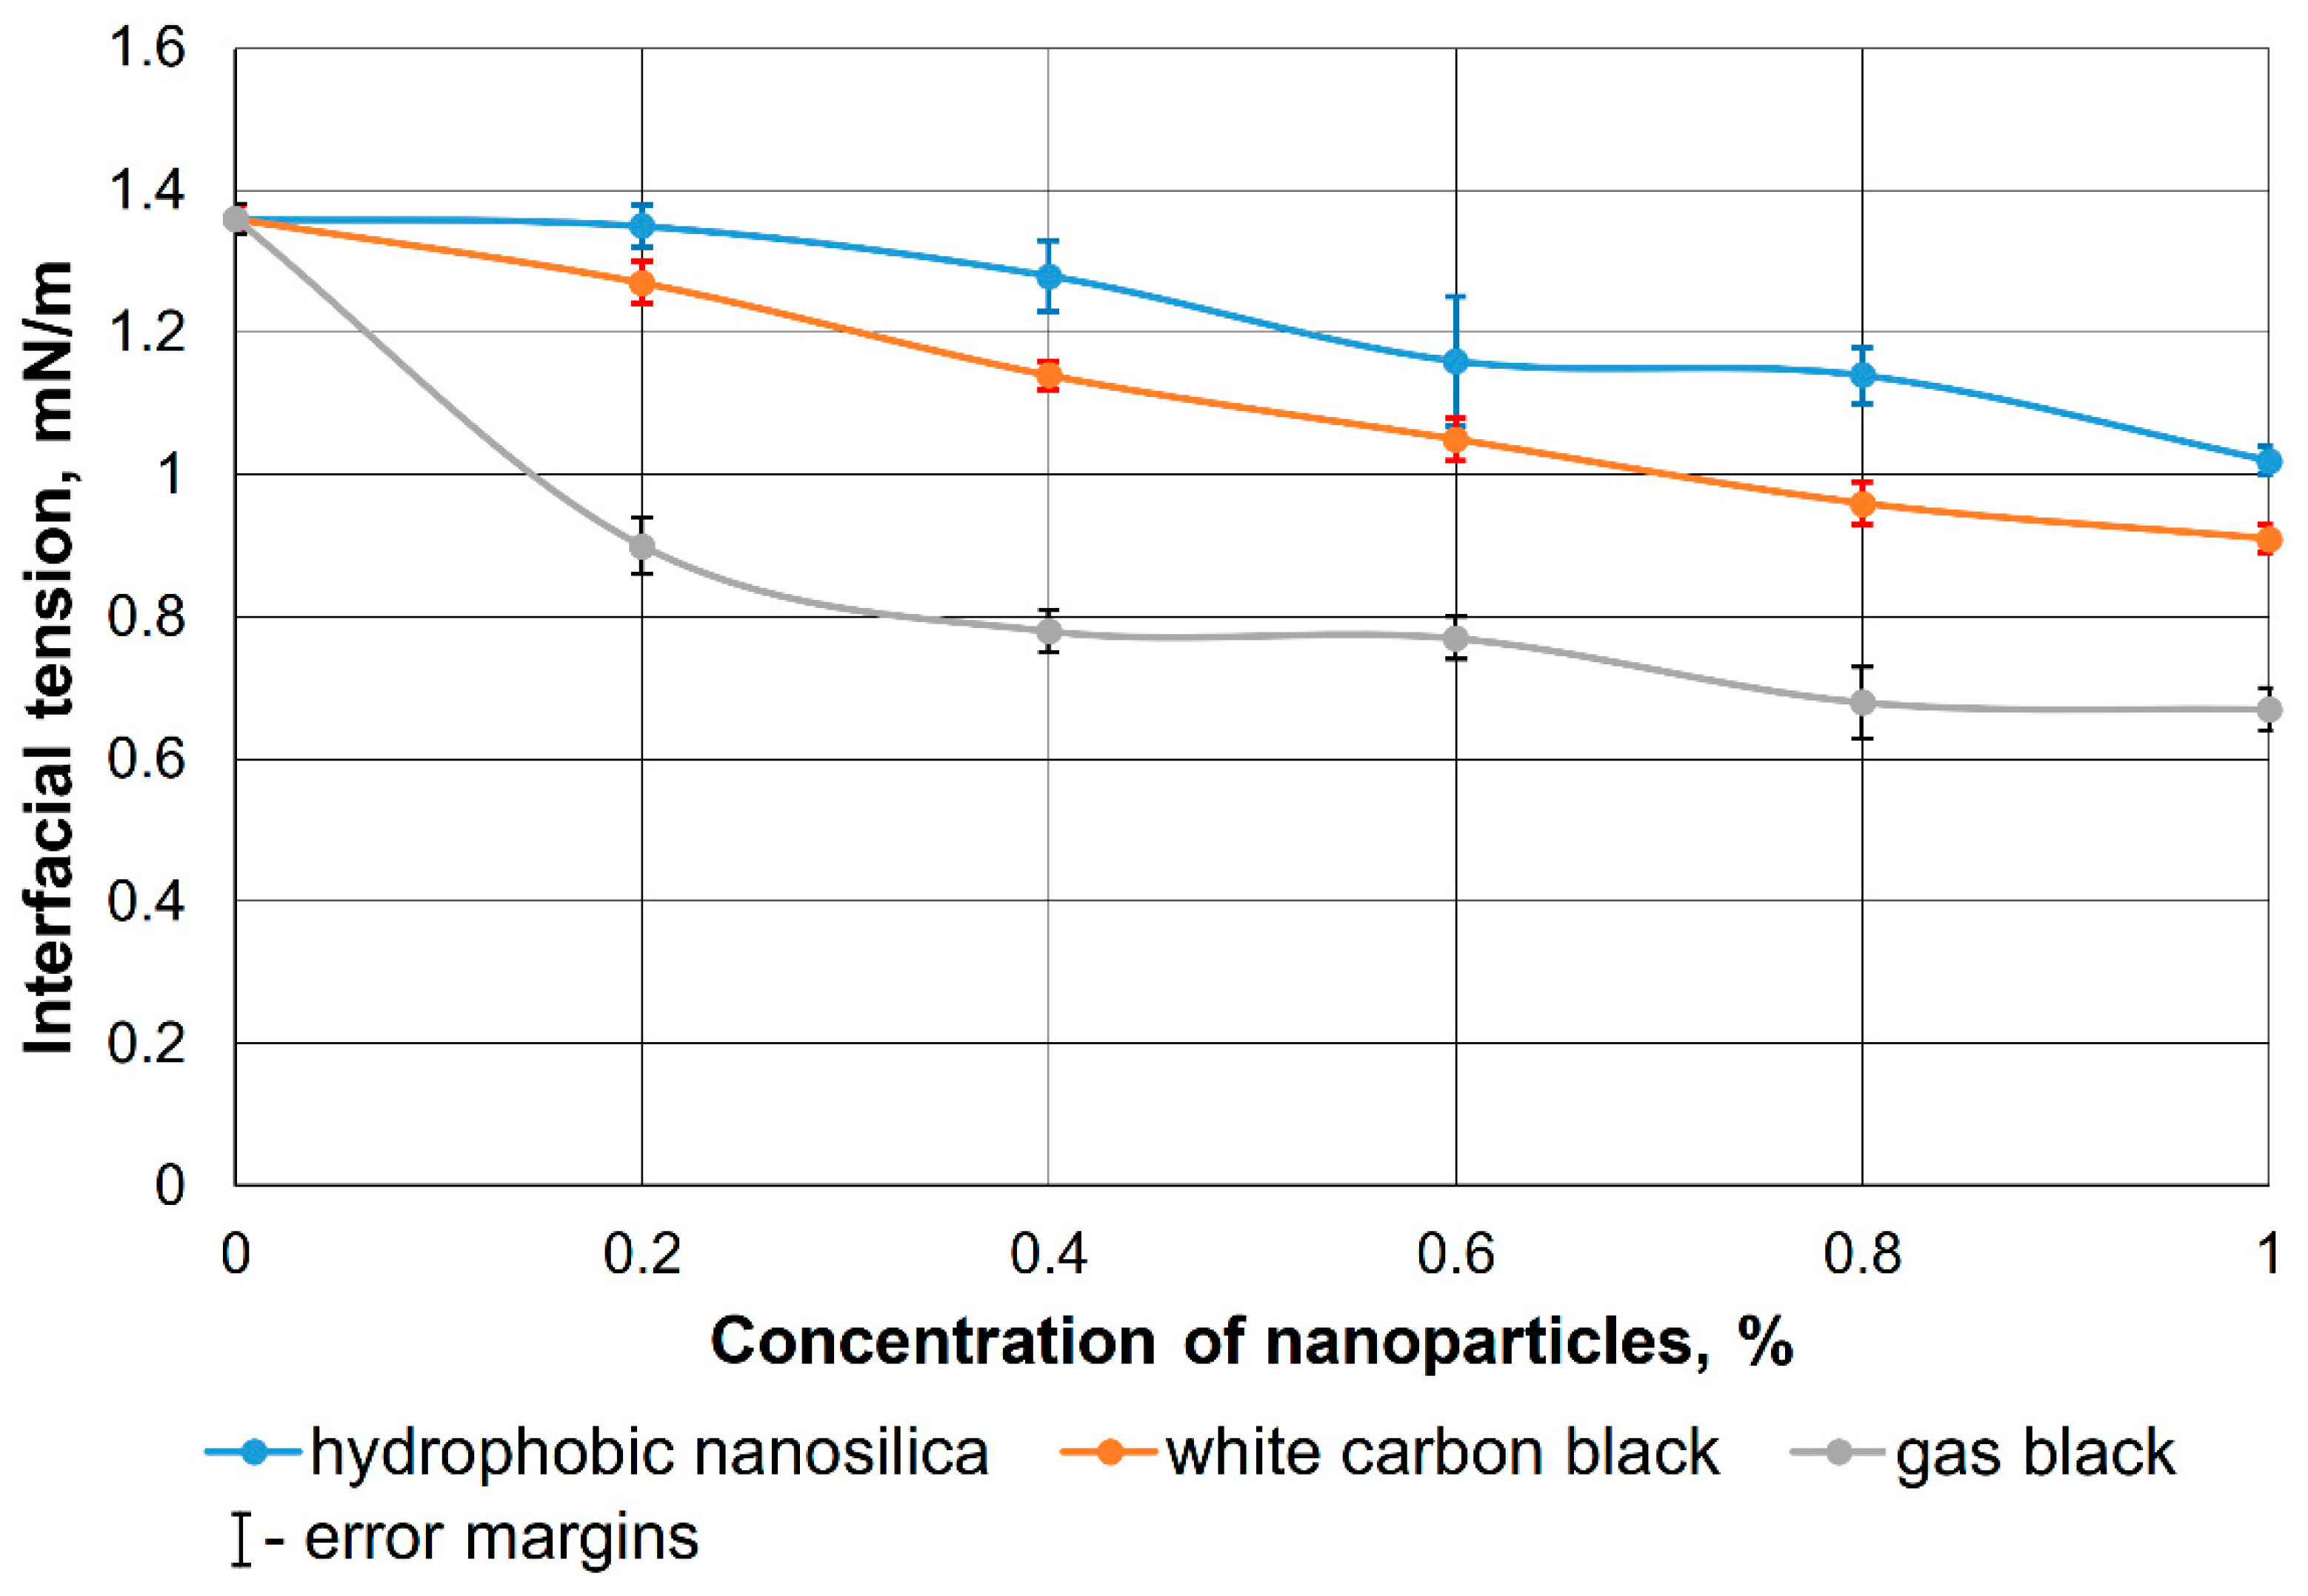
Figure 3.
Wettability isotherm for surfactants composition.
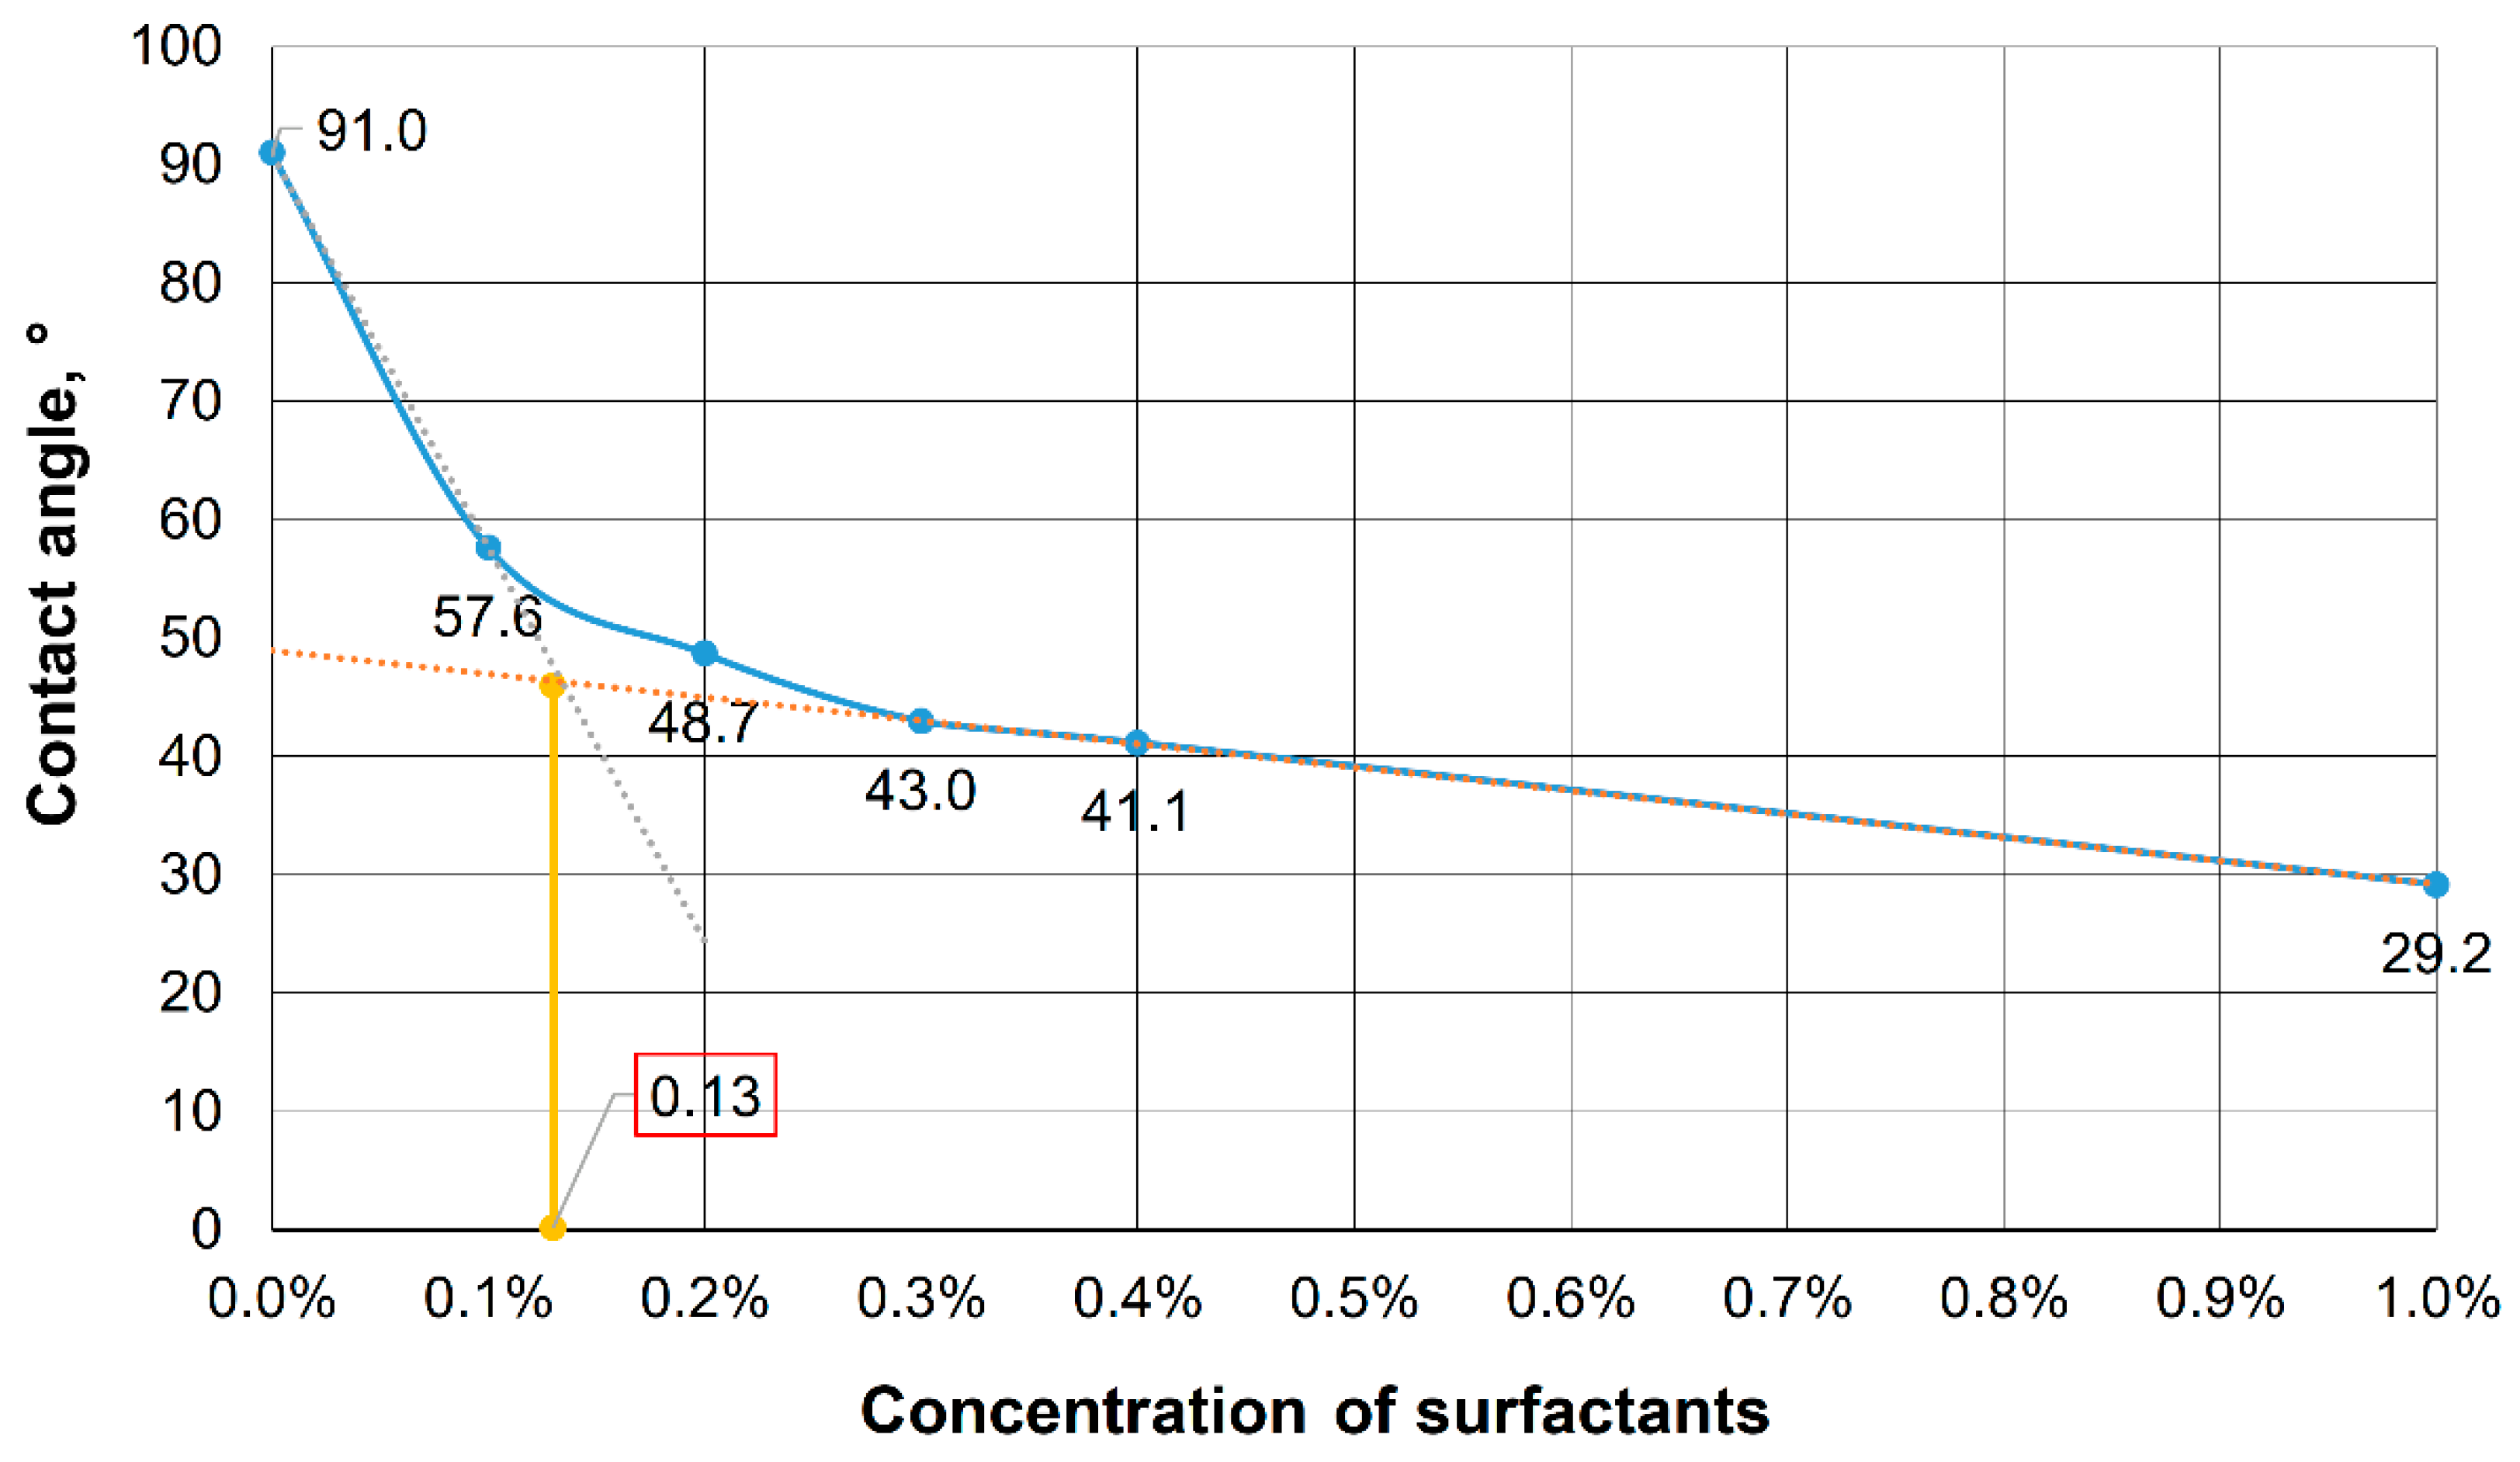
Figure 4.
Contact angle versus nanoparticle content for surfactant compositions.
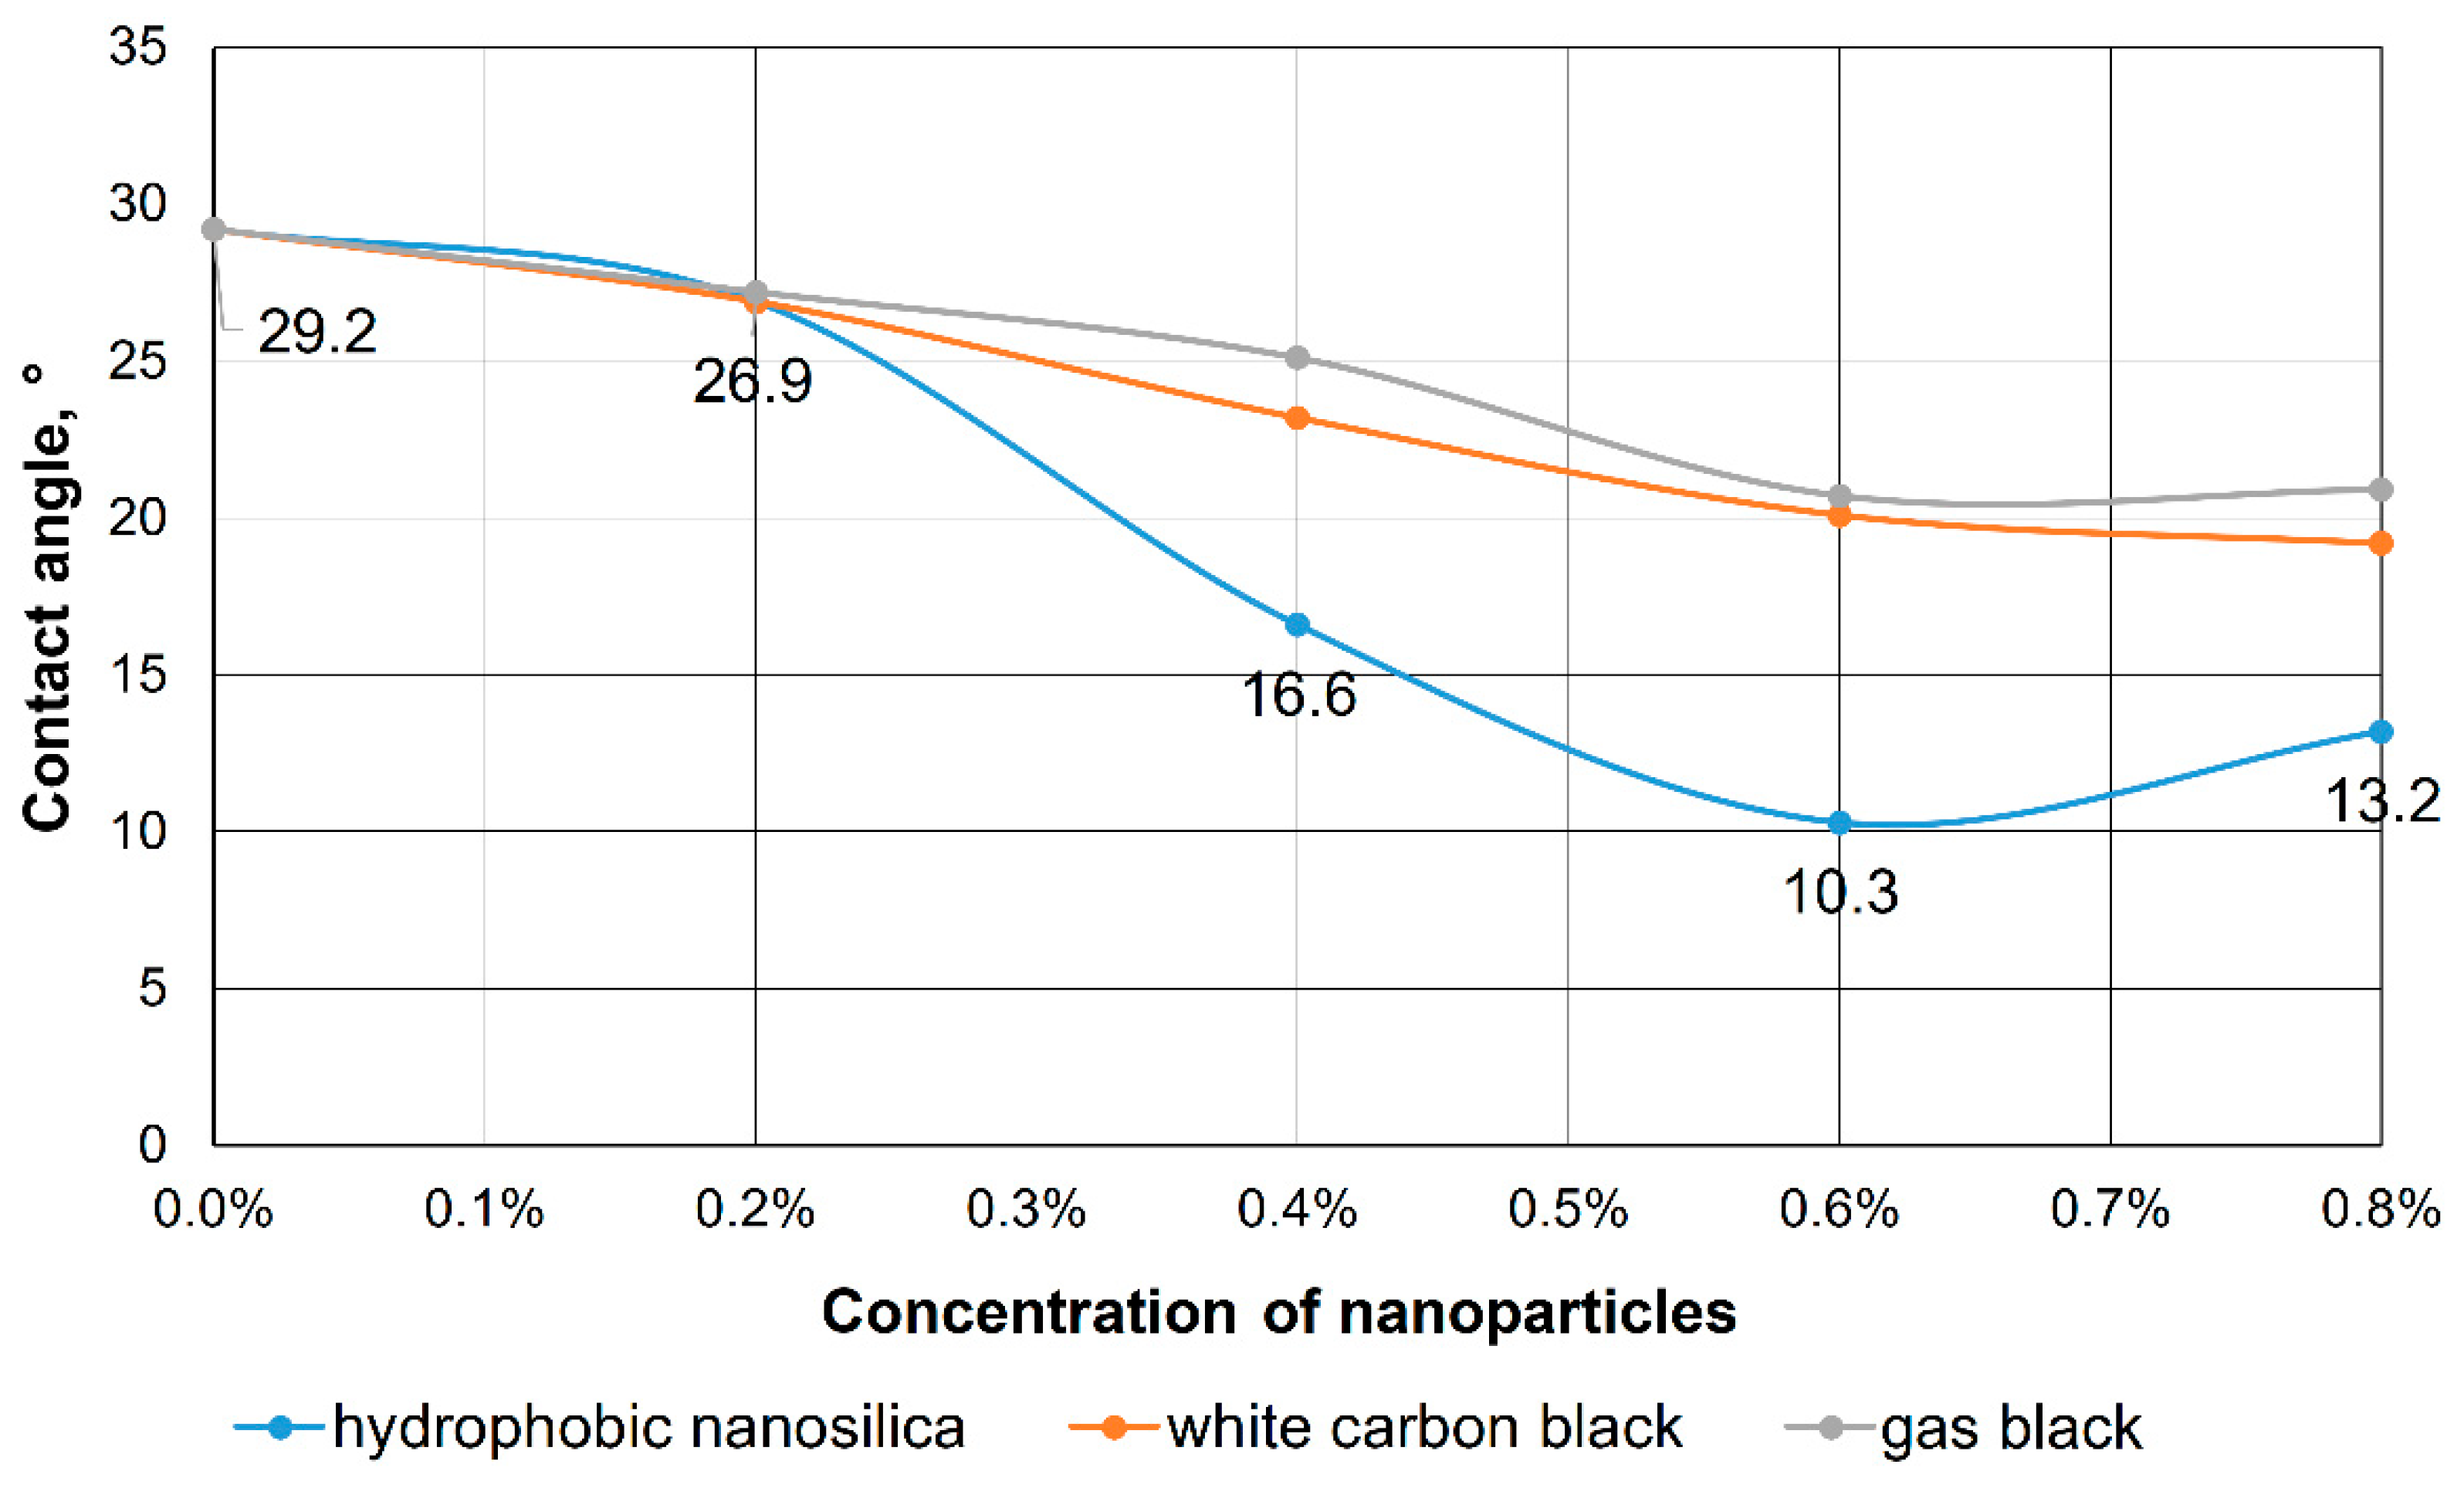
Figure 5.
Oil displacement dynamics by water from Pashian sandstones and post-flood displacement by a surfactant composition (1%) with a volume of 1 PV, followed by waterflooding (1 – displacement coefficient; 2 – pressure gradient; 3 – oil saturation).
Figure 5.
Oil displacement dynamics by water from Pashian sandstones and post-flood displacement by a surfactant composition (1%) with a volume of 1 PV, followed by waterflooding (1 – displacement coefficient; 2 – pressure gradient; 3 – oil saturation).
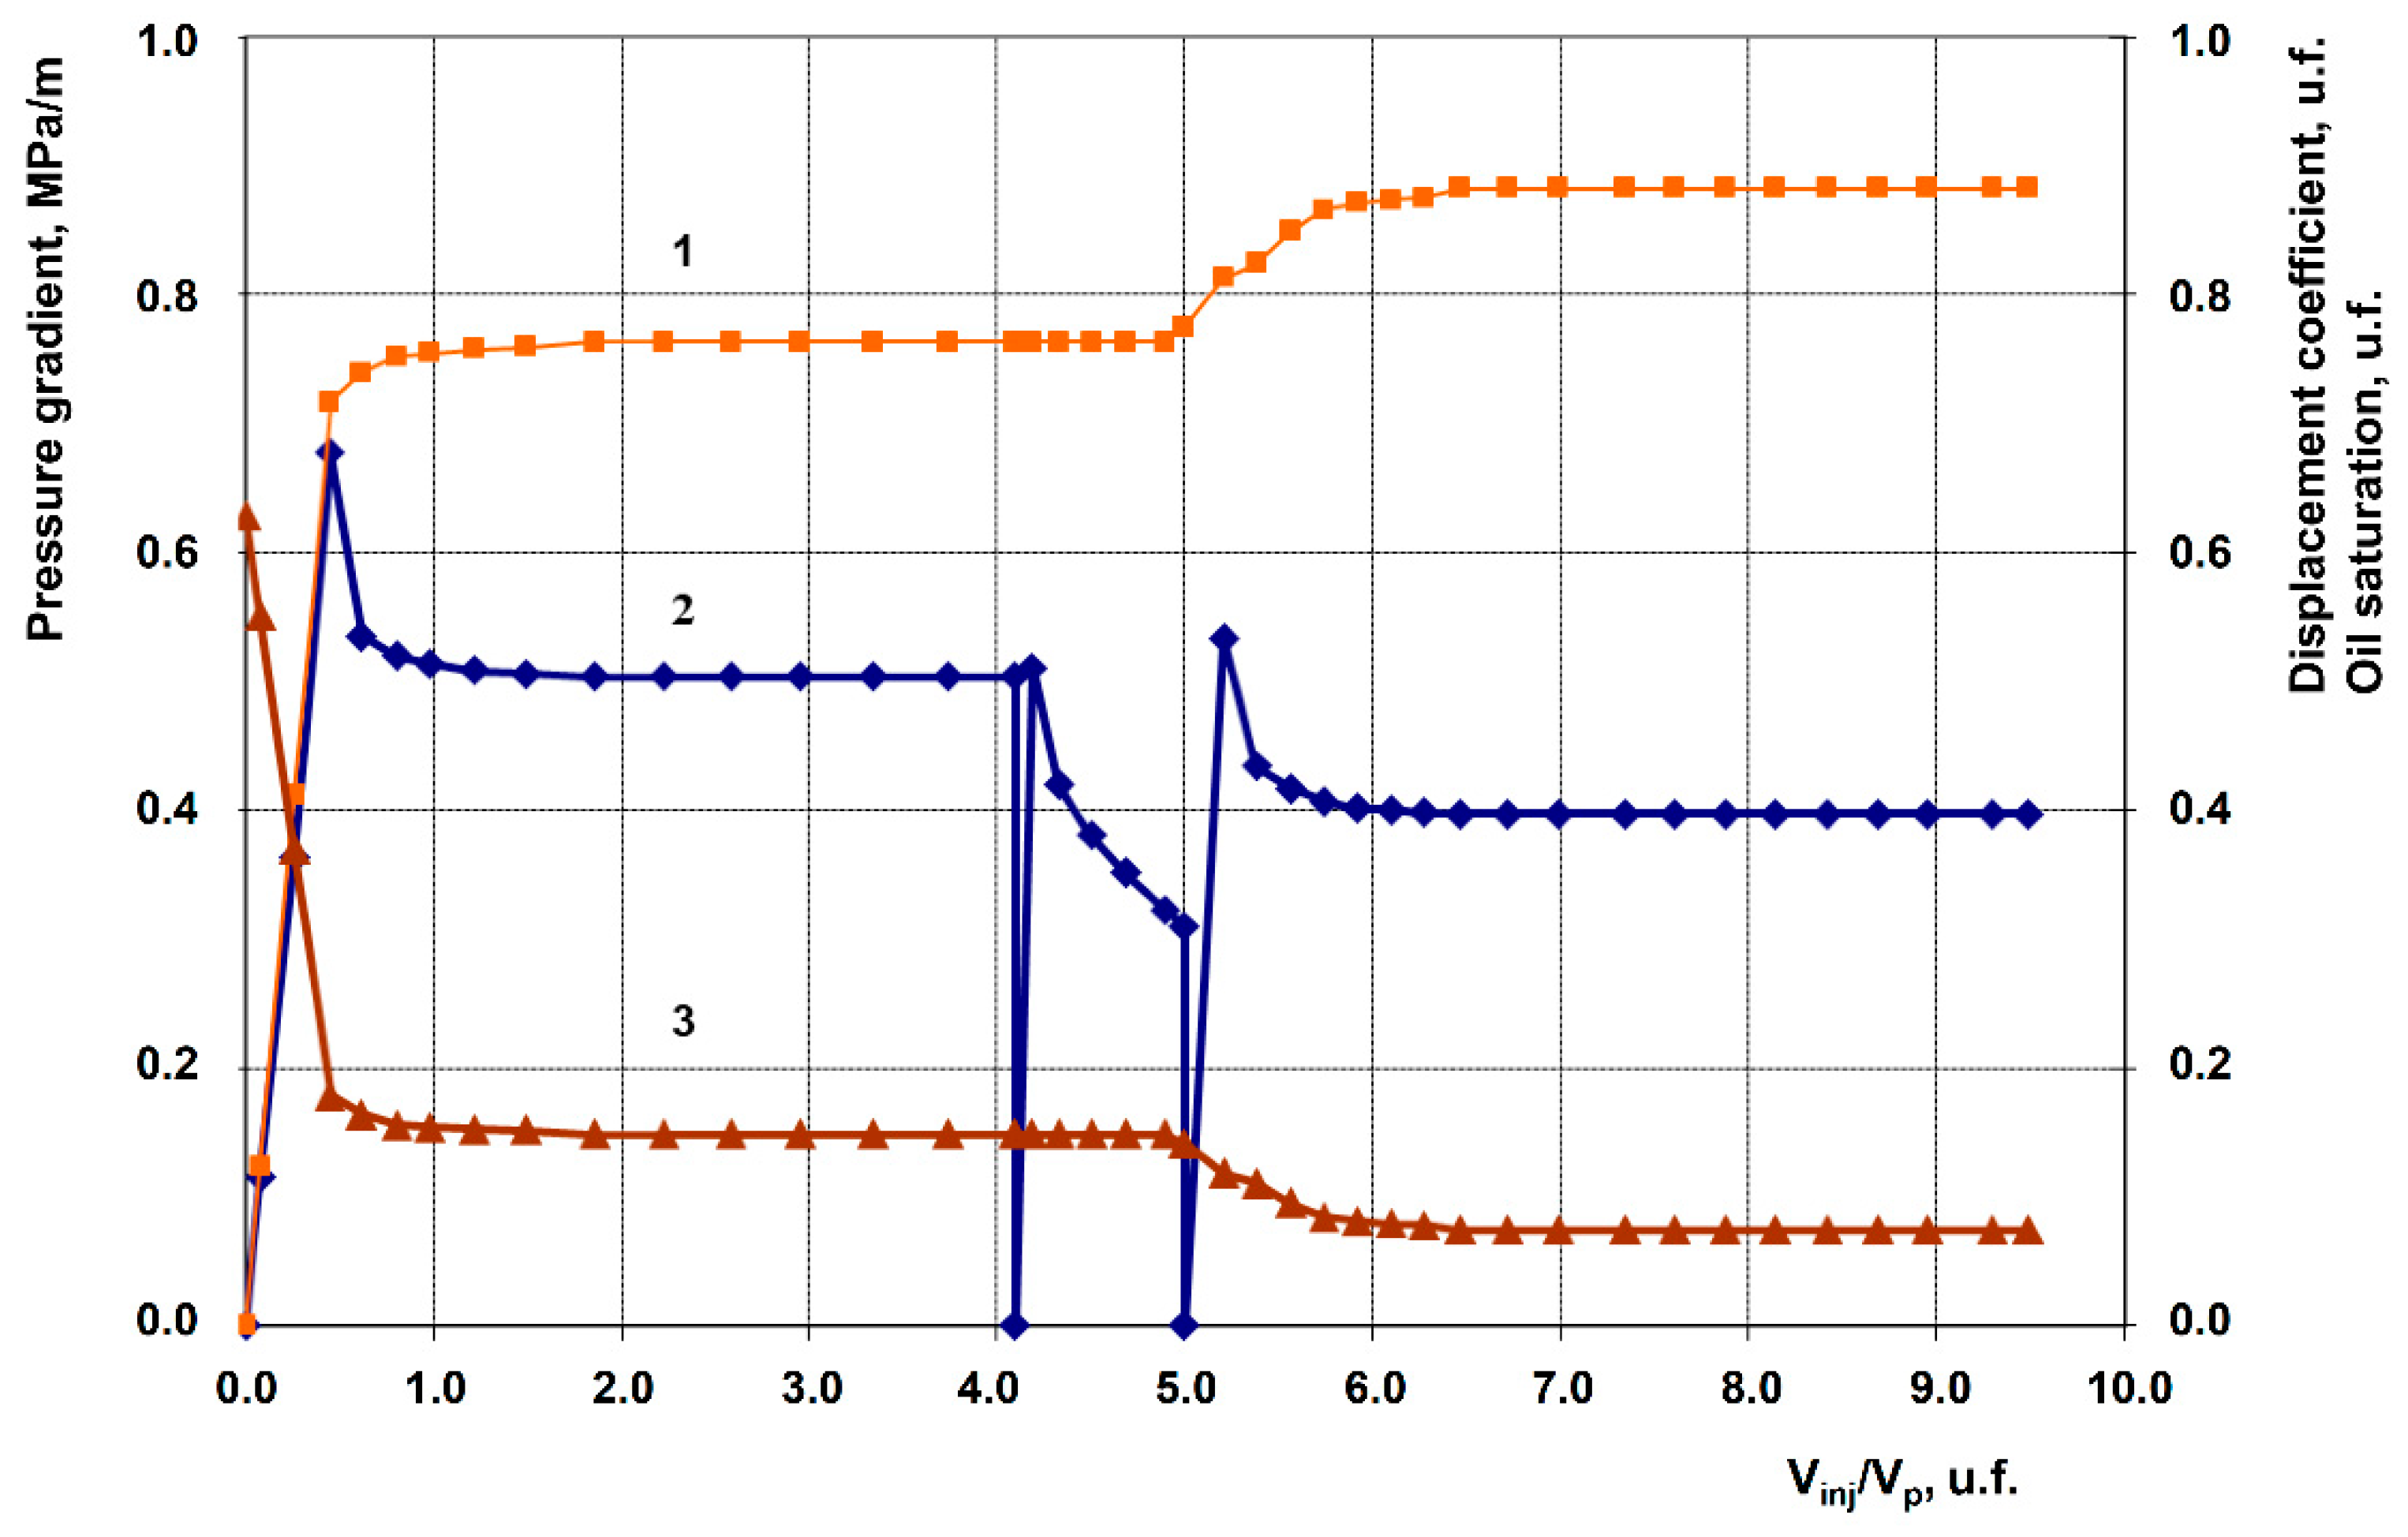
Figure 6.
Oil displacement dynamics by water from Pashian sandstones and post-flood displacement by a surfactant composition (1%) with hydrophilic nanosilica grade HSIL-200 (1%), volume 1 PV, followed by waterflooding (1 – displacement coefficient; 2 – pressure gradient; 3 – oil saturation).
Figure 6.
Oil displacement dynamics by water from Pashian sandstones and post-flood displacement by a surfactant composition (1%) with hydrophilic nanosilica grade HSIL-200 (1%), volume 1 PV, followed by waterflooding (1 – displacement coefficient; 2 – pressure gradient; 3 – oil saturation).
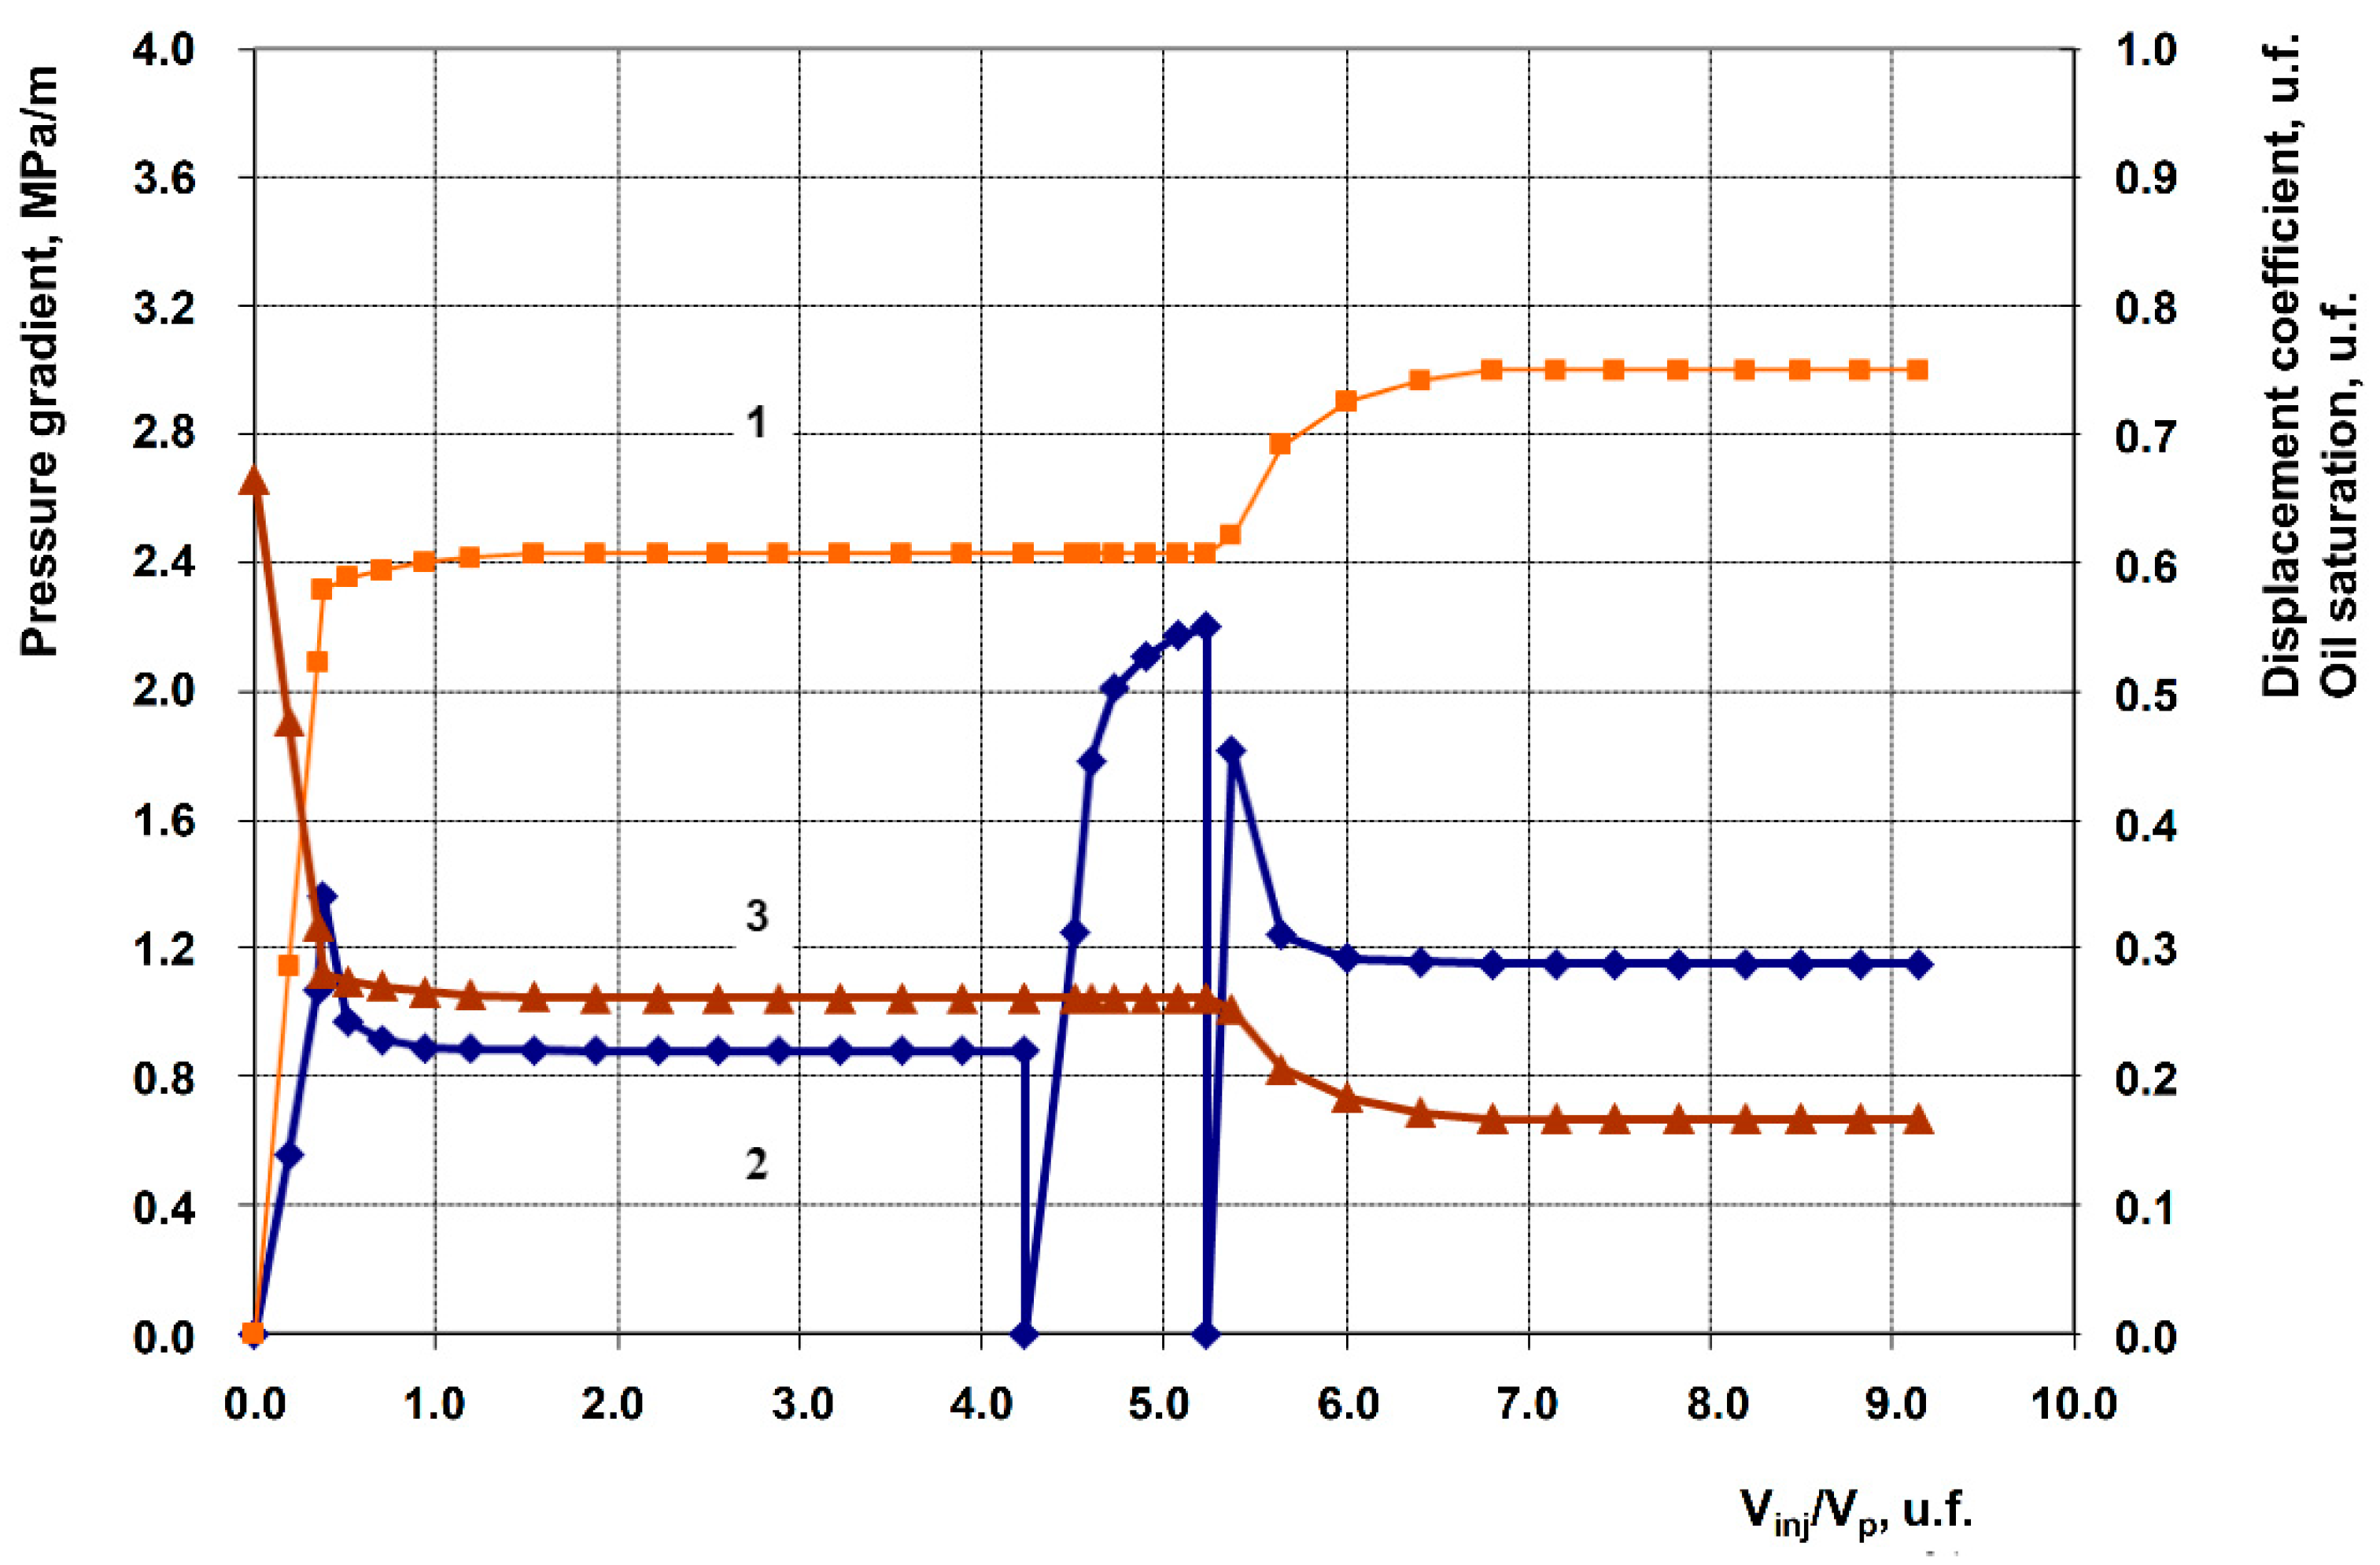
Figure 7.
Oil displacement dynamics by water from Pashian sandstones and post-flood displacement by a surfactant composition (1%) with hydrophobic nanosilica grade RX-380 (1%), volume 1 PV, followed by waterflooding (1 – displacement coefficient; 2 – pressure gradient; 3 – oil saturation).
Figure 7.
Oil displacement dynamics by water from Pashian sandstones and post-flood displacement by a surfactant composition (1%) with hydrophobic nanosilica grade RX-380 (1%), volume 1 PV, followed by waterflooding (1 – displacement coefficient; 2 – pressure gradient; 3 – oil saturation).
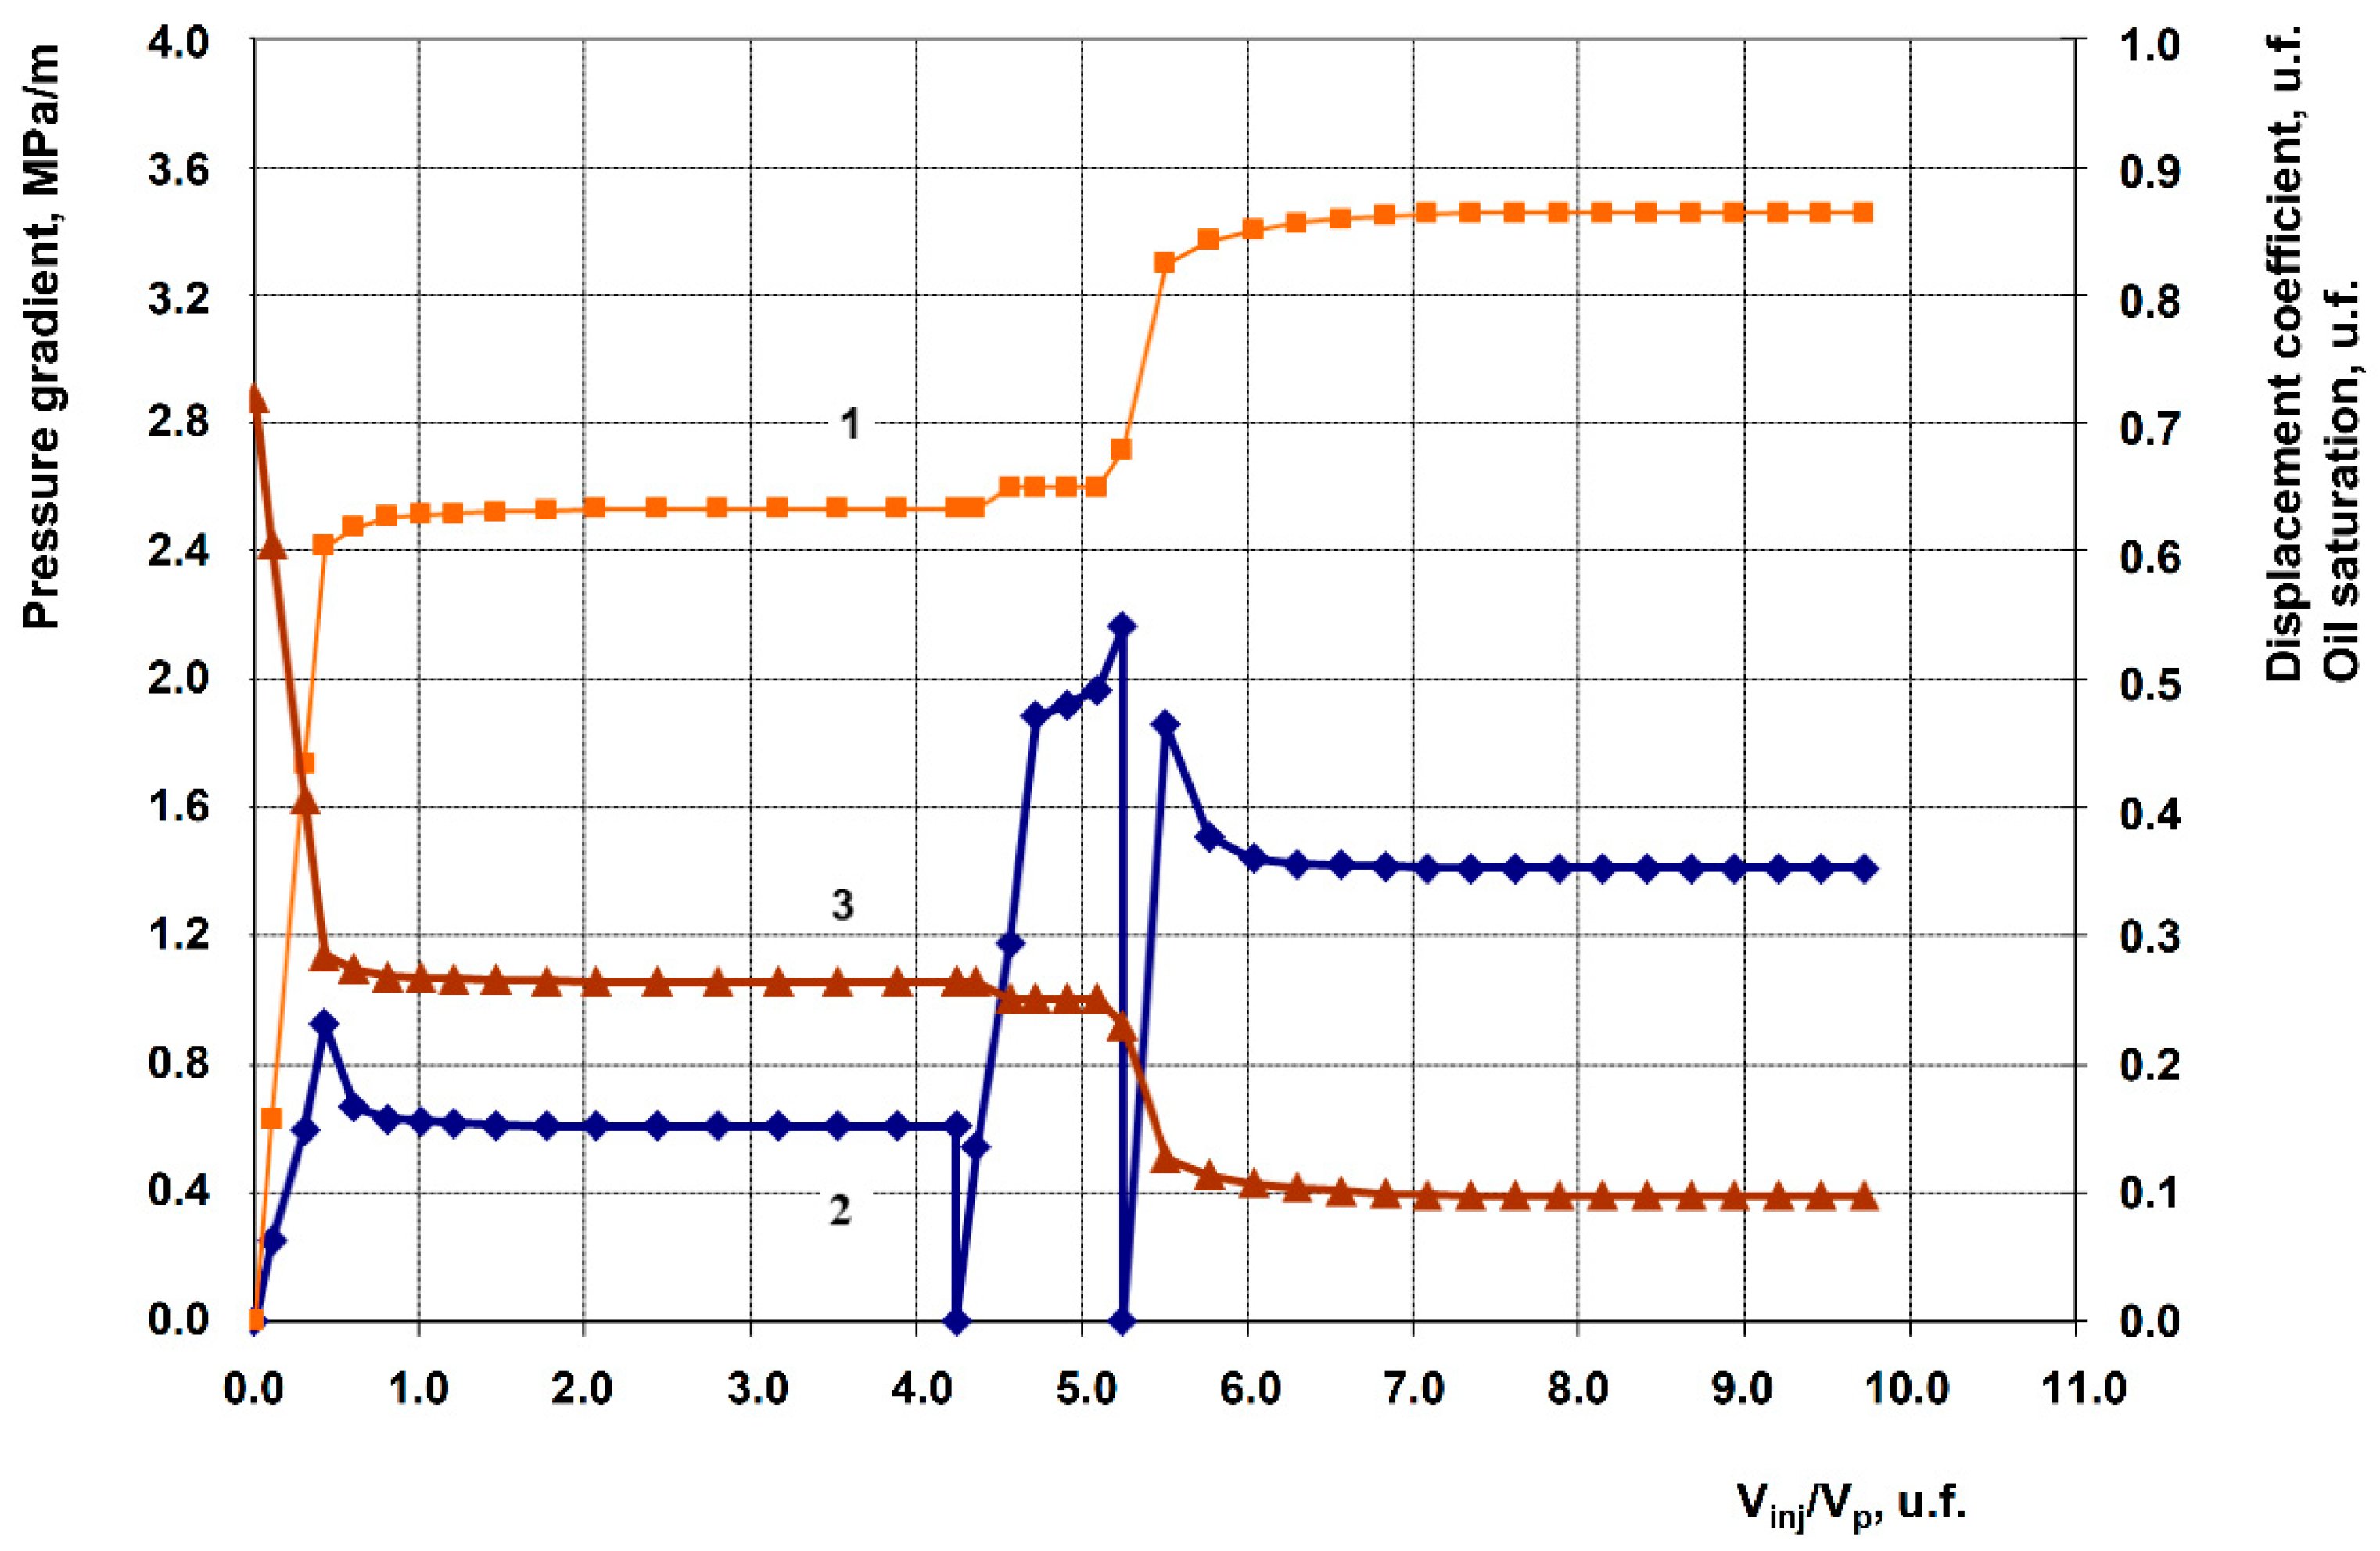
Figure 8.
Oil displacement dynamics by water from Pashian sandstones and post-flood displacement by a surfactant composition (1%) with uncompacted white carbon black (1%), volume 1 PV, followed by waterflooding (1 – displacement coefficient; 2 – pressure gradient; 3 – oil saturation).
Figure 8.
Oil displacement dynamics by water from Pashian sandstones and post-flood displacement by a surfactant composition (1%) with uncompacted white carbon black (1%), volume 1 PV, followed by waterflooding (1 – displacement coefficient; 2 – pressure gradient; 3 – oil saturation).
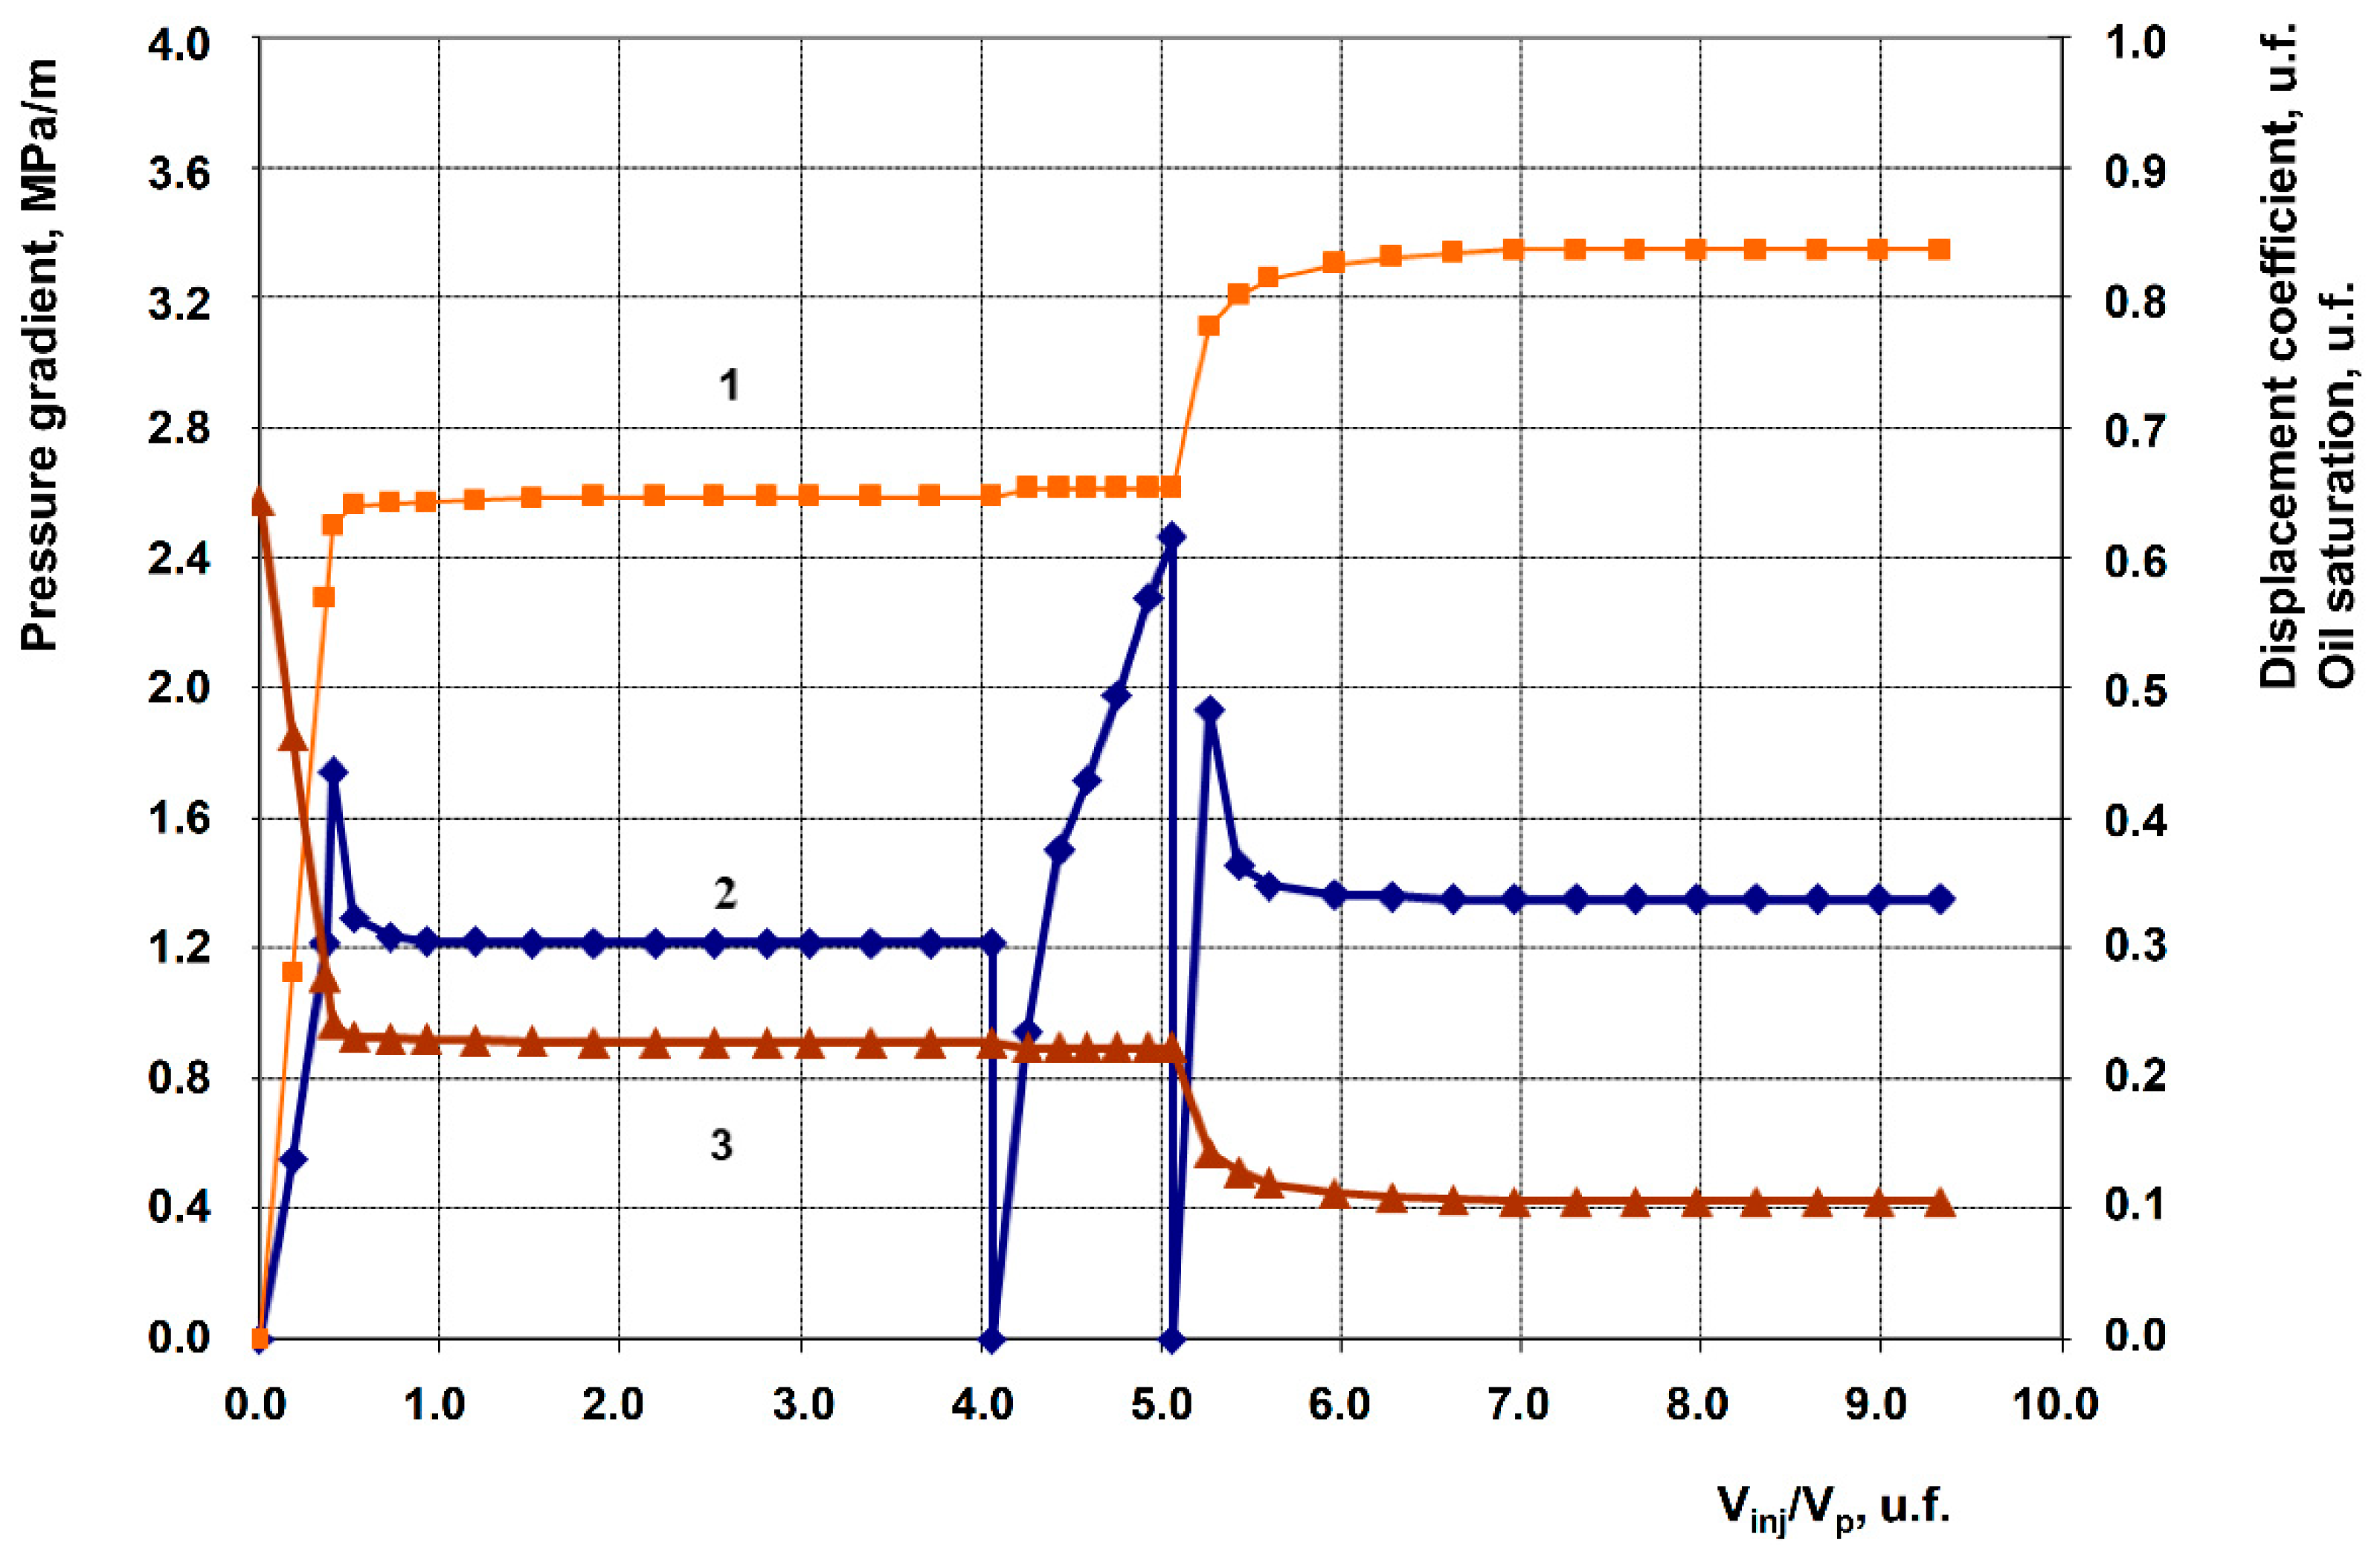
Figure 9.
Oil displacement dynamics by water from Pashian sandstones and post-flood displacement by a surfactant composition (1%) with graphene (1%), volume 1 PV, followed by waterflooding (1 – displacement coefficient; 2 – pressure gradient; 3 – oil saturation).
Figure 9.
Oil displacement dynamics by water from Pashian sandstones and post-flood displacement by a surfactant composition (1%) with graphene (1%), volume 1 PV, followed by waterflooding (1 – displacement coefficient; 2 – pressure gradient; 3 – oil saturation).
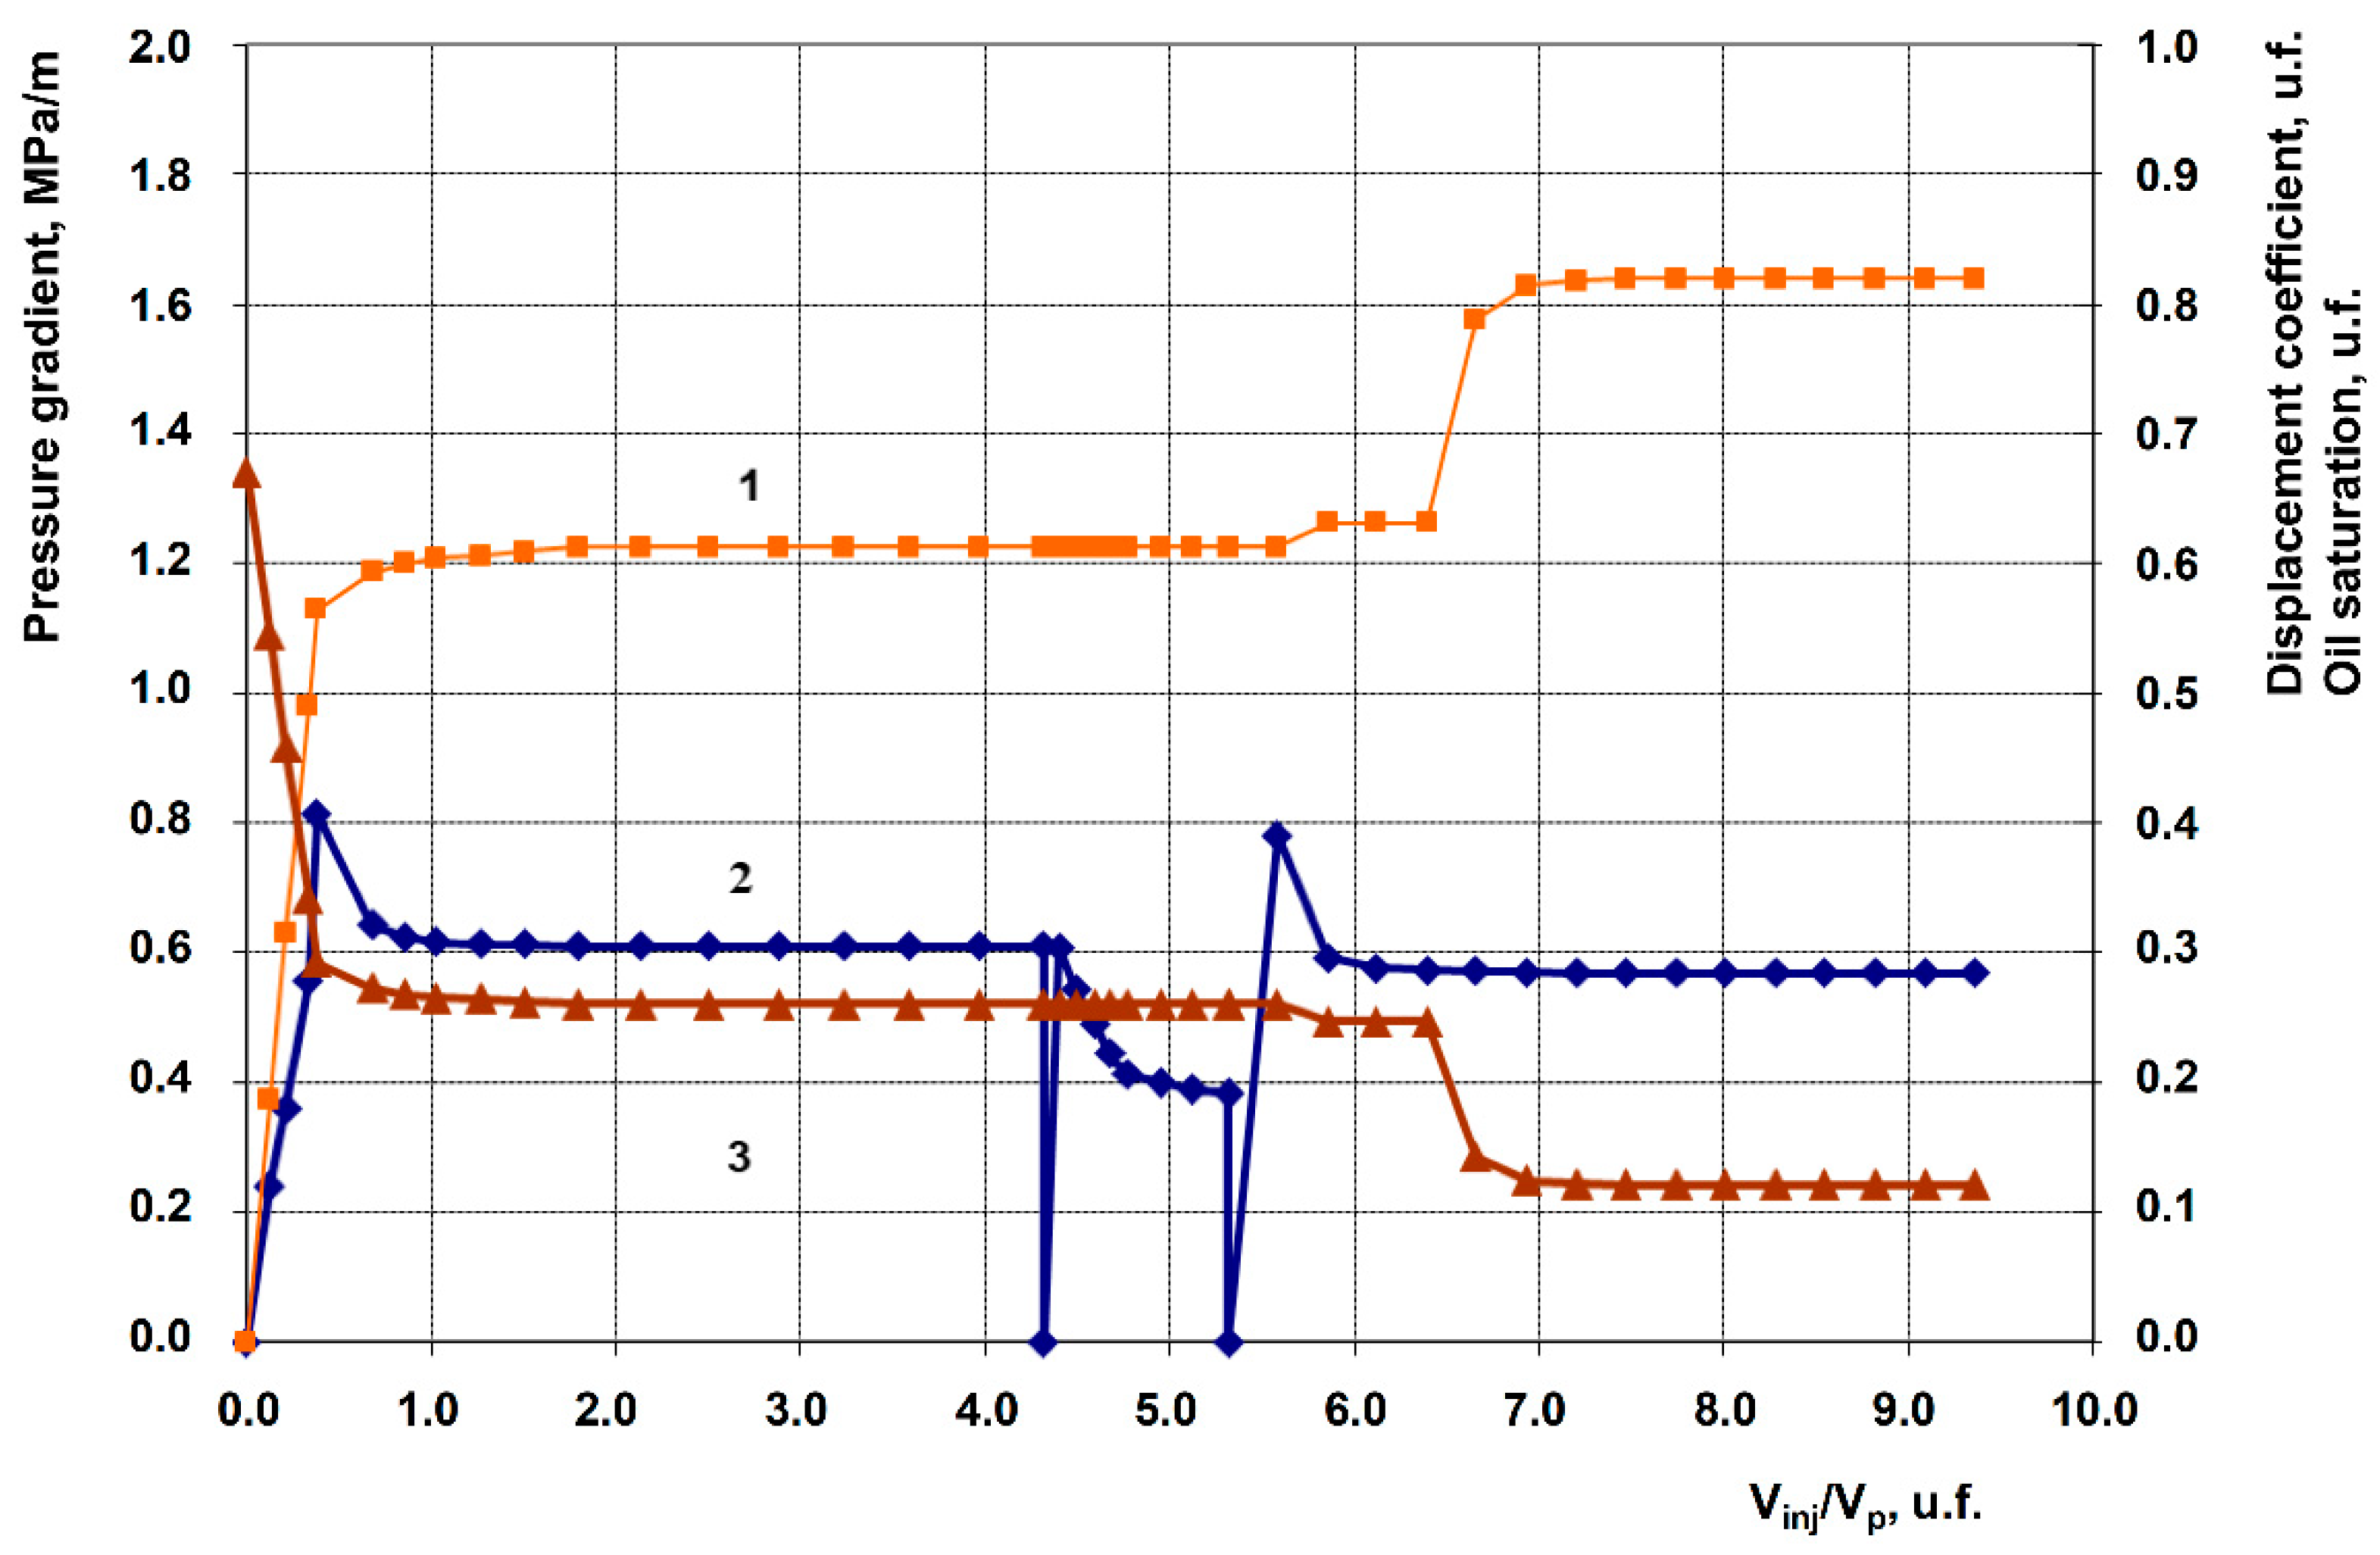
Figure 10.
Oil displacement dynamics by water from Pashian sandstones and post-flood displacement by a surfactant composition (1%) with shungite (1%), volume 1 PV, followed by waterflooding (1 – displacement coefficient; 2 – pressure gradient; 3 – oil saturation).
Figure 10.
Oil displacement dynamics by water from Pashian sandstones and post-flood displacement by a surfactant composition (1%) with shungite (1%), volume 1 PV, followed by waterflooding (1 – displacement coefficient; 2 – pressure gradient; 3 – oil saturation).
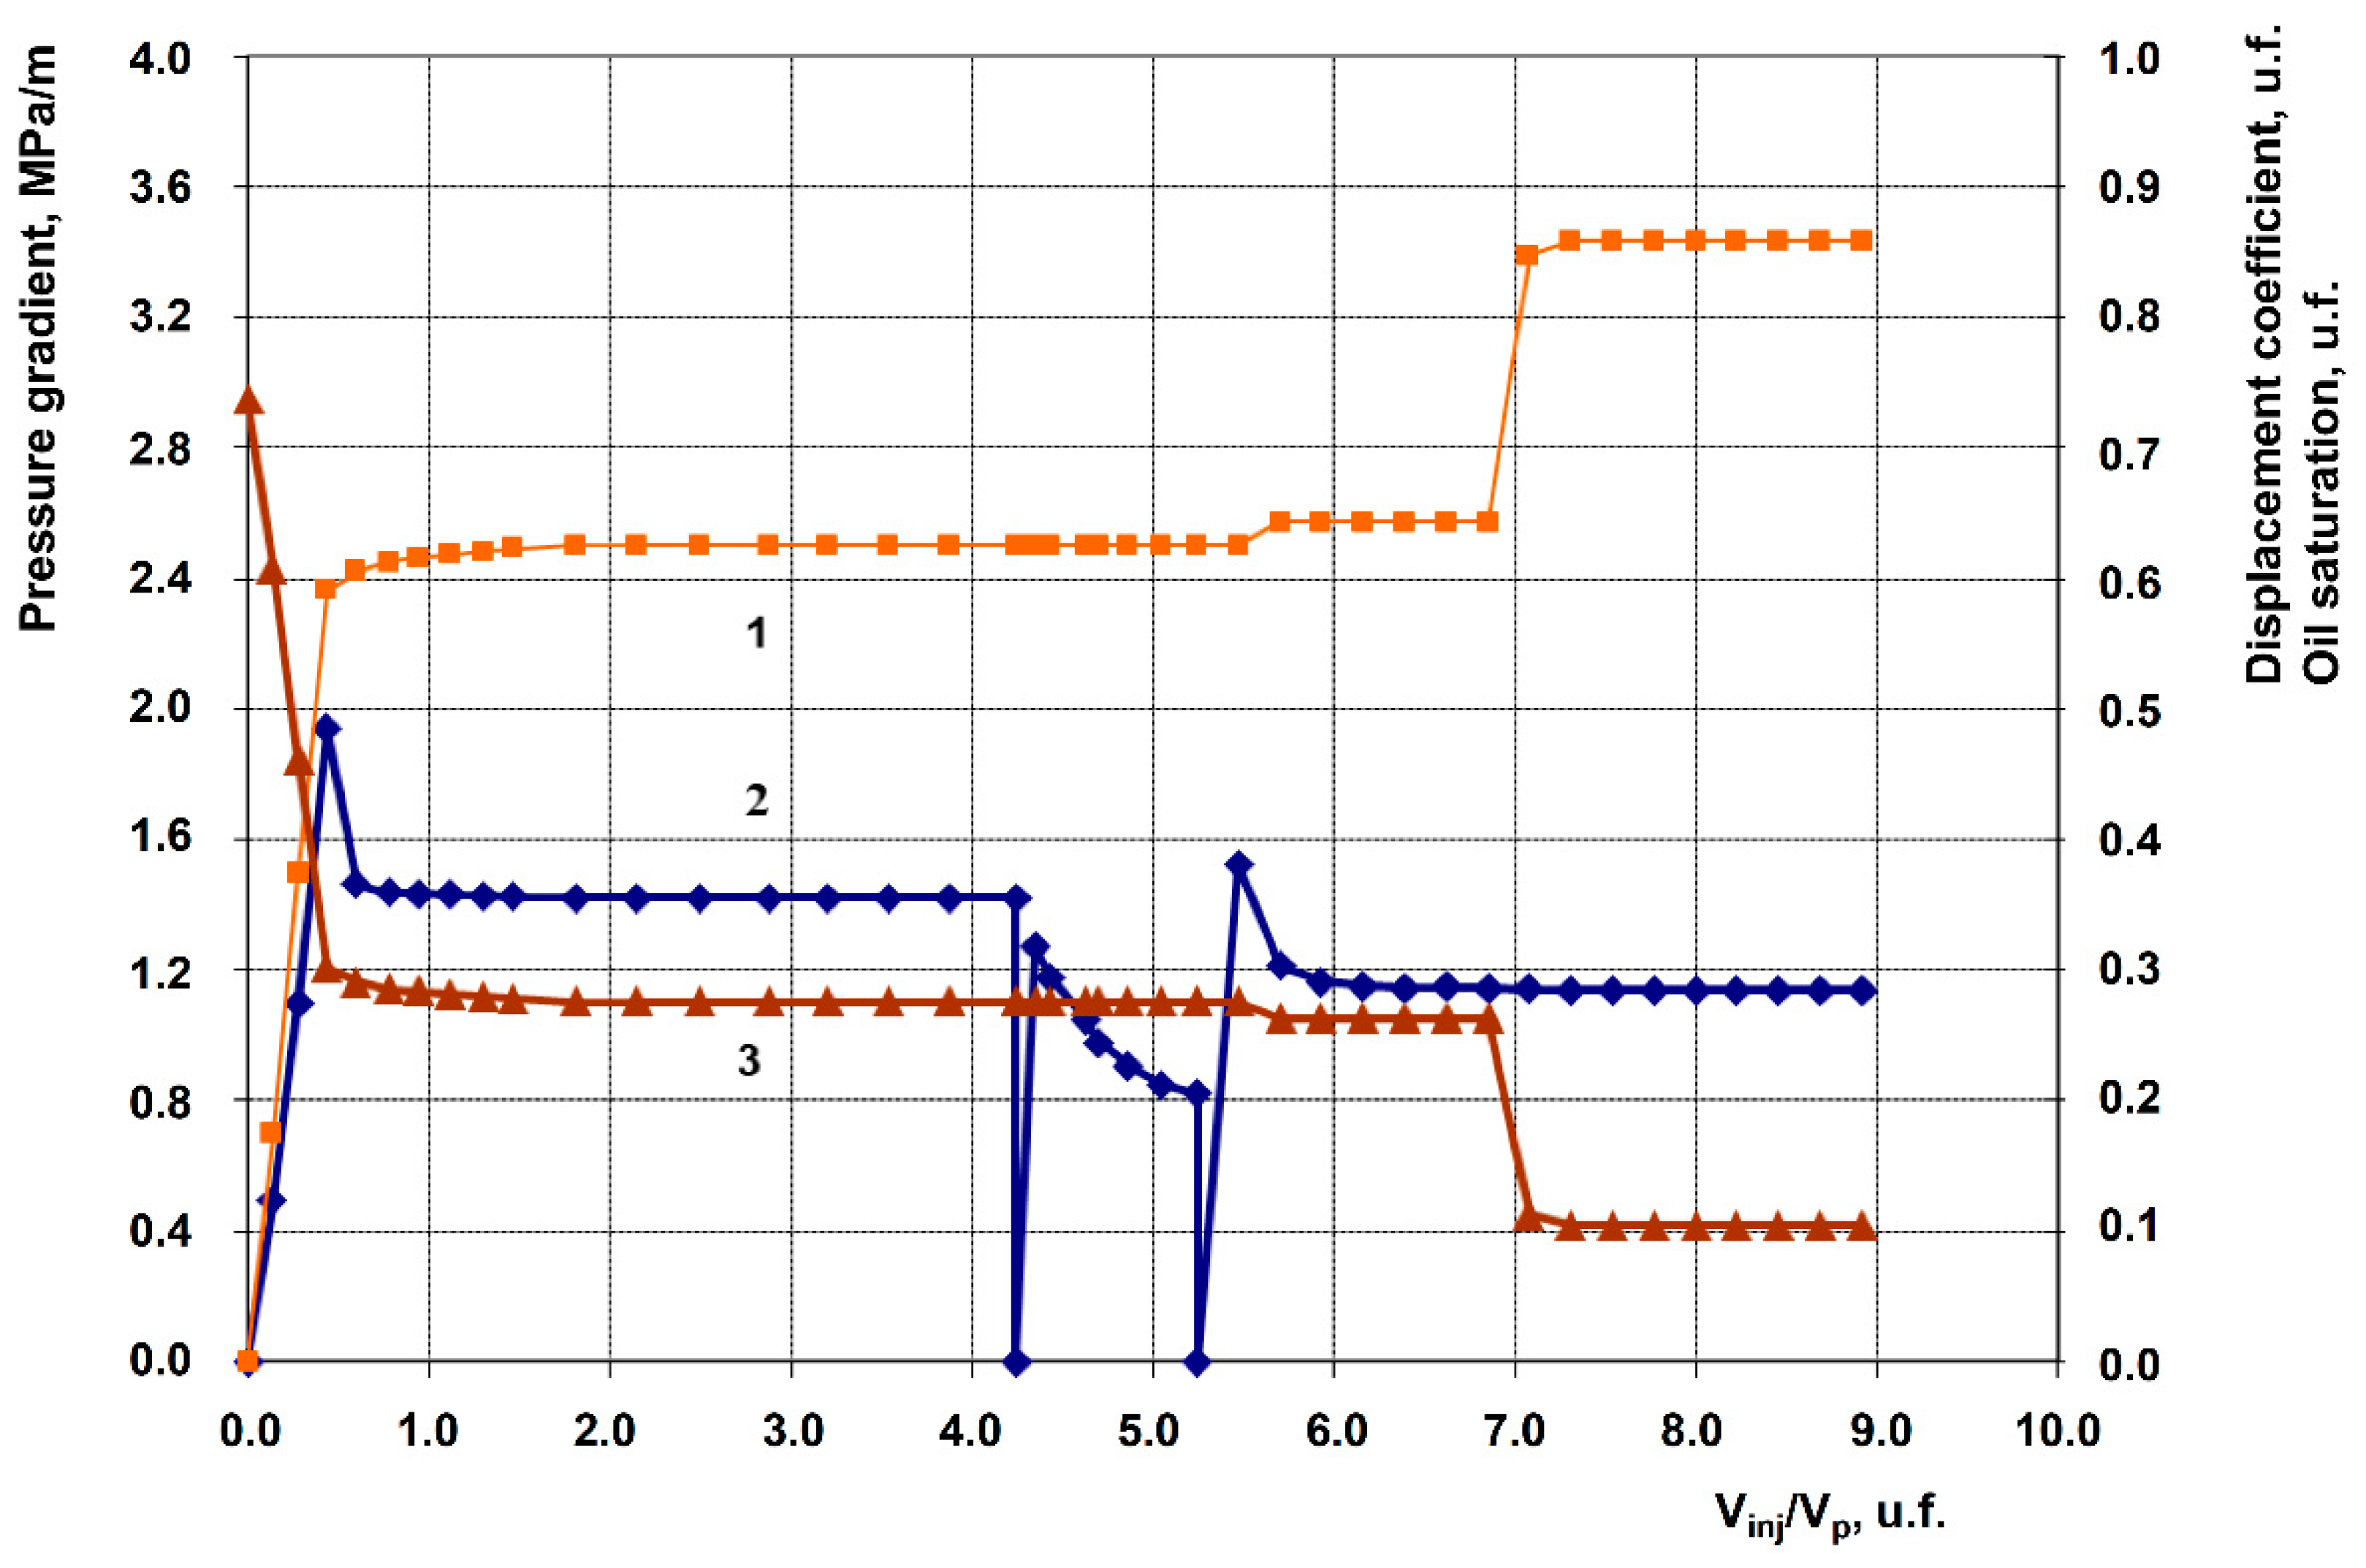
Figure 11.
Oil displacement dynamics by water from Pashian sandstones and post-flood displacement by a surfactant composition (1%) with gas black (1%), volume 1 PV, followed by waterflooding (1 – displacement coefficient; 2 – pressure gradient; 3 – oil saturation).
Figure 11.
Oil displacement dynamics by water from Pashian sandstones and post-flood displacement by a surfactant composition (1%) with gas black (1%), volume 1 PV, followed by waterflooding (1 – displacement coefficient; 2 – pressure gradient; 3 – oil saturation).
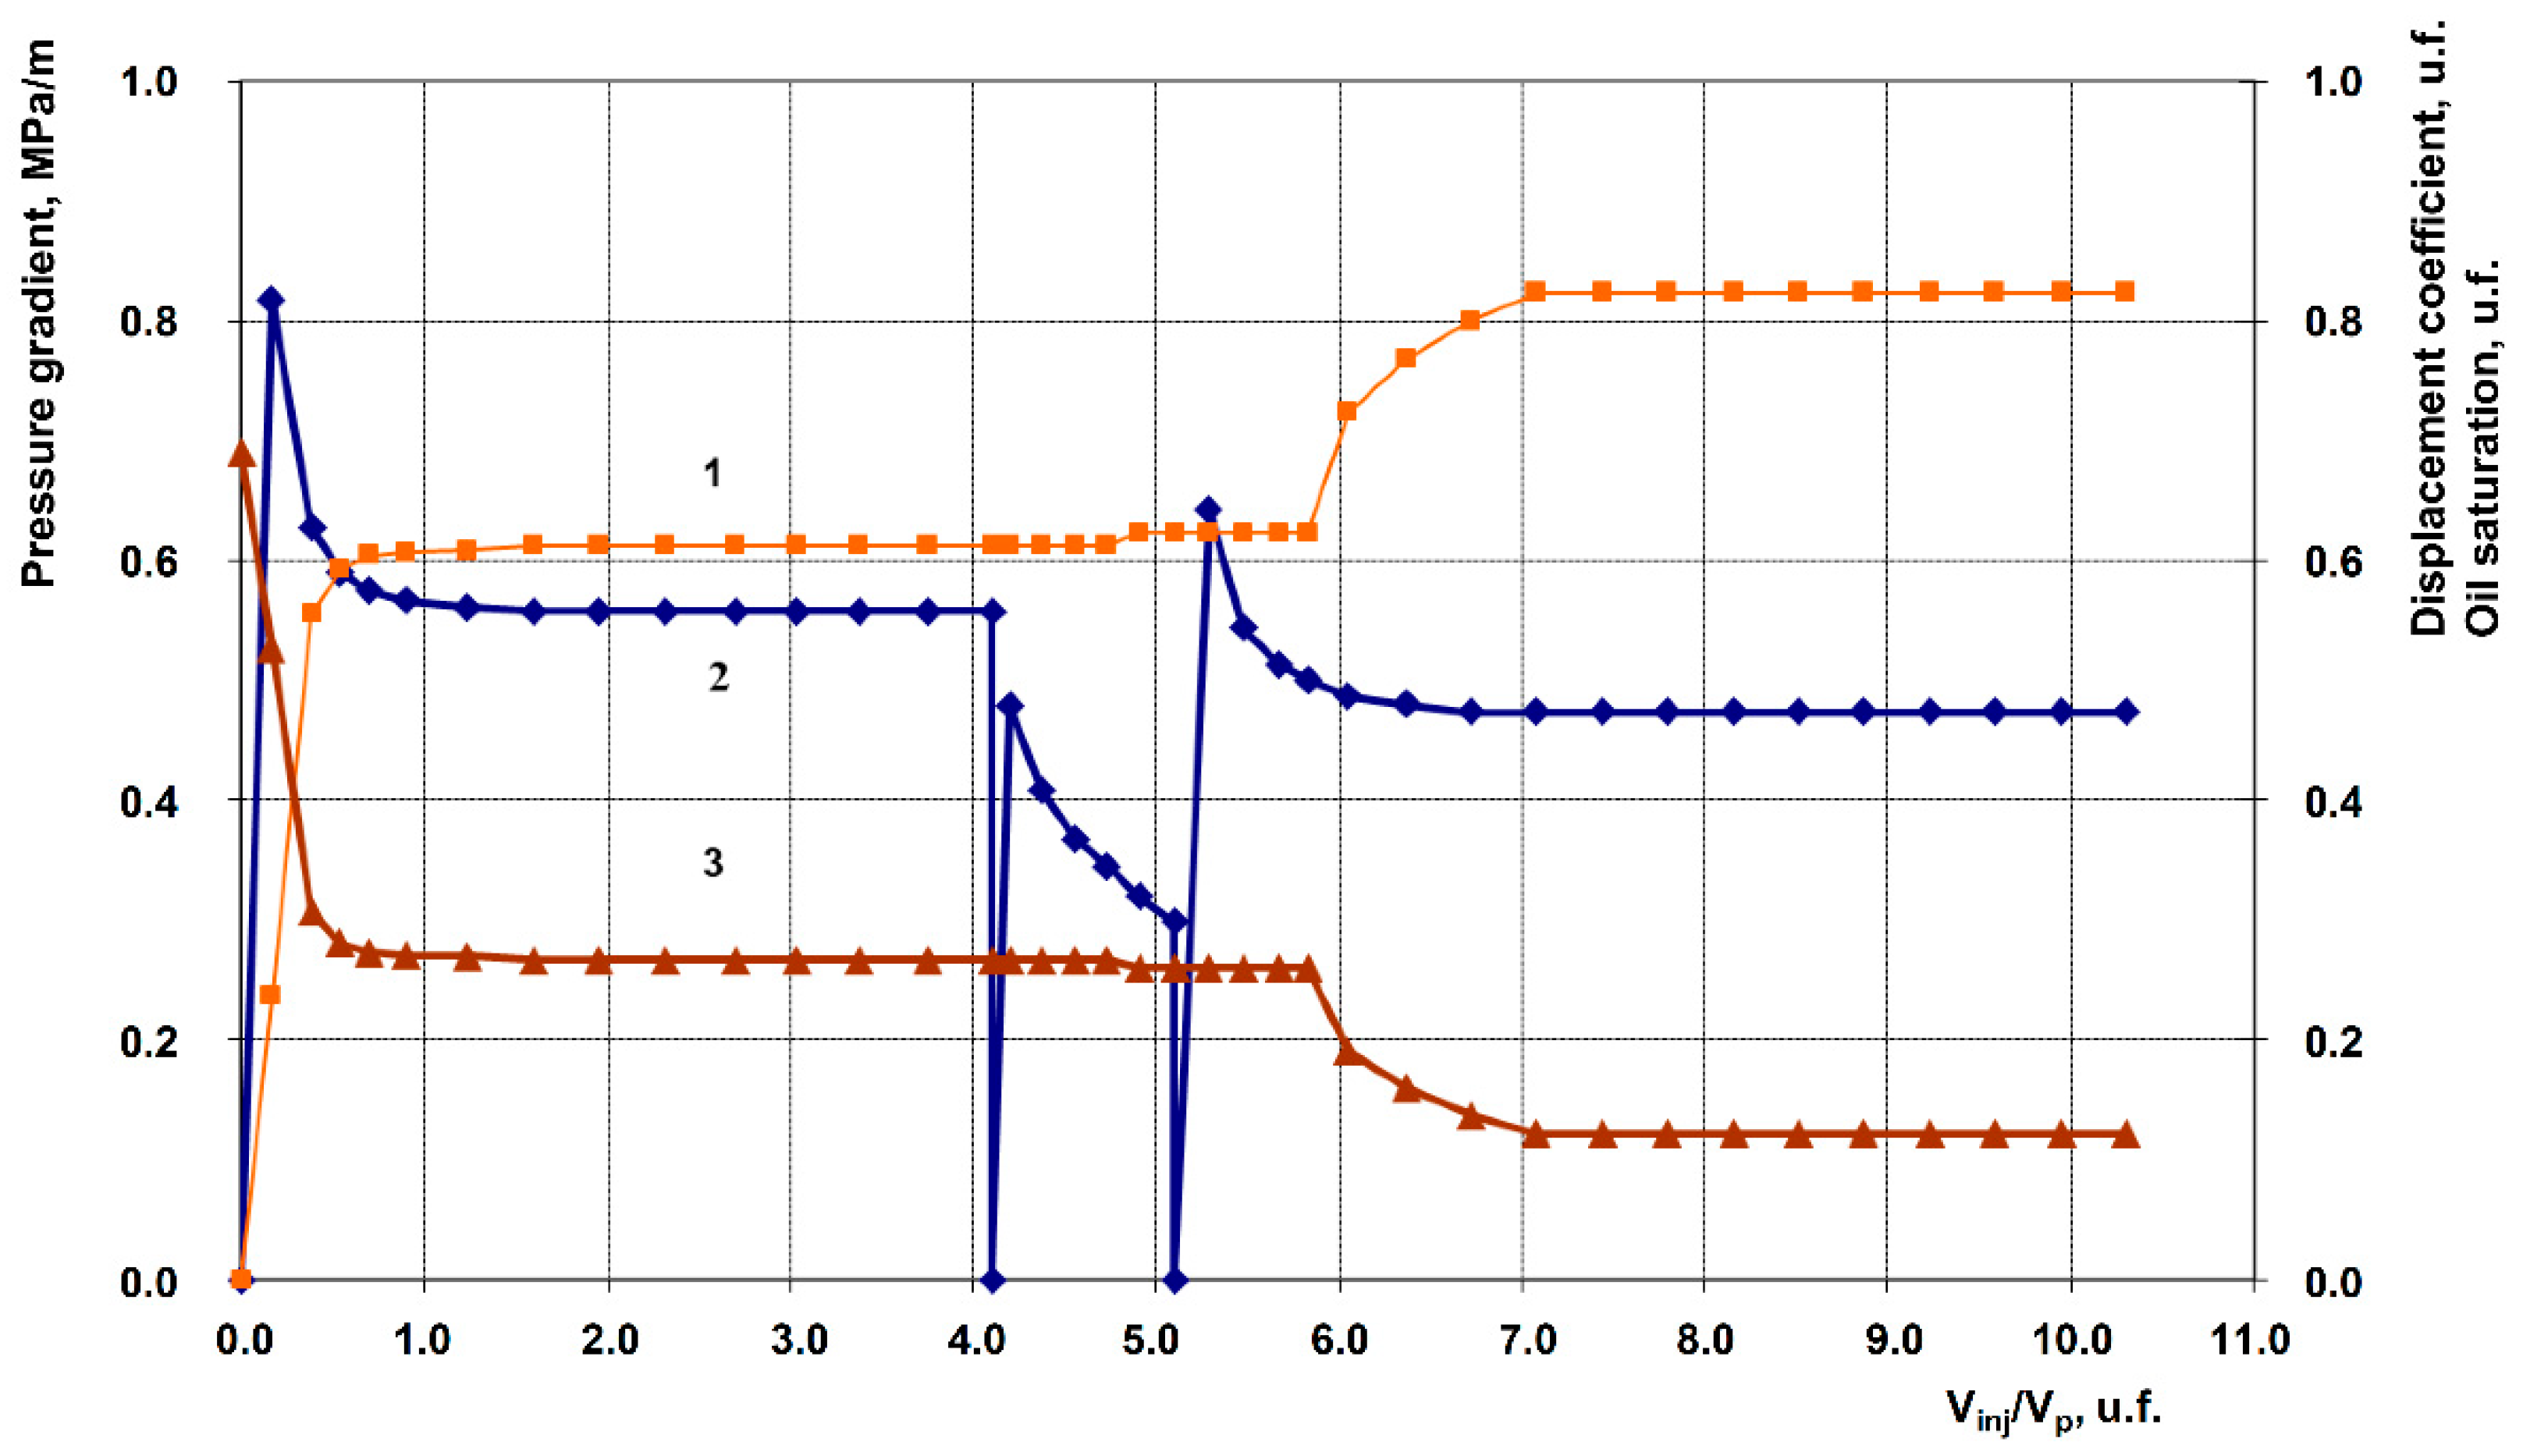
Figure 12.
Particle size distribution for the surfactant composition with hydrophobic nanosilica.
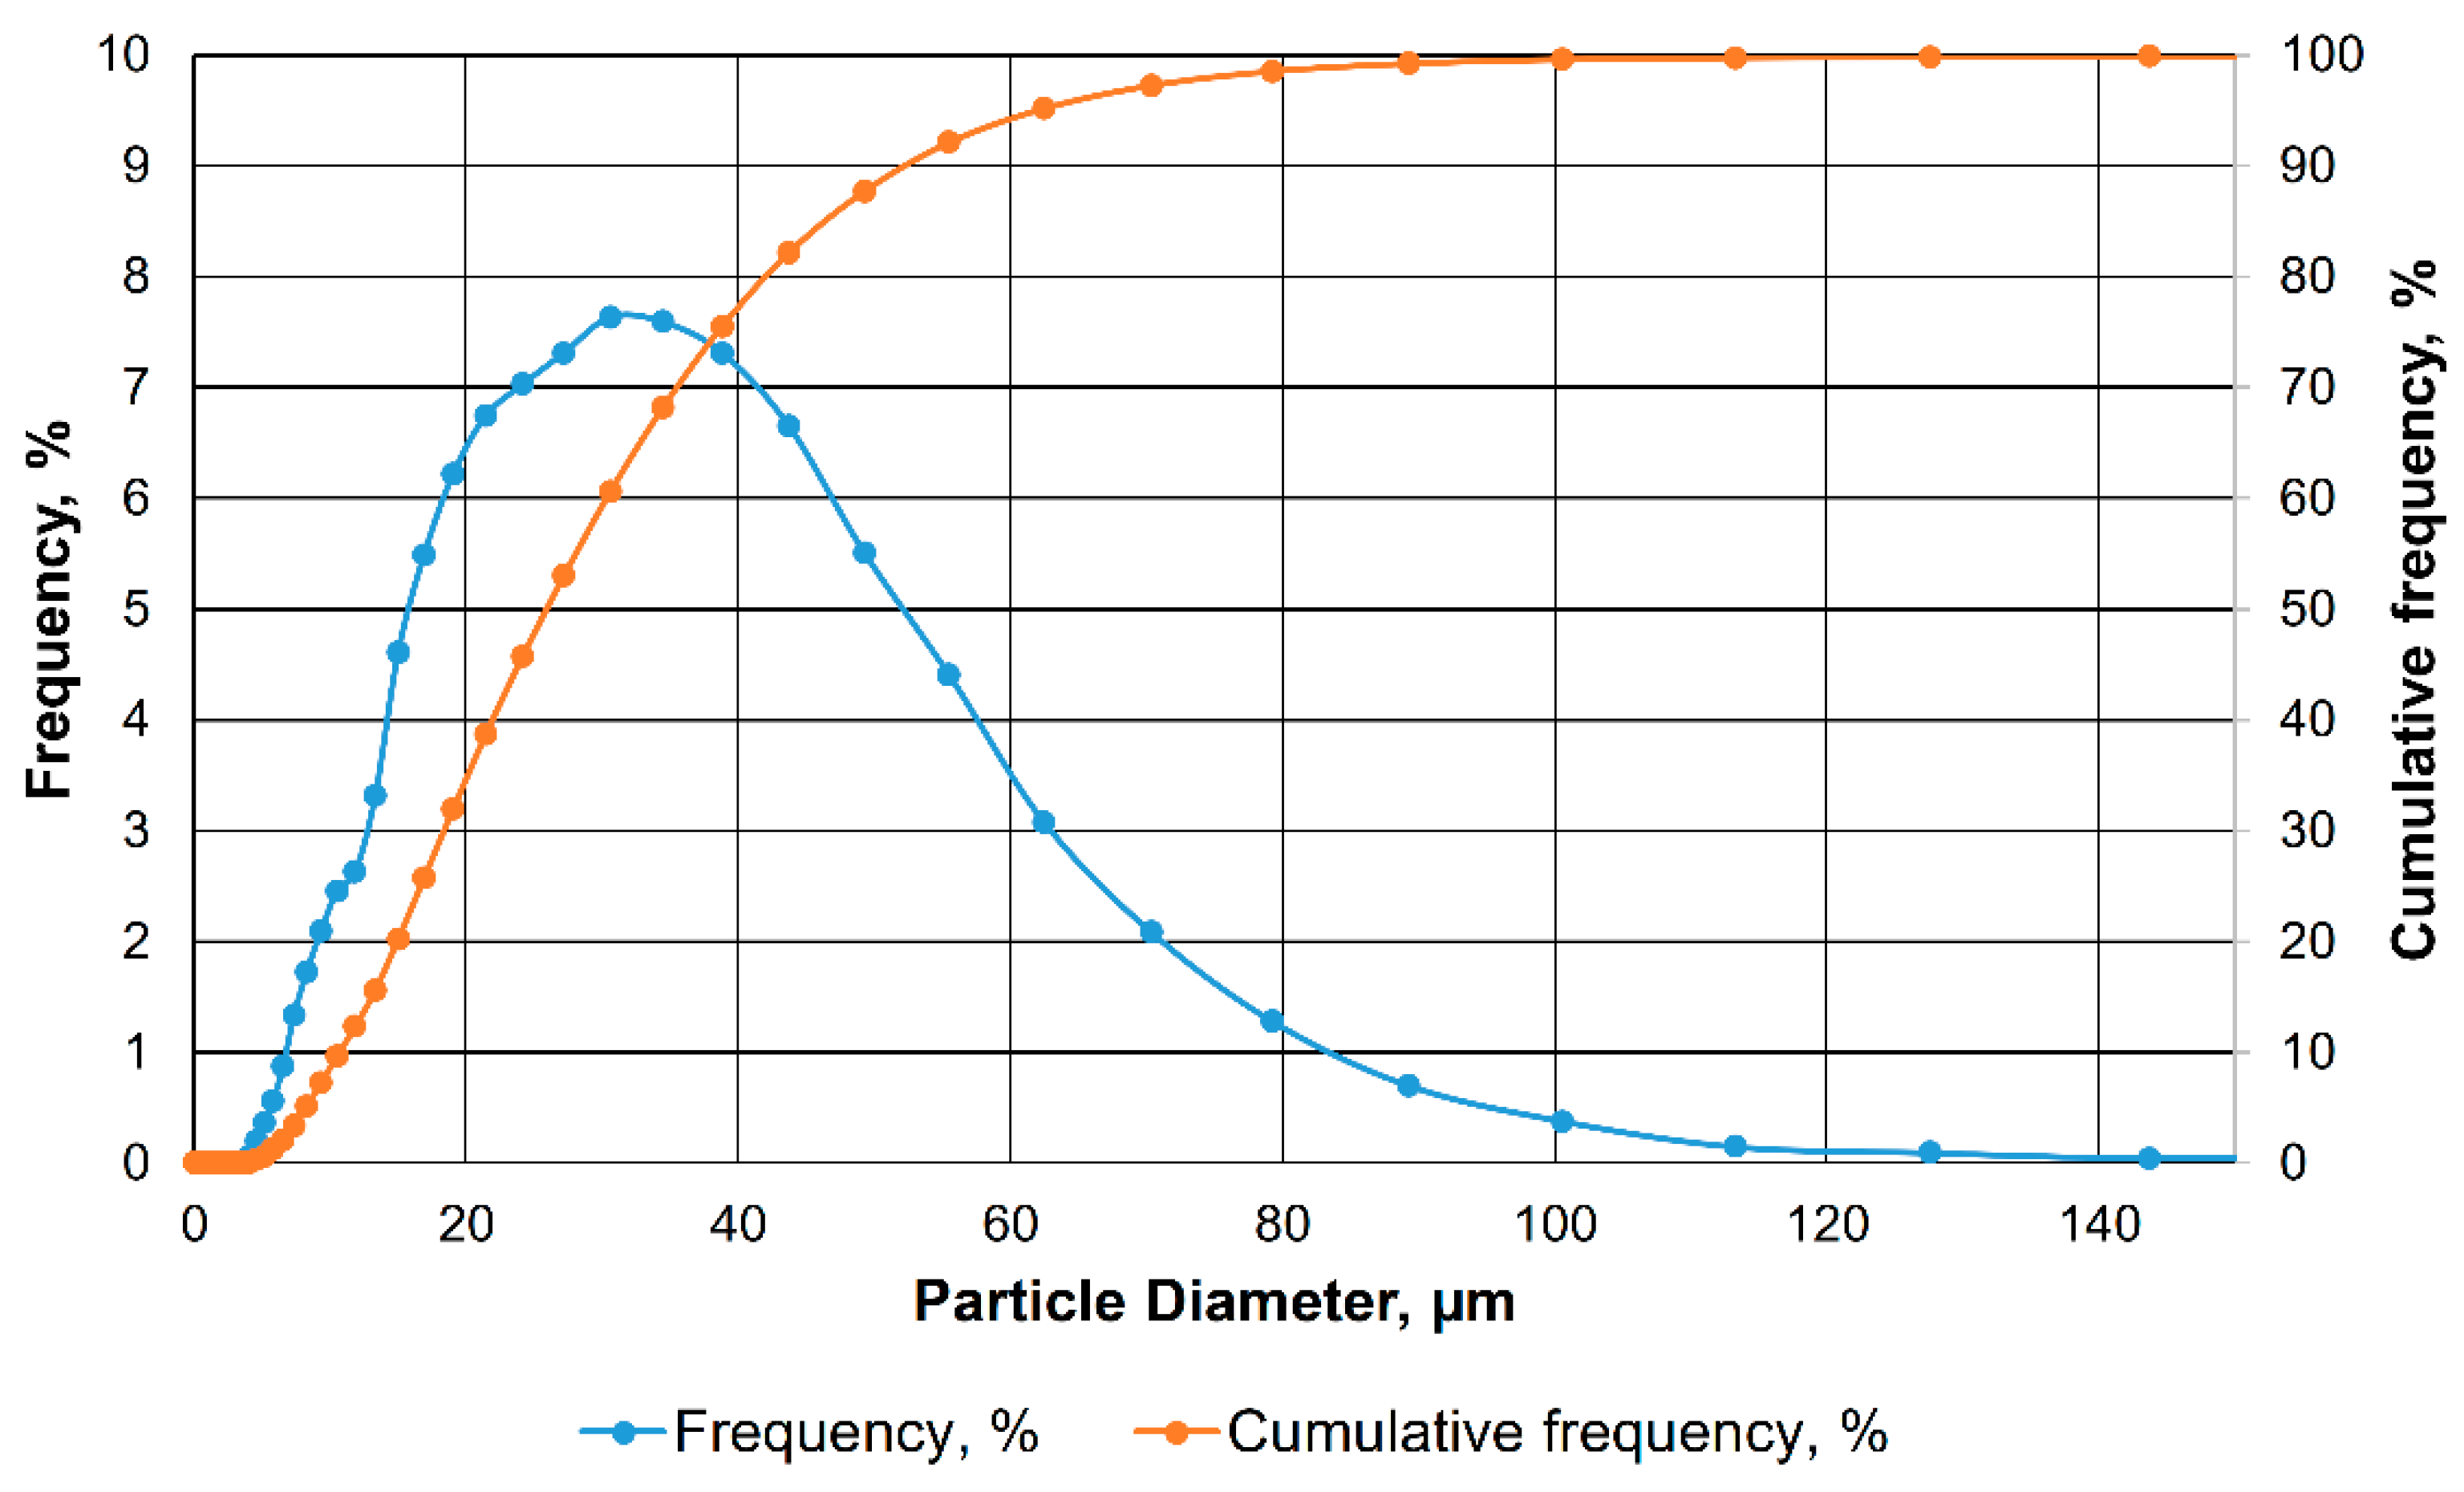
Figure 13.
SEM images: (a) Gas black; (b) Hydrophobic nanosilica; (c) Gas black particle size distribution bar charts (after interaction with surfactants); (d) Hydrophobic nanosilica particle size distribution bar charts (after interaction with surfactants).
Figure 13.
SEM images: (a) Gas black; (b) Hydrophobic nanosilica; (c) Gas black particle size distribution bar charts (after interaction with surfactants); (d) Hydrophobic nanosilica particle size distribution bar charts (after interaction with surfactants).
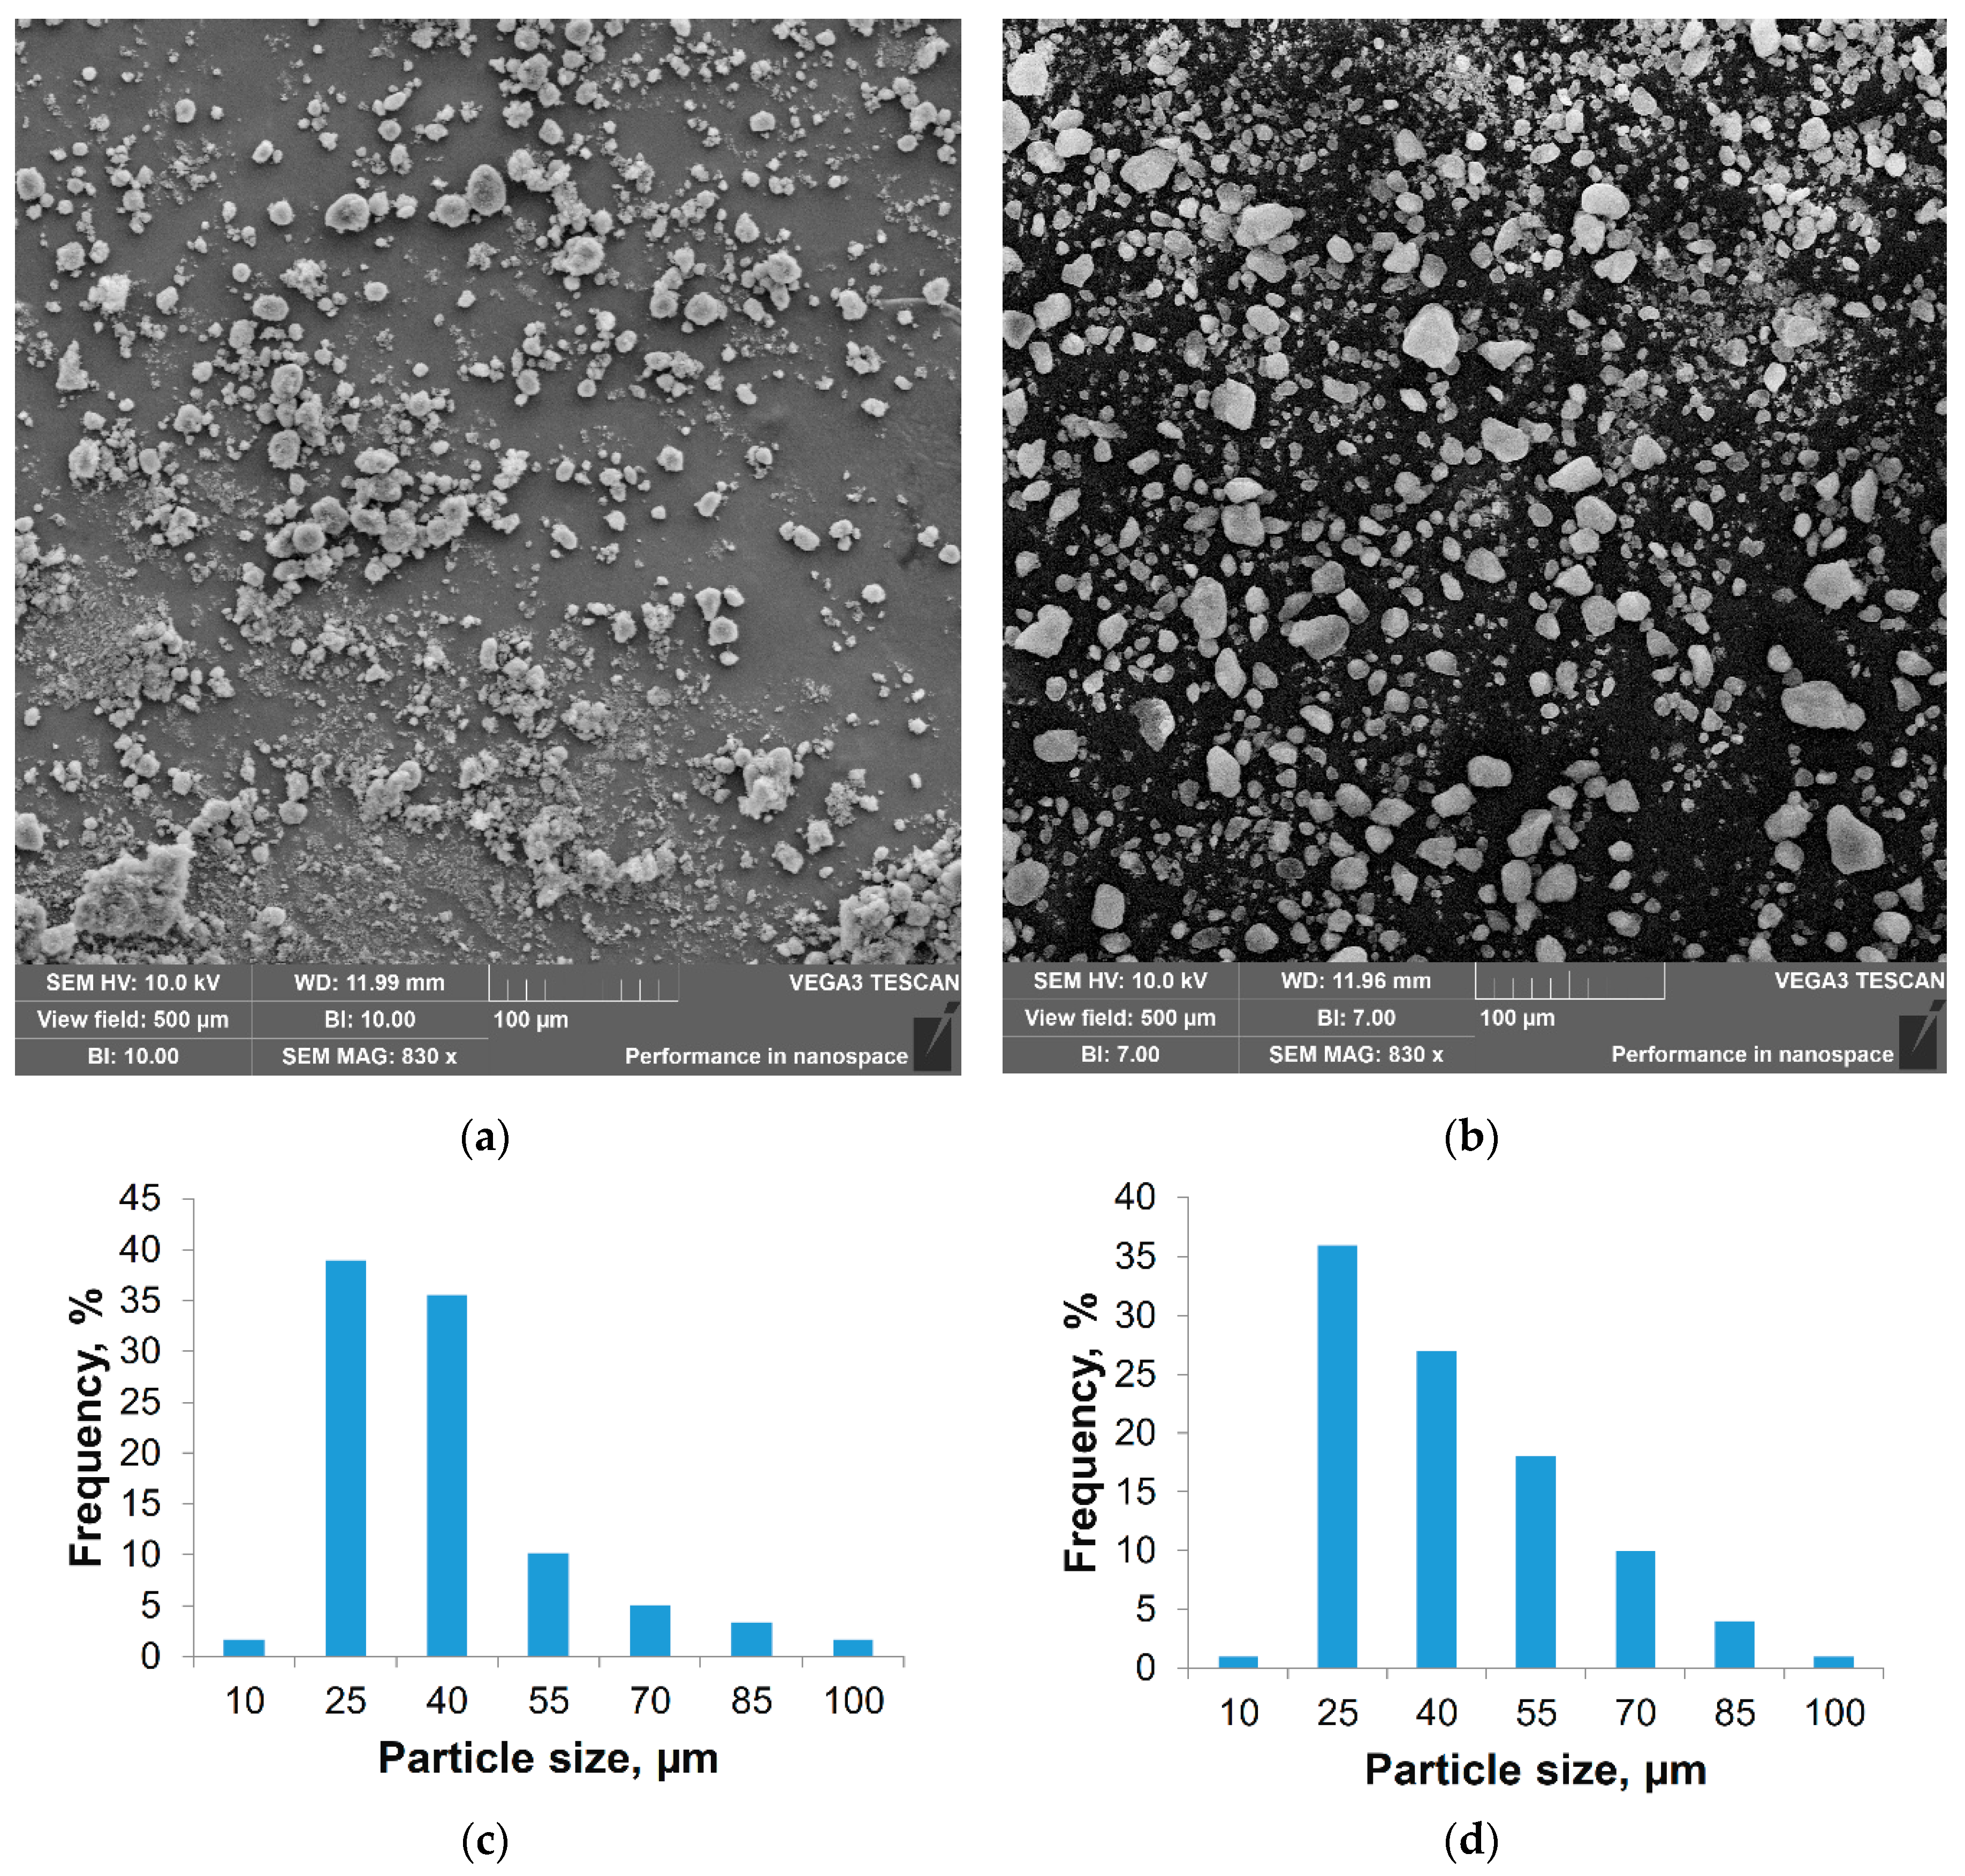
Figure 14.
Pore size distribution of the porous medium.
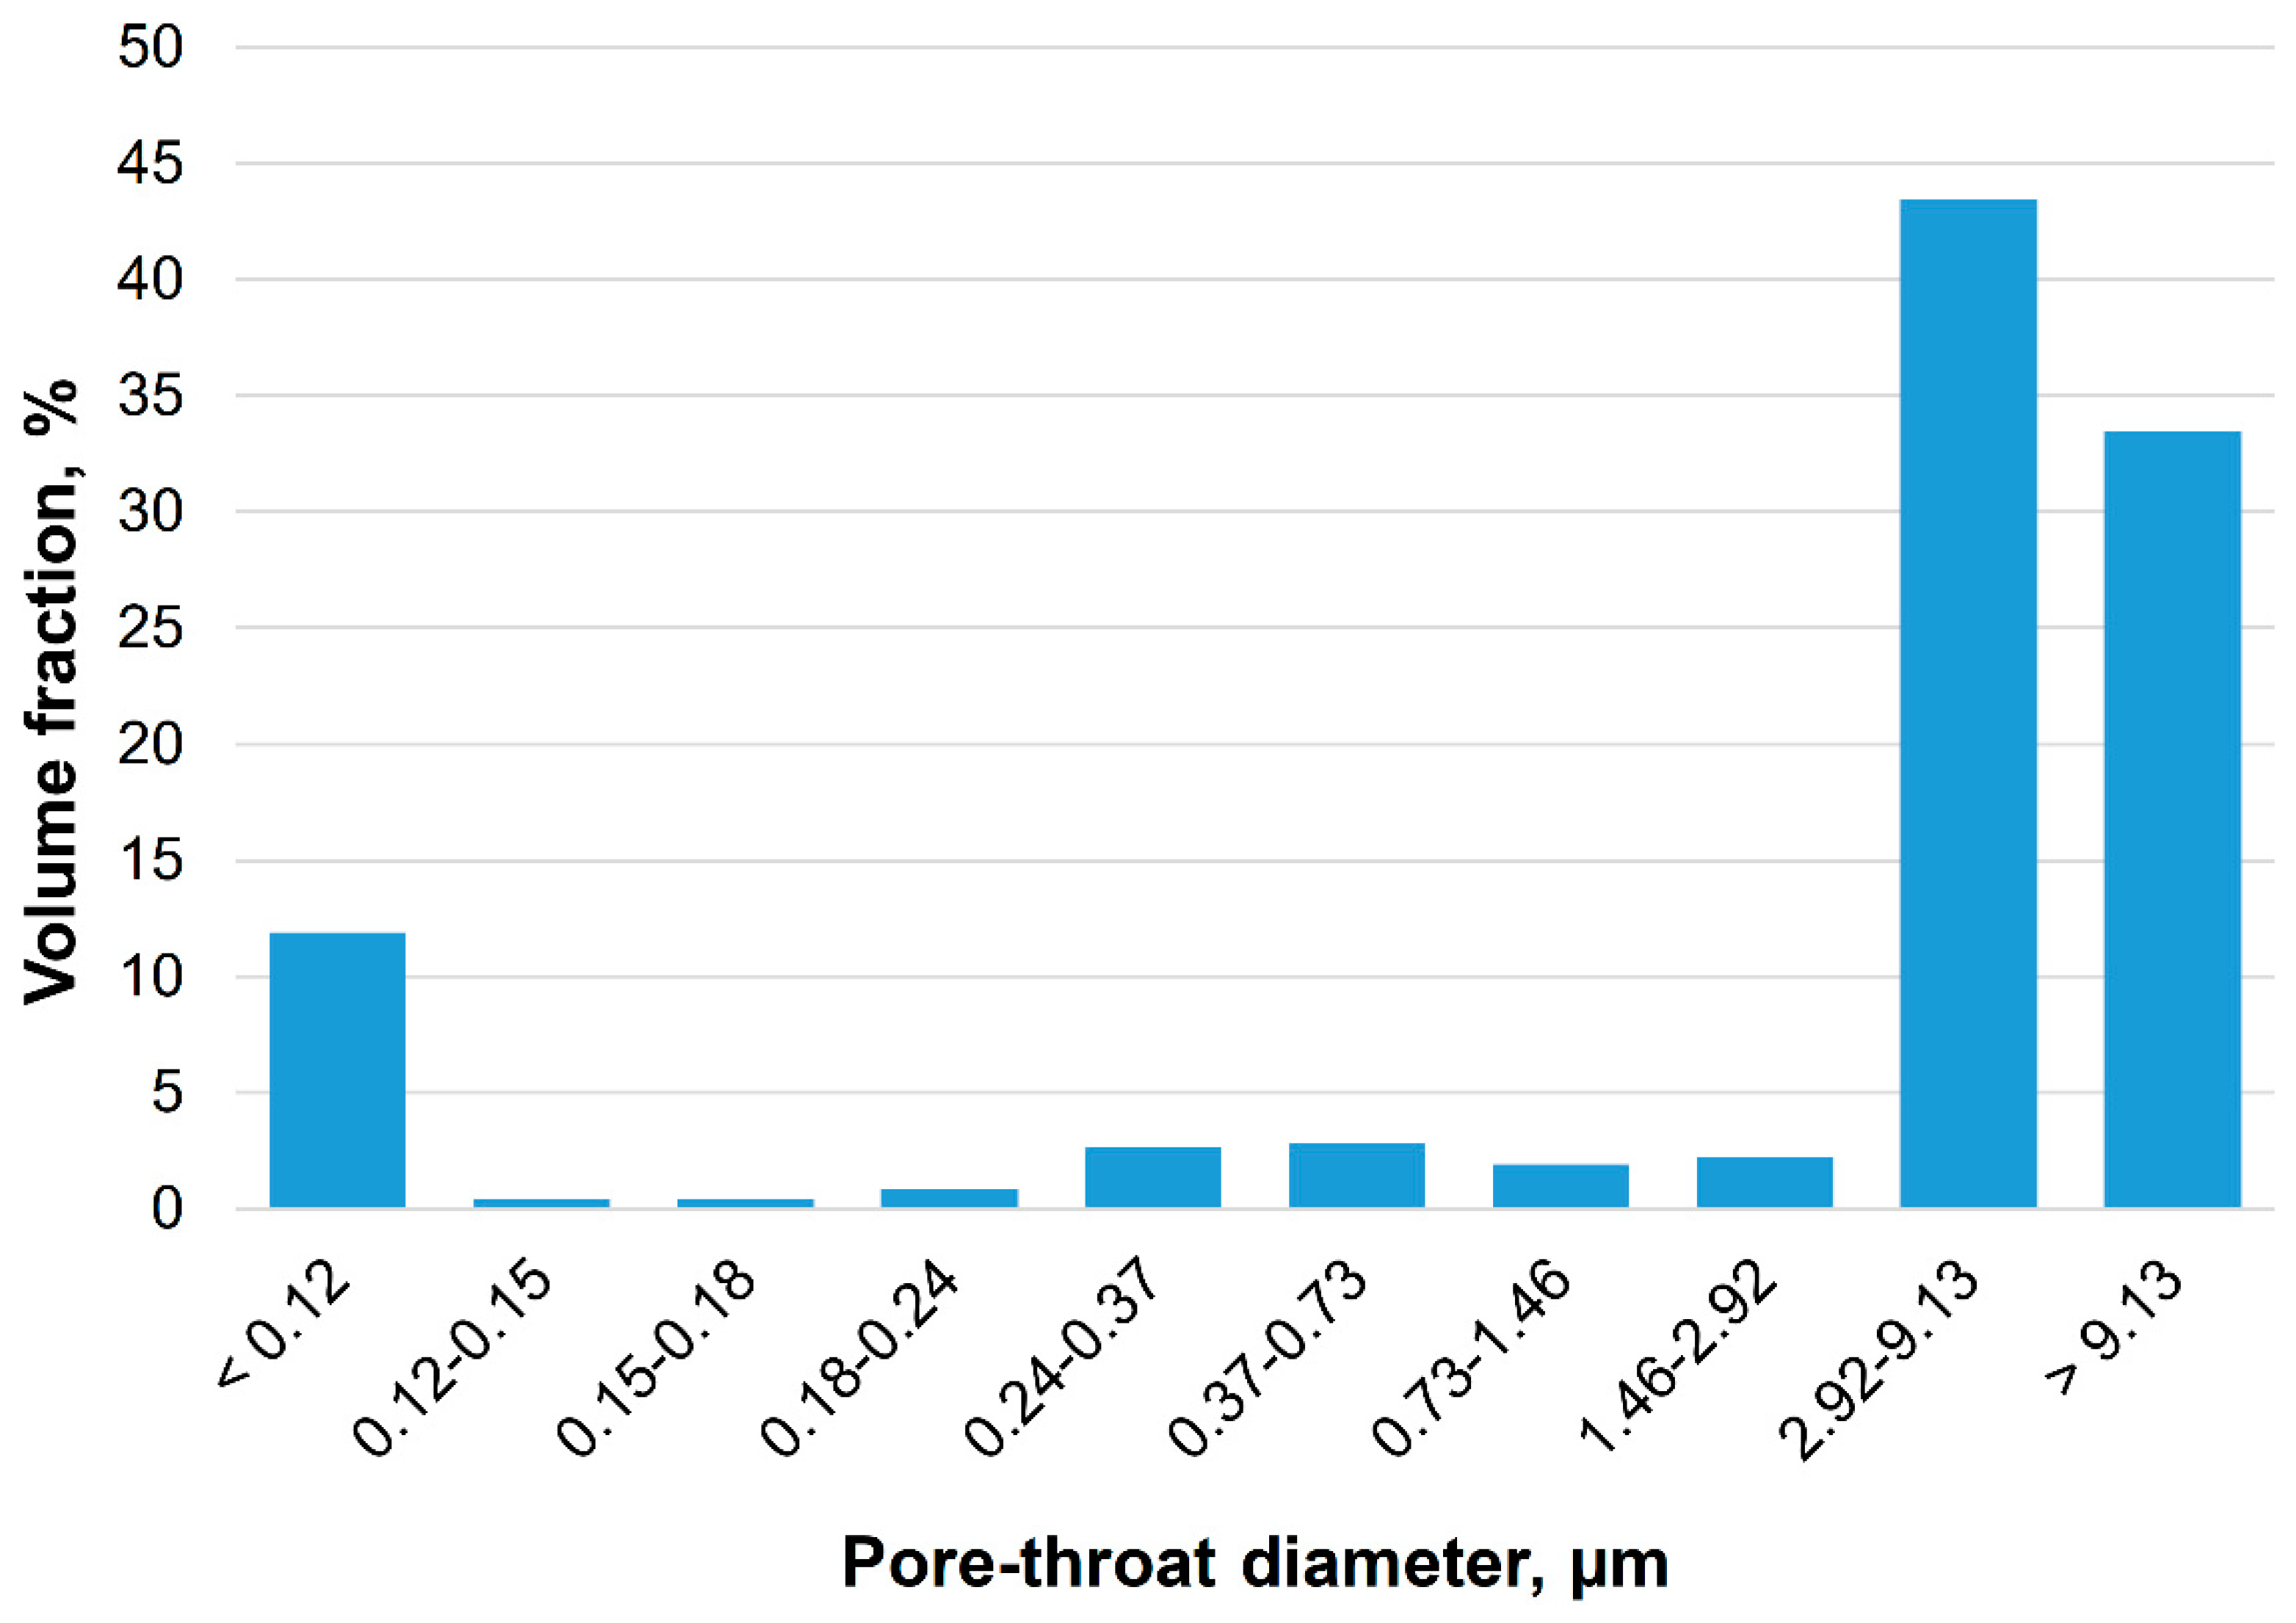
Figure 15.
UV spectra of nanoparticle suspensions and disaggregated core before and after modi-fication with the surfactant composition: (a) Aqueous solution of the surfactant composition (a suspension is being analyzed; the analysis is qualitative, concentration was not determined); (b) White black carbon suspensions; (c) RX-380 suspensions; (d) Disaggregated core suspensions.
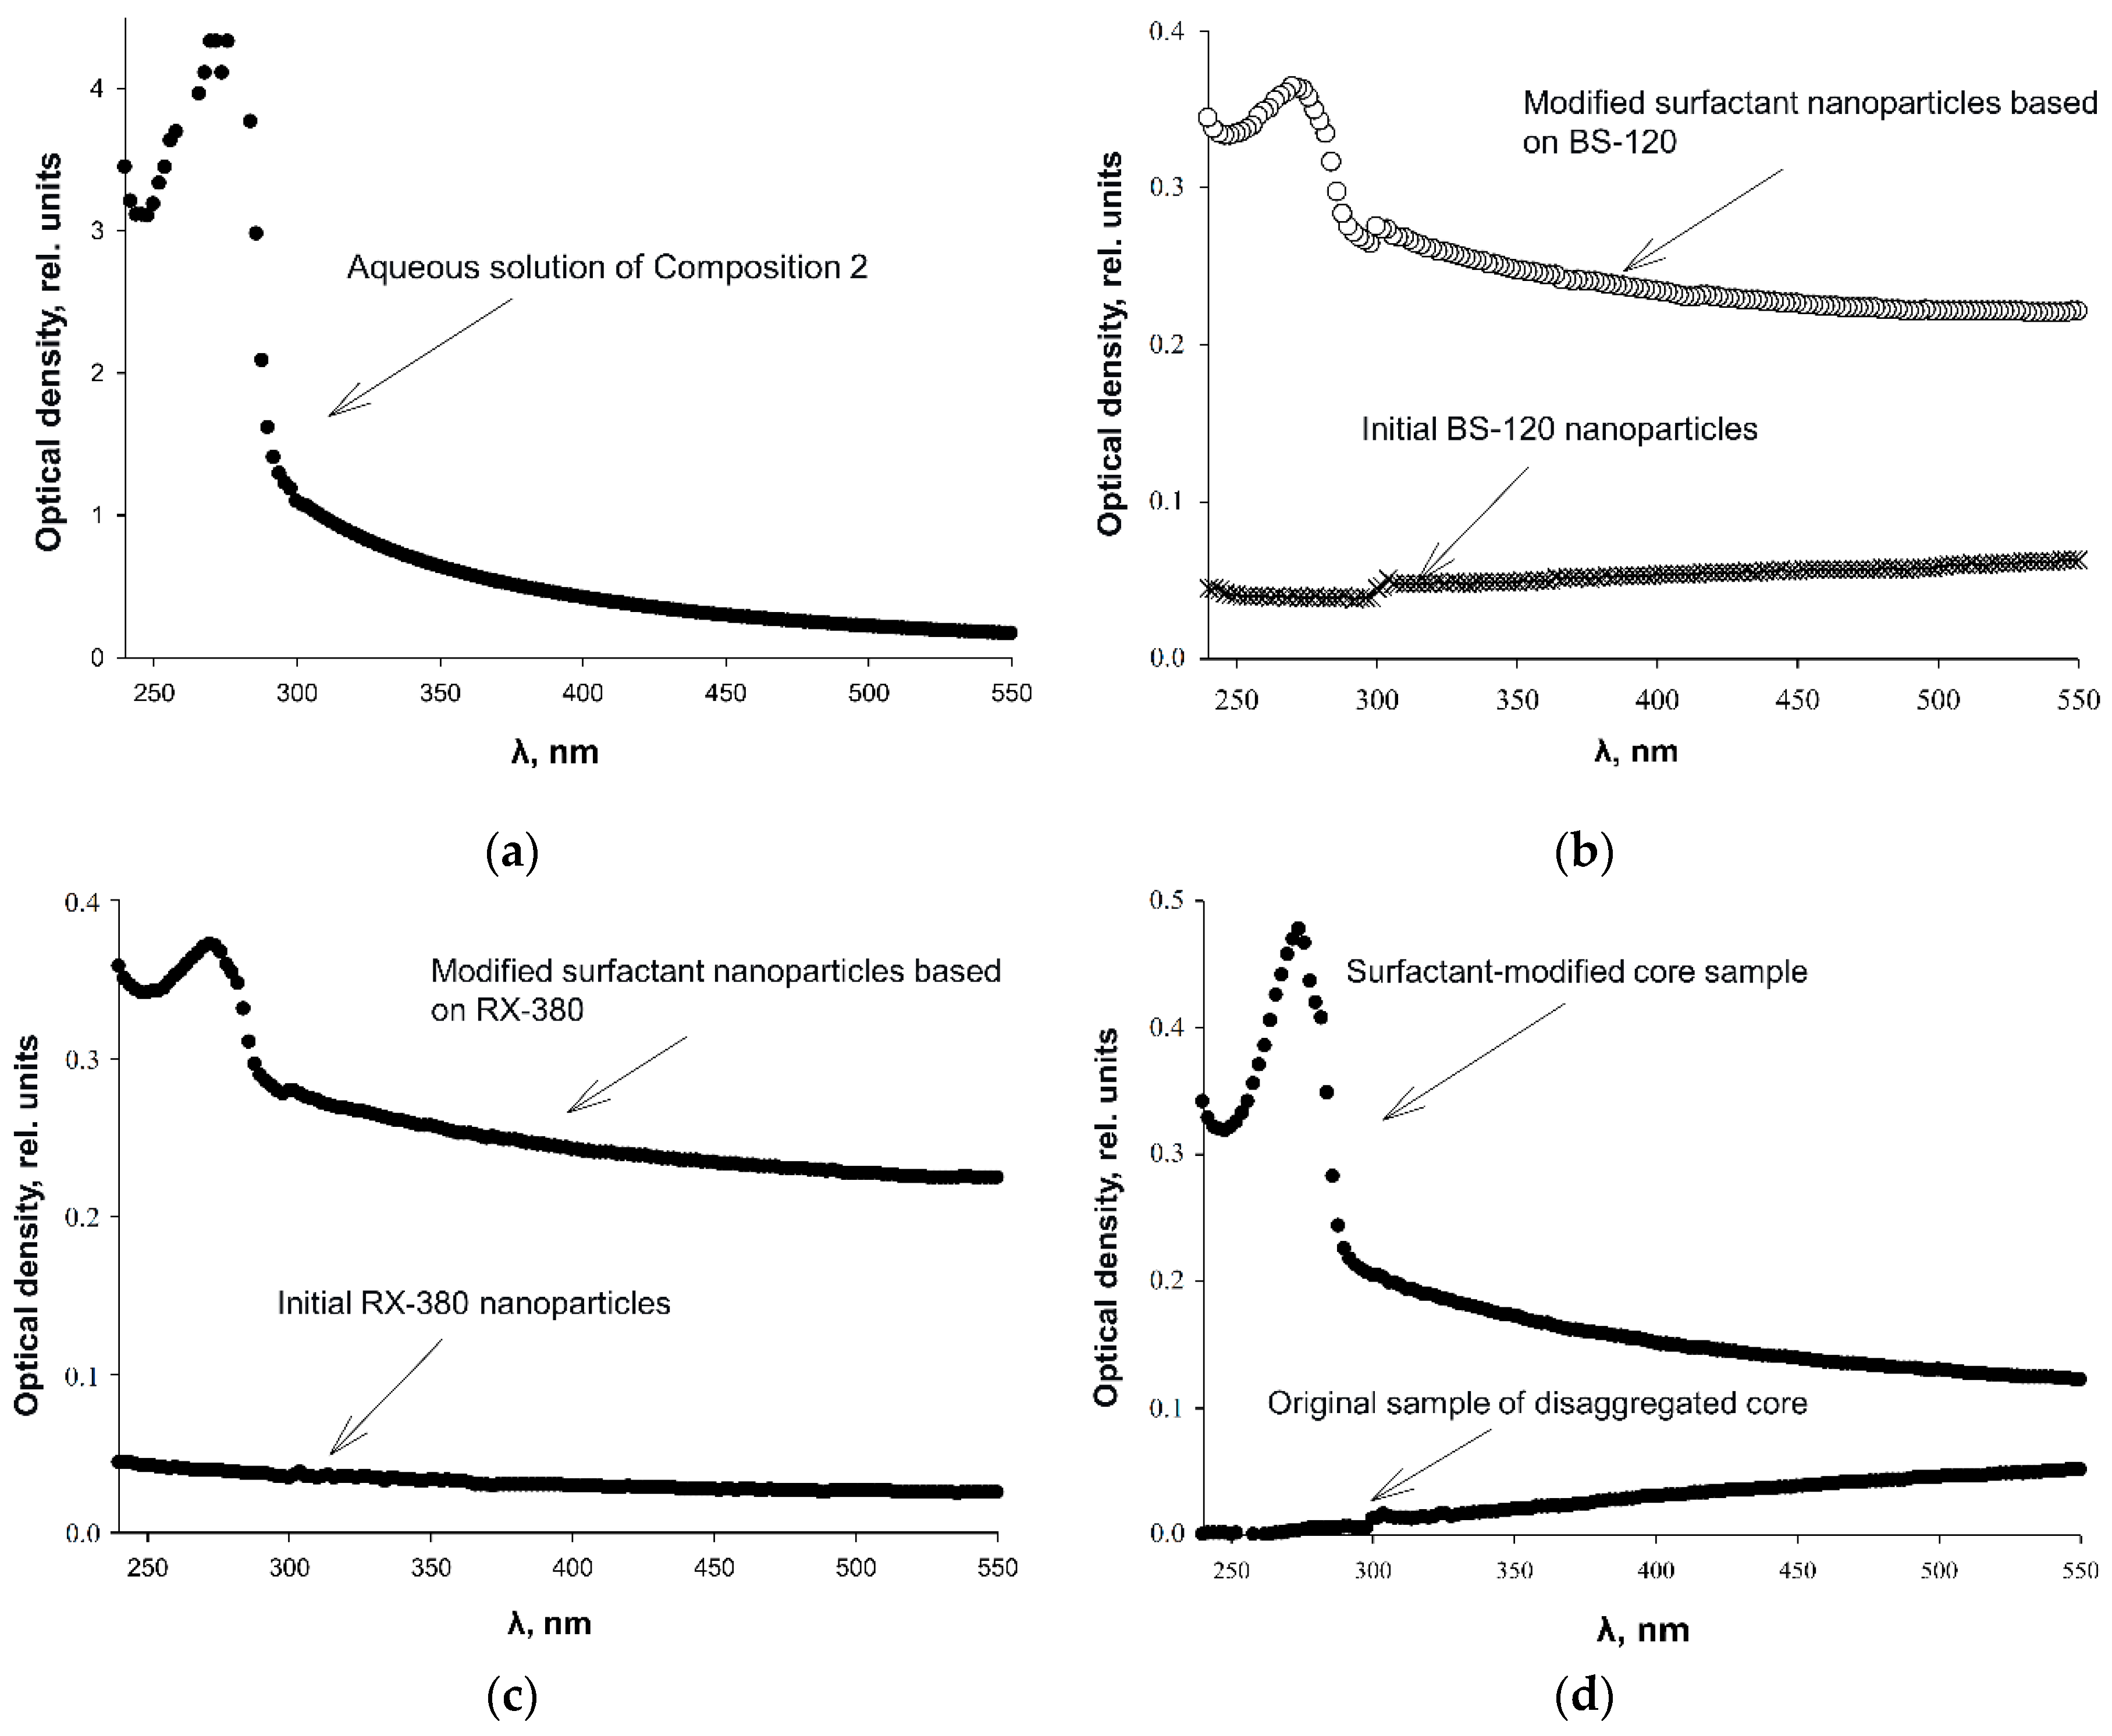

Table 1.
Characteristics of the nanosilicas used.
| Nanoadditive | Specific surface, m2/g | Calculated mean diameter, nm |
| White carbon black BS-120 NU |
132 | 20.7 |
| Hydrophilic nanosilica HCSIL200 | 202 | 13.5 |
| Hydrophobic nanosilica RX380 | 380 | 7.2 |
Table 2.
Technical specifications of the SMP FES-2R unit.
| No | Parameter | Value |
| 1 | Core model length | 100–300 mm |
| 2 | Core temperature regulation range | (+25)–(+150) °C |
| 3 | Maximum overburden pressure | 70 MPa |
| 4 | Maximum reservoir pressure | 55 MPa |
Table 3.
Results of experiments on post-waterflood oil displacement by surfactant-nanoparticle compositions.
Table 3.
Results of experiments on post-waterflood oil displacement by surfactant-nanoparticle compositions.
| Exp. No. | Displacing agent (Post-waterflood) | Permeability, 10⁻³ μm² |
Displacement coefficient |
Increase in displacement coefficient, % | ||
| Absolute gas permeability | Oil phase permeability | Base | Post-composition injection | |||
| 1 | Anionic + Nonionic surfactant composition, 1% in fresh water (Baseline experiment) | 258.9 | 105.9 | 0.763 | 0.882 | 11.9 |
| 2 | Anionic + Nonionic surfactant composition + 1% Hydrophilic nanosilica HSIL-200 | 201.9 | 70.2 | 0.607 | 0.750 | 14.3 |
| 3 | Anionic + Nonionic surfactant composition + 1% Hydrophobic nanosilica RX-380 | 262.3 | 117.6 | 0.633 | 0.864 | 23.1 |
| 4 | Anionic + Nonionic surfactant composition + 1% Uncompacted white carbon black | 199.5 | 62.1 | 0.647 | 0.837 | 19.0 |
| 5 | Anionic + Nonionic surfactant composition + 1% Graphene | 249.8 | 92.3 | 0.612 | 0.819 | 20.7 |
| 6 | Anionic + Nonionic surfactant composition + 1% Shungite (elutriated) | 200.3 | 67.3 | 0.626 | 0.858 | 23.2 |
| 7 | Anionic + Nonionic surfactant composition + 1% Gas black | 253.4 | 96.2 | 0.613 | 0.824 | 21.1 |
| 8 | 1% Anionic surfactant + 1% Graphene | 251.9 | 94.2 | 0.730 | 0.901 | 17.1 |
| 9 | 1% Anionic surfactant + 1% Uncompacted white carbon black | 250.8 | 93.1 | 0.622 | 0.741 | 11.9 |
| 10 | 1% Nonionic Surfactant + 1% Graphene | 252.2 | 95.6 | 0.651 | 0.745 | 9.4 |
| 11 | 1% Uncompacted white carbon black in fresh water | 239.1 | 82.7 | 0.599 | 0.599 | 0.0 |
Disclaimer/Publisher’s Note: The statements, opinions and data contained in all publications are solely those of the individual author(s) and contributor(s) and not of MDPI and/or the editor(s). MDPI and/or the editor(s) disclaim responsibility for any injury to people or property resulting from any ideas, methods, instructions or products referred to in the content. |
© 2026 by the authors. Licensee MDPI, Basel, Switzerland. This article is an open access article distributed under the terms and conditions of the Creative Commons Attribution (CC BY) license (http://creativecommons.org/licenses/by/4.0/).
Copyright: This open access article is published under a Creative Commons CC BY 4.0 license, which permit the free download, distribution, and reuse, provided that the author and preprint are cited in any reuse.


