
Submitted:
20 January 2026
Posted:
20 January 2026
You are already at the latest version
Abstract
Existing methods for power load anomaly detection suffer from several limitations, including insufficient extraction of multi-scale temporal features, difficulty in capturing long-range dependencies, and inefficient fusion of heterogeneous spatiotemporal information. To address these issues, this study proposes the TGCformer, an enhanced Transformer-based model designed for dynamic spatiotemporal feature fusion. First, a dual-path spatiotemporal feature extraction module is constructed. The temporal path utilizes TSFresh to enhance the explicit pattern representation of the load sequences, while the spatial path employs an improved GATv2 to model dynamic correlations among grid nodes. Together, these two paths provide more interpretable and structured inputs for the Transformer encoder. Subsequently, a multi-head cross-attention mechanism is designed, where temporal features serve as the Query and graph embeddings as the Key and Value, to guide the feature fusion process. This design ensures the effective integration of complementary information while suppressing noise. Experimental results on the public Irish dataset demonstrate the effectiveness of the proposed model. Specifically, TGCformer achieves average F1-score improvements of 0.35 and 0.53 compared with InceptionTime and XceptionTime, respectively.
Keywords:
transformer
; spatiotemporal features
; TSFresh
; graph neural network
; cross-attention
; dynamic feature fusion
1. Introduction
With the continuous growth in electricity demand, the issue of Non-Technical Losses (NTL) caused by abnormal electricity consumption behavior has become increasingly prominent, threatening the secure operation of distribution networks and causing significant economic losses [1,2]. As a crucial technique for identifying such anomalies and ensuring the stable operation of power grids, power load anomaly detection has attracted increasing research attention in recent years. Existing approaches can be broadly categorized into three groups: traditional methods, machine learning methods, and deep learning methods.
Traditional anomaly detection methods primarily include strategies based on statistical analysis, signal processing, density estimation, and clustering. While statistical and signal processing methods offer fundamental modeling of load data, they are often inadequate for handling non-stationary, high-dimensional, and highly nonlinear sequences [3]. Density-based and clustering methods can identify potential anomalies in an unsupervised manner; however, they are inherently limited in explicitly modeling long-term temporal dynamics and complex sequential dependencies [4,5,6]. Although hybrid forecasting-based methods and residual analysis techniques have improved detection accuracy to some extent [7], traditional approaches overall struggle to capture the complex temporal dependencies and spatial correlations inherent in power load data, limiting their performance in practical applications.
Machine learning methods enhance the modeling of complex features and improve generalization through supervised or semi-supervised mechanisms. Support Vector Machines (SVM) have demonstrated good performance in handling nonlinear features and imbalanced datasets [8,9]. Ensemble learning algorithms, such as Random Forest (RF), Extreme Gradient Boosting (XGBoost), and Gradient Boosting Machines (GBM), significantly boost detection robustness and accuracy through multi-model fusion [10,11,12]. However, these methods typically depend on manually engineered features, making it difficult to fully exploit the dynamic temporal patterns and latent spatial dependencies within load data.
Deep learning methods offer substantial advantages in time series modeling and high-dimensional feature representation. Architectures like Recurrent Neural Networks (RNN), Long Short-Term Memory (LSTM), Gated Recurrent Units (GRU), and Convolutional Neural Networks (CNN) can effectively capture nonlinear relationships and long-term dependencies [13,14]. Recently, the Transformer architecture, with its self-attention mechanism, has shown exceptional performance in long-sequence modeling and has been widely applied to power load forecasting and anomaly detection [15]. Studies indicate that combining Transformer with techniques like clustering, residual analysis, or Generative Adversarial Networks (GAN) can significantly enhance detection performance [16]. Furthermore, improved Transformer variants designed for multivariate and multi-scale time series exhibit greater stability and generalization in complex scenarios [17]. Nevertheless, most existing methods focus predominantly on temporal modeling, paying insufficient attention to the potential spatial-topological features within power systems and to mechanisms for effectively fusing multi-modal features.
To address the aforementioned limitations, this paper proposes an anomaly detection framework named TGCformer, based on the dynamic fusion of multi-scale temporal features and graph-level features. The framework aims to achieve joint spatiotemporal modeling and multi-source feature fusion for power load data, thereby improving detection accuracy and model interpretability. The main contributions of this paper are as follows:
(1) Multi-scale Temporal Feature Extraction: We employ the TSFresh automatic feature extraction method to mine statistical, time-domain, and frequency-domain features from load sequences, constructing a rich multi-scale temporal representation.
(2) Graph-level Embedding Feature Extraction: We utilize an improved GATv2 network to model sparse spatial correlations among grid nodes. By enhancing interactions between key nodes via a self-attention mechanism, the method achieves unified modeling of local topology and global dependencies, improving the expressiveness and robustness of graph-level features.
(3) Cross-attention-based Dynamic Feature Fusion Mechanism: We design a cross-attention interaction module to enable deep coupling and dynamic weighting between multi-scale temporal features and graph-level features. This allows the model to adaptively focus on critical feature channels while suppressing redundancy from irrelevant information, significantly enhancing the accuracy and stability of anomaly detection.
In summary, this paper achieves spatiotemporal feature fusion and information interaction for power load data through the collaborative modeling of TSFresh and a Sparse GATv2 network, coupled with a cross-attention mechanism. The proposed framework provides an efficient, scalable, and interpretable solution for anomaly detection in complex power systems.
2. TGCformer
2.1. Overall Framework
To address the issues of insufficient representation of multi-scale temporal patterns and difficulty in effectively modeling dynamic spatial correlations in power load data, this paper proposes the spatiotemporal fusion anomaly detection framework TGCformer. This method improves anomaly detection performance by achieving joint spatiotemporal modeling of multi-scale time statistical features and dynamic graph-level features. The overall structure is shown in Figure 1 and mainly includes four modules: temporal statistical feature extraction, sparse graph feature encoding, spatiotemporal feature cross-fusion, and classification decision-making. The method primarily consists of three parts:
Firstly, Multi-scale Temporal Feature Modeling: Unlike traditional Transformers that rely solely on implicit positional encoding, TGCformer explicitly constructs spatiotemporal structural features to directly model temporal evolution and spatial topological relationships.
Secondly, Dynamic Spatial Feature Modeling: Constructs a sparse adjacency graph based on KNN, introduces GATv2 to adaptively encode spatial dependencies between nodes, explicitly preserving the spatial topological relationships between load nodes.
Thirdly, Spatiotemporal Feature Dynamic Fusion: Designs a cross-attention fusion mechanism, using temporal features as Query and spatial features as Key and Value, to achieve heterogeneous information interaction and complementary fusion while suppressing redundant information. The Transformer encoder refines deep semantics, and the final fully connected layer outputs the anomaly detection result.
2.2. Spatiotemporal Structural Feature Extraction and Encoding
2.2.1. Multi-Scale Time Series Statistical Feature Extraction
In the temporal dimension, TGCformer utilizes the TSFresh library [18] to automatically extract time-domain, spectral-domain, and frequency-domain features, enabling explicit characterization of the sequential and evolutionary patterns of time series. Some features are shown in Figure 2. Typical features include:
absolute_sum_of_changes (sum of absolute values of first-order differences), used to reflect sequence volatility:
fft_coefficient (average coefficient of Fourier transform), used to capture the periodicity and frequency characteristics of time series:
C_3 (nonlinear measure based on physics for time series data), used to characterize the self-similarity and higher-order statistical information of time series:
As shown in Module1 of Figure 1, after TSFresh extracts multi-scale features, feature selection is required. Univariate linear regression F-test [19] is used to screen significant features:
Subsequently, the Benjamini-Yekutieli (BY) procedure [20] is applied to control the false discovery rate:
where is the total number of features, and is the original -value sorted in ascending order. If the corrected , the feature is considered significant and retained.
2.2.2. Graph-Level Embedding Feature Extraction Method Based on Sparse GATv2
In the spatial dimension, to characterize the dynamic dependencies of sequences, a dynamic graph feature extraction module based on sparse GATv2 is designed (Module2 in Figure 1). First, a sparse adjacency graph is constructed via KNN to retain key temporal dependencies. Then, GATv2 is used to perform adaptive weighting and dynamic aggregation of node features, enhancing information interaction between nodes. Finally, graph-level embedding vectors are generated through average pooling, achieving efficient representation of the global topology and dynamic structure of sequences.
- 1)
- Sparse Neighbor Graph Construction
Treat the time series as graph-structured data, with each time point corresponding to a node. To reduce the computational complexity of a fully connected graph, KNN is used to construct a sparse adjacency matrix: for time point , the temporally closest points are selected as neighbor nodes, forming the sparse graph . The initial features of each node consist of three parts: (1) the original value ; (2) the mean and standard deviation under different window scales; (3) sine-cosine positional encoding :
- 2)
- Dynamic Graph Attention Modeling
GATv2 [21] incorporates a nonlinear mapping before computing attention weights, allowing attention scores to adjust dynamically based on node features, thereby better capturing nonlinear dependencies.
For node at layer , its feature and the feature of neighbor node are linearly transformed and concatenated, then input into a function, followed by a nonlinear mapping to obtain the attention score (as shown in Figure 3):
where is a learnable attention vector, is a learnable weight matrix, and denotes vector concatenation. The attention score reflects the importance of neighbor node to node .
The function is used for normalization within the neighbor set to compute attention weights:
where denotes the set of neighbors for node . GATv2 employs a multi-head attention mechanism to enhance feature representation capability:
where is the activation function, and denotes the feature projection matrix for the -th attention head. The multi-head mechanism yields richer and more robust node feature representations. Residual connections and layer normalization are applied after each GATv2 layer to improve training stability and convergence. After multiple stacked layers, the final node graph embedding representation is obtained.
- 3)
- Graph-level Feature Aggregation
To obtain global dynamic graph features for the entire time series, an average pooling operation is introduced after the sparse GATv2 layers, aggregating the embedding features of all nodes into a graph-level representation vector:
where L denotes the number of GATv2 layers. The resulting graph-level feature vector comprehensively characterizes the dynamic dependency structure of the load sequence, providing a dynamic graph semantic representation foundation for subsequent cross-attention fusion.
2.3. Spatiotemporal Feature Fusion and Encoding Based on Multi-Head Cross-Attention
In power load anomaly detection, time series features and spatial topological features are heterogeneous, exhibiting significant differences in semantic expression and statistical distribution. While the self-attention mechanism of the standard Transformer can effectively capture global dependencies within time series, its cross-modal information interaction capability is limited. It can only model dependencies within a single modality, making it difficult to explicitly model the relationship between the temporal and spatial domains, leading to insufficient spatiotemporal information fusion. To address this, this paper proposes the introduction of a cross-attention mechanism [22,23] based on the standard Transformer framework, aiming to achieve deep interactive fusion of multi-scale temporal features and graph embedding features (as shown in Module3 of Figure 1).
Specifically, TGCformer takes the multi-scale time series features extracted by TSFresh and the graph embedding features generated by the sparse GATv2 network as dual-channel inputs. The cross-attention mechanism enables explicit relational modeling between these heterogeneous features. As shown in Figure 4, serves as the Query vector, and serves as the Key and Value vectors, obtained via linear projection:
Cross-attention generates fused features by computing the similarity between Query and Key and performing a weighted sum over Value:
Compared to self-attention, which focuses only on dependencies within the same source, cross-attention achieves directed interaction between features from the temporal and spatial domains. It can adaptively aggregate graph structure information most relevant to the temporal features, achieving cross-modal feature alignment. Furthermore, to enhance multi-semantic relational modeling capability for spatiotemporal features, a Multi-Head Cross-Attention (MHCA) mechanism is introduced to learn complementary relationships in parallel across different subspaces:
where is a learnable linear projection matrix. The multi-head mechanism learns in parallel across different feature subspaces, thereby capturing complementary semantic relationships between temporal and graph structural features, significantly enhancing spatiotemporal dependency modeling capability and feature expression richness.
To improve deep encoding stability, TGCformer retains the Transformer's residual connection and layer normalization structure, ensuring stable gradient propagation and enhancing feature representation efficiency. The inter-layer computation is as follows:
The Feed-Forward Network (FFN) adopts a standard two-layer linear transformation structure with GELU activation and Dropout to prevent overfitting:
where ,, and to enhance nonlinear representation capability.
The fused feature vector obtained after stacking multiple cross-attention layers is input into a Multilayer Perceptron (MLP) for anomaly detection (as shown in Module4 of Figure 1). The designed MLP has four hidden layers, each containing linear projection, batch normalization, GELU activation function, and Dropout to enhance nonlinear representation capability and reduce overfitting risk[24]. The forward pass can be represented as:
where is the cumulative distribution function of the standard normal distribution, and is the error function.
The output layer maps the last hidden layer features to a single neuron and generates the probability of a sample belonging to the anomalous class via the Sigmoid activation function:
During training, the network uses Focal Loss to optimize the anomaly detection task:
where and are tuning factors to mitigate training bias caused by class imbalance.
3. Experiments and Validation
3.1. Data Description
This paper uses the actual electricity consumption data from the Irish Electricity Research Center (Irish CER Smart Meter Dataset) [25] as experimental samples. The dataset contains smart meter records from 5,633 residential and commercial users, with a sampling interval of 1 hour, totaling 12,002 time series samples. Since the dataset originates from normal users who gave informed consent to participate in the study,it is therefore assumed that the original data represents normal electricity consumption behavior. To construct anomaly samples, this paper refers to literature [26,27,28] and combines typical patterns of Advanced Metering Infrastructure (AMI) attacks[29], designing six electricity theft methods from perspectives such as reducing consumption, setting to zero, and random perturbation, corresponding to different types of non-technical theft scenarios. Subsequently, anomaly samples are mixed into the original data according to proportions to construct three types of anomalous datasets with anomaly ratios of 5%, 10%, and 15%, used for multi-scenario model evaluation and robustness verification. Figure 5 shows the hourly electricity distribution for normal samples and under the six fraud methods. It can be observed that the overall distribution of normal samples is relatively broad, with the median and extreme values significantly higher than those of fraudulent samples. The distributions of various anomaly samples show downward shifts and contraction trends, with varying degrees of contraction across different theft methods. This indicates that the designed anomaly samples are significantly different in statistical characteristics from normal loads, effectively simulating multiple types of electricity theft behavior.
3.2. Evaluation Metrics
To comprehensively evaluate model performance in the power load anomaly detection task, this paper selects Accuracy, Precision, Recall, and F1-Score as evaluation metrics. The calculation methods are as follows:
3.3. Overall Performance Evaluation of TGCformer
Comparative evaluation of TGCformer's overall performance was conducted using datasets with different anomaly ratios. The results are shown in Table 1. As the anomaly proportion increases, TGCformer exhibits high stability across all metrics. When the anomaly proportion is low (5%), the model's overall accuracy is high, but the recall rate is relatively low, indicating some missed detections under conditions of scarce anomaly samples, mainly influenced by sample imbalance. As the anomaly proportion increases to 10% and 15%, the model's Recall and F1 scores significantly improve, indicating stronger identification capability and better balanced performance when anomaly samples increase. Overall, the model maintains excellent detection effectiveness and strong robustness under different anomaly proportions.
To validate the effectiveness of TGCformer, it was compared with two traditional time series anomaly detection methods, InceptionTime [30] and XceptionTime [31]. Experimental results show that TGCformer significantly outperforms the comparison models in ACC, Precision, Recall, and F1_score across all anomaly ratios. Under low anomaly ratios (5%), traditional models show low Recall, indicating limited ability to identify minority-class anomalies, while TGCformer's Recall significantly improves, demonstrating stronger capture capability for anomaly samples in imbalanced data scenarios. As the anomaly ratio increases to 15%, TGCformer's metrics remain at high levels, showing stability and robustness, whereas traditional models exhibit larger fluctuations in F1 scores, indicating unstable performance when anomaly samples increase. Figure 6 presents bar charts comparing the performance of different models under various anomaly ratios, visually demonstrating that TGCformer outperforms comparison models across all metrics, with the advantage in identifying minority-class samples being most pronounced under low anomaly ratios.
3.4. Ablation Study
To verify the effectiveness of the model design, ablation experiments were conducted on the test set with an anomaly ratio of 10%, comparing detection performance with different feature inputs. The results are shown in Table 2. When using only multi-scale temporal features (Only-TSFresh) modeled via self-attention, the model achieves high precision but relatively low recall, indicating missed detections still exist when relying solely on temporal statistical information. When using only graph embedding features (Only-GATv2), performance is weakest, with Precision notably decreased and false alarm rate high, suggesting that utilizing only spatial dependencies cannot provide sufficient discriminative power. The complete TGCformer, which simultaneously incorporates temporal and spatial features and performs explicit fusion via cross-attention, achieves the best performance in Precision, Recall, and F1_score. This validates that dual-channel collaborative modeling and the cross-attention mechanism can effectively enhance anomaly pattern recognition capability and detection stability.
Figure 7 visualizes the cross-attention weights. The average attention distribution (left) shows the model consistently focuses on a few key topological nodes across multiple interaction layers. The 8×8 attention matrix from the final layer (right) shows some nodes receive higher weights during feature fusion. This indicates the model can adaptively identify the feature dimensions and nodes most contributing to anomaly detection, achieving efficient information integration.
As shown in Figure 8, after PCA dimensionality reduction of TSFresh features (left), normal users (blue dots) are mainly concentrated in the central region, but some points extend along horizontal and vertical directions forming a "long tail," increasing the difficulty of anomaly detection. Anomalous users (red dots) are partly distributed at the edges or far from the main cluster, and while some overlap with normal samples, there are also discrete samples. This feature distribution provides effective information for anomaly detection. Scatter plots based on high-variance features (right) further show that anomaly samples are mostly concentrated at the edges or in discrete regions, providing discriminative clues for the model.
4. Conclusions
This paper proposes TGCformer, a novel dual-channel model for dynamic spatiotemporal feature fusion, designed for power load anomaly detection. TGCformer integrates multi-scale temporal features with graph-level spatial features, aiming to fully leverage global temporal patterns and the spatial correlations among grid nodes. Experimental results demonstrate that TGCformer consistently achieves excellent performance across various anomaly ratio scenarios. The model's overall F1-score is significantly higher than those of state-of-the-art deep temporal baselines, including InceptionTime and XceptionTime, with substantial average improvements. This validates the model's robustness and superiority in identifying anomalies within imbalanced datasets. However, the study also reveals a limitation: when the model relies heavily on the cross-attention mechanism for fusion, it may underutilize discriminative features from individual channels, potentially hindering fine-grained recognition of specific anomaly types. Future work will explore methods to enhance the model's adaptive utilization of diverse features, preserving its fusion strengths while better harnessing the discriminative power of heterogeneous information.
Author Contributions
Conceptualization, L.X., S.C. and Q.W.; methodology, L.X., S.C. and Q.W.; resources, X.W. and Y.L.; writing—original draft preparation, L.X. and S.C.; writing—review and editing, Q.W. and X.W.; visualization, L.X., S.C. and Y.P.; supervision, L.X. All authors have read and agreed to the published version of the manuscript.
Funding
Supported by the Foundation Research Project of Kaili University(Grant no.2025YB005);Guangxi Science and Technology Base and Talent Special Project: Research and Application of Key Technologies for Precise Navigation (Gui Ke AD25069103);the National Natural Science Foundation of China (Grant nos. 62162012 and 62462013);the Key Project of Engineering Research Center of Micro-nano and Intelligent Manufacturing of Ministry of Education (Grant no. WZG202502);Guizhou Provincial Science and Technology Projects (QN no.〔2025〕241).
Data Availability Statement
The original contributions presented in this study are included in the article.
Conflicts of Interest
The authors declare no conflicts of interest.
References
- Carr, Darragh; Thomson, Murray. Non-technical electricity losses. Energies 2022, 15.6, 2218. [Google Scholar] [CrossRef]
- de Souza Savian, Fernando; et al. Non-technical losses: A systematic contemporary article review. Renewable and Sustainable Energy Reviews 2021, 147, 111205. [Google Scholar] [CrossRef]
- Fahmia; Khalid, ATW; Kashyzadeh, K. R.; Ghorbania, S. Enhanced Autoregressive Integrated Moving Average Model for Anomaly Detection in Power Plant Operations. International Journal of Engineering 2024, 37.8, 1691–1699. [Google Scholar] [CrossRef]
- Cheng, Min; et al. Power system abnormal pattern detection for new energy big data. International Journal of Emerging Electric Power Systems 2023, 24.1, 91–102. [Google Scholar] [CrossRef]
- Yang, J; Fei, K; Ren, F; et al. Non-technical loss detection using missing values pattern[C]. International Conference on Smart Grid and Clean Energy Technologies, Kuching, Malaysia, 2020; pp. 149–154. [Google Scholar]
- Hussain, S; Mustafa, M; Jumani, T; et al. A novel unsupervised feature-based approach for electricity theft detection using robust PCA and outlier removal clustering algorithm[J]. International Transactions on Electrical Energy Systems 2020, 30(11), 3359–3372. [Google Scholar] [CrossRef]
- Guerrero, Juan Ignacio; et al. Non-technical losses reduction by improving the inspections accuracy in a power utility. IEEE Transactions on Power Systems 2017, 33.2, 1209–1218. [Google Scholar] [CrossRef]
- Xia, Y; Liang, D; Zheng, G; et al. Helicopter main reduction planetary gear fault diagnosis method based on SVDD [J]. International Journal of Applied Electromagnetics and Mechanics 2020, 64(1-4), 137–145. [Google Scholar] [CrossRef]
- Vapnik, V; Chervonenkis, A Y. A class of algorithms for pattern recognition learning[J]. Avtomat. i Telemekh 1964, 25(6), 937–945. [Google Scholar]
- Liu, H; Shi, J; Fu, R; et al. Anomaly Detection of Residential Electricity Consumption Based on Ensemble Model of PSO-AE-XGBOOST[C]//International Conference on Neural Computing for Advanced Applications; Springer Nature Singapore: Singapore, 2024; pp. 44–58. [Google Scholar]
- Touzani, S; Granderson, J; Femandes, S. Gradient boosting machine for modeling the energy consumption of commercial buildings[J]. Energy and Buildings 2018, 158, 1533–1543. [Google Scholar] [CrossRef]
- Harshini, Ch; et al. Electricity theft detection in power grids with deep learning and random forests. International Journal of Management Research and Reviews 2023, 13.3, 1–10. [Google Scholar]
- Bian, Jiahao; et al. Abnormal detection of electricity consumption of user based on particle swarm optimization and long short term memory with the attention mechanism. IEEE Access 2021, 9, 47252–47265. [Google Scholar] [CrossRef]
- Irwansyah, Arif; et al. Power consumption predictive analytics and automatic anomaly detection based on CNN-LSTM neural networks. Jurnal Rekayasa Elektrika 2023, 19.14, 127–134. [Google Scholar] [CrossRef]
- Duan, Jing. Deep learning anomaly detection in AI-powered intelligent power distribution systems. Frontiers in Energy Research 2024, 12, 1364456. [Google Scholar] [CrossRef]
- Kang, Hyeongwon; Kang, Pilsung. Transformer-based multivariate time series anomaly detection using inter-variable attention mechanism. Knowledge-Based Systems 2024, 290, 111507. [Google Scholar] [CrossRef]
- Yi, Shuang; et al. Robust transformer-based anomaly detection for nuclear power data using maximum correntropy criterion. Nuclear Engineering and Technology 2024, 56.4, 1284–1295. [Google Scholar] [CrossRef]
- Christ, Maximilian; et al. Time series feature extraction on basis of scalable hypothesis tests (TSFresh - a python package). Neurocomputing 2018, 307, 72–77. [Google Scholar] [CrossRef]
- Tam, I; Kalech, M; Rokach, L; et al. Probability-based algorithm for bearing diagnosis with untrained spall sizes[J]. Sensors 2020, 20(5), 1298–1299. [Google Scholar] [CrossRef] [PubMed]
- Döhler, Sebastian. A discrete modification of the Benjamini--Yekutieli procedure. Econometrics and Statistics 2018, 5, 137–147. [Google Scholar] [CrossRef]
- Fu, Yu; Liu, Xindi; Yu, Bin. PD-GATv2: Positive difference second generation graph attention network based on multi-granularity in information systems to classification. Applied Intelligence 2024, 54.6, 5081–5096. [Google Scholar] [CrossRef]
- Ma, Wenping; et al. Intra-and intersource interactive representation learning network for remote sensing images classification. IEEE Transactions on Geoscience and Remote Sensing 2024, 62, 1–15. [Google Scholar] [CrossRef]
- Li, H; Wu, X J. CrossFuse: A novel cross attention mechanism based infrared and visible image fusion approach[J]. Information Fusion 2024, 103, 102147. [Google Scholar] [CrossRef]
- Lv, Y; Liu, Y; Li, S; et al. Enhancing marine shaft generator reliability through intelligent fault diagnosis of gearbox bearings via improved Bidirectional LSTM[J]. Ocean Engineering 2025, 337, 121860. [Google Scholar] [CrossRef]
- Razavi, Rouzbeh; Gharipour, Amin. Rethinking the privacy of the smart grid: What your smart meter data can reveal about your household in Ireland. Energy research & social science 2018, 44, 312–323. [Google Scholar]
- Zanetti, M; Jamhour, E; Pellenz, M; et al. A tunable fraud detection system for advanced metering infrastructure using short-lived patterns[J]. IEEE Transactions on Smart grid 2017, 10(1), 830–840. [Google Scholar] [CrossRef]
- Jokar, P; Arianpoo, N; Leung, V C M. Electricity theft detection in AMI using customers' consumption patterns[J]. IEEE Transactions on Smart Grid 2015, 7(1), 216–226. [Google Scholar] [CrossRef]
- McLaughlin, S; Holbert, B; Fawaz, A; et al. A multi-sensor energy theft detection framework for advanced metering infrastructures[J]. IEEE journal on selected areas in communications 2013, 31(7), 1319–1330. [Google Scholar] [CrossRef]
- Mohassel, R R; Fung, A S; Mohammadi, F; et al. A survey on advanced metering infrastructure and its application in smart grids[C]//2014 IEEE 27th Canadian conference on electrical and computer engineering (CCECE); IEEE; Volume 2014, pp. 1–8.
- Fawaz, Ismail; Hassan; et al. Inceptiontime: Finding alexnet for time series classification. Data Mining and Knowledge Discovery 2020, 34.6, 1936–1962. [Google Scholar] [CrossRef]
- Rahimian, Elahe; et al. Xceptiontime: A novel deep architecture based on depthwise separable convolutions for hand gesture classification. arXiv 2019, arXiv:1911.03803. [Google Scholar] [CrossRef]
Figure 1.
Figure 1. Schematic diagram of the overall TGCformer network structure.
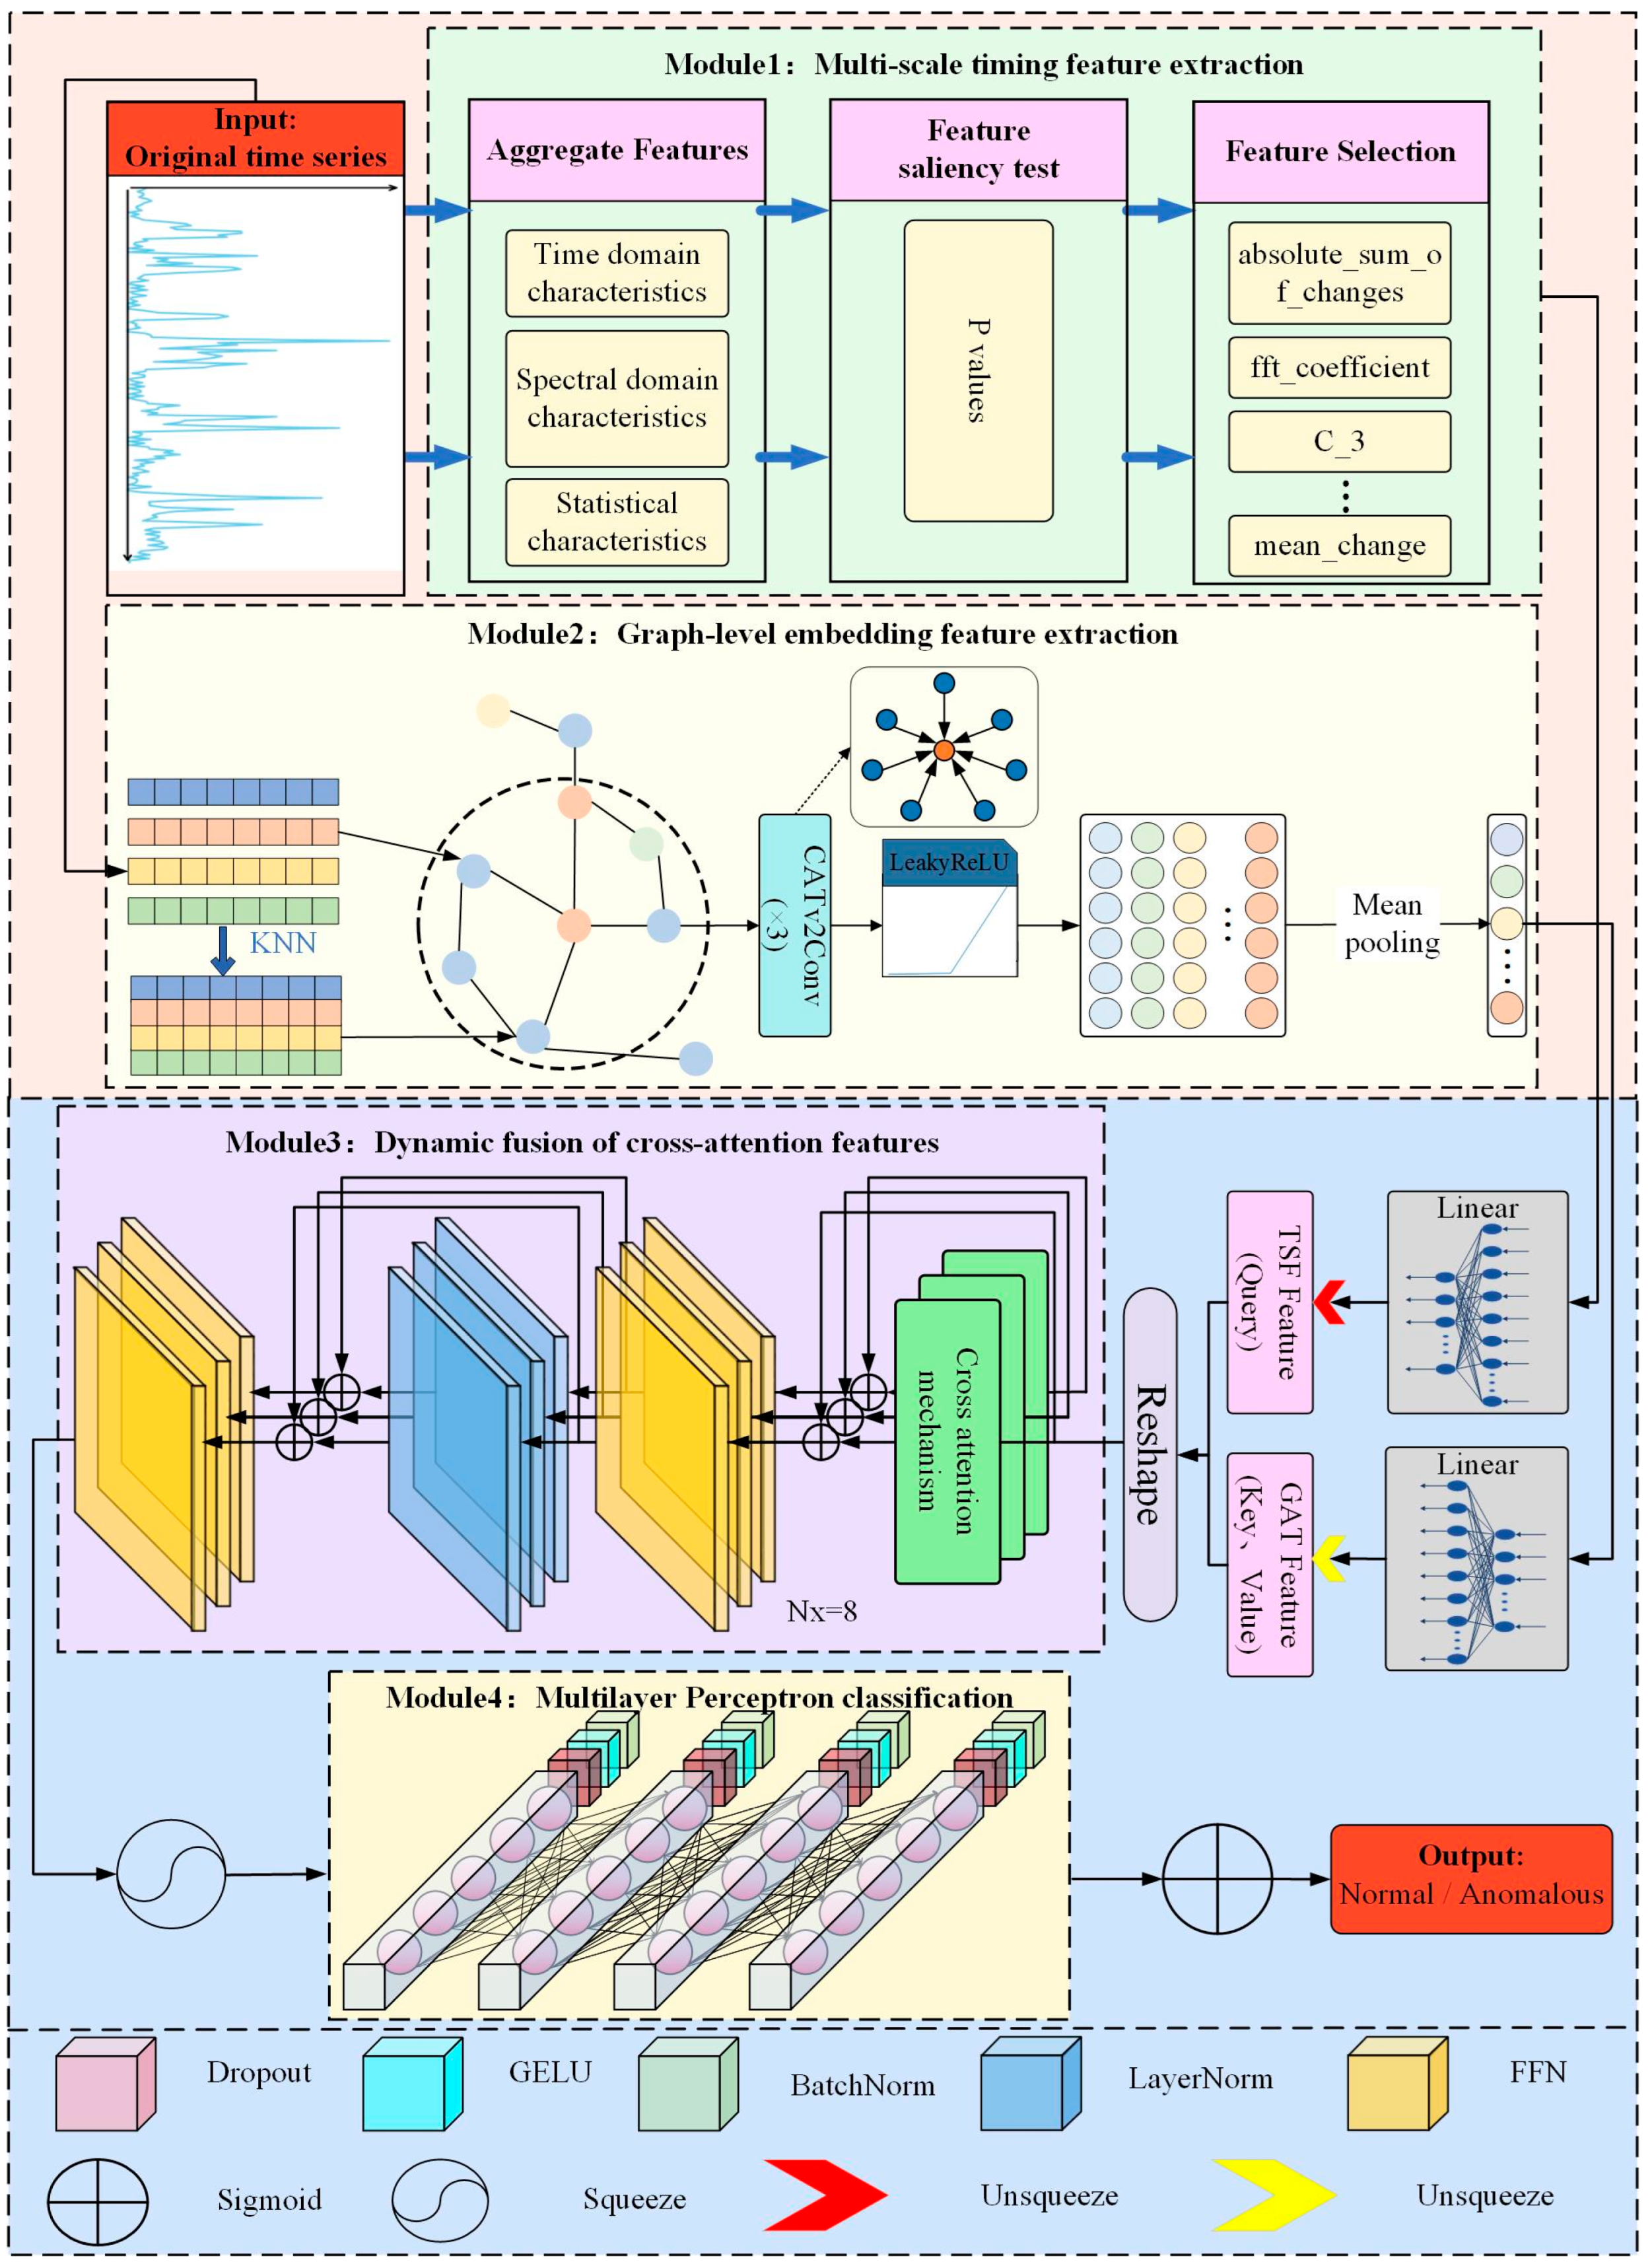
Figure 2.
Some time series features extracted by TSFresh.
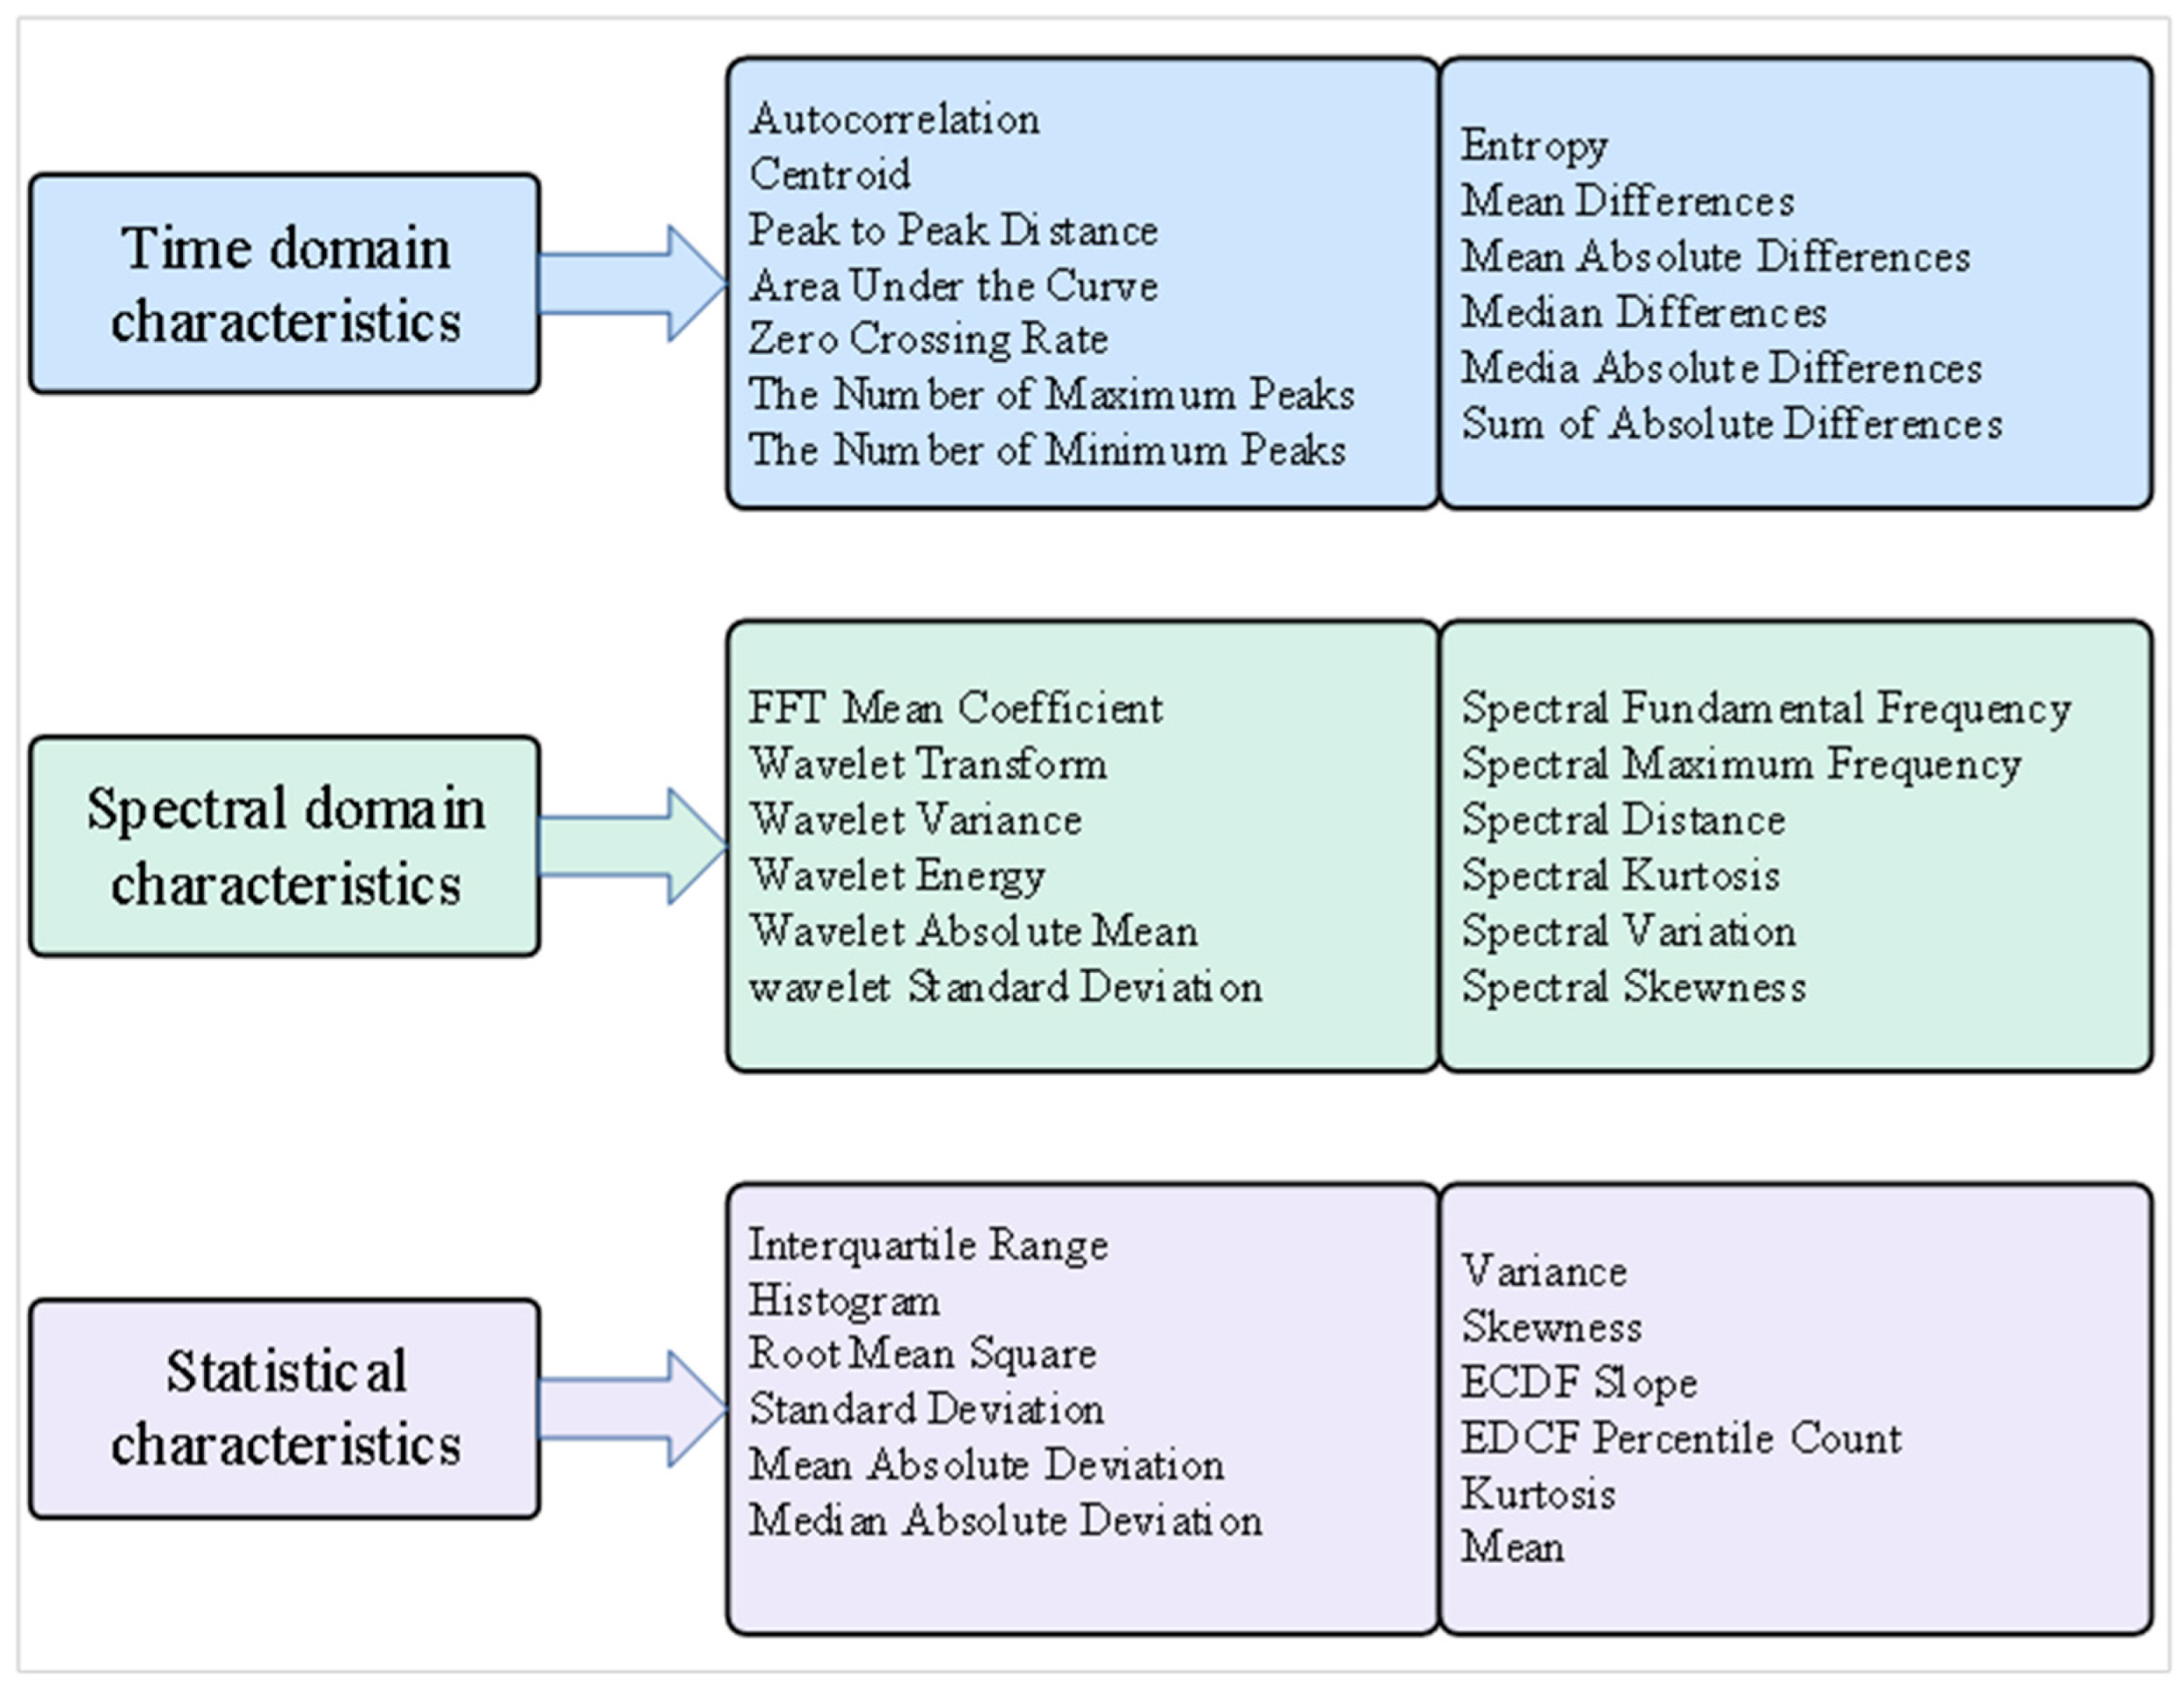
Figure 3.
Calculation process of GATv2 attention coefficients.
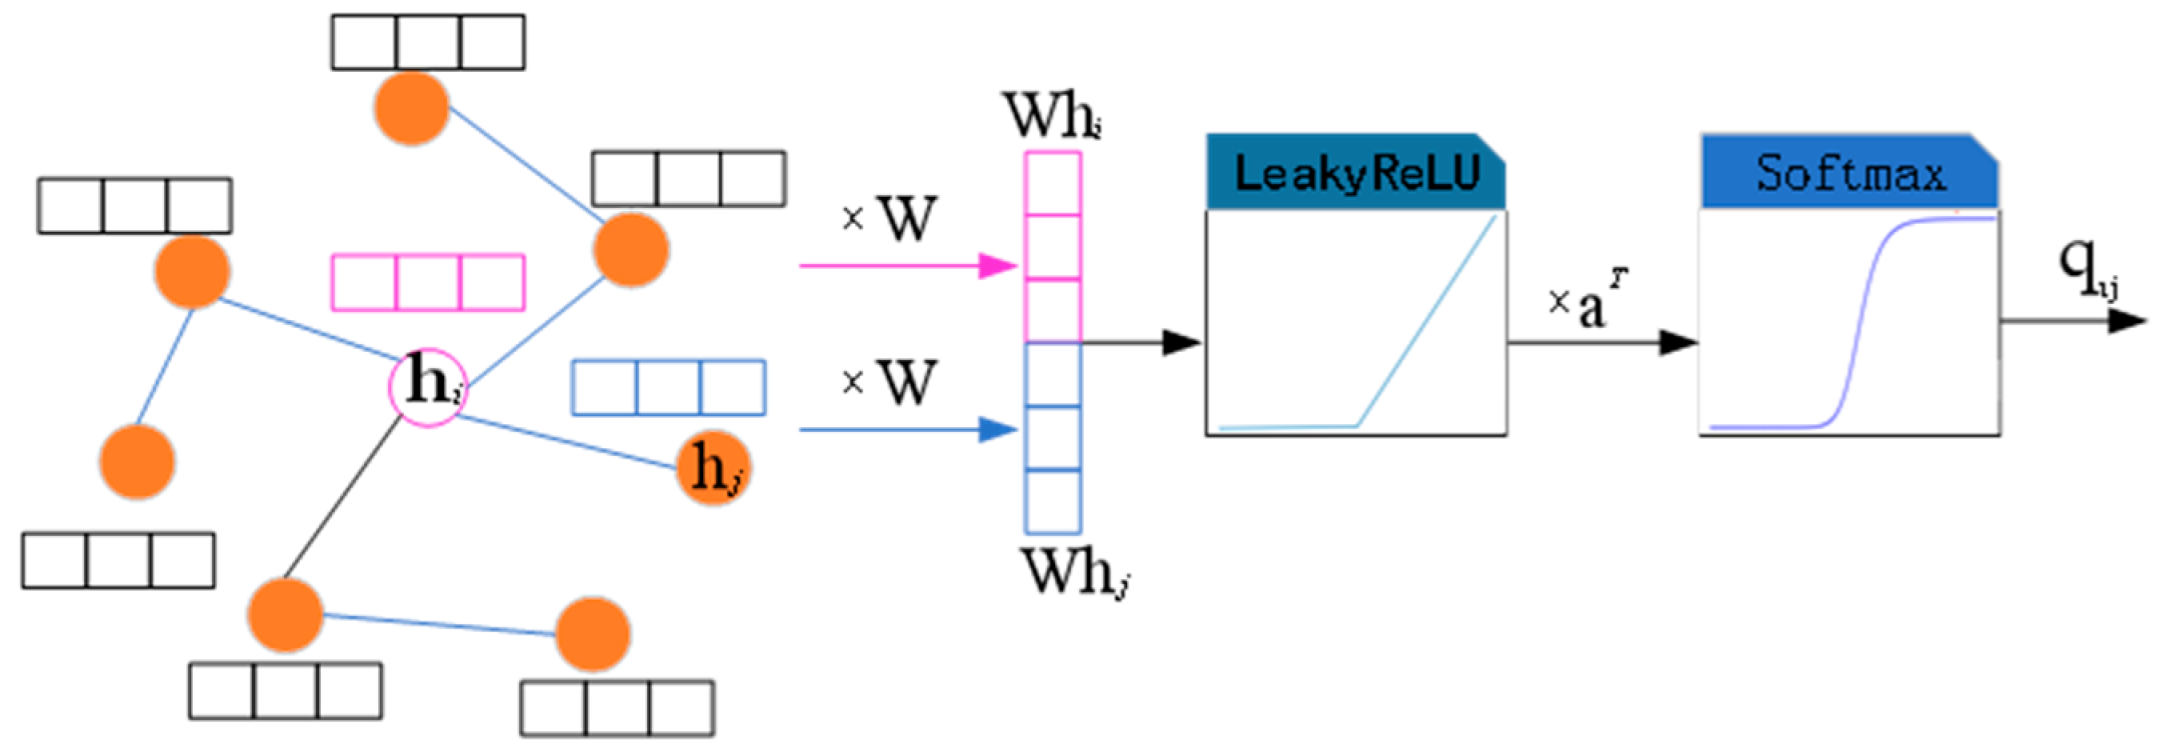
Figure 4.
Schematic diagram of the cross-attention mechanism.
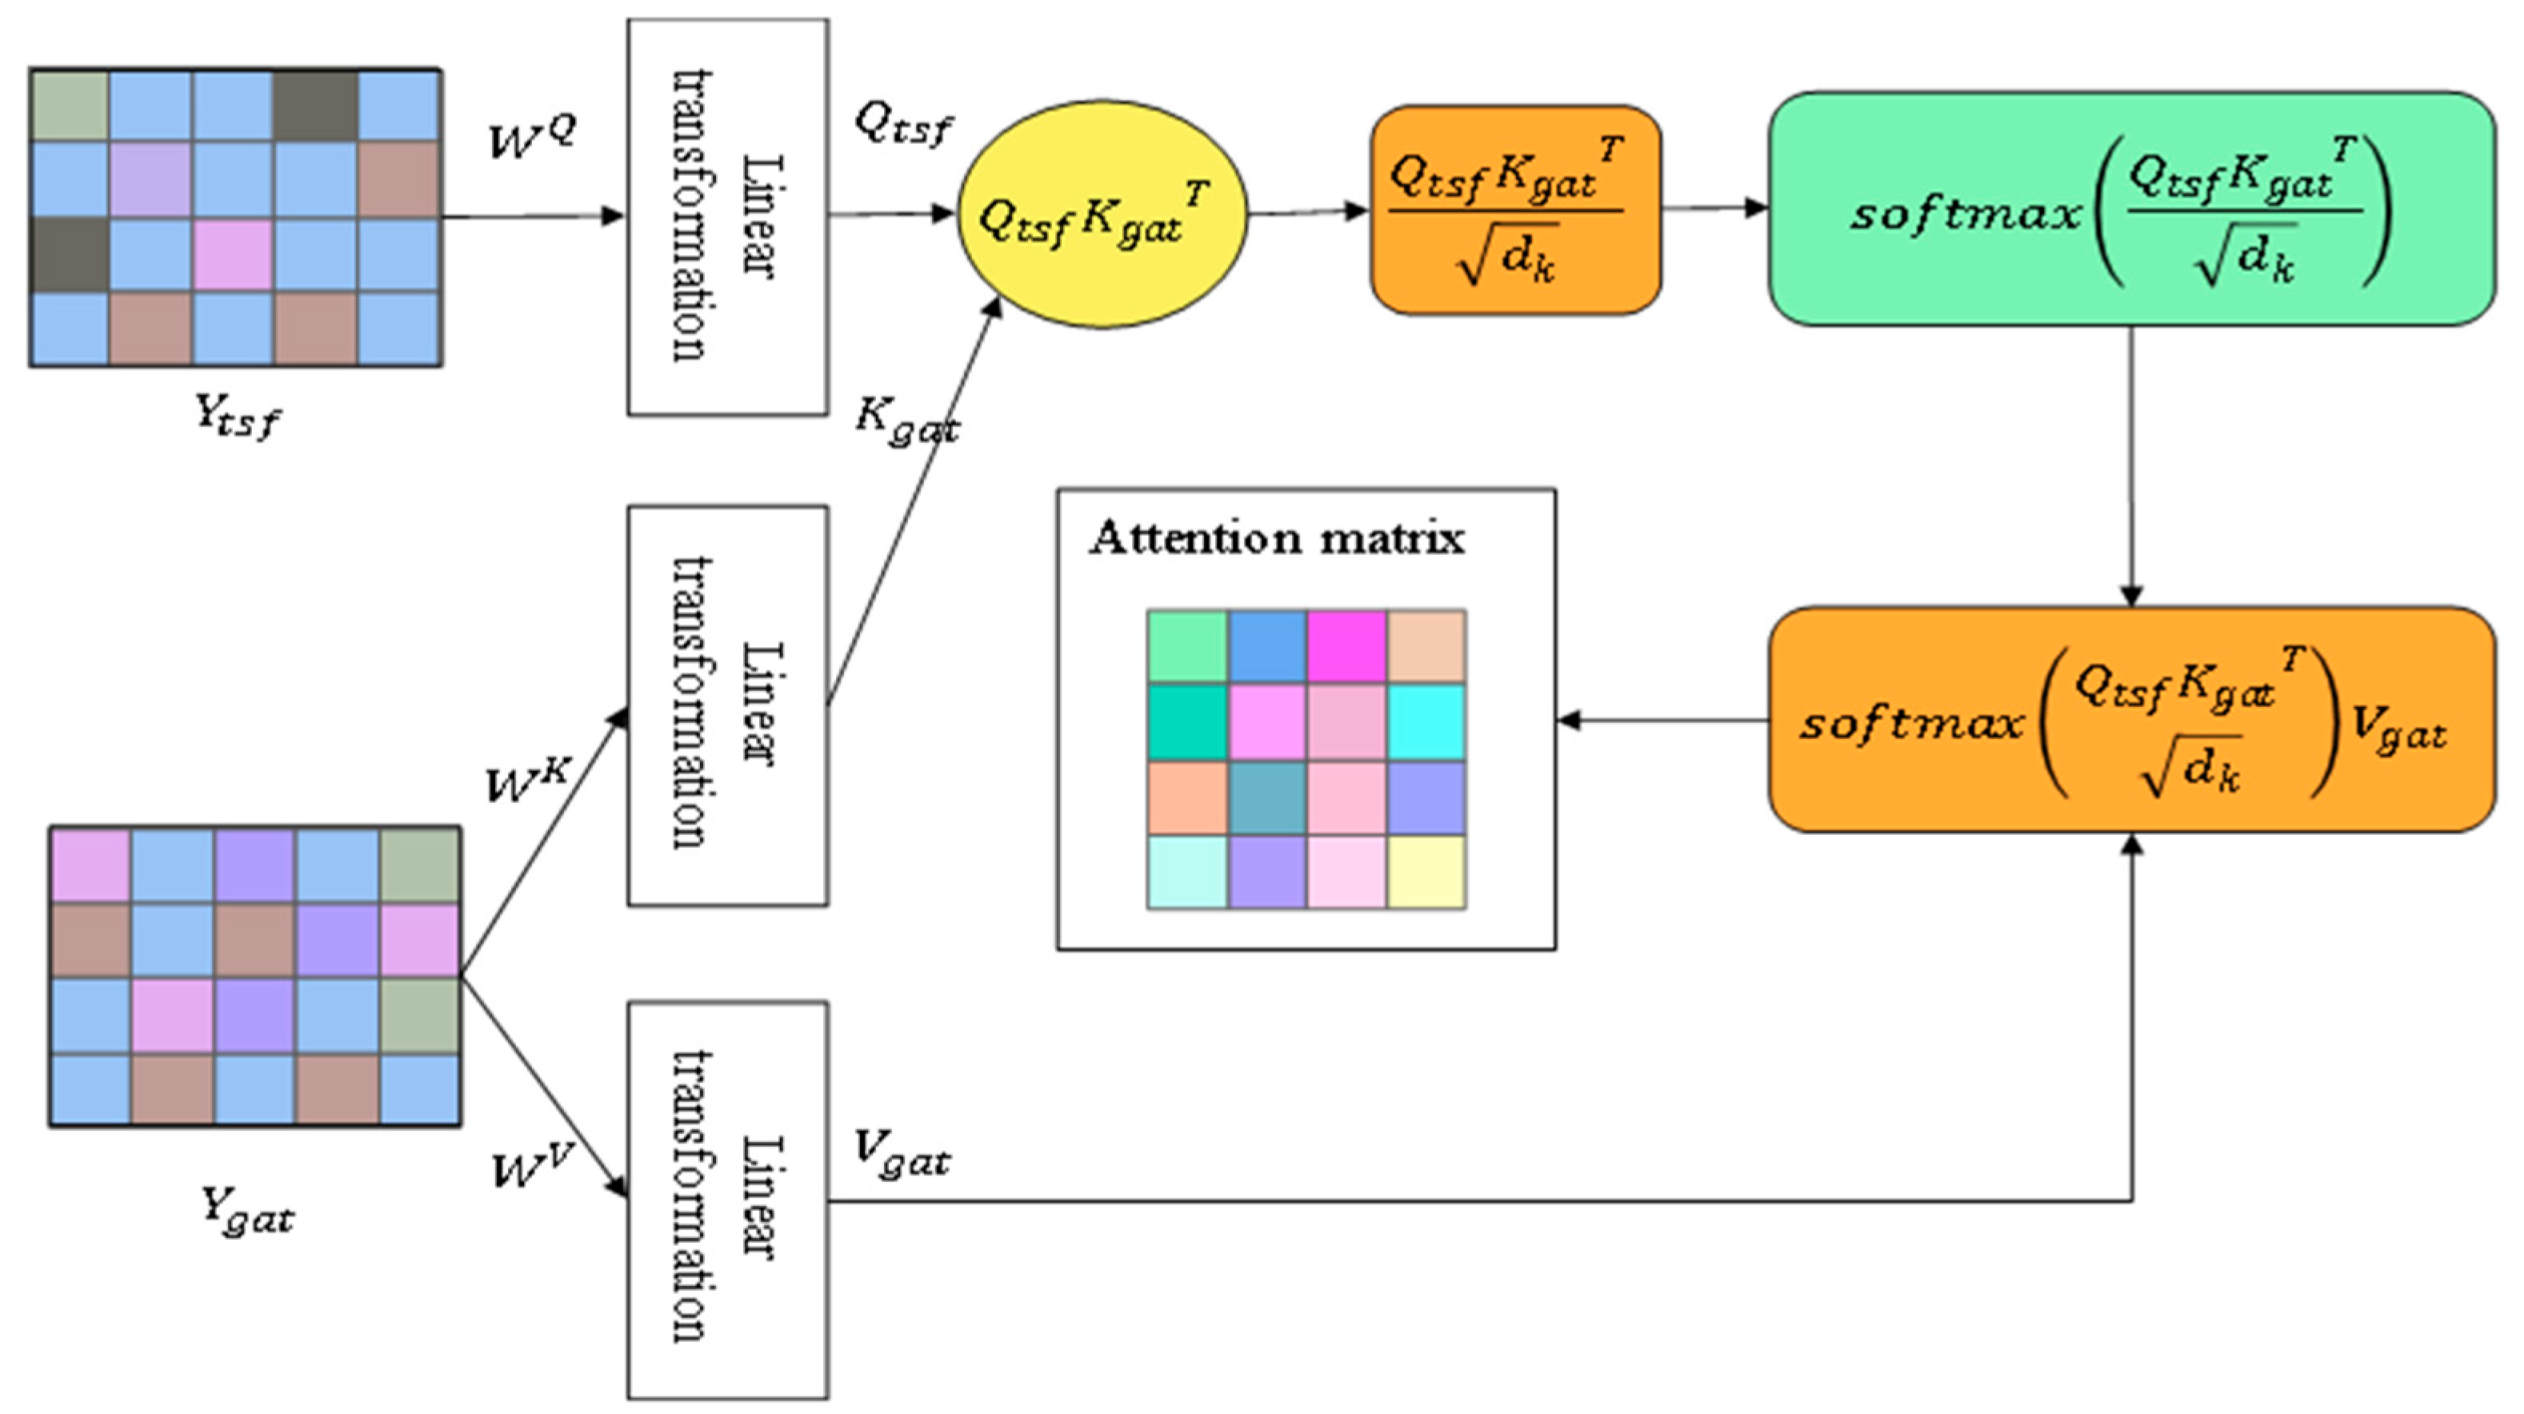
Figure 5.
Comparison chart of hourly electricity consumption distribution between normal and electricity theft samples.
Figure 5.
Comparison chart of hourly electricity consumption distribution between normal and electricity theft samples.
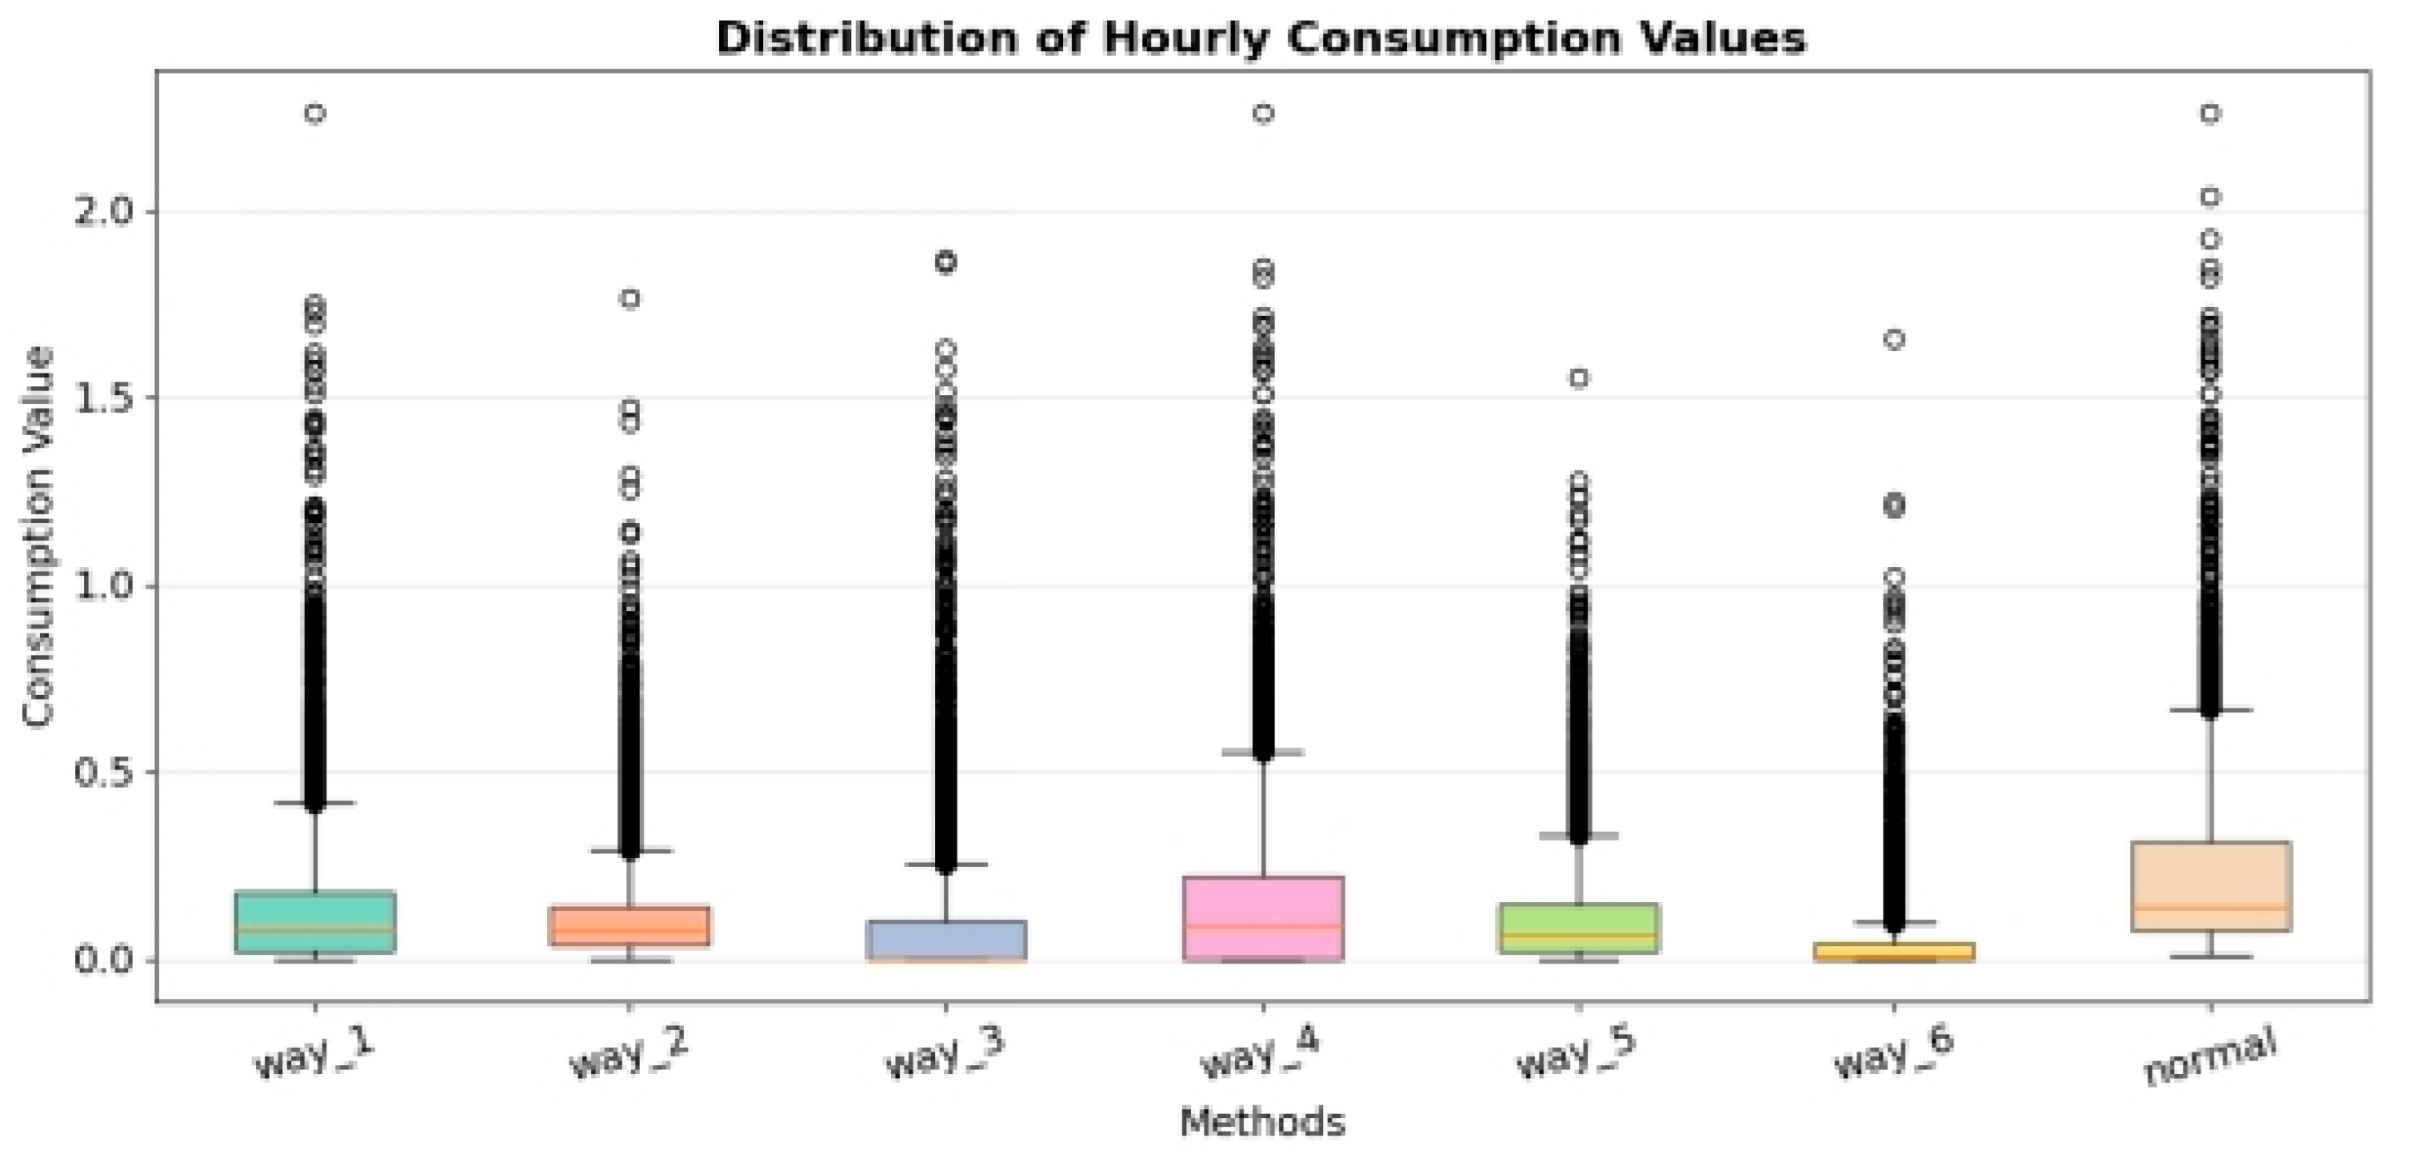
Figure 6.
Performance comparison of different models.
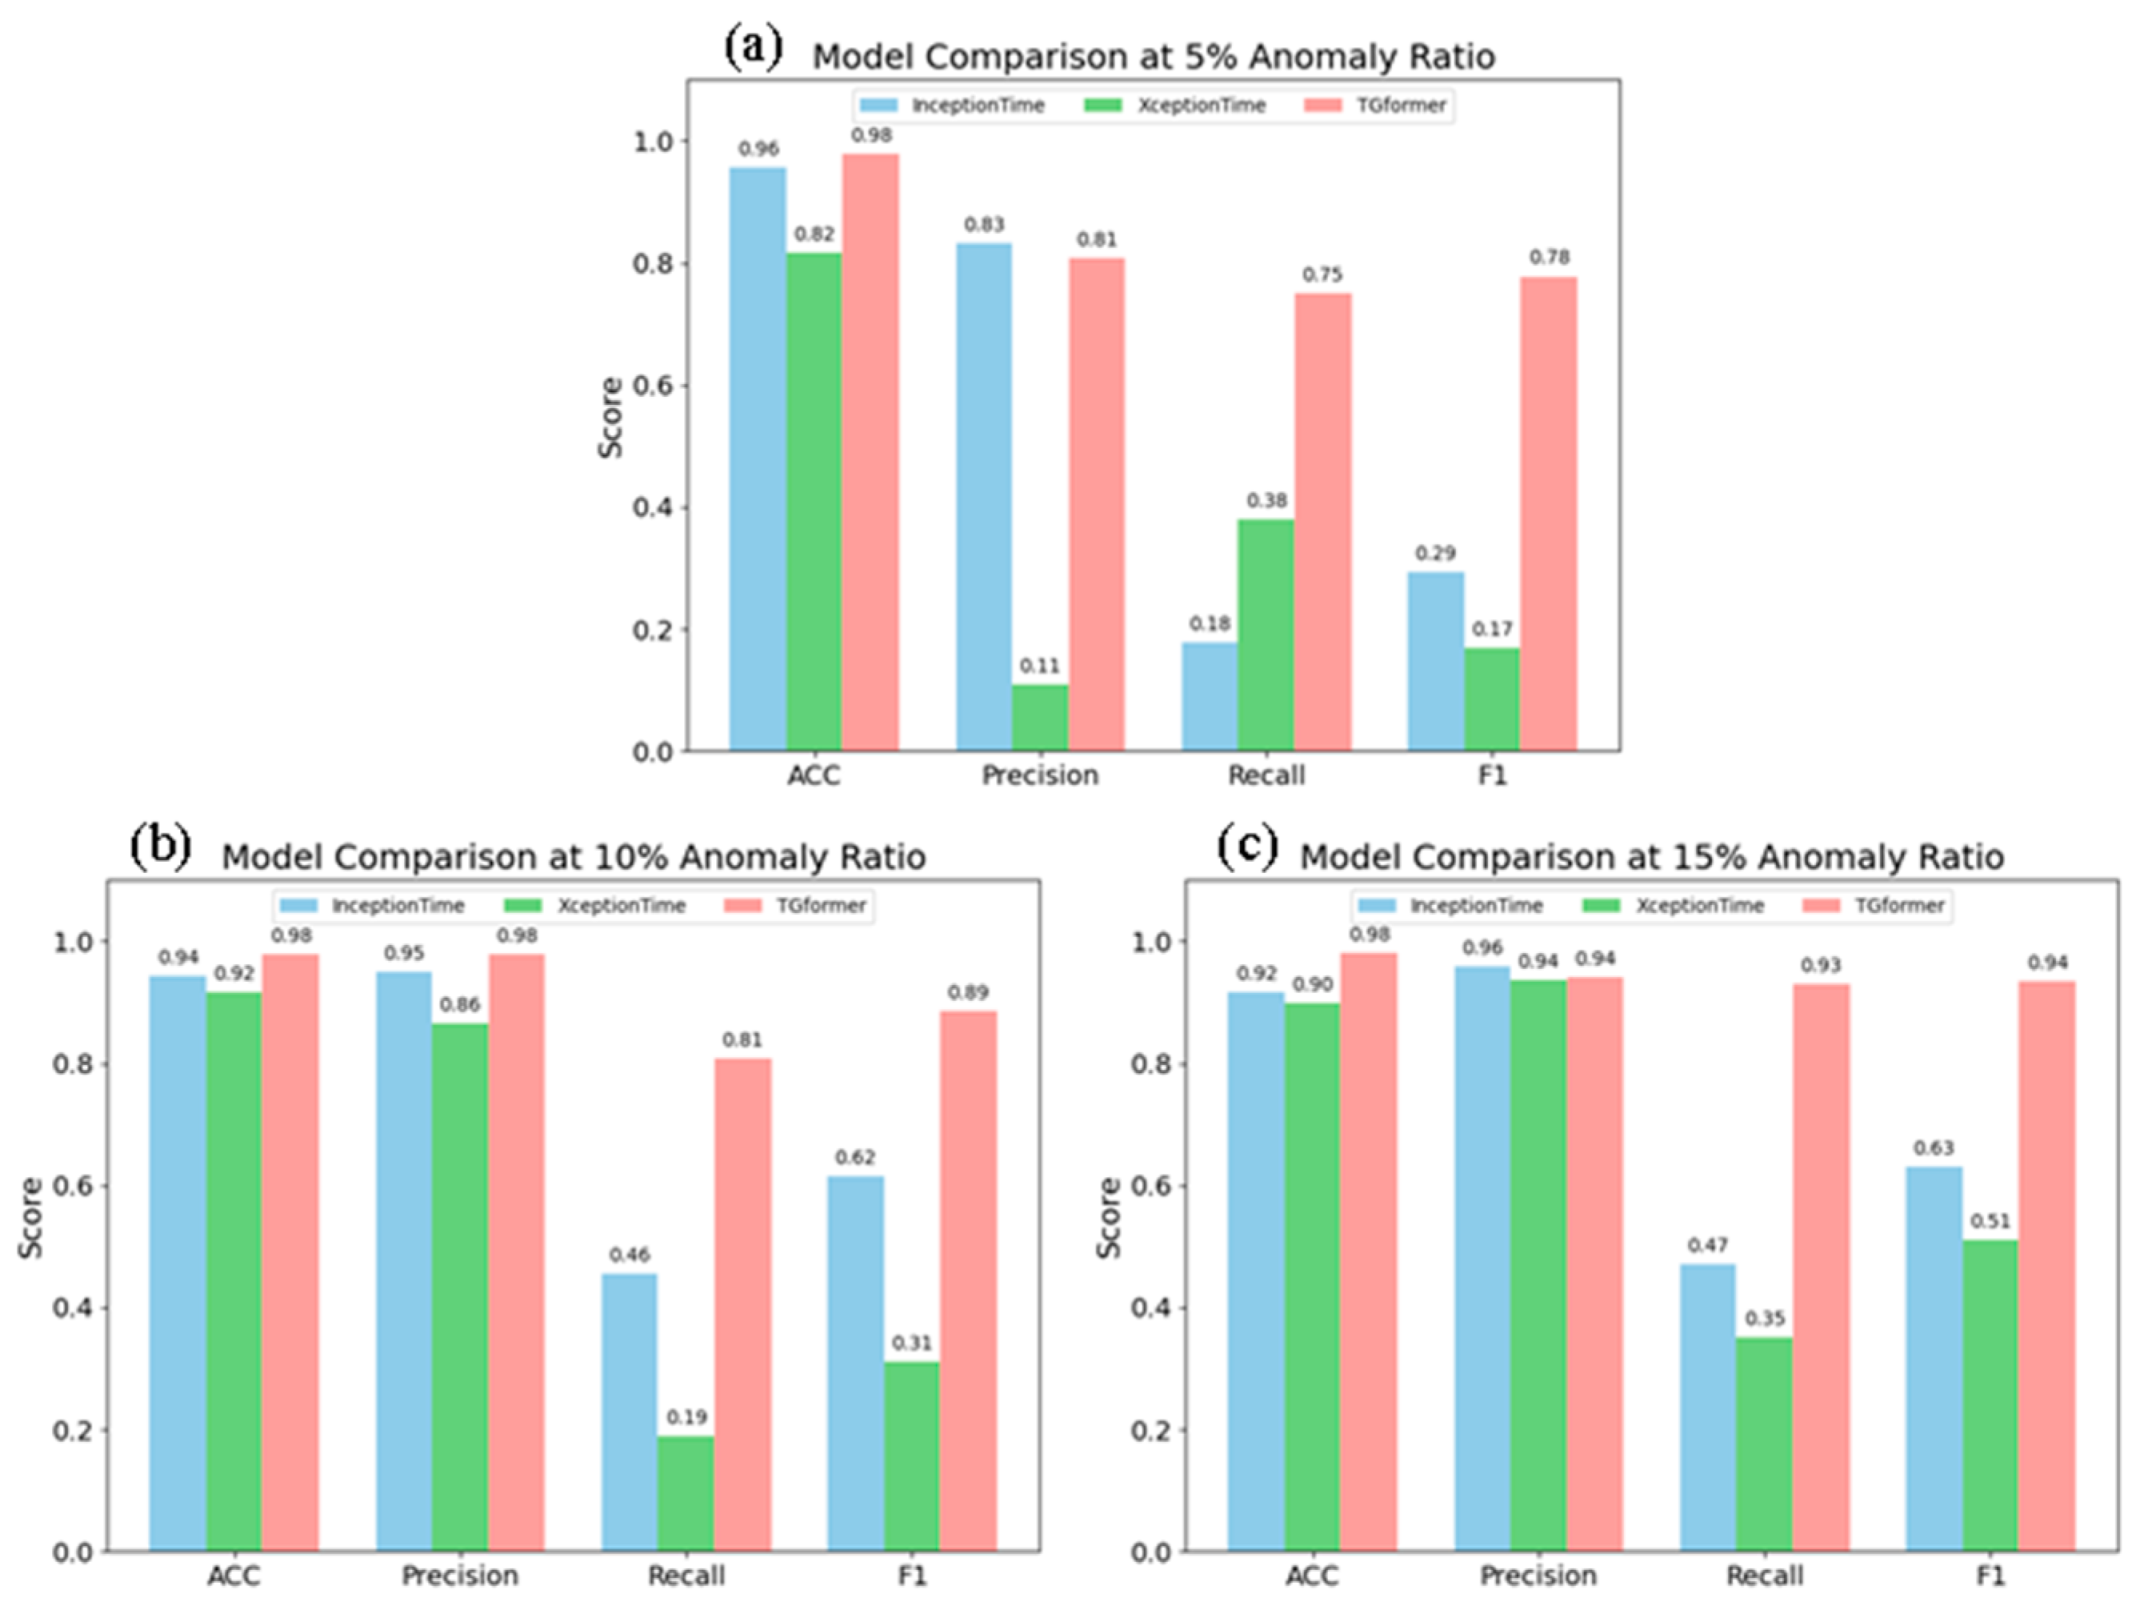
Figure 7.
Visualization of cross-attention weights.
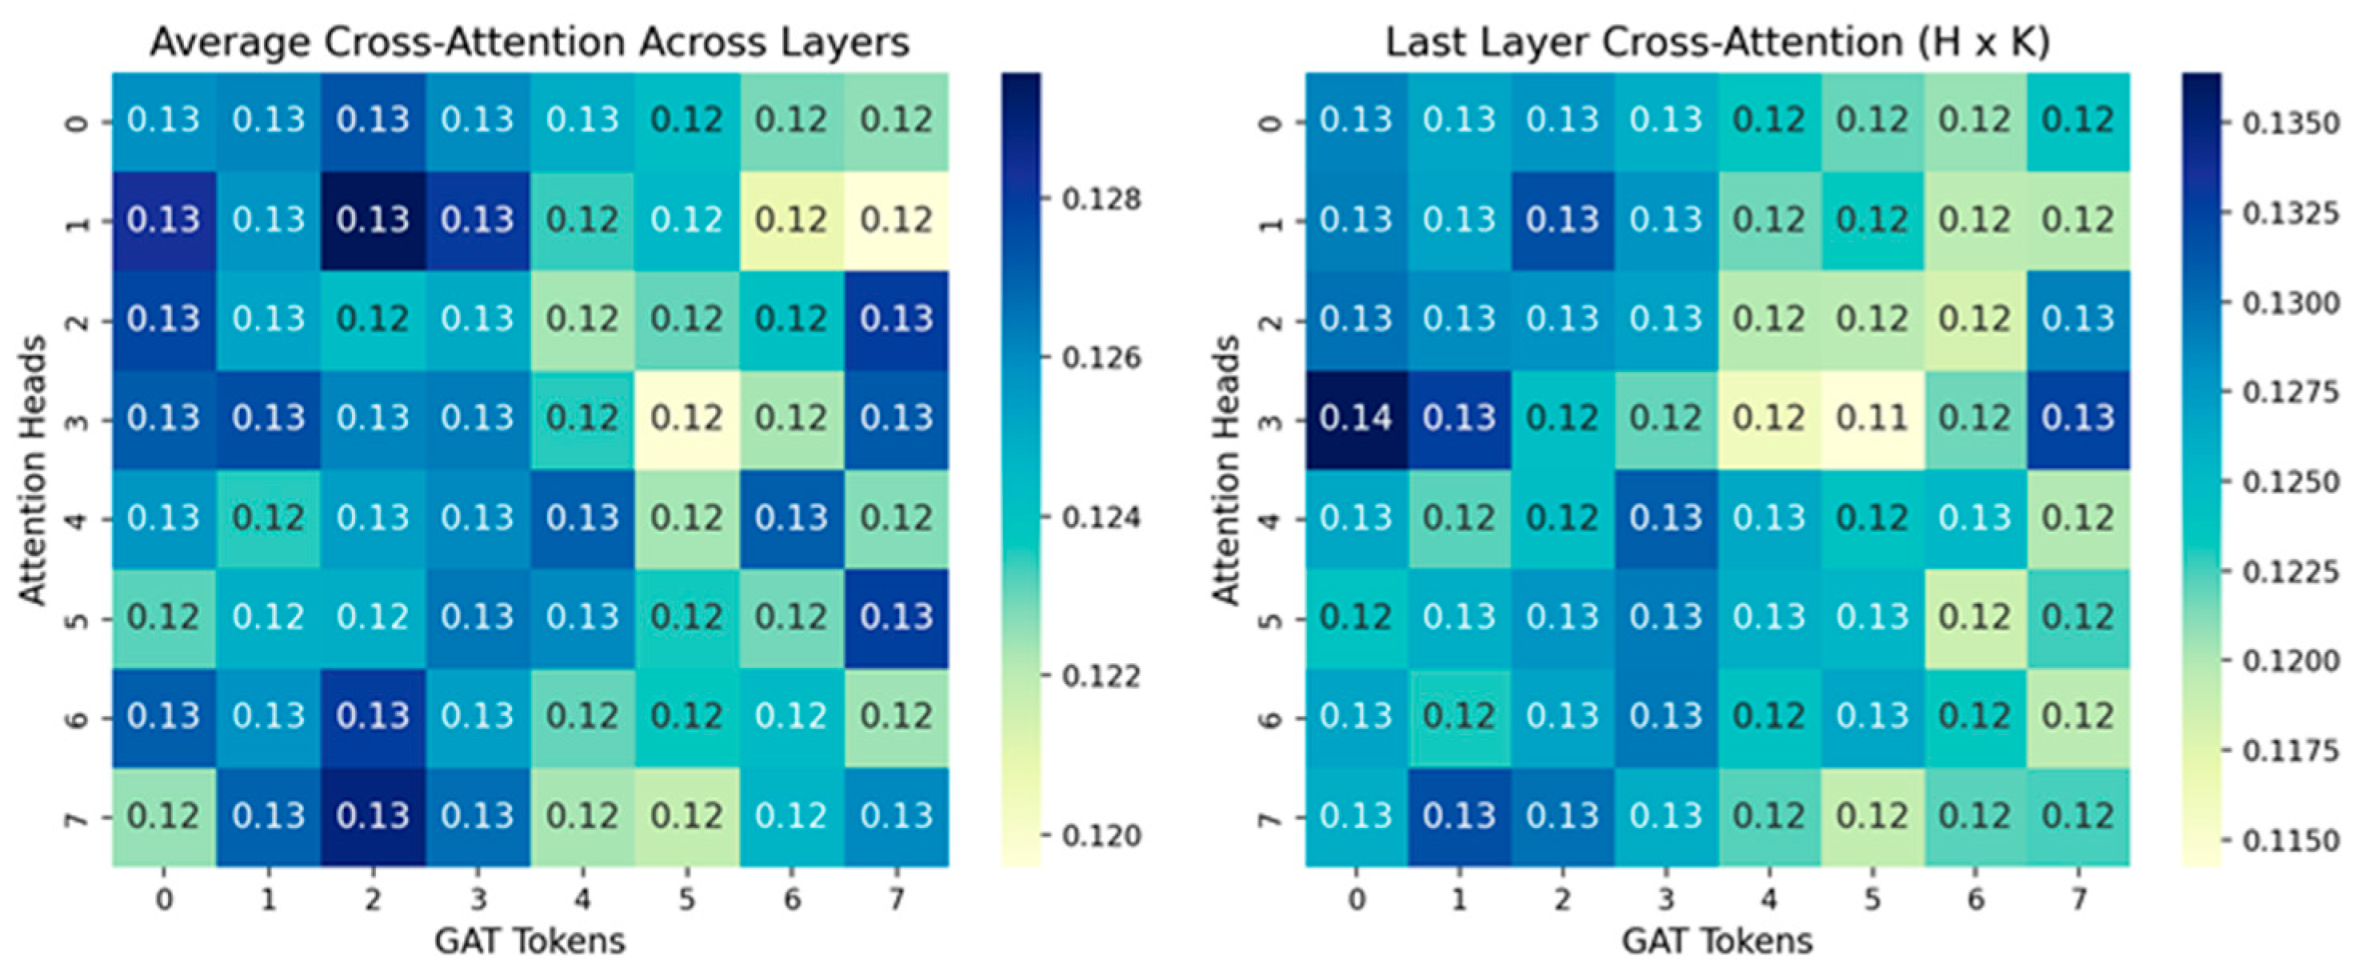
Figure 8.
Visualization of the distribution of normal and anomalous samples under the first two principal components and the first two high-variance features.
Figure 8.
Visualization of the distribution of normal and anomalous samples under the first two principal components and the first two high-variance features.
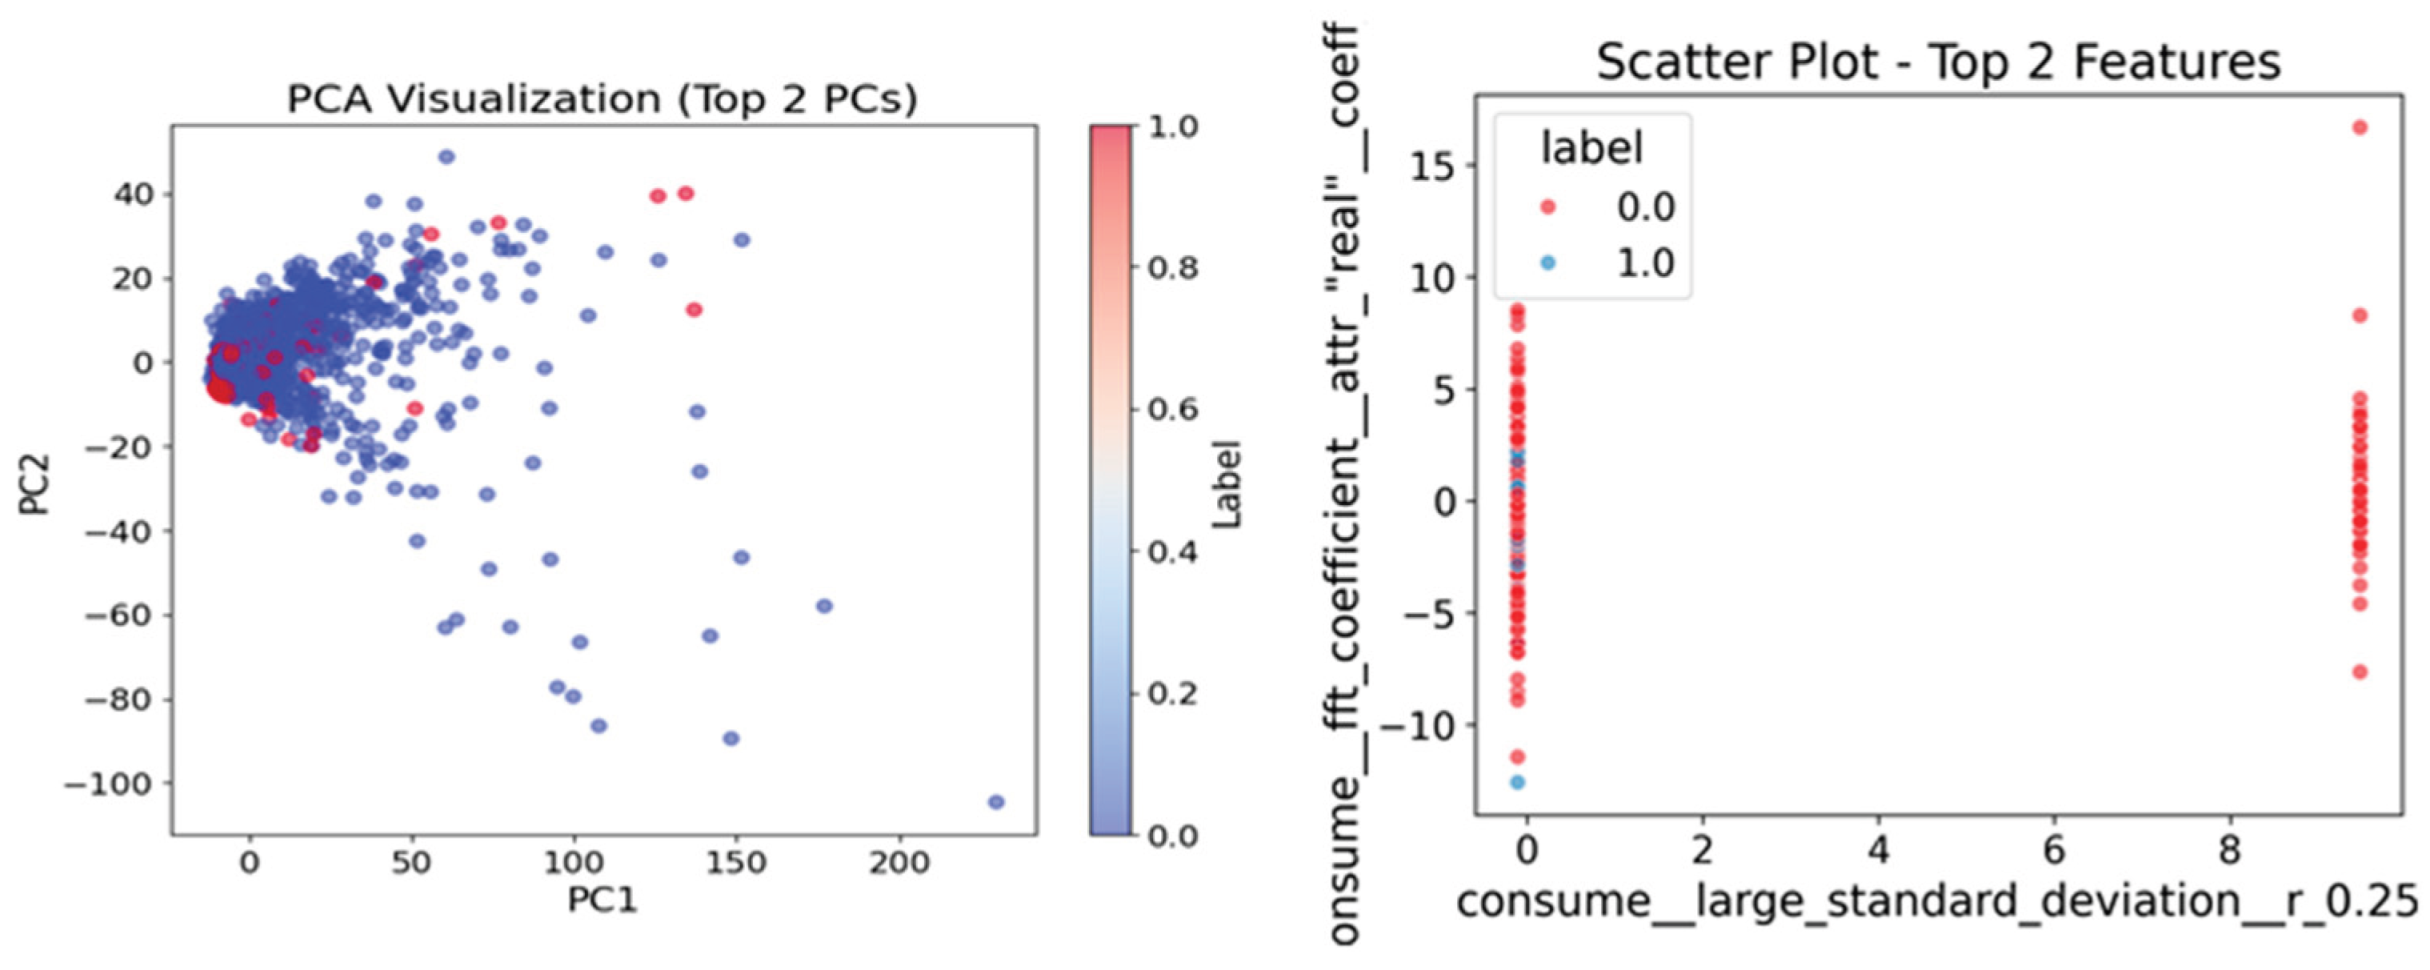

Table 1.
Comparative Experiments with Other Anomaly Detection Methods.
| Method | Anomaly Rate of the Method | ACC | Precision | Recall | F1 |
|---|---|---|---|---|---|
| InceptionTime | 5% | 0.957 | 0.833 | 0.178 | 0.294 |
| XceptionTime | 5% | 0.815 | 0.109 | 0.380 | 0.170 |
| TGCformer (ours) |
5% | 0.979 | 0.808 | 0.750 | 0.778 |
Table 2.
Detection Performance under Different Feature Inputs.
| Method | ACC | Precision | Recall | F1 |
|---|---|---|---|---|
| Only_ TSFresh | 0.971 | 0.936 | 0.771 | 0.846 |
| Only_GATv2 | 0.890 | 0.460 | 0.509 | 0.484 |
| TGCformer | 0.979 | 0.979 | 0.807 | 0.885 |
Disclaimer/Publisher’s Note: The statements, opinions and data contained in all publications are solely those of the individual author(s) and contributor(s) and not of MDPI and/or the editor(s). MDPI and/or the editor(s) disclaim responsibility for any injury to people or property resulting from any ideas, methods, instructions or products referred to in the content. |
© 2026 by the authors. Licensee MDPI, Basel, Switzerland. This article is an open access article distributed under the terms and conditions of the Creative Commons Attribution (CC BY) license.
Copyright: This open access article is published under a Creative Commons CC BY 4.0 license, which permit the free download, distribution, and reuse, provided that the author and preprint are cited in any reuse.


