
Submitted:
19 January 2026
Posted:
21 January 2026
You are already at the latest version
Abstract
This study presents a comparative Life Cycle Assessment (LCA) of packaging 1,000 kg of fresh-cut salad using conventional Polypropylene (PP) and bio-based INZEA® FH05 bags. Using the Product Environmental Footprint (PEF) methodology, the analysis revealed functional environmental parity: 152 ± 14 mPt for PP and 158 ± 14 mPt for the bioplastic. While Monte Carlo analysis suggests a statistically significant difference, the overlapping standard deviations indicate that, in practice, the choice does not yield a tangible benefit, validating the robustness of the comparative results and the stability of the environmental scores. Bioplastic films showed advantages in fossil resource depletion; however, these were offset by higher impacts in marine eutrophication and freshwater ecotoxicity. A critical finding is that the theoretical benefit of compostability is currently hindered by infrastructural deficiencies in industrial composting. Under current production and end-of-life scenarios, PP offers a marginally better environmental profile. These results highlight that the transition to bioplastics requires not only material innovation but also systemic improvements in waste management infrastructure.
Keywords:
life cycle assessment (LCA)
; product environmental footprint (PEF)
; polypropylene (PP)
; bioplastics
; food packaging
; waste management infrastructure
; marine eutrophication
; Monte Carlo analysis (MCA)
1. Introduction
The consumption of fresh-cut fruit and vegetable products—fresh, washed, and ready-to-eat—has seen a steady increase in Italy, which currently stands as the leading market for these products in Europe. In 2024 alone, this sector generated sales of €1.085 billion, corresponding to approximately 157,000 tons of product and employing roughly 30,000 workers [1].
Despite a significantly higher price point compared to bulk produce—where a bag of lettuce can reach nearly €10/kg compared to less than €2/kg for loose heads—the “convenience factor” remains the primary driver for modern consumers. Data elaborated by NielsenIQ for Unione Italiana Food indicates that between January and May 2025, sales exceeded €440 million, with the vegetable segment growing by 2.3% and the smaller fruit segment surging by 7% [2].
The fresh-cut industry is increasingly defined not only by its practicality but also by a growing commitment to environmental sustainability. According to industry reports, the pre-washed and portioned nature of these products aims to minimize household food waste [3]. Furthermore, production stages are increasingly adopting circular economy practices, such as photovoltaic integration, low-impact agricultural techniques, and the repurposing of processing waste for animal feed [4].
Within this framework, packaging plays a pivotal role in maintaining the shelf-life and safety of these highly perishable goods by managing respiration rates through Modified Atmosphere Packaging (MAP) [5]. While traditional petroleum-based plastics like Polypropylene (PP) have dominated the market due to their mechanical performance and low cost, the industry is facing a massive environmental challenge. Based on current market volumes, it is estimated that approximately 84 million salad bags are sold monthly in Italy. Given an average weight of 5 g per bag, this results in an annual consumption of over 5,000 metric tons of single-use plastic packaging.
To mitigate this impact, the industry is exploring bio-based and biodegradable alternatives, such as poly-lactate (PLA) and other biodegradable films [6]. However, the transition to bioplastics is not a straightforward solution and can sometimes result in “greenwashing” if not supported by rigorous data [7].
Scholarly research suggests a “green paradox”: while bioplastics aim to reduce fossil fuel dependency, their environmental superiority is strictly contingent upon production efficiency, material thickness, and the existence of robust industrial composting infrastructures [8]. Without a 100% efficient recovery system, biodegradable plastics landfilled in anaerobic conditions can release methane, a greenhouse gas (GHG) significantly more potent than CO2, potentially making them more impactful than traditional inert plastics [9,10].
Given this context, the objective of the present work is to perform a Streamlined Life Cycle Assessment (LCA) from “cradle-to-grave” of primary packaging for bagged salads. This study specifically aims to identify and quantify the environmental impacts associated with the production, use, and post-consumer disposal phases. By comparing a traditional plastic reference film with a biodegradable target film (INZEA®® FH05), this research seeks to provide a scientific basis for evaluating whether bioplastics can truly meet the dual requirements of environmental sustainability and high-performance food preservation in the Italian fresh-cut sector.
2. Materials and Methods
2.1. Defining Objectives and Scope
A streamlined Life Cycle Assessment (LCA) was conducted to evaluate the environmental profile of primary packaging for fresh-cut salads, encompassing both the production and end-of-life (EoL) phases. The study was performed in accordance with ISO 14040:2006 [11] and ISO 14044:2006 [12], covering the four standard phases: goal and scope definition, Life Cycle Inventory (LCI) analysis, Life Cycle Impact Assessment (LCIA), and interpretation of results.
2.2. Functional Unit and Packaging Materials
The Functional Unit (FU) was defined as a single 100-g retail package of fresh-cut salad (e.g., baby lettuce, arugula, or mixed greens). Two distinct materials were compared:
- a)
- Polypropylene (PP) Film: The reference packaging consisted of a biaxially oriented polypropylene film with a thickness of 40 μm and a grammage of 36.8 g m-2 (±9% tolerance), manufactured by New Dimension Plastic Srl (Nocera Inferiore, Italy). This material was characterized by high mechanical strength and moisture barrier properties (WVTR =6 g m-2 day-1), relatively high oxygen permeability (OTR =1800 cc m-2 day-1), and a wide sealing range (115–140 °C), ensuring hermetic closures during high-speed industrial packaging.
- b)
- Biodegradable and Compostable Film: The target alternative was the INZEA®® FH05 film, with a thickness of 35 μm and a density of 1210 kg m-3, produced by Nurel S.A. (Zaragoza, Spain). It features a sealing range of 115–130 °C and is designed for disposal via organic waste streams in compliance with EN 13432 [13] (industrial composting) and EN 17033 [14] for biodegradation in soil.
2.3. Composition and Inventory of the Bioplastic Film
As the exact formulation of INZEA®® FH05 is proprietary, its composition was estimated based on common industrial practices for compostable flexible packaging, as reported in Table S1 in the electronic supplement.
2.4. Life Cycle Inventory Data and Assumptions
Modeling data were sourced from the Ecoinvent database v. 3.9.1 using the “Cut-off, S” system model [15]. The selection of the cut-off approach is based on the principle that the first user of a material should carry its full environmental burden, thus providing a clear and transparent distribution of responsibilities within the life cycle [16]. This choice is consistent with the general philosophy of the Product Environmental Footprint (PEF) methodology regarding the accountability of primary production impacts [17]. The use of the cut-off model is further justified by evidence from several life cycle studies on food systems, which indicate that the choice between cut-off and APOS (Allocation at the Point of Substitution) models often yields a negligible difference in the final results [18]. Specifically, sensitivity analyses conducted on food products have shown that switching from Cut-off to APOS resulted in a minimal variation of the carbon footprint, often estimated at less than 2% [18]. This limited impact is particularly evident in lightweight primary packaging or energy-intensive food chains, where the environmental “credits” from material recovery are statistically secondary compared to the high-impact phases of cultivation, industrial processing, and refrigeration [19]. By adopting the cut-off model, the study provides a transparent and robust representation of the system’s primary burdens, avoiding potential overestimation of recycling benefits in the early stages of the product’s life cycle [16,20]. Additionally, while the Cut-off model serves as the primary approach, a sensitivity analysis using the APOS model was performed specifically for the bioplastic end-of-life (Section 3.6) to evaluate how the distribution of burdens for secondary by-products (e.g., compost) affects the overall environmental profile
The following proxy datasets were used for the INZEA®® FH05 film:
- ○
- PLA: Polylactide, granulate {GLO}|market for polylactide, granulate |Cut-off, S.
- ○
- PBAT: Polyester-complexed starch biopolymer {GLO}|market for polyester-complexed starch biopolymer |Cut-off, S.
- ○
- ATBC: Acetyl tributyl citrate {GLO}|Technology mix |Production mix, at plant.
- ○
- Processing Additive: Estimated as a blend of Talc (50%), Silica (30%), and Glycerol Monostearate (20%) using respective Ecoinvent LCI results.
Manufacturing yield was assumed to be 97.6% for the PP film and 95.0% for the bioplastic film, reflecting the higher technical complexity involved in processing bio-based polymers.
2.5. System Boundaries
The industrial production of bagged salad involves several complex stages, including pre-washing, automated coring, cutting, washing (often using ozone as a disinfectant), dewatering, and final centrifugal drying. However, in order to isolate the environmental performance of different material solutions, this LCA study adopted a “gate-to-grave” approach focused specifically on the packaging system. Consequently, the cultivation of raw materials, harvesting, and the energy-intensive processing steps (coring, cutting, and washing) are excluded from the system boundaries. To neutralize the inherent variability associated with different salad varieties and initial processing technologies, a standardized matrix of pre-cut salad was assumed for all examined configurations.
As illustrated in Figure 1, the system boundaries examined in this study primarily include:
- -
- Packaging Production and Logistics: The extraction of raw materials, manufacturing of the previously described films, and transport of all packaging materials.
- -
- Distribution Phase: The transport of the final packaged product from the facility to distribution centers (DC) and points of sale (PoS).
- -
- Use Phase and End-of-Life: The management of post-consumer packaging waste and the organic waste generated during the product’s shelf life.
By excluding the upstream agricultural phase and the internal processing stages, the methodological framework ensures that any differences in the overall environmental impact are directly and exclusively attributed to the packaging life cycle and its end-of-life management, as supported by the findings of Manfredi & Vignali [19] regarding the dominance of specific phases in food LCA.
2.6. System Exclusions
Several elements were excluded from the system boundaries of this study:
- -
- The production, maintenance, and disposal of capital goods (e.g., machinery for bag production, packaging lines, or domestic refrigeration), as detailed in Section 6.4.4 of PAS 2050 [21].
- -
- Employee commuting and personnel travel.
- -
- Consumer transport to and from the Points of Sale (PoS), as detailed in Section 6.5 of PAS 2050 [21].
The cultivation, transport, and primary processing of lettuce were excluded from the system boundaries, as these processes remain identical regardless of the packaging material used.
2.7. Geographical, Temporal, and Technological Boundaries
In accordance with Section 7.2 of PAS 2050 [21], the study considers typical process configurations and current technical and environmental standards for industrial-scale fresh-cut salad packaging lines in the year 2025.
2.8. Data Sources
Primary data regarding manufacturing yields and by-product generation (specifically post-consumer salad waste and packaging residue) were collected from the reference company - San Lidano Soc. Coop. Agr. (Sezze, Italy) - or sourced from specialized literature. San Lidano is a prominent Italian cooperative specializing in fresh-cut products, managing a direct supply chain of approximately 1,000 hectares. With over 30,000 m2 of processing space across three facilities and more than 25 automated packaging lines, the company has an annual capacity exceeding 100 million units, including bags, trays, and bowls of various formats and weights. This large-scale industrial context ensures that the LCI data—particularly regarding manufacturing efficiencies and waste fractions—are representative of contemporary European industrial standards.
Secondary data were sourced from the Ecoinvent v. 3.9.1 database, integrated into the SimaPro Craft 10.2.0.2 LCA software (Prè Consultants, Amersfoort, NL).
2.9. Packaging Phase
The primary packaging consists of a plastic or bioplastic bag (see Figure S1 in the electronic supplement), with main characteristics summarized in Table S2. The secondary packaging consists of an open recycled cardboard box (Figure S2 in the electronic supplement), with characteristics detailed in Table S3. As shown in Figure S2, the tertiary packaging for the cardboard boxes consists of an EPAL wooden pallet (800 mm x 1200 mm) weighing 14 kg, a Polyethylene (PE) stretch film and one adhesive paper label (3.1 g). The main characteristics of the tertiary packaging are reported in Table S4.
Table S5 summarizes the waste percentage for each packaging component during industrial-scale fresh-cut salad packaging, as collected at the reference processing plant.
Figure 2 illustrates the block diagram for the primary, secondary, and tertiary packaging processes of fresh-cut salad and the management of associated waste. It can be noted that the processing and packaging of fresh-cut salad generates several by-product and waste streams, each managed according to specific protocols:
- -
- By-products (SIT): These consist of waste generated during the bagging phase of the washed and cut salad. These materials are collected and used for animal feed in local buffalo farms.
- -
- Compostable Waste (RCO): Consists of primary packaging residues (SBAG) made of compostable and biodegradable bioplastics (e.g., PLA).
- -
- Plastic Waste (RPL): Includes PP bags (SBAG) and polyethylene (PE) stretch film (SFP).
- -
- Paper and Cardboard Waste (RCC): Includes non-compliant cardboard boxes (SCA) and labels (SEP).
- -
- Wood Waste (RL): Wooden pallets managed primarily through repair and reuse; otherwise, they are disposed of as non-hazardous wood waste (SPAL).
Finally, Table S6 presents the mass balance associated with the primary, secondary, and tertiary packaging stages of fresh-cut salad, as well as the management of the corresponding process waste. The balance is calculated, assuming an input of 1000 kg of product ready for packaging in PP bags and accounts for the waste percentages specified in Table S5.
2.10. Energy Consumption and Sources
Electricity is the primary energy resource utilized in the packaging and cold-chain management of fresh-cut salad. As this streamlined LCA focused exclusively on the environmental performance of different packaging configurations, the system boundary is limited to the packaging phase, excluding common upstream processing steps such as sorting, washing and cutting. Data from Pagani et al. [22] indicates that the total energy input for 1 kg of packaged salad ranges from 16 to 37 MJ. In the absence of primary sub-metered data for specific machinery, this study assumes the packaging phase (comprising primary bagging, secondary casing, and tertiary palletization) accounts for 25–33% of the total facility energy demand (excluding refrigeration). This translates to an estimated consumption of 4 MJ/kg to 12 MJ/kg. This range is particularly relevant when comparing material configurations. Although the bagging process for this study does not utilize a modified atmosphere (MAP), the electrical demand is influenced by the thermal sealing requirements of the primary films. Specifically, the energy intensity varies between PP and Bioplastic films due to differences in their sealing temperatures and the dwell time required to achieve a hermetic seal. The adopted energy interval (4–12 MJ/kg) is intended to encompass these fluctuations in heater-band power consumption and machine cycle efficiency across the different material scenarios.
2.11. Transport and Distribution Phases
The logistics network encompasses all inbound and outbound transport routes associated with the packaging life cycle and waste management. In alignment with modern environmental standards, all road transport was modeled using EURO 6 vehicles. Detailed logistics data, including specific vehicle types, load capacities, and transport distances, were provided by the reference company and are summarized in Table 1.
The transport inventory includes the following flows:
- -
- Upstream Logistics: Transport of raw materials for packaging from primary production sites to the Packaging Factory Gate (PFG), based on a standardized distance of 250 km. This is followed by the delivery of converted packaging materials from the PFG to the salad processing facility (Factory Gate, FG).
- -
- Distribution Network: Outbound transport of the final packaged salad. This includes the movement of palletized goods from the FG to Distribution Centers (DC) and subsequent delivery in secondary cardboard packaging from DCs to various Points of Sale (PoS).
- -
- Circular Logistics (Pallet Management): The transport of standardized EPAL wooden pallets between the Euro Pallet Management Center (EPMC), the processing facility (FG), and the DCs.
- -
- Waste and By-product Logistics: Transport of industrial packaging scraps from the FG and post-consumer packaging waste from homes (CH) to the designated Waste Collection Center (WCC).
- -
- Recovery of organic by-products, specifically bagging salad scraps, which are transported from the FG to local buffalo farms for use as animal feed.
2.12. Economic Allocation and Multi-Functionality
To address the multi-functionality of the salad processing stage, an economic allocation approach was adopted. The industrial preparation of fresh-cut salad generates significant amounts of organic scraps during the preliminary cleaning, washing, and automated optical sorting phases. According to industry data and literature, these by-products account for an average of 36 ± 6% of the initial raw material mass [23]. In this study, a mass balance was modeled where 1,000 kg of raw salad heads yield 640 kg of finished product and 360 kg of cleaning-sorting by-products. The allocation of environmental burdens was calculated based on current market values:
- -
- Fresh-cut salad: 3.50 €/kg.
- -
- By-products: 0.01 €/kg (based on a market price of 10 €/Mg for local buffalo farms).
Consequently, as detailed in Table S7, although the by-products represent 36% of the total output mass, their minimal commercial value results in a negligible economic allocation factor of 0.16%. This methodological choice effectively concentrates the environmental impacts of the upstream and processing phases on the primary product, ensuring a conservative and robust assessment of the bagged salad’s footprint.
2.13. Consumption Phase
Despite its convenience, fresh-cut salad is often not entirely consumed, contributing significantly to home food waste. Although designed to minimize waste compared to whole heads, several factors compromise full consumption. Primary causes of waste include: the unavoidable discarding of wilted or imperfect leaves, limited shelf-life once the package is opened leading to rapid spoilage, and oversized portions that often exceed individual needs. Individual preferences also play a role, as some consumers discard parts of the salad they do not like. Unfortunately, salad is among the most wasted foods at the domestic level. In Italy, salads contribute 19.4 g/day per capita to food waste, ranking in the “top five” most discarded foods [24]. Notably, this figure would translate to approximately 7.1 kg of salad wasted per person per year. This figure appears significantly high, especially when compared to a total per capita consumption of only 1.6 kg/year in 2017 [25], suggesting potential differences in collection methodologies or category definitions between sources, or highlighting an extremely critical proportion of waste relative to actual purchases. According to a recent survey by Legambiente [26], bagged salad and herbs (celery, parsley, basil) are the most wasted items (30.8% of respondents), followed by fresh fruit (21.5%), specifically strawberries, fresh bread (20.9%), and dairy products (15.7%). While the exact national average waste rate for bagged salad remains difficult to quantify without total purchase volumes, recent 2025 data from ALDI provided a significant benchmark for consumer behavior in the UK [27]. The report indicates that nearly one-quarter (24%) of consumers discard at least 50% of a salad bag before finishing it. Additionally, with an average of 88 bags of salad binned per household annually, it is evident that consumer-level waste is a critical factor in the product’s life cycle. In the absence of a single definitive percentage for the entire market, this study assumes a baseline waste rate of 10%. To account for the high-waste behavior identified recently, a sensitivity range of 5–30% was applied. This interval ensures that the environmental benefits of packaging—specifically its role in preventing large-scale food waste—are realistically weighed against the impact of the packaging materials themselves.
2.14. Waste Management and Disposal Scenarios
Waste management practices and recovery rates are highly dependent on national infrastructure and regional policies. In this study, the end-of-life (EoL) phase was modeled according to the Italian national guidelines for municipal solid [28,29,30,31,32]. The specific waste treatment scenarios for the reference year 2022 are detailed in Table S8 of the Supplementary Material. These data reflect a robust recycling infrastructure for traditional materials, with high recovery rates for paper and cardboard (81.2%), aluminum (73.6%), and wood (62.7%), while plastic packaging shows a more moderate recycling rate of 48.9% [30]. Regarding organic waste management, which is particularly relevant for the disposal of food remains and biodegradable components, 2022 statistics indicate that 49.2% was recycled (with 44.0% undergoing composting and 5.2% treated via anaerobic digestion) [32]. The remaining fraction was managed through incineration with energy recovery (28.9%) or disposed of in landfills (21.9%) [28]. These recovery and disposal shares were integrated into the LCA model to accurately reflect the environmental credits and burdens associated with the post-consumer phase.
2.15. Environmental Impact Assessment
The environmental impact of the chosen functional unit was estimated using the standard Product Environmental Footprint (PEF) methodology [17], integrated into the SimaPro Craft 10.2 software (PRé Consultants, Amersfoort, NL). The PEF method considers 16 impact categories: Climate Change (CC); Ozone Depletion (OD); Ionizing Radiation - Human Health (IR); Photochemical Ozone Formation (PhOF); Particulate Matter (PM); Human Toxicity, non-carcinogenic (NC-HT); Human Toxicity, carcinogenic (C-HT); Acidification (AC); Freshwater Eutrophication (FWE); Marine Eutrophication (ME); Terrestrial Eutrophication (TE); Freshwater Ecotoxicity (FWET); Land Use (LU); Water Scarcity (WU); Resource Use - Fossils (RUF); Resource Use - Minerals and Metals (RUMM).
This methodology consolidates these environmental impacts into a single point score. This is achieved by normalizing each impact category against its corresponding global impact, as recommended by Sala et al. [33]. The normalized scores are then weighted according to Sala et al. [34] and summed to obtain an Overall Weighted Score (PEF).
2.16. Sensitivity Analysis
To address uncertainties in packaging waste percentages and resource consumption within the preparation process, a sensitivity analysis was conducted using Monte Carlo simulations. Triangular and/or normal probability distributions were assigned to the relevant parameters in the LCA model. Using SimaPro Craft 10.2 software, 2,000 iterations were performed, generating random variables within these defined uncertainty intervals. This process recalculated the impact categories and the overall score, resulting in a probability distribution of potential outcomes that comprehensively assesses the inherent uncertainty of the study.
2.17. Data Quality and Uncertainty Analysis
The reliability of the life cycle inventory was verified using a Data Quality Indicator (DQI) framework based on the Pedigree Matrix [35]. Primary data flows were categorized into foreground data (specific primary information for packaging and waste processes) and background data (generic secondary data, such as the Italian electricity grid mix). Critical flows were identified via process network maps (Figures S4a and S4b), including factory electricity, packaging materials, and refrigerated transport. Each flow was evaluated across five dimensions: reliability (R), completeness (Co), and temporal (TiR), spatial (GeR), and technical (TeR) representativeness. These scores were aggregated into a final Data Quality Rating (DQR) [17]. Furthermore, parameter uncertainty (P) was quantified on a scale of 1 (highest quality) to 5 (lowest quality), correlating to specific geometric standard deviations (σg) ranging from 1.05 to 2.00. The overall standard uncertainty of the final PEF score (uT) was calculated by combining individual uncertainties (ui) using the Root Mean Square (RMS) method, assuming independent distributions [17,35].
3. Results
3.1. Data Quality Rating
The quantitative assessment of the LCI data quality, performed using the Pedigree matrix-based method described in Appendix A, yielded an overall Data Quality Rating (DQR) of 2.0 ± 0.5 for the PP bags and 2.1 ± 0.4 for the bioplastic bags. According to the PEF quality scale [17], these values classify the datasets as “Good” quality (2.0 < DQR ≤ 3.0), bordering on the “Very Good” category. This confirms the reliability of the foreground data collected and the appropriateness of the background datasets selected for the environmental impact assessment.
3.2. Comparative Analysis of the Environmental Footprint of Plastic and Bioplastic Films
To understand the environmental impact of PP and bioplastic films, it is useful to visualize the material and energy flows, as well as their respective contributions to the overall impact, through the Sankey diagrams illustrated in Figure S3. These diagrams offer an intuitive representation of the total impact proportions, where the width of the arrows is proportional to the magnitude of the impact generated by each process or phase. The aggregated impact unit used in these diagrams is the Product Environmental Footprint (PEF), expressed in millipoints (mPt). More specifically, the Sankey diagram in Figure S3a illustrates the environmental footprint for the production of 1 kg of PP film. The total cumulative environmental impact for this functional unit is 348.5 μPt. An analysis of the flows clearly shows that the primary contribution to the impact stems from raw material production:
- -
- Polypropylene granulate: With an input of 1.153 kg, it contributes a substantial 262 μPt to the total impact, as evidenced by the width of the red incoming arrow.
- -
- Transformation process: The extrusion of the plastic film has a significantly lower impact compared to granulate production, amounting to 58.9 μPt.
- -
- Transport: The transport of raw materials (0.2882 ton·km) accounts for a much more limited impact of approximately 5 μPt.
- -
- Waste management: The flow related to the management of 0.153 kg of PP scrap results in an impact of 23 μPt.
The Sankey diagram in Figure S3b details the environmental impact for the production of 1 kg of bioplastic film. The total cumulative environmental impact for this functional unit is 421 μPt. Compared to PP, this diagram reveals a more complex supply chain in terms of constituents:
- -
- Polylactate (PLA) granulate: The largest contribution comes from the production of PLA granulate which, at 0.71 kg, accounts for 242 μPt.
- -
- Other significant components: These include the polybutylene adipate terephthalate (PBAT) proxy (0.4145 kg, contributing 88.2 μPt) and the film extrusion process (1.184 kg, contributing 60.5 μPt), the latter representing a notable impact within the transformation phase.
- -
- Minor additives: Contributions from additives such as citric esters, glycerol monostearate, talc, and silica are also present, with lower impacts compared to the main components.
- -
- Transport: Logistics (0.2961 t·km) result in an impact of 5.1 μPt, like that of the PP film.
- -
- End-of-life management: The diagram includes several entries related to organic waste management; while individual impacts are relatively low, they collectively reflect the biodegradable nature of the material and the end-of-life handling of processing scraps.
Initial visual analysis of the Sankey diagrams reveals that the total impact of the bioplastic film is slightly higher than that of the PP film, although both are dominated by the raw material production phase. Furthermore, the bioplastic supply chain appears more intricate, characterized by a greater variety of inputs.
For a more quantitative and detailed assessment of these environmental impacts across specific categories, reference is made to Table 2, which presents the average environmental profiles and standard deviations, according to the standard PEF method, for the production of 1 kg of film in either PP or INZEA®® FH05, intended for fresh-cut salad packaging.
Table 2 reveals a complex and unexpected scenario regarding the environmental footprint of PP and INZEA®® FH05 films during the production phase. Contrary to the common perception that bioplastics are inherently “better,” the data indicate a mixed impact profile:
- PP emerges with a lower impact in a significant number of categories, including ozone depletion, ionizing radiation, photochemical ozone formation, particulate matter, acidification, all forms of eutrophication (freshwater, marine, terrestrial), freshwater ecotoxicity, non-carcinogenic human toxicity, land use and, most notably, water use and the use of mineral and metallic resources. Regarding the significantly lower impact on land use (LU) and water use (WU) for PP, it should be noted that bioplastics often require crops that demand land occupation and irrigation.
- INZEA®® FH05 bioplastic shows a clear advantage only in carcinogenic human toxicity (C-HT).
- For climate change, the two materials exhibit very similar impacts, with a slight advantage for PP.
In summary, Table 2 suggests that, for the production of 1 kg of film, PP generally displays a more favorable environmental profile across most impact categories. This highlights the importance of comprehensive LCA assessments that consider multiple impact categories, rather than focusing on a single parameter (e.g., carbon emissions or raw material origin alone). Decisions regarding material sustainability are complex and depend on balancing diverse impacts throughout the entire life cycle.
Using the standard PEF method, Table 3 reports the normalized and weighted values of the 16 impact categories (ICNWj) and the overall weighted score (PEF).
Analyzing the normalized and weighted data according to the PEF method, it is observed that:
- The production of 1 kg of PP film has a lower overall environmental footprint (349 µPt) compared to the bioplastic material (429 µPt).
- PP shows a lower impact in almost all weighted categories, particularly in water use (WU), ionizing radiation (IR), freshwater ecotoxicity (FWET), eutrophication categories (FWE, ME, TE), and land use (LU). Even climate change (CC) is slightly lower for PP in absolute terms (though it represents a higher percentage of its own total PEF score).
- INZEA®® FH05 bioplastic presents a clear advantage in resource use, fossils (RUF), with an impact of 78.4 µPt (18.3% of its total) compared to 123.3 µPt for PP (35.4% of its total). This is an expected result for a bio-based material, which also shows a lower impact in carcinogenic human toxicity (C-HT).
In conclusion, while INZEA®® FH05 demonstrates a significant advantage in reducing fossil resource depletion, its higher impact in numerous other categories—especially those related to water use, eutrophication, and ecotoxicity—leads to a less favorable overall PEF score compared to PP for the production of 1 kg of film. This underscores the necessity of a thorough and weighted LCA analysis, which often reveals that bio-based materials are not inherently superior in all environmental aspects, particularly when considering not only direct emissions but also resource consumption (water, land, minerals) and impacts across the entire value chain.
3.3. Comparative Mass Balance and Waste Generation
Table 4 presents a detailed mass balance of the waste generated during the packaging phase of 1,000 kg of washed and cut salad, using two distinct bag types (PP and bioplastic films). The analysis also includes the packaging-to-raw-material ratio (P/RM).
The following provides a concise description and comparison of the waste generated, based on the mass balances for packaging 1,000 kg of fresh-cut salad in plastic and bioplastic bags:
- Wood Waste: Wood waste is identical for both materials at 0.69 kg. This figure stems from the fraction of pallets damaged during the transport of the palletized product.
- Paper and Cardboard Waste: Similarly, paper and cardboard waste is equal for both materials at 319.1 kg, as the secondary packaging remains the same regardless of the primary bag type.
- Plastic Waste: This amounts to 67.7 kg for PP bags, whereas it is reduced to only 14.2 kg for bioplastic bags.
- Salad Scrap: In both cases, salad scraps amount to 50 kg, this being used as cattle feed.
- Organic Waste: No organic waste is generated in the case of PP bags. For bioplastic bags—being compostable and biodegradable—organic waste amounts to 61.6 kg and can be disposed of according to the national disposal scenario for organic waste.
- Total Packaging Waste and P/RM Ratio: PP bags generate 387.5 kg of total packaging waste, while bioplastic bags generate a slightly higher amount (395.6 kg). This difference is attributable to the higher weight of each bioplastic bag (5.8 g vs. 5.0 g), which is reflected in a higher packaging-to-raw-material (P/RM) ratio: 0.396 kg/kg for bioplastic vs. 0.388 kg/kg for PP bags.
In summary, every kilogram of packaged salad requires nearly 0.4 kg of packaging material, with bioplastics showing a slightly higher mass incidence. The primary advantage of the INZEA®® FH05 bioplastic film is the qualitative nature of its waste; unlike traditional plastics, these scraps are theoretically compatible with industrial composting, mitigating long-term plastic accumulation. However, the realization of this potential is strictly contingent upon national waste management infrastructure. As shown in Table S8, only 49.2% of organic waste is currently diverted to recycling (composting or anaerobic digestion). Consequently, a significant portion of bioplastic ends up in less virtuous streams, such as incineration or landfill. Conversely, PP-related plastic waste faces similar limitations, with only 48.9% recycled, while the remainder (51.1%) is incinerated or landfilled. While both materials suffer from infrastructural inefficiencies, PP carries a higher environmental burden due to its lack of biodegradability. Ultimately, while bioplastic bags generate slightly higher total waste mass, their ecological superiority lies in their potential integration into the organic cycle—provided that disposal infrastructure efficiency improves.
3.4. Environmental Profile of Different Packaging Formats for Fresh-Cut Salad
To eliminate variability associated with salad cultivation, product variety, and initial processing, the same washed and cut salad (standardized raw material) was used across all examined formats. This allows any differences in Product Environmental Footprint (PEF) scores and contributions to impact categories to be primarily attributed to:
- Production, transport, and end-of-life (EoL) of packaging materials (PP/PLA bags).
- Disposal of salad scraps and packaging waste.
Figure S4 illustrates the Sankey diagrams for the various life cycle stages regarding the packaging of 1,000 kg of washed and cut salad in 100-g packs, using the two materials examined: PP and INZEA®® FH05. It includes film production, packaging, logistics to the final product, and consumption with the formation of packaging waste and organic waste from spoilage.
The diagram in Figure S4a represents the environmental footprint associated with packaging in PP bags, which has a total cumulative environmental impact of approximately 150 mPt. By analyzing the impact flows, the main contributors can be identified:
- PP Bag Production (SALAD PP Ass - 1pack): The stages related to PP packaging production, including polypropylene granulate production and film extrusion, represent a significant share of the impact; the production of 54.7 kg of PP granules alone contributes 16.5 mPt.
- Use Phase (SALAD BIOP - Use phase): A relevant component is the impact associated with the product’s use phase which, while not considering domestic refrigeration, includes consumer waste and waste generation.
- Waste Management: This involves “Waste polypropylene” and the treatment of organic scraps (“Biowaste”).
- Logistics and Transport: Various transport flows show the incidence of material handling.
- Salad Production: Although not the primary object of the packaging study, the diagram includes the impact of 950 kg of “SALAD” at 65 mPt, linked to the electricity used for packaging and cold preservation.
The diagram in Figure S4b describes the environmental footprint associated with packaging based on INZEA®® FH05 bioplastic film, characterized by a total cumulative environmental impact of approximately 156 mPt. The diagram allows for the identification of “hotspots” in the product’s life cycle—the stages or materials that contribute most to the total environmental impact—potentially guiding efforts to improve sustainability.
Table 5 presents the environmental impact categories according to the standard PEF method for the two packaging formats under study, referring to a functional unit of 1,000 kg of washed and cut salad ready for packaging.
By comparing the data in Table 5, several significant trends can be observed among the mean values of the different environmental impact categories (ICj):
- -
- Climate Change (CC): This is virtually identical for both packaging types, suggesting a similar impact in terms of greenhouse gas emissions per functional unit.
- -
- Generally higher impact for INZEA®® FH05 film: For the majority of impact categories (OD, IR, PhOF, PM, AC, FWE, ME, TE, C-HT, NC-HT, WU, RUMM), this bioplastic film shows a higher mean value compared to PP. The difference is significantly higher in the cases of freshwater ecotoxicity (8.84 × 10³ vs. 5.60 × 10³ CTUe) and land use (1.08 × 10⁴ vs. 8.78 × 10³ Pt).
- -
- Slightly higher impact for PP in fossil resource use (RUF): PP shows a marginally higher value in this category (2.60 × 10⁴ vs. 2.48 × 10⁴ MJ).
In summary, for the production of 1,000 kg of washed, cut, and packaged salad, the use of PP bags tends to exhibit a lower (and thus better) environmental profile in most impact categories compared to INZEA®® FH05 bags. These differences are particularly pronounced for freshwater ecotoxicity and land use, where the bioplastic film presents a significantly higher impact. Although PLA is a bio-based material, these data indicate that its production can lead to non-negligible environmental impacts across various life cycle stages, in some cases exceeding those of PP.
Table 6 presents the normalized and weighted impact categories (expressed in mPt) according to the standard PEF method, along with the overall weighted PEF score, for the two packaging formats referring to a functional unit of 1,000 kg of packaged salad.
Analyzing the mean values of the normalized and weighted impact categories (ICNWj) and the overall PEF score (Table 6), the following emerges:
- -
- The overall PEF score for PP (152 mPt) is slightly lower than that of INZEA®® FH05 (158 mPt), although the difference is limited and the standard deviations overlap.
- -
- The carbon footprint (CC) of the two films is practically identical, indicating an equivalent contribution to climate impact.
- -
- The INZEA®® FH05 bioplastic film shows a slightly lower impact for fossil resource use (as expected for a bio-based polymer), but a higher impact for water use.
- -
- In other categories (i.e., OD, PhOF, PM, AC, FWE, ME, TE, FWET, C-HT, NC-HT, LU, and RUMM), a higher impact is found for the bioplastic film.
Although the bio-based INZEA®® FH05 film offers a modest reduction in fossil resource depletion, this benefit is offset by higher impacts in other critical areas—specifically marine eutrophication, freshwater ecotoxicity, and mineral resource use. These trade-offs suggest that the material’s upstream production phase introduces environmental burdens that are not present in the traditional PP life cycle. Consequently, based on the standard PEF methodology for 1,000 kg of fresh-cut salad, the PP bag remains marginally more advantageous. This result highlights a significant bottleneck: the ecological potential of compostable materials like PLA is currently hindered by the limitations of the Italian organic waste management system.
The ‘virtuous’ life cycle of bioplastics—integral to a circular economy—depends entirely on the efficiency of waste separation and the availability of industrial composting infrastructure. Without a synchronized national strategy to improve organic waste processing, the environmental advantages of such biopolymers remain largely theoretical, rather than realized benefits in the transition to more sustainable packaging systems.
3.5. Uncertainty Assessment of the Estimated Product Environmental Footprint
The quantitative uncertainty of the final Environmental Product Footprint (PEF) was estimated using the Data Quality Indicator (DQI)-based uncertainty propagation method detailed in Appendix A. The overall standard uncertainty (uT) and the contributions of individual life cycle steps (ui) are reported in Table A3 for both modeled scenarios.
A detailed analysis of the individual contributions identifies that the overall uncertainty is primarily driven by the Processing and Cold-chain Electricity, which accounts for approximately 8.3–8.7% of the total 9.5% uncertainty. While this flow benefits from reliable background data, its dominant share of the total environmental impact makes it the main source of absolute variance. Conversely, factors such as Primary Packaging and Transport contribute significantly less to the final uncertainty (ranging from 0.5% to 2.9%), reflecting the high precision of the foreground data collected (P=2) and the rigorous selection of secondary datasets. This qualitative robustness is further supported by the quantitative results, where the calculated uT ≈ 9.5% places the study within the “Excellent” range according to the PEF quality thresholds (uT ≤ 10%) [17]. This confirms that the inventory data is highly representative and that the comparative results between PP and bioplastic bags are statistically robust, as the margin of uncertainty is significantly lower than the observed differences in environmental performance.
These analytical findings are in high agreement with the Monte Carlo simulation results (152 ± 14 mPt for PP and 158 ± 14 mPt for bioplastic), which independently yielded an uncertainty range of approximately 9%. The convergence of both the DQI-based propagation and the stochastic simulation reinforces the ‘Excellent’ quality rating and confirms the reliability of the comparative environmental profile.
3.6. Sensitivity Analysis: End-of-Life Modeling Using Cut-Off vs. APOS
To assess how the valuation of by-products influences the bioplastic’s environmental profile, the end-of-life (EoL) phase was modeled under the hypothesis that all organic residues (salad waste and INZEA®® FH05 film) are directed to industrial composting. Beyond the baseline Cut-off approach, the APOS model was employed to account for the shared responsibility between waste producers and the users of recycled by-products [15]. This comparison evaluates whether the environmental “credits” or shared burdens inherent in the APOS framework significantly alter the competitiveness of the bioplastic scenario.
Table S9 reports the characterized (ICj), normalized, and weighted (ICNWj) values for 1,000 kg of fresh-cut salad across the 16 PEF impact categories. The overall PEF scores for both system models are compared to identify if the recovery of valuable compost provides a sufficient offset to the bioplastic’s upstream production impacts.
Table S9 reveals a critical finding: the total PEF score is identical for both the Cut-off and APOS scenarios (158 ± 14 mPt). All variations in individual impact categories remain within the model’s uncertainty range, rendering the differences statistically insignificant. This near-perfect alignment stems from the fact that both models assume 100% industrial composting for organic residues and bioplastic bags. In this specific scenario, the methodological divergence in by-product management is neutralized. The results confirm that the environmental burdens associated with composting—namely collection, transport, and plant operation—are almost entirely offset by the environmental credits assigned to the resulting compost. These credits account for the avoided production of synthetic fertilizers, as the compost serves as a direct nutrient substitute. Furthermore, the consistency between these scenarios and the national disposal baseline indicates that upstream phases—specifically primary production, energy-intensive processing, and the refrigerated cold chain—exert a far greater influence on the environmental profile than end-of-life (EoL) management. These findings align with PEFCR principles and Ecoinvent documentation, suggesting that different allocation models do not inherently dictate a ‘better’ environmental outcome. Ultimately, the high impact of the initial life cycle stages renders the final disposal choice statistically secondary, highlighting the necessity of focusing on production efficiency rather than solely on EoL management.
4. Discussion and Conclusions
The environmental equivalence observed in this study—with PEF scores of 152 mPt for PP versus 158 mPt for INZEA®® FH05—aligns with a growing body of literature challenging the inherent “green” superiority of bioplastics. Notably, these findings remained consistent regardless of the allocation transition model applied (APOS or Cut-off), further validating the robustness of the comparative results and confirming that the observed trends are independent of the chosen allocation method.
Comparative research confirms that the impact of biopolymers often exceeds that of conventional plastics like PP or PE, depending on methodological choices and end-of-life (EoL) infrastructure. Bishop et al. [8] and Marson et al. [36] emphasized that comprehensive methodologies like PEF are essential to capture shifts in impact categories, particularly land-use change, which many “optimism-biased” LCAs overlook by assuming ideal laboratory biodegradation rates [37]. While specific applications, such as PLA face masks, may show a 37% lower carbon footprint [9], these benefits are frequently negated by energy-intensive synthesis and pre-treatment requirements [38,39]. For polyhydroxyalkanoates (PHA), the challenge is even steeper; production costs remain 5 to 10 times higher than traditional polymers, and raw materials like molasses can contribute up to 94% of the total impact in certain categories [39]. Furthermore, the environmental burden is often exacerbated by functional requirements. As demonstrated by Montalbo-Lomboy et al. [40], bioplastics often require greater thickness—in their study, 30 μm versus 20 μm for PP—to maintain structural integrity, leading to higher mass per functional unit. In this study, the INZEA®® FH05 bag mass (5.8 g) was higher than the PP bag (5.0 g). This “cradle-to-gate” impact frequently outweighs carbon benefits, as agricultural production drives higher Acidification and Eutrophication scores compared to fossil-based PP [41,42].
Ultimately, the near-identical PEF scores found here demonstrate that bioplastics represent a systemic solution rather than a standalone one. Their ‘benefit’ is entirely contingent on waste management efficiency. If bioplastics reach landfills instead of industrial composting facilities, they can release methane—a greenhouse gas 25 times more potent than CO2 [9,10]. In such scenarios, traditional PP is climatically ‘safer’ due to its inert nature, which prevents the release of sequestered carbon. Furthermore, the risk of bioplastics contaminating traditional mechanical recycling streams [7] suggests that improper disposal can actively degrade the existing circular economy.
This integrated analysis suggests that corporate narratives often employ bioplastics as a marketing tool without a verified environmental basis [5,6]. For bioplastics to transition from a “bane” to a “boon,” the industry must prioritize:
- -
- Feedstocks Evolution: Shifting to second-generation, waste-based feedstocks (such as molasses or agricultural residues) to minimize land-use change and competition with food systems [43].
- -
- Infrastructure Integration: Ensuring 100% efficient collection and industrial composting collection to prevent the climate risks associated with landfilling.
- -
- Methodological Transparency: Implementing transparent LCAs that account for real-world infrastructure limitations and the negative externalities of recycling contamination.
In conclusion, the environmental impact of bioplastics is a multi-dimensional outcome influenced by feedstock origin, production efficiency, and local waste infrastructure, rather than a binary choice of material. The results of this study suggest that the current transition toward bio-based packaging for fresh-cut produce lacks a clear environmental justification under present technological and infrastructural conditions. The ‘compostability’ feature, while commercially attractive, does not compensate for the higher upstream impacts of bioplastic production. Consequently, promoting these materials as a definitive ecological solution could be interpreted as a form of ‘environmental labeling’ that lacks a holistic scientific basis, emphasizing the need for production-side efficiency over purely end-of-life focused strategies.
Supplementary Materials
The following supporting information can be downloaded at the website of this paper posted on Preprints.org. Figure S1: Photos of fresh-cut salad packaged in bioplastic bags; Figure S2: Photo of the secondary and tertiary packaging configuration; Figure S3: Sankey diagrams mapping the environmental footprint of pastic and bioplastic films; Figure S4: Sankey diagrams mapping the environmental footprint of a 1,000 kg fresh-cut salad batch; Table S1: Detailed material composition of the bioplastic film; Table S2: Technical specifications for primary packaging; Table S3: Technical specifications for secondary packaging; Table S4: Technical specifications for tertiary packaging; Table S5: Industrial packaging waste percentages; Table S6: Material balances for the fresh-cut salad packaging process and associated waste; Table S7: Economic allocation parameters between the fresh-cut salad and by-products; Table S8: Italian waste management scenarios; Table S9: Environmental profile of the bioplastic system using the APOS and Cut-off system model.
Author Contributions
Conceptualization, M.M.; methodology, M.M.; validation, M.M.; formal analysis, M.M.; investigation, M.M.; resources, M.M.; data curation, M.M.; writing—original draft preparation, M.M.; writing—review and editing, M.M.; visualization and supervision: M.M.; project administration, M.M.; funding acquisition, M.M.
Funding
This research was carried out as part of the BIOPLAST Project no. 24250029824 funded by Latium Region of Italy.
Institutional Review Board Statement
Not applicable.
Informed Consent Statement
Not applicable.
Data Availability Statement
Data is contained within the article or supplementary material.
Acknowledgments
The author would like to thank Paolo Cappuccio (San Lidano, Sezze, Italy) for providing the primary data regarding the industrial-scale production, packaging, and distribution of fresh-cut salads.
Conflicts of Interest
The author declares no conflict of interest. The funders had no role in the design of the study; in the collection, analyses, or interpretation of data; in the writing of the manuscript; or in the decision to publish the results.
Nomenclature
| AC | Acidification [mol H+e] |
| APOS | Allocation at the Point of Substitution |
| BAG | Plastic or bioplastic bags |
| Co | Completeness |
| CA | Cartons [kg] |
| CaF | Cattle farm |
| CC | Climate Change [kg CO2e] |
| CFC11 | Trichlorofluoromethane. |
| C-HT | Human Toxicity, carcinogenic [CTUh] |
| CTUe | Comparative Toxic Unit for ecosystems |
| CTUh | Comparative Toxic Unit for humans |
| DC | Distribution center |
| DQI | Data quality indicator |
| DQR | Data quality rating |
| EoL | End of Life |
| EP | Pallet paper label [kg] |
| EPAL | European Pallet Association |
| EPMC | Euro pallet managing center |
| FG | Factory gate |
| FP | Shrink film for pallets [kg] |
| FU | Functional Unit |
| FWE | Freshwater Eutrophication [kg Pe] |
| FWET | Freshwater Ecotoxicity [CTUe] |
| GeR | Geographical representativeness |
| GHG | Greenhouse Gas |
| ICj | Generic j-th impact category |
| ICNWj | Generic j-th normalized and weighted impact category |
| IPCC | Intergovernmental Panel on Climate Change |
| IR | Ionizing Radiation - Human Health [kBq 235Ue] |
| IT | Washed and cut salad [kg] |
| ITC | Washed and cut salad in cardboard boxes [kg] |
| ITP | Bagged salad on pallets [kg] |
| ITS | Washed and cut salad in bags [kg] |
| LCA | Life-cycle assessment |
| LCI | Life-cycle inventory |
| LCIA | Life-cycle impact assessment |
| LU | Land Use [Pt] |
| MAP | Modified Atmosphere Packaging |
| ME | Marine Eutrophication [kg Ne] |
| MWCS | Municipal waste collection service |
| NC-HT | Human Toxicity, non-carcinogenic [CTUh] |
| NMVOC | Non-Methane Volatile Organic Compounds |
| OD | Stratospheric Ozone Depletion [kg CFC11e] |
| P | Parameter uncertainty/precision |
| PAL | EPAL wooden pallet [kg] |
| PAS | Publicly Available Specification |
| PE | Polyethylene |
| PEF | Product Environmental Footprint [Pt] |
| PFG | Packaging Factory Gate |
| PhOF | Photochemical Ozone Formation [kg NMVOCe] |
| PLA | Polylactic acid |
| PM | Particulate Matter [disease incidence] |
| PoS | Point of Sale |
| PP | Polyethylene |
| PS | Production site |
| P/RM | Packeging-to-raw material ratio [kg/kg] |
| R | Reliability |
| RCC | Paper and cardboard waste [kg] |
| RL | Wood waste [kg] |
| RM | Raw Material |
| RMS | Root mean square method |
| RPL | Plastic waste [kg] |
| RUF | Resource Use – Fossils [MJ] |
| RUMM | Resource Use - Minerals and Metals [kg Sbe] |
| SBAG | Primary package residues |
| SCA | Carton waste [kg] |
| SEP | Pallet label waste [kg] |
| SFP | PE stretch film waste [kg] |
| SIT | Frsh-cut salad waste [kg] |
| SPAL | EPAL wooden pallet waste [kg] |
| SPC | Sandwich bread waste [kg] |
| SPE | PE bag waste [kg] |
| SSC | Scotch tape waste [kg] |
| TE | Terrestrial Eutrophication [mol Ne] |
| TeR | Technological representativeness |
| TiR | Time-related representativeness |
| TR | Transportation |
| ui | Standard uncertainty contribution for each individual life cycle step |
| uT | Overall standard uncertainty |
| WCC | Waste Collection Center |
| WD | Waste disposal |
| WU | Water Scarcity [m3 depriv.] |
| σg | Geometric standard deviation. |
Appendix A. Data Quality and Uncertainty Analysis
A.1. Identification of Significant Data Flows
Based on the process network maps (Figure S4), the primary contributors to the total Environmental Product Footprint (PEF) were identified. In this model, the electric energy for factory-level processing and cold-chain preservation emerged as the dominant driver of the “Salad” node impact, followed by the secondary and primary packaging, transport, and waste disposal (Table A1).

Table A1.
Primary data flow contributions referred to a Functional Unit of 1000 kg of fresh-cut salad packed in PP o bioplastic bags.
Table A1.
Primary data flow contributions referred to a Functional Unit of 1000 kg of fresh-cut salad packed in PP o bioplastic bags.
| Process Item | PP bags (mPt) | Bioplastic bags (mPt) | Data Type |
|---|---|---|---|
| Electricity (Processing/Cold-chain) | 65.08 | 65.08 | Background |
| Primary Packaging (Film) | 15.23 | 22.80 | Foreground |
| Secondary Packaging (Cartons) | 54.54 | 54.59 | Foreground |
| Tertiary Packaging (Pallets) | 3.55 | 3.55 | Foreground |
| Transport | 8.12 | 8.18 | Foreground |
| Waste Disposal | 3.75 | 2.00 | Foreground |
A.2 Pedigree Matrix Scoring
The data quality was assessed using the Pedigree matrix-based method [33], which includes five indicators: Reliability (R), Completeness (C), Time-related representativeness (TiR), Geographical representativeness (GeR), and Technological representativeness (TeR). Each indicator is scored from 1 (excellent) to 5 (poor).
Table A2.
Pedigree Matrix Scoring.
| Data Flow Item | R | Co | TiR | GeR | TeR | Score (DQRi) |
|---|---|---|---|---|---|---|
| Electricity | 3 | 3 | 4 | 2 | 2 | 2.8 |
| Primary Packaging (PP) | 1 | 1 | 2 | 2 | 1 | 1.4 |
| Primary Packaging (BIOPL) | 2 | 2 | 2 | 2 | 2 | 2 |
| Secondary Packaging | 2 | 1 | 2 | 2 | 2 | 1.8 |
| Tertiary Packaging | 2 | 1 | 2 | 2 | 2 | 1.8 |
| Transport | 2 | 1 | 2 | 3 | 2 | 2 |
| Waste Disposal | 2 | 1 | 2 | 2 | 2 | 1.8 |
| Overall DQR (PP bags) | 1.96 | |||||
| Overall DQR (Bioplastic bags) | 2.08 |
As shown in Table A2, the Data Quality Rating for each i-th item (DQRi) was calculated as the arithmetic average of these five scores. The overall DQR for the dataset was then determined by averaging the individual DQRi values. Following the PEF guidelines [17], the dataset is classified based on the following thresholds: Excellent (DQR ≤ 1.6), Very Good (1.6 < DQR < 2.0), Good (2.0 < DQR < 3.0), Fair (3.0 < DQR < 4.0), or Poor (DQR > 4.0). Based on these results, the dataset for the PP bags (1.96) is classified as “Very Good”, while the bioplastic bags (2.08) fall into the “Good” quality category.
A.3 Uncertainty Propagation Methodology
The quantitative uncertainty of the final environmental footprint was estimated through the propagation of geometric standard deviations. To reflect the high reliability of the collected data, the standard uncertainty (ui) for each life cycle step (PEFi) was calculated using refined uncertainty factors:
ui = PEFi (σgi − 1)
Specifically, a factor of 0.10 was assigned to verified primary data (P=2) and 0.20 to high-quality secondary data (P=3). The overall standard uncertainty (uT) for the total PEF was then calculated using the Root Mean Square (RMS) method:
The final uncertainty range is presented as ± (2 × uT), approximating a 95% confidence interval [33]. Table A3 provides Pi scores and resulting uncertainty propagation.
Table A3.
Uncertainty analysis and calculated uT values.
| Scenario | PP bags | Bioplastic bags | ||||
|---|---|---|---|---|---|---|
| Life Cycle Step | PEFi [%] | Pi Score | ui [%] | PEFi [%] | Pi Score | ui [%] |
| Electricity | 43.3 | 3 | 8.66 | 41.7 | 3 | 8.33 |
| Primary Packaging | 10.1 | 2 | 1.01 | 14.6 | 3 | 2.92 |
| Secondary Packaging | 36.3 | 2 | 3.63 | 34.9 | 2 | 3.49 |
| Tertiary Packaging | 2.4 | 2 | 0.24 | 2.3 | 2 | 0.23 |
| Transport | 5.4 | 2 | 0.54 | 5.2 | 2 | 0.52 |
| Waste Disposal | 2.5 | 2 | 0.25 | 1.3 | 2 | 0.13 |
| uT | 9.47 | 9.51 | ||||
Based on the calculated uT values of approximately 9.5%, the dataset is classified as “Excellent” according to the PEF quality thresholds (uT ≤ 10%). This high level of quantitative precision, combined with the “Very Good/Good” qualitative DQR scores, confirms that the life cycle inventory is highly robust and suitable for a rigorous comparative assessment.
References
- Galbo, I. Tutti vogliono l’insalata in busta anche se costa cinque volte quella sfusa. Ecco i numeri. 2025. Available online: https://www.gamberorosso.it/notizie/attualita/tutti-vogliono-linsalata-in-busta-anche-se-costa-cinque-volte-quella-sfusa-ecco-i-numeri/ (accessed on 5 January 2026).
- Busana, C.; Busana, R. IV Gamma, i dati dei primi 5 mesi. L’Insalata dell’Orto: Nel settore nuove priorità. 2025. Available online: https://www.freshcutnews.it/2025/07/11/iv-gamma-i-dati-dei-primi-5-mesi-linsalata-dellorto-nel-settore-nuove-priorita/ (accessed on 5 January 2026).
- Beverfood. Indagine Unione Italiana Food sui prodotti IV Gamma: comodi, sani e sostenibili. 2022. Available online: https://www.beverfood.com/documenti/indagine-unione-italiana-food-sui-prodotti-iv-gamma-comodi-sani-e-sostenibili-wd/ (accessed on 5 January 2026).
- Bulla, M.; Devi, R.; Mishra, A.K.; Kumar, V. Bioplastic for a clean environment. In Bioplastic for a Clean Environment; Mishra, A.K., Hussain, C. M., Eds.; Elsevier: Amsterdam, The Netherlands, 2024; pp. 47–76. [Google Scholar]
- Ghasemlou, M.; Barrow, C.J.; Adhikari, B. The future of bioplastics in food packaging: An industrial perspective. Food Packag. Shelf Life 2024, 43, 101279. [Google Scholar] [CrossRef]
- Jayakumar, A.; Radoor, S.; Siengchin, S.; Shin, G.H.; Kim, J.T. Recent progress of bioplastics in their properties, standards, certifications and regulations: A review. Sci. Total Environ. 2023, 878, 163156. [Google Scholar] [CrossRef] [PubMed]
- Nandakumar, A.; Chuah, J.A.; Sudesh, K. Bioplastics: A boon or bane? Renew. Sustain. Energy Rev. 2021, 147, 111237. [Google Scholar] [CrossRef]
- Bishop, G.; Styles, D.; Lens, P.N.L. Environmental performance comparison of bioplastics and petrochemical plastics: A review of life cycle assessment (LCA) methodological decisions. Resour. Conserv. Recycl. 2021, 168, 105451. [Google Scholar] [CrossRef]
- Lyu, L.; Peng, H.; An, C.; Sun, H.; Yang, X.; Bi, H. An insight into the benefits of substituting polypropylene with biodegradable polylactic acid face masks for combating environmental emissions. Sci. Total Environ. 2023, 905, 167137. [Google Scholar] [CrossRef] [PubMed]
- Chen, G.; Li, J.; Sun, Y.; Wang, Z.; Leeke, G.A.; Moretti, C.; Cheng, Z.; Wang, Y.; Li, N.; Mua, L.; Li, J.; Tao, J.; Yan, B.; Hou, L. Replacing traditional plastics with biodegradable plastics: Impact on carbon emissions. Engineering 2024, 32, 152–162. [Google Scholar] [CrossRef]
- ISO 14040; Environmental Management e Life Cycle Assessment and Principles and Framework. International Organization for Standardization: Genève, Switzerland, 2006.
- Environmental Management—Life Cycle Assessment—Requirements and Guidelines . ISO 14044; International Organization. International Organization for Standardization: Genève, Switzerland, 2006.
- CEN (European Committee for Standardization). EN 13432:2000. Packaging: Requirements for packaging recoverable through composting and biodegradation—Test scheme and evaluation criteria for the final acceptance of packaging; CEN: Brussels, Belgium, 2000. [Google Scholar]
- CEN (European Committee for Standardization). EN 17033:2018. Plastics: biodegradable mulch films for use in agriculture and horticulture—Requirements and test methods; CEN: Brussels, Belgium, 2018. [Google Scholar]
- EcoInvent. System Models. 2024. Available online: https://ecoinvent.org/the-ecoinvent-database/system-models/#!/allocation (accessed on 6 January 2026).
- Fan, Y. V.; Čuček, L.; Krajnc, D.; Klemeš, J. J.; Tin Lee, C. Life cycle assessment of plastic packaging recycling embedded with responsibility distribution as driver for environmental mitigation. Sustainable Chemistry and Pharmacy 2023, 31, 100946. [Google Scholar] [CrossRef]
- European Commission; Joint Research Centre. Product Environmental Footprint (PEF) Guide: Consolidated Version; Institute for Environment and Sustainability (IES): Ispra, Italy, 2012; pp. 37–49. Available online: https://pdf4pro.com/view/product-environmental-footprint-pef-guide-6271fd.html (accessed on 8 January 2026).
- Cimini, A.; Sestili, F.; Moresi, M. Environmental profile of a novel high-amylose bread wheat fresh pasta with low glycemic index. Foods 2022, 11, 3199. [Google Scholar] [CrossRef] [PubMed]
- Manfredi, M.; Vignali, G. Life cycle assessment of a packaged tomato puree: a comparison of environmental impacts produced by different life cycle phases. Journal of Cleaner Production 2014, 73, 275–284. [Google Scholar] [CrossRef]
- Ekvall, T. Attributional and consequential Life Cycle Assessment. In José Bastante-Ceca, M.; Luis Fuentes-Bargues, J.; Hufnagel, L.; Mihai, F.C.; Iatu, C. (ed.s) Sustainability Assessment at the 21st century. IntechOpen; 2020, pp. 1-21. [CrossRef]
- BSI. Publicly Available Specification (PAS 2050) for the assessment of the life cycle greenhouse gas emission of goods and services; British Standards Institution: London, UK, 2011. [Google Scholar]
- Pagani, M.; Vittuari, M.; Falasconi, L. Does packaging matter? Energy consumption of pre-packed salads. British Food Journal 2015, 117, 1961–1980. [Google Scholar] [CrossRef]
- Plazzotta, S.; Manzocco, L.; Nicoli, M.C. Fruit and vegetable waste management and the challenge of fresh-cut salad. Trends in Food Science & Technology 2017, 63, 51–59. [Google Scholar] [CrossRef]
- Waste Watcher Observatory. Waste watcher 2025. 2025. Available online: https://www.sprecozero.it/wp-content/uploads/2025/02/WWI25_4feb_Presentazione_pdf.pdf (accessed on 7 January 2026).
- Italiafruit News. IV gamma e aromi: il mercato, i consumi, le preferenze degli italiani. 2017. Available online: https://www.italiafruit.net/iv-gamma-e-aromi-il-mercato-i-consumi-le-preferenze-degli-italiani (accessed on 13 January 2026).
- Redazione, GL. Spreco alimentare, in Italia si buttano 9 miliardi di euro di cibo ogni anno. 2025. Available online: https://www.ilgiornalelocale.it/2025/02/spreco-alimentare-in-italia-si-gettano-9-miliardi-di-euro-di-cibo-annui/ (accessed on 7 January 2026).
- ALDI. ALDI reveals over half of brits throw away untouched food wasting up to £520 a year. 2025. Available online: https://www.aldipresscentre.co.uk/product-news/aldi-reveals-over-half-of-brits-throw-away-untouched-food-wasting-up-to-520-a-year/ (accessed on 7 January 2026).
- Aterini, L. Rifiuti organici, oltre il 70% degli impianti italiani di gestione lavora in perdita economica . 2025. Available online: https://www.greenreport.it/news/green-economy/4711-rifiuti-organici-oltre-il-70-degli-impianti-italiani-di-gestione-lavora-in-perdita-economica (accessed on 7 January 2026).
- Santini, A.; Fabio Tatti, F. Tasso di riciclaggio dei rifiuti urbani organici; ISPRA: Rome, Italy, 2025; Available online: https://indicatoriambientali.isprambiente.it/it/rifiuti/tasso-di-riciclaggio-dei-rifiuti-urbani-organici (accessed on 7 January 2026).
- Evangelista, R.; Mariotta, C.; Ricciardi, F.; Tuscano, J. Imballaggi e rifiuti di imballaggio. Chp. 4. In Rapporto Rifiuti Urbani. Edizione 2023. Rapporti 393/2023; ISPRA: Rome, Italy, 2023; pp. 189–219. Available online: https://www.isprambiente.gov.it/it/pubblicazioni/rapporti/rapporto-rifiuti-urbani-edizione-2023 (accessed on 7 7 January 2026).
- Pavan, A. La gestione del rifiuto indifferenziato in Italia . 2024. Available online: https://www.consorziosea.it/la-gestione-del-rifiuto-indifferenziato-italia/ (accessed on 7 January 2026).
- Pergolizzi, A. Il tesoro nascosto dei rifiuti organici . 2024. Available online: https://www.rigeneriamoterritorio.it/il-tesoro-nascosto-dei-rifiuti-organici/ (accessed on 7 January 2026).
- Sala, S.; Crenna, E.; Secchi, M.; Pant, R. Global Normalisation Factors for the Environmental Footprint and Life Cycle Assessment; JRC Scientific Report; Publications Office of the European Union: Luxembourg, 2017; Available online: https://op.europa.eu/en/publication-detail/-/publication/3ec9e2cb-f1cc-11e7-9749-01aa75ed71a1/language-en (accessed on 8 January 2026).
- Sala, S.; Cerutti, A.K.; Pant, R. Development of a Weighting Approach for the Environmental Footprint; Publications Office of the European Union: Luxembourg, 2018; Available online: https://op.europa.eu/en/publication-detail/-/publication/6c24e876-4833-11e8-be1d-01aa75ed71a1/language-en (accessed on 8 January 2026).
- Weidema, B.P.; Wesnæs, M.S. Data quality management for life cycle inventories—An example of using data quality indicators. J. Clean. Prod. 1996, 4, 167–174. [Google Scholar] [CrossRef]
- Marson, A.; Piron, M.; Zuliani, F.; Fedele, A.; Manzardo, A. Comparative Life Cycle Assessment in the plastic sector: A systematic literature review. Clean. Environ. Syst. 2023, 9, 100119. [Google Scholar] [CrossRef]
- Van Roijen, E.C.; Miller, S.A. A review of bioplastics at end-of-life: Linking experimental biodegradation studies and life cycle impact assessments. Resour. Conserv. Recycl. 2022, 181, 106236. [Google Scholar] [CrossRef]
- Senila, L.; Kovacs, E.; Resz, M.A.; Senila, M.; Becze, A.; Roman, C. Life Cycle Assessment (LCA) of Bioplastics Production from Lignocellulosic Waste (Study Case: PLA and PHB). Polymers 2024, 16, 3330. [Google Scholar] [CrossRef] [PubMed]
- Vea, E.B.; Fabbri, S.; Spierling, S.; Owsianiak, M. Inclusion of multiple climate tipping as a new impact category in life cycle assessment of polyhydroxyalkanoate (PHA)-based plastics. Sci. Total Environ. 2021, 788, 147544. [Google Scholar] [CrossRef] [PubMed]
- Montalbo-Lomboy, M.; Schrader, J.A.; Grewell, D. Cradle-to-gate life cycle assessment of bioplastic horticulture containers and comparison to standard petroleum-plastic containers. Schrader, J.A., Kratsch, H.A., Graves, W.R., Eds.; In Bioplastic Container Cropping Systems: Green Technology for the Green Industry; Sustainable Hort. Res. Consortium: Ames, IA, USA, 2016; pp. 249–273. [Google Scholar]
- Islam, M.; Xayachak, T.; Haque, N.; Lau, D.; Bhuiyan, M.; Pramanik, B.K. Impact of bioplastics on environment from its production to end-of-life. Process Saf. Environ. Prot. 2024, 188, 151–166. [Google Scholar] [CrossRef]
- Atiwesh, G.; Mikhael, A.; Parrish, C.C.; Banoub, J.; Le, T-A., T. Environmental impact of bioplastic use: A review. Heliyon 2021, 7, e07918. [Google Scholar] [CrossRef] [PubMed]
- Ali, Z.; Abdullah, M.; Yasin, M.T.; Amanat, K.; Ahmad, K.; Ahmed, I.; Qaisrani, M.M.; Khan, J. Organic waste-to-bioplastics: Conversion with eco-friendly technologies and approaches for sustainable environment. Environ. Res. 2024, 244, 117949. [Google Scholar] [CrossRef] [PubMed]
Figure 1.
System boundaries for the LCA study evaluating the environmental impact of a 100-g bag of fresh-cut salad leaves. DC: Distribution Center; PoS: Point of Sale.
Figure 1.
System boundaries for the LCA study evaluating the environmental impact of a 100-g bag of fresh-cut salad leaves. DC: Distribution Center; PoS: Point of Sale.
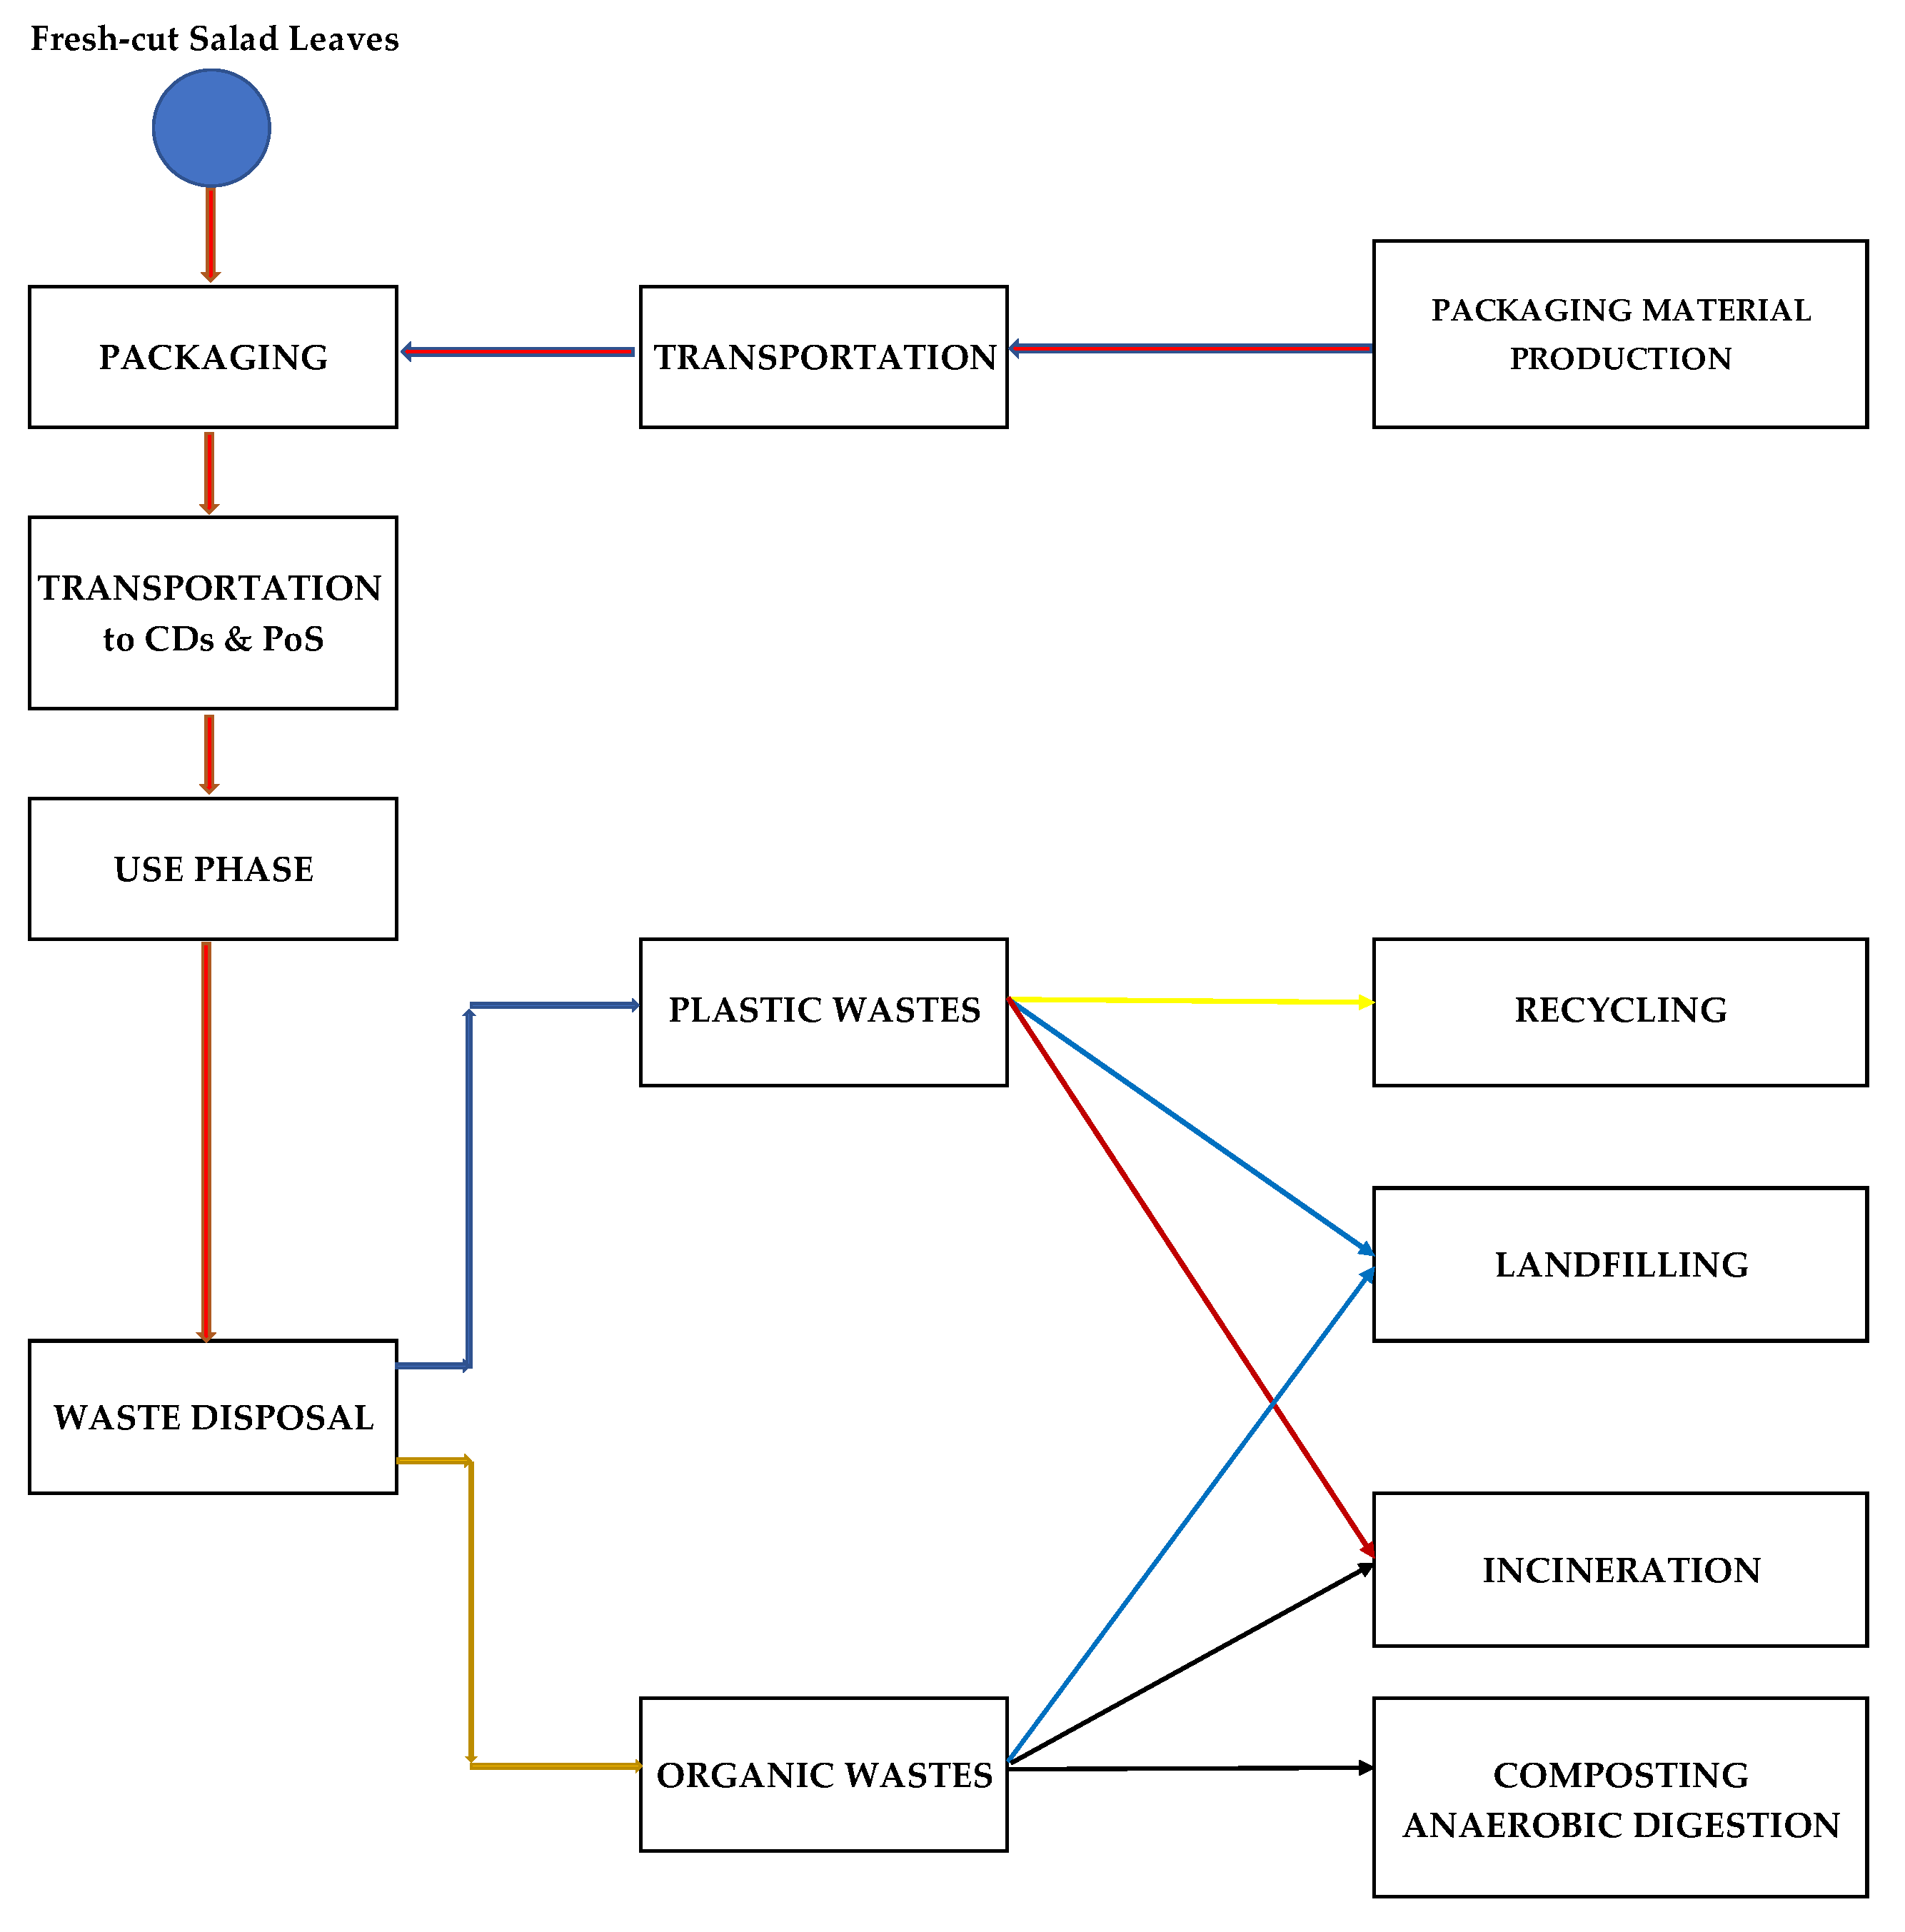
Figure 2.
Flowchart of the primary, secondary, and tertiary packaging processes for fresh-cut salad and associated waste management. Refer to the Nomenclature for symbols. The dashed line indicates that bag waste is sorted as either plastic or compostable waste, depending on whether it is derived from polypropylene (PP) or bioplastic film.
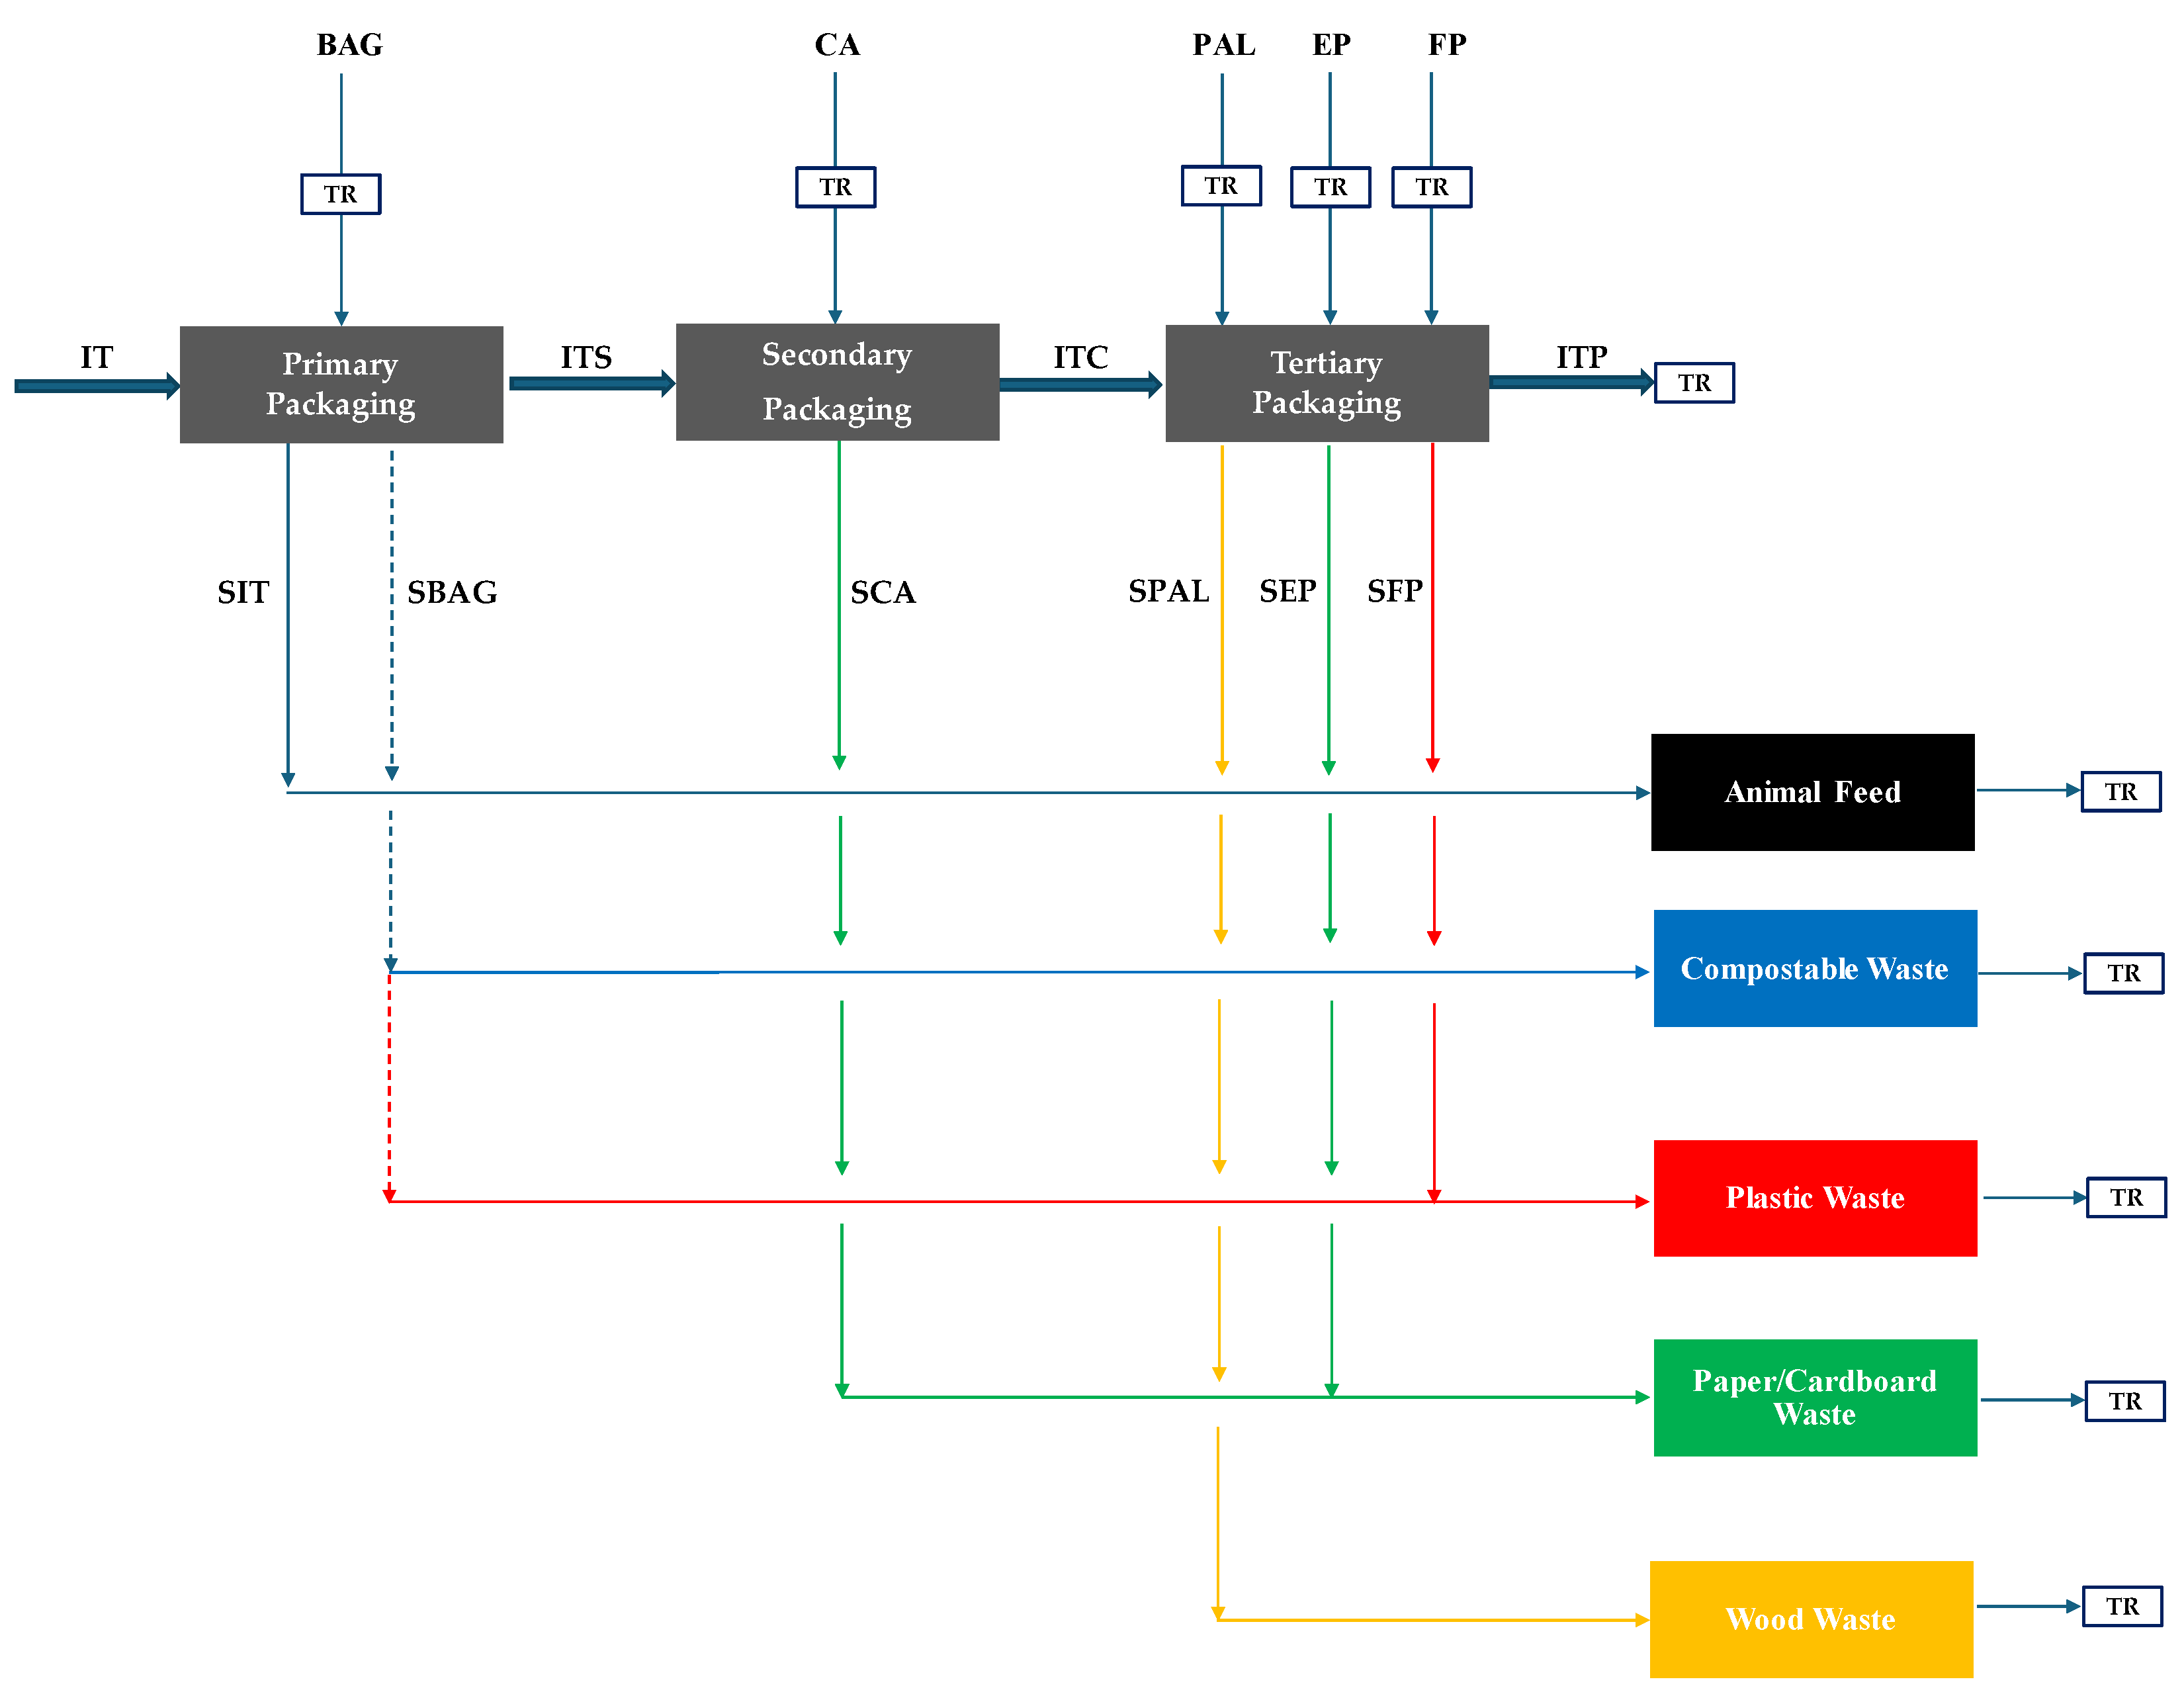
Table 1.
Inbound/Outbound logistics via EURO 6 road vehicles: transport routes, vehicle types, load capacity, distances for supply chain materials, and data sources.
Table 1.
Inbound/Outbound logistics via EURO 6 road vehicles: transport routes, vehicle types, load capacity, distances for supply chain materials, and data sources.
| Materials | Route Segment | Vehicle Type | Capacity [Mg] | Distance [km] | Data Source |
|---|---|---|---|---|---|
| Raw packaging materials | PS→PFG | Articulated truck | 16-32 | 250 | Assumption |
| Plastic/bioplastic film | PFG→FG | Heavy rigid truck | 7.5–16 | 300 | Company |
| Cardboard, labels | PFG→FG | Heavy rigid truck | 7.5–16 | 50 | Company |
| Pallets | EPMC→FG | Heavy rigid truck | 7.5–16 | 50 | Company |
| Pallets (Returns) | DC→EPMC | Heavy rigid truck | 7.5–16 | 200 | Company |
| Palletized salad | FG→DC | Articulated (Refr.) truck | 16–32 | 150 (45–300) | Company |
| Salad in cardboard boxes | DC→PoS | Light truck | 3.5–7.5 | 50 | Company |
| Waste (organic & packaging) | FG, CH→WCC | Heavy rigid truck | 7.5–16 | 50 | Company |
| Salad scraps | FG → CaF | Heavy rigid truck | 7.5–16 | 5 | Company |
CaF – Local Farm (Buffalo); CH - Consumer Homes; DC - Distribution Center; EPMC - EPAL Wood Pallet Management Center; FG - Factory Gate; PFG - Packaging Factory Gate; PoS - Points of Sale; PS – Production site; WCC - Waste Collection Center.
Table 2.
Environmental profiles for the production of 1 kg of PP or PLA film according to the standard PEF method: mean value and standard deviation for each environmental impact category (ICj).
Table 2.
Environmental profiles for the production of 1 kg of PP or PLA film according to the standard PEF method: mean value and standard deviation for each environmental impact category (ICj).
| ICj \ Film | PP | INZEA®® FH05 | UdM | ||||
|---|---|---|---|---|---|---|---|
| CC | 3.75×100 | ± | 5.78 × 10⁻² | 4.05 × 100 | ± | 1.99 × 10⁻¹ | kg CO2e |
| OD | 1.96 × 10⁻⁸ | ± | 1.77 × 10⁻¹⁰ | 7.90 × 10⁻⁸ | ± | 4.78 × 10⁻⁹ | kg CFC11e |
| IR | 1.63 × 10⁻¹ | ± | 1.47 × 10⁻³ | 3.66 × 10⁻¹ | ± | 1.68 × 10⁻² | kBq235Ue |
| PhOF | 1.23 × 10⁻² | ± | 1.66 × 10⁻⁴ | 1.63 × 10⁻² | ± | 8.17 × 10⁻⁴ | kg NMVOCe |
| PM | 1.88 × 10⁻⁷ | ± | 3.75 × 10⁻⁹ | 2.25 × 10⁻⁷ | ± | 1.05 × 10⁻⁸ | disease inc. |
| AC | 1.43 × 10⁻² | ± | 1.45 × 10⁻⁴ | 2.44 × 10⁻² | ± | 1.22 × 10⁻³ | mol H+e |
| FWE | 7.21 × 10⁻⁴ | ± | 6.50 × 10⁻⁶ | 1.49 × 10⁻³ | ± | 7.08 × 10⁻⁵ | kg Pe |
| ME | 2.87 × 10⁻³ | ± | 3.34 × 10⁻⁵ | 8.23 × 10⁻³ | ± | 4.49 × 10⁻⁴ | kg Ne |
| TE | 2.99 × 10⁻² | ± | 3.52 × 10⁻⁴ | 6.90 × 10⁻² | ± | 3.61 × 10⁻³ | mol Ne |
| ETFW | 1.21 × 101 | ± | 2.75 × 10⁻¹ | 5.27 × 101 | ± | 2.88 × 100 | CTUe |
| C-HT | 3.06 × 10⁻⁹ | ± | 1.47 × 10⁻¹⁰ | 1.97 × 10⁻⁹ | ± | 8.97 × 10⁻¹¹ | CTUh |
| NC-HT | 2.75 × 10⁻⁸ | ± | 5.67 ×10⁻¹⁰ | 4.85 × 10⁻⁸ | ± | 2.54 ×10⁻⁹ | CTUh |
| LU | 1.36 ×101 | ± | 1.22 × 10⁻¹ | 4.63 × 101 | ± | 2.21 × 100 | Pt |
| WU | 1.36 × 100 | ± | 1.23 × 10⁻² | 5.25 × 100 | ± | 2.49 × 10⁻¹ | m3 depriv. |
| RUF | 9.64 × 101 | ± | 8.69 × 10⁻¹ | 6.12 × 101 | ± | 3.34 × 100 | MJ |
| RUMM | 1.16 × 10⁻⁵ | ± | 1.04 × 10⁻⁷ | 2.49 × 10⁻⁵ | ± | 1.36 × 10⁻⁶ | kg Sbe |
Table 3.
Mean values and standard deviations of the 16 normalized and weighted impact categories (ICNWj) and the overall weighted score (PEF) for 1 kg of PP or INZEA®® FH05 film according to the standard PEF method.
Table 3.
Mean values and standard deviations of the 16 normalized and weighted impact categories (ICNWj) and the overall weighted score (PEF) for 1 kg of PP or INZEA®® FH05 film according to the standard PEF method.
| Film | PP | INZEA®® FH05 | ||
|---|---|---|---|---|
| ICNWj [μPt] | m ± sd | % | m ± sd | % |
| CC | 104.6 ± 1.6 | 30.0 | 113.0 ± 5.6 | 26.3 |
| OD | 0.024 ± 0.02 | 0.01 | 0.10 ± 0.01 | 0.02 |
| IR | 1.94 ± 0.02 | 0.6 | 4.3 ± 0.2 | 1.0 |
| PhOF | 14.4 ± 0.2 | 4.1 | 19.0 ± 1.0 | 4.4 |
| PM | 28.2 ± 0.6 | 8.1 | 33.8 ± 1.6 | 7.9 |
| AC | 15.9 ± 0.2 | 4.6 | 27.3 ± 1.4 | 6.4 |
| FWE | 12.6 ± 0.1 | 3.6 | 26.0 ± 1.2 | 6.1 |
| ME | 4.4 ± 0.1 | 1.2 | 12.5 ± 0.7 | 2.9 |
| TE | 6.3 ± 0.1 | 1.8 | 14.5 ± 0.8 | 3.4 |
| FWET | 4.1 ± 0.1 | 1.2 | 17.8 ± 1.0 | 4.2 |
| C-HT | 3.8 ± 0.2 | 1.1 | 2.4 ± 0.1 | 0.6 |
| NC-HT | 3.9 ± 0.1 | 1.1 | 6.9 ± 0.4 | 1.6 |
| LU | 1.31 ± 0.01 | 0.4 | 4.5 ± 0.2 | 1.0 |
| WU | 10.1 ± 0.1 | 2.9 | 39.0 ± 1.8 | 9.1 |
| RUF | 123.3 ± 1.1 | 35.4 | 78.4 ± 4.3 | 18.3 |
| RUMM | 13.7 ± 0.1 | 3.9 | 29.5 ± 1.6 | 6.9 |
| PEF | 349 ± 4 | 100.0 | 429 ± 21 | 100.0 |
Table 4.
Mass balance of discarded packaging materials for the two different bags (PP and INZEA®® FH05) during the packaging of 1,000 kg of washed and cut salad (RM), including packaging and overall waste, and the packaging-to-raw-material ratio (P/RM).
Table 4.
Mass balance of discarded packaging materials for the two different bags (PP and INZEA®® FH05) during the packaging of 1,000 kg of washed and cut salad (RM), including packaging and overall waste, and the packaging-to-raw-material ratio (P/RM).
| Parameters | PP bags | INZEA®® FH05 bags | Unit |
|---|---|---|---|
| Fresh-cut Salad (Initial RM) | 1000 | 1000 | kg |
| Wood Waste | 0.69 | 0.69 | kg |
| Paper and Cardboard Waste | 319.11 | 319.11 | kg |
| Plastic Waste | 67.73 | 14.24 | kg |
| Salad Scraps (Cattle feed) | 50.0 | 50.0 | kg |
| Organic Waste (Bioplastic) | 0 | 61.56 | kg |
| Total Packaging Waste | 387.54 | 395.60 | kg |
| Total Waste | 437.54 | 445.60 | kg |
| Packaging/Raw Material Ratio (P/RM) | 0.388 | 0.396 | kg/kg |
Table 5.
Environmental profiles for 1,000 kg of washed and cut salad packaged in two different bag types (PP and INZEA®® FH05) according to the standard PEF method: mean value and standard deviation for each environmental impact category (ICj).
Table 5.
Environmental profiles for 1,000 kg of washed and cut salad packaged in two different bag types (PP and INZEA®® FH05) according to the standard PEF method: mean value and standard deviation for each environmental impact category (ICj).
| ICj | Unit | PP bags | INZEA®® FH05 bags | ||||
|---|---|---|---|---|---|---|---|
| CC | kg CO2e | 1.63 × 10³ | ± | 1.90 × 10² | 1.63 × 10³ | ± | 1.84 × 10² |
| OD | kg CFC11e | 2.58 × 10⁻⁵ | ± | 4.32 × 10⁻⁶ | 2.94 × 10⁻⁵ | ± | 4.23 × 10⁻⁶ |
| IR | kBq235Ue | 1.58 × 10² | ± | 2.40 × 101 | 1.72 × 10² | ± | 2.32 × 101 |
| PhOF | kg NMVOCe | 4.92 × 100 | ± | 5.64 × 10⁻¹ | 5.23 × 100 | ± | 5.48 × 10⁻¹ |
| PM | disease inc. | 7.10 × 10⁻⁵ | ± | 3.87 × 10⁻⁶ | 7.57 × 10⁻⁵ | ± | 3.83 × 10⁻⁶ |
| AC | mol H+e | 5.58 × 100 | ± | 6.75 × 10⁻¹ | 6.55 × 100 | ± | 6.66 × 10⁻¹ |
| FWE | kg Pe | 2.00 × 10⁻¹ | ± | 2.94 × 10⁻² | 2.45 × 10⁻¹ | ± | 2.89 × 10⁻² |
| ME | kg Ne | 1.71 × 100 | ± | 1.23 × 10⁻¹ | 1.99 × 100 | ± | 1.20 × 10⁻¹ |
| TE | mol Ne | 1.31 × 101 | ± | 1.34 × 100 | 1.68 × 101 | ± | 1.39 × 100 |
| ETFW | CTUe | 5.60 × 10³ | ± | 4.97 × 10² | 8.84 × 10³ | ± | 6.41 × 10² |
| C-HT | CTUh | 5.26 × 10⁻⁷ | ± | 5.14 × 10⁻⁸ | 5.34 × 10⁻⁷ | ± | 5.14 × 10⁻⁸ |
| NC-HT | CTUh | 9.16 × 10⁻⁶ | ± | 9.45 × 10⁻⁷ | 1.03 × 10⁻⁵ | ± | 9.28 × 10⁻⁷ |
| LU | Pt | 8.78 × 10³ | ± | 5.23 × 10² | 1.08 × 10⁴ | ± | 5.29 × 10² |
| WU | m3 depriv. | 4.24 × 10³ | ± | 1.82 × 10² | 4.46 × 10³ | ± | 1.77 × 10² |
| RUF | MJ | 2.60 × 10⁴ | ± | 2.94 × 10³ | 2.48 × 10⁴ | ± | 2.85 × 10³ |
| RUMM | kg Sbe | 2.78 × 10⁻³ | ± | 3.40 × 10⁻⁴ | 3.62 × 10⁻³ | ± | 3.44 × 10⁻⁴ |
Table 6.
Mean values and standard deviations of the 16 normalized and weighted impact categories (ICNWj) and the overall weighted score (PEF) for 1,000 kg of washed and cut salad packaged in two different bag types according to the standard PEF method.
Table 6.
Mean values and standard deviations of the 16 normalized and weighted impact categories (ICNWj) and the overall weighted score (PEF) for 1,000 kg of washed and cut salad packaged in two different bag types according to the standard PEF method.
| ICNWj | PP bags | INZEA®® FH05 bags | ||
|---|---|---|---|---|
| [mPt] | mean ± sd | % | mean ± sd | % |
| CC | 45.4 ± 5.3 | 29.9 ± 3.5 | 44.7 ± 5.1 | 28.3 ± 3.2 |
| OD | 0.03 ± 0.01 | 0.021 ± 0.003 | 0.04 ± 0.01 | 0.022 ± 0.003 |
| IR | 1.9 ± 0.3 | 1.2 ± 0.2 | 2.0 ± 0.3 | 1.3 ± 0.2 |
| PhOF | 5.8 ± 0.7 | 3.8 ± 0.4 | 6.1 ± 0.6 | 3.9 ± 0.4 |
| PM | 10.7 ± 0.6 | 7.0 ± 0.4 | 11.4 ± 0.6 | 7.2 ± 0.4 |
| AC | 6.2 ± 0.8 | 4.1 ± 0.5 | 7.3 ± 0.7 | 4.6 ± 0.5 |
| FWE | 3.5 ± 0.5 | 2.3 ± 0.3 | 4.3 ± 0.5 | 2.7 ± 0.3 |
| ME | 2.6 ± 0.2 | 1.7 ± 0.1 | 3.0 ± 0.2 | 1.9 ± 0.1 |
| TE | 2.8 ± 0.3 | 1.8 ± 0.2 | 3.5 ± 0.3 | 2.2 ± 0.2 |
| FWET | 1.9 ± 0.2 | 1.3 ± 0.1 | 3.0 ± 0.2 | 1.9 ± 0.1 |
| C-HT | 0.6 ± 0.1 | 0.43 ± 0.04 | 0.7 ± 0.1 | 0.42 ±0.04 |
| NC-HT | 1.3 ± 0.1 | 0.9 ± 0.1 | 1.5 ± 0.1 | 0.9 ± 0.1 |
| LU | 0.9 ± 0.1 | 0.56 ± 0.03 | 1.0 ± 0.1 | 0.66 ± 0.03 |
| WU | 31.5 ± 1.4 | 20.8 ± 0.9 | 33.1 ± 1.3 | 21.0 ± 0.8 |
| RUF | 33.3 ± 3.8 | 21.9 ± 2.5 | 31.8 ± 3.6 | 20.1 ± 2.3 |
| RUMM | 3.3 ± 0.4 | 2.2 ± 0.3 | 4.3 ± 0.4 | 2.7 ± 0.3 |
| PEF | 152 ± 14 | 100 ± 9 | 158 ± 14 | 100 ± 9 |
Disclaimer/Publisher’s Note: The statements, opinions and data contained in all publications are solely those of the individual author(s) and contributor(s) and not of MDPI and/or the editor(s). MDPI and/or the editor(s) disclaim responsibility for any injury to people or property resulting from any ideas, methods, instructions or products referred to in the content. |
© 2026 by the authors. Licensee MDPI, Basel, Switzerland. This article is an open access article distributed under the terms and conditions of the Creative Commons Attribution (CC BY) license (http://creativecommons.org/licenses/by/4.0/).
Copyright: This open access article is published under a Creative Commons CC BY 4.0 license, which permit the free download, distribution, and reuse, provided that the author and preprint are cited in any reuse.


