
Submitted:
19 January 2026
Posted:
20 January 2026
You are already at the latest version
Abstract
We reviewed the recent fire regimes in the semi-arid savannas of Etosha National Park and adjacent areas in northern Namibia using MODIS satellite imagery from 2001 – 2025 across gradients of mean annual rainfall (200 – 500 mm), land ownership, and vegetation types. Fires were highly seasonal, concentrated in the two driest months of the year (September and October). The average fire return period over 25 years was 6.9 years in Etosha National Park, but more than four times greater (31.8 years) on adjacent freehold farms. The proportion of the area burned annually ranged from zero to over 30% and the fire regime was dominated by a few episodic but extreme fire events. Some findings were counter-intuitive in that certain vegetation types in areas of low mean annual rainfall (< 300 mm) burned frequently (fire return period 4.3 years) while others experienced infrequent fires (fire return periods 34 – 206 years) in higher rainfall areas (> 400 mm). Current fire management practices have attempted to reconstruct natural fire regimes and are not based on ecological understanding, and further research, based on monitoring of dynamic interactions between rainfall, fuel accumulation, levels of herbivory and the extent of fires are needed to explain these findings.
Keywords:
Southern Africa
; Mopani woodlands
; arid savanna
; fire management
; fire seasonality
; fire frequency
; fire return interval
1. Introduction
Fires are a common feature across a large proportion of sub-Saharan Africa [1]. In African savannas, the area that burns is highly dependent on grass production, which in turn depends on the amount of rainfall over the preceding wet seasons [2,3]. Climate also influences fire regimes, with fire return periods increasing as mean annual rainfall declines. Fire is widely used in the management of savanna protected areas in Africa, where a recent review identified 15 distinct fire management practices that were used to achieve a range of ecological and social goals [4]. The review also concluded that there was still little consensus on a broad fire management approach that would adequately cater for a wide variety of ecological and social conditions, and that this frequently left managers without clear guidelines for implementing appropriate fire regimes.
A management policy that specifically forbade the use of fire for managing the natural vegetation the Etosha National Park in northern Namibia was adopted in 1970 [5]. It was only in 1981 that fire was recognised as ecologically important, and the park adopted a burning strategy that attempted to simulate the incidence of lightning fires [6], based on seasonal rainfall and the post-fire age of the vegetation. Under this system, areas were selected for prescribed burning in the late dry season (September to October) if the preceding wet season’s rainfall was higher than the 20-year running mean, and priority was given to areas with the greatest post-fire age. The system was later refined to include additional criteria, in which areas initially identified as suitable for burning were excluded if grass fuel loads were low (< 2000 kg/ha) and if < 20% of the grass sward was moribund [7]. The occurrence of large wildfires in 2009 and 2011 precipitated an abrupt change in Etosha’s fire management policy in 2012. This involved a shift in the season of prescribed burns to the early dry season (May to July) when fires would be less intense and more fragmented. Despite the intent to manage fires in this way, the implementation of this policy has been hampered by funding constraints, a lack of capacity, and a shortage of experienced staff [8]. The implementation of early dry season burns in Etosha has also proven difficult because of a lack of clear guidelines, varied fire suppression policies in the areas surrounding Etosha, and difficulties in changing negative perceptions of fire [9].
Almost all commercial framers and other landowners to the south of Etosha National Park do not use fire as a management practice [10]. When unplanned wildfires occur, vigorous attempts are typically made to extinguish or contain them, and this is often achieved through the collaborative efforts of neighbours [10]. In these areas, fires are not considered in terms of any ecological role that they may play, as the major goal is to prevent the widespread loss of grazing.
In this paper, we review the recent fire regimes of the Etosha National Park and bordering farms to the south of the park, and examine the variation in these regimes across land uses, broad vegetation types, and a gradient of mean annual rainfall. Based on our findings, we also discuss possible approaches to fire management that would be appropriate for achieving conservation goals.
2. Materials and Methods
2.1. Study Area
The Etosha National Park (approximately 22 800 km2) is situated in northern Namibia (centred on 19°02’S and 16°28’E; Figure 1). A large proportion of the park is occupied by the Etosha Pan, a dry salt pan that covers 4730 km2. The climate is semi-arid with an average temperature of 22.1oC. Mean annual rainfall ranges from around 250 mm in the west to 450 mm in the east. Precipitation occurs mainly during the summer months, with > 98% falling in the months from November to April. The mean elevation of Etosha National Park is 1129 m above sea level. Mendelsohn et al. [11] included eight vegetation types in the study area. These were (in order of area occupied): karstveld mixed woodlands on mollic leptosols; pans, which are extensive, but essentially do not support much vegetation or fires, and were excluded from our analysis; western Kalahari broadleaved woodlands on ferralic arenosols; mopane shrublands on ferralic arenosols, dominated by Colophospermum mopane trees, Figure 2; Etosha grass and dwarf shrublands on calcaric regosols; north-eastern Kalahari broadleaved woodlands on ferralic arenosols; the western highlands which support grasslands and scattered trees; and Cuvelai drainage floodplain grasslands and woodlands. Large herbivorous mammals are found throughout the area, and include browsers (e.g., black rhinoceros, Diceros bicornis; giraffes, Giraffa camelopardalis; and kudu, Tragelaphus strepciceros), grazers (e.g., white rhinoceros, Ceratotherium simum; plains zebras, Equus quagga; mountain zebras, Equus zebra; blue wildebeest, Connochaetes taurinus; and gemsbok Oryx gazella); and mixed feeders (e.g., African elephants, Loxodonta africana; black-faced impala, Aepyceros melampus petersi; and springbuck, Antidorcas marsupialis). Termites, notably in the genus Macrotermes, are important consumers of above-ground plant material. The Etosha National Park is a popular destination for international tourists, making an important contribution to the Namibian economy [12].
Our study included the Etosha National Park and a 30 km buffer to the south of the park. For the purposes of assessing fire regimes, we excluded the Etosha Pan and other large pans from all analyses. Land to the south of Etosha National Park is divided into farms of between 5000 – 10 000 ha, with both private and communal ownership. This land is utilised for various purposes, including raising commercial livestock, game farming and hunting, and conservation. Charcoal production using Colophospermum mopane and other tree species in the genera Terminalia, Vachellia and Senegalia is a common form of land use, and charcoal kilns often provide a source of ignition for bushfires. Land parcels are typically fenced, often restricting the movement of wildlife across the landscape. For this analysis, we recognised two land use categories in the buffer area. The first was land in private ownership, utilised for livestock farming, hunting, tourism or conservation purposes. The second was resettlement areas, which provide land access to marginalized indigenous groups to build livelihoods and address historical land inequalities, and allow for communal management for a range of purposes [13].
2.2. Baseline Data
The area burned between 1 January 2001 to 31 October 2025 was obtained from the MODIS MCD64A1 Version 6 burnt area product, which differentiates burned and unburned surfaces at a resolution of ± 500 × 500 m [14], and records the dates on which the relevant pixels burned. The area burned was extracted for each month individually, and for each calendar year (a “fire year”, Figure 3). Rainfall data were sourced from the Climate Hazards Center Infrared Precipitation (CHIRPS v3) product available on Google Earth Engine [15]. CHIRPS incorporates 0.05° (5 km) resolution satellite imagery with in-situ station data to create a gridded rainfall time series [16]. We used these data to divide the study area into bands spanning 50 mm of mean annual rainfall from 200 to 500 mm (Figure 1). Rainfall data were summed for each year from 1 July to end of June of the following year so that the rainfall totals included the full wet season which extends across two calendar years from November to April (a “rainfall year”, Figure 3). This allowed us to examine the relationship between rainfall in a rainfall year, and area burnt in the following fire year. We examined fire frequency and seasonality (see below) for the entire study area, as well as for different categories of land. These categories included the area within the Etosha National Park, privately-owned land and resettlement areas in the buffer zone, the area within each vegetation type, and the area in different rainfall categories separately.
2.3. Fire Regime Analysis
The mean fire return period for each vegetation type, land use category, and mean annual rainfall category was estimated as RP = y/(b/a), where RP is the return period in years, y is the number of years over which fires were recorded, b is the extent of all fires recorded over y years, and a is the area over which fires were recorded. Fire seasonality was estimated from the total area burned each month, for all fires on record. The relationship between the area burned each year and the rainfall in the preceding wet season for the Etosha National Park was estimated by comparing the area burnt in each calendar year with the rainfall year over the preceding season (e.g., the area burnt in 2001 was compared to rainfall between 1 July 2000 and 30 June 2001, Figure 3). Burned area or CHIRPS rainfall pixels were included into different vegetation types, land tenure classes, burned area categories, or rainfall zones when the pixel centroids were located within the boundaries of the overlaying mapped polygons.
We constructed survival curves (i.e., the likelihood that a given pixel would burn again within a given time after a previous fire) for different vegetation types, using Kaplan–Meier survival analysis [17,18] implemented in the R package survival [19]. Annual burned-area raster layers were overlaid on a systematic 1 km2 grid of 24 860 sampling points to construct fire histories for each point. For every observed fire at a point, the time-to-event (duration) was calculated as the number of years from that fire until either the next fire (uncensored event = 1) or the end of the observation period in 2025 (right-censored event = 0). Points that never experienced fire during the 25-year period contributed no episodes and were excluded from the survival analysis. Kaplan–Meier curves were produced for (i) the land tenure classes (freehold and resettlement areas combined), (ii) each vegetation type and (iii) rainfall class, respectively, showing the cumulative probability of fire reoccurrence as a function of years since the previous fire.
To examine the relationship between seasonal rainfall and annual area burned in Etosha National Park and adjacent farmland, we conducted separate Pearson correlation analyses for each tenure class using rainfall data in each rainfall year and burned area in the corresponding following fire year (Figure 3). To account for potential carry-over effects of fuel from preceding rainfall, we correlated burned area with rainfall from the two earlier successive rainfall years separately, and as a mean over two years. Significant correlations (P < 0.05) were further examined by simple linear regressions. A multiple linear regression was used to assess the combined influences of two successive rainfall years on burned area.
To assess whether fire seasonality differed between tenure classes, monthly burned area was standardised by expressing each month as a proportion of the annual burned area within each zone and year. This removed absolute differences in burned area and allowed comparison of seasonal distribution patterns. Monthly proportional distributions between Etosha National Park and adjacent farmland were compared using the non-parametric two-sample Kolmogorov–Smirnov tests. Tests were conducted separately for each month, and p-values were adjusted for multiple comparisons using the Holm correction.
All statistical analyses were conducted in R (version 4.5.0; R Core Team).
3. Results
The mean fire return interval in the Etosha National Park was 6.9 years but was almost 2.5 times as long in the resettlement areas and more than four times as long on freehold farms and reserves south of the park (Table 1; Figure 4). The fire return periods for most vegetation types ranged between 4.3 and 13.5 years but were substantially longer for Cuvelai drainage floodplains (34 years), western highlands (37.1 years) and north-eastern Kalahari broadleaved woodlands (206.9 years). Where mean annual rainfall was between 250 and 500 mm, fire return periods ranged from 7.5 to 10.2 years. In areas of very low rainfall (<250 mm) the mean fire return period was substantially longer (48.2 years).
Fire survival curves indicate that 50% of the area covered by three vegetation types (Karstveld, Mopane shrublands, and western Kalahari woodlands) would experience a successive fire within five years of a previous fire (Figure 5), while in Etosha grass and dwarf shrublands it took more than 10 years on average for half of the area to burn again. In the north-eastern Kalahari woodlands, and western highlands, fires were rare, and it took more than 15 years for around 20% of the area to burn again, while most of the area that burned once did not experience a subsequent fire in the 25 years examined here. Land tenure also had a marked effect, with 50% of the land in Etosha National Park burning again within 4 years of a previous fire, compared to 10 years in freehold and resettlement farms (Figure 5). Mean annual rainfall had less effect on the shape of fire survival curves, with 50% of the land in most rainfall classes experiencing a subsequent fire within 4 to 7 years. This increased markedly to 15 years when the mean annual rainfall was below 250 mm (Figure 6).
Fires occurred predominantly in the late dry season in September and October. Fires in these two months accounted for 71.2% in Etosha National Park and 66.3% in the adjacent farming land of all fires recorded between 2001 and 2025; no fires were recorded in February and March (Figure 7). Monthly burned area during the 25-year period was dominated by episodic extreme fire events, resulting in a right-skewed distribution where monthly means greatly exceeded medians. When monthly burned area was expressed as a proportion of the annual total, the seasonal distribution of fires did not differ between the Etosha National Park and the buffer area to the south of the park (two-sample Kolmogorov–Smirnov tests with Holm correction, p > 0.05), although a smaller proportion of the area burned annually outside of the park (on average 14.6% in Etosha National Park vs 3.8% outside of the park).
The total rainfall recorded in individual rainfall years between 2001 and 2025 ranged between 119 and 711 mm in Etosha and 122 and 747 mm in the adjacent areas. In Etosha National Park, burned area was positively correlated with mean rainfall in the preceding rainfall year (Pearson’s r = 0.67, p < 0.001, Figure 8). A linear regression indicated that approximately 44% of the variation in annual burned area was explained by rainfall in the preceding rainfall year, while rainfall in the rainfall year preceding that showed no correlation with burned area in Etosha (r = 0.24, p > 0.05, Figure 8). In the multiple regression model (Adjusted R2 =0.39, F2,22 = 8.8, P < 0.01), preceding rainfall over two years was also not an important predictor (β = 0.11, P > 0.05), whereas most of the variation in burned area extent was explained by current rainfall year (β = 13.7, P < 0.001). Burned area was minimal when rainfall in the preceding rainfall year was below 200 mm.
On the freehold and resettlement land, neither current rainfall, preceding rainfall nor the mean of these two rainfall years were correlated with burned area year (P > 0.05, Figure 9), suggesting that inter-annual variation in rainfall does not strongly influence fire extent in this intensively managed landscape.
Burned area during the 25-year period was dominated by episodic extreme fire events. The average area burned per year in the Etosha National Park was 2583 km2 (Figure 10), but in 12 of the 25 years the area burned was below 1000 km2 (average 216 km2, or 1.2% of the area of the park), and in 10 out of 25 years fires did not occur or burned < 3% of the park. On the other hand, large fires exceeding 7000 km2 occurred in only six years, and averaged 7817 km2, or 44% of the park.
4. Discussion
4.1. Differences in Fire Return Intervals
We found a greater than four-fold difference in fire return intervals between Etosha National Park (6.9 years) and farmed land to the south of the park (31.8 years). This is most likely due to a reluctance to use fire as a management practice on these farms, as well as to effective collaborative efforts to contain or extinguish any fires that occurred [10]. Research into the effects of fire at an arid location in central Namibia (361 mm mean annual rainfall) found that seedling and sapling mortality was higher in burnt areas compared to unburnt areas [20]. The authors concluded from this that fire would interrupt the transition from open grassy savanna to thicket in arid savannas and suggested that farmers who prevent fires are likely to experience encroachment by woody shrubs and trees in future. This essentially suggest that farmers are trading short-term gains (loss of grazing to fire) for long-term losses (loss of grazing to woody encroachment).
Some vegetation types also experienced markedly longer fire return intervals than others. The western highland grass and shrublands areas (fire return period 37.1 years) are situated in the far west of Etosha National Park where mean annual rainfall is low (200 – 300 mm), and fires are presumably fuel-limited. The western Kalahari, on the other hand, experienced regular fires (fire return period 4.3 years) despite low mean annual rainfall (< 300 mm). The Cuvelai drainage floodplains (fire return period 34 years) occupy a very small proportion of the Etosha National Park (0.22%) north of the Etosha Pan (Figure 1). These areas would presumably be more heavily grazed due to their location along drainage lines, reducing above-ground biomass (fuels) and preventing frequent fires. The north-eastern Kalahari broadleaved woodlands experienced a remarkably long average fire return interval (206.9 years). This vegetation type occurs at the eastern end of the Etosha National Park, which receives a relatively high mean annual rainfall (400 mm). The reasons for the paucity of fires in the north-eastern Kalahari broadleaved woodlands are not fully understood but could be related to high levels of grazing which removes fuels. Research in African savannas elsewhere has demonstrated that a high biomass of grazing mammals led to a significantly lower extent of fires, and that this effect was most marked in arid or semi-arid areas (~ 450 mm/yr) [21].
4.2. Priorities for Research
A robust understanding of fire regimes and their determinants, and the effects of manipulating elements of the fire regime on the recipient ecosystems, is needed to underpin evidence-based fire management. Managers of fire-prone ecosystems need to know whether they should burn, where and when they should burn, and how often they should burn. Our study has provided baseline information on the fire regimes of the Etosha ecosystem, which can be used to set initial targets for management, but several important questions remain. All fire management policies that have been adopted in the Etosha region over the past decades (outlined in section 1 above) have not had a basis in ecological understanding but have rather sought to introduce fire patterns that were assumed to be natural and therefore desirable. Ecological research is necessary to test these assumptions.
Some vegetation and land tenure types examined here experienced unexpectedly low fire frequencies, while others had unexpectedly high fire frequencies. The dynamics of rainfall cycles, levels of herbivory, and their effects on fuels are not well understood at present, especially in arid African savannas. There are very few African savanna areas where a reasonably sound research-based understanding of fire ecology and management has been developed, and these all receive higher rainfall than the arid and semi-arid vegetation of Etosha (250 – 450 mm), e.g., the Kruger (400 – 800 mm) and Hluhluwe-iMfolozi (550 – 1000 mm) parks in South Africa, and the Serengeti in Tanzania (800 – 1200 mm) [22,23,24]. Several issues deserve attention if our understanding of the determinants and ecological effects of fire in arid semi-arid areas is to improve. Rainfall and drought both affect fuel dynamics and the occurrence of fires, and we found that the fire record in Etosha was dominated by a few episodic but extreme fire events. An ability to predict such events would require a better understanding of their causes and would be useful in preparing to deal with them. Herbivory is also important, for two reasons. First, fires and herbivores are competitors for the same resource, grass fuels [25]. Numerous herbivores can prevent fires, or reduce their intensity, by consuming most available fuel [21], while above-average rainfall generates abundant forage that can satiate herbivores, leaving sufficient fuels to support fires. Secondly, interactions between elephants and fires can have dramatic effects on trees in savannas [26,27] and the relative importance of this issue in drylands requires further investigation. Finally, a shift in burning from the late to the early dry season, as currently proposed [8,9], may have ecological implications that are currently not fully understood [28]. Turner et al. [9] noted that studies on the “interactions between vegetation dynamics, herbivores and fire in the greater Etosha landscape are highly important for future research”. Research aimed at improving our understanding of these dynamics should be structured around regular monitoring and recording of inputs (rainfall, herbivore numbers, and the occurrence of fires) and outputs (plant species composition, biomass and structure). This could provide a broad basis for improving understanding over the longer term.
4.3. Implications for Management
The Etosha National Park’s management policy recognises that fire plays an important ecological role and that fires must “be applied primarily to reduce fuel loads to limit the size and scale of fires, especially wildfires” [8]. The intention is to shift the seasonality of fires from the late to the early dry season, by initiating patch burns early in the dry season to break up continuous fuel beds [29]. Implementation of this policy has commenced, but it has proven difficult to carry it out consistently because of a lack of skills and experience in the safe application of fires, and ongoing negative perceptions of fire [8,9]. As a result, most of the park still appears to burn in unplanned fires (data on the cause of fires are not available). Occasional large wildfires cause considerable negative publicity, especially if large and charismatic animals are killed or injured in such fires, and this further highlights the need for the effective implementation of a practical and defensible fire policy. The current fire policy has proved difficult to implement because of the size of the area, limited access roads, and the lack of experienced managers to implement an effective patch mosaic burning strategy. Several studies in South Africa [23,29,30,31] have found that patch mosaic burning was effective in increasing the heterogeneity of fire patterns in savanna protected areas. Many of these areas were relatively small compared to the Etosha National Park (<1 000 km2 in size), but the practice was also shown to be effective in larger areas, e.g., the Kruger National Park in South Africa [33], which is similar in size to Etosha National Park (20 000 km2), but better resourced. A policy of regular prescribed burning was implemented for over half a century across the entire Kruger National Park [3]. The outcomes of this policy were later examined using satellite remote sensing, which revealed that some areas burned very infrequently. A decision was taken not to subject these areas to deliberate burning, and they were excluded from any future fire management interventions [33], freeing up scarce capacity and resources to manage fires where they were required. In Etosha National Park, the Cuvelai drainage, northeastern Kalahari woodlands, and western highlands also burn very infrequently (Table 1), and arguably need not be subjected to patch burning practices. This may relieve some pressure on managers, although the area excluded from active fire management would be less than 10%. The effective implementation of patch mosaic burning across the remaining fire-prone areas in Etosha National Park would require a larger investment into management capacity, training and fire control equipment if the occurrence of occasional extensive wildfires is to be effectively reduced.
Author Contributions
Both authors were involved in conceptualization, methodology, and validation. CvdW conducted GIS analyses and BvW wrote the manuscript with inputs from CvdW. Both authors agreed to the published version of the manuscript.
Funding
This research was funded by the Ongava Research Centre.
Institutional Review Board Statement
Not applicable.
Data Availability Statement
Data will be made available by the corresponding author upon reasonable request.
Acknowledgments
We thank Rolf Becker, Pierre du Preez, Gerhard de Lange and Karl-Heinz Moeller for useful discussions on fire management in the Etosha area.
Conflicts of Interest
The authors declare that they have no conflicts of interest.
Abbreviations
The following abbreviations are used in this manuscript:
| CHIRPS | Climate Hazards Center Infrared Precipitation |
| MODIS | Moderate Resolution Imaging Spectroradiometer |
References
- Archibald, S.; Scholes, R.J.; Roy, D.P.; Roberts, G.; Boschetti, L. Southern African fire regimes as revealed by remote sensing. International Journal of Wildland Fire 2010, 19, 861–878. [Google Scholar] [CrossRef]
- Archibald, S.; Nickless, A.; Scholes, R.J.; Schulze, R. Methods to determine the impact of rainfall on fuels and burned area in southern African savannas. International Journal of Wildland Fire 2010, 19, 774–782. [Google Scholar] [CrossRef]
- van Wilgen, BW; Govender, N.; Biggs, H.C.; Ntsala, D.; Funda, X.N. Response of savanna fire regimes to changing fire management policies in a large African national park. Conservation Biology 2004, 18, 1533–1540. [Google Scholar] [CrossRef]
- Nieman, W.A.; Leslie, A.J.; van Wilgen, B.W. A review of fire management practices in African savanna protected areas. Koedoe 2021, 63, a1655. [Google Scholar] [CrossRef]
- Siegfried, W.R. The incidence of veld-fire in the Etosha National Park, 1970– 1979. Madoqua 1981, 12, 225–230. [Google Scholar]
- Stander, P.E.; Nott, T.B.; Mentis, M.T. Proposed burning strategy for a semi-arid African savanna. African Journal of Ecology 1993, 31, 282–289. [Google Scholar] [CrossRef]
- Du Plessis, W.P. Refinements to the burning strategy in the Etosha National Park, Namibia. Koedoe 1997, 40, 63–76. [Google Scholar] [CrossRef]
- 8. Anonymous. Fire management strategy for Namibia’s protected areas; Directorate of Wildlife and National Parks, Ministry of Environment and Tourism: Windhoek, Namibia, 2021.
- Turner, W.C.; Periquet, S; Goelst, C.E.; Vera, K.B.; Cameron, E.Z.; Alexander, K.A.; Belant, J.L.; Cloete, C.C.; Du Preez, P.; Getz, W.M; Hetem, R.S. Africa’s drylands in a changing world: Challenges for wildlife conservation under climate and land-use changes in the Greater Etosha Landscape. Global Ecology and Conservation 2022, 38, e02221. [Google Scholar] [CrossRef]
- Le Roux, J. The effect of land use practices on the spatial and temporal characteristics of savanna fires in Namibia. PhD thesis, Friedrich-Alexander-Universität, Erlangen-Nürnberg, 2011. [Google Scholar]
- Mendelsohn, J.; Jarvis, A.; Roberts, C.; Robertson, T. Atlas of Namibia; David Phillips Publishers: Cape Town, South Africa, 2002; pp. 96–100. [Google Scholar]
- Kimaro, M.E.; Lendelvo, S.M.; Nakanyala, J. Determinants of tourist’s satisfaction in Etosha National Park, Namibia. Journal for Studies in Humanities and Social Sciences 2025, 4, 116–131. [Google Scholar]
- Odendaal, W.; Werner, W. Neither here nor there: Indigeneity, marginalisation and land rights in post-independence Namibia; Land, Environment and Development Project, Legal Assistance Centre: Windhoek, Namibia, 2020. [Google Scholar]
- Smit, I.P.J.; Baard, J.A.; van Wilgen, B.W. Fire regimes and management options in mixed grassland-fynbos vegetation, South Africa. Fire Ecology 2024, 20, 29. [Google Scholar] [CrossRef]
- Gorelick, N.; Hancher, M.; Dixon, M.; Ilyushchenko, S.; Thau, D.; Moore, R. Google Earth Engine: Planetary-scale geospatial analysis for everyone. Remote Sensing of Environment 2017, 202, 18–27. [Google Scholar] [CrossRef]
- Funk, C.; Peterson, P.; Landsfeld, M.; Pedreros, D.; Verdin, J.; Shukla, S.; Husak, G.; Rowland, J.; Harrison, L.; Hoell, A. The climate hazards infrared precipitation with stations—a new environmental record for monitoring extremes. Scientific Data 2015, 2, 1–21. [Google Scholar] [CrossRef] [PubMed]
- Kaplan, E.L.; Meier, P. Nonparametric estimation from incomplete observations. Journal of the American Statistical Association 1958, 53, 457–481. [Google Scholar] [CrossRef]
- D’Arrigo, G.; Leonardis, D.; Abd El Hafeez, S.; Fusaro, M.; Tripepi, G.; Roumeliotis, S. Methods to analyse time-to-event data: The Kaplan-Meier survival curve. Oxidative Medicine and Cellular Longevity 2021, 2021(1), 2290120. [Google Scholar] [CrossRef]
- Therneau, T. A package for survival analysis in R. R package version 3.2-7. 2024. [Google Scholar]
- Joubert, D.F.; Smit, G.N.; Hoffman, M.T. The role of fire in preventing transitions from a grass dominated state to a bush thickened state in arid savannas. Journal of Arid Environments 2012, 87, 1–7. [Google Scholar] [CrossRef]
- Smit, I.P.; Archibald, S. Herbivore culling influences spatio-temporal patterns of fire in a semiarid savanna. Journal of Applied Ecology 2019, 56, 711–21. [Google Scholar]
- van Wilgen, B.W.; Govender, N.; Smit, I.P.J.; MacFadyen, S. The ongoing development of a pragmatic and adaptive fire management policy in a large African savanna protected area. Journal of Environmental Management 2014, 132, 358–368. [Google Scholar] [CrossRef]
- Archibald, S.; Beckett, H.; Bond, W.J.; Coetsee, C.; Druce, D.J.; Staver, C.A. Interactions between fire and ecosystem processes. In Conserving Africa’s megadiversity in the anthropocene: The Hluhluwe-iMfolozi Park story; Cromsigt, J.P.G.M., Archibald, S., Owen-Smith, N., Eds.; Cambridge University Press: Cambridge, United Kingdom, 2017; pp. 233–262. [Google Scholar]
- Eby, S.L.; Dempewolf, J.; Holdo, R.M.; Metzger, K.L. Fire in the Serengeti ecosystem: History, drivers, and consequences. In Serengeti IV: Sustaining biodiversity in a coupled human-natural system; Sinclair, A.R.E, Metzger, K.L., Mduma, S.A.R., Fryxell, J.M., Eds.; The University of Chicago Press: Chicago, 2015; pp. 73–104. [Google Scholar]
- Bond, W.J.; van Wilgen, B.W. Plants and Fire; Chapman & Hall, London, 1996; p. 9. [Google Scholar]
- Vanak, A. T.; Shannon, G.; Thaker, M.; Page, B.; Grant, R.; Slotow, R. Bio- complexity in large tree mortality: Interactions between elephant, fire and landscape in an African savanna. Ecography 2012, 35, 315–321. [Google Scholar] [CrossRef]
- Stevens, N.; Erasmus, B. F. N.; Archibald, S.; Bond, W. J. Woody encroachment over 70 years in South African savannahs: overgrazing, global change or extinction aftershock? Philosophical Transactions of the Royal Society B: Biological Sciences 2016, 27 371(1703), 20150437. [Google Scholar] [CrossRef]
- Knowles, T.; Stevens, N.; Amoako, E.E.; Armani, M.; Barbosa, C.; Beale, C.; Bond, W.; Chidumayo, E.; Courtney-Mustaphi, C.; Dintwe, K.; Dobson, A. Viability and desirability of financing conservation in Africa through fire management. Nature Sustainability 2025, 8, 226–233. [Google Scholar] [CrossRef]
- Brockett, B.H.; Biggs, H.C.; van Wilgen, B.W. A patch mosaic burning system for conservation areas in southern Africa. International Journal of Wildland Fire 2001, 10, 169–183. [Google Scholar]
- Mulqueeny, C.M.; Goodman, P.S.; O’Connor, T.G. Landscape-level differences in fire regime between block and patch-mosaic burning strategies in Mkuzi Game Reserve, South Africa. African Journal of Range & Forage Science 2010, 27, 143–150. [Google Scholar]
- 31. Balfour, D.A.; Howison, O.E., Spatial and temporal variation in a mesic savanna fire regime: Responses to variation in annual rainfall. African Journal of Range & Forage Science 2001, 19, 45–53.
- van Wilgen, B.W.; Govender, N.; Smit, I.P.J.; MacFadyen, S. The ongoing development of a pragmatic and adaptive fire management policy in a large African savanna protected area. Journal of Environmental Management 2014, 132, 358–368. [Google Scholar] [CrossRef] [PubMed]
Figure 1.
Geographic location of Etosha National Park and adjacent freehold and resettlement farms in northern Namibia, showing vegetation types and isohyets of mean annual rainfall used in the analysis of fire regimes. The inset shows the location of the study area in northern Namibia.
Figure 1.
Geographic location of Etosha National Park and adjacent freehold and resettlement farms in northern Namibia, showing vegetation types and isohyets of mean annual rainfall used in the analysis of fire regimes. The inset shows the location of the study area in northern Namibia.
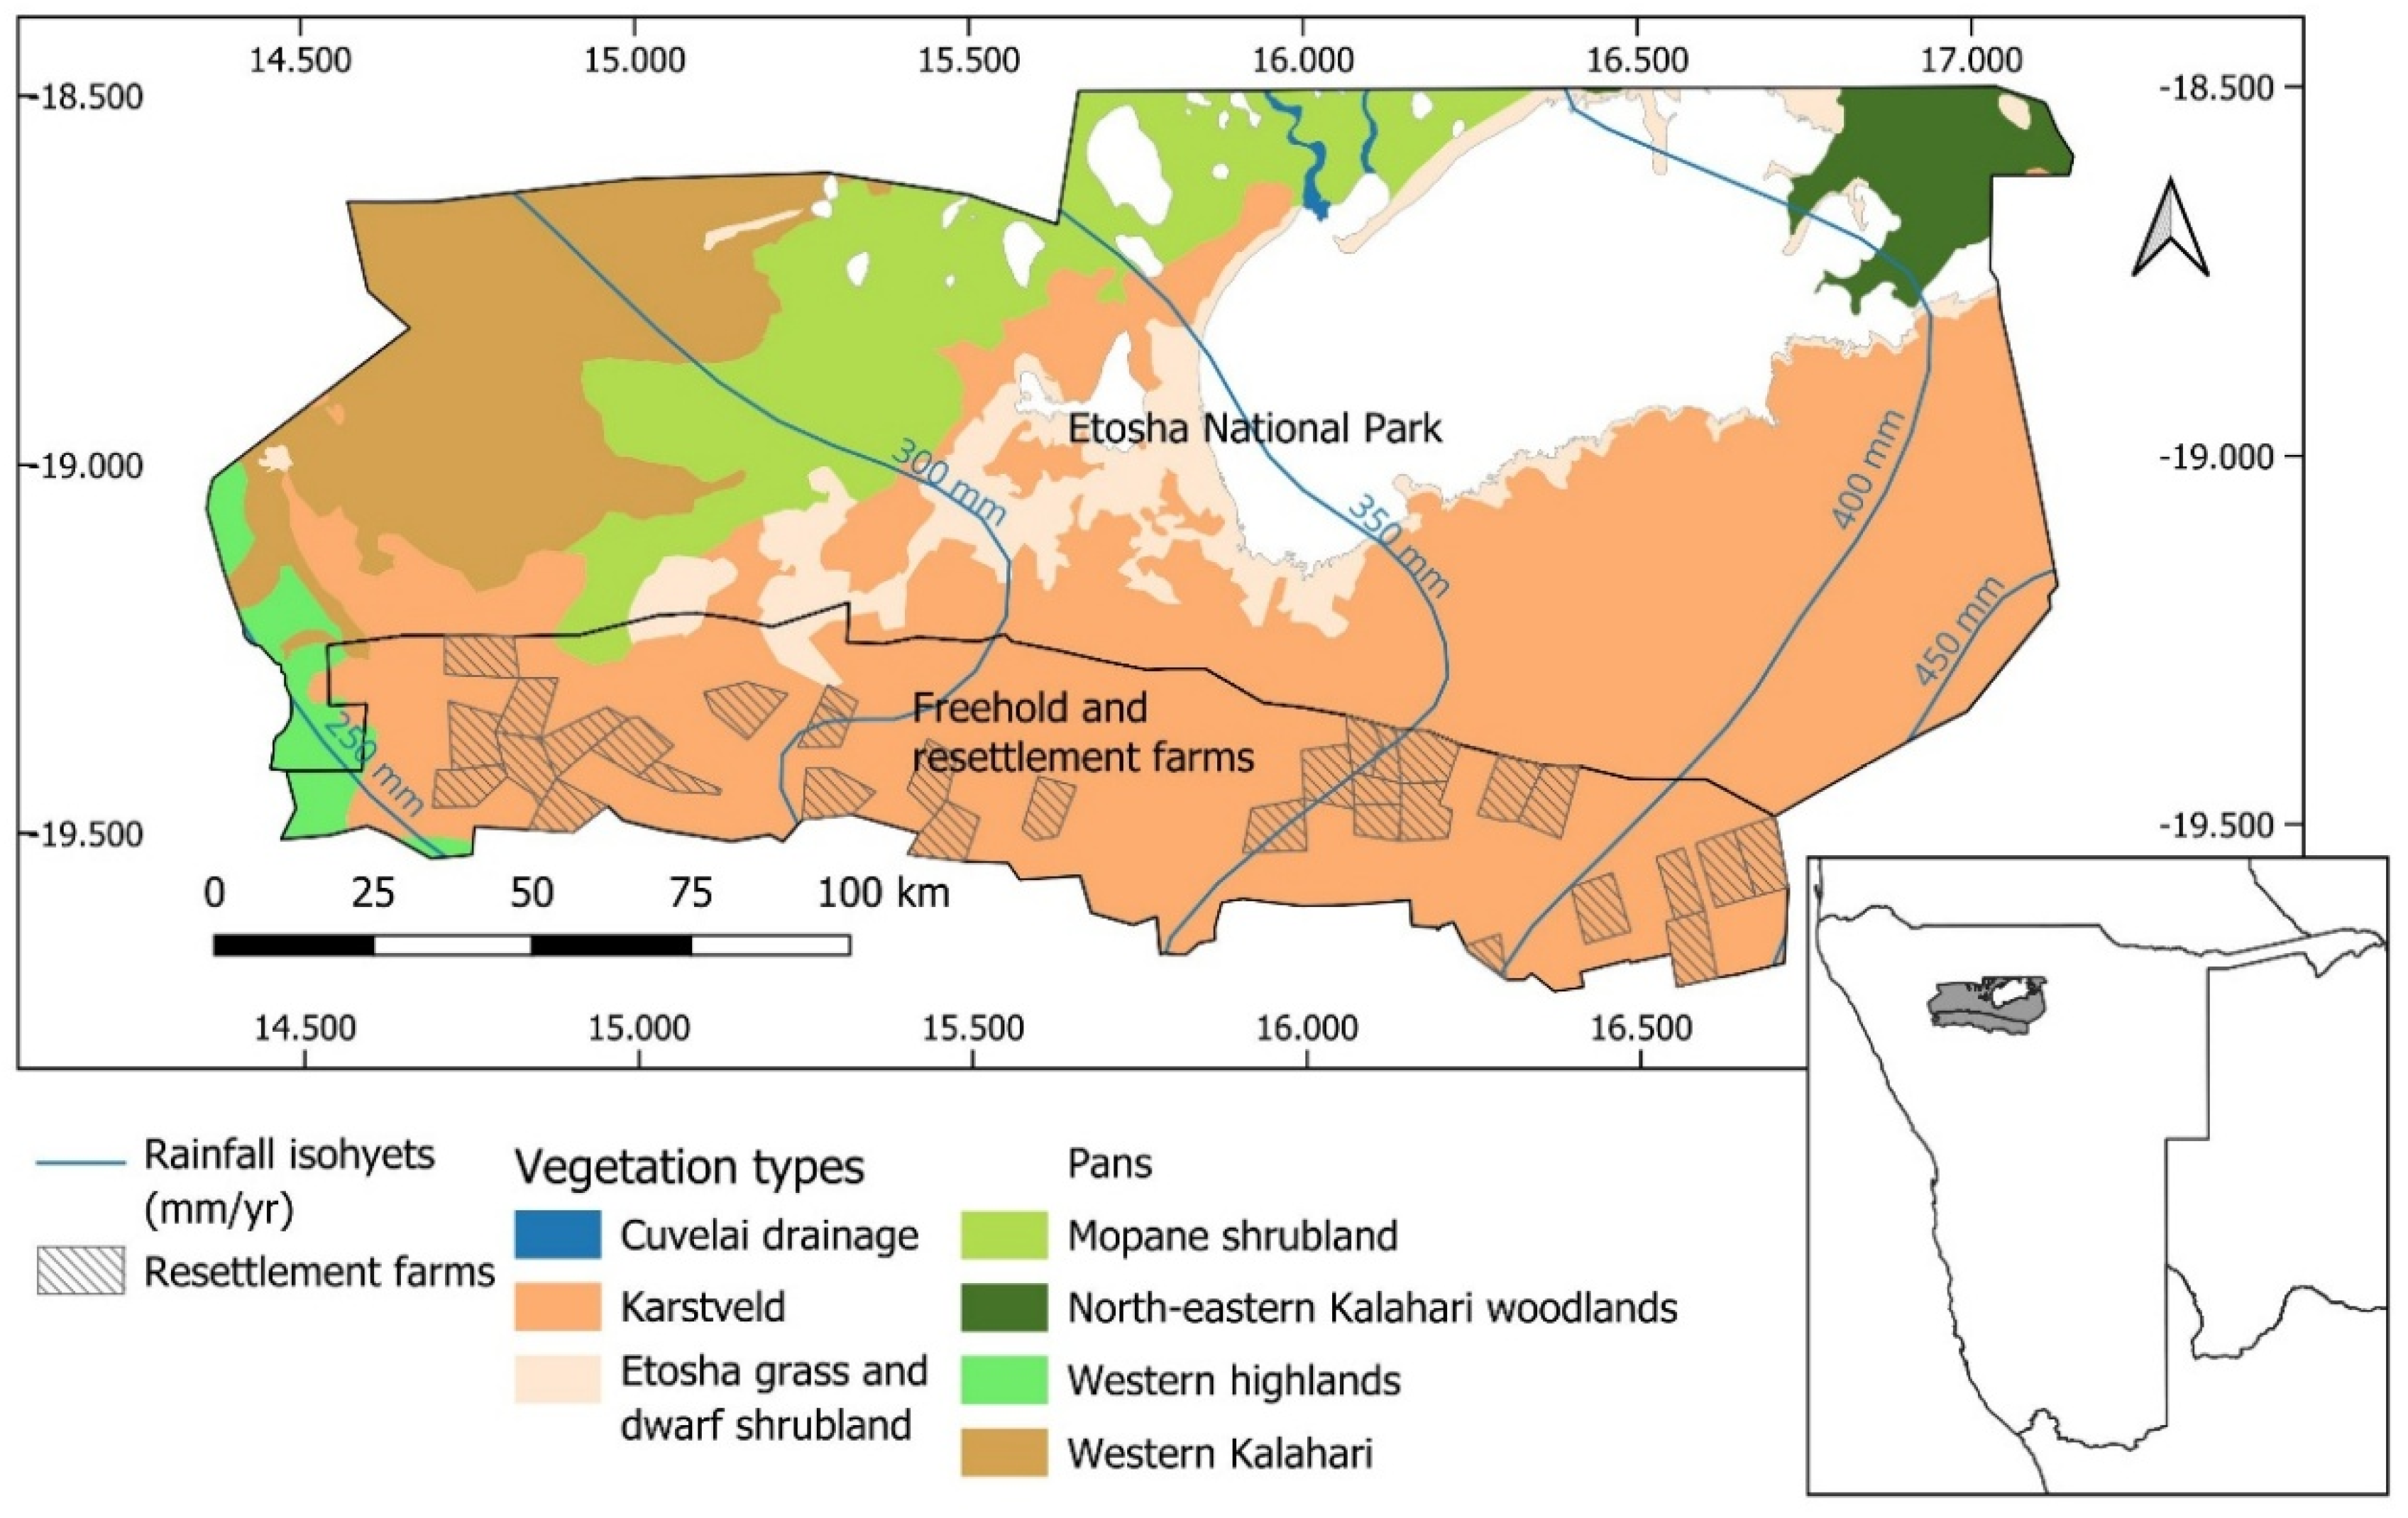
Figure 2.
Woodlands south of Etosha National Park, dominated by mopani trees (Colophospermum mopane). Photograph B.W. van Wilgen.
Figure 2.
Woodlands south of Etosha National Park, dominated by mopani trees (Colophospermum mopane). Photograph B.W. van Wilgen.
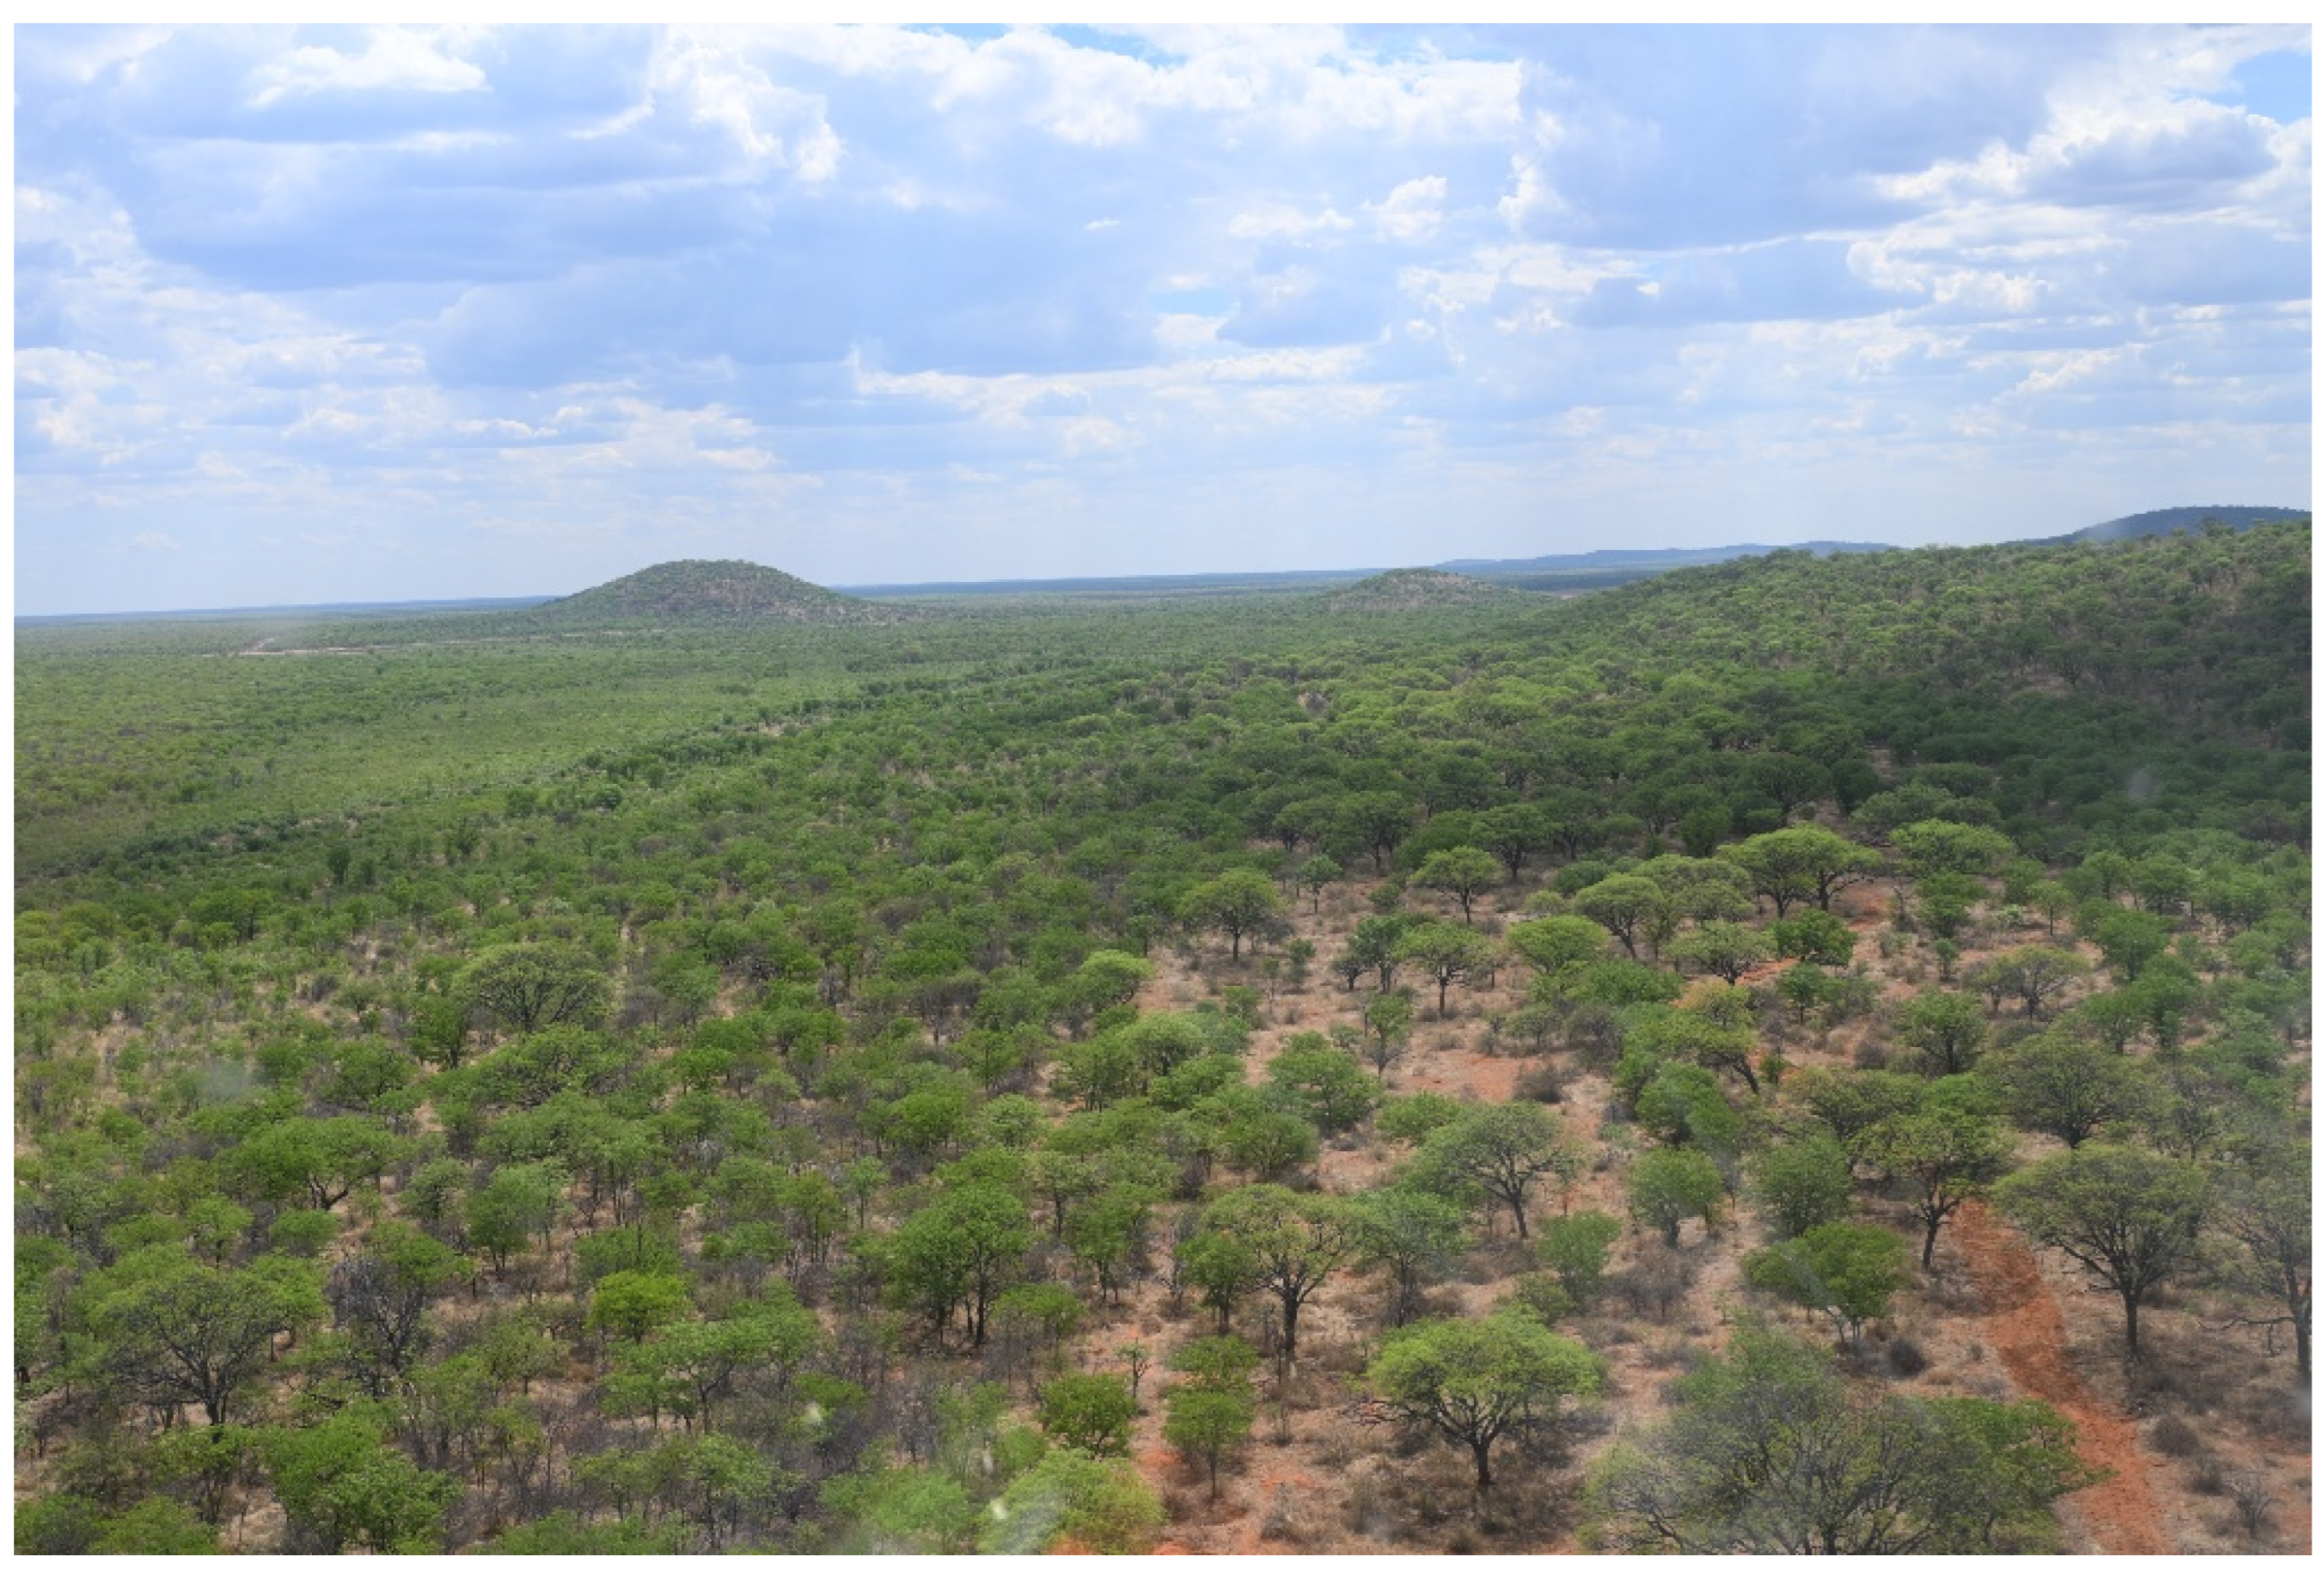
Figure 3.
Schematic illustration of the rainfall year (1 July to 30 June) and calendar or fire year (1 January to 31 December). Data are hypothetical for illustrative purposes.
Figure 3.
Schematic illustration of the rainfall year (1 July to 30 June) and calendar or fire year (1 January to 31 December). Data are hypothetical for illustrative purposes.
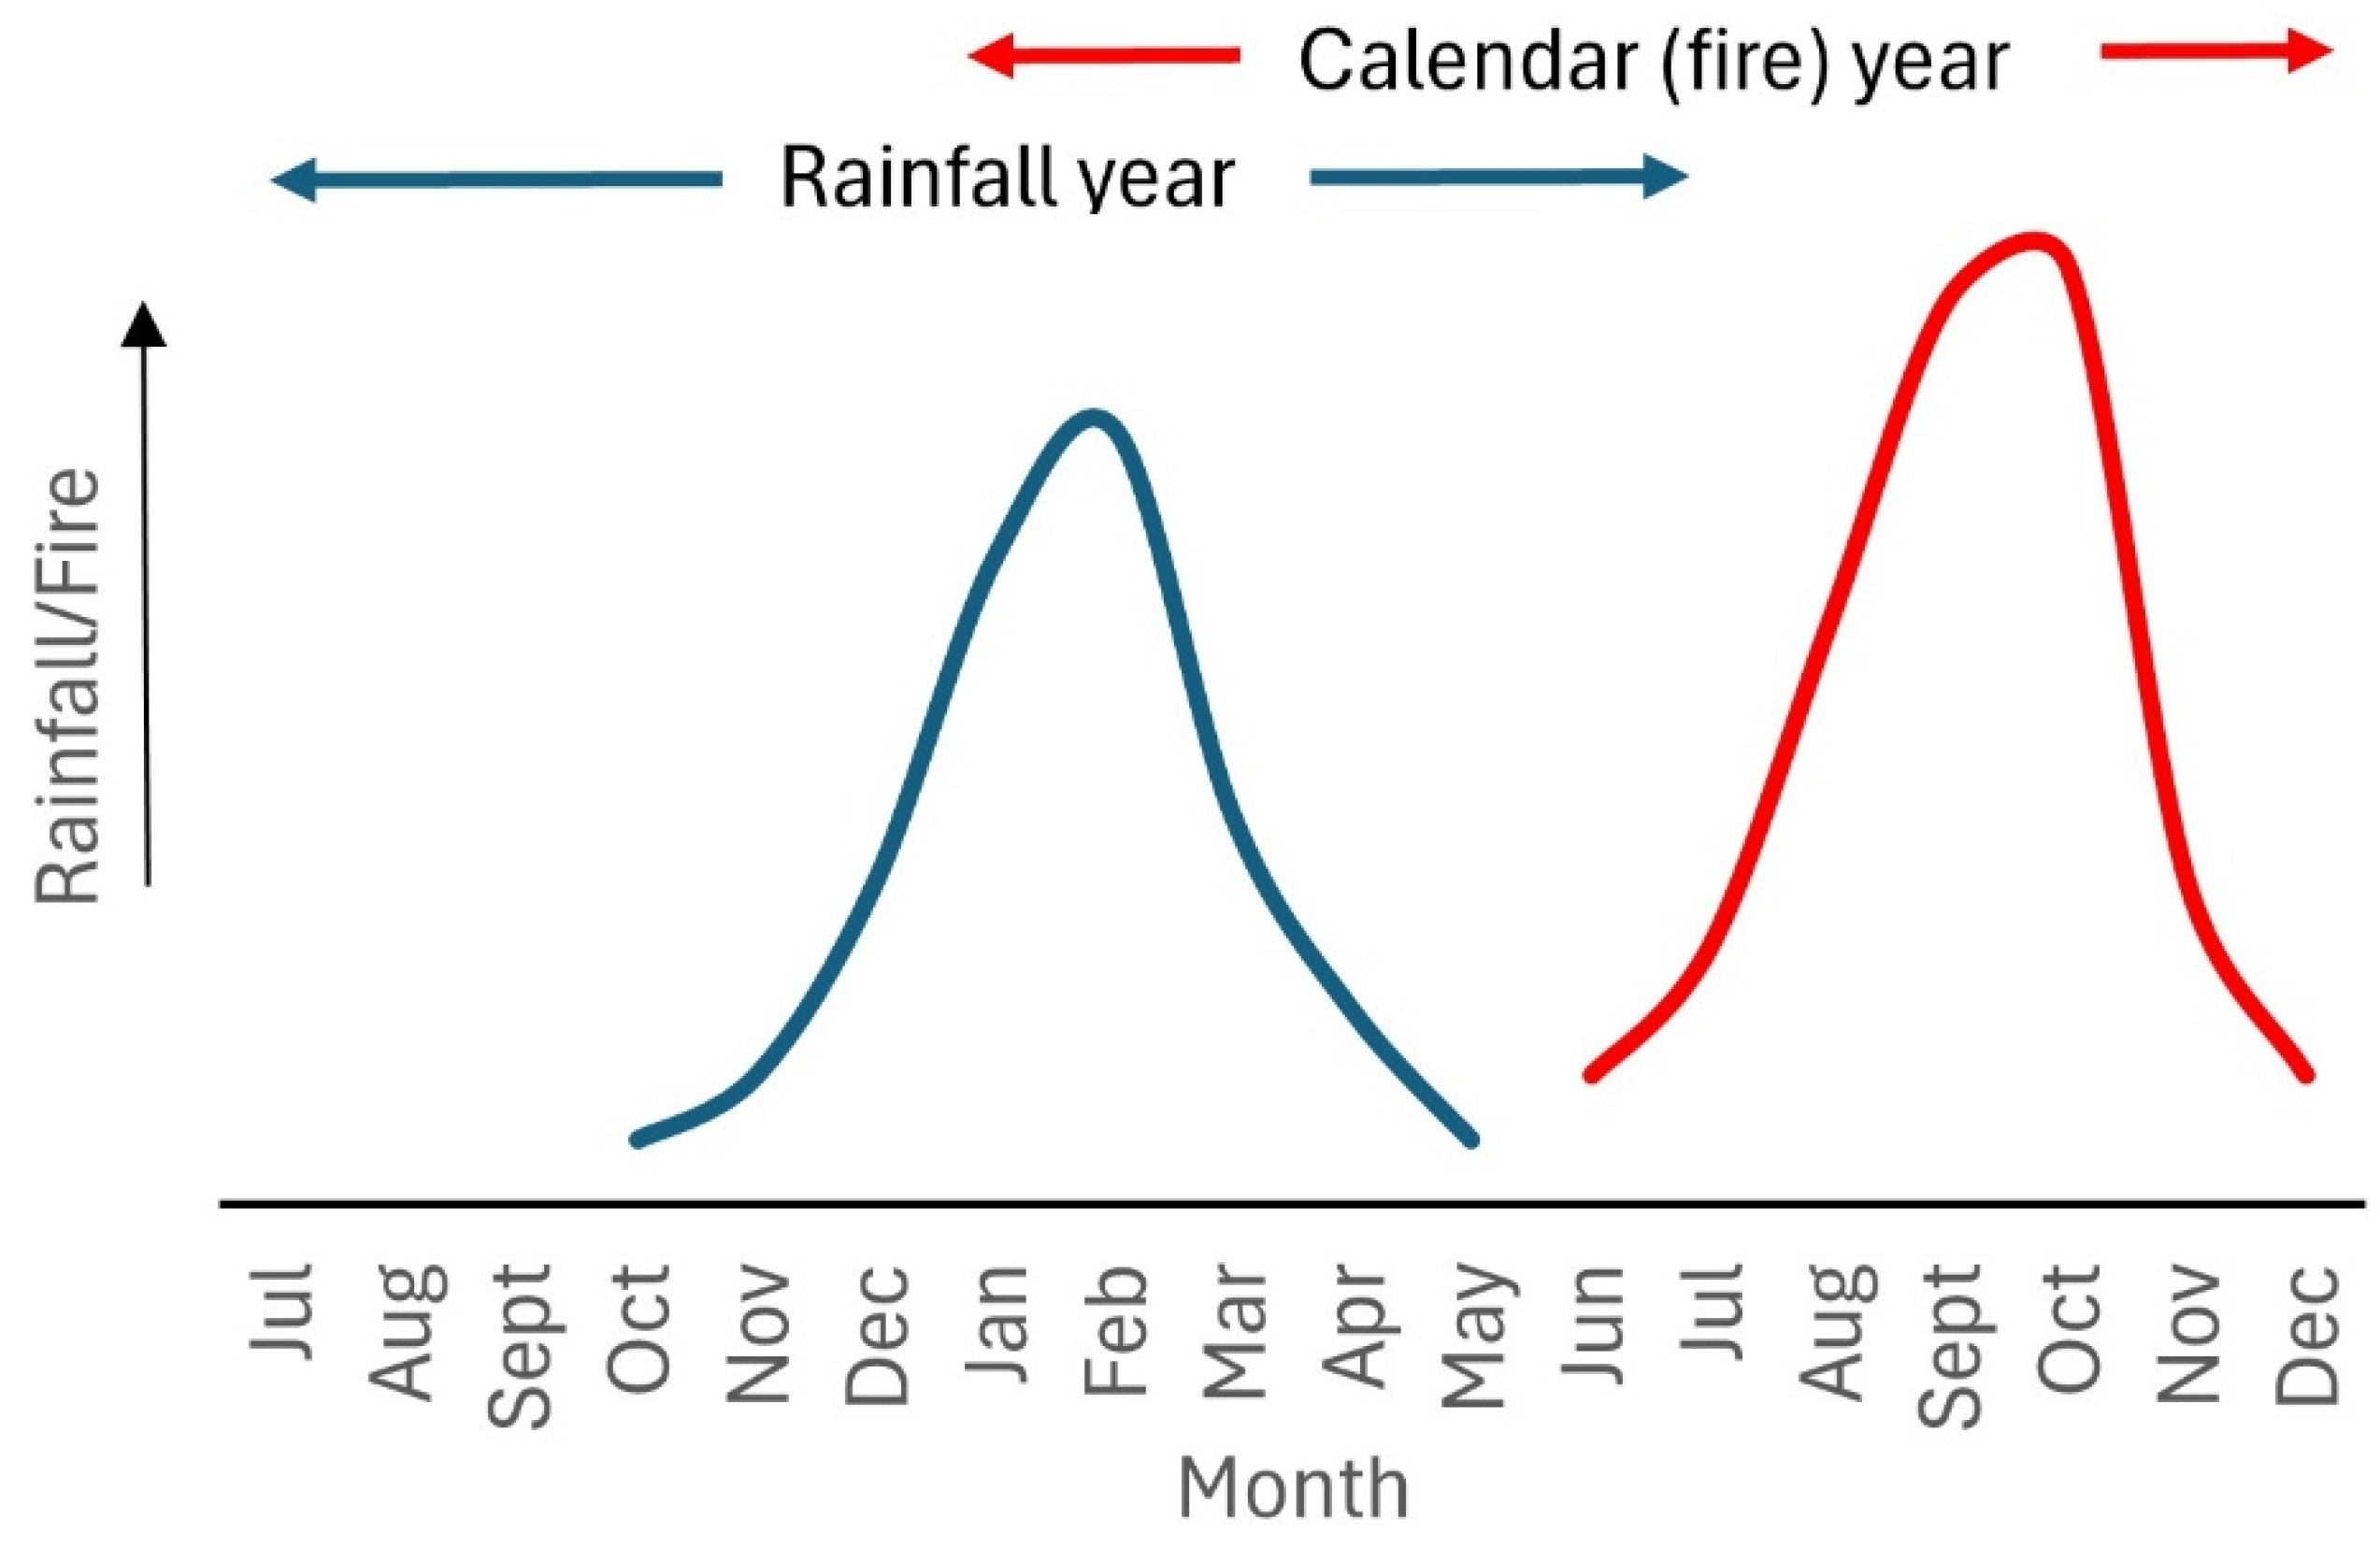
Figure 4.
The fire frequency (number of times burned over 25 years) in the Etosha National Park and adjacent areas.
Figure 4.
The fire frequency (number of times burned over 25 years) in the Etosha National Park and adjacent areas.
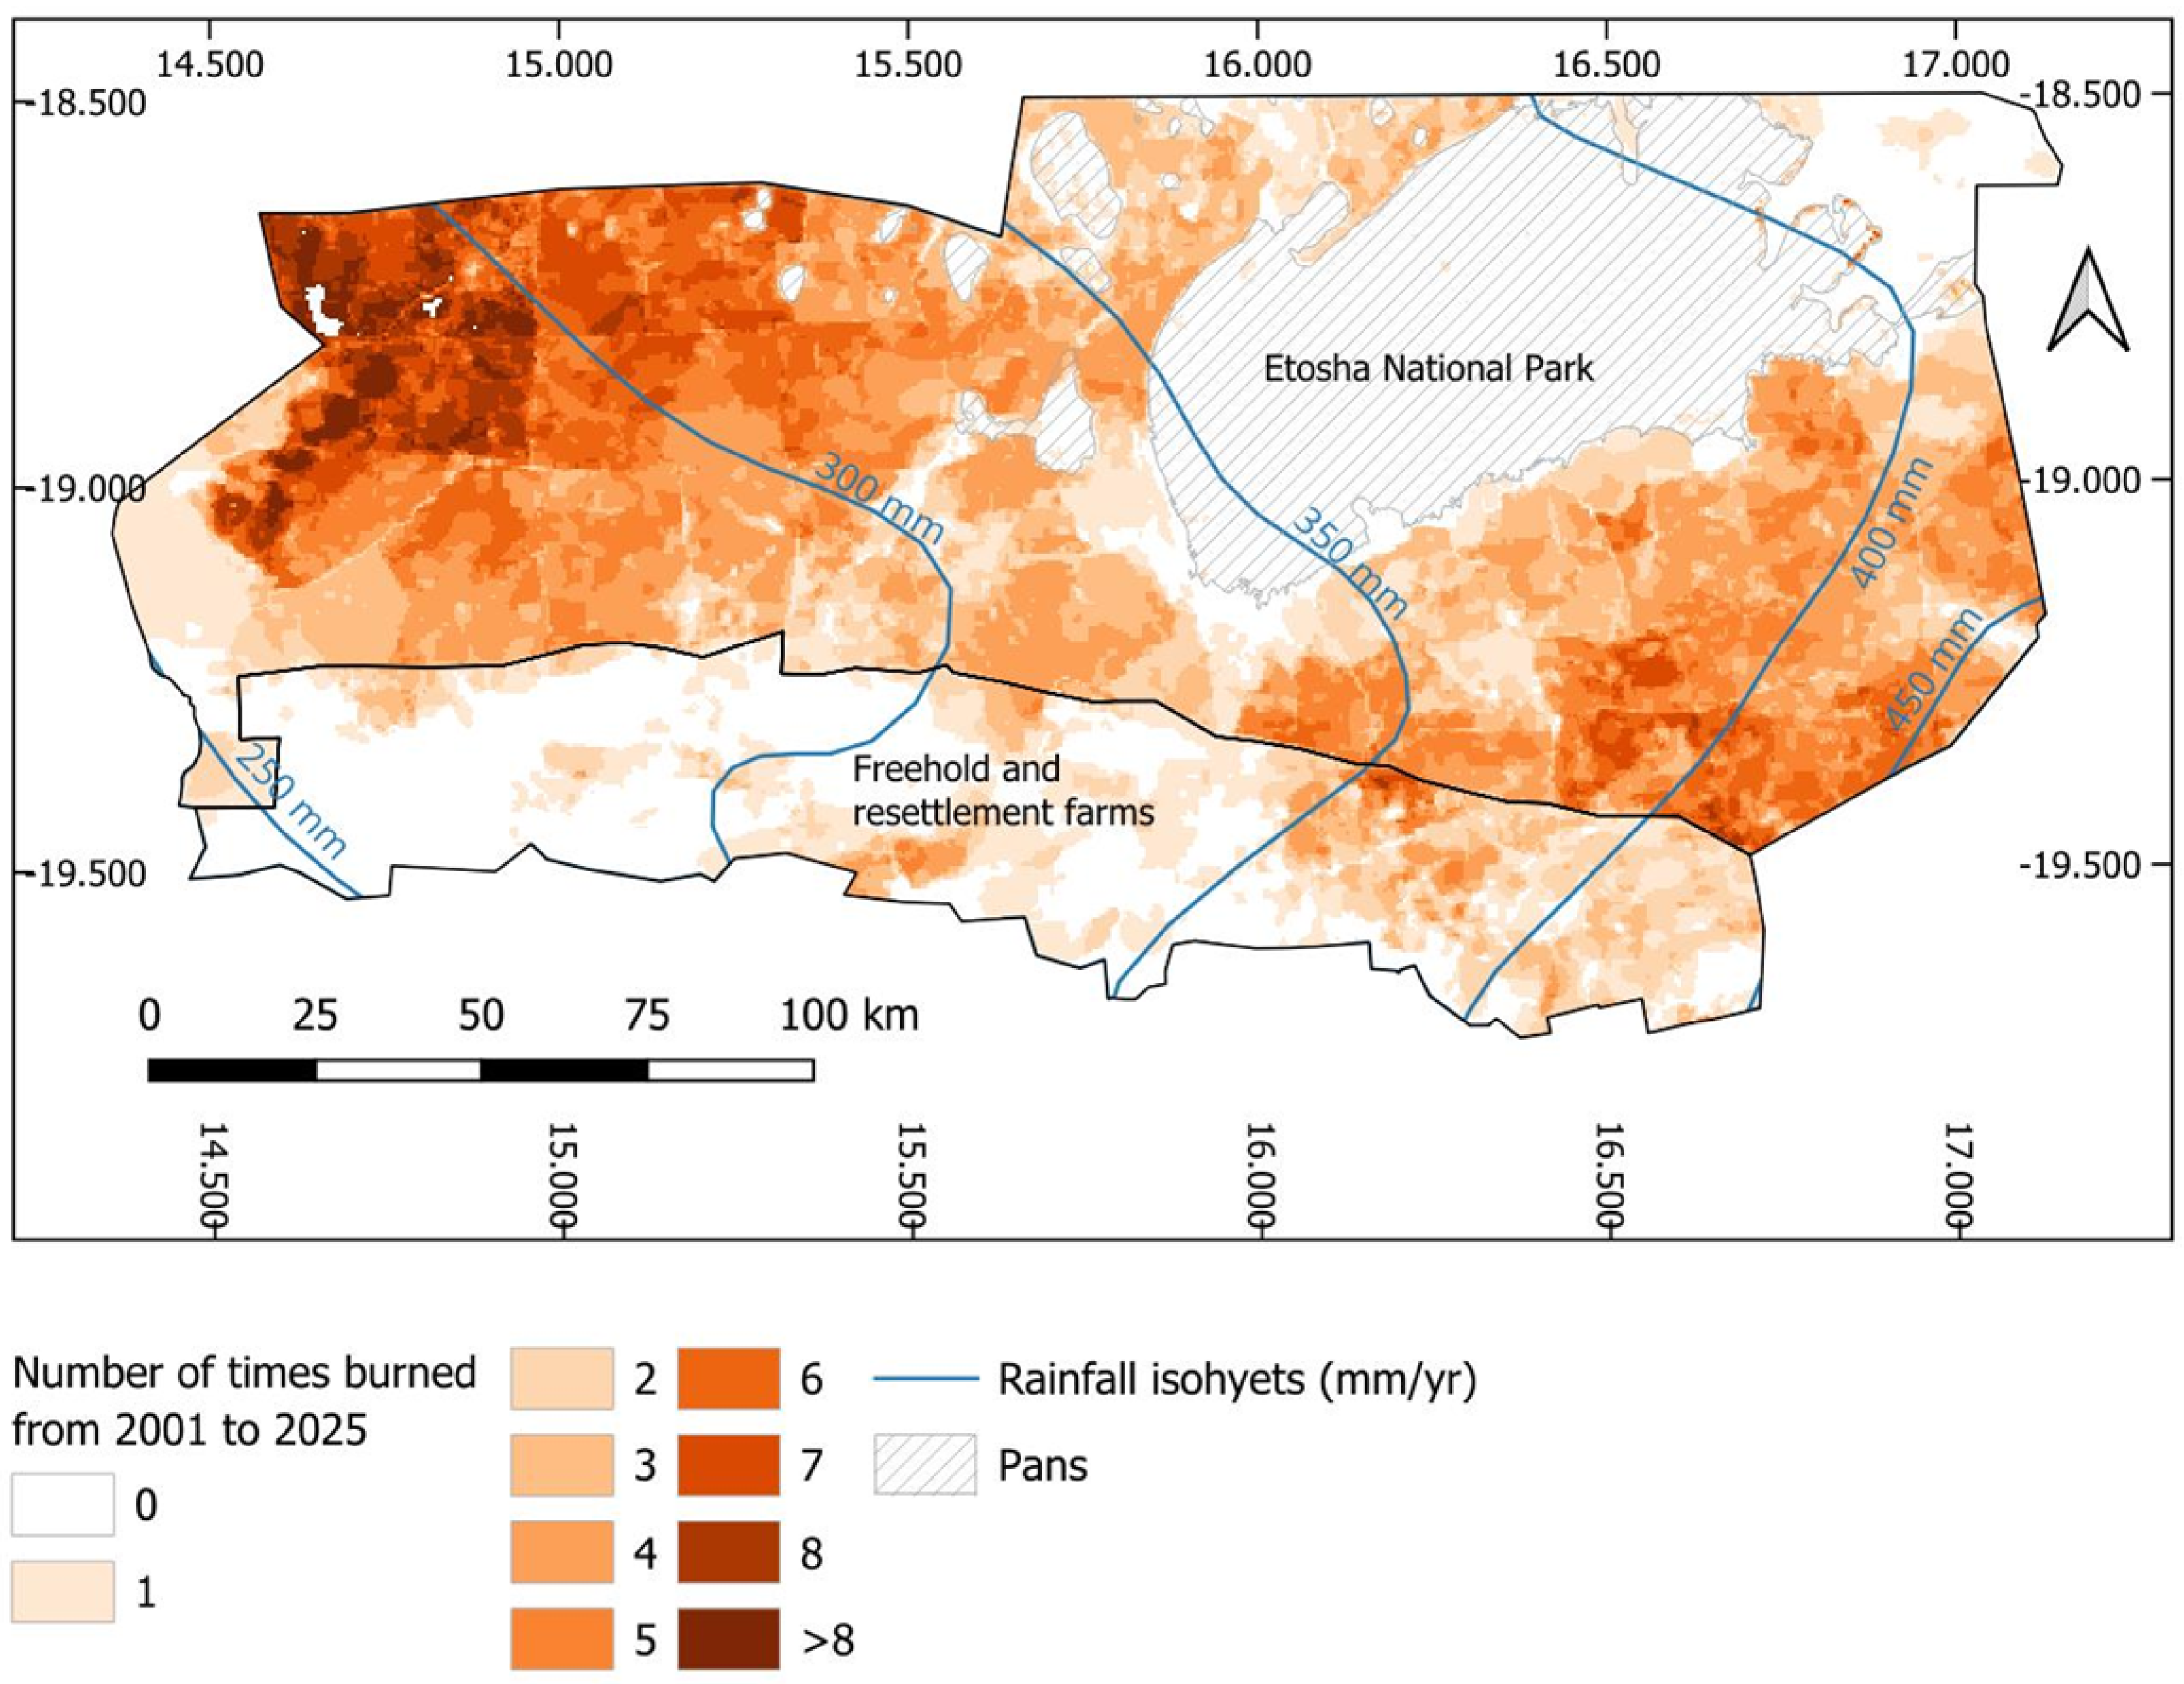
Figure 5.
Fire survival curves for the Etosha National Park and freehold and resettlement farms south of the park (left panel) and six vegetation types (right panel) in the Etosha National Park and surrounding areas derived from 25 years of burned area data. The survival curves were calculated for areas that burned at least once during the 25 years. Shaded areas represent pointwise 95% confidence intervals. .
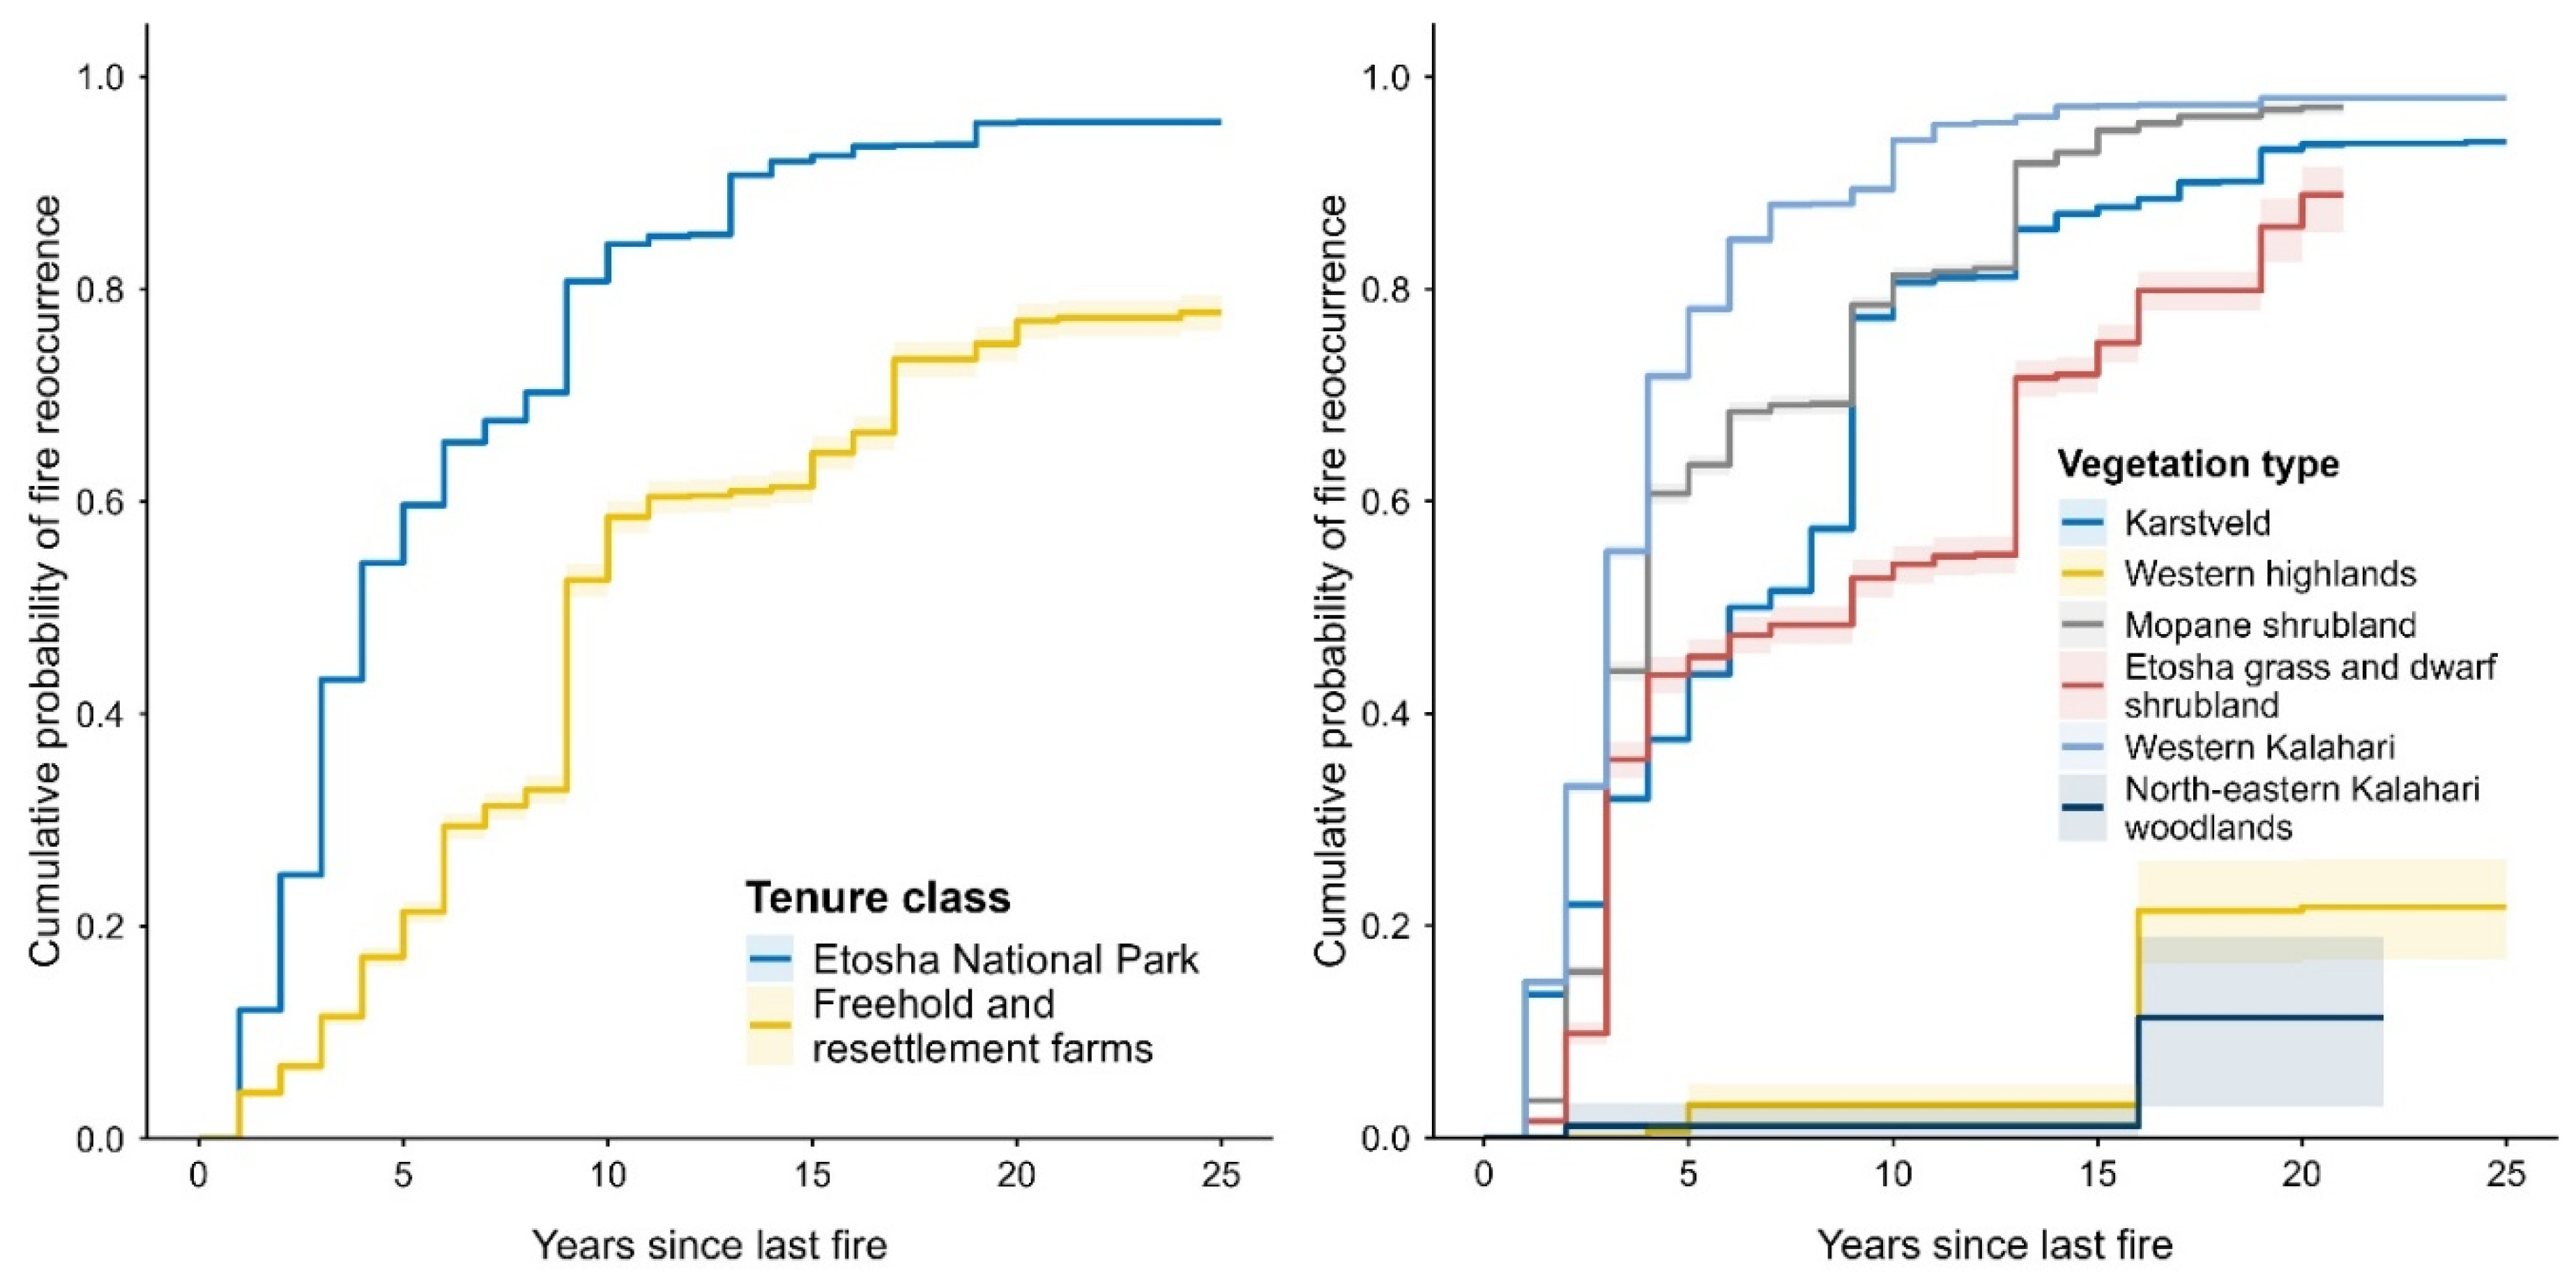
Figure 6.
A comparison of fire survival curves for six classes of mean annual rainfall in the Etosha National Park and freehold and resettlement farms south of the park derived from 25 years of burned area data. The survival curves were calculated for areas that burned at least once during the 25 years. Shaded areas represent pointwise 95% confidence intervals.
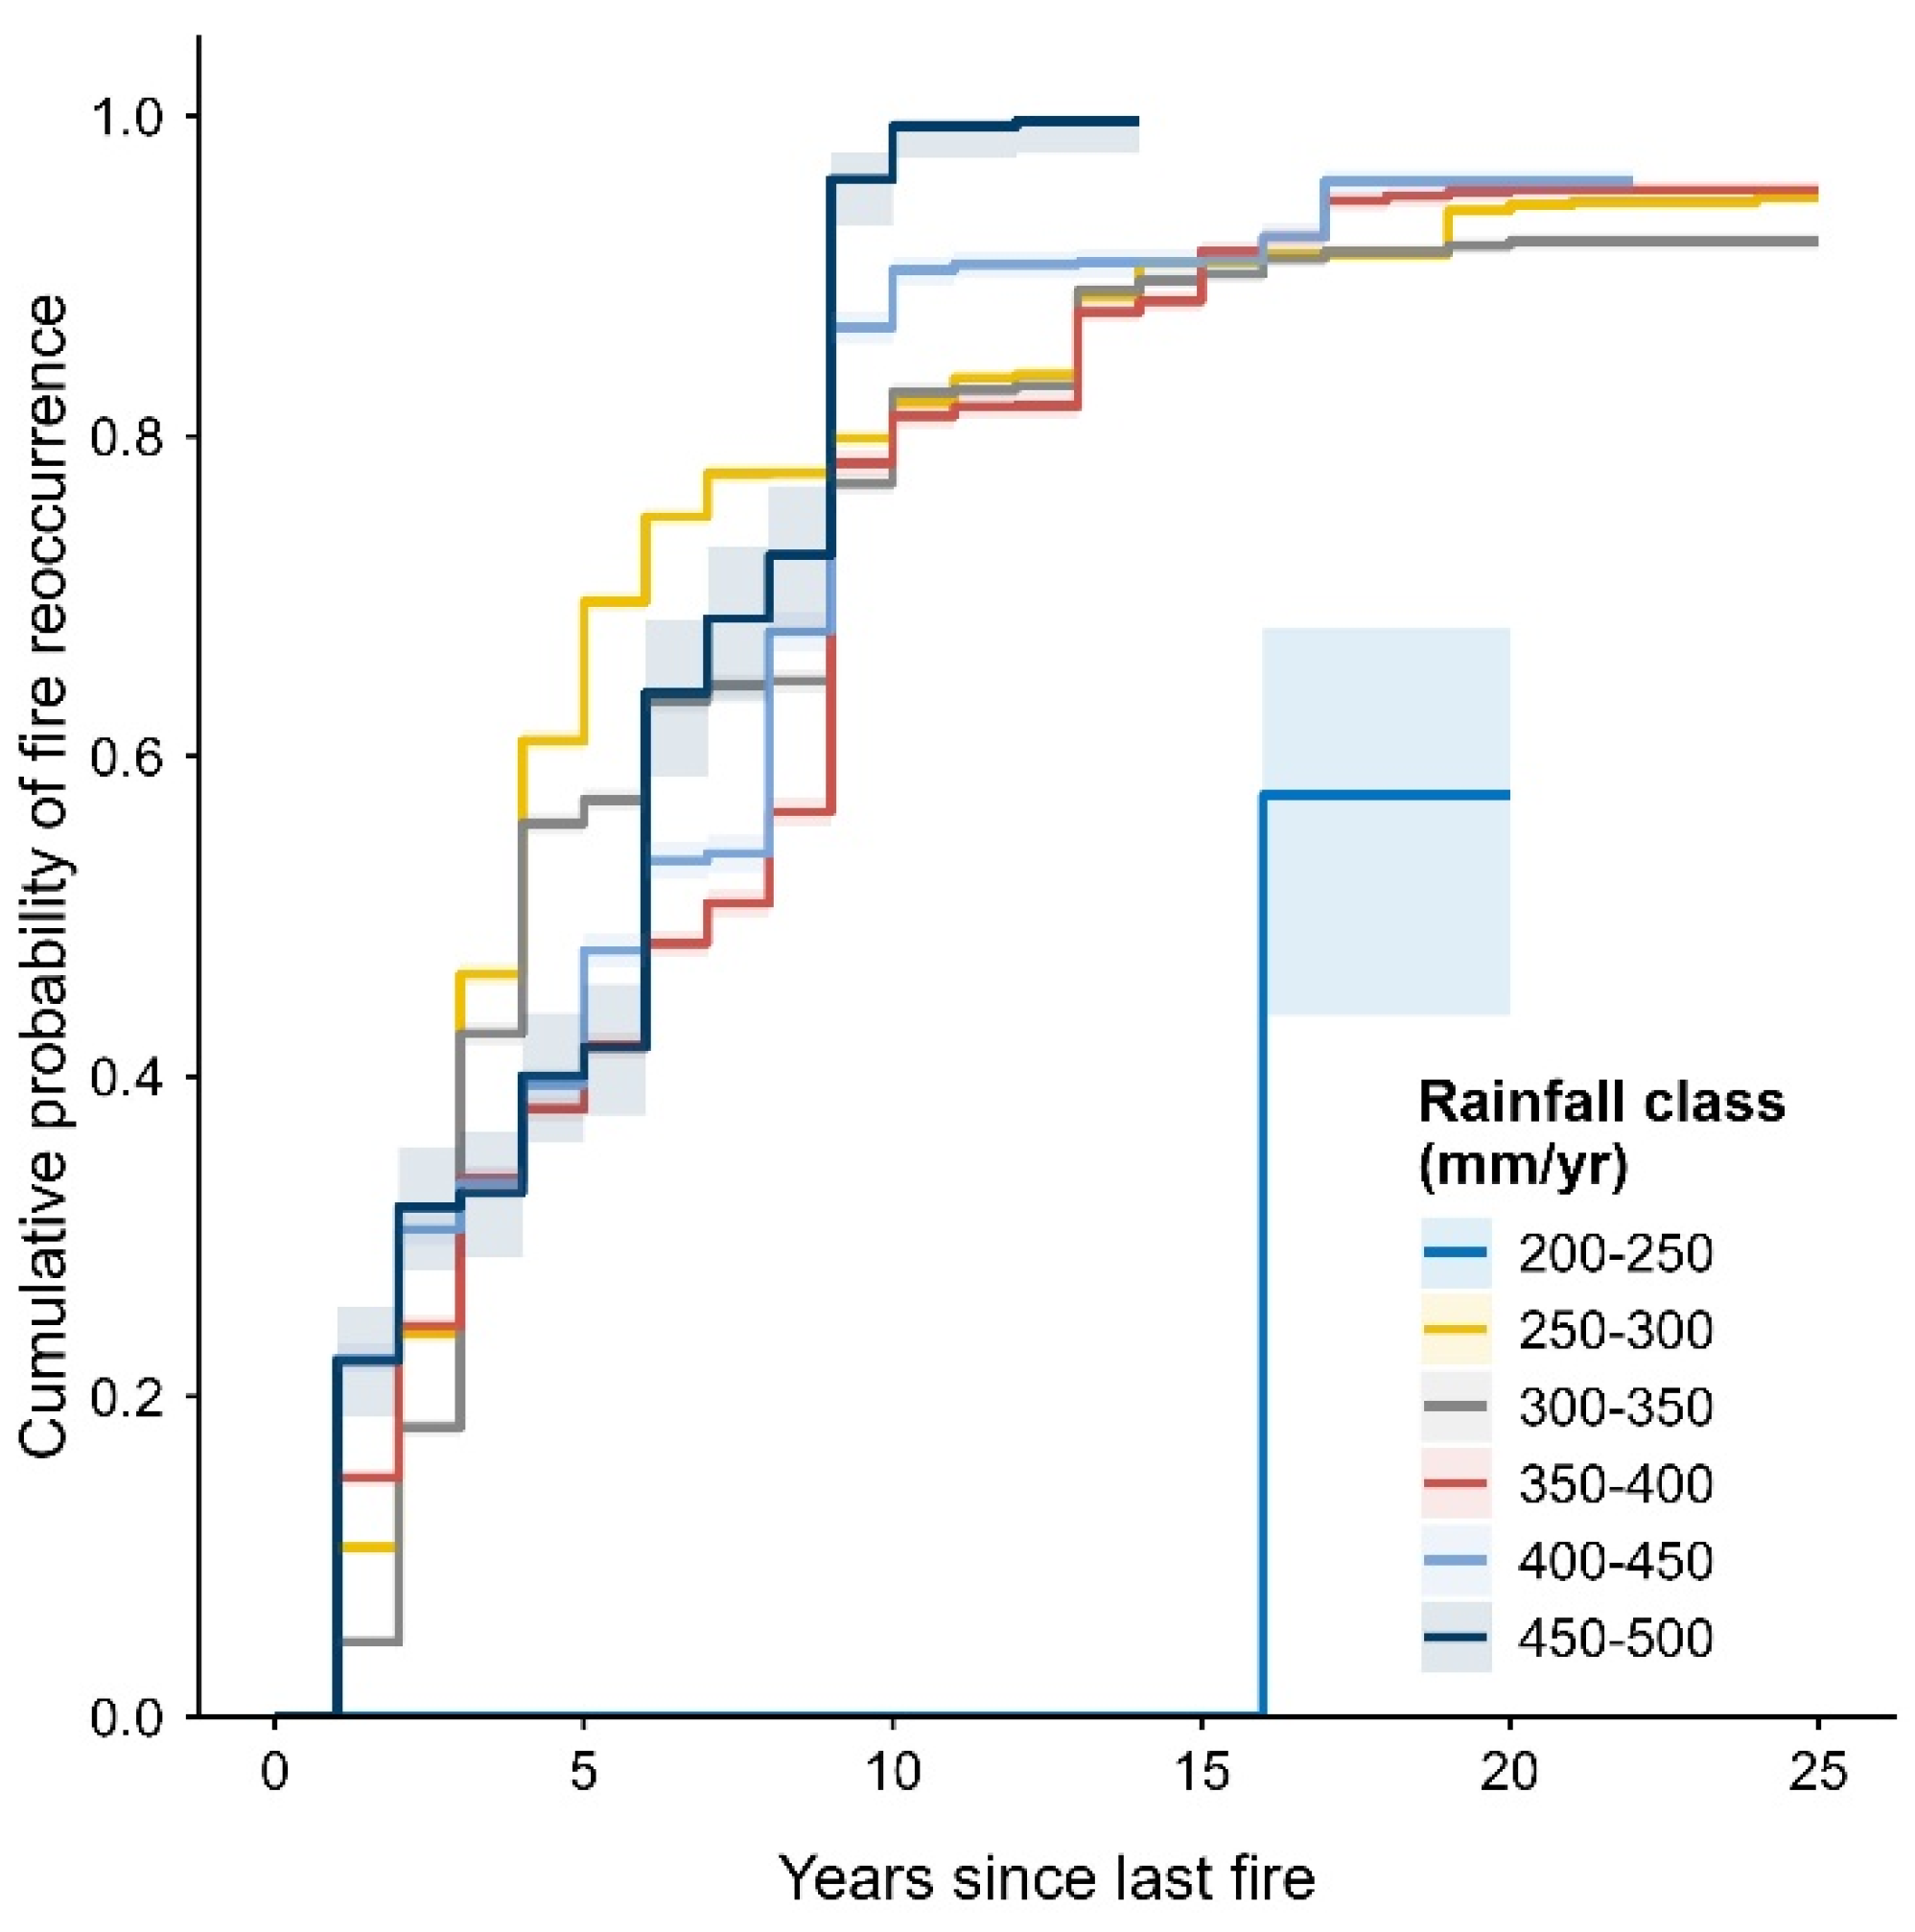
Figure 7.
The area burned per month in Etosha National Park and in freehold and resettlement areas in a 30-km buffer south of the park between 2001 and 2025. In the boxplots the horizontal line represents the median. The box spans the 25th to 75th percentiles, and whiskers extend to 1.5 × the interquartile range. The diamonds indicate the mean burned area for each month.
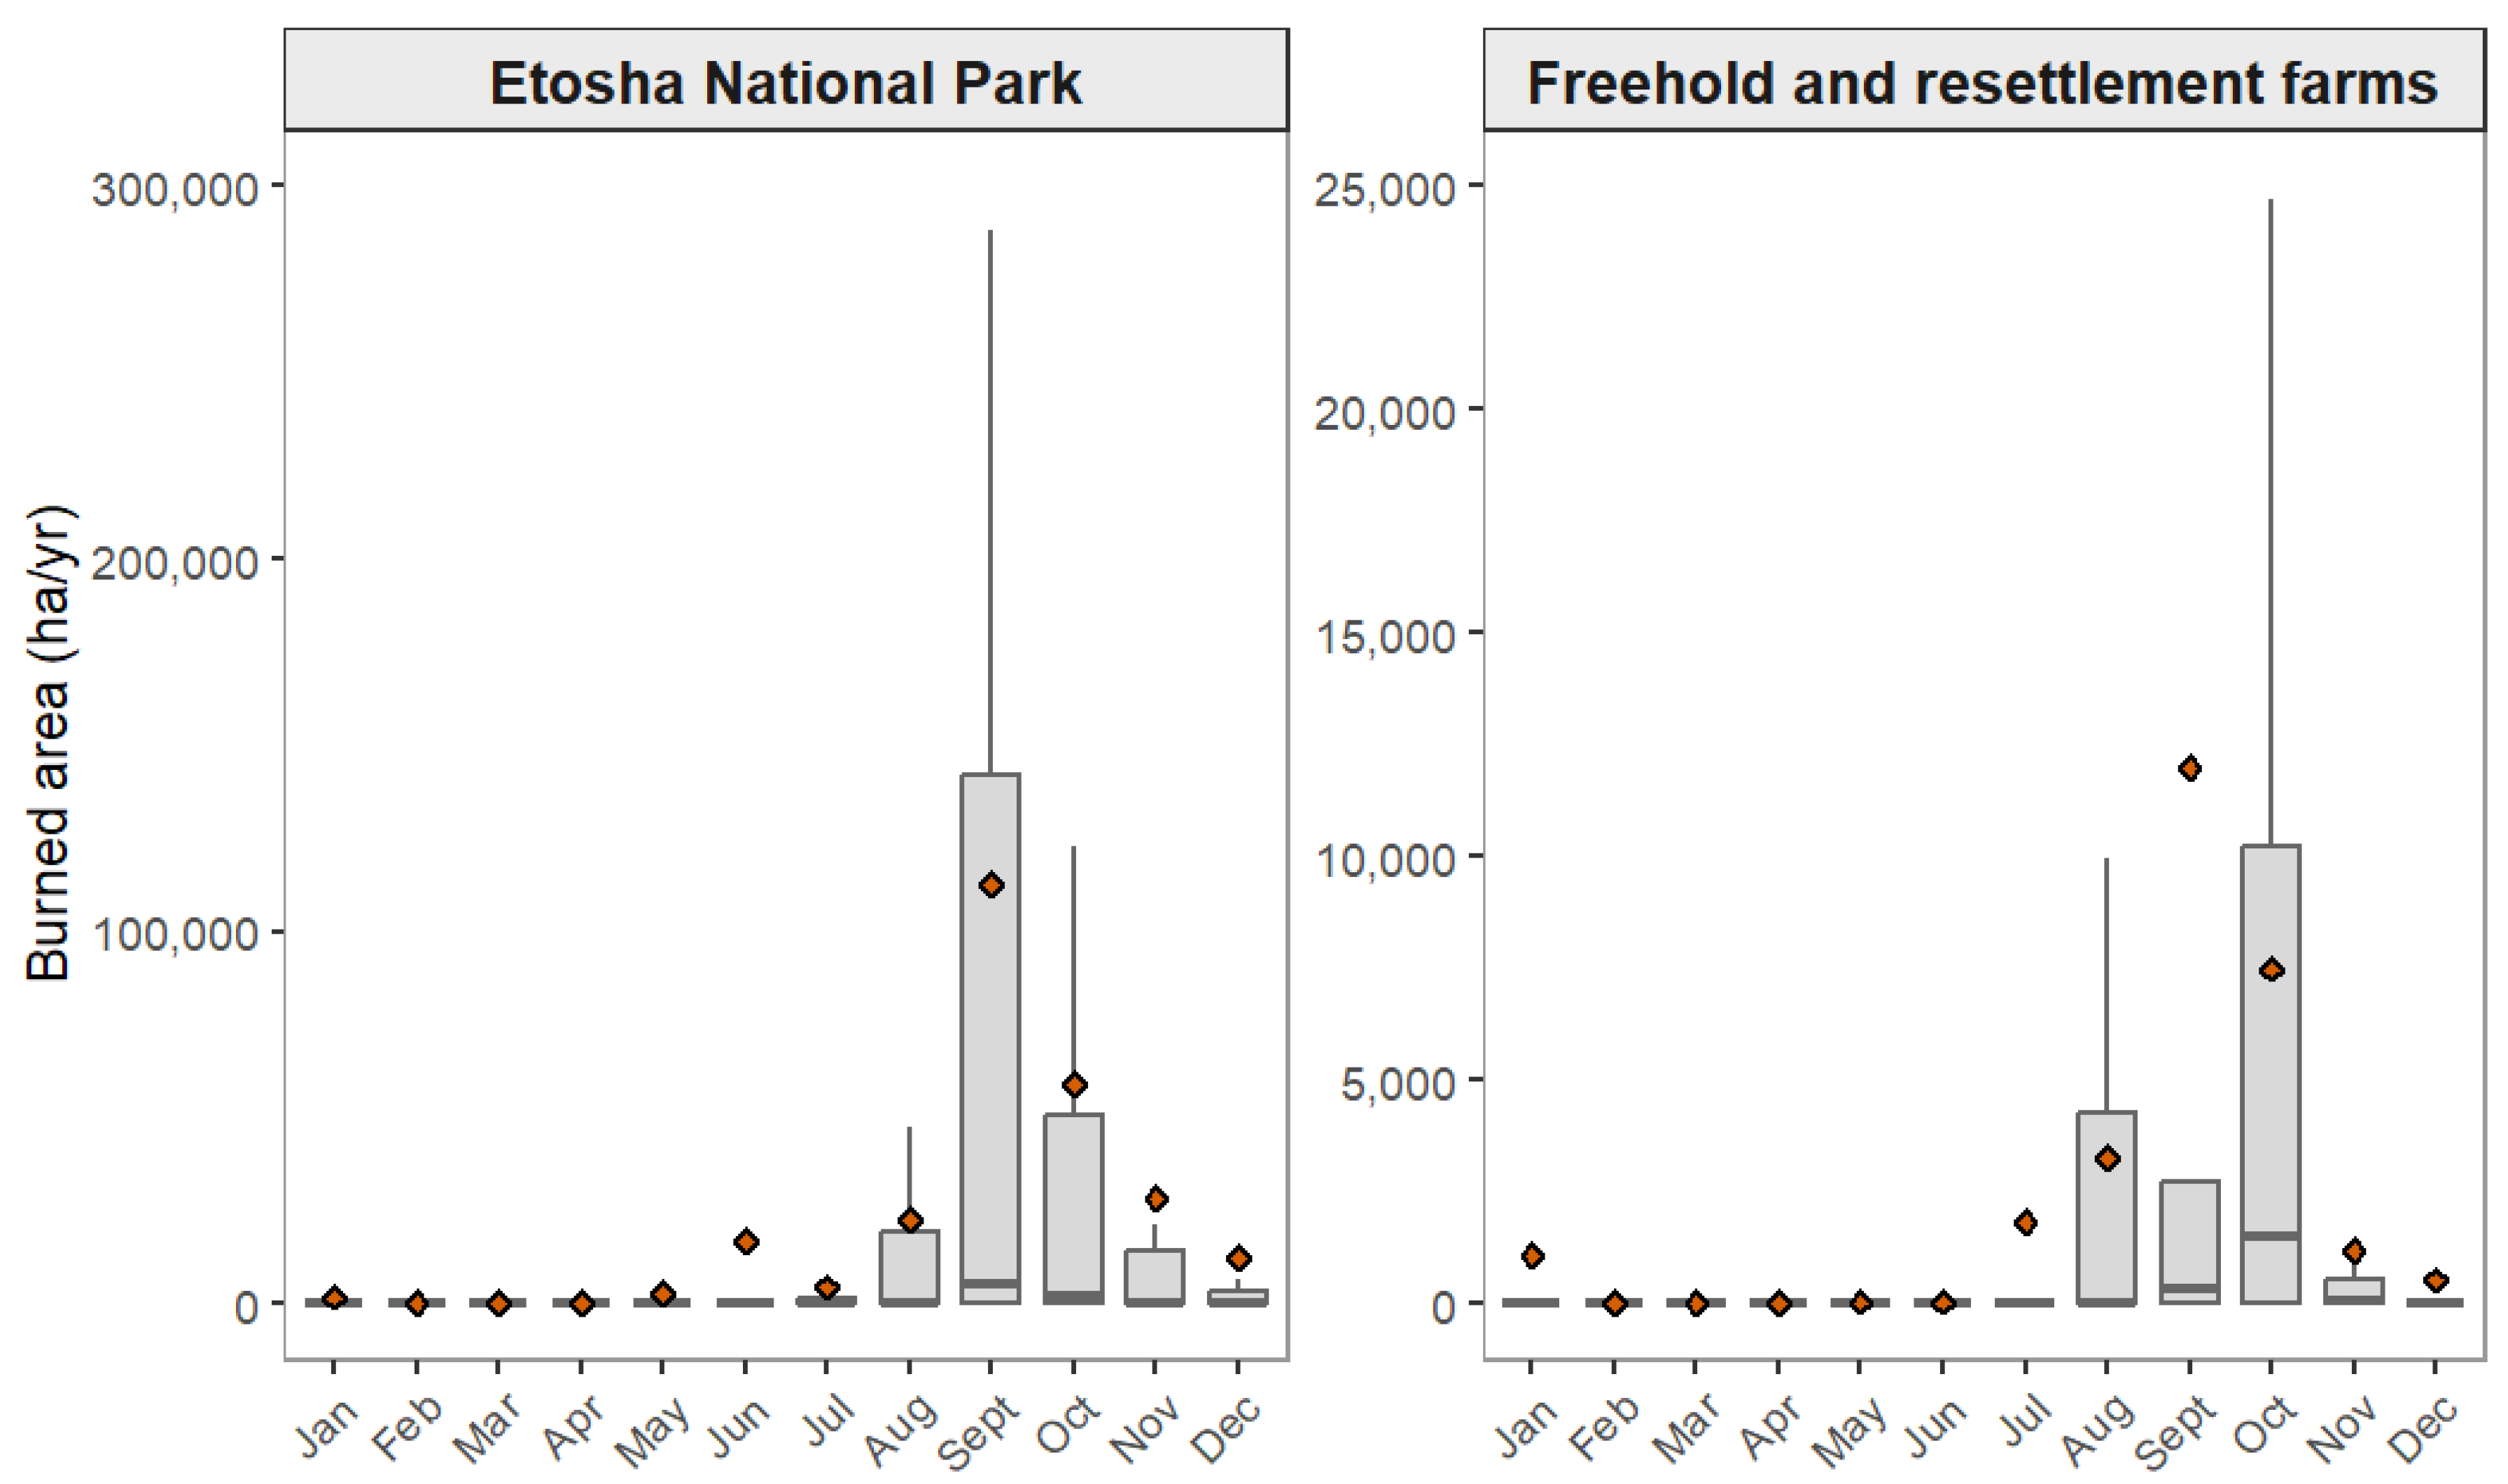
Figure 8.
Relationships between area burnt in a fire year in Etosha National Park and rainfall two years prior to the fire year (left panel); rainfall over the immediate past rainfall year (centre panel); and mean rainfall over the past two years (right panel) for 2001 through 2025. The regression equation for the immediate past rainfall year is y = 13.72x – 2787.33 (r2= 0.44). NS = not significant; * = P<0.05, ** = P<0.01; *** = P<0.001.
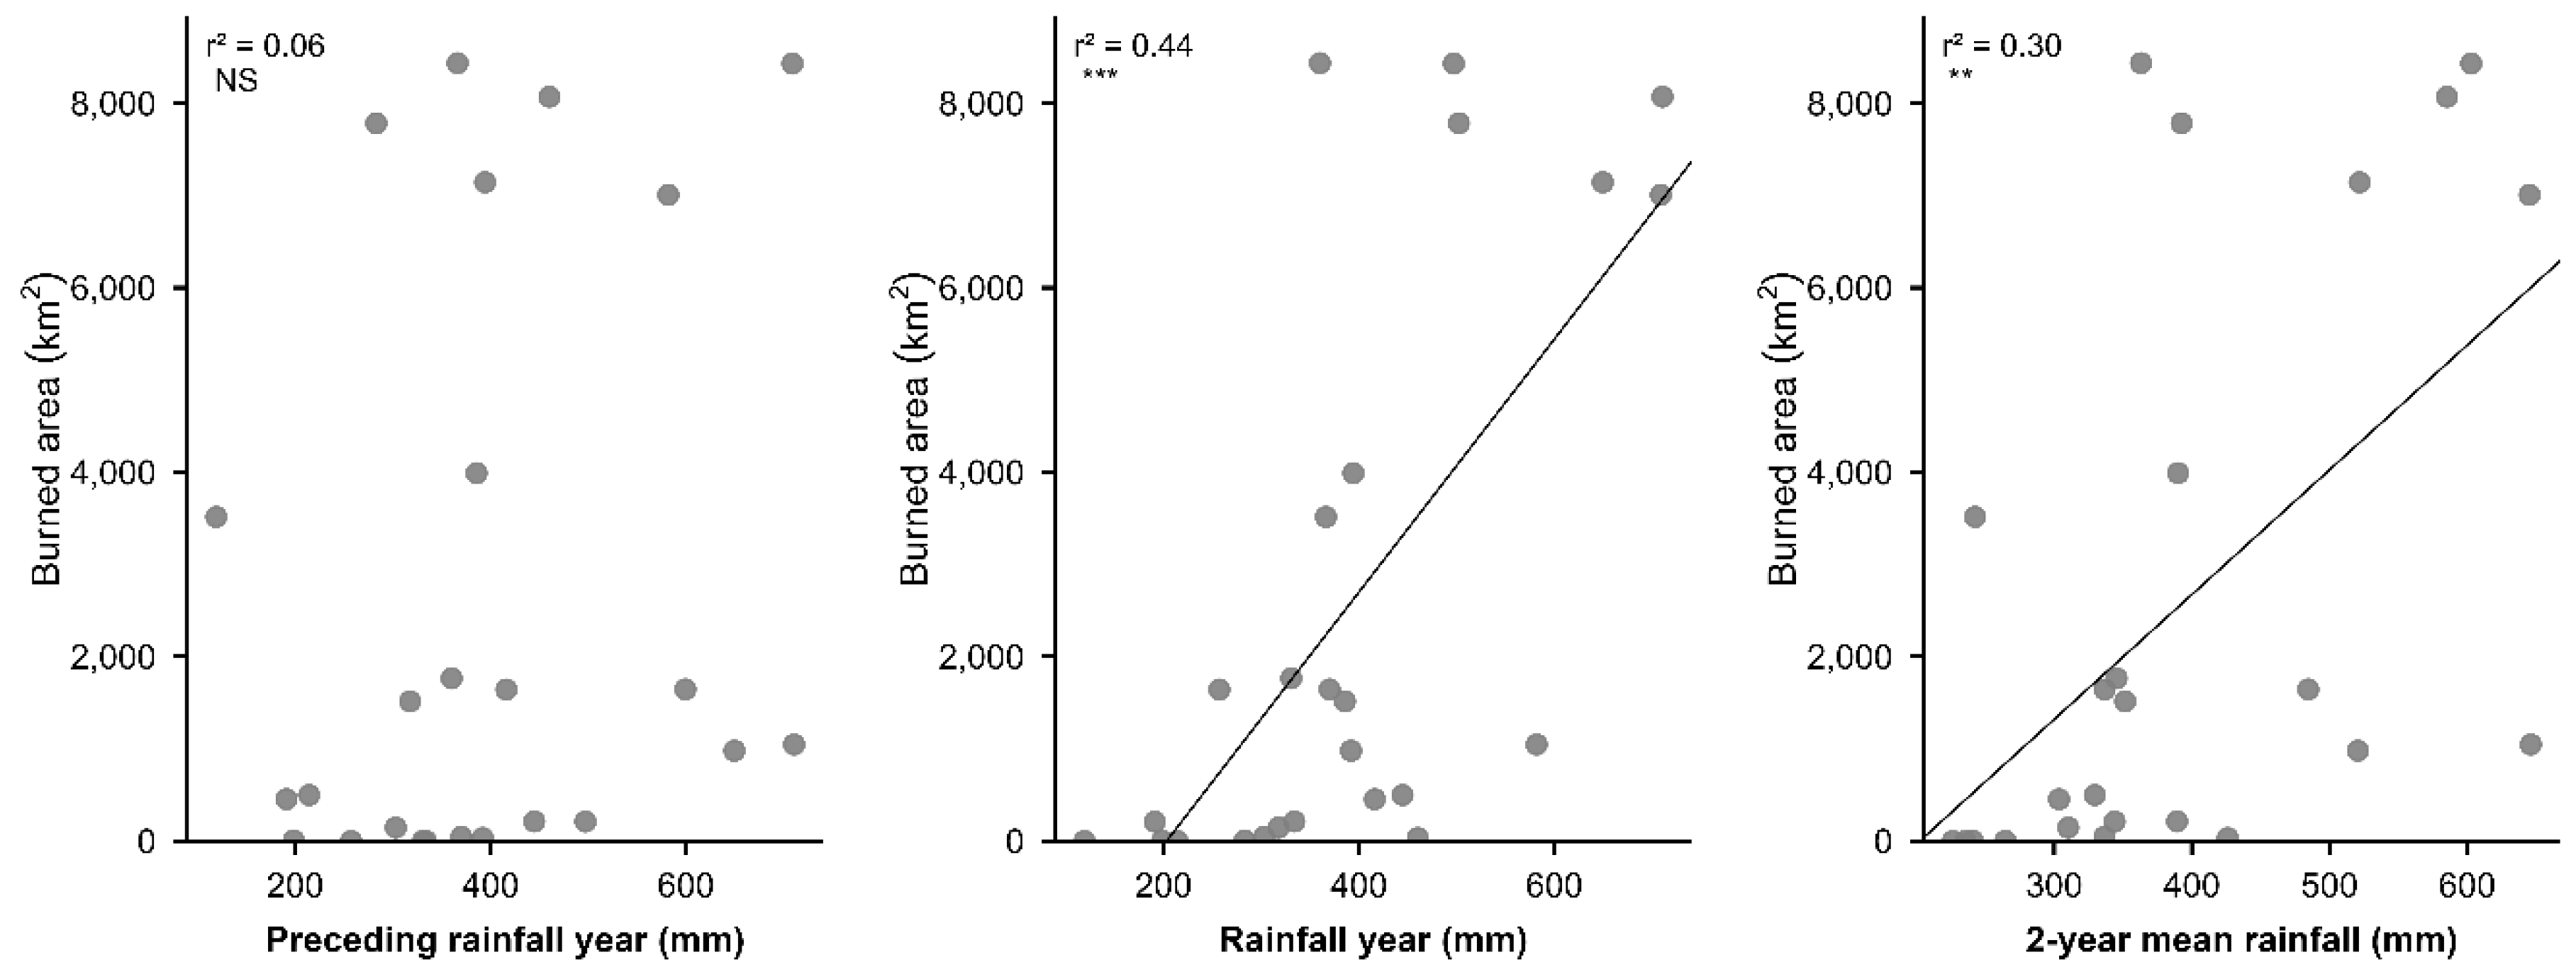
Figure 9.
Relationships between area burnt in a fire year in land south of Etosha National Park, and rainfall two years prior to the fire year (left panel); rainfall over the immediate past rainfall year (centre panel); and mean rainfall over the past two years (right panel) for 2001 through 2025. None of the relationships were significant (NS, P > 0.05).
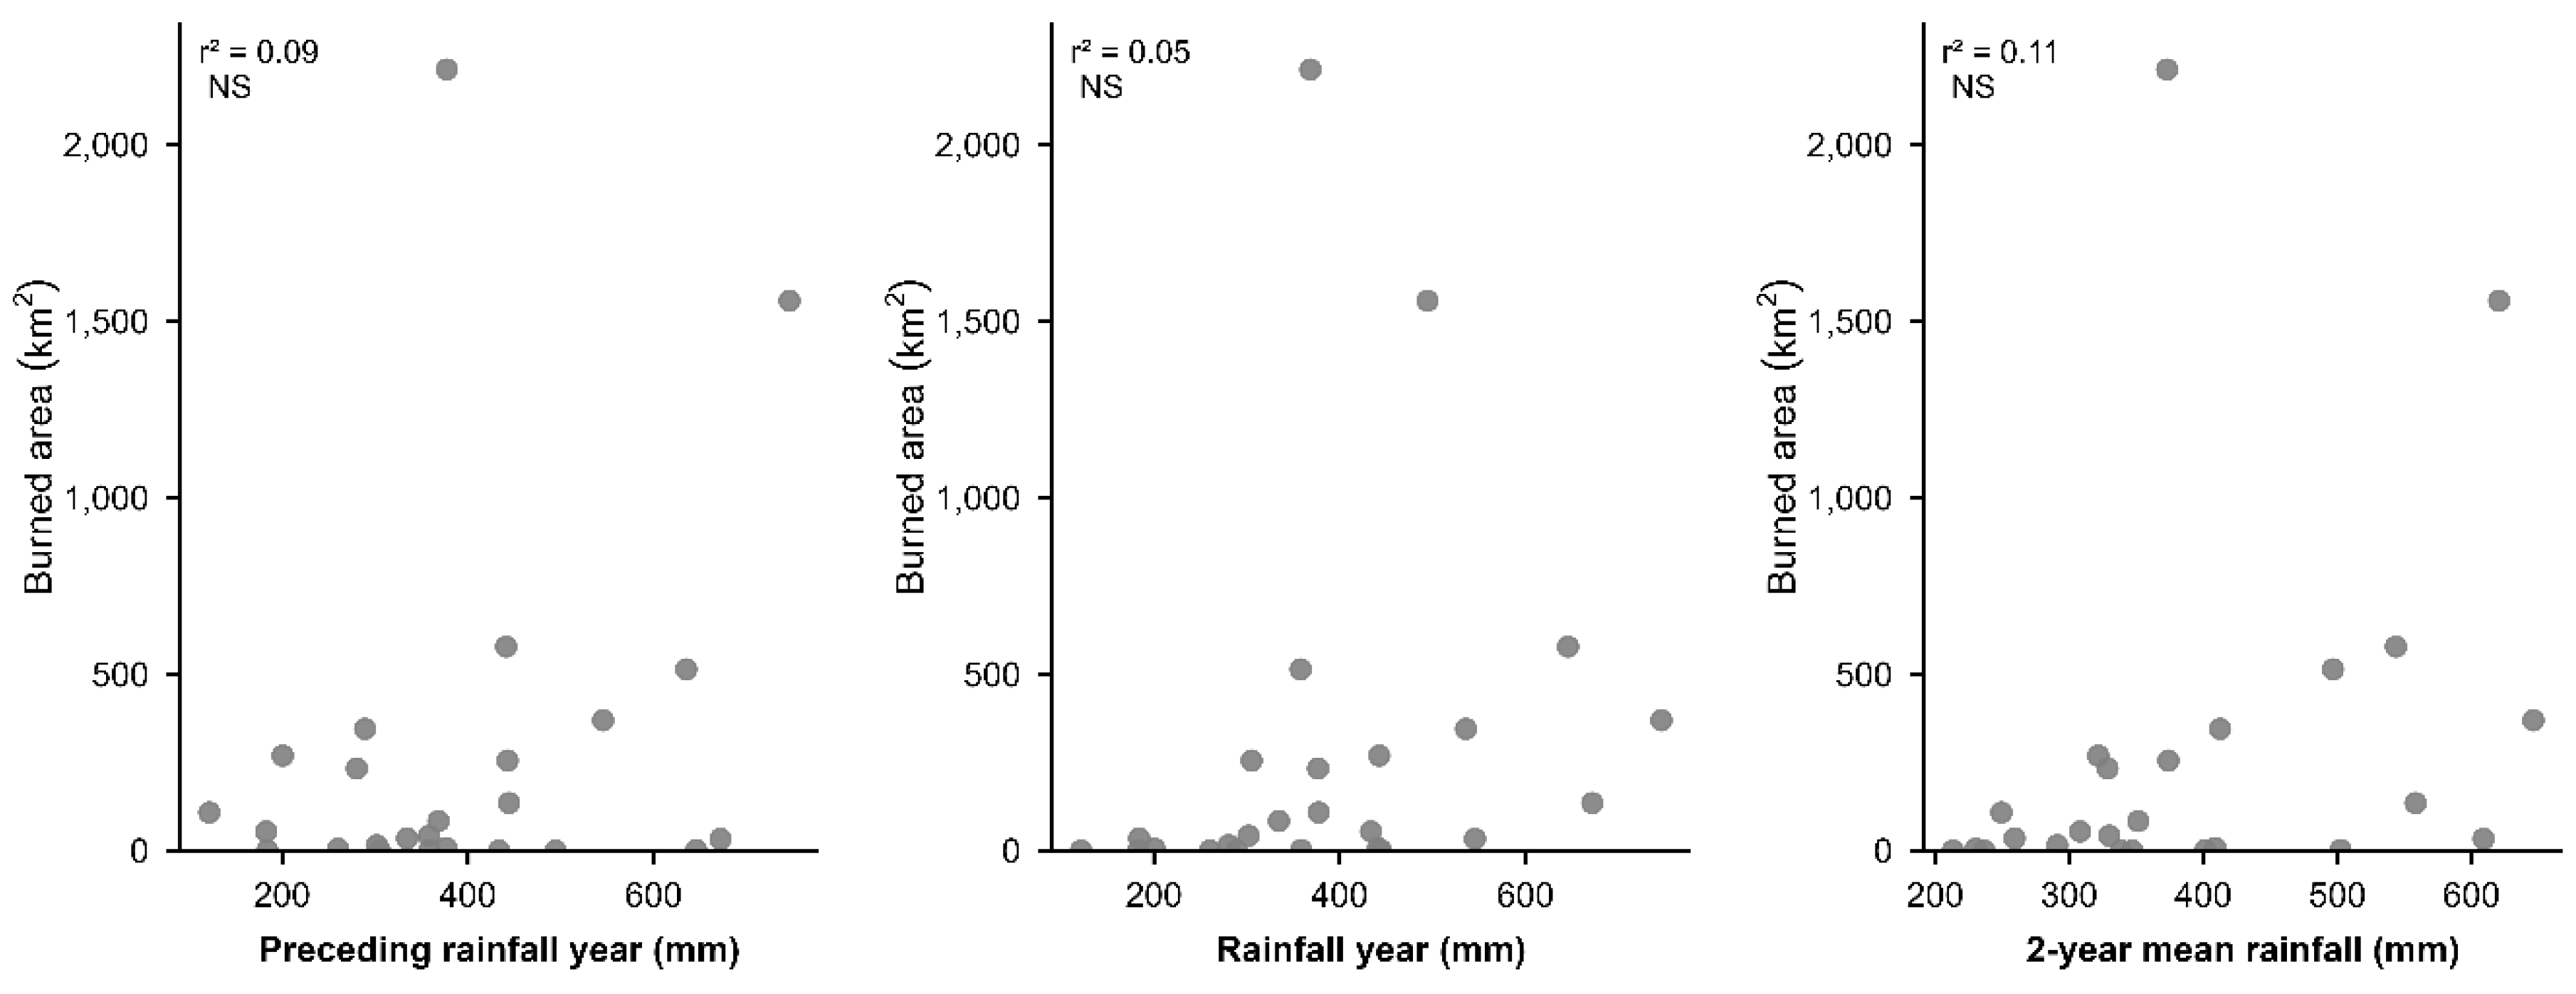
Figure 10.
The annual area burned (bars) from 2001 to 2025 in the Etosha National Park. The blue line shows rainfall received per rainfall year. The percentage of Etosha that burned per year is shown above the bars. .
Figure 10.
The annual area burned (bars) from 2001 to 2025 in the Etosha National Park. The blue line shows rainfall received per rainfall year. The percentage of Etosha that burned per year is shown above the bars. .
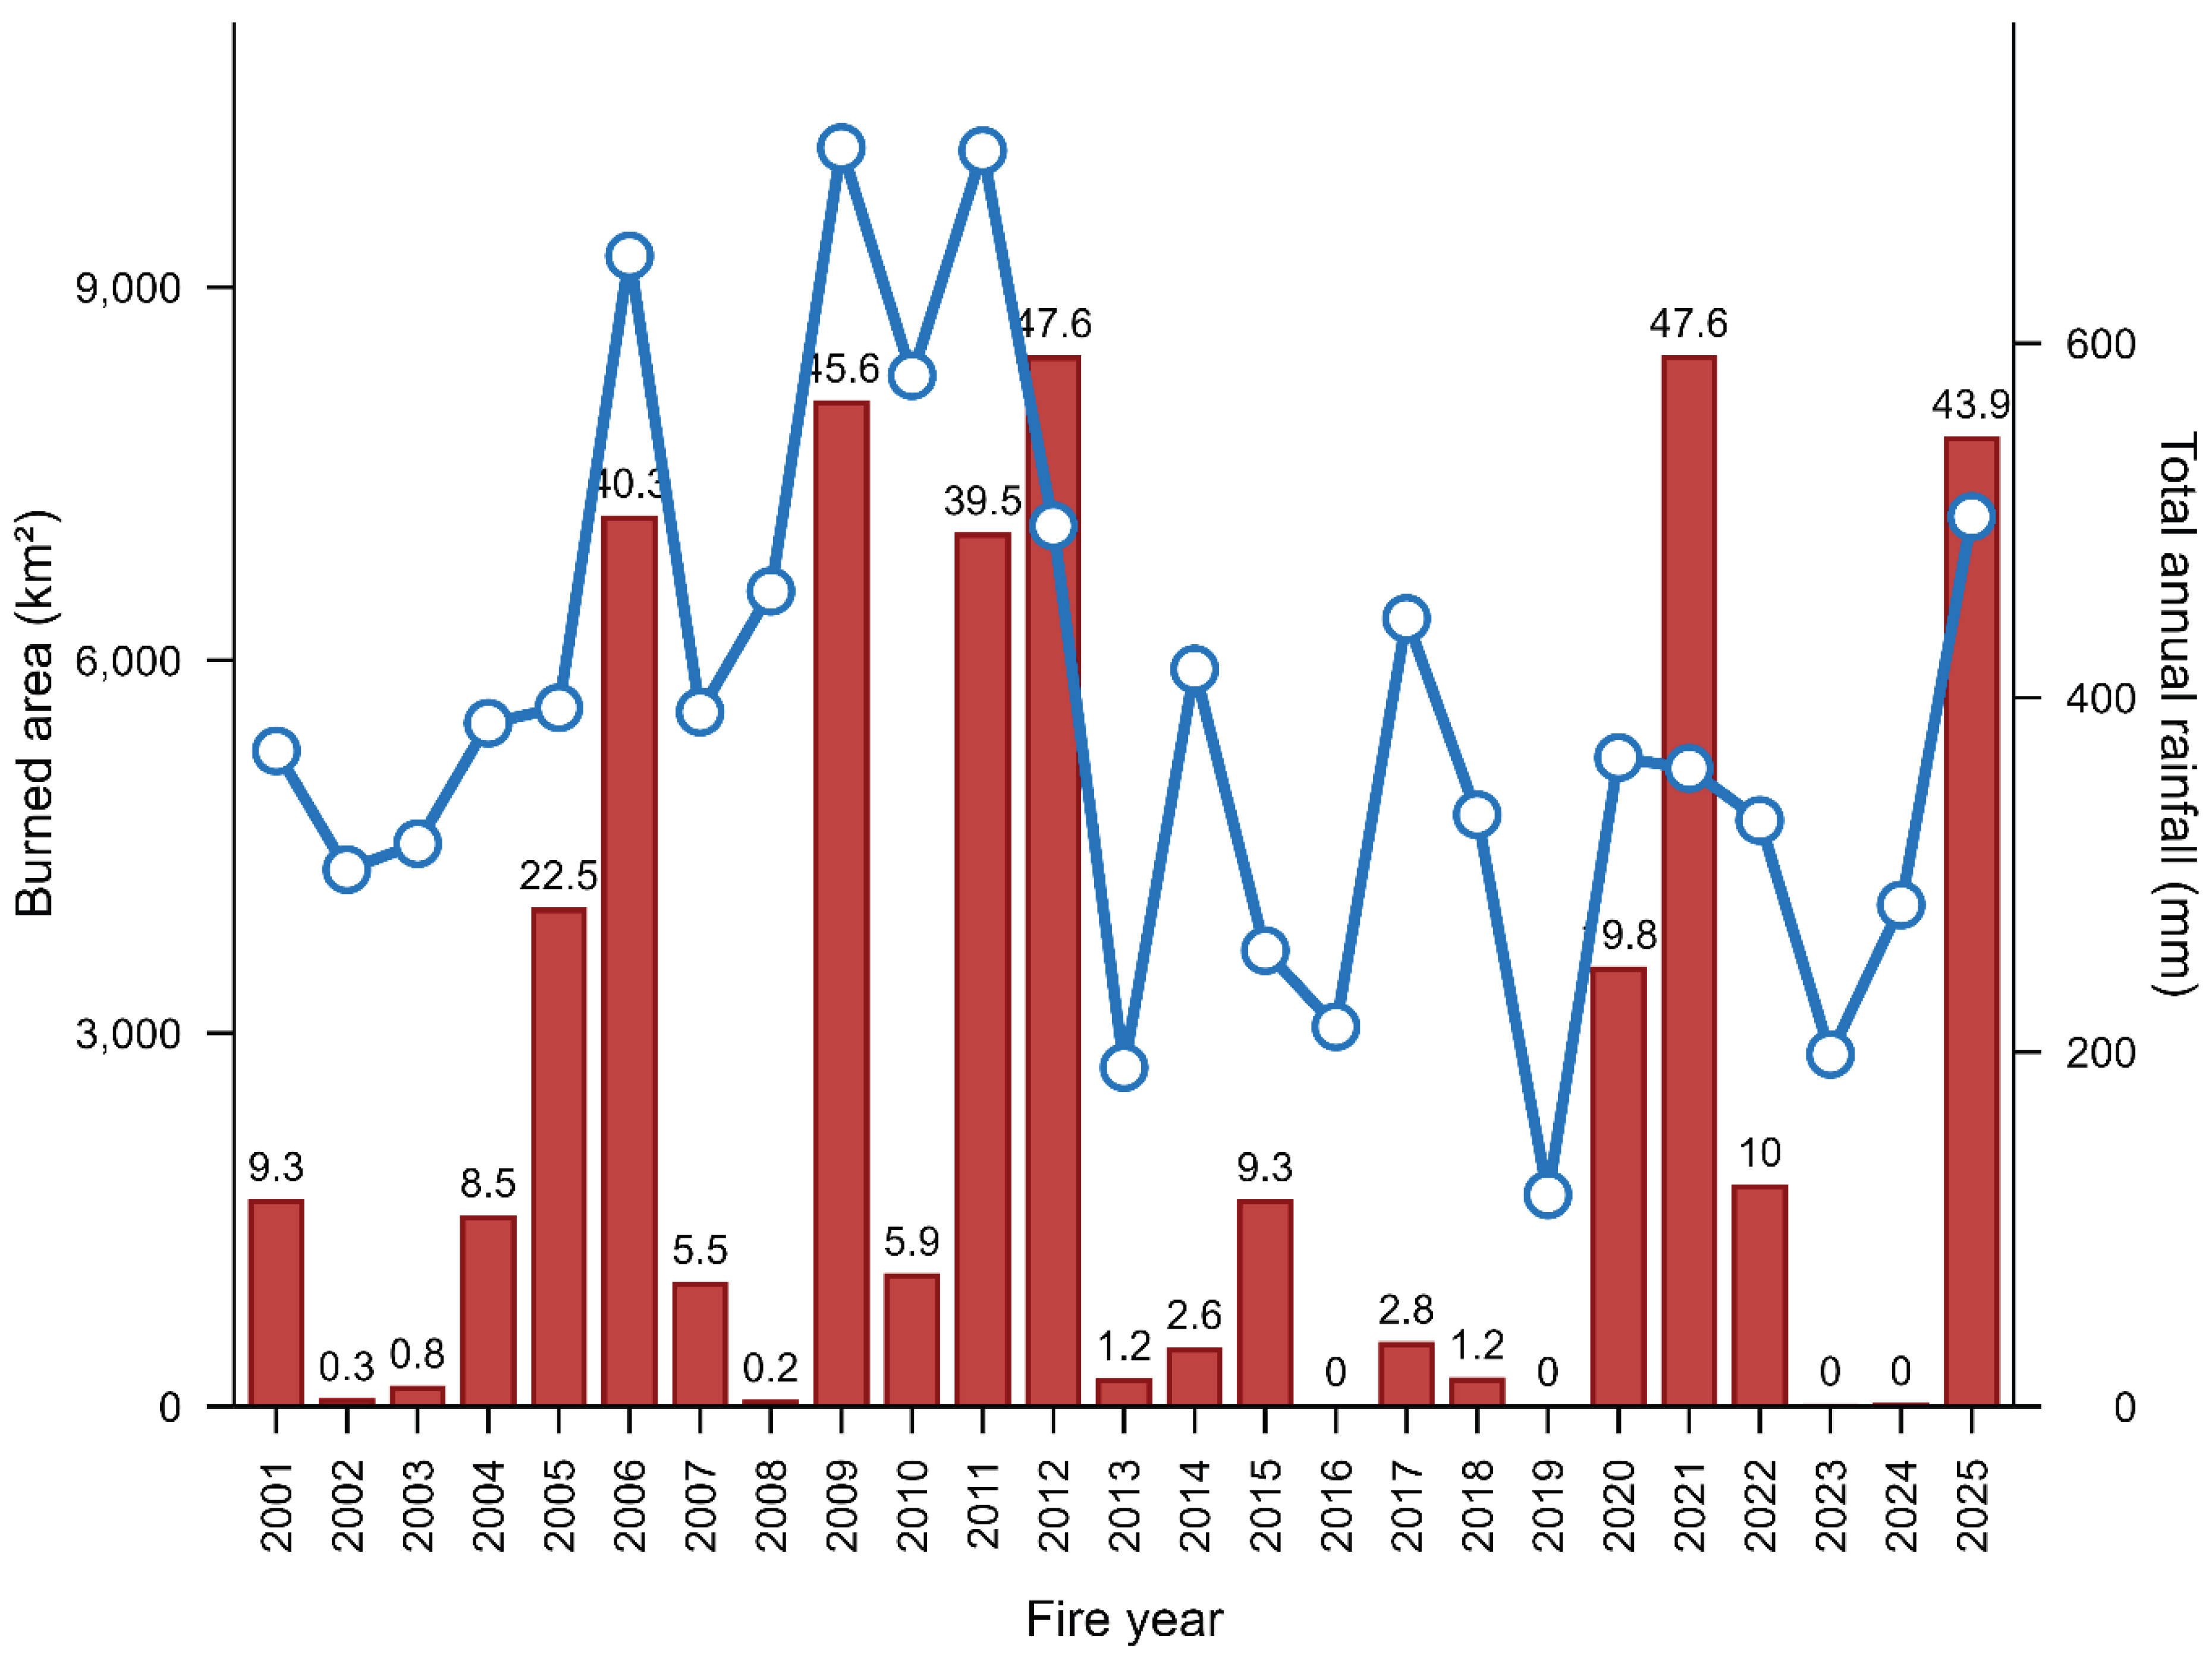

Table 1.
Areas burned, and estimated fire return intervals, between 2001 and 2025 in different categories of land use, vegetation types, and mean annual rainfall for the Etosha National Park and adjacent areas.
Table 1.
Areas burned, and estimated fire return intervals, between 2001 and 2025 in different categories of land use, vegetation types, and mean annual rainfall for the Etosha National Park and adjacent areas.
| Aspect examined | Category | Total area (km2) | Area burned over 25 years (km2) | Fire return interval (years) |
Proportion remaining unburnt (%) |
| Study area | Entire area | 24866 | 71264 | 8.7 | 20.6 |
| Land use | Etosha National Park (excluding pans) | 17717 | 64497 | 6.9 | 8.8 |
| Resettlement farms south of Etosha National Park | 1701 | 2479 | 17.1 | 36.2 | |
| Freehold farms and reserves south of Etosha National Park | 5449 | 4287 | 31.8 | 53.9 | |
| Vegetation type | Cuvelai drainage | 52 | 38 | 34.0 | 48.1 |
| Etosha grass and dwarf shrubland | 2045 | 3784 | 13.5 | 24.6 | |
| Karstveld | 14895 | 34757 | 10.7 | 23.9 | |
| Mopane shrubland | 3240 | 12462 | 6.5 | 3.5 | |
| North-eastern Kalahari woodlands | 771 | 93 | 206.9 | 88.7 | |
| Western highlands | 496 | 334 | 37.1 | 44.6 | |
| Western Kalahari | 3368 | 19795 | 4.3 | 0.5 | |
| Mean annual rainfall category (mm) | 200-250 | 212 | 110 | 48.2 | 66.8 |
| 250-300 | 7661 | 24271 | 7.9 | 26.5 | |
| 300-350 | 7291 | 21076 | 8.6 | 18.4 | |
| 350-400 | 6013 | 16639 | 9.0 | 12.0 | |
| 400-450 | 3517 | 8601 | 10.2 | 24.7 | |
| 450-500 | 171 | 567 | 7.5 | 9.7 |
Disclaimer/Publisher’s Note: The statements, opinions and data contained in all publications are solely those of the individual author(s) and contributor(s) and not of MDPI and/or the editor(s). MDPI and/or the editor(s) disclaim responsibility for any injury to people or property resulting from any ideas, methods, instructions or products referred to in the content. |
© 2026 by the authors. Licensee MDPI, Basel, Switzerland. This article is an open access article distributed under the terms and conditions of the Creative Commons Attribution (CC BY) license (http://creativecommons.org/licenses/by/4.0/).
Copyright: This open access article is published under a Creative Commons CC BY 4.0 license, which permit the free download, distribution, and reuse, provided that the author and preprint are cited in any reuse.


