
Submitted:
19 January 2026
Posted:
20 January 2026
You are already at the latest version
Abstract
Trachoma, caused by Chlamydia trachomatis (Ct), persists as a major cause of preventable blindness despite the global SAFE strategy. Understanding how Ct genovars and genovariants influence infection dynamics and clinical outcomes is crucial for sustaining elimination efforts and informing vaccine development. A four-year longitudinal study was conducted in a trachoma-endemic region of Tanzania across multiple rounds of mass drug administration (MDA) with azithromycin. Ct infections were genotyped by ompA sequencing to identify genovars and genovariants. Associations between genetic variants, bacterial load, and clinical signs of trachoma were assessed. Following MDA, a shift in Ct genovar prevalence occurred from genovar B to genovar A. Genovar B was associated with more severe clinical signs, including follicles, papillae, and scarring, whereas genovar A infections exhibited higher bacterial loads. Among 121 individuals with recurrent infections, 94% were re-infected with the same genovar, indicating limited protective immunity and incomplete clearance despite MDA coverage exceeding 60%. The genovariants B2, B9, and A2 predominated, with an A→T amino acid substitution in B9 potentially modifying antigenic recognition. Post-MDA, normalized genovariant diversity increased, suggesting ongoing transmission or strain reintroduction. Distinct genovar-associated clinical and immunological patterns underscore the need to elucidate genovar-specific virulence and immune evasion mechanisms. These findings provide key insights for optimizing trachoma control and advancing vaccine development.
Keywords:
Chlamydia trachomatis
; trachoma
; genovar
; genovariant
; MOMP
; Tanzania
; mass drug administration
; ompA
; antigenic variation
; vaccine development
1. Introduction
Chlamydia trachomatis (Ct) is an obligate intracellular bacterium that causes trachoma, an infection of the eye that can lead to blindness [1]. It is estimated that trachoma is responsible for visual impairment in 1.9 million people worldwide, with 103 million people living in trachoma endemic areas [2]Although Chlamydia trachomatis has been widely studied, there are currently no approved vaccines against infection or the development of blinding complications. There are however vaccines being developed[3,4] with primary targets focusing on the Major Outer Membrane Protein (MOMP), a chlamydial protein that expresses multiple T and B cell epitopes [5,6].
MOMP is encoded by the gene Outer Membrane Protein A (ompA), and it is sequence differences in this gene that enable different chlamydial serotypes to be identified [7]. There are 19 recognised serotypes of Ct, of which serotypes A-C are overwhelmingly responsible for ocular infection [8]. Ocular serotypes display a level of geographical localisation, with serotypes A and B dominating in Africa, Asia and south America and serotypes Ba and C mostly identified in indigenous communities in Australia and islands in Australasia [9]. The 19 serotypes can be divided into 2 main immunotypes known as the B- and C-complexes. These are dependent on the 4 major epitope regions present in MOMP, known as variable domains (VD) 1-4. Serotypes A and C are part of the C-complex, whereas serotype B (and the minor serotype Ba) are part of the B-complex. This difference in complex-type between the two dominant ocular serotypes A and B is significant as vaccines developed against only one complex may lack protection against infection with the other [10].
Due to this key role in interacting with the immune system, it is postulated that Ct may benefit from slight differences in MOMP which help to evade the immune response and hinder the development of subsequent immunity [11]. However, while numerous ocular ompA genovariants have been identified, [12,13,14,15,16] there is limited evidence that demonstrates whether this translates to either greater evasion of the immune system or enhanced infectiousness or virulence. One of the challenges in determining the role of sequence genovariants within Ct genotypes is that many studies rely solely on cross-sectional data. This approach captures a single snapshot in time, allowing researchers to observe an association between specific sequence genovariants and the presence of active trachoma. However, because cross-sectional studies can only suggest associations these are insufficient to establish a causal link, account for the impact of recurrent infections, or determine how specific genotypes influence the progression to conjunctival scarring. Therefore, longitudinal studies that track individuals over time are necessary to fully elucidate long-term causal effects.
In this study samples were collected from a longitudinal cohort of children living in a trachoma endemic region of Tanzania [17,18,19,20,21]. A cohort of 666 children from 3 villages in northern Tanzania were initially enrolled in a 4-year study of progressive scarring trachoma, infection and clinical signs with samples and trachoma grades recorded every 3 months. Annual mass drug administration with Azithromycin was delivered as recommended by the WHO. The identification of Ct-positive children and associated clinical grading in a longitudinal study provides a valuable opportunity to investigate the ompA sequence genovariants that may be associated with the clinical signs of trachoma, recurrent infection and the effect of MDA.
2. Materials and Methods
Ethics
Ethical approval for the collection of the samples used in this study was granted by the London School of Hygiene & Tropical Medicine and the Tanzania National Institute for Medical Research, Kilimanjaro Christian Medical University College as outlined in the original study plan [22]. As all participants were under the legal age of consent, written informed consent from a parent or legal guardian was necessary for enrolment, with the study explained in local languages prior to requesting consent.
Study Design and Population
The study design and study population is described by Ramadhani et al. [20,23]. In brief, 666 children between the ages of 6-10 years old living in three rural villages in Northern Tanzania were eligible for enrolment in the study of which 616 were initially enrolled. The study collection ran from 2012-2016 with the aim of collecting samples every three months (17 timepoints in total). The median number of study participants seen from the 17 timepoints was 451 (range 380 – 536). A total of 7640 conjunctival swabs were subjected to Ct diagnostic testing. Each village was treated with three rounds of annual MDA with azithromycin, which occurred between timepoints 3-4, 7-8 and 11-12, except for village 3, which had an additional fourth round of MDA between timepoints 15 and 16, since trachoma prevalence remained above 15% after the third round of treatment.
Sample Collection and Processing
Conjunctival swab samples and clinical trachoma grades were collected following the method described by Ramadhani et al., 2019. The key clinical signs recorded at each time point were conjunctival scarring, follicles and papillae, each scored on a scale of 0-3 [24]. Scarring scores were determined using the method outlined in Ramadhani et al. [18]. In brief, photographic grading was used to assess new or progressive conjunctival scarring by comparing baseline and final images. When baseline or final images were missing, the nearest time-points were substituted (timepoints 2 and 16). All images were graded by an experienced ophthalmologist using a detailed scarring system [25,26]. The collected samples were stored at -80 degrees until ready for processing. DNA extraction and diagnostic qPCR was performed in Tanzania on all samples to determine Ct positivity and bacterial load as previously described [23]. In brief, Ct was detected at time-point 1 by droplet digital PCR (ddPCR) and at all other time-points by validated multiplex qPCR [27]. Both assays targeted the plasmid pORF2 and the outer membrane complex protein B (omcB) genes. DNA samples were shipped on dry ice to the London School of Hygiene & Tropical Medicine for further analysis.
OmpA Genotyping
OmpA sequences from the cohort were obtained in 2 ways. Firstly, ompA sequence was extracted from Ct whole genome sequences (WGS) using a reference-based assembly method (PRJEB46956) as previously described [28]. In brief, sequences were extracted from quality-filtered reads by aligning to three reference genomes (A/Har13, B/Jali20 and C/TW3) with Bowtie2. The ompA sequence with the lowest percentage-missing calls per whole-genome sequence was used in downstream analyses. Secondly, PCR positive Ct samples not selected for WGS due to insufficient yield for sequencing were subjected to an ompA-nested PCR for amplicon-based Sanger sequencing. PCR was conducted using a Veriti Thermocycler (Thermo Fisher), following the procedure outlined in Andreasen et al., (2008). For the first round, 20 ul of 5prime MasterMix, 20 ul of molecular grade water, 2.5 ul each of forward and reverse primers ompA-87 TGAACCAAGCCTTATGATCGACGG and ompA1163 CGGAATTGTGCATTTACGTGAG and 5 ul of DNA template were run using the cycling conditions as follows: Initial denaturation of 2 minutes at 94 °C, then 35 cycles of 94 °C for 15 s and 62 °C for 75 s, and a final elongation step of 72 °C for 10 minutes. This PCR resulted in a product of 1076 base pairs (bp) in size. Samples were run on a gel, and if no band was present, nested PCR was performed. For the second round of PCR, 10 ul 5prime MasterMix (QuantaBio), 1.25 ul ompA-87 and 1.25 ul ompA-1059 GCAAGATTTTCTAGATTTCATC primers and 11.5 ul molecular grade water were added to 1 ul of a 1 in 200 dilution of the product from the first round. The final product size of the target sequence was 972 bp in length. This product was then cleaned using a ratio of 0.8 X final volume of AMPure XP magnetic beads (Beckman Coulter) following the manufacturer’s instructions, quantified on the Qubit 2.0 Fluorometer (Thermo Fisher) and diluted to a concentration of ~10 ng/ul. All samples were sequenced by Source Bioscience (Cambridge, UK).
Genovariant Calling
Sequence files received from Source Bioscience were first base-called and trimmed to remove bases with a quality score below Q20 (a 99% base call accuracy). The resulting high-quality sequences were then converted to the FASTA format and subsequently used to query all Chlamydia sequences available in NCBI via BLASTn to determine the genotype/genovar/genovariant [29] according to the consensus nomenclature proposed. Sequencing data for every sample was then split into their respective genotypes and aligned to a reference sequence, B-TW/5 (M17342) for genotype B and A/HAR-13 (DQ064279) for genotype A to determine genovar. All sequences were trimmed to 850 bp in length to ensure a standardised read, with the trimmed sequence spanning full coverage of VDII-VDIII, and partial coverage of VDI and VDIV. Sequences where there were overlapping peaks at specific positions were re-sequenced to confirm the overlap, and if true overlapping peaks were found, genovariants could not be called and these sequences were not included in any genovariant analyses.
Antigenicity Prediction
The antigenicity of the top two genotype B genovariants was compared using the Immune Epitope Database (IEDB.org) B cell epitope prediction online tool. The semi-empirical Kolaskar and Tongaonkar Antigenicity Epitope Prediction method was used [30], with a 281 amino acid peptide broken down into sequentially overlapping 7-mer peptides. Data are shown as antigenicity scores, with values above 1.0 indicating an above-average likelihood of antigenicity.
Data Analysis
Basic exploratory tests were done to compare between genovars, genovariants, and pre- and post-MDA. The difference in the loads of the plasmid pORF2 gene between the three genovars was tested using linear mixed effects models to account for repeated measures present for some individuals, with ID set as the random effect. The load between genovar B and the most frequent genovariant (B9) was tested using the same method. The difference between the clinical signs of follicles, papillae and scarring between pre- and post-MDA time points was tested using the non-parametric Kruskal-Wallis test. Association analyses were conducted using multiple response variables. The original ordinal clinical scores of scarring, follicles and papillae were analysed separately using mixed effects ordinal logistic regression in R (CLMM package). Each positive infection was treated as a separate event, with the role of the dependent variables age, gender, genotype, Ct load and genovariant tested on each clinical sign, with balozi and id used as the random effects. Only one genovariant (B9) had a high enough allele frequency to perform a statistical analysis in relation to clinical signs. Models were run including age and gender as standard, with females set as the reference level for gender; the variables genotype, Ct load and genovariant were tested using a backwards selection approach, with the model with the lowest Akaike information criterion (AIC) chosen for the final estimates. Two new response variables were created to investigate the influence of the dependent variables on the presence of multiple clinical signs, following the technique outlined in Chin et al., [16]. The first was defined as no scarring=0, scarring but no inflammation (inflammation defined as papillae score of 3) =1, and scarring and inflammation =2. FPC grades of P3 equate to a diagnosis of TI by the WHO simplified system. The same was done using the follicle score in place of scarring, but including both F2 and F3 follicle scores. These response variables were also analysed using ordinal mixed effects logistic regression. Scarring progression was categorised as a binomial variable and analysed using mixed effects logistic regression using the package lme4 [31], including the dependent variables age and gender, and a binary variable representing the presence or absence of a serial genovar infection, defined as an individual experiencing serial genovar infections with a differing ompA genovar or ompA genovariant over the 4-year study period. The pathogen diversity of each village was calculated for pre- and post-MDA timepoints and first and last timepoints using the Shannon index from the Vegan package[32] in each village.
3. Results
A total of 593/7856 (7.7%) specimens were identified as positive for Ct infection by diagnostic qPCR, with 451 (75%, 238 individuals) of these successfully sequenced for ompA. The prevalence of infection at baseline was 15.4%, with a final prevalence of 4.8% at time point 17, 4 years after baseline (Ramadhani et al., 2017) (Figure 1). Of the people successfully sequenced for ompA, 121 were positive for Ct infection at two or more timepoints, 17 of which had different genotypes (A, B or Ba) at separate timepoints.
3.1. ompA Genovars
Three genovars were found in these samples; genovar A (n=222), genovar B (n=222) and the minor genovar Ba (n=7). The majority of samples at the first three time points prior to the first round of MDA were genovar B (Figure 2). Most genotype A infections were found in village 3, whereas genovar B was more evenly spread. The number of Ct positive individuals dropped substantially after the first MDA, with a prevalence of 1% at timepoint 4. The majority (94%) of infections prior to any treatment were genovar B (168 B/Ba; 10 A) whereas in the years following the first round of MDA genovar A accounted for 78% of infections (61 B; 215 A). While the proportion of genovar A individuals increased over time from time point 7 onwards, low numbers of genovar B were maintained throughout most of the the remaining time points (Figure 2). The analysis of bacterial load demonstrated that genovar A infections (mean load: 12256 copies/ul) had a statistically higher load relative to B/Ba genotypes overall (mean load: 754 copies/ul) (t-test, p<0.01). Genovar load varied substantially over time and in response to MDA treatment (Figure 3).
3.2. Genovariants
Within genovar, nine A genovariants and nine B genovariants were identified (Supplementary Tables 1 and 2), relative to the respective reference genotypes for A and B. Single nucleotide variants (SNV) were only defined as single nucleotide polymorphisms when more than 1% of the population expressed the SNV. There were no genovariants in genovar Ba sequences. Genovariants were located throughout the sequence, with one of the dominant genovar A genovariant (A2) SNPs located three AAs from a known MOMP immunogenic epitope (VAGLEK) located in VD 1 [33]. For genovar A, genovariant A2 accounted for over 97% of the samples, all other genovariants had a frequency of one. For genovar B, there were two genovariants with a frequency above one, genovariant B2 (n=197) and genovariant B9 (n=21). Genovariant B9 was found in predominantly pre-MDA time points 1-3, with one individual in time point 4. There was no significant difference between the loads of the most common genovariant B2 and genovariant B9.
All genovar A samples but one had the two base pair changes shown in genovariant A2, relative to the reference sequence A/HAR13 (supplementary Table 1). The first of these changes resulted in an amino acid change of Alanine to Threonine, and the second changed the amino acid from isoleucine to leucine. All B genotype samples had the same genovariant changes relative to the reference sequence B/TW-5 shown in genovariant B2. Genovariant B9, the most common genovariant (n=21), had just one SNP at the very last position in variable domain 4, which changed the amino acid from alanine to threonine. Predicted antigenicity indicated that the change in amino acid between the most common genovariant B2 (GDVKTSA) and the second most common genovariant B9 (GDVKTST) resulted in a small reduction in antigenicity on the Kolaskar and Tongaonkar scale (1.005 to 0.983) . For the most common genovar A genovariant (A2), relative to the A/HAR13 reference, the amino acid changed from Alanine to Threonine and resulted in a reduction in antigenicity from 1.086 to 1.064.
3.3. Clinical Signs Association Analyses
Genovar B showed significant association with the presence of follicles, papillae and scarring across all timepoints. A Kruskal-Wallis test comparing each clinical sign between timepoints sorted into two groups of pre-MDA (timepoints 1-3) and post-MDA (timepoints 4-17) showed that there was a strong significant difference between the two MDA stages (p<0.001) for all three clinical signs. Age was also indicated as significant for the decreased risk of developing follicles but increased risk of scarring, with increasing age increasing the likelihood of scarring by a factor of 1.2, whereas increasing age decreased the likelihood of follicles (Table 1).
For the new variables created following Chin et al. [34] age and genotype were significant for scarring and/or inflammation, whereas genotype was associated with the presence of follicles and/or inflammation, with genotype B having higher odds relative to genovar A for both variables. There was no evidence to suggest that scarring progression was associated with any of the variables tested. For the scarring progression analysis, 109 children did not have data available, due to missing surveys from beginning and/or end timepoints (supplementary Table 4).

Table 1.
Association analysis results. The reference levels for genovar, age and gender were genotype A, 1 year and female respectively. Genovariant refers to the second most frequent genovar B genovariant B9 (n=21). Only the results for variables that were included in the final models with the lowest AIC are shown.
| Response Variable | Dependent variables | Adjusted odds ratio (95% CI) | P value |
| Scarring (0-3) | Age Gender Genotype B Genotype Ba |
1.23 (0.98-1.54) 0.89 (0.37-2.15) 13.64 (4.90-37.93) 4.79 (0.17-135.2) |
0.08 0.79 <0.001 0.36 |
| Follicles (0-3) | Age Gender Genotype B Genotype Ba |
0.81 (0.71-0.93) 1.33 (0.79-2.22) 2.27(1.41-3.65) 3.40 (0.19-59.25) |
0.0032 0.28 <0.001 0.40 |
| Papillae (0-3) | Age Gender Genotype B Genotype Ba |
0.96 (0.81-1.14) 1.12 (0.58-2.19) 3.38 (1.9-6.10) 1.17 (0.07-19.60) |
0.69 0.73 <0.001 0.91 |
| Scarring and/or inflammation (0-2) |
Age Gender Genotype B Genotype Ba |
1.21 (1.05-1.40) 1.21 (0.7-2.08) 7.78 (3.56-17.0) 6.5 (1.03-40.4) |
0.00858 0.5 <0.001 0.046 |
| Follicles and/or inflammation (0-2) |
Age Gender Genovariant B9 Genotype B Genotype Ba |
0.95 (0.86-1.06) 1.2 (0.8-1.8) 2.52 (0.96-6.6) 2.47 (1.56-3.91) 1.91 (0.36-10.1) |
0.4 0.4 0.06 <0.001 0.45 |
| Scarring progression (Y/N) |
Age Gender Serial genotype infection |
0.94 (0.76-1.16) 1.33 (0.61-2.93) 1.7 (0.55-5.31) |
0.358 0.468 0.558 |
3.4. Diversity
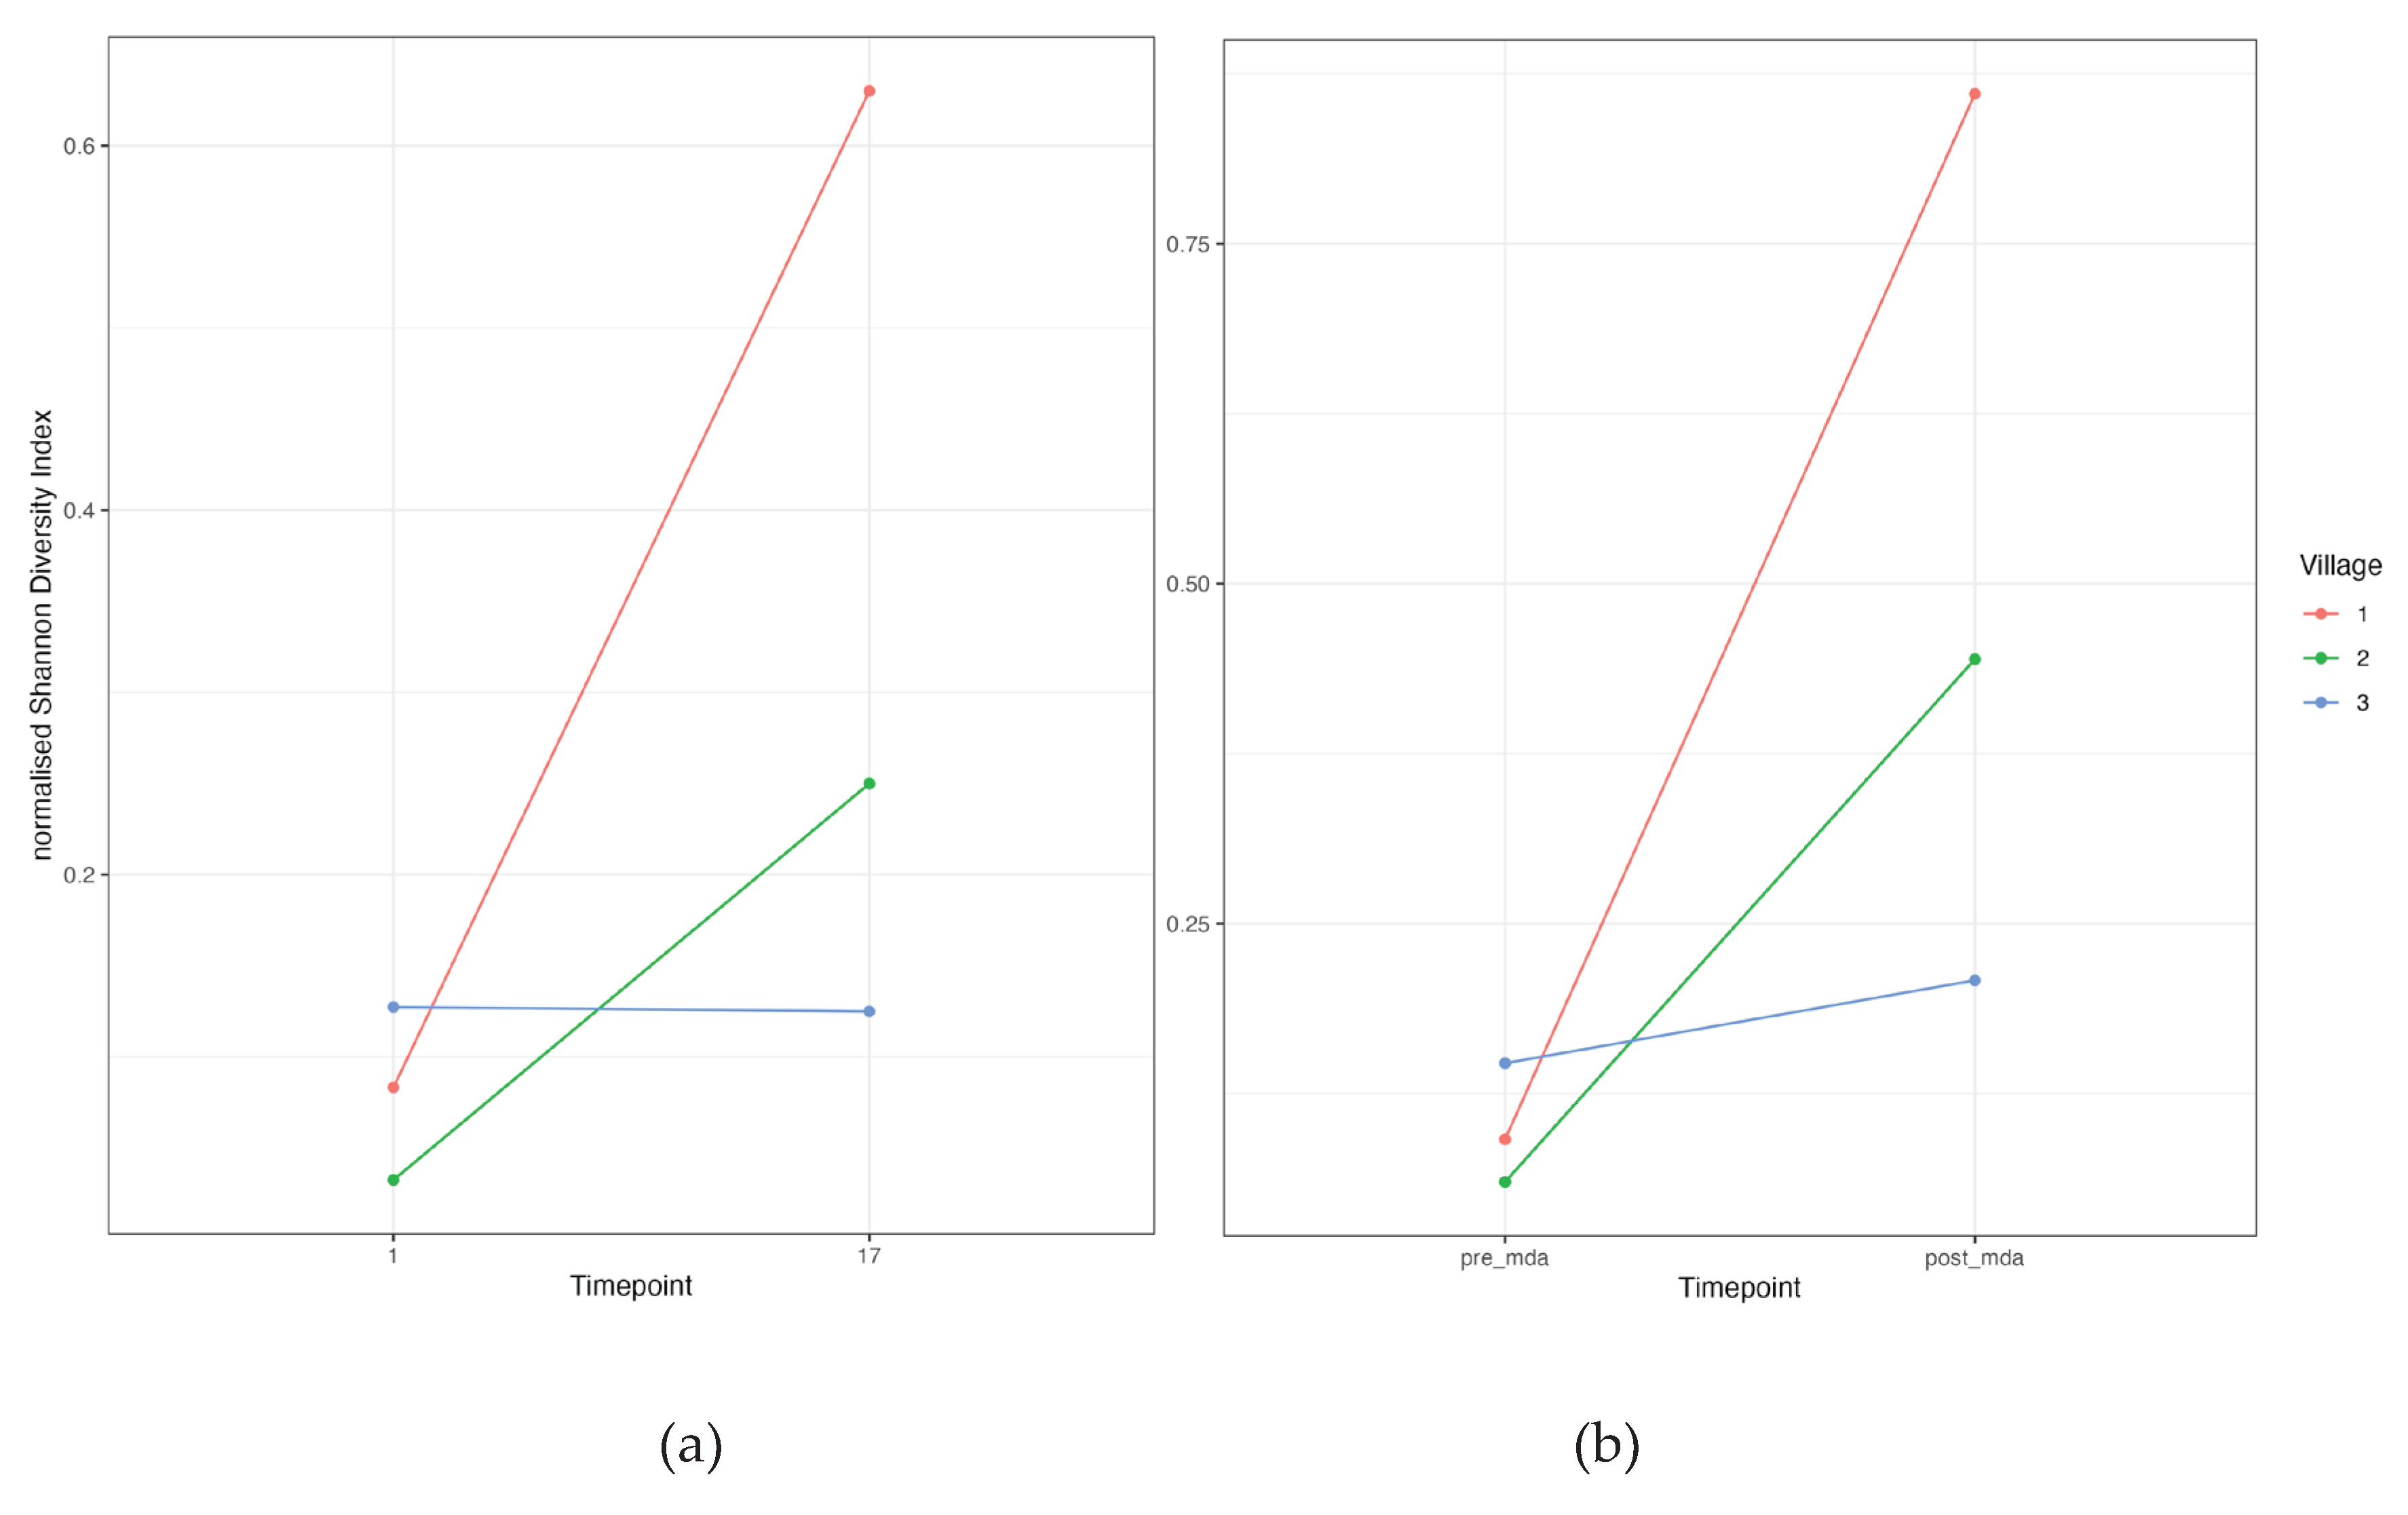
Ct ompA genovariant diversity increased substantially after MDA for villages 1 and 2, however village 3 had a much smaller increase (Figure 4). The comparison between the first and last time point demonstrated a similar pattern, with almost identical levels of diversity for village 3 between the two time points.
4. Discussion
A The present study provides valuable insights into the dynamics of Ct infections, specifically focusing on the role of genovars and genovariants of the MOMP, how they are impacted by MDA and their association with clinical signs in a trachoma-endemic region of Tanzania. The World Health Organization has targeted trachoma for elimination for over 25 years. Progress via the SAFE strategy has been remarkable. In 2002, an estimated 1.5 billion people were at risk of trachoma; as of early 2026, that number has plummeted to below 100 million—a reduction of over 90 [35]. In some areas however trachoma remains a significant public health concern, and understanding transmission dynamics is key to determining drivers of persistence and re-emergence in areas where SAFE has been conducted. In addition to this, despite extensive research, the absence of approved vaccines against active infection or blinding trachoma underscores the need for a deeper understanding of the factors influencing the pathogenesis of Ct.
Our findings highlight the prevalence and distribution of Ct genotypes, with a notable shift from genovar B to genovar A following the first round of mass drug administration (MDA). In a longitudinal study based in Ethiopia by Mosenia et al., [36], children that had been re-infected with Ct were generally re-infected with the same genovar, with only one household in 19 switching from A to B. In another study of adult Tanzanian women, over 70% were infected with the same genovar three years after the first sample collection [37]. Out of 121 people who had recurrent infections in this study, only 28 had multiple different genovariant infections over time, and of these 28, 17 switched between genovar A and B. One likely reason for the observed change from genotype B to A in this study may be partially due to the differences in genovars between the villages at baseline, and the relative proportion of samples collected from each village at later timepoints. Village 3 for example had more genovar A positive individuals in the pre-MDA timepoints (1-3) than villages 1 and 2. As the villages are located in close enough proximity to assume some level of population mixing, it is possible that infected people from village 3 were responsible for transmitting the genovar A infections observed in villages 1 and 2 at timepoint 14 and onwards (Figure 2). Individual level MDA coverage for the cohort was above 60% for all MDA treatments (Figure 1), and of the 121 people who were infected more than once, 114 were treated at least once prior to reinfection, over the course of the study (supplementary Table 6). While this suggests that some people in the cohort did not receive treatment and could therefore have feasibly transmitted infection to previously recovered people, it also suggests that re-infection is a relatively common occurrence.
The study’s longitudinal design, spanning four years and incorporating multiple rounds of MDA, is a notable strength, providing a unique dataset to explore the influence of recurrent infections, genovars and their genovariants on the prevalence of clinical signs as well as scarring progression. Association analyses between genotypes and clinical signs revealed that genotype B showed a significant association with the presence of follicles, papillae, and scarring. Genotype B has been shown to be associated with higher levels of inflammation (TI and TF) [16] and that genovars A and B may trigger subtle differences in host inflammatory responses [38,39]. Genovar B, however, is confounded by the timing, with the vast majority of genotype B found before MDA, and the pre-MDA timepoint being significantly associated with higher follicles, papillae and scarring. This makes it difficult to tease apart the relative roles of genovars and MDA on the severity of the clinical signs of trachoma. There were no variables that were shown to be significantly associated with scarring progression.
The longitudinal nature of this study also allows the influence of multiple infections with different genovars to be investigated. A serial genotype infection was not indicated as influential for any response variable, however the number of people with serial infections was low so statistical power may be lacking to confidently draw this conclusion; Of the 121 people with recurrent infections, 83% were infected with the same genotype, and 77% were infected with the same genovariant. Repeated infection even after treatment was also observed (supplementary Table 6), suggesting the effects of MDA are relatively short-lived. A similar proportion of matching serotypes and genotypes was found in a study conducted on 22 children infected with Ct in Tanzania between 1989 and 1995 [40]. While some individuals may have been experiencing a single uninterrupted infection rather than a re-infection, this inability to clear the same or near identical ompA infections indicates the hosts do not mount an immune response sufficient to clear initial infection or prevent reinfection.
The analysis of ompA genovariants within genovars revealed the dominance of a small number of genovariants, with genovariants B2 and B9 in genotype B and genovariant A2 in genovar A representing the majority of genovars. The impact of these genovariants on antigenicity was explored, demonstrating potential for significant change: Since the hydroxyl (OH) group of Threonine is a stronger hydrogen bond donor/acceptor and can be a site for phosphorylation or O-linked glycosylation, this substitution can drastically alter how an antibody recognizes the residue. If the residue is on the surface, the change from non-polar (A) to polar (T) can modify the local hydrophilicity and surface accessibility, which are key factors for B-cell epitope recognition. Even a small increase in the antigenic propensity score due to the A → T change could cause the region to move from non-epitope to epitope (or vice versa), making the change meaningful for prediction. B9 was the only genovariant with a high enough frequency to allow statistical analysis to be conducted on its impact on clinical signs; while it was not significant for any of the clinical signs, the model investigating the ordinal response variable ‘follicles and/or inflammation’ did suggest that individuals infected with genovariant B9 may be up to 2.5 times more likely to have follicles and or inflammation (P=0.06). The amino acid change observed in B9 switched from A → T. Threonine contains a hydroxyl (-OH) group, which can form hydrogen bonds, and can therefore significantly alter the local charge distribution and polarity within the epitope region. The OH group of threonine also has hydrogen bonding potential, and can form hydrogen bonds with other amino acids within the epitope or with other parts of the antigen; in the influenza virus haemagglutinin protein, a mutation at position 156 from Ala-to-Thr has been shown to add a glycosylation motif which blocks neutralizing antibody binding (Schuele et al., 2023).
The majority of the genovariants were found in pre-MDA timepoints 1-3, however when diversity was normalised to account for the number of infections, it was evident that diversity post-MDA was substantially higher relative to timepoints before the first round of MDA (Figure 4). This finding implies that there is an influx of Ct strains entering the cohort population, or incomplete control of transmission. It has been speculated that if ompA diversity is brought to low levels following MDA, the resulting population bottleneck of distinct chlamydial strains would result in more widespread individual-level immunity to the reduced number of genovars and hence keep the prevalence at a low level. Chin et al. [41] found there was no relationship between Ct diversity and Ct transmission, however this study was limited by relatively small number of positive Ct results per community, partly due to MDA. Others have found opposing results, where genetic diversity was significantly associated with the presence of active trachoma [12], however in that study MDA was not given to the cohort. As a high proportion of repeated infection was with identical or near identical ompA strains, it suggests that ompA diversity may be less important in overall immunity than the hosts ability to develop an effective immune response to Ct .
Another interesting result of this study is the observation that there was a significantly higher load of Ct in people infected with genovar A over genovar B. This is unexpected as in other studies genovar B was associated with a higher Ct loads and prevalence of clinical signs, indicating more inflammation [42,43]. However, as shown in Figure 3, Ct load fluctuated substantially over time for both genovar A and genovar B, with load increasing in genotype A after timepoint 6. MDA is likely to have had an influence on Ct load; In a study by Last et al. [44], load significantly decreased after treatment with Azithromycin. The limitation of using load as a factor is that studies have shown that Ct load can vary substantially between individuals [45], and between strains [46]. Studies have also shown that plasmid copy number in Ct and other Chlamydia species can be increased, potentially as a response to chemical stress [47].
There are several study limitations; village 3 had a much larger population sampled throughout the study, as well as an additional round of MDA. As this village appeared to be driving much of the infection with genovar A at later time points but did not have as high a proportion sampled at earlier timepoints where genovar B was dominant, it creates confusion with regards to the relative roles of genovar in Ct virulence, as well as relative genovariant diversity. Multiple rounds of MDA also made determining the effect of individual MDA on re-infection difficult; of the 76 people who experienced infection before and after treatment, there was substantial individual variation between the amount of time that had passed after the most recent round of MDA and the subsequent re-infection (Supplementary Table 4). However, this is the frequency with which MDA is delivered by the national programme for control as advised by WHO [48], and is therefore reflective of trachoma control dynamics. Other limitations include ompA load based plasmid qPCR and sample collection frequency of three months. These may not be ideal due to some variation in plasmid copy number per sample and infection duration, which in 4-15-year-olds can be as little as two weeks [49] in other longitudinal studies.
5. Conclusions
The long-term study of Ct dynamics in a trachoma-endemic Tanzanian population illuminates the complex effects of MDA. MDA may influence genovar diversity by driving a shift from the dominant B genovar to the A genovar, and this genovar change may be of significance: Genovar B showed a stronger link to severe clinical signs (inflammation and scarring), while Genovar A was associated with higher bacterial burden, highlighting distinct genovar–host interaction patterns. The persistent recurrence of infections, often by the same genovar after treatment, points to problems with incomplete clearance and a weak protective immune response. Ultimately, these results call for research focused on genovar-specific immune mechanisms and virulence factors to develop an effective trachoma vaccine and optimize future eradication campaigns.
Supplementary Materials
The following supporting information can be downloaded at the website of this paper posted on Preprints.org. Table S1: Genotype A genovariants, with the position and base pair followed by the amino acid. Table S2: Genotype B genovariants, with the position and base pair followed by the amino acid. Table S3: Number of individuals presenting clinical signs per genotype and village. Table S4: Demographic table of those excluded from the analysis due to not having information on scarring progression in comparison to those included- age, sex, village. Table S5: Number of people with each genotype per timepoint. Table S6: Infection and treatment timepoints for people who were positive for Chlamydia trachomatis more than once. N=120.
Author Contributions
Conceptualization, M.H., M.B., R.B., and D.M.; methodology, A.H., E. G., H.P., M.H., M.B., R.B., D.M; validation, M.H., P.M., T.M., and M.B.; formal analysis, A.H., E.G., H.P., M.B. and M.H.; investigation, A.H., E.M., A.R., P.M., A.M., T.D., E.G., H.P., M.H and M.B.; resources, M.H., M.B., R.B., D.M.; data curation, A.H., A.R., H.P, E.G., T.D.; writing—original draft preparation, A. H., M.H.; writing—review and editing, A.H., M.H.,; visualization, A.H., and M.H; supervision, M.H., M.B., and T.D.; project administration, T.M., M.H., M.B., and T.D.; funding acquisition, M.H., M.B., R.B., and D.M. All authors have read and agreed to the published version of the manuscript.
Funding
This study was funded by the Wellcome Trust (grants 098481/Z/12/Z and 093368/Z/10/Z) and The EU Horizon 2020 Programme (733373). The APC was funded by lshtm library OA services”.
Institutional Review Board Statement
The study was conducted in accordance with the Declaration of Helsinki, and approved by the Institutional Review Board (or Ethics Committee) of London School of Hygiene and Tropical Medicine (protocol code 5988 ammendment approved 20/11/2017), National Institute of Medical Research, Tanzania (protocol code NIMR/HQ/R.8c/Vol. I/529 27/03/2018 and Kilimanjaro Christian Medical University College (protocol code 412 and 23/01/2018).
Informed Consent Statement
Informed consent was obtained from all subjects or their guardians involved in the study.
Data Availability Statement
The data that were used to support the findings of this study are available from the corresponding author upon request.
Acknowledgments
We would like to acknowledge the study field teams, village assistants, participants, families and households where this study took place. The authors have reviewed and edited the output and take full responsibility for the content of this publication.
Conflicts of Interest
The authors declare no conflicts of interest. The funders had no role in the design of the study; in the collection, analyses, or interpretation of data; in the writing of the manuscript; or in the decision to publish the results.
Abbreviations
The following abbreviations are used in this manuscript:
| MDA | Mass Drug Administration |
| SNV | Single nucleotide variant |
| WHO | World Health Organization |
| SAFE | Surgery, Antibiotic, Facial cleanliness, Environmental improvement |
| FPC | Follicles, Papillae, Cicatrices |
| MOMP | Major Outer Membrane Protein |
| ompA | Outer membrane protein A |
| S | Conjunctival Scarring |
References
- Solomon, A.W.; Burton, M.J.; Gower, E.W.; Harding-Esch, E.M.; Oldenburg, C.E.; Taylor, H.R.; Traoré, L. Trachoma. Nat Rev Dis Primers 2022, 8, 32. [CrossRef]
- World Health Organisation. Trachoma Available online: https://www.who.int/news-room/fact-sheets/detail/trachoma (accessed on 19 January 2026).
- Poston, T.B. Advances in Vaccine Development for Chlamydia Trachomatis. Pathog. Dis. 2024, 82. [CrossRef]
- Pollock, K.M.; Borges, Á.H.; Cheeseman, H.M.; Rosenkrands, I.; Schmidt, K.L.; Søndergaard, R.E.; Day, S.; Evans, A.; McFarlane, L.R.; Joypooranachandran, J.; et al. An Investigation of Trachoma Vaccine Regimens by the Chlamydia Vaccine CTH522 Administered with Cationic Liposomes in Healthy Adults (CHLM-02): A Phase 1, Double-Blind Trial. Lancet Infect. Dis. 2024, 1–16. [CrossRef]
- Ortiz, L.; Demick, K.P.; Petersen, J.W.; Polka, M.; Rudersdorf, R.A.; Van der Pol, B.; Jones, R.; Angevine, M.; DeMars, R. Chlamydia Trachomatis Major Outer Membrane Protein (MOMP) Epitopes That Activate HLA Class II-Restricted T Cells from Infected Humans. J. Immunol. 1996, 157, 4554–4567.
- Shi, Z.; Zhu, S.; XU, W.; LU, L.; LI, L.; Zhang, L. The Cellular Immune Response Produced in BALB/c Mice Immunized with HPV6b L1/Ct MOMP Multi-Epitope Chimeric DNA. Chinese Journal of Microbiology and Immunology 2010, 942–948.
- Nunes, A.; Borrego, M.J.; Nunes, B.; Florindo, C.; Gomes, J.P. Evolutionary Dynamics of OmpA, the Gene Encoding the Chlamydia Trachomatis Key Antigen. J. Bacteriol. 2009, 191, 7182–7192.
- Burton, M.J. Trachoma: An Overview. Br Med Bull 2007, 84, 99–116, ldm034 [pii]. [CrossRef]
- Porter, M.; Mak, D.; Chidlow, G.; Harnett, G.B.; Smith, D.W. The Molecular Epidemiology of Ocular Chlamydia Trachomatis Infections in Western Australia: Implications for Trachoma Control. Am. J. Trop. Med. Hyg. 2008, 78, 514–517.
- Olsen, A.W.; Rosenkrands, I.; Holland, M.J.; Andersen, P.; Follmann, F. A Chlamydia Trachomatis VD1-MOMP Vaccine Elicits Cross-Neutralizing and Protective Antibodies against C/C-Related Complex Serovars. NPJ Vaccines 2021, 6, 58.
- Kim, S.-K.; DeMars, R. Epitope Clusters in the Major Outer Membrane Protein of Chlamydia Trachomatis. Curr. Opin. Immunol. 2001, 13, 429–436.
- Zhang, J.; Lietman, T.; Olinger, L.; Miao, Y.; Stephens, R.S. Genetic Diversity of Chlamydia Trachomatis and the Prevalence of Trachoma. Pediatr. Infect. Dis. J. 2004, 23, 217–220. [CrossRef]
- Andreasen, A.A.; Burton, M.J.; Holland, M.J.; Polley, S.; Faal, N.; Mabey, D.C.W.; Bailey, R.L. Chlamydia Trachomatis OmpA Variants in Trachoma: What Do They Tell Us? PLoS Negl. Trop. Dis. 2008, 2, e306. [CrossRef]
- Hsieh, Y.-H.; Bobo, L.D.; Quinn, T.C.; West, S.K. Determinants of Trachoma Endemicity Using Chlamydia Trachomatis OmpA DNA Sequencing. Microbes Infect. 2001, 3, 447–458. [CrossRef]
- Smith, A.; Muñoz, B.; Hsieh, Y.-H.; Bobo, L.; Mkocha, H.; West, S. OmpA Genotypic Evidence for Persistent Ocular Chlamydia Trachomatis Infection in Tanzanian Village Women. Ophthalmic Epidemiol. 2001, 8, 127–135. [CrossRef]
- Chin, S.A.; Alemayehu, W.; Melese, M.; Lakew, T.; Cevallos, V.; Lietman, T.M.; Keenan, J.D. Association of Chlamydia Trachomatis OmpA Genovar with Trachoma Phenotypes. Eye 2018, 32, 1411–1420. [CrossRef]
- Ramadhani, A.M.; Derrick, T.; Macleod, D.; Holland, M.J.; Burton, M.J. The Relationship between Active Trachoma and Ocular Chlamydia Trachomatis Infection before and after Mass Antibiotic Treatment. PLoS Negl. Trop. Dis. 2016, 10, e0005080. [CrossRef]
- Ramadhani, A.M.; Derrick, T.; Macleod, D.; Massae, P.; Mafuru, E.; Malisa, A.; Mbuya, K.; Roberts, C.H.; Makupa, W.; Mtuy, T.; et al. Progression of Scarring Trachoma in Tanzanian Children: A Four-Year Cohort Study. PLoS Negl. Trop. Dis. 2019, 13, e0007638. [CrossRef]
- Ramadhani, A.M.; Derrick, T.; Macleod, D.; Massae, P.; Malisa, A.; Mbuya, K.; Mtuy, T.; Makupa, W.; Roberts, C.H.; Bailey, R.L.; et al. Ocular Immune Responses, Chlamydia Trachomatis Infection and Clinical Signs of Trachoma before and after Azithromycin Mass Drug Administration in a Treatment Naïve Trachoma-Endemic Tanzanian Community. PLoS Negl. Trop. Dis. 2019, 13, e0007559. [CrossRef]
- Derrick, T.; Ramadhani, A.M.; Macleod, D.; Massae, P.; Mafuru, E.; Aiweda, M.; Mbuya, K.; Makupa, W.; Mtuy, T.; Bailey, R.L.; et al. Immunopathogenesis of Progressive Scarring Trachoma: Results of a 4-Year Longitudinal Study in Tanzanian Children. Infect. Immun. 2020, 88, 1–12. [CrossRef]
- Ghasemian, E.; Ramadhani, A.; Harte, A.; Mafuru, E.; Derrick, T.; Mtuy, T.; Massae, P.; Malissa, A.; Breuer, J.; Pickering, H.; et al. Evolutionary Dynamics in the Genome of Ocular Chlamydia Trachomatis Strains from Northern Tanzania Following Mass Drug Administration. Microb. Genom. 2025, 11. [CrossRef]
- Ramadhani, A.M.; Derrick, T.; MacLeod, D.; Massae, P.; Mafuru, E.; Malisa, A.; Mbuya, K.; Roberts, C.H.; Makupa, W.; Mtuy, T.; et al. Progression of Scarring Trachoma in Tanzanian Children: A Four-Year Cohort Study. PLoS Negl. Trop. Dis. 2019, 13. [CrossRef]
- Ramadhani, A.M.; Derrick, T.; Macleod, D.; Massae, P.; Mtuy, T.; Jeffries, D.; Roberts, C.H.; Bailey, R.L.; Mabey, D.C.W.; Holland, M.J.; et al. Immunofibrogenic Gene Expression Patterns in Tanzanian Children with Ocular Chlamydia Trachomatis Infection, Active Trachoma and Scarring: Baseline Results of a 4-Year Longitudinal Study. Front. Cell. Infect. Microbiol. 2017, 7, 406. [CrossRef]
- Thylefors, B.; Dawson, C.R.; Jones, B.R.; West, S.K.; Taylor, H.R. A Simple System for the Assessment of Trachoma and Its Complications. Bull. World Health Organ. 1987, 65, 477–483.
- Hu, V.H.; Weiss, H.A.; Massae, P.; Courtright, P.; Makupa, W.; Mabey, D.C.W.; Bailey, R.L.; Burton, M.J. In Vivo Confocal Microscopy in Scarring Trachoma. Ophthalmology 2011, 118, 2138–2146. [CrossRef]
- Burton, M.J.; Rajak, S.N.; Hu, V.H.; Ramadhani, A.; Habtamu, E.; Massae, P.; Tadesse, Z.; Callahan, K.; Emerson, P.M.; Khaw, P.T.; et al. Pathogenesis of Progressive Scarring Trachoma in Ethiopia and Tanzania and Its Implications for Disease Control: Two Cohort Studies. PLoS Negl. Trop. Dis. 2015, 9, e0003763. [CrossRef]
- Roberts, C.H.; Last, A.; Molina-Gonzalez, S.; Cassama, E.; Butcher, R.; Nabicassa, M.; McCarthy, E.; Burr, S.E.; Mabey, D.C.; Bailey, R.L.; et al. Development and Evaluation of a Next-Generation Digital PCR Diagnostic Assay for Ocular Chlamydia Trachomatis Infections. J. Clin. Microbiol. 2013, 51, 2195–2203. [CrossRef]
- Harding-Esch, E.M.; Holland, M.J.; Schémann, J.-F.; Sillah, A.; Sarr, B.; Christerson, L.; Pickering, H.; Molina-Gonzalez, S.; Sarr, I.; Andreasen, A.A.; et al. Impact of a Single Round of Mass Drug Administration with Azithromycin on Active Trachoma and Ocular Chlamydia Trachomatis Prevalence and Circulating Strains in The Gambia and Senegal. Parasit. Vectors 2019, 12, 497. [CrossRef]
- de Vries, H.J.C.; Pannekoek, Y.; Dean, D.; Bavoil, P.M.; Borel, N.; Greub, G.; Morré, S.A.; Bavoil Patrik, M.; Nicole, B.; Lee Ann, C.; et al. Call for Consensus in Chlamydia Trachomatis Nomenclature: Moving from Biovars, Serovars and Serotypes to Genovariants and Genotypes. Clinical Microbiology and Infection 2022. [CrossRef]
- Kolaskar, A.S.; Tongaonkar, P.C. A Semi-empirical Method for Prediction of Antigenic Determinants on Protein Antigens. FEBS Lett. 1990, 276, 172–174. [CrossRef]
- Bates, D.; Mächler, M.; Bolker, B.; Walker, S. Fitting Linear Mixed-Effects Models Using Lme4. J. Stat. Softw. 2015, 67. [CrossRef]
- Oksanen, J.; Blanchet, F.G.; Friendly, M.; Kindt, R.; Legendre, P.; McGlinn, D.; Minchin, P.R.; O’hara, R.B.; Simpson, G.L.; Solymos, P. Package ‘Vegan.’ Community ecology package, version 2019, 2.
- Su, H.; Caldwell, H.D. Immunogenicity of a Chimeric Peptide Corresponding to T Helper and B Cell Epitopes of the Chlamydia Trachomatis Major Outer Membrane Protein. J. Exp. Med. 1992, 175, 227–235.
- Chin, S.A.; Alemayehu, W.; Melese, M.; Lakew, T.; Cevallos, V.; Lietman, T.M.; Keenan, J.D. Association of Chlamydia Trachomatis OmpA Genovar with Trachoma Phenotypes. Eye 2018, 32, 1411–1420. [CrossRef]
- Solomon, A.W.; Burton, M.J.; Gower, E.W.; Harding-Esch, E.M.; Oldenburg, C.E.; Taylor, H.R.; Traoré, L. Trachoma. Nat. Rev. Dis. Primers 2022, 8, 32. [CrossRef]
- Mosenia, A.; Chin, S.A.; Alemayehu, W.; Melese, M.; Lakew, T.; Zhou, Z.; Doan, T.; Cevallos, V.; Lietman, T.M.; Keenan, J.D. Concordance of OmpA Types in Children Re-Infected with Ocular Chlamydia Trachomatis Following Mass Azithromycin Treatment for Trachoma. PLoS Negl. Trop. Dis. 2022, 16, e0010237-.
- Smith, A.; Munoz, B.; Hsieh, Y.H.; Bobo, L.; Mkocha, H.; West, S. OmpA Genotypic Evidence for Persistent Ocular Chlamydia Trachomatis Infection in Tanzanian Village Women. Ophthalmic Epidemiol 2001, 8, 127–135.
- Kari, L.; Whitmire, W.M.; Carlson, J.H.; Crane, D.D.; Reveneau, N.; Nelson, D.E.; Mabey, D.C.W.; Bailey, R.L.; Holland, M.J.; McClarty, G.; et al. Pathogenic Diversity among Chlamydia Trachomatis Ocular Strains in Nonhuman Primates Is Affected by Subtle Genomic Variations. Journal of Infectious Diseases 2008, 197, 449–456. [CrossRef]
- Ghasemian, E.; Holland, M.J. Comparative Transcriptomic Profiling of Human Conjunctival Epithelial Cells and Macrophages in Response to Chlamydia Trachomatis Genovars A and B in Early- and Mid-Infection Cycles. bioRxiv 2025.
- Hsieh, Y.-H.; Bobo, L.D.; Quinn, T.C.; West, S.K. Determinants of Trachoma Endemicity Using Chlamydia Trachomatis OmpA DNA Sequencing. Microbes Infect. 2001, 3, 447–458. [CrossRef]
- Chin, S.A.; Morberg, D.P.; Alemayehu, W.; Melese, M.; Lakew, T.; Chen, M.C.; Zhou, Z.; Doan, T.; Cevallos, V.; Lietman, T.M.; et al. Diversity of Chlamydia Trachomatis in Trachoma-Hyperendemic Communities Treated With Azithromycin. Am. J. Epidemiol. 2018, 187, 1840–1845. [CrossRef]
- Lu, L.; Fauci, A.; Richardson, Q.R.; Mahmud, H.; Nesemann, J.M.; Aragie, S.; Hailu, D.; Dagnew, A.; Chernet, A.; Tadesse, Z.; et al. Correlation of Clinical Severity of Trachomatous Inflammation and Chlamydia Trachomatis Bacterial Load. Am. J. Trop. Med. Hyg. 2024, 111, 1256–1258. [CrossRef]
- Ghasemian, E.; Inic-Kanada, A.; Collingro, A.; Mejdoubi, L.; Alchalabi, H.; Keše, D.; Elshafie, B.E.; Hammou, J.; Barisani-Asenbauer, T. Comparison of Genovars and Chlamydia Trachomatis Infection Loads in Ocular Samples from Children in Two Distinct Cohorts in Sudan and Morocco. PLoS Negl. Trop. Dis. 2021, 15. [CrossRef]
- Last, A.R.; Burr, S.E.; Harding-Esch, E.; Cassama, E.; Nabicassa, M.; Roberts, C. h.; Mabey, D.C.W.; Holland, M.J.; Bailey, R.L. The Impact of a Single Round of Community Mass Treatment with Azithromycin on Disease Severity and Ocular Chlamydia Trachomatis Load in Treatment-Naïve Trachoma-Endemic Island Communities in West Africa. Parasit. Vectors 2017, 10, 624. [CrossRef]
- Dirks, J.A.M.C.; Janssen, K.; Hoebe, C.J.P.A.; Geelen, T.H.B.; Lucchesi, M.; Dukers-Muijrers, N.H.T.M.; Wolffs, P.F.G. Chlamydia Trachomatis Intra-Bacterial and Total Plasmid Copy Number in Clinical Urogenital Samples. Sci. Rep. 2021, 11, 259. [CrossRef]
- Ferreira, R.; Borges, V.; Nunes, A.; Borrego, M.J.; Gomes, J.P. Assessment of the Load and Transcriptional Dynamics of Chlamydia Trachomatis Plasmid According to Strains’ Tissue Tropism. Microbiol. Res. 2013, 168, 333–339. [CrossRef]
- Pickett, M.A.; Everson, J.S.; Pead, P.J.; Clarke, I.N. The Plasmids of Chlamydia Trachomatis and Chlamydophila Pneumoniae (N16): Accurate Determination of Copy Number and the Paradoxical Effect of Plasmid-Curing Agents. Microbiology (N Y). 2005, 151, 893–903. [CrossRef]
- Solomon, A.; Zondervan, M.; Kuper, H.; Buchan, J.; Mabey, D.; Foster, A. Trachoma Control: A Guide for Program Managers.; World Health Organization: Geneva, Switzerland: World Health Organization, 2006;
- Pickering, H.; Teng, A.; Faal, N.; Joof, H.; Makalo, P.; Cassama, E.; Nabicassa, M.; Last, A.R.; Burr, S.E.; Rowland-Jones, S.L.; et al. Genome-Wide Profiling of Humoral Immunity and Pathogen Genes under Selection Identifies Immune Evasion Tactics of Chlamydia Trachomatis during Ocular Infection. Sci. Rep. 2017, 7, 9634. [CrossRef]
Figure 1.
Chlamydia trachomatis prevalence in the Tanzanian cohort of children confirmed by diagnostic PCR, based on the number of positives in the number of children sampled at each timepoint. The red bars show the percentage of MDA coverage for the study cohort at each treatment point. The fourth red bar between time points 15 and 16 represents treatment for village 3 only.
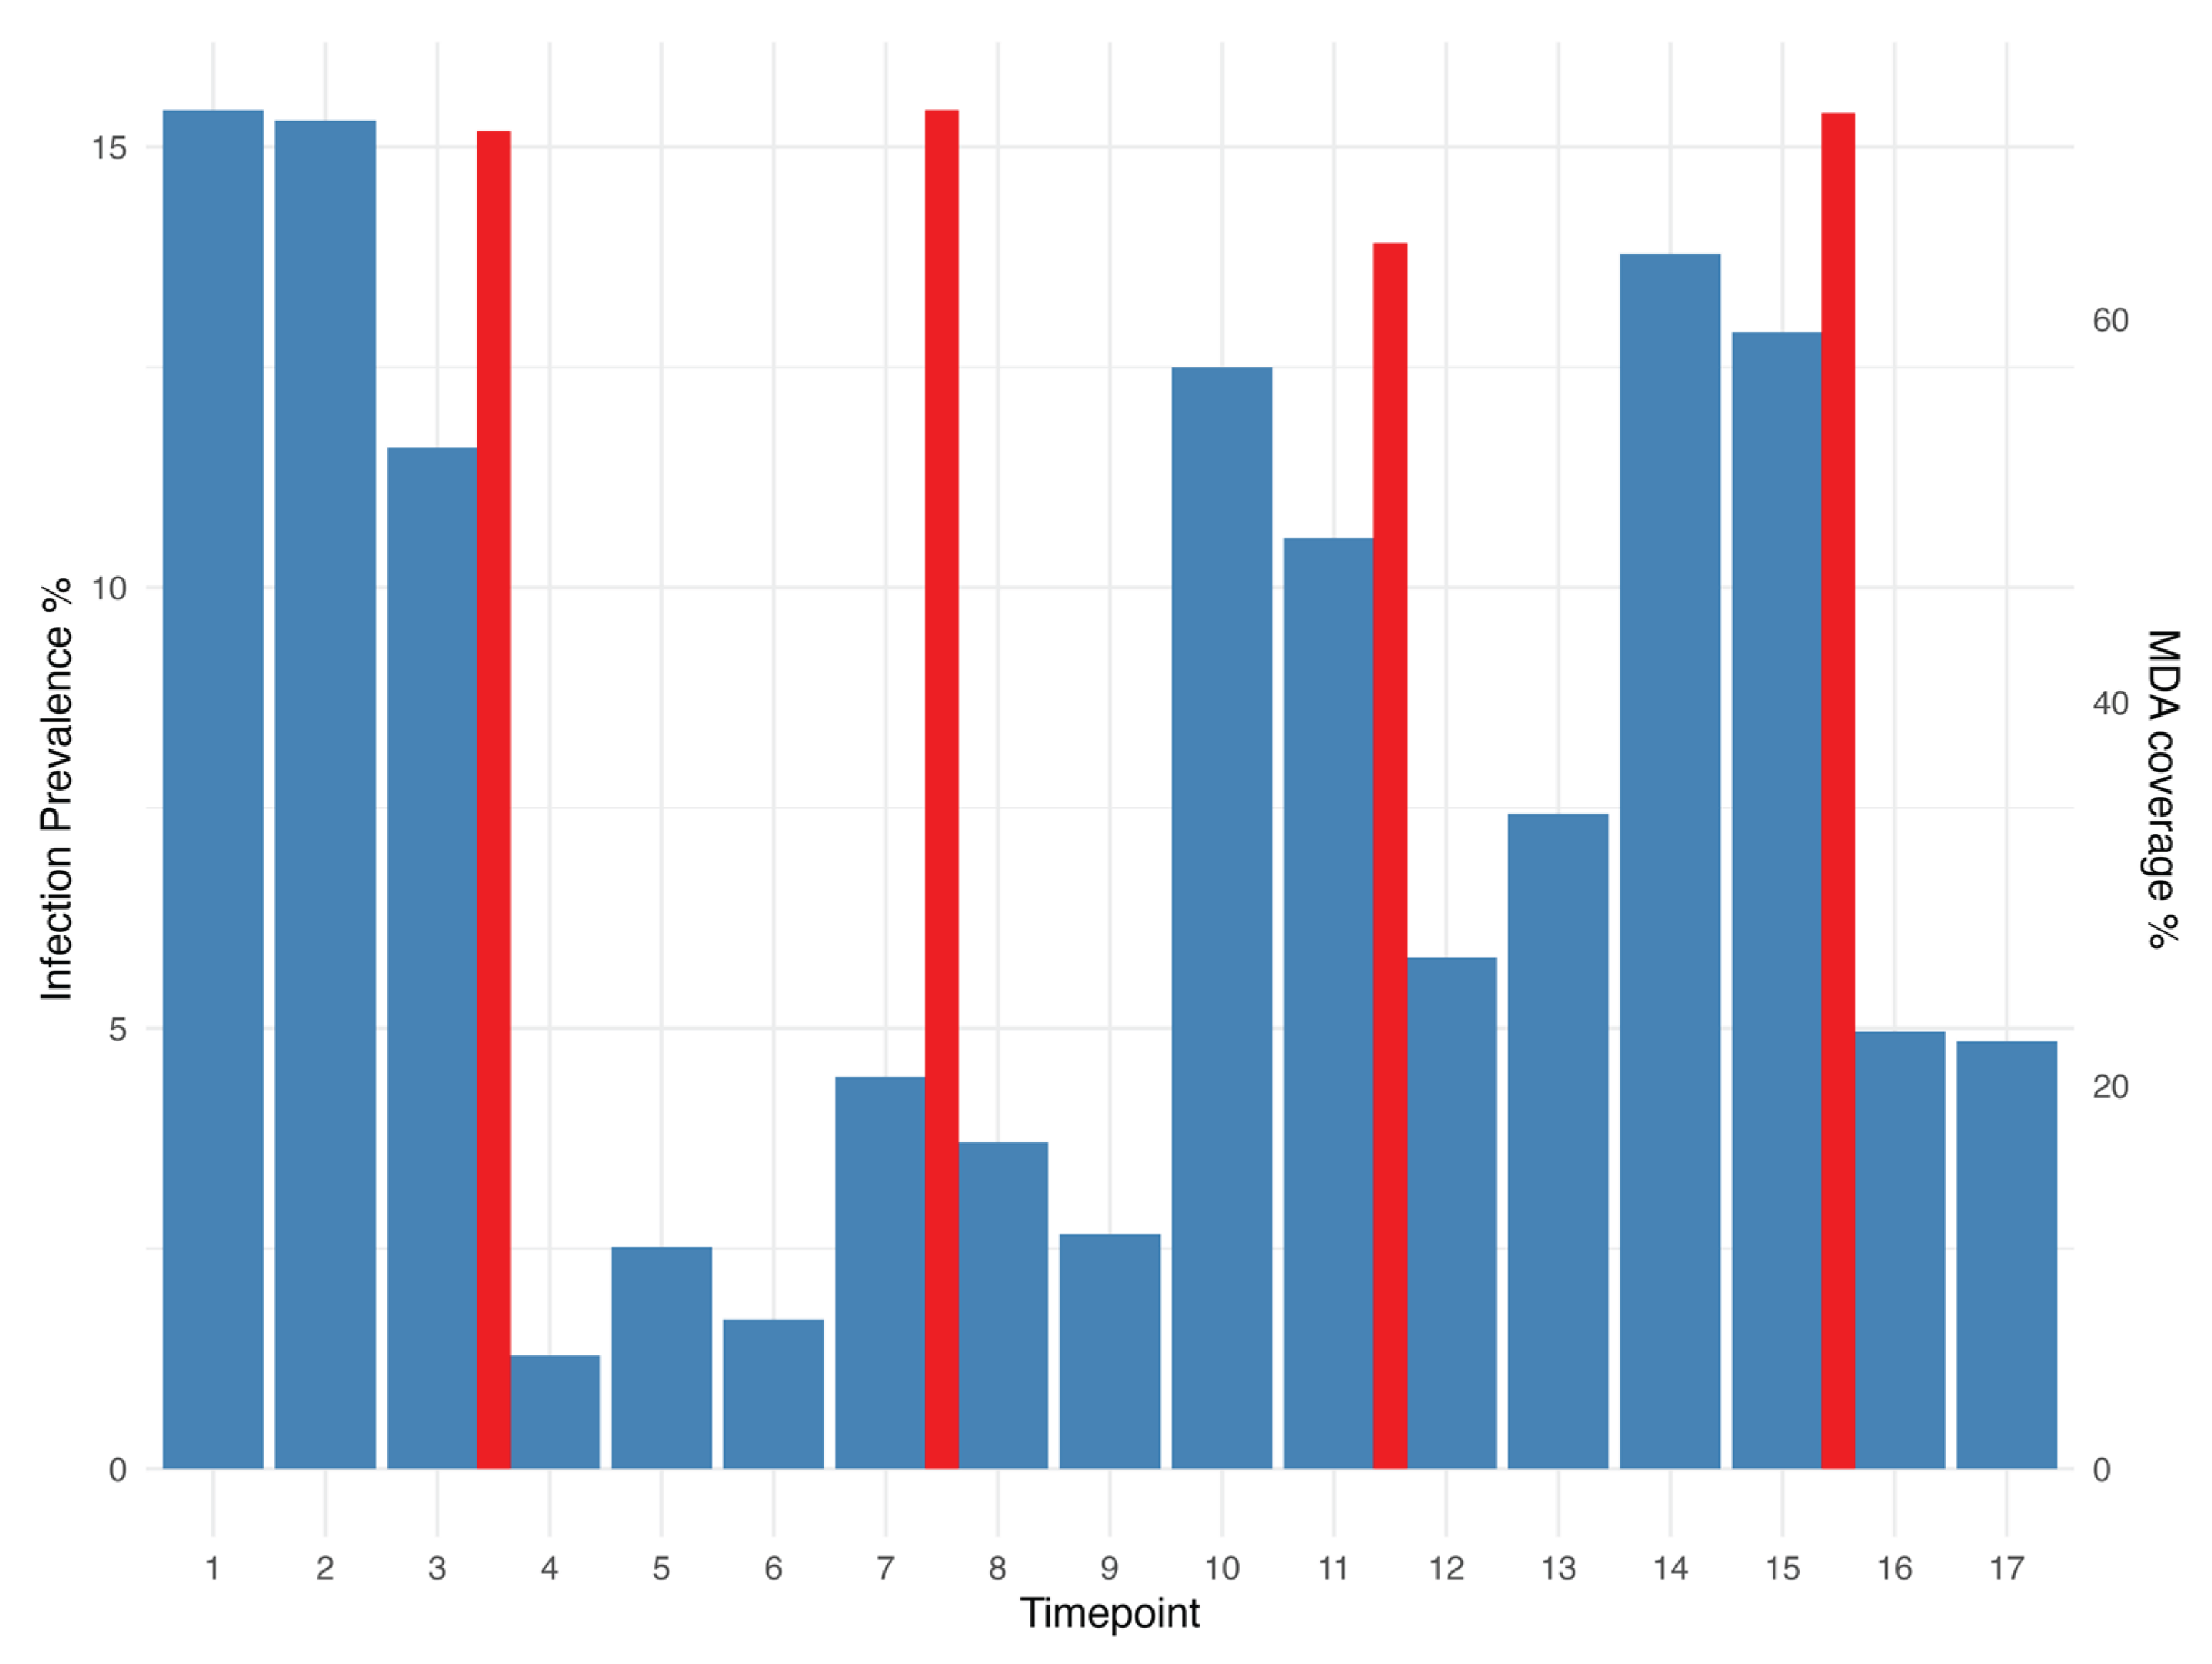
Figure 2.
The number and genovariant ID of Chlamydia trachomatis positive people at each timepoint. Dotted lines indicate where the population underwent a mass drug administration event. Each row of the plot represents an individual, with all individuals grouped by village. NA indicates samples that tested positive but could not be successfully sequenced.
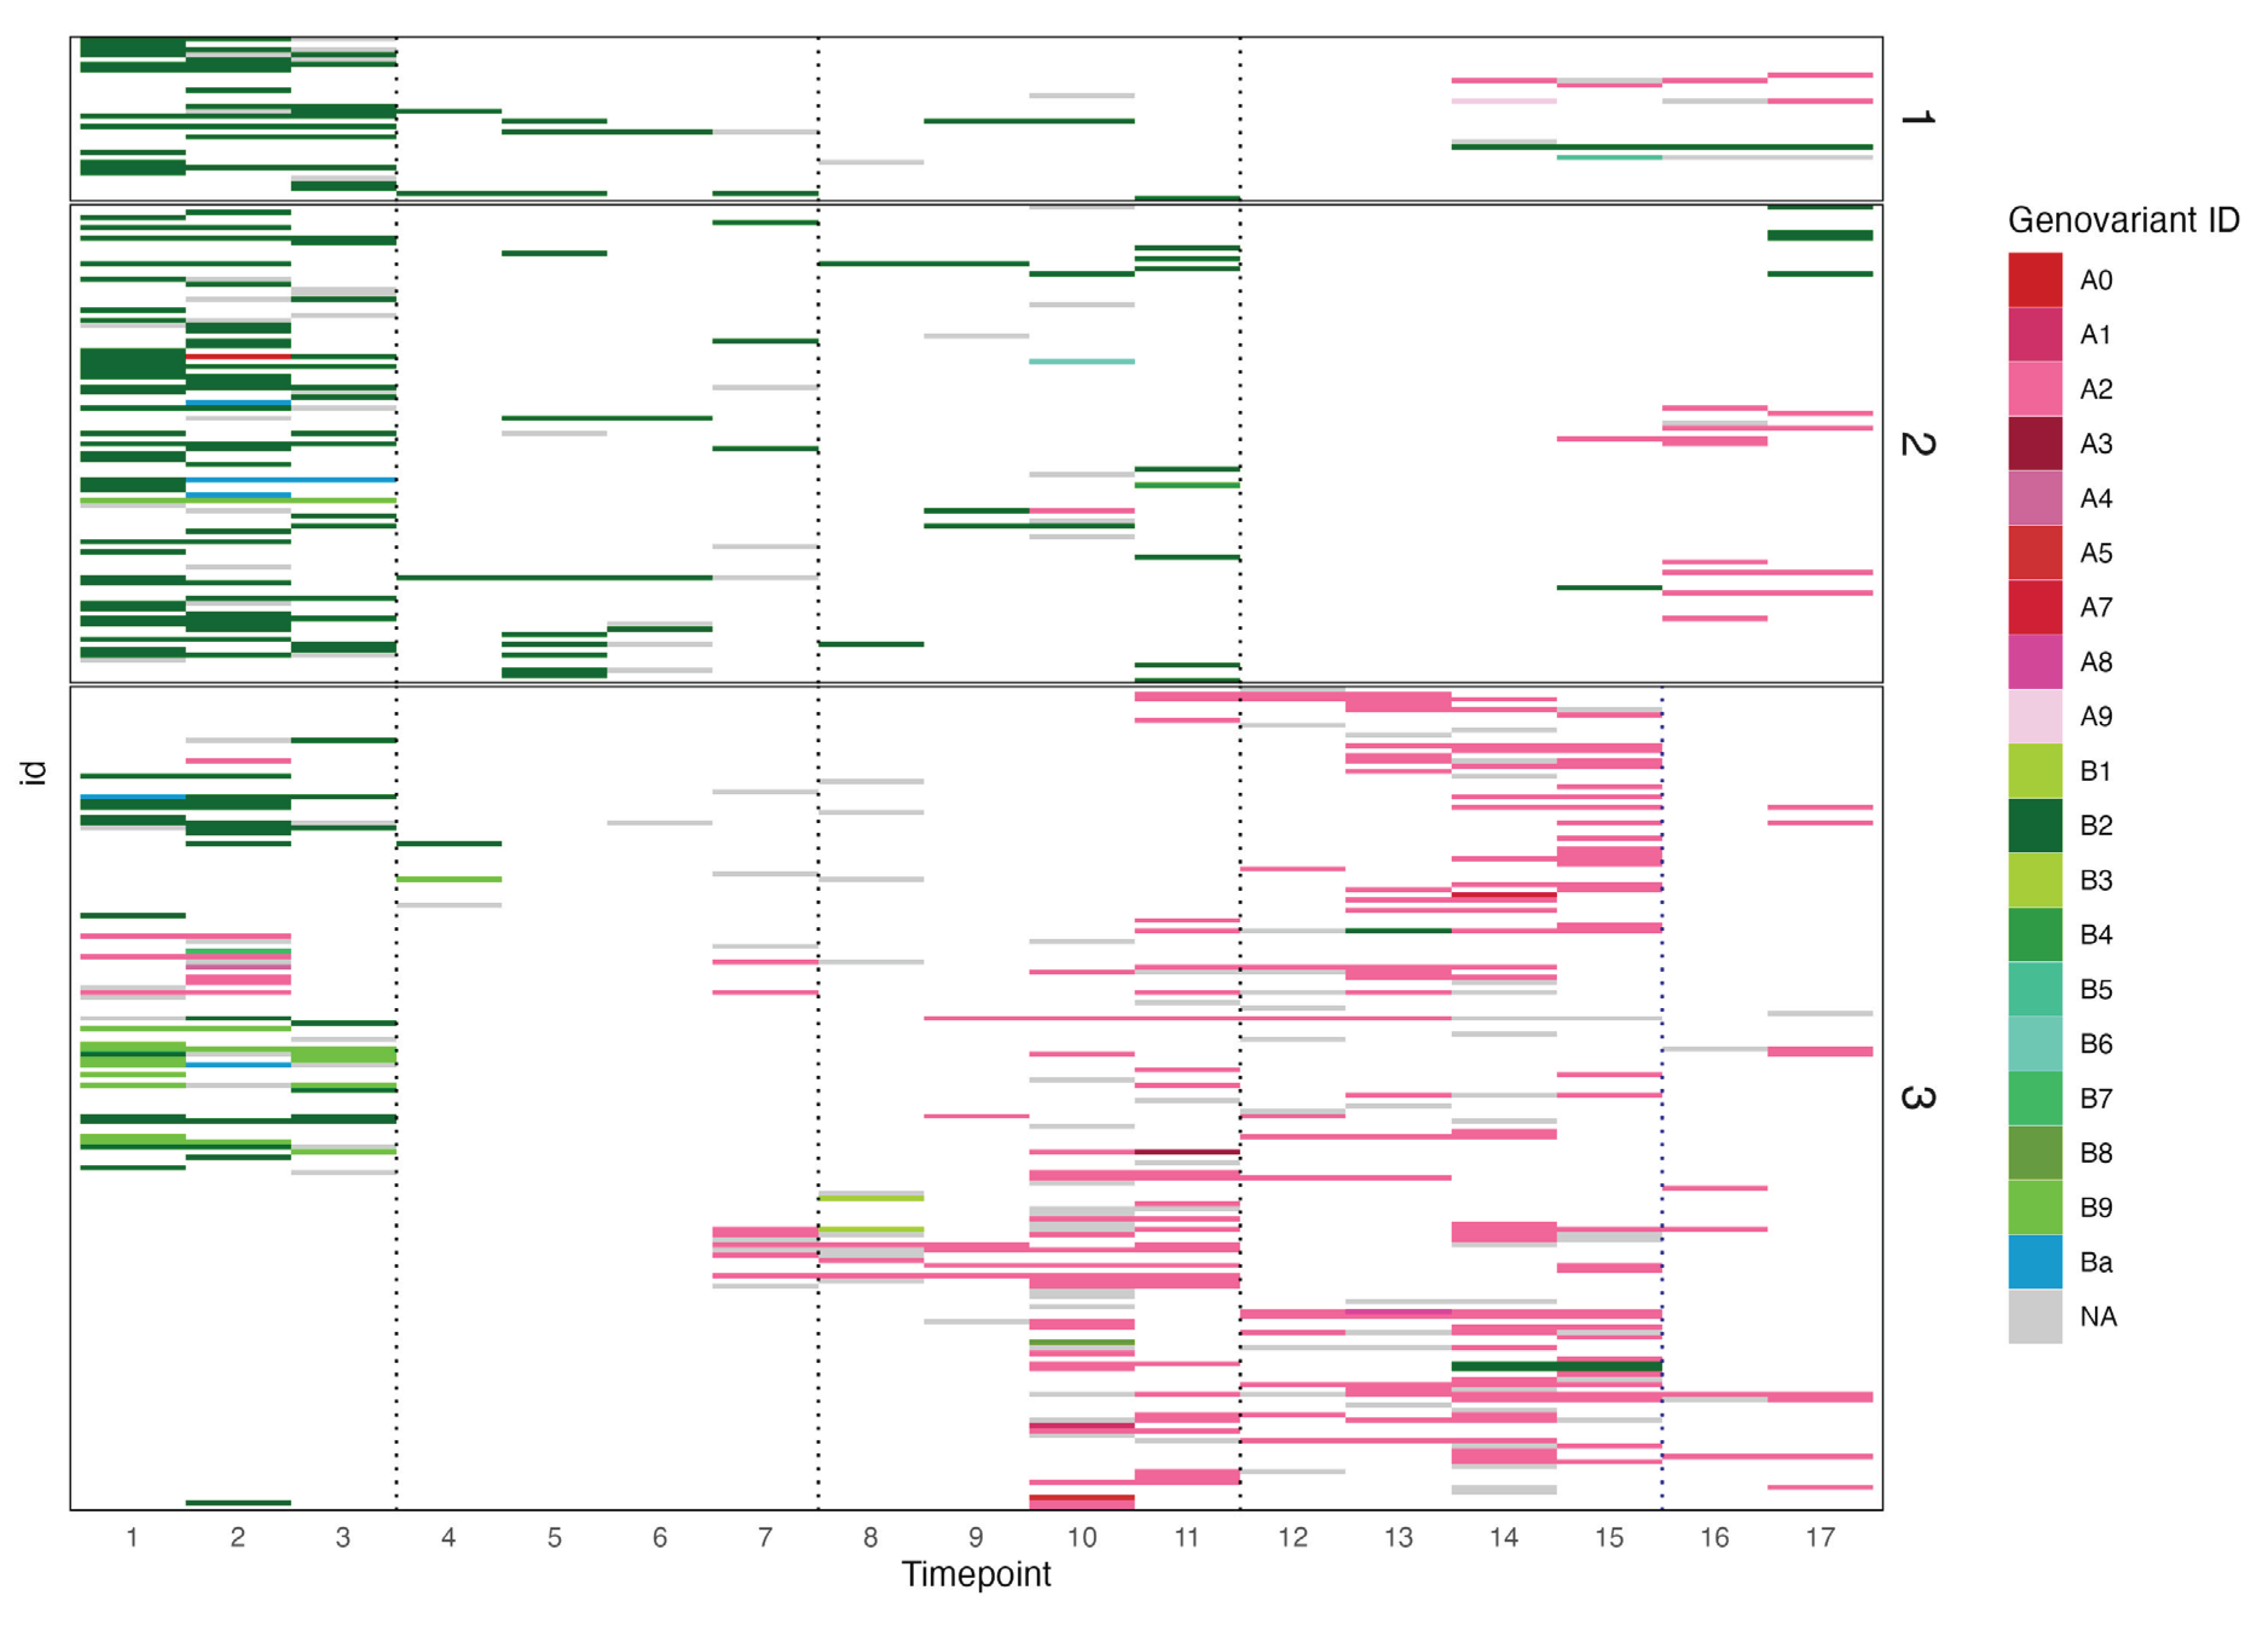
Figure 3.
Log10 Chlamydia trachomatis plasmid load per genotype at each timepoint for all three Tanzanian villages. Dashed lines indicate mass drug administration. The fourth dotted line between time points 15 and 16 represents treatment for village 3 only. NA indicates samples that tested positive but could not be successfully sequenced.

Figure 4.
Normalised exponent of Shannon diversity separated for each Tanzanian village, comparing the first and last timepoints (a) and the mean diversity scores of pre-MDA (timepoints 1-3) and post-MDA (timepoints 4-17) timepoints (b). MDA: Mass drug administration with Azithromycin.
Figure 4.
Normalised exponent of Shannon diversity separated for each Tanzanian village, comparing the first and last timepoints (a) and the mean diversity scores of pre-MDA (timepoints 1-3) and post-MDA (timepoints 4-17) timepoints (b). MDA: Mass drug administration with Azithromycin.
Disclaimer/Publisher’s Note: The statements, opinions and data contained in all publications are solely those of the individual author(s) and contributor(s) and not of MDPI and/or the editor(s). MDPI and/or the editor(s) disclaim responsibility for any injury to people or property resulting from any ideas, methods, instructions or products referred to in the content. |
© 2026 by the authors. Licensee MDPI, Basel, Switzerland. This article is an open access article distributed under the terms and conditions of the Creative Commons Attribution (CC BY) license (http://creativecommons.org/licenses/by/4.0/).
Copyright: This open access article is published under a Creative Commons CC BY 4.0 license, which permit the free download, distribution, and reuse, provided that the author and preprint are cited in any reuse.


