Submitted:
19 January 2026
Posted:
20 January 2026
You are already at the latest version
Abstract
Addressing the issue of high cleaning loss rates in practical operations, this study designed adevice for detecting cleaning losses. Three-dimensional models of wheat kernels were constructed using Blender software. Subsequently, the discrete element method software EDEM was employed to simulate the impact process of wheat kernels and straw dropped from varying heights onto a sensing plate, obtaining the contact force history and particle trajectories. The results revealed a significant difference in the impact force between the two material types on the sensing plate, enabling material identification and loss rate calculation through signal acquisition.Based on this, a detection device comprising mechanical structures and a control system was designed. An ESP32 microcontroller was used to read data from a piezoelectric ceramic vibration sensor. After processing with a Kalman filter, material classification thresholds were determined based on the normal distribution pattern of the signals. Experimental parameters were initially identified through a three-factor, three-level experiment and subsequently optimized using response surface methodology. The experimental results indicated that the threshold discriminability and loss rate calculation accuracy were optimal when the sensing plate was installed at a height of 550mm with a tilt angle of 40°, and the conveyor belt speed was 8 meters per minute.Bench test verification demonstrated that the device achieved an overall error of less than 3%, with recognition rates for both wheat kernels and straw exceeding 97%.
Keywords:
cleaning loss
; EDEM discrete element analysis
; wheat kernels
; ESP32
; piezoelectric ceramic vibration sensor
; Kalman filter
1. Introduction
The loss rate serves as a critical metric for evaluating the performance of the cleaning device in wheat harvesters. As a core component, the cleaning device directly influences the overall cleaning efficacy of the machine [1,2,3,4]. The cleaning system, a vital part of combine harvesters, plays a decisive role in determining both the grain loss rate and the cleanliness of the harvested yield [5,6,7]. During mechanized wheat harvesting, variable field conditions—such as crop status, moisture, density, and harvester travel speed—often cause the cleaning system to operate under suboptimal conditions. This frequently results in grain being expelled along with residue, leading to increased losses.
Currently, grain combine harvesters generally exhibit a low level of intelligence in their cleaning systems, relying on manual experience to adjust operational parameters. This often leads to high cleaning loss rates, especially in working environments with frequent variations in feed rate [8,9]. Therefore, developing an efficient and accurate wheat cleaning loss monitoring device is of great significance for enhancing the intelligence level of combine harvesters and reducing grain loss. With advancements in materials science and signal processing technology, researchers have successively employed sensitive materials such as piezoelectric ceramics and PVDF piezoelectric films to develop detection sensors. These sensors monitor losses by collecting impact signals generated by grains and impurities [6,10,11,12]. For instance, Liu Yangchun et al. designed a corn grain loss monitoring system for header losses based on the piezoelectric effect. By optimizing the sensor structure and signal processing circuit, they achieved synchronous monitoring of cleaning loss and header loss [10]. Furthermore, collision simulation analysis based on the Discrete Element Method (DEM) has provided theoretical support for sensor structure optimization [8]. In terms of signal processing, traditional methods often rely on time-domain feature thresholds for grain identification, which face challenges such as difficult threshold setting and poor robustness. Xing Gaoyong et al. proposed a signal classification method based on a VS-1D CNN model. Combined with impact signals collected by PVDF piezoelectric film sensors, this method achieved accurate distinction between corn grains and residue, with a model accuracy of 94.2% [13]. Some studies have begun to introduce modern filtering algorithms and deep learning models to enhance the accuracy and adaptability of signal classification [9,13].
In summary, despite the progress achieved in grain loss monitoring both domestically and internationally, dedicated devices for monitoring wheat cleaning loss still commonly face technical bottlenecks such as complex structure, high cost, and poor environmental adaptability. To address the limitations of current wheat harvester cleaning loss detection technology, this study employs EDEM discrete element simulation software [14,15,16,17,18,19,20,21] to conduct a numerical simulation of the dynamic process in which wheat kernels and straw materials impact a sensitive detection plate. This investigation aims to explore the technical feasibility of accurately distinguishing between wheat kernels and straw materials using impact excitation signals. Based on the direct piezoelectric effect of piezoelectric ceramics, the impact-induced electrical signals from the sensitive detection plate are collected in real-time. An ESP32 microcontroller transmits the acquired electrical signals to a host computer terminal, where the PLX-DAQ tool [21] is utilized for the visualization and recording of the monitoring data, ultimately enabling the real-time quantitative calculation of the wheat cleaning loss rate.
2. Materials and Methods
2.1. Principle of Piezoelectric Ceramic Vibration Sensor Detection
Piezoelectric sensors feature compact size, light weight, and wide operating frequency bands. Their core operating mechanism is based on the positive piezoelectric effect. This effect describes how certain anisotropic dielectric materials, when deformed by mechanical stress, generate internal electrical polarization. This leads to the appearance of bound charges with opposite signs and equal magnitudes on the material’s relative surfaces. Upon removal of the external force, the material reverts to its uncharged state.
As the fundamental physical phenomenon underlying piezoelectric ceramics, the positive piezoelectric effect describes the conversion of mechanical energy into electrical energy. Specifically, when an external force is applied parallel to the polarization direction of a piezoelectric material, the surface charge density on its electrodes changes.
Figure 1 depicts a quartz cutting disc with length a, width b, and height c. When metal materials are deposited on two planes perpendicular to the x-axis, the quartz disc can be regarded as a capacitor. Upon applying a force Fx along the x-direction, a charge Qx is generated on the surface perpendicular to the electric axis x, as expressed in Equation (1).
Qx: Charge quantity(C)
D: Piezoelectric coefficient of quartz crystals(C/N)
Fx: Force applied along the x-axis(N)
When the piezoelectric ceramic sensor detects vibration, it generates electric charge, which can be equivalently regarded as a charge source. Opposite charges of equal magnitude accumulate on the upper and lower surfaces of the piezoelectric ceramic sensor. The charges then charge a capacitor through a resistor, producing a voltage across the capacitor, which allows for the reading of an analog voltage signal.
2.2. Method
2.2.1. Mechanical Analysis of Material Impact on the Sensing Plate
The collision of wheat kernels and straw with the sensing plate constitutes a transient impact process. Its mechanical characteristics determine the features of the sensor’s output signal and can be simplified using a mass-spring-damper system. The corresponding dynamic equation is given by Equation (3).
m: Material Quality(kg)
c: Damping coefficient (Ns/m)
k: Equivalent stiffness coefficient of the sensitive plate (N/m)
y: Vibration displacement of the sensitive plate (m)
F(t): Collision impact force (N)
The impact force pulse generated by the collision can be simplified as a triangular waveform. Its peak force (Fmax) and pulse rise time (tr) are the key characteristic parameters determining the sensor’s response signal. Based on the law of conservation of energy (Equation 4) and Hooke’s law (Equation 5), the maximum impact force can be derived to be related to the velocity of the material upon impact with the sensing plate, the mass of the material, and the equivalent stiffness coefficient of the sensing plate, as expressed in Equation (Equation 6).
According to the law of conservation of energy:
can be derived: According to Hooke’s Law:
Substitute into Hooke’s Law:
V0: Velocity of material upon collision with the sensitive plate(m/s)
M: Material Quality(kg)
K: Equivalent stiffness coefficient of sensitive plates(N/m)
Fmax: Peak impact force(N)
Due to the extremely brief duration of force application during material impact on the sensing plate, the deformation process of the sensing plate can be simplified as a simple harmonic motion. According to the formula for simple harmonic motion, the rise time from the onset of impact to the peak impact force can be derived and is related to the mass of the material and the equivalent stiffness coefficient of the sensing plate, as shown in Equation (7).
Frequency of Simple Harmonic Motion: Period of Simple Harmonic Motion: Time at which the collision impact force reaches its maximum:
m: Material Quality(kg)
k: Equivalent stiffness coefficient of sensitive plates(N/m)
tr : Rise time at peak collision impact force(s)
From the analysis of Equations (6) and (7), it can be seen that the velocity V0 of the material impacting the sensing plate and the mass of the material influence both the magnitude of the impact force and its rise time during collision, resulting in differences in contact duration and impact force when the material contacts the steel plate. According to Equation (6), the peak impact force is proportional to the mass and velocity of the material; the greater the mass and velocity, the higher the impact force. Equation (7) indicates that the time required to reach the maximum impact force is proportional to the mass of the material. Therefore, the key to distinguishing between wheat kernels and straw lies in differentiating their respective peak forces and pulse rise times. Using EDEM discrete element software, a simulation of wheat kernels and straw impacting the sensing plate was conducted to examine the mechanical characteristics during impact and to validate the feasibility of distinguishing between wheat kernels and straw based on post-impact peak force and pulse rise time.
2.2.2. Establishment of the EDEM Simulation Model
Wheat grains are irregular ellipsoidal particles. By randomly selecting 100 wheat kernels and measuring their length and width using a vernier caliper, the average values were obtained as follows: average length 6.31 mm, average width 3.24 mm, and average thickness of 2.75 mm. The length of chopped straw after combine harvesting generally ranges from 50 to 150 mm. Wheat straw segments of 50 mm and 100 mm were selected as experimental subjects. Blender software was used to create three-dimensional models of the wheat kernels. The created models were then imported into the EDEM discrete element simulation software. For wheat kernels, the simulation model was generated by filling them with spherical particles of varying sizes, while for wheat straw, the experimental simulation model was created by filling with spherical particles of uniform size, as shown in Figure 2. The simulation parameters required for the discrete element models were obtained by referring to the literature [22,23,24] and are listed in Table 1.
2.2.3. Simulation Experiment
The experimental model was established in EDEM simulation software. Based on actual experimental dimensions, models of the conveyor belt, sensing plate, and collection bin were created, with wheat kernels generated above the conveyor belt. The distance between the conveyor belt and the center of the sensing plate was set to 550 mm, the sensing plate was tilted at 40°, and the conveyor belt speed was set to 8 m/min. After the simulation, the motion trajectory of individual particles during collision, as well as the impact force and rise time during their collision with the sensing plate, were exported from the Analyst processing module, as shown in Figure 3 and Figure 4.
Based on the motion trajectory of the wheat kernels, it can be observed that each kernel collides with the sensing plate only once before falling into the collection bin. This indicates that the same particle does not undergo a secondary collision with the sensing plate, which does not affect the calculation of the loss rate.
Based on the exported data, the rise time of the collision force between wheat kernels and the sensing plate was 0.025s, with a peak impact force of 0.00059N. For 50mm straw segments, the rise time was 0.05s with a peak force of 0.0000723N, while for 100mm straw segments, the rise time was 0.09s with a peak force of 0.000153N. Since the mass of a wheat kernel is smaller than that of a straw segment, the rise time required for the wheat impact force to reach its maximum is shorter than that for straw. Furthermore, due to their small volume and high density, wheat kernels are less affected by air resistance during free fall. In contrast, straw segments, which are larger in volume, lower in density, and hollow, experience greater air resistance. Consequently, the impact velocity of wheat kernels against the sensing plate is significantly higher than that of straw segments.
Experimentally measured data show that the rise time of the collision force between wheat kernels and the sensing plate is 0.025s, with a peak impact force reaching 5.9×10⁻⁴N. For 50mm long straw segments, the collision force rise time is 0.05s with a peak force of 7.23×10⁻⁵N, while for 100mm long straw segments, the rise time extends to 0.09s with a peak force of 1.53×10⁻⁴N.
Compared to straw, wheat kernels possess physical characteristics such as smaller mass, smaller volume, and higher density, whereas straw exhibits larger volume, lower density, and a hollow structure. During free fall, the hindering effect of air resistance on straw is significantly greater than on wheat kernels, resulting in a much higher impact velocity of wheat kernels against the sensing plate compared to straw. The product of the square of the impact velocity and the mass for wheat kernels is greater than that for straw, leading to a higher peak impact force when wheat kernels collide with the sensing plate. Consequently, wheat kernels produce a larger Fmax and a shorter tr upon collision, while straw produces a smaller Fmax and a longer tr.
2.2.4. Control System and Mechanical Structure Design
- Data Acquisition Solution Based on PLX-DAQ
PLX-DAQ is a macro-defined Excel sheet integrated into Microsoft Excel. It communicates with a microcontroller via a serial communication protocol, enabling real-time acquisition, display, and recording of sensor data. It can also automatically generate graphs, thereby facilitating the rapid construction of a host computer data acquisition interface [21].
To set up the system, open the Trust Center in Excel options, click “Trust Center Settings,” select “Macro Settings,” and enable VBA macros. The PLX-DAQ-v2.11 sheet can then be opened using Microsoft Excel, revealing the serial communication interface as shown in Figure 5.
- 2.
- Design of a Lower-Level Control and Processing System Based on ESP32
The analog signal output pin of the piezoelectric ceramic sensor is connected to the GPIO27 pin of the ESP32 microcontroller. This pin belongs to the ADC2 unit, which supports high-impedance analog signal input and enables accurate reading of the voltage variations generated by the sensor. The internal 12-bit ADC then converts these analog readings into digital values. During data acquisition, the Wi-Fi radio module of the ESP32 is kept inactive to prevent access conflicts with ADC2. To suppress environmental noise and the sensor’s inherent noise, thereby improving the signal-to-noise ratio, a software-based Kalman filter was implemented. The sensor signal is modeled as a slowly varying physical quantity over time, with its state-space representation defined as a first-order linear system. The process noise covariance was set to 0.01, and the measurement noise covariance was set to 0.2. Through the two-step process of prediction and update, this filter performs an optimal estimation for each raw sampled value and outputs a smoothed value, providing a stable and reliable data foundation for subsequent decision-making. A sliding window buffer algorithm is employed, which maintains a buffer containing the six latest non-zero sampled values. This algorithm aims to capture characteristic signals that appear within a brief time window and facilitates subsequent signal processing. Additionally, two functional buttons are implemented: one button resets the system by clearing all data and resetting the counters, while the other button controls the writing of data to storage. The system workflow is illustrated in Figure 6.
- 3.
- Mechanical Structure Design
The mechanical structure of the wheat loss detection device is shown in Figure 7. It consists of a feeding hopper, a conveyor belt, a sensing plate, and a collection bin. The interior of the feeding hopper is designed with flow guidance and material control mechanisms. Under the combined action of gravity and the control mechanism, wheat kernels can fall from the outlet in a single, continuous manner, avoiding interference in the detection signal caused by multiple kernels falling simultaneously. The conveyor belt is responsible for transporting the material samples to be tested at a constant speed to its end point, where they fall freely. Under gravity, the materials descend along a parabolic trajectory and impact the central area of the inclined sensing plate positioned directly below. The impact sensing unit, serving as the core detection component, has its plate mounted at a specific angle to the horizontal plane. This ensures that the wheat kernels rebound upon impact, generating a distinct impact signal. After collision, the materials detach from the surface of the sensing plate due to the rebound force and enter the collection bin, which is designed to receive the fallen materials.
2.2.5. Orthogonal Experiments Determine Experimental Factors
To achieve accurate automatic identification and separation of wheat kernels and straw, this study determines the voltage signal threshold range for their impact on the sensing plate through bench experiments. The experimental system mainly consists of a feeding system, a conveyor belt, a sensing plate, a data acquisition computer, and an ESP32 microcontroller control system. Wheat kernels and wheat straw segments ranging from 50mm to 150mm in length were selected as experimental subjects, with independent experiments conducted for each material type. In each experiment, 1000 wheat kernels and 400 straw segments were randomly selected as samples.
Three key factors were set in the experiments: the vertical installation height from the conveyor plane to the center of the sensing plate, the inclination angle of the sensing plate, and the conveyor belt speed. A three-factor, three-level orthogonal experimental design was adopted. The experimental plan is shown in Table 2, and the orthogonal design tables are presented in Table 3 and Table 4.
During the experiments, the system automatically completed the entire process of material transportation, free fall, impact on the sensing plate, and data acquisition. The dynamic response signal generated by each impact was converted by the ESP32 microcontroller via analog-to-digital conversion, and the voltage characteristic values were recorded in real time using the PLX-DAQ tool. All data from different materials were imported into Origin statistical analysis software to plot normal distribution fitting curves. The mathematical expectation (μ) of each normal distribution curve was recorded as valid sensor data in the orthogonal experimental tables, with the normal distribution plots for wheat and straw orthogonal experiment data shown in Figure 8 and Figure 9, respectively.
The range analysis method was applied to process the orthogonal experimental results. For each factor, the average experimental result under different levels was calculated, and the range of the factor was derived based on these averages. The magnitude of the range reflects the degree of influence of each factor on the ADC value: a larger range indicates a more significant influence of that factor on the results.
Analysis of the orthogonal experimental results for wheat indicates, based on the range of the mean values under different factor levels, that the installation height has the greatest influence on the sensor data, followed by the installation angle, and then the conveyor belt speed. The sensor reading for wheat impacting the sensing plate reaches its maximum when the installation height is 550mm, the sensing plate tilt angle is 40°, and the conveyor belt speed is 8 m/min. Analysis of the orthogonal experimental results for straw shows that the sensor reading for straw impacting the sensing plate reaches its minimum when the installation height is 350mm, the sensing plate tilt angle is 45°, and the conveyor belt speed is 2.7m/min.
3. Results
3.1. Response Surface Methodology for Validating Experimental Factors
Based on the orthogonal experimental results, the data were analyzed using Design-Expert software to perform quadratic regression fitting. Analysis of variance was conducted for wheat and straw, as shown in Table 5 and Table 6. The tables indicate that the P-values for both wheat and straw models are less than 0.0001 (highly significant), while the P-values for the lack-of-fit term are greater than 0.05 (not significant), indicating good model fit. The R² values for both wheat and straw models exceed 0.99, and the difference between the adjusted and predicted coefficients is less than 0.2, demonstrating that the models accurately represent the experimental data. The quadratic regression model for wheat impacting the sensing plate is given by Equation (8), and that for straw is given by Equation (9). The response surfaces illustrating the interactive effects of the vertical installation height from the conveyor plane to the center of the sensing plate, the horizontal inclination angle of the sensing plate, and the conveyor belt speed on the sensor readings are shown in Figure 10.
Y1 represents the number of wheat grains striking the sensitive plate.
A1 is the vertical mounting height from the conveyor belt plane to the center of the sensitive plate.
B1 is the horizontal tilt angle of the sensitive plate.
C1 is the conveyor belt speed.
Y2 represents the number of straw impacts on the sensitive plate.
A2 is the vertical mounting height from the conveyor belt plane to the center of the sensitive board.
B2 is the horizontal tilt angle of the sensitive plate.
C2 represents the conveyor belt speed.
Based on the above regression models Y₁ and Y₂, under the condition of maximizing the target value for wheat, the optimal solution provided by the software is as follows: a vertical installation height from the conveyor plane to the center of the sensing plate of 550mm, a horizontal inclination angle of the sensing plate of 37.5°, and a conveyor belt speed of 8.0m/min. For straw, under the condition of minimizing the target value, the optimal solution provided by the software is a vertical installation height of 350mm, a sensing plate inclination angle of 45°, and a conveyor belt speed of 2.7m/min. This indicates that the optimal conditions for different materials obtained through response surface analysis are essentially consistent with those derived from the orthogonal experiments, confirming these as the best operational choices for the respective materials.
To better distinguish between wheat and straw, the difference between the mean value for wheat and the corresponding mean value for straw under the same factor level was calculated. The condition yielding the maximum difference was selected as the optimal condition for threshold-based discrimination. As shown in Table 7, the best choice is an installation height of 550mm, a sensing plate inclination angle of 40°, and a conveyor belt speed of 8m/min. Under these conditions, the separation between the ADC values of the materials is the greatest, the threshold boundary is the most distinct, and consequently, the calculation of the loss rate is most effective and the identification performance is optimal.
3.2. Determine the Threshold for the Optimal Experimental Factors
Wheat kernels and wheat straw segments ranging from 50 mm to 150 mm in length were selected as experimental subjects, with independent experiments conducted for each material type. In each experiment, 1000 wheat kernels and 400 straw segments were randomly selected as samples. The experimental conditions were set as follows: a vertical distance of 550 mm between the sensing plate and the conveyor plane, an angle of 40° between the sensing plate and the horizontal plane, and a conveyor belt speed of 8 m/min. The normal distribution plot of the experimental results is shown in Figure 11.
Based on the characteristic analysis of the normal distribution, the ADC values for wheat falling within the range greater than 423 (μ - 2σ) encompass approximately 95.45% of the data. Similarly, the ADC values for straw falling within the range less than 254 (μ + 2σ) cover approximately 95.45% of the data. Accordingly, 423 was set as the lower threshold for wheat identification, and 254 was set as the upper threshold for straw identification. For samples with ADC values between 254 and 423, the discrimination was performed based on the distribution characteristics of the data within a sliding window.
3.3. Experimental Verification and Analysis
To verify the accuracy of the experiment, wheat kernels and wheat straw segments were randomly selected for testing under the following conditions: a vertical distance of 550 mm from the conveyor plane to the center of the sensing plate, a sensing plate installation angle of 40°, and a conveyor belt speed of 8 m/min. The experimental results are presented in Table 8. The results indicate that the recognition rate for cleaning loss can exceed 97%.
4. Discussion
This study addresses the widespread challenge of high cleaning loss rates during mechanized wheat harvesting by designing and developing a cleaning loss detection device based on piezoelectric vibration sensing. By integrating theoretical modeling, discrete element simulation, and experimental validation, it demonstrates a technical approach for distinguishing grains from straw through material impact signals, providing a precise sensing solution for intelligent operation of combine harvesters.
The research mechanistically reveals the fundamental differences in impact dynamics between wheat kernels and straw via discrete element simulation. The established particle models and collision process simulations show significant distinctions in peak impact force and rise time between the two materials, while trajectory analysis confirms the absence of secondary collisions. This fundamentally validates the feasibility of classification using transient impact signals. Theoretical analysis based on the direct piezoelectric effect and a simple harmonic motion model further clarifies the quantitative relationship between material physical properties and sensor output signals, establishing a theoretical foundation for subsequent threshold discrimination. Systematic parameter optimization experiments identified the optimal operating parameter combination that maximizes signal distinguishability: installation height of 550 mm, sensing plate inclination of 40°, and conveyor belt speed of 8 m/min. Under these conditions, the ADC values of wheat and straw exhibit highly separated distributions, enabling robust classification thresholds to be set based on statistical principles (μ ± 2σ). This process represents a complete research cycle, transitioning from simulation to experiment and from qualitative analysis to quantitative decision-making. Bench verification experiments confirm the excellent performance of the device, with recognition accuracy exceeding 97% for both wheat kernels and straw, and an overall loss rate calculation error of less than 3%, demonstrating that the proposed method is both theoretically viable and practically reliable. The successful integration of discrete element simulation analysis with signal processing technology provides a “simulation-first, experiment-optimized” research paradigm for agricultural material identification, which can be extended to detection scenarios involving other grains or materials.
5. Conclusions
To address the practical need for detecting the cleaning loss rate in wheat combine harvesters, this study designed and developed a cleaning loss detection device based on the analysis of vibration signals from a sensing plate. By integrating theoretical analysis, simulation verification, and bench testing, the following conclusions were drawn.
- 1.
- A loss detection method utilizing discrete element simulation and signal processing techniques was employed. With the aid of Blender and EDEM software, discrete element models of wheat kernels and straw were established. Simulation analysis revealed significant differences in both contact force and contact duration when these materials impact the sensing plate, and it was confirmed that the material trajectory does not lead to a second contact with the plate. These findings theoretically demonstrate the feasibility of material identification by detecting impact-induced vibration signals, thereby providing a theoretical foundation for the design of the detection device.
- 2.
- Through a three-factor, three-level orthogonal experiment and range analysis, the primary and secondary influence of each factor on the impact signal was clarified. The optimal parameter combination for achieving the most distinct discrimination between wheat and straw was determined as follows: installation height of 550 mm, sensing plate tilt angle of 40°, and conveyor belt speed of 8 m/min. Verification experiments demonstrated that under these parameters, the distribution intervals of the ADC values of the materials are maximally separated, providing a basis for accurate threshold setting. Specifically, the ADC values of wheat samples are predominantly distributed in the range ≥423, whereas most ADC values of straw are below 254.
- 3.
- Real-time and accurate calculation of the cleaning loss rate was achieved. Through bench experiments, the signal threshold range for the impact of wheat kernels and straw on the sensing plate was calibrated, enabling precise material identification and classification. The experimental results demonstrate that the detection device achieves recognition accuracy rates exceeding 97% for both wheat kernels and straw, with an overall detection error of less than 3%. This provides an important theoretical foundation and data support for the practical application and promotion of the cleaning loss detection device in field operating scenarios.
Author Contributions
Conceptualization, H.Z.; methodology, Z.L.; investigation, X.S. and R.J.; resources, Y.H.; data curation, R.J.; writing—original draft preparation, X.S. and R.J.; writing— review and editing, X.S. and R.J.; visualization X.S.; supervision, W.W.; project administration, Y.H. and W.W.; funding acquisition, Y.H. All authors have read and agreed to the published version of the manuscript.
Funding
This research was funded by the Special Fund for the China Agriculture Research System, grant number CARS-03.
Institutional Review Board Statement
Not applicable.
Informed Consent Statement
Not applicable.
Data Availability Statement
The data presented in this study are available on request from the corresponding author.
Acknowledgments
The authors are grateful to the anonymous reviewers for their comments.
Conflicts of Interest
The authors declare no conflicts of interest.
References
- Zhao, N.; Jin, C.Q.; Wang, C.; et al. Research Progress on Intelligent Technology of grain combined harvester cleaning system. J. Chin. Agric. Mech. 2023, 44(3), 163–170. [Google Scholar] [CrossRef]
- Liu, X.Y.; Chen, J.; Zhang, X.L.; et al. Intelligent Analysis of the Internal Signal Processing and Transmission in the Precision Seeding Planter. J. Agric. Mech. Res. 2020, 42, 200–204, 210. [Google Scholar] [CrossRef]
- Xu, L.Z.; Li, Y.; Li, Y.M.; et al. Research Progress on Cleaning Technology and Device of Grain Combine Harvester. Trans. Chin. Soc. Agric. Mach. 2019, 50(10), 1–16. [Google Scholar]
- Qu, Z.; Lu, Q.; Shao, H.; Le, J.; Wang, X.; Zhao, H.; Wang, W. Design and Test of a Grain Cleaning Loss Monitoring Device for Wheat Combine Harvester. Agriculture 2024, 14(5), 671–699. [Google Scholar] [CrossRef]
- Wang, Z.; Che, D.; Bai, X.P.; et al. Improvement and Experiment of Cleaning Loss Rate Monitoring Device for Corn Combine Harvester. Trans. Chin. Soc. Agric. Mach. 2018, 49(12), 100–108. [Google Scholar]
- Du, Y.F.; Zhang, L.R.; Mao, E.R.; et al. Design and Experiment of Corn Combine Harvester Grain Loss Monitoring Sensor Based on EMD. Trans. Chin. Soc. Agric. Mach. 2022, 53(S1), 158–165. [Google Scholar]
- Yang, Y.; Zhang, M.; Jiang, T.; Wang, G.; Jiang, L. Design and Test of Real-Time Detection System for Cleaning Loss of Rapeseed Harvester. Appl. Sci. 2025, 15(2), 792. [Google Scholar] [CrossRef]
- Ding, L.; Xu, Y.F.; Qu, Z.; et al. Design of Test Device for Monitoring Loss of Wheat Harvester During Cleaning Based on EDEM. J. Chin. Agric. Mech. 2023, 44(3), 13–21. [Google Scholar] [CrossRef]
- Guo, H.; Han, J.X.; Lv, Z.S.; et al. Design and Test of Cleaning Loss Monitoring Device for Oil Sunflower Combine Harvester. J. Jilin Univ. (Eng. Technol. Ed.). accessed on. 2026. (accessed on 17 January 2026). [CrossRef]
- Liu, Y.C.; Li, M.H.; Wang, J.Z.; et al. Design and Test of Entrainment Loss Detection System for Corn Kernel Direct Harvester. Trans. Chin. Soc. Agric. Mach. 2023, 54(5), 140–149. [Google Scholar]
- Chen, G; Wu, XY; Zhang, J; et al. A flexible cleaning loss sensing module for wheat combine harvesters with reduced error using vertically distributed PVDF sensing array [J]. Applied Engineering in Agriculture 2025, 41(3), 227–236. [Google Scholar] [CrossRef]
- Ni, J; Mao, HP; Pang, FR; et al. Design and Experimentation of Piezoelectric Crystal Sensor Array for Grain Cleaning Loss [J]. International Journal of Distributed Sensor Networks 2015, 2015, 754278. [Google Scholar] [CrossRef]
- Xing, G.Y.; Ge, S.C.; Lu, C.Y.; et al. Design and Experiment of VS - 1D CNN-based Clearing Loss Detection System for Corn Kernel Direct Harvester. Trans. Chin. Soc. Agric. Mach. 2025, 56(2), 206–216. [Google Scholar]
- PENG, J W; SHEN, H Y; DING, W Q; et al. Research and analysis of conveyor separation mechanism of light and simple sweet potato combine harvester based on EDEM discrete element method [J]. Computational Particle Mechanics 2025, 12(5), 3421–3438. [Google Scholar] [CrossRef]
- ZHANG, P C; LI, F G; WANG, F Y. Optimization and test of ginger-shaking and harvesting device based on EDEM software [J]. Computers and Electronics in Agriculture 2023, 213, 108257. [Google Scholar] [CrossRef]
- ZHANG, L; ZHAI, Y B; CHEN, J N; et al. Optimization design and performance study of a subsoiler underlying the tea garden subsoiling mechanism based on bionics and EDEM [J]. Soil and Tillage Research 2022, 220, 105375. [Google Scholar]
- SHEN, H Y; WANG, B; WANG, G P; et al. Research and optimization of the hand-over lifting mechanism of a sweet potato combine harvester based on EDEM [J]. International Journal of Agricultural and Biological Engineering 2023, 16(5), 71–79. [Google Scholar] [CrossRef]
- LIU, D J; GONG, Y; ZHANG, X J; et al. Edem simulation study on the performance of a mechanized ditching device for codonopsis planting [J]. Agriculture-Basel 2022, 12(8), 1238. [Google Scholar]
- Hao, J.J.; Jin, D.X.; Gao, Z.; et al. Design and Experiment of the Vibratory Soil Crushing Device for Ma Yam Harvesting Machine Based on EDEM. Trans. Chin. Soc. Agric. Eng. 2025, 41(16), 90–98. [Google Scholar]
- Li, M.S.; Wang, Y.J.; Xie, S.Y.; et al. Simulation Analysis and Test of the Operation Performance of Shear Vibration Co-operation Subsoiler Based on Discrete Element Method. Trans. Chin. Soc. Agric. Eng. 2024, 40(20), 81–90. [Google Scholar]
- Walkowiak, M; Nehring, A. Using ChemDuino, Excel, and PowerPoint as Tools for Real-Time Measurement Representation in Class[J]. JOURNAL OF CHEMICAL EDUCATION 2016, 93(4), 778–780. [Google Scholar] [CrossRef]
- Wang, W.Z.; Liu, W.R.; Yuan, L.H.; et al. Simulation and Experiment of Single Longitudinal Axial Material Movement and Establishment of Wheat Plants Model. Trans. Chin. Soc. Agric. Mach. 2020, 51(S2), 170–180. [Google Scholar]
- Meng, Q.C.; Xu, L.Z.; Li, Y.M.; et al. Simulation Analysis of Flow Field-Material Coupling in Cleaning Unit of Combine Harvester Based on CFD-DEM. Trans. Chin. Soc. Agric. Mach. 2025, 56(11), 184–192, 212. [Google Scholar] [CrossRef]
- Sun, Y.X.; Wang, M.X.; Zhang, C. Experiment Calibration of Contact Parameters Between Wheat and Conveyor Belt. J. Henan Univ. Technol. (Nat. Sci. Ed.) 2021, 42(6), 113–120. [Google Scholar] [CrossRef]
Figure 1.
Positive piezoelectric effect of piezoelectric ceramics.
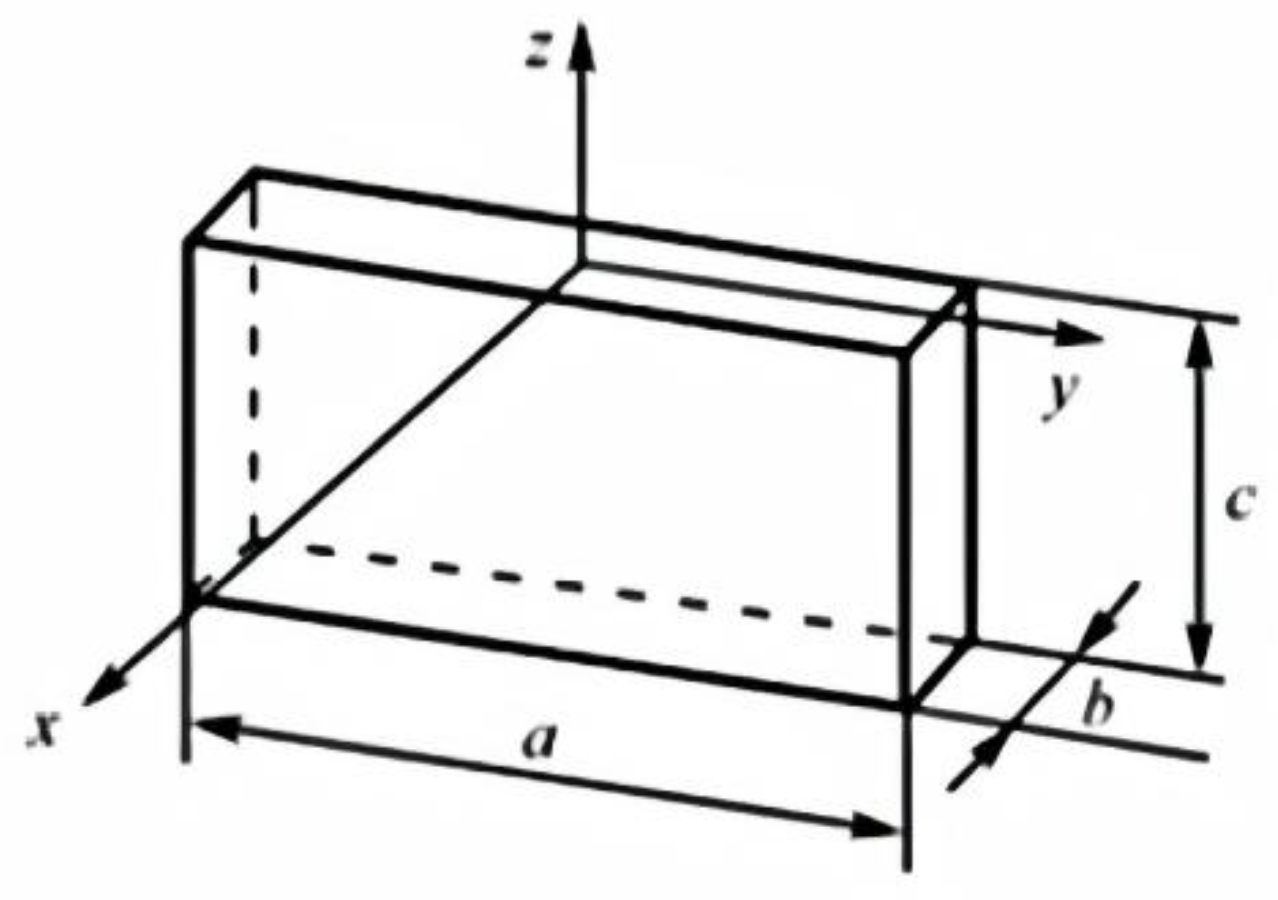
Figure 2.
Simulation Model of Wheat and Straw. (a)Blender Wheat Grain Model;(c)100mm Wheat Straw Model;(d)50mm Wheat Straw Model.
Figure 2.
Simulation Model of Wheat and Straw. (a)Blender Wheat Grain Model;(c)100mm Wheat Straw Model;(d)50mm Wheat Straw Model.
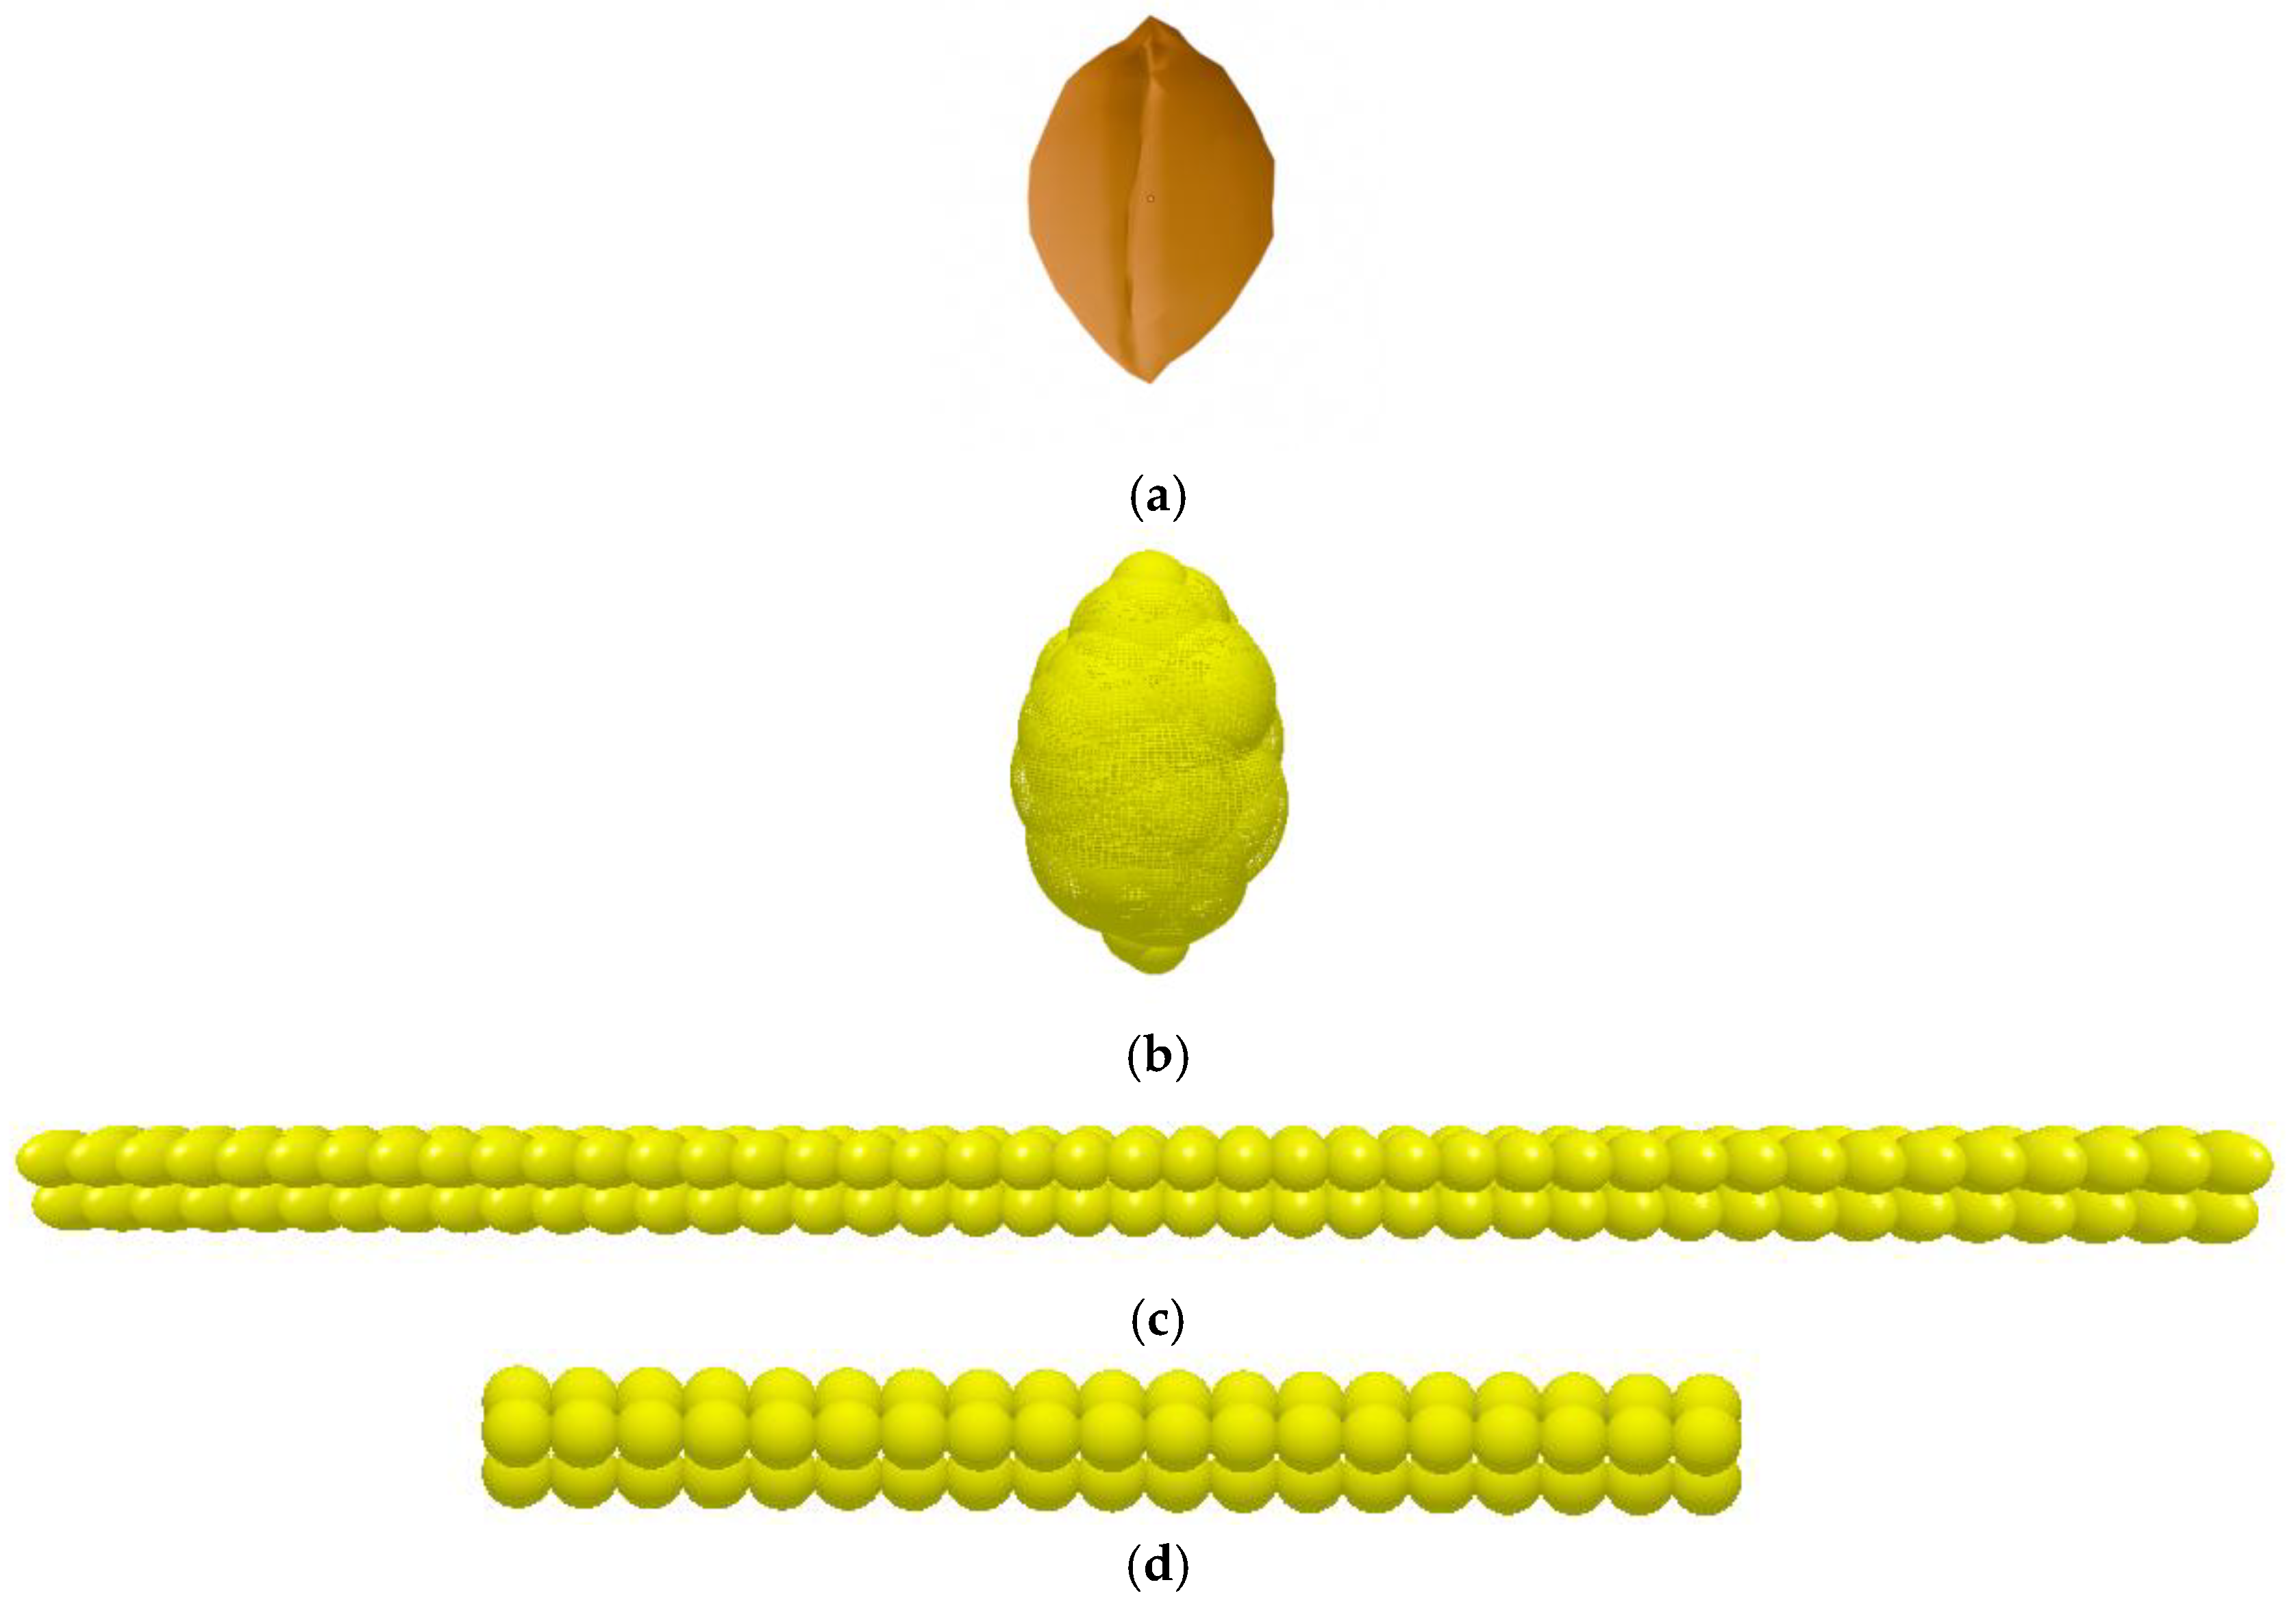
Figure 3.
Simulation Motion Trajectory of Wheat.
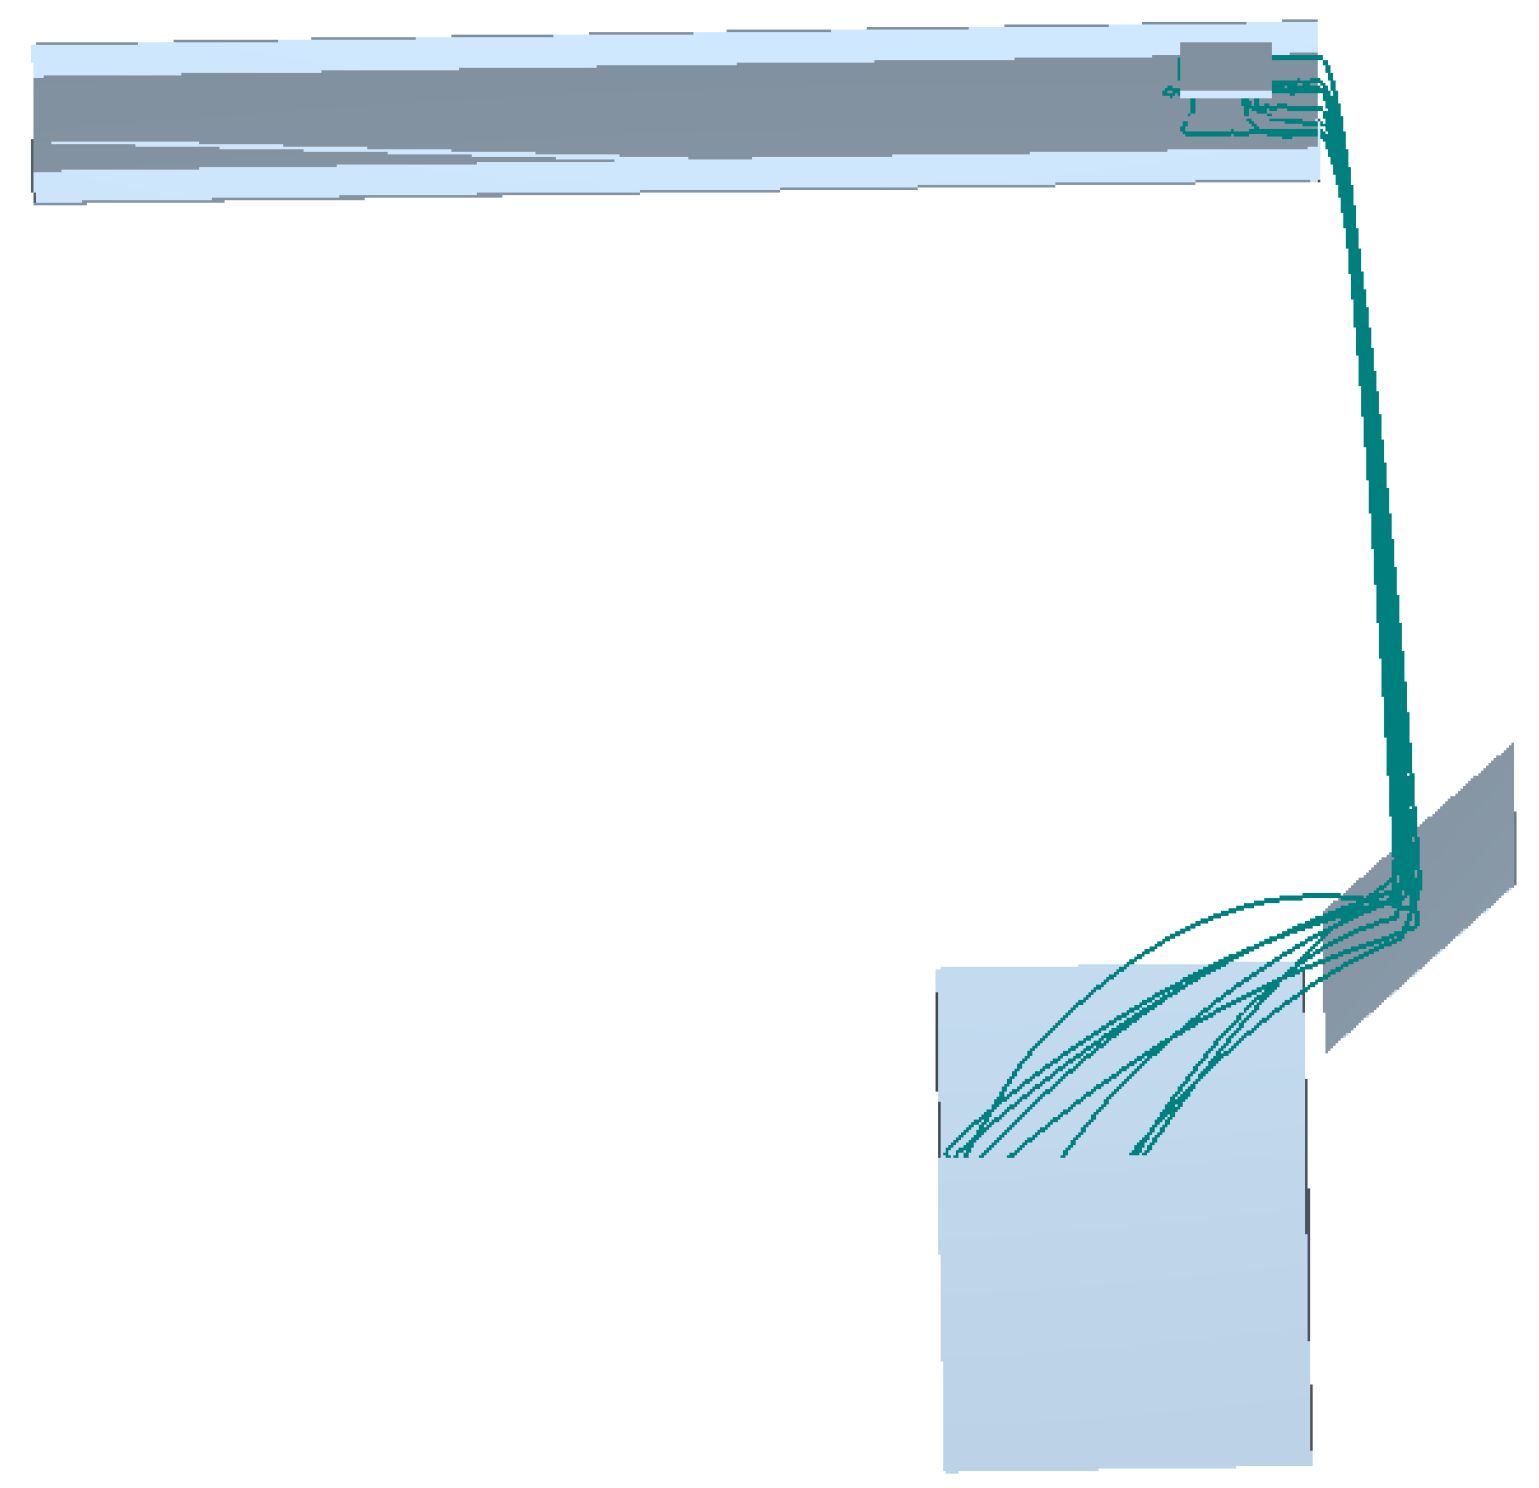
Figure 4.
Contact Forces Between the Sensitive Plate and Wheat Grains, 50-mm Straw, and 100-mm Straw. (a)Wheat Contact Force with Sensitive Board;(b)Contact force between 50mm straw and sensitive plate;(c)Contact force between 100mm straw and sensitive plate.
Figure 4.
Contact Forces Between the Sensitive Plate and Wheat Grains, 50-mm Straw, and 100-mm Straw. (a)Wheat Contact Force with Sensitive Board;(b)Contact force between 50mm straw and sensitive plate;(c)Contact force between 100mm straw and sensitive plate.
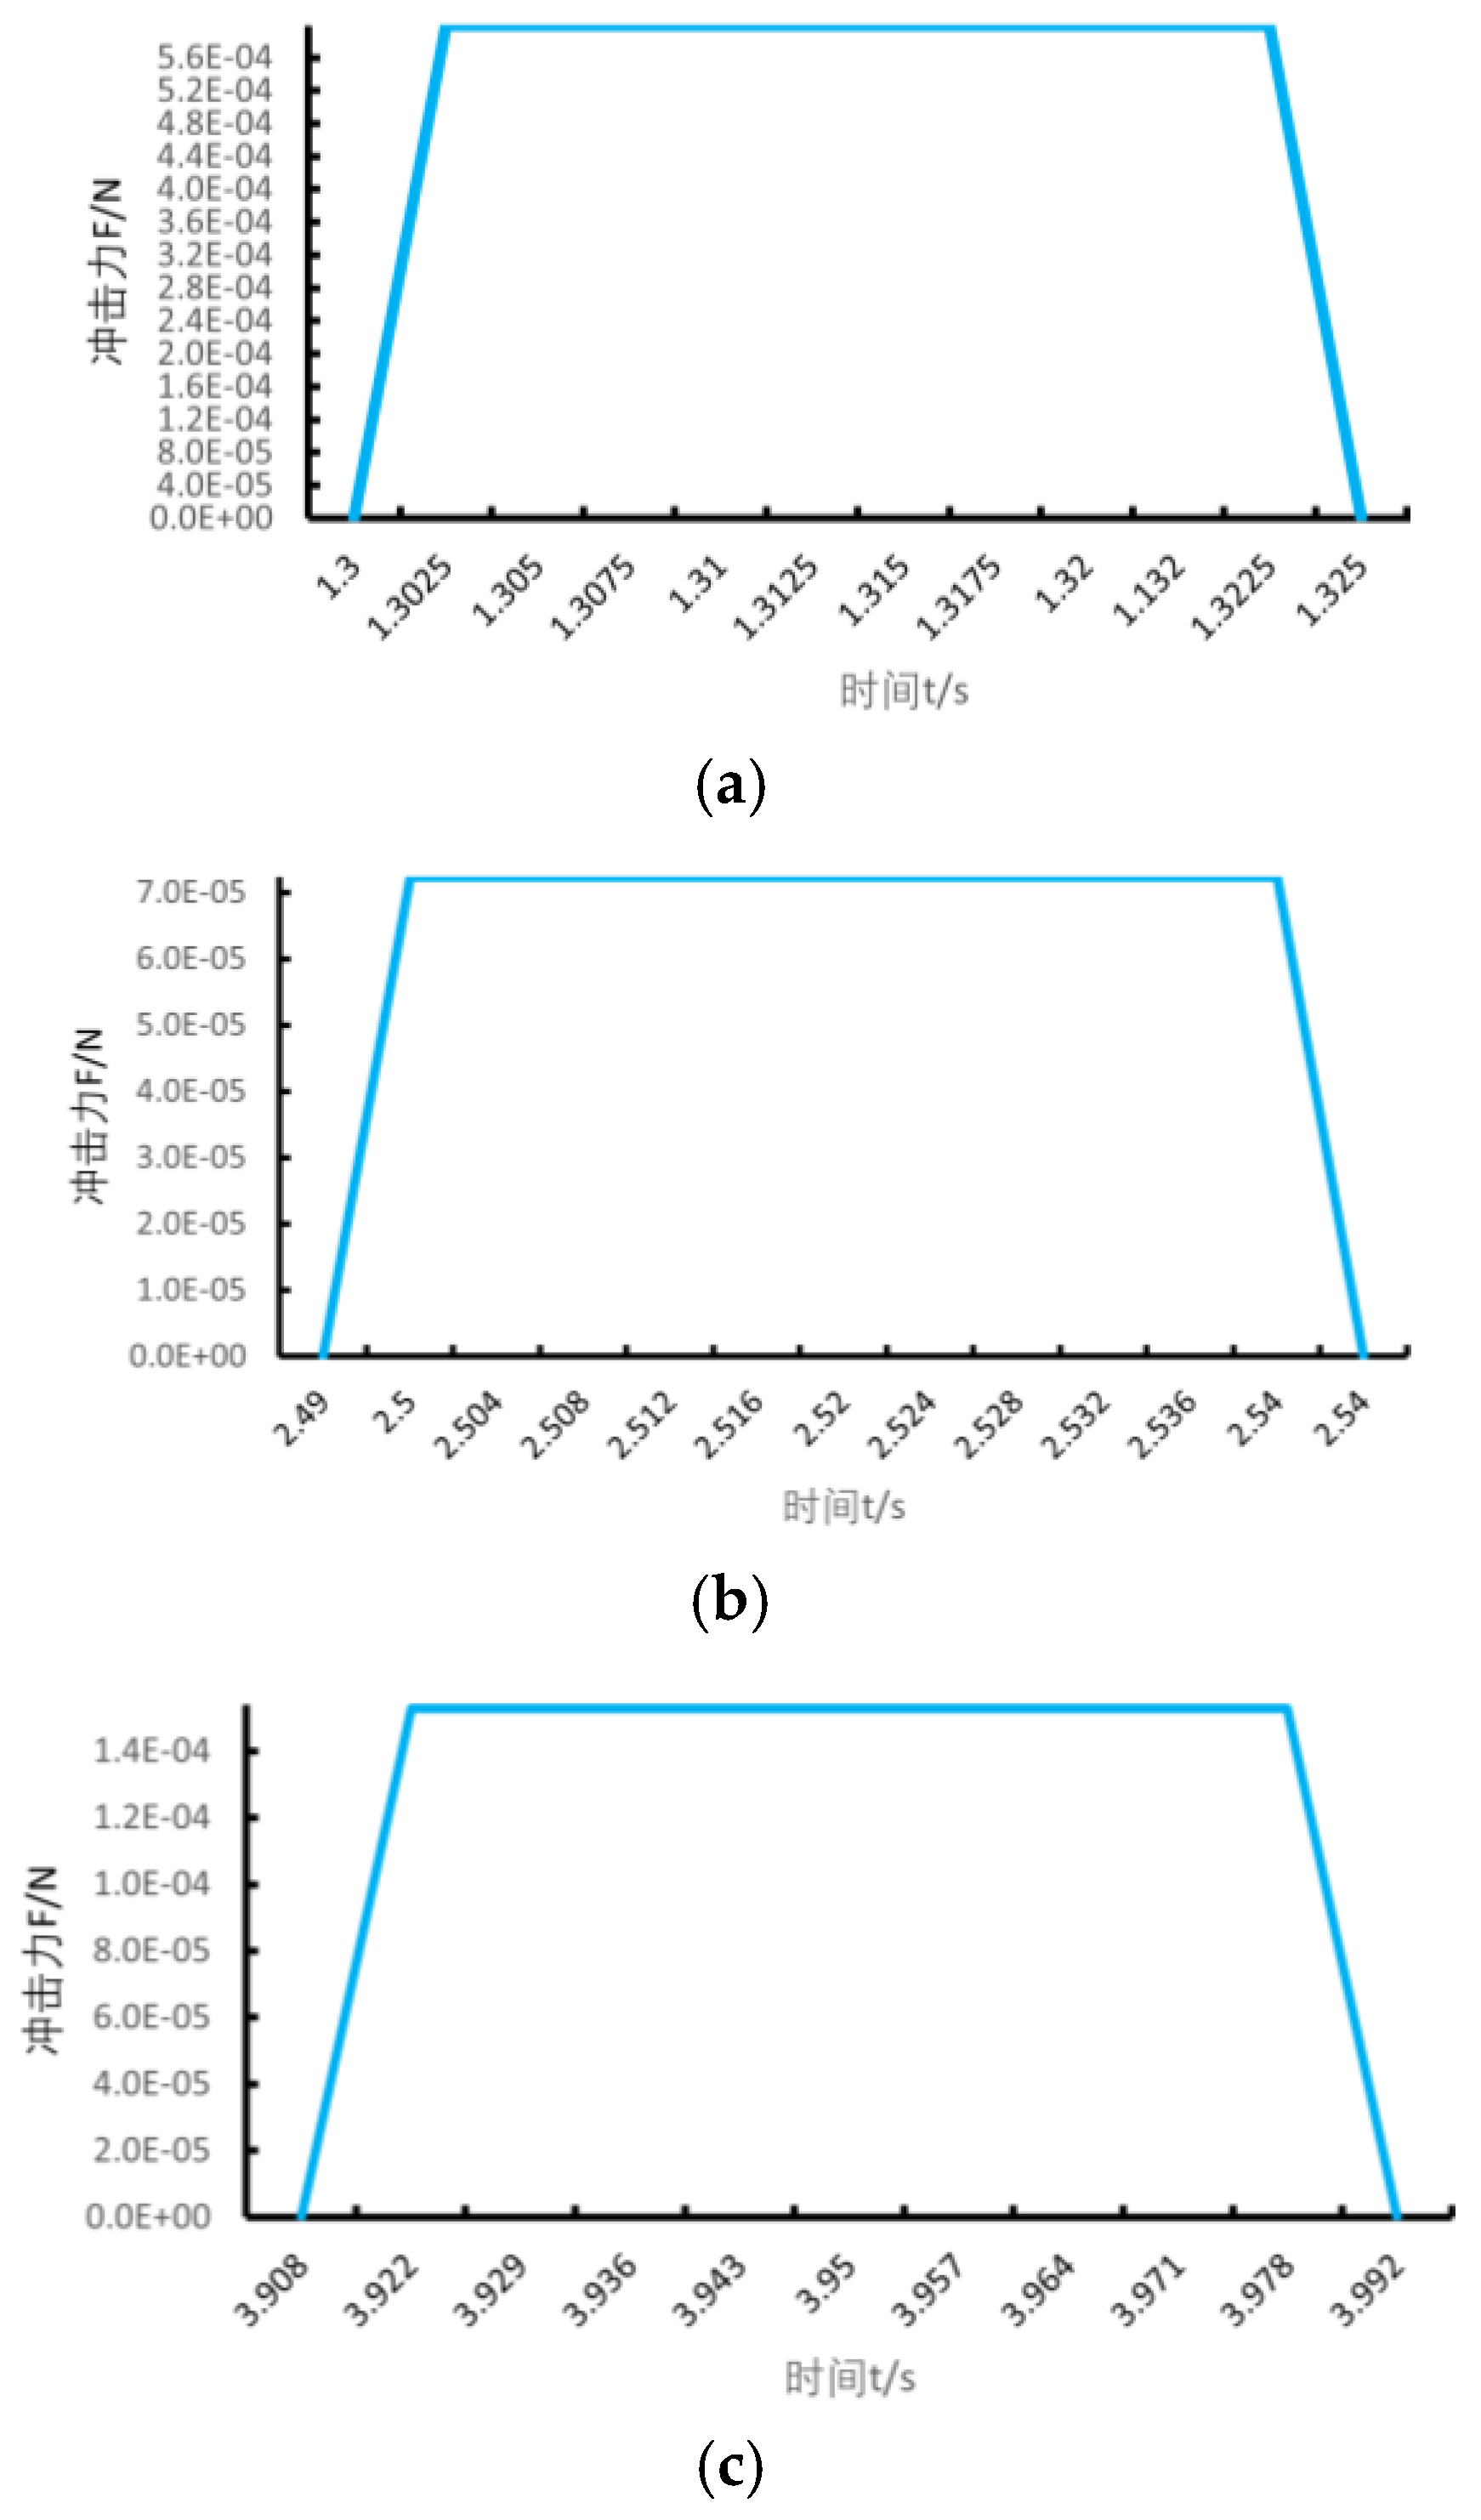
Figure 5.
PLX-DAQ Serial Communication Interface.
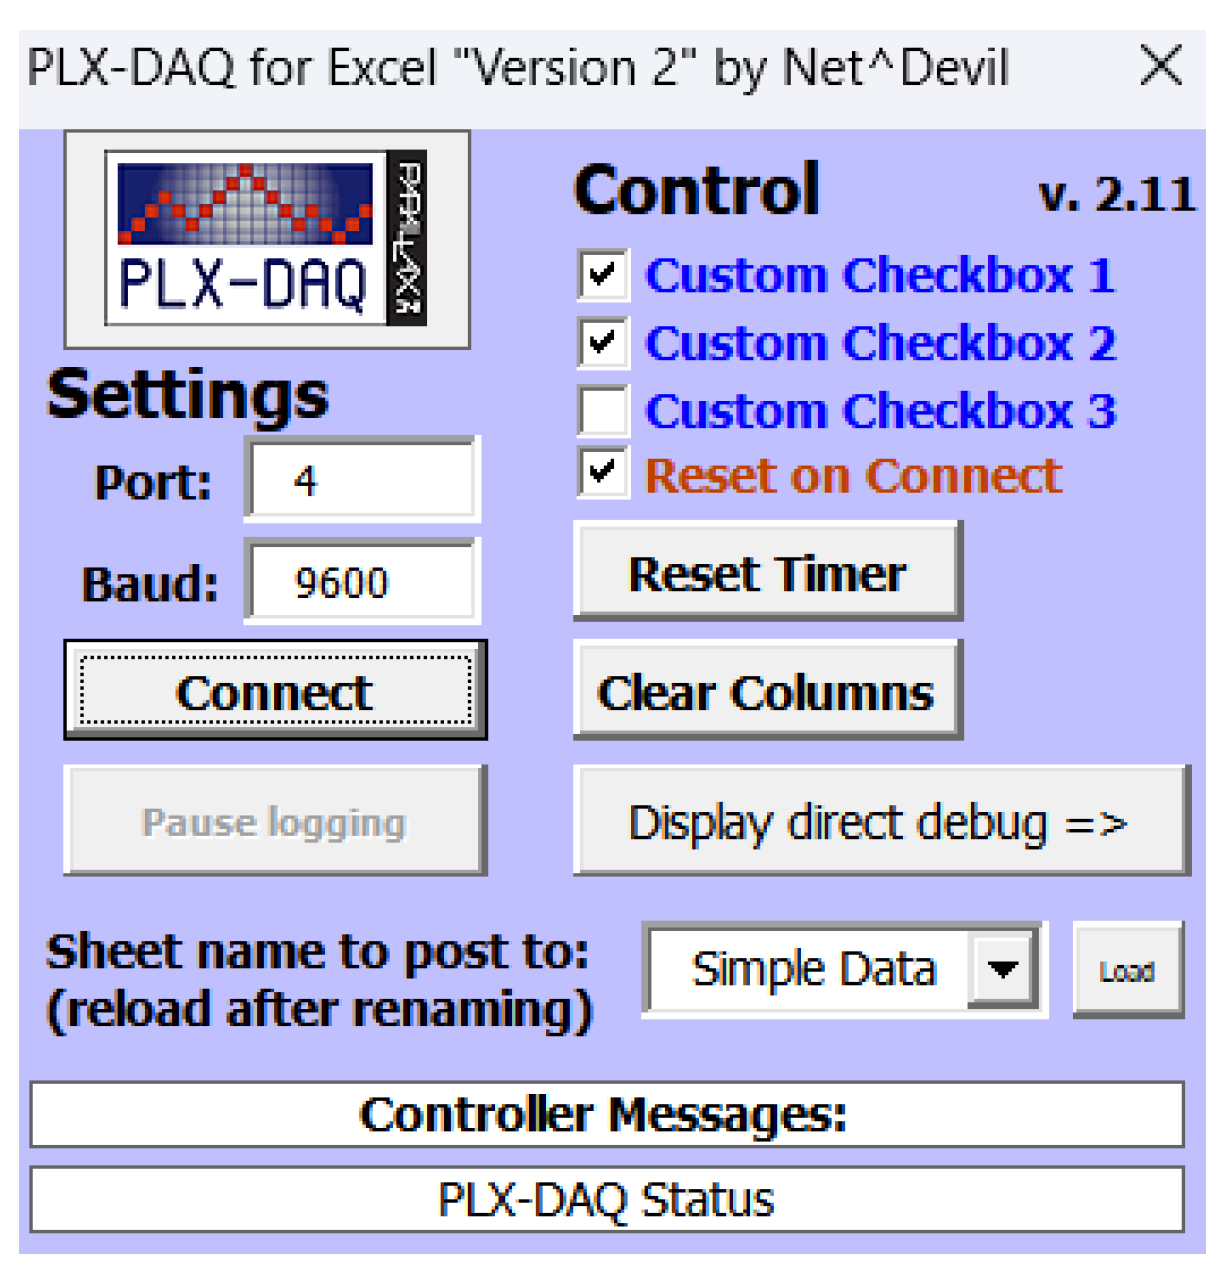
Figure 6.
Flowchart of the Cleaning Loss Detection System.
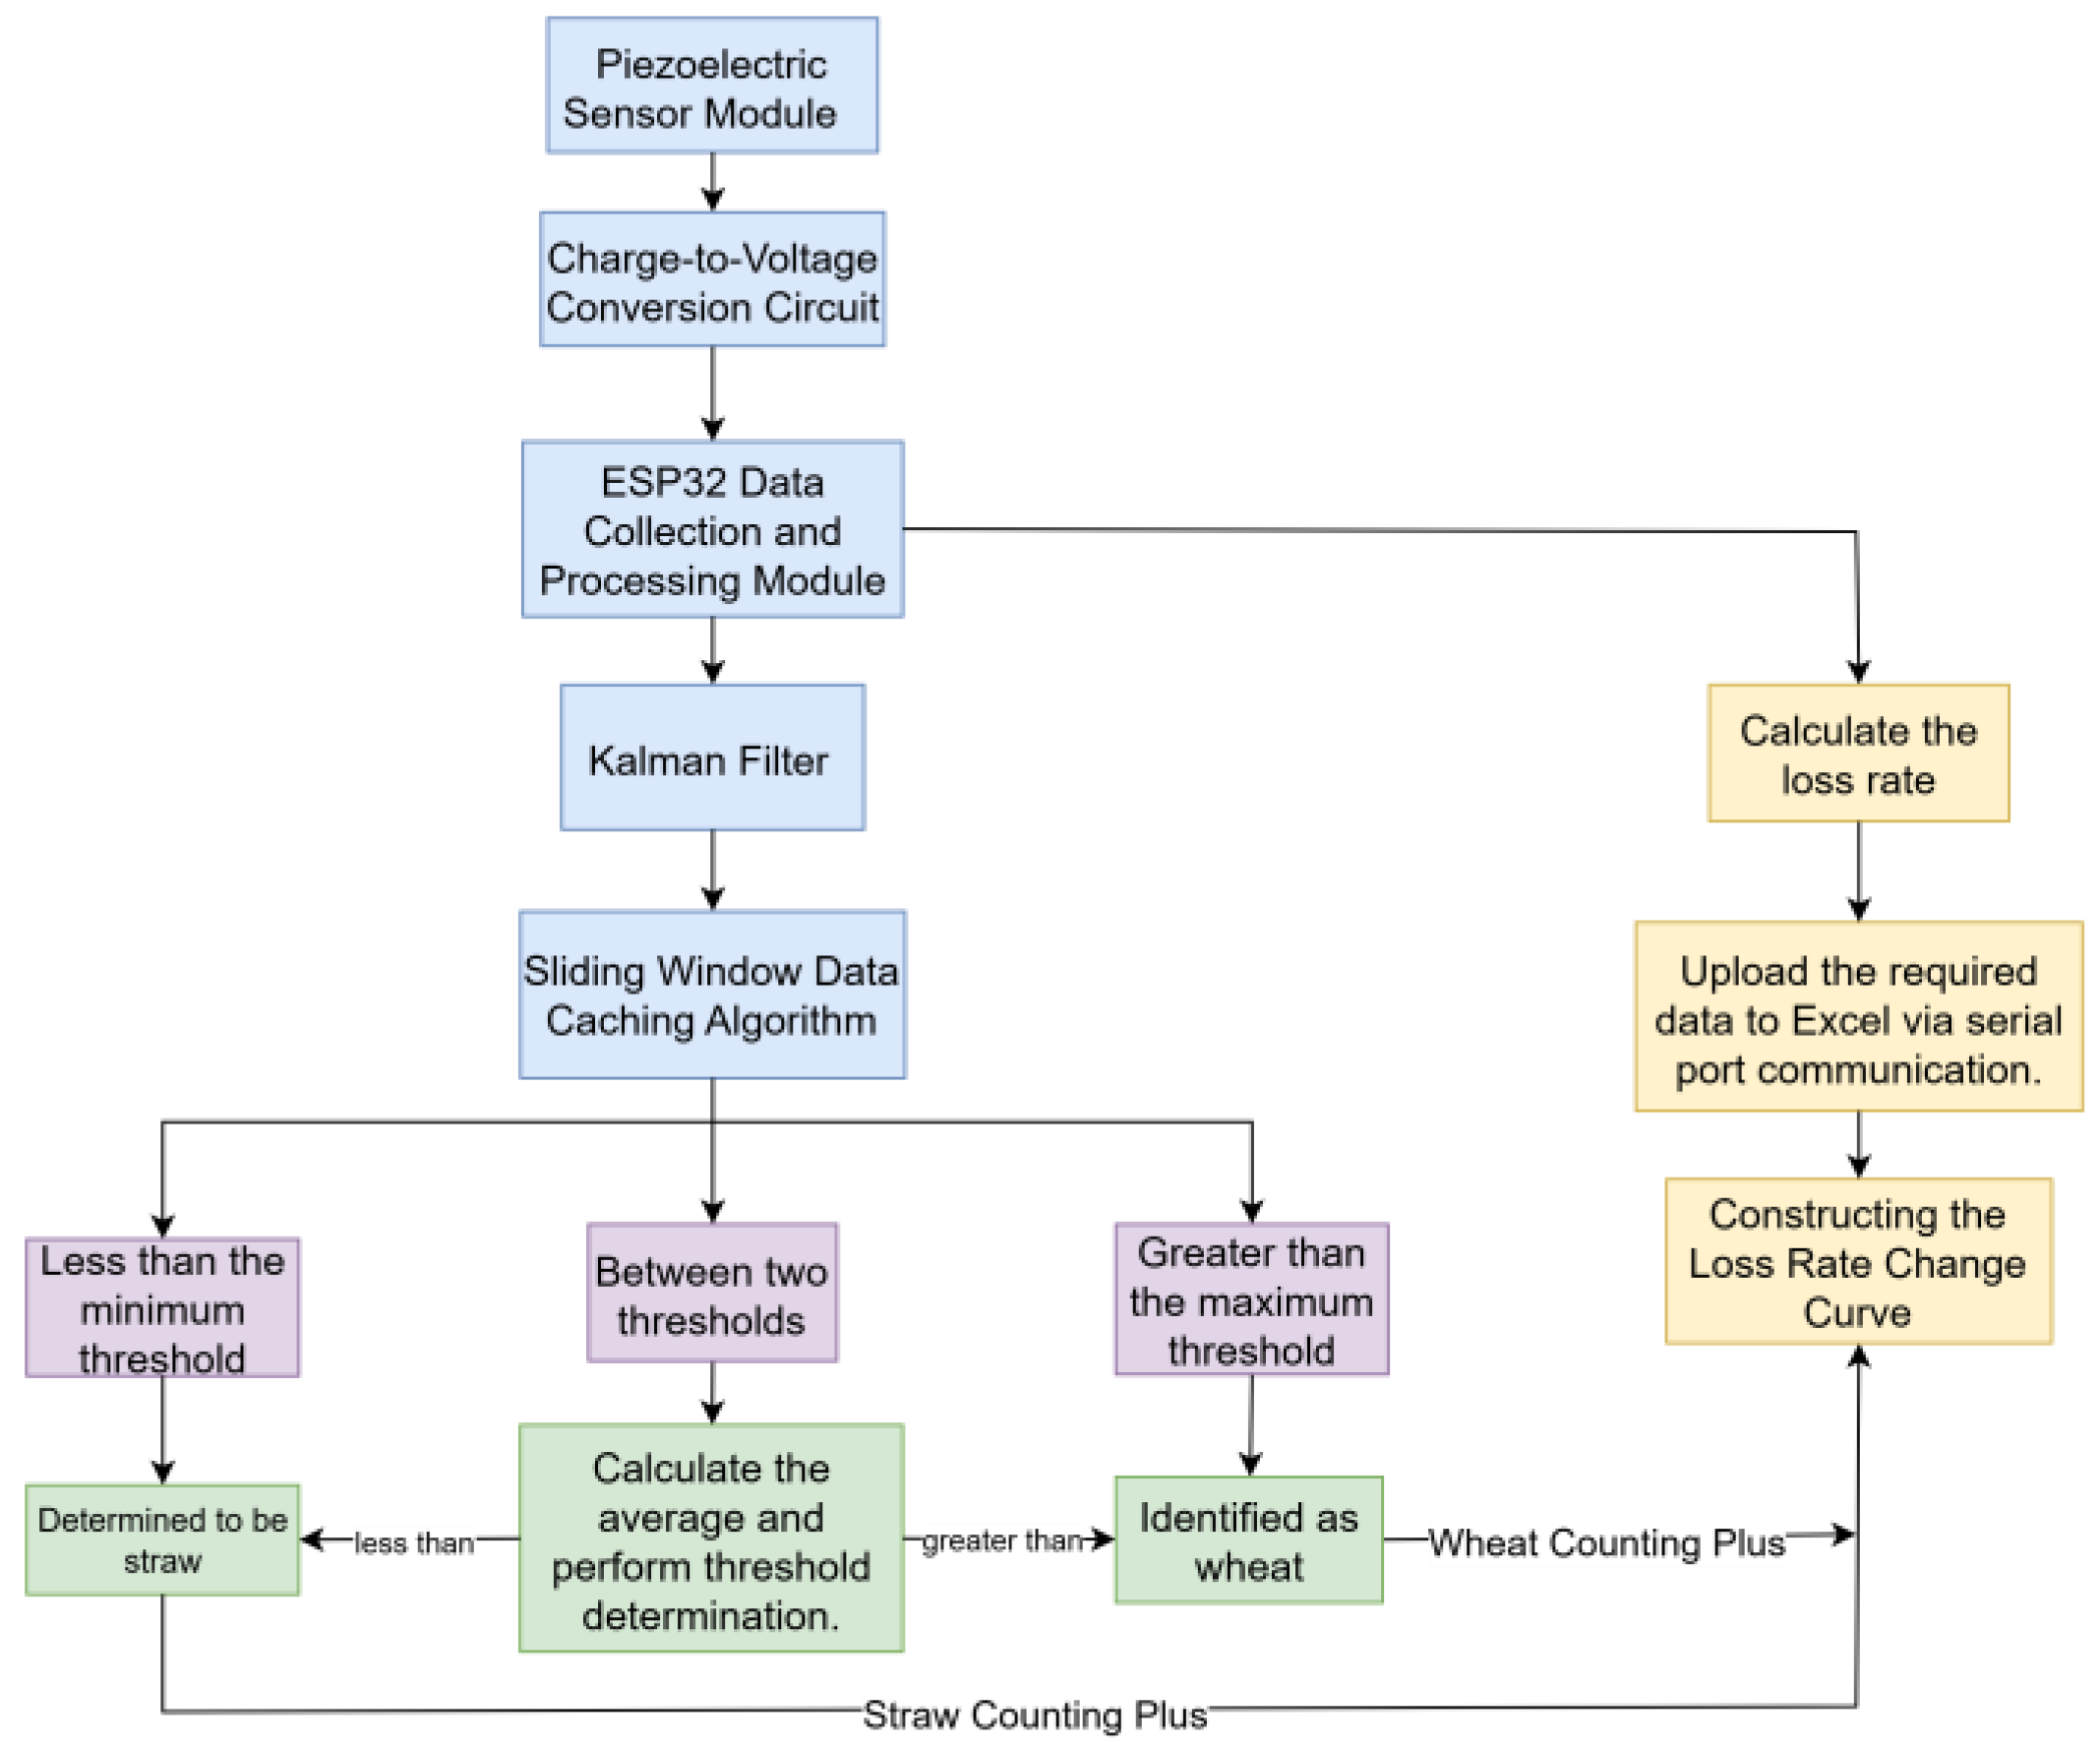
Figure 7.
Schematic Diagram of the Overall Mechanical Structure of the Loss Detection Device. 1. Conveyor Belt 2. Sensitive Plate 3. Sensitive Plate Fixing Bracket 4. Collection Box.
Figure 7.
Schematic Diagram of the Overall Mechanical Structure of the Loss Detection Device. 1. Conveyor Belt 2. Sensitive Plate 3. Sensitive Plate Fixing Bracket 4. Collection Box.
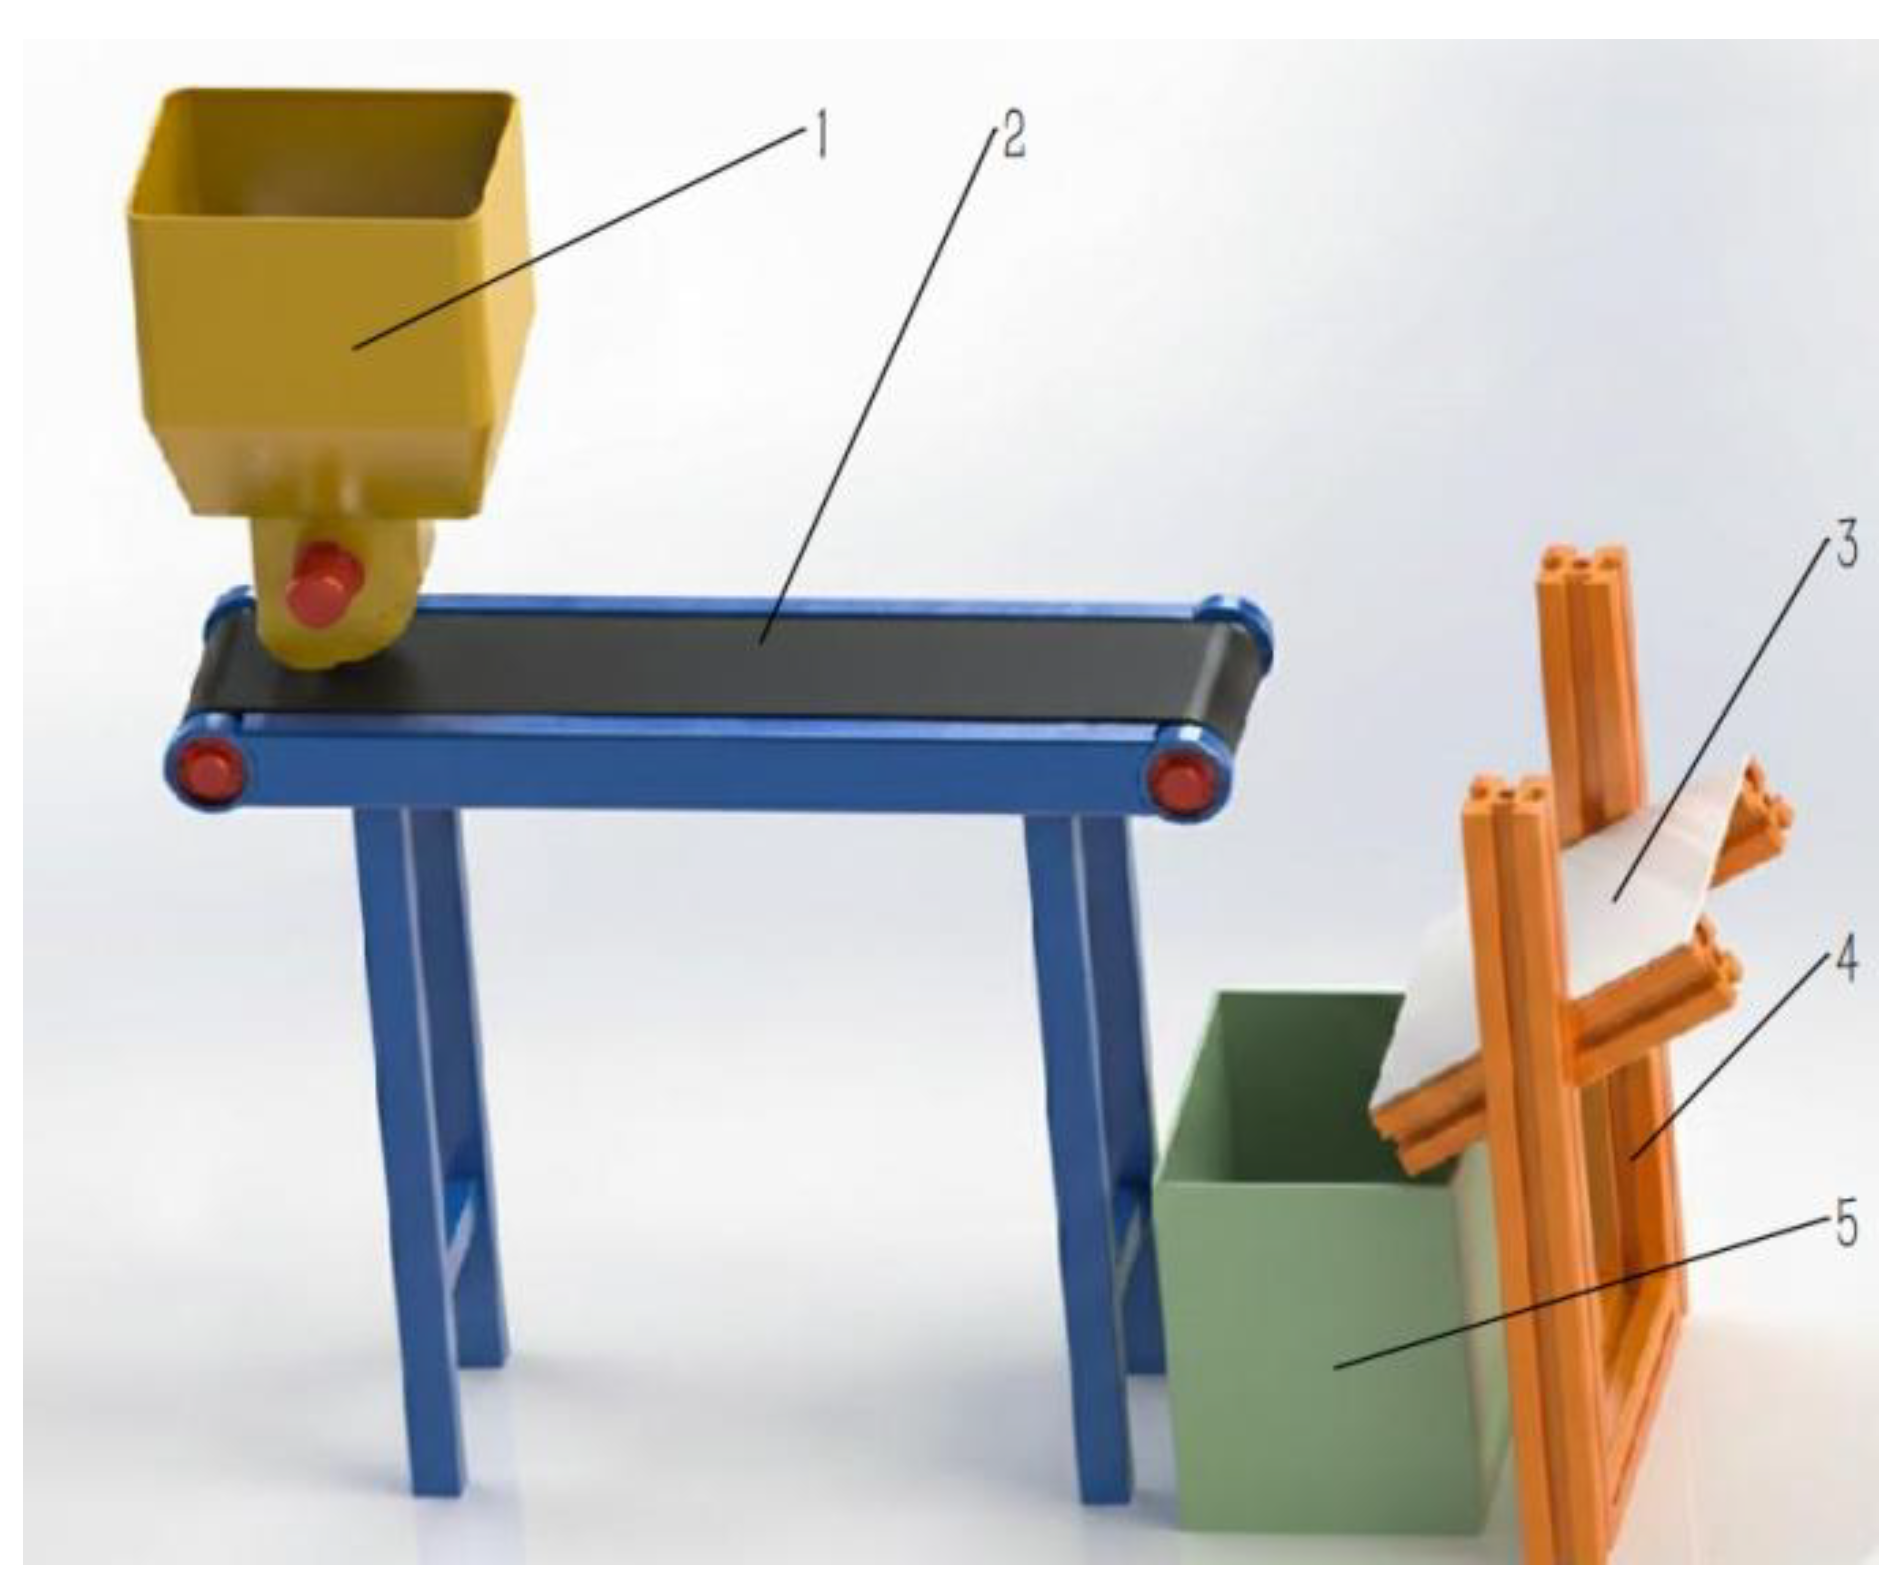
Figure 8.
Normal Distribution Plot of Wheat Impact Test.
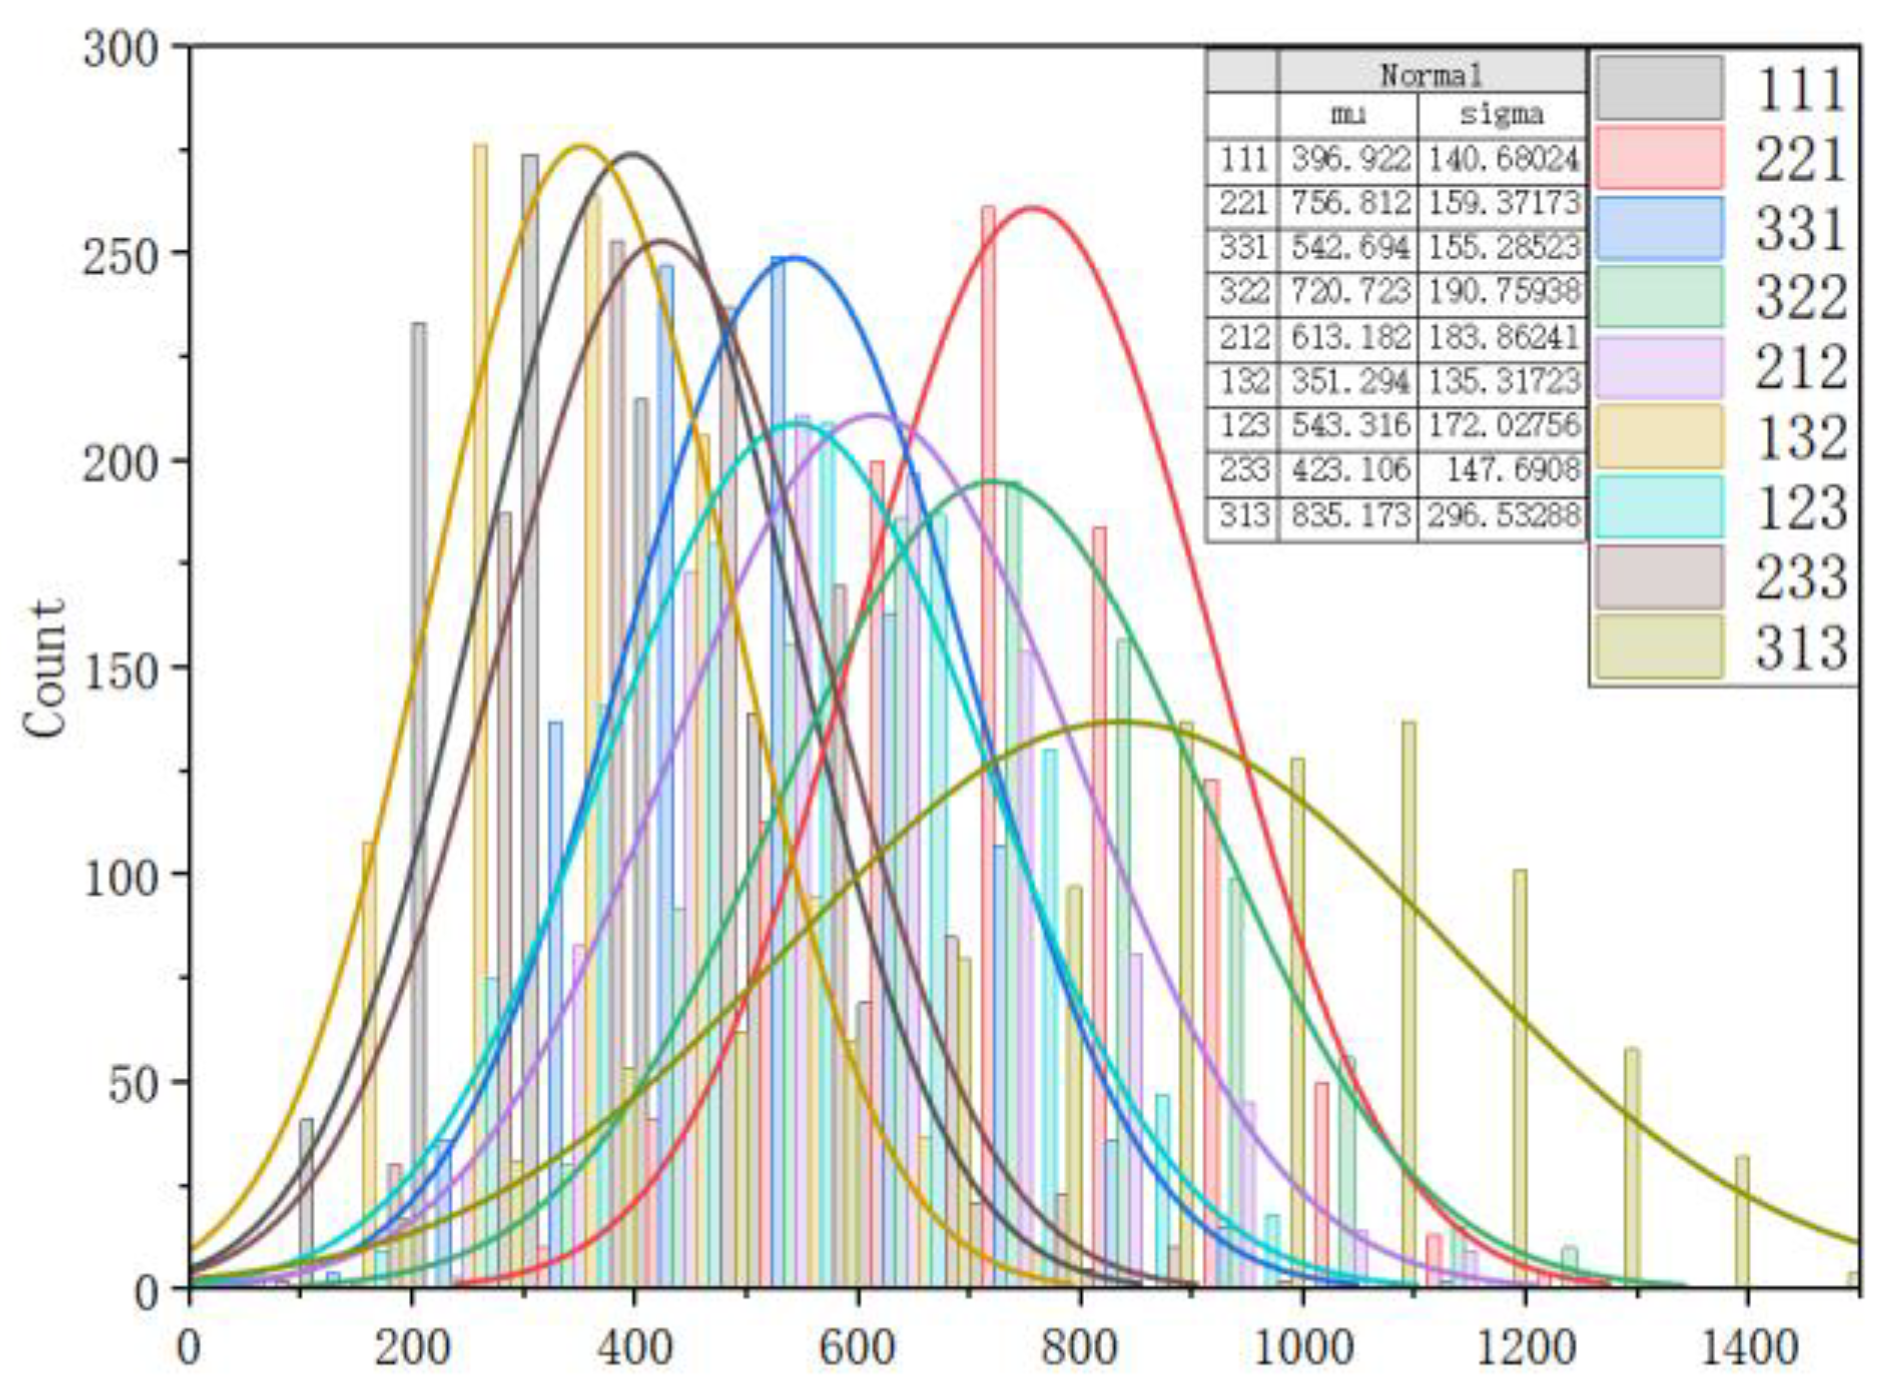
Figure 9.
Normal Distribution Plot of Straw Impact Test.
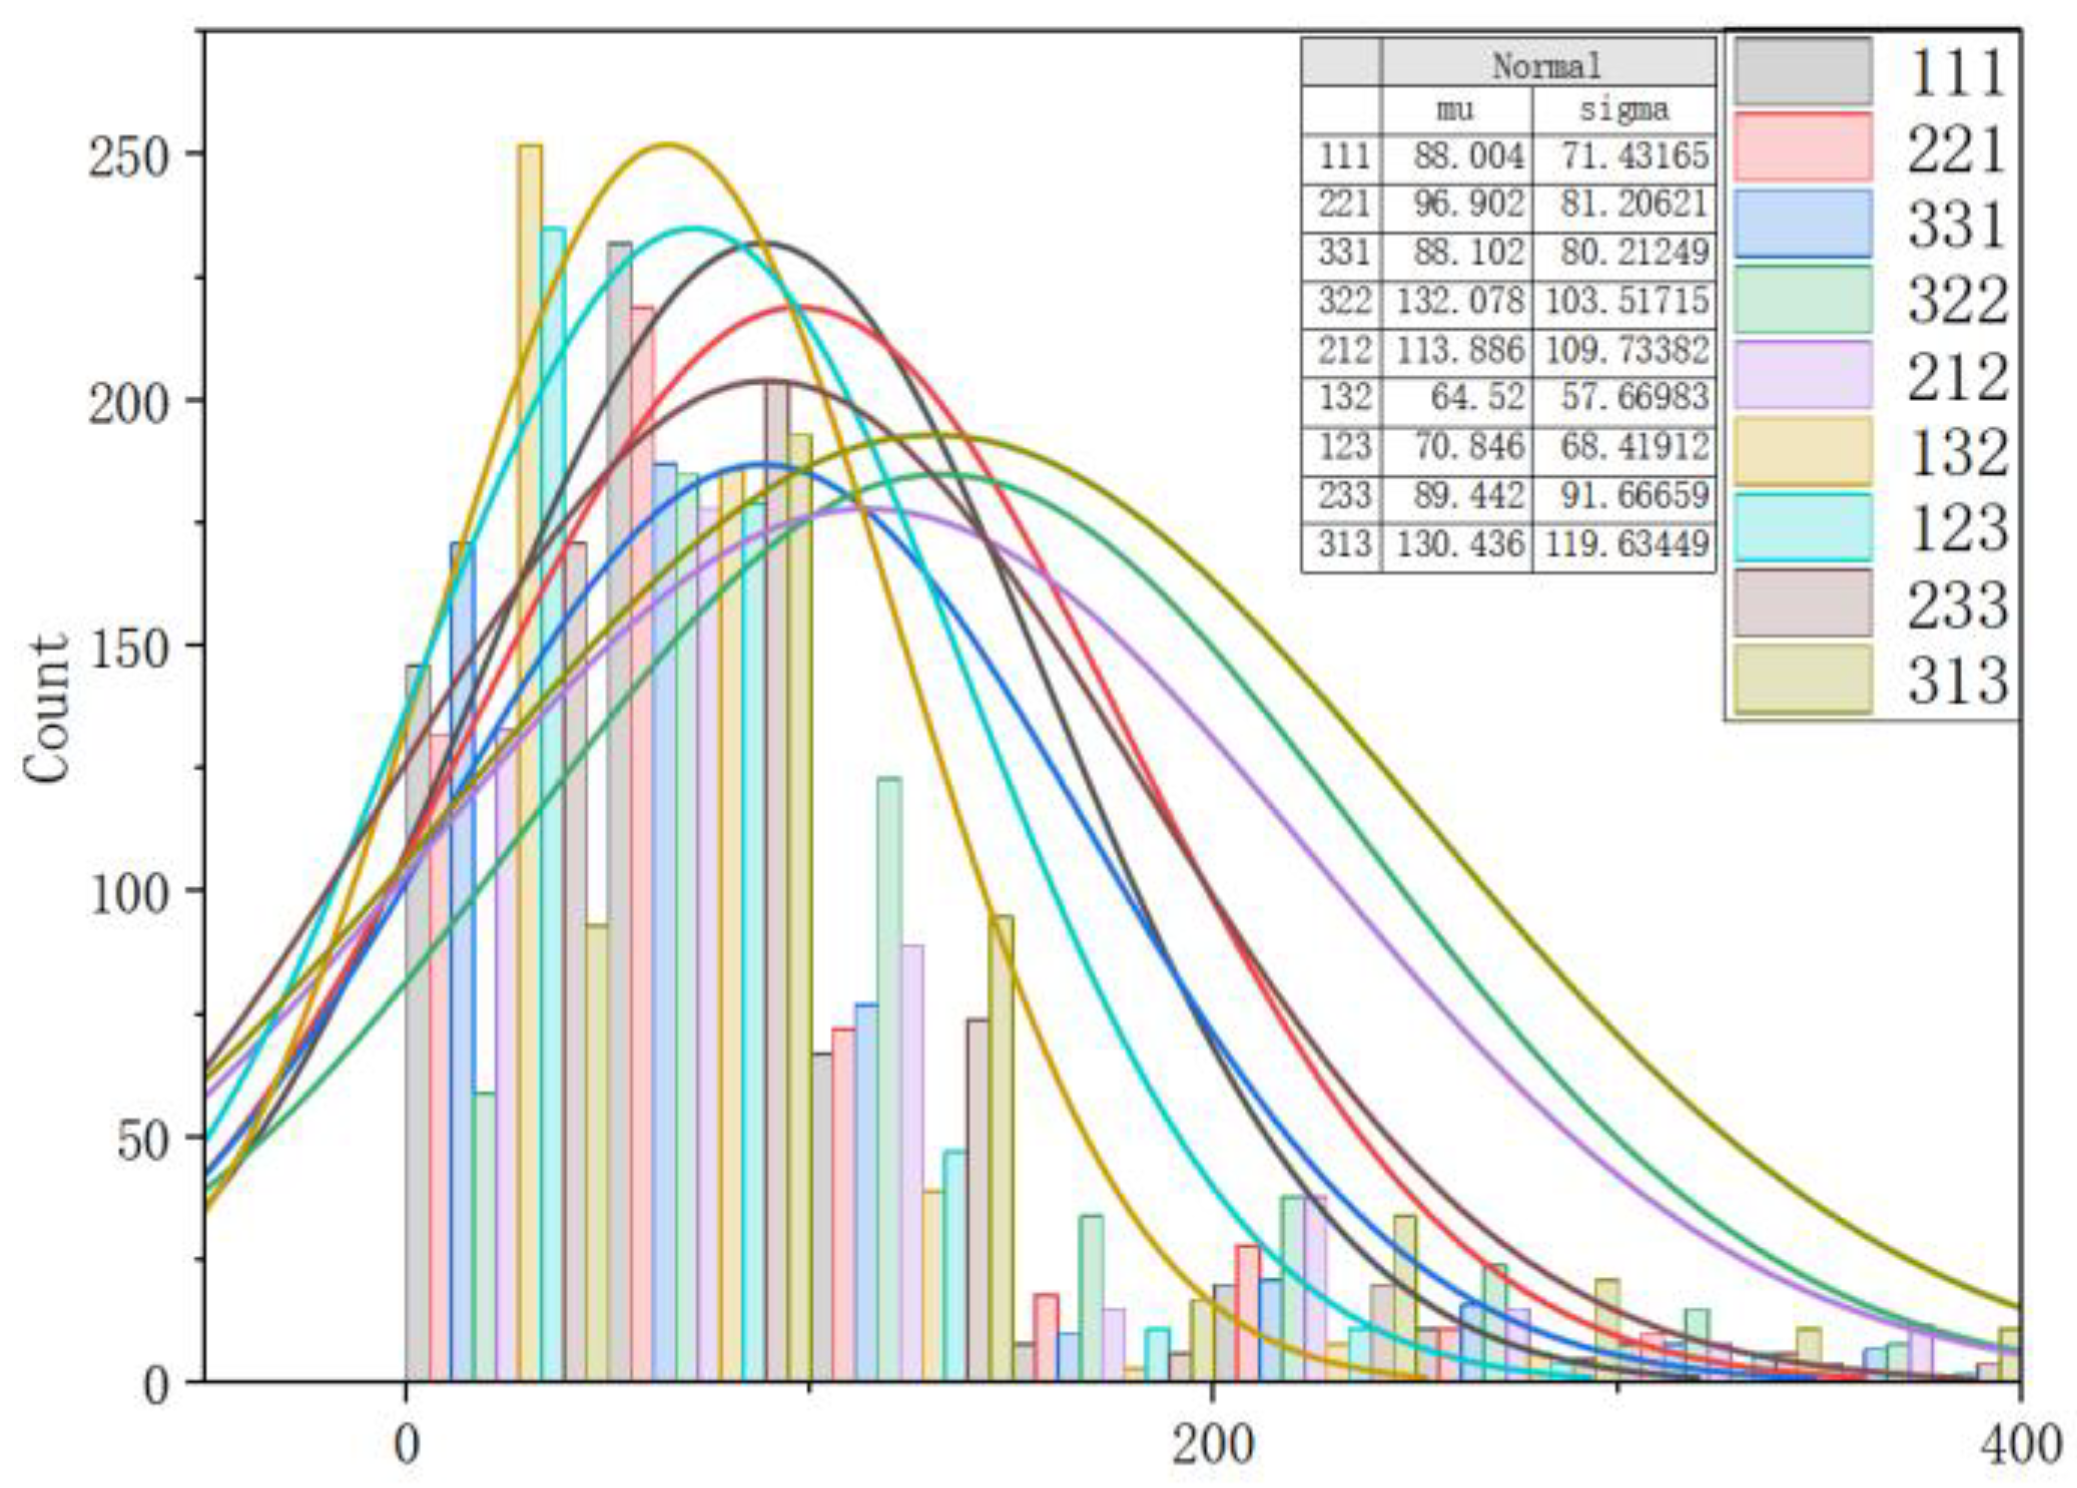
Figure 10.
Response Surface of Sensor Data for Wheat and Straw Impact on the Sensitive Plate. (a)Wheat Impact Sensor Data Response Surface on the Sensitive Board; (b)Straw Impact Sensor Data Response Surface on the Sensitive Plate.
Figure 10.
Response Surface of Sensor Data for Wheat and Straw Impact on the Sensitive Plate. (a)Wheat Impact Sensor Data Response Surface on the Sensitive Board; (b)Straw Impact Sensor Data Response Surface on the Sensitive Plate.
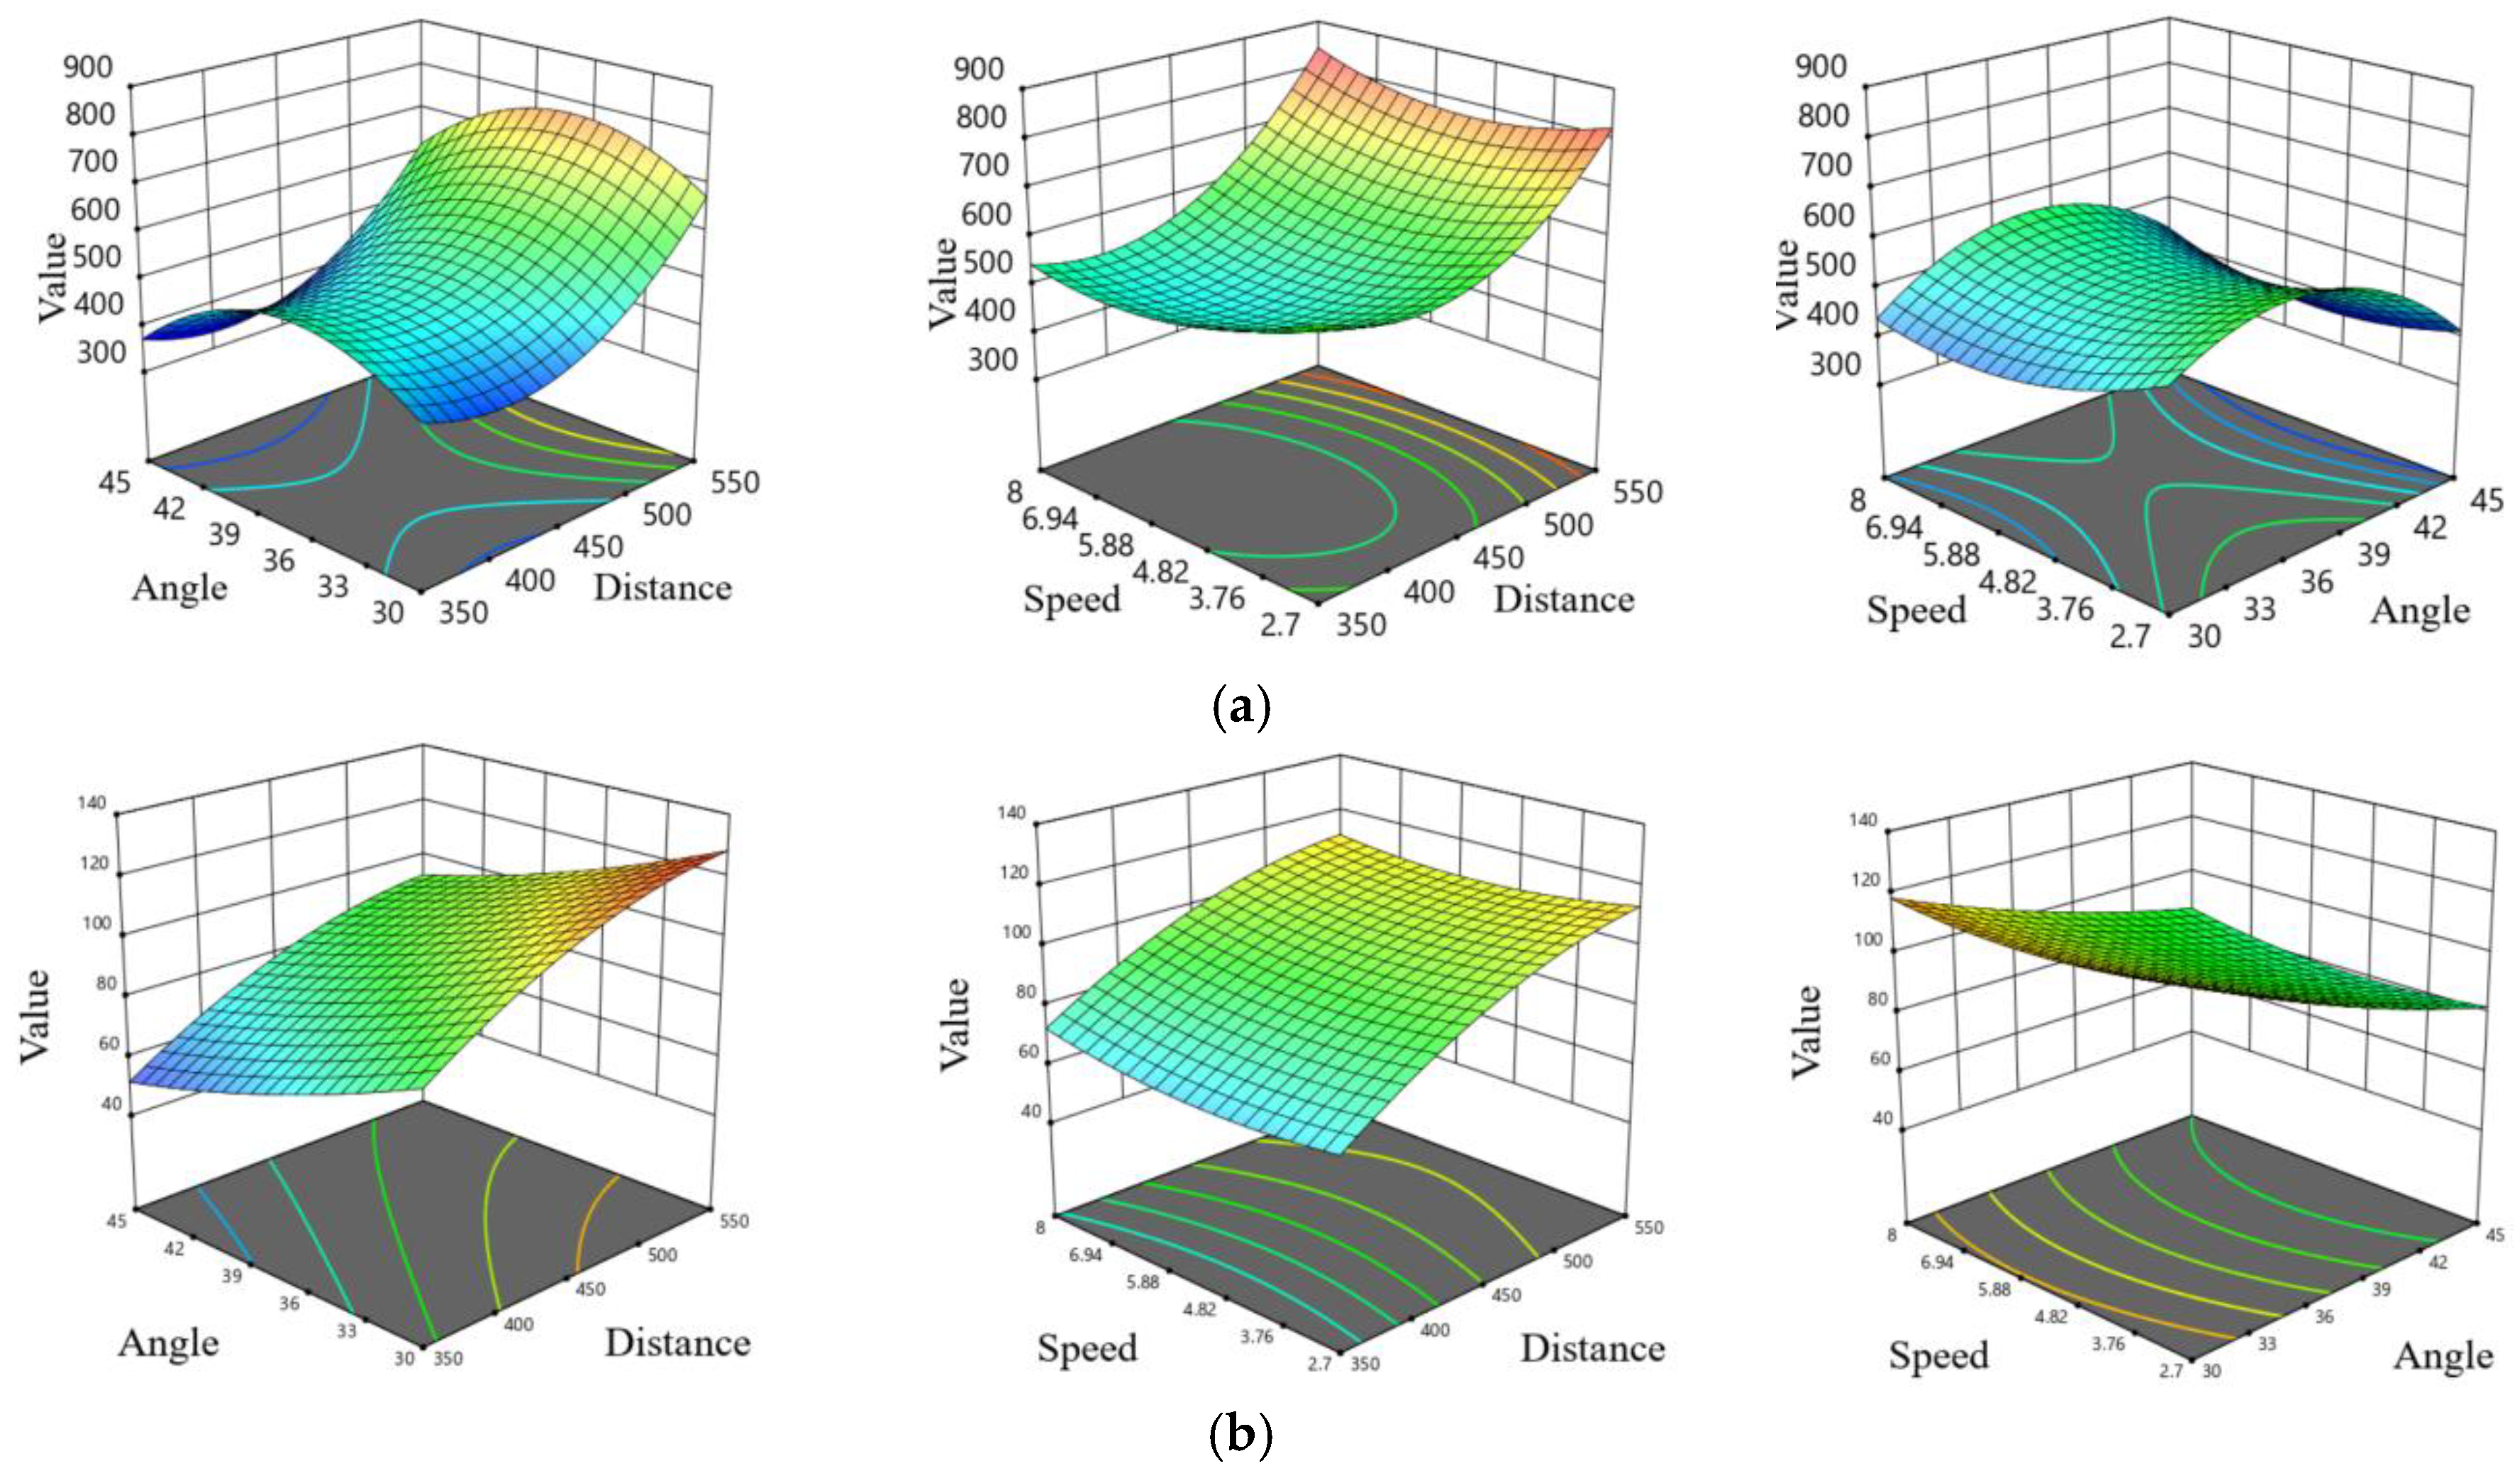
Figure 11.
Normal Distribution Plot for the Threshold Determination Experiment of Wheat and Straw.
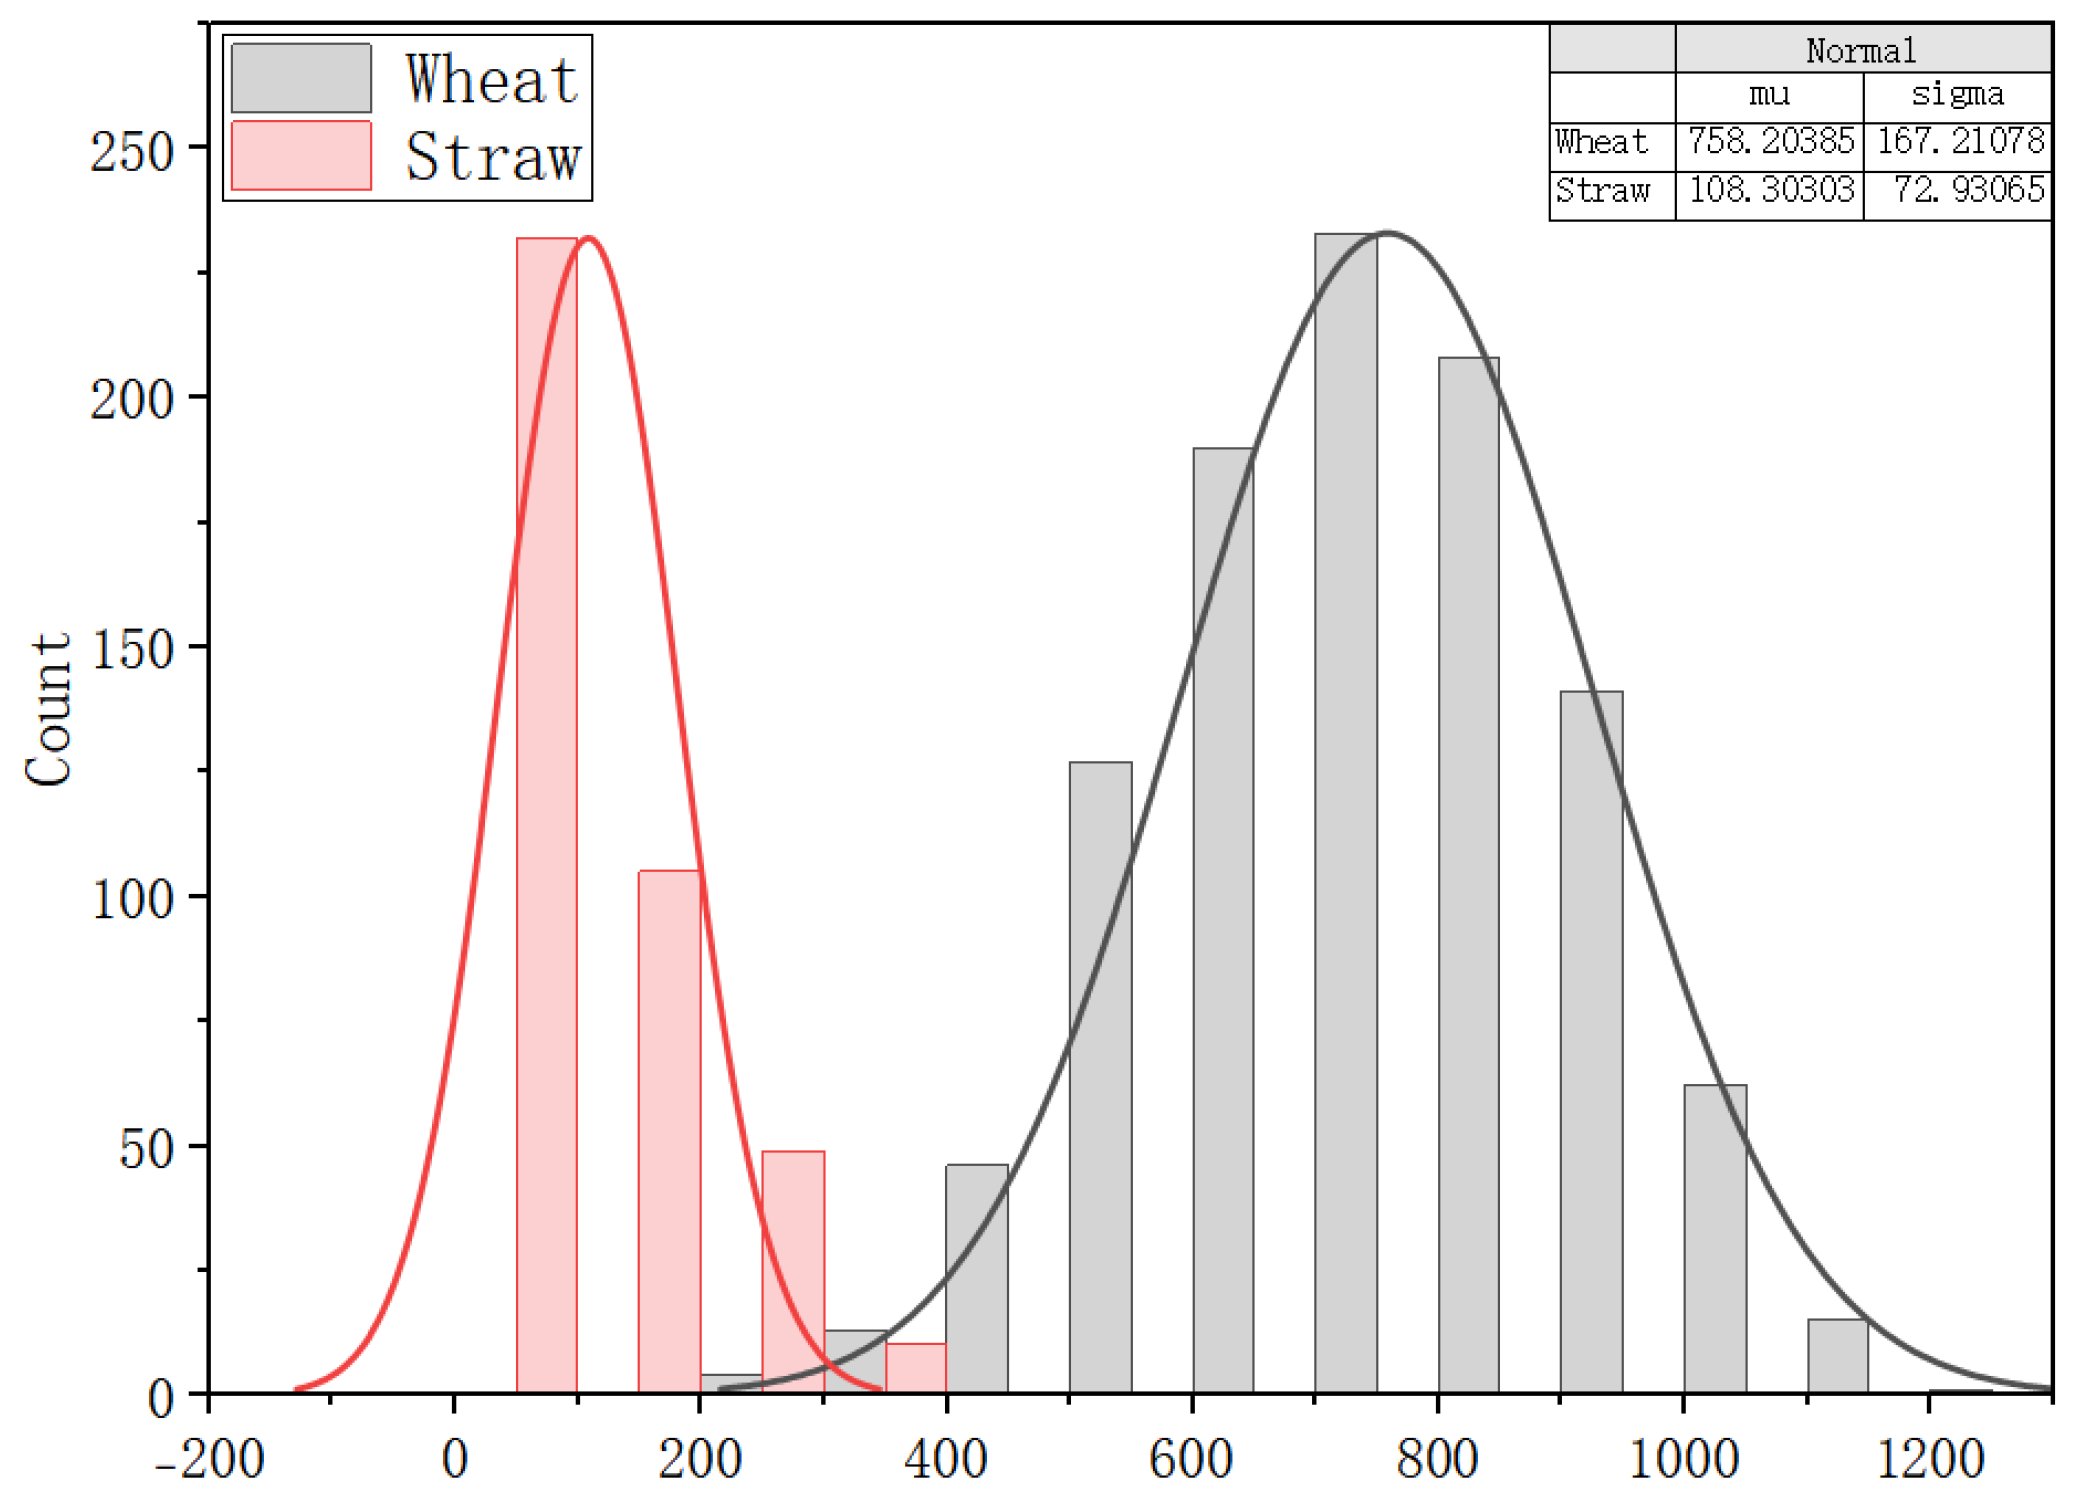

Table 1.
Parameters of EDEM Discrete Element Simulation Experiment.
| Simulation Parameters | Poisson ratio | Density/(kg/m³) | Modulus of elasticity/MPa |
| Wheat | 0.3 | 1480 | 1930 |
| 50mm straw | 0.4 | 1670 | 16.96 |
| 100mm straw | 0.4 | 1670 | 16.96 |
| Sensing plate | 0.35 | 1150 | 3000 |
Table 2.
Experimental Factors and Levels.
|
Level Factor |
Factor | ||
| Installation height(mm) | Installation angle(°) | Conveyor belt speed(m/min) | |
| 1 | 350 | 30 | 2.7 |
| 2 | 450 | 40 | 5.3 |
| 3 | 550 | 45 | 8 |
Table 3.
Orthogonal Experimental Design for Wheat Tests.
| Orthogonal Design Table | Mathematical Expectation of Sensor Data | |||
| Number | Factor 1 | Factor2 | Factor3 | |
| 1 | 1 | 1 | 1 | 396.992 |
| 2 | 2 | 2 | 1 | 756.812 |
| 3 | 3 | 3 | 1 | 542.694 |
| 4 | 3 | 2 | 2 | 720.723 |
| 5 | 2 | 1 | 2 | 613.182 |
| 6 | 1 | 3 | 2 | 351.294 |
| 7 | 1 | 2 | 3 | 543.316 |
| 8 | 2 | 3 | 3 | 423.106 |
| 9 | 3 | 1 | 3 | 835.173 |
| Mean 1 | 430.534 | 615.116 | 565.499 | |
| Mean 2 | 597.700 | 673.617 | 561.733 | |
| Mean 3 | 699.530 | 439.031 | 600.532 | |
| Extreme difference | 268.996 | 234.586 | 38.799 | |
Table 4.
Orthogonal Experimental Design for Straw Tests.
| Orthogonal Design Table | Mathematical Expectation of Sensor Data | |||
| Number | Factor 1 | Factor2 | Factor3 | |
| 1 | 1 | 1 | 1 | 88.004 |
| 2 | 2 | 2 | 1 | 96.902 |
| 3 | 3 | 3 | 1 | 88.102 |
| 4 | 3 | 2 | 2 | 132.078 |
| 5 | 2 | 1 | 2 | 113.886 |
| 6 | 1 | 3 | 2 | 64.520 |
| 7 | 1 | 2 | 3 | 70.846 |
| 8 | 2 | 3 | 3 | 89.442 |
| 9 | 3 | 1 | 3 | 130.436 |
| Mean 1 | 74.457 | 110.775 | 91.003 | |
| Mean 2 | 100.077 | 99.942 | 103.495 | |
| Mean 3 | 116.872 | 80.688 | 96.908 | |
| Extreme difference | 42.415 | 30.087 | 12.492 | |
Table 5.
Analysis of Variance for Quadratic Regression Model in Wheat Experiments.
| Source | Sum of Squares | df | Mean Square | F-value | p-value | |
| Model | 2.784E+05 | 9 | 30933.60 | 88.61 | < 0.0001 | significant |
| A-Height | 1.167E+05 | 1 | 1.167E+05 | 334.38 | < 0.0001 | |
| B-Angle | 7548.03 | 1 | 7548.03 | 21.62 | 0.0056 | |
| C-Speed | 2677.69 | 1 | 2677.69 | 7.67 | 0.0394 | |
| AB | 19.57 | 1 | 19.57 | 0.0561 | 0.8222 | |
| AC | 3120.40 | 1 | 3120.40 | 8.94 | 0.0305 | |
| BC | 3421.43 | 1 | 3421.43 | 9.80 | 0.0259 | |
| A2 | 61749.90 | 1 | 61749.90 | 176.88 | < 0.0001 | |
| B2 | 60228.23 | 1 | 60228.23 | 172.52 | < 0.0001 | |
| C2 | 12650.28 | 1 | 12650.28 | 36.24 | 0.0018 | |
| Residual | 1745.51 | 5 | 349.10 | |||
| Lack of Fit | 1538.67 | 3 | 512.89 | 4.96 | 0.1724 | not significant |
| Pure Error | 206.85 | 2 | 103.42 | |||
| Cor Total | 2.801E+05 | 14 |
Table 6.
Analysis of Variance for Quadratic Regression Model in Straw Experiments.
| Source | Sum of Squares | df | Mean Square | F-value | p-value | |
| Model | 6332.21 | 9 | 703.58 | 77.14 | < 0.0001 | significant |
| A-Height | 3440.89 | 1 | 3440.89 | 377.26 | < 0.0001 | |
| B-Angle | 2511.49 | 1 | 2511.49 | 275.36 | < 0.0001 | |
| C-Speed | 0.7657 | 1 | 0.7657 | 0.0840 | 0.7836 | |
| AB | 0.0056 | 1 | 0.0056 | 0.0006 | 0.9811 | |
| AC | 7.74 | 1 | 7.74 | 0.8489 | 0.3991 | |
| BC | 14.06 | 1 | 14.06 | 1.54 | 0.2694 | |
| A2 | 217.58 | 1 | 217.58 | 23.86 | 0.0045 | |
| B2 | 34.16 | 1 | 34.16 | 3.75 | 0.1107 | |
| C2 | 78.03 | 1 | 78.03 | 8.56 | 0.0328 | |
| Residual | 45.60 | 5 | 9.12 | |||
| Lack of Fit | 30.92 | 3 | 10.31 | 1.40 | 0.4417 | not significant |
| Pure Error | 14.68 | 2 | 7.34 | |||
| Cor Total | 6377.81 | 14 |
Table 7.
Analysis of Means.
| Factor 1 | Factor2 | Factor3 | |||||||
| Mean 1 | Mean2 | Mean3 | Mean 1 | Mean2 | Mean3 | Mean 1 | Mean2 | Mean3 | |
| Wheat | 430.534 | 597.700 | 699.530 | 615.116 | 673.617 | 439.031 | 565.499 | 561.733 | 600.532 |
| Straw | 74.457 | 100.077 | 116.872 | 110.775 | 99.942 | 80.688 | 91.003 | 103.495 | 96.908 |
| difference | 356.077 | 497.623 | 582.658 | 504.341 | 573.675 | 358.343 | 474.496 | 458.238 | 503.624 |
Table 8.
Wheat and Straw Impact Experiments.
| Types | Manual inspection of actual quantity per unit | Number of sensors detected/per unit | Sensor error | error rate |
| Wheat | 453 | 448 | 5 | 1.1% |
| Straw | 393 | 382 | 11 | 2.8% |
Disclaimer/Publisher’s Note: The statements, opinions and data contained in all publications are solely those of the individual author(s) and contributor(s) and not of MDPI and/or the editor(s). MDPI and/or the editor(s) disclaim responsibility for any injury to people or property resulting from any ideas, methods, instructions or products referred to in the content. |
© 2026 by the authors. Licensee MDPI, Basel, Switzerland. This article is an open access article distributed under the terms and conditions of the Creative Commons Attribution (CC BY) license (http://creativecommons.org/licenses/by/4.0/).
Copyright: This open access article is published under a Creative Commons CC BY 4.0 license, which permit the free download, distribution, and reuse, provided that the author and preprint are cited in any reuse.


