
Submitted:
17 January 2026
Posted:
19 January 2026
You are already at the latest version
Abstract
Accurately tracking carbon dynamics by sources, sinks, and removals in Malawi’s Land Use, Land-Use Change, and Forestry (LULUCF) sector is critical for understanding the country’s contribution to global greenhouse gas (GHG) balances and for guiding effective climate policy. A study was conducted to track carbon dynamics by sources, sinks, and removals in Malawi’s LULUCF sector for the period 2018-2022 to enhance carbon market development. Carbon Stock Change Approach following the Intergovernmental Panel on Climate Change (IPCC) guidelines were employed. The approach integrated forest inventory data, and Earth Observations from Sentinel-2 Multispectral Imager and ALOS-PALSAR-1. Activity datasets were categorised into land classification schema sources of, Forestland, Cropland, Grassland, Wetland, and Settlement. Monte Carlo uncertainty analysis at a 95% confidence level was applied to assess data reliability and estimate uncertainties in emissions and removals. The results revealed that total emissions from the LULUCF sector declined by 10.29%, primarily due to reduced deforestation rates and increased forest regrowth. Forestland contributed the largest proportion of emissions (79.08%), followed by cropland (9.70%) and wetlands (8.50%). In contrast, the Grassland and Settlement categories contributed the lowest, 2.60% and 0.12%, respectively. Forest conversion to other land uses decreased, while natural regeneration and afforestation initiatives enhanced carbon removals. The overall uncertainty level was low, 4.16%. This greatly enhances Malawi’s ability to participate in carbon markets, report transparently under climate conventions, and attract climate finance with reduced risk. Finally, the study also contributes to Malawi’s first biennial transparency report (BTR1) and fourth national communication (NC4) to the United Nations framework convention on climate change under the Paris agreement.
Keywords:
LULUCF
; greenhouse gas
; sinks and sources
; removals
; pathways
; carbon market
1. Introduction
Climate change, largely because of the rise in greenhouse gas (GHG) concentration in the atmosphere, remains one of the most tenacious global challenges of the 21st century, vividly in the tropical sub-Saharan Region of Africa (SSA). In this region, where Malawi is also located, it significantly impacts the sustainable development and management of natural resources. Malawi, a party to the United Nations Framework Convention on Climate Change (UNFCCC), continues to face the escalation of climate-related effects characterised by anthropogenic drivers, especially those characterised within the ‘Land Use, Land-Use Change, and Forestry’ (LULUCF) [1,2].
Key studies acknowledge that Land Use/Land Cover (LULC), otherwise loosely referred to as LULUCF in other reports, remains a prominent source and sink of greenhouse gas (GHG) emissions, particularly in tropical forests [1,3]. Nevertheless, the challenge has been tracking the evidence of trajectories for both emissions from sources and removals from sinks (ibid). Fortunately, for this study, this presents a prominent gap for exploring the pathways of the GHG sources and sinks, plus the actions involved, more innocuously, to meet a country’s obligations to meet the UNFCCC agenda.
Detailed studies primarily, though not exclusively, further indicate that the drivers range from the change from forestland to agricultural land or other to settlement land or the vice-versa through processes such as degradation and deforestation, harvested wood products (HWP), forest fire, afforestation, and reafforestation [1,4,5]. These activities contribute to GHG emissions and removals principally, in form of Carbon dioxide (CO2), Methane (CH4), and Nitrous Oxide (N2O), globally measured in tonnes of carbon dioxide equivalent (tCO2e) as a standard unit [3,6]. Furthermore, the metric CO2e is important in establishing Climate Change mitigation potential of the trees in a study area [5].
However, there is little research in Malawi on tracking of these gas fluxes (emissions and removals) from their sources and sinks [2]. Yet, this area forms a mandatory requirement for reporting on Climate Change management and mitigation to UNFCCC through inter alia; (i) Tracking progress in implementation and achieving the Nationally Determined Contributions (NDCs), (ii) National Communications (reported after every four years), and (iii) Biennial Transparency Report (BTR) [7].
Besides, Malawi launched the Carbon Framework in August 2025 which aims to offer a structured approach to carbon trading and enable the country to participate in both voluntary and compliance carbon markets [8]. The framework further indicates its ambitious intentions as follows; (i) leverage carbon finance, (ii) targeting to incentivise green investments, (iii) promote renewable energy, (iv) enhance natural resources conservation, (v) promote clean technology, and (vi) support climate-smart agriculture while contributing to global emission reduction efforts. A key study on estimation of long-term carbon stocks in Zimbabwe, a country in the SSA revealed that monitoring and quantification which intrinsically involves tracking of the same is pivotal for the penetration of the carbon credit markets [5,9].
Nevertheless, one open secret question remains how Malawi’s Carbon Framework would achieve these aforesaid targets in absence of the up-to-date information and analysis on; (i) the quantity and recent trends of the net and gross of the GHG emissions and removals? and (ii) the currently identified sources and sinks of these key GHGs? [6]. In view of the aforesaid knowledge gaps, therefore, it was imperative for this study to deliver answers to the stated key questions as well as by providing the information to the operationalisation of the Malawi Carbon Framework, hence, the rationale of this study needs not to be overemphasized. Therefore, the objective of this study was to track carbon dynamics by sources, sinks, and removals in Malawi’s LULUCF sector for the period 2018-2022 to enhance carbon market development. This study provides robust, low-uncertainty LULUCF carbon estimates for Malawi, strengthening MRV systems, improving emissions accounting, and enabling credible participation in voluntary and compliance carbon markets. The study also contributes to Malawi’s first biennial transparency report (BTR1) and fourth national communication (NC4) to the United Nations framework convention on climate change under the Paris agreement.
2. Methods and Materials
2.1. Study Area
The study was conducted in Malawi, located in Southern Africa (Figure 1). The country is bordered by Zambia to the northwest and west, Tanzania to the north and northeast, and Mozambique to the east and southwest. Malawi experiences three distinct seasons: a cool–dry season from May to August with average temperatures of 4–10 °C; a hot–dry season from September to October with mean temperatures of 25–37 °C; and a warm–wet season from November to April, during which most annual rainfall occurs, ranging from 725 to 2,500 mm [10].
2.2. Activity Data, Emission Factor, and Land Use Classification
The study employed Carbon Stock Change Approach following the Intergovernmental Panel on Climate Change (IPCC) guidelines [11]. The approach is well explained in [2]. Briefly, the approach integrated forest inventory data, and Earth Observations from Sentinel-2 Multispectral Imager and ALOS-PALSAR-1. Activity datasets were categorised into land classification schema sources of, Forestland, Cropland, Grassland, Wetland, and Settlement [11] (Table 1). The emission factors used in this LULUCF sector are presented in Table 2.
2.3. Approaches Used for Natural Disturbances and Harvested Wood Products
Fire (biomass burning) is the principal form of natural disturbance which impacts carbon stocks on land in Malawi [12]. Therefore, only losses of carbon stocks due to fires were considered in this inventory. Other disturbances such as wind, and pest and disease outbreaks were considered insignificant. The statistics of the burnt areas were acquired from Global Forest Resource Assessment (FRA) and distributed proportionately to forest sub-types and other land classes. Biomass burning utilized combustion values and fuel loads from regionally existing studies [12]. On the other hand, statistics for timber harvests in the form of round wood, sawn wood, wood-based panels and industrial round wood were obtained from FAOSTAT. The FAO data was consolidated into harvested wood products/types as indicated in Table 3.
2.4. Estimation of Biomass, Carbon Stock, Uncertainty, and Greenhouse Gases
The UNFCCC guidelines require the use of five carbon pools when estimating greenhouse gases. These pools include above-ground biomass, below-ground biomass, deadwood (DW), litter, and soil organic carbon (SOC) [11]. This study used three carbon pools, above ground biomass, below ground biomass, and soil organic carbon. It should be noted that Malawi’s populace is highly dependent on fuel wood and less wood is left lying for longer periods in the forestlands unlike in other highly significant areas like peatlands. Furthermore, litter is burned in the dry season to achieve ecosystem goals [13]. Therefore, the assumption is that the carbon stocks in deadwood and litter do not significantly change over time. The default emission factors were used for the Pine plantation, Eucalyptus plantation, cropland, grassland, wetland, and settlement categories.
The above ground biomass (AGB) and below ground biomass (BGB) were estimated using the site-specific allometric equation developed [14].
where: AGB and BGB are above ground biomass and below ground biomass (kg dry matter per tree), respectively; dbh is a diameter at breast height (1.3 m above the ground level) (cm); and ht is the total tree height (m).
AGB = 0.103685 x (dbh)1.921719 x ht0.844561
BGB = 0.284615 x (dbh)1.992658
Total living biomass of a tree (TLB) was calculated as the sum of AGB and BGB, while carbon stock (C) was calculated using the following formula:
where: CF is the carbon factor and varies from 0.45 to 0.50 [15]. In this study, the widely accepted biomass-to-carbon conversion factor of 0.47 was employed [2].
C = TLB x CF
Soil organic carbon (SOC) was calculated using equation 4 as recommended by [16].
SOC = 0.571 × (AGC + BGC)
where: SOC is soil organic carbon (tC/ha), AGC and BGC are above-ground carbon stock and below-ground carbon stock (tC/ha), respectively.
Carbon stock or biomass estimates are usually associated with uncertainties from sources such as sampling error, measurement error and estimation error [17]. It is a good practice to quantify uncertainties to understand the accuracy of the carbon stock estimations [15]. Therefore, Monte Carlo procedure, well explained by other researchers [2] was used to estimate uncertainty of the parameters studied at 95% confidence interval.
The datasets obtained were manually populated into IPCC Inventory software version 2.98 to estimate the greenhouse gases emissions. The software supports all sectors and allows users to enter activity data and emission factors, calculate emissions and removals, and generate reporting tables for UNFCCC submissions. Key enhancements include improved reporting tables, notation keys, Excel export, and performance improvements [11]. It is considered robust because it (i) implements agreed international IPCC methodologies across all inventory sectors Implements agreed international IPCC methodologies across all inventory sectors, (ii) reduces calculation errors with built-in defaults and quality-control features, and (iii) enhances transparency and interoperability with UNFCCC reporting tools [18].
3. Results and Discussion
3.1. Overall Emissions Trends in LULUCF Sector for the Period 2018 to 2022
Summary of the results on the overall emissions trends in LULUCF Sector in Malawi for the period 2018 to 2022 are presented in Table 4, Figure 2, Figure 3 and Figure 4. The results indicate that there has been a noticeable fluctuation in emissions which registered a decreased of 5,347.13 GgCO2e (10.29%) averaging to -2.06% annually (Figure 2; Figure 3). Furthermore, for the period 2018 to 2022 the greatest contribution of the emissions emanated from the forestland (79.08%), followed by cropland (9.70%) and Wetland (8.50%). Grassland and settlement contributed the lowest, 2.60% and 0.12%, respectively (Figure 4).
As depicted in Table 4, Figure 2 and Figure 3, the underlying trend of declining emissions in the LULUCF sector from 2018 to 2022 is primarily, though not exclusively, attributed to the following, (i) the decline in emissions from forestland conversion to other land uses, and (ii) the increase in removals through forest regrowth on previously cleared land [2]. These have ultimately resulted to a decline in net emissions from the harvest of indigenous (Miombo) forests.
Nevertheless, emissions remained relatively stable in 2022 as increasing sink in croplands and grasslands due to the La Niña conditions (wetter conditions that enhanced plant growth) were offset by increases in emissions in forest lands due to wildfires and increased rates of soil carbon decay also caused by the wetter conditions [19].
Principally, the mitigation scenario predicts GHG emission trends under interventions to curtail their emissions. In as far as Malawi’s Nationally Determined Contributions (NDCs) and Nationally Appropriate Mitigation Actions (NAMA) are concerned, the LULUCF sector showed greatest mitigation potential [20]. Coincidentally, the mitigation options identified also in Malawi's Third National Communication NC3 apply for this study [21]. They further agree with the recommendations of the Food and Agricultural Organization (FAO) which recognised them as the GHG reduction options under the LULUCF sector [22]. Selection of these mitigation interventions was carried out through a screening process by the stakeholders which prioritised the following in their criteria; (i) the cost of implementation, (ii) potential to reduce emissions, (iii) ease of implementation, and (iv) compatibility with government programmes and plans. The optimal mitigation options selected are briefly enshrined in policy framework and implementation [7]. In this regard, the country is implementing, sector-specific policies to enhance mainstreaming of adaptation and mitigation measures within the FOLU context, and inter-alia, these include, (i) National Forest Landscape Restoration Strategy-2018, (ii) Reducing Emissions from Degradation and forest Degradation (REDD+) Strategic Plan, (iii) Malawi REDD+ Forest Reference Level-2018, (iv) Malawi National Charcoal Strategy 2017-2027, (v) Tree planting (afforestation and reforestation) Initiatives, (vi) National Greenhouse Gas Inventory Systems (GHG-IS) 2019, and (vii) Towards Healthy Forests for a Better Malawi [10].
Additionally, there are technological options in LULUCF sector aimed at mitigating GHG emissions and the key ones are not limited to, (i) Tree survival campaigns, (ii) Breeding and screening drought tolerant tree species, (iii) Pest and disease control, (iv) Sustainable management of forest resources, and (v) Increase in concessions of protected areas though under the Department of National Parks and Wildlife (i.e., Majete, Liwonde and recently Nkhotakota Wildlife Reserves under the African Parks Programme) [9].
In addition, Malawi has also engaged in the international Carbon Trade and the key carbon market schemes under the FOLU subsector so far include (i) the ‘Reducing Deforestation and forest Degradation (REDD+), and (ii) the Voluntary Carbon Markets (VCM). Advocated by the UNFCCC, the REDD+ includes the conservation and sustainable management of forests and enhancement of forest carbon stocks, thus the ‘Plus’ [23,24,25].
In the year 2023 the country officially launched the Malawi Carbon Markets Initiative (MCMI) to champion the implementation of the frameworks, action plans, and ongoing efforts that support carbon markets [8]. In Malawi, carbon trading is deemed as a source of revenue that will bolster the economy by supporting, foreign exchange shortages caused by a large trade imbalance and being buffeted by several shocks, including the climate crisis. In economic terms, the country’s carbon potential is estimated to be around 19 million metric tons annually [26]. The advantage of carbon trading is that it will provide incentives for managing trees and forests and all other initiatives that enhance carbon sequestration and are aimed at avoiding greenhouse gases. This is deemed a key mitigation option under LULUCF [27].
3.2. Emissions in LULUCF Sector for the Period 2018 to 2022 by Land Classification
3.2.1. Forestland
3.2.1.1 Forestland Remaining Forestland
3.2.1.1.1 Category Description
There are two broad sub-divisions to forest land remaining forestland, namely, the Miombo woodland, and the plantations. Plantations are further sub-divided into two: Pines and Eucalyptus plantations. The distribution of Miombo woodland, Pine plantations and Eucalyptus plantations is 89%, 3%, and 8%, respectively [2]. Miombo woodland in Malawi is defined as a tropical and subtropical dry forest ecosystem dominated by tree species from the Brachystegia, Julbernardia, and Isoberlinia genera. It is characterized by a mix of deciduous and semi-evergreen trees, with an understory of grasses and shrubs [28]. Plantations included within forest land remaining forest land are commercial plantations (Pine and Eucalyptus).
3.2.1.1.2 Emissions and removals from forestland remaining forestland
Summary of emissions and removals from forestland remaining forestland are depicted in Table 5. The emissions data for ‘forestland’ remaining ‘forestland’ from 2018 to 2022 show a gradual decline from 33,830.53 GgCO₂e in 2018 to 33,494.63 GgCO₂e in 2022. This downward trend suggests a steady reduction in net emissions, which could be attributed to improved forest conservation efforts, enhanced carbon sequestration, or reduced deforestation and degradation [29]. The consistent decrease, averaging around 84 GgCO₂e per year, indicates that forest management strategies, such as afforestation, reforestation, and reduced logging, may be having a positive impact [10]. However, the decline is relatively small, implying that while progress is being made, additional efforts may be needed to accelerate carbon sequestration or further minimize emissions from forest degradation [30]. Continuous monitoring and strengthening of sustainable forest management practices will be crucial to maintaining and enhancing this trend. Mitigation interventions implemented in areas hit-hard by the climate-induced catastrophes (cyclones Freddy, Idai and Chido) such as tree planting and conservation of regeneration would go a long way in enhancing carbon increase [31].
3.2.1.2 Land converted to forestland
3.2.1.2.1 Category description
Land converted to forestland includes the sub-categories, (i) grassland converted to forest land, (ii) cropland converted to forest land, and (iii) wetlands converted to forest land [2]. Grassland converted to forestland contains forest established on land that was previously non-forest. These conversions include (a) commercial plantations and environmental plantings, (b) forest that has regrown on land that was previously converted from a forest to grassland, and (c) regeneration from natural seed sources on land protected by State or Territory vegetation management policies. Cropland converted to forest land contains forest that has regrown on land that was previously converted from forest land to the land use identified. Wetlands converted to forestland comprises land on marsh have been detected to emerge with trees [2].
3.2.1.2.2 Annual area (ha) and Annual net emissions for land converted to forestland
The annual area in hectares for the land converted to forestland category is shown in Table 6. On the other hand, the annual net emissions for the land converted to forestland category are shown in Table 7. The emissions data for land converted to forestland from 2018 to 2022 show a steady decline from 2,995.90 GgCO₂e in 2018 to 2,577.44 GgCO₂e in 2022, indicating a reduction of approximately 104 GgCO₂e per year. This downward trend suggests that newly established forests are increasingly acting as carbon sinks, sequestering more carbon over time as trees mature and accumulate biomass. The decline in emissions may also reflect improved afforestation and reforestation efforts, natural regeneration, or better land-use practices that enhance carbon absorption [32]. However, the gradual decrease suggests that while progress is being made in converting land to forest, the rate of carbon sequestration is still limited, possibly due to factors such as species selection, soil conditions, or initial land degradation [33]. Strengthening forest restoration initiatives and ensuring sustainable management of newly forested areas could further enhance carbon sequestration and contribute to long-term climate mitigation goals [34].
3.2.1.2.3 Annual area burnt and net emissions for burning biomass in forestland
The annual area burnt and net emissions for burning biomass in forestland are presented in Table 8. The emissions data for burning biomass in forestland from 2018 to 2022 show significant fluctuations, with a peak at 5,227.17 GgCO₂e in 2020. This is followed by a decline to 4,755.77 GgCO₂e in 2021, and a drastic drop to 96.27 GgCO₂e in 2022. The increase from 2018 to 2020 suggests intensified forest fires, slash-and-burn practices, or increased biomass burning due to deforestation or land clearing [35]. However, the sharp reduction in 2022 indicates a major shift, potentially due to improved fire management strategies, stricter regulations, or favourable climatic conditions that reduced fire occurrences. Arguably, this could also typify the less anthropogenic activities subjected to forest (wood harvesting, forest fires for forest produce’s extraction) due to the lockdown that was imposed during the peak of the COVID 19 pandemic [36]. The extreme variability highlights the sensitivity of forest emissions to human activities and environmental factors, emphasizing the need for sustainable forest fire management, early warning systems, and policies that mitigate biomass extraction and burning to maintain forest carbon stocks and reduce emissions [37].
3.2.1.3 Harvested Wood Products
Malawi applies the stock-change approach for harvested wood products (HWP) in use. The net emissions from harvested wood products are presented in Figure 5. The emissions data for harvested wood products in forestland from 2018 to 2022 exhibit fluctuations, with emissions rising from 126.2 GgCO₂e in 2018 to 149.4 GgCO₂e in 2019, then decreasing to 90.2 GgCO₂e by 2022. This trend suggests variability in the amount of wood harvested, with higher emissions in years of increased logging or timber extraction, followed by a reduction as harvesting activity decreased or more sustainable practices were implemented [10]. The spike in 2019 could reflect an increase in timber demand or forest management practices that emphasized harvesting. Conversely, the subsequent decline may indicate a reduction in wood extraction, possibly due to changes in the market, improved forest management, or the adoption of policies promoting reforestation and sustainable timber harvesting [2]. The overall reduction in emissions by 2022 highlights the potential for forest management strategies to limit carbon release from harvested wood products, underlining the importance of promoting sustainable forestry practices to balance economic needs with environmental goals [38,39].
3.2.2. Cropland
3.2.2.1 Cropland remaining cropland
3.2.2.1.1 Category description
The cropland remaining cropland sub-category includes continuous cropping lands and lands that are cropped in rotation with pastures. Croplands are of high land value with a high return on production and moderate to high soil nutrient status and are therefore not generally converted to forest land or grassland but remain as cropland [10]. Anthropogenic emissions and removals on croplands occur because of changes in management practices from changes in crop type and from changes in land use. Permanent changes in management practices generate changes in the levels of soil carbon or woody biomass stocks over the longer term. Changes in carbon stock levels during the transition period to a new stock equilibrium are recorded under cropland [2].
3.2.2.1.2 Net emissions (GgCO2e) from cropland remaining cropland
Summary of net emissions from cropland remaining cropland are given in Figure 6. The emissions data for cropland remaining cropland from 2018 to 2022 show a very gradual decline from 2,999.91 GgCO₂e in 2018 to 2,994.96 GgCO₂e in 2022, indicating a minor annual reduction of approximately 1 GgCO₂e per year. This stability suggests that agricultural practices, soil carbon dynamics, and land-use management have remained largely unchanged over the years. The slight decrease in emissions could be attributed to marginal improvements in sustainable farming techniques, such as conservation agriculture, reduced tillage, or enhanced soil carbon sequestration [40]. However, the minimal reduction implies that more significant interventions such as large-scale adoption of agroforestry, cover cropping, or improved fertilizer management, are needed to achieve substantial emission reductions [10]. Continuous monitoring and investment in climate-smart agricultural practices could further enhance carbon sequestration and improve the sustainability of cropland management [41].
3.2.2.2 Land converted to cropland
3.2.2.2.1 Category description
Within the land converted to cropland sub-category, Malawi reports emissions for forestland converted to cropland, and wetlands converted to cropland subcategories. The wetland converted to cropland subcategory includes the conversion of wetlands to cropping, and irrigated cropping [2].
3.2.2.2.2 Annual area (ha) and Annual net emissions for land converted to cropland
The annual area in hectares for the land converted to cropland category is shown in Table 9. On the other hand, the annual net emissions for the land converted to cropland category are shown in Table 10. The emissions data for land converted to cropland from 2018 to 2022 show a steady decline from 181.63 GgCO₂e in 2018 to 148.61 GgCO₂e in 2022, reflecting an annual reduction of approximately 8 GgCO₂e. This declining trend suggests a decrease in land conversion to cropland, possibly due to reduced deforestation for agricultural expansion, improved land-use planning, or a shift towards more sustainable farming practices. The decrease may also indicate better soil management and conservation measures that help maintain or enhance soil carbon stocks [10]. However, while this reduction is positive in terms of emission control, it could also be linked to factors such as land degradation, reduced agricultural expansion, or shifts in economic priorities affecting land use [2]. Strengthening sustainable agricultural policies, promoting agroforestry, and enhancing soil carbon sequestration strategies could further reduce emissions while ensuring food security and productive land use [40].
3.2.2.2.3 Annual area burnt and net emissions for burning biomass in cropland
The annual area burnt and net emissions for burning biomass in cropland are presented in Table 11. The emissions data for burning biomass in cropland from 2018 to 2022 show a slight, but consistent increase from 1,768.80 GgCO₂e in 2018 to 1,778.67 GgCO₂e in 2022, with an average annual rise of approximately 2–3 GgCO₂e. This upswing trend suggests that agricultural biomass burning, such as the burning of crop residues, has remained a common practice. This could possibly be due to traditional land-clearing methods, limited access to alternative residue management techniques, or increasing agricultural activity [10]. The steady increase in emissions highlights the need for improved sustainable practices, such as residue incorporation, mulching, or bioenergy production, to reduce carbon release and enhance soil fertility [33]. Without interventions, continued biomass burning could contribute to long-term soil degradation and air pollution. Encouraging farmers to adopt climate-smart agriculture and promoting policies that regulate biomass burning could help curb emissions while maintaining agricultural productivity [41].
3.2.3 Grassland
3.2.3.1 Grassland remaining grassland
3.2.3.1.1 Category description
The grassland remaining grassland category encompasses all grassland areas not classified under land converted to grassland. Areas that undergo rotational use between grassland and cropland are recorded under either forestland converted to cropland or cropland remaining cropland [2]. Anthropogenic emissions and removals in grasslands result from shifts in management practices, particularly in pasture and grazing management, savanna fire management, and changes in sparse woody vegetation that do not qualify as forests. Grassland remaining grassland is categorized into three components corresponding to these practices. Long-term alterations in management can lead to changes in soil carbon levels or woody biomass stocks. As these changes occur, carbon may either be emitted or sequestered. However, these effects are temporary rather than permanent. Over time, the net emissions or removals from a modified management practice stabilise, reaching an equilibrium of approximately zero emissions, unless further changes disrupt the balance [10].
3.2.3.1.2. Net Emissions (GgCO2e) from Grassland Remaining Grassland
Summary of net emissions from grassland remaining grassland are provided in Figure 7. The emissions data for grassland remaining grassland from 2018 to 2022 show a gradual decline from 814.15 GgCO₂e in 2018 to 777.78 GgCO₂e in 2022, with an average annual reduction of approximately 9 GgCO₂e. This decreasing trend suggests improved management of grasslands, potentially through better grazing practices, fire management, or natural regeneration that enhances carbon sequestration [37]. The reduction in emissions could also indicate a shift towards more sustainable land-use strategies, such as rotational grazing or reduced biomass burning [34]. However, the decline may also be influenced by changes in land cover, such as grassland degradation or conversion to other land uses, which could have long-term ecological consequences. To sustain and further reduce emissions, it is essential to strengthen grassland conservation efforts, promote ecosystem restoration, and implement policies that encourage carbon-friendly land management practices [10].
3.2.3.2. Land Converted to Grassland
3.2.3.2.1. Category Description
In the land converted to grassland subcategory, Malawi reports emissions from forestland converted to grassland and wetlands converted to grassland. Net emissions resulting from conversions between croplands and grasslands are accounted for under croplands remaining croplands, as pasture and grazing rotations are commonly integrated into cropping systems [2].
3.2.3.2.2. Annual Area (ha) and Net Emissions for Land Converted to Grassland
The annual area in hectares and net emissions for the land converted to grassland category are shown in Table 12. The emissions data for land converted to grassland from 2018 to 2022 show a steady decline from 51.77 GgCO₂e in 2018 to 42.36 GgCO₂e in 2022, reflecting an annual reduction of approximately 2–3 GgCO₂e. This drop off trend suggests a decrease in land conversion to grassland, which may be due to reduced deforestation, shifts in land-use policies, or improved land management practices that enhance soil carbon sequestration [10]. The declining emissions could also indicate a transition toward more stable ecosystems with lower carbon release from soil disturbance [2]. However, this trend may also reflect a reduction in available land for grassland expansion, potentially due to competing land uses such as agriculture or urbanisation. To maximize the climate benefits of grasslands, further efforts in sustainable grazing, fire control, and soil restoration should be encouraged to enhance carbon storage and mitigate emissions [37].
3.2.3.2.3. Annual Area Burnt and Net Emissions for Burning Biomass in Grassland
The annual area burnt and net emissions for burning biomass in grassland are presented in Table 13. The emissions data for biomass burning in grassland from 2018 to 2022 show a significant and consistent decline from 747.48 GgCO₂e in 2018 to 182.75 GgCO₂e in 2022. This sharp reduction suggests a decrease in the frequency or intensity of grassland fires, likely due to improved fire management practices, reduced human-induced burning, or changes in climate conditions affecting fire occurrence. The decline may also be attributed to shifts in land-use practices, such as better grazing management or policies discouraging uncontrolled burning [10]. While the reduction in emissions is a positive indicator for climate mitigation, it is important to assess whether it has any unintended ecological consequences, such as excessive fuel buildup that could lead to more intense wildfires in the future [2]. Strengthening controlled burning strategies, promoting sustainable grazing, and enhancing natural firebreaks could help maintain the ecological balance while minimizing carbon emissions [42].
3.2.4. Wetland
3.2.4.1. Wetland Remaining Wetland
3.2.4.1.1. Category Description
The estimates in this category are guided by the Environment Management Act No. 19 of 2017 and the 2019 Refinement to the 2006 IPCC Guidelines [11]. In this category, the Malawi inventory includes estimates for biomass burning on tropical savannas that are categorised as wetlands [2].
3.2.4.1.2. Net Carbon Dioxide Emissions (GgCO2e) from Wetland Remaining Wetland
Summary of net emissions from wetland remaining wetland are given in Figure 8. The emissions data for wetland remaining wetland from 2018 to 2022 show a gradual increase in emissions, rising from 3,763.59 GgCO₂e in 2018 to 3,814.20 GgCO₂e in 2022. This steady upward trend suggests that the wetlands are releasing more carbon over time, potentially due to factors such as increasing degradation, changes in water levels, or disturbances from land-use practices like drainage or agriculture. Wetlands are significant carbon sinks, but when disturbed, they can become net carbon emitters due to the release of stored carbon from organic soils [2]. The consistent rise in emissions could reflect increased human activity in these areas, such as land conversion, or natural factors like climate change affecting water regimes [10]. To mitigate this, effective wetland conservation strategies, including improved water management and restoration projects, are crucial to preserving their carbon sequestration capacity and reducing future emissions [38].
3.2.4.2. Land Converted to Wetland
3.2.4.2.1. Category Description
This category includes the subcategory forest land converted to wetlands (flooded land). Forest conversion occurs when forests are cleared for the construction of reservoirs or other areas classified as flooded lands under the forest land converted to wetlands subcategory in the IPCC 2006 Guidelines [11]. Emissions are reported for land clearing activities associated with flooding [2].
3.2.4.2.2. Annual Area (ha) And Net Emissions for Land Converted to Wetland
The annual area in hectares and net emissions for the land converted to wetland category are shown in Table 14. The emissions data for land converted to wetland from 2018 to 2022 show a steady increase, rising from 522.31 GgCO₂e in 2018 to 551.86 GgCO₂e in 2022. This consistent upward trend suggests that land conversions into wetlands, possibly driven by human activities such as drainage or reclamation for agricultural or developmental purposes, are leading to higher carbon emissions. Wetland conversions can release significant amounts of stored carbon from organic soils, as draining or disturbing these areas exposes previously sequestered carbon to oxidation, contributing to greenhouse gas emissions [10]. The gradual increase in emissions highlights the need for better land-use planning and stronger regulations to prevent the degradation of wetlands. Additionally, promoting the restoration and preservation of wetlands can mitigate emissions, as healthy wetlands function as critical carbon sinks, contributing to climate change mitigation [2].
3.2.5. Settlement
3.2.5.1. Settlement Remaining Settlement
3.2.5.1.1. Category Description
The settlements remaining settlements subcategory encompasses urban areas and infrastructure that have not undergone land use conversion. To prevent double counting, it excludes woody vegetation classified as forest land [11]. This subcategory accounts only for net emissions from changes in sparse woody vegetation, such as those resulting from modifications in urban parks and gardens [2].
3.2.5.1.2. Area and Net Emissions of Sparse Woody Vegetation, Settlements Remaining Settlements
The key input data and estimated net emissions for settlement remaining settlements are presented in Table 15. The emissions data for settlement remaining settlement from 2018 to 2022 show minimal fluctuations, with emissions ranging from 19.47 GgCO₂e to 20.15 GgCO₂e over the five-year period. The slight variation in emissions indicates a stable level of emissions from settled areas, with relatively consistent land use and low changes in land cover. Settlements, being largely urbanized, tend to have stable emissions because the land-use patterns in these areas do not change significantly, and the main emission sources are typically from energy consumption, waste management, and transportation rather than land conversion [10]. The small increase in 2022 could reflect urban expansion or increased emissions from infrastructure development or changes in waste management practices [2]. This stability highlights the need for continued efforts in promoting sustainable urban planning, energy efficiency, and low-carbon technologies to keep emissions in settlement areas under control while supporting urban growth [42].
3.2.5.2. Land Converted to Settlement
3.2.5.2.1. Category Description
The land converted to settlements category comprises areas where forestland has been cleared and transformed into settlements, reflecting land-use change driven by urbanization and infrastructure development [11].
3.2.5.2.2. Annual Area (ha) for Land Converted to Settlement and Annual Net Emissions for Land Converted to Settlement
The annual area in hectares for the land converted to wetland category and annual net emissions for land converted to settlement are given in Table 16. The emissions data for land converted to settlement from 2018 to 2022 show a consistent decline, decreasing from 39.55 GgCO₂e in 2018 to 38.27 GgCO₂e in 2022. This gradual decrease suggests a reduction in the amount of land being converted into settlements or potentially more sustainable urban development practices being implemented. Lower emissions could reflect urban planning initiatives that focus on reducing land use change, improving building designs, and using energy-efficient technologies, which mitigate emissions typically associated with land conversion, such as those from vegetation clearing or soil disturbance [10]. The reduction might also indicate a shift towards higher-density developments rather than extensive sprawl [29]. However, the decreasing trend in emissions is modest, so it is important to continue promoting sustainable land-use policies and smart growth strategies to minimize the environmental impact of urban expansion while accommodating population growth [40].
3.3. Uncertainty Assessment
The results on uncertainty assessment for the reporting period are presented in Table 17. The uncertainty results, at 95% confidence level, for GHG emissions indicate varying levels of assurance in the estimates across different land categories. Cropland (0.20%) and wetland (0.64%) have the lowest uncertainties, suggesting that data availability, emission factors, and estimation methodologies for these categories are relatively robust and well-documented [2]. Similarly, settlements (0.69%) show a low level of uncertainty, likely due to stable land-use patterns and well-defined emission sources [11]. In contrast, grassland (6.05%) exhibits the highest uncertainty, reflecting challenges in measuring emissions from fire management (biomass burning), which are influenced by management variations [35]. However, the uncertainty value for grassland is within the allowable value (9.0%) as indicated in 2006 IPCC guidelines. Forestland (4.92%) has moderate uncertainty, which may be attributed to variability in deforestation rates, carbon stock estimates, and biomass loss calculations [2]. The overall uncertainty (4.16%) represents a balanced measure of all land categories, indicating a reasonably reliable national GHG inventory. This suggests that while some land categories have reliable estimates, land-use monitoring, especially for biomass burning in grassland is needed to enhance accuracy [35].
The implication of this study is that it provides robust, policy-relevant evidence on Malawi’s LULUCF carbon dynamics by combining IPCC-compliant methods, Earth observation data, and low-uncertainty estimates. The demonstrated decline in emissions and increase in removals strengthen Malawi’s credibility in national GHG reporting and enhance transparency under the UNFCCC and Paris Agreement. The low uncertainty level (4.16%) significantly reduces investment risk, improving the country’s readiness to access voluntary and compliance carbon markets [38]. By identifying key emission sources and high-potential carbon sinks, the findings support targeted land-use planning, forest restoration, and afforestation strategies. Overall, the study underpins evidence-based climate policy, supports REDD+ and carbon credit development, and positions Malawi to attract climate finance while contributing to global mitigation efforts [2]. Finally, the study also contributes to Malawi’s first biennial transparency report (BTR1) and fourth national communication (NC4) to the United Nations framework convention on climate change under the Paris agreement [9].
Despite its strengths, the study is limited by reliance on medium-resolution satellite imagery, which may not fully capture small-scale land-use changes and degradation processes. The 2018–2022 timeframe also restricts assessment of long-term trends and climate variability effects. Future studies should incorporate higher-resolution data (e.g., LiDAR), extend temporal coverage (preferably 1990-2025), and assess socio-economic drivers and policy impacts on LULUCF carbon dynamics.
4. Conclusion
The study has demonstrated that Malawi’s LULUCF sector has transitioned toward lower emissions and enhanced carbon removals between 2018 and 2022, driven by reduced deforestation and increased forest regeneration. By applying IPCC-compliant methods and integrating forest inventory data with satellite observations, the study generated reliable, low-uncertainty estimates of carbon sources, sinks, and removals. Forestland remains the dominant contributor to emissions, highlighting the continued importance of sustainable forest management and land-use planning. Overall, the findings strengthen Malawi’s national GHG reporting, support REDD+ implementation, and provide a robust scientific foundation for developing credible carbon market projects and attracting climate finance. Finally, the study also contributes to Malawi’s first biennial transparency report (BTR1) and fourth national communication (NC4) to the United Nations framework convention on climate change under the Paris agreement.
Data Availability
The data that supports the findings of this study can be obtained from the corresponding author upon reasonable request.
Acknowledgments
The authors are thankful to the Department of Environment Affairs (EAD) for financial and administrative support. Dr. Kenneth Gondwe from Malawi University of Business and Applied Sciences (MUBAS) for technical support. Finally, Dr. Maggie Munthali, and Mr. Mike Chirwa for their review contribution to Malawi’s first biennial transparency report (BTR1) and fourth national communication (NC4) to the United Nations framework convention on climate change under the Paris agreement.
Conflicts of Interest
The authors declare no conflicts of interest.
References
- Berhanu, Y., Dalle, G., Sintayehu, D. W., Kelboro, G., and Nigussie, A. Land use/land cover change-induced greenhouse gas emissions in the global biosphere reserve of tropical Afromontane Forest. Scientific African, 2023, 21. [CrossRef]
- Missanjo, E. and Kadzuwa, H. Activity Data and Emission Factor for Forestry and Other Land Use Change Subsector to Enhance Carbon Market Policy and Action in Malawi. Journal of Environmental Protection, 2024, 15, 401-414. [CrossRef]
- Adzawla, W., Sawaneh, M., and Yusuf, A.M. Greenhouse gasses emission and economic growth nexus of sub-Saharan Africa. Scientific African, 2019, 3, 65. [CrossRef]
- Ismail, M.S., Sulistijorini, S., Muttaqin, M., Al Anshori, Z., Rizaldi, M.R., Wijedasa, L., Moore, J., Agusti, R., Swarup, S., and Triadiati, T. Elemental Stoichiometry of Tropical Peatland Trees: Implications for Adaptation and Carbon Sequestration. Forests, 2025, 16(9). [CrossRef]
- Masere, T.P., Nyahwai, R., and Zhou, N.M. Estimation of Long-Term Above-Ground Biomass, Carbon Stocks and Carbon Dioxide Equivalent Lost Due to Deforestation in Mapfungautsi Forest, Zimbabwe. International Journal of Forest, 2023, 7(3), 2456–8791. [CrossRef]
- Domke, G.M., Walters, B.F., Giebink, C.L., Greenfield, E.J., Smith, J.E., Nichols, M.C., Knott, J.A., Ogle, S.M., Coulston, J.W., and Steller, J. Greenhouse gas emissions and removals from forest land, woodlands, urban trees, and harvested wood products in the United States, 1990-2021, 2023. [CrossRef]
- UNFCCC. UNFCCC BTR Review Training: Course C Tracking Progress in Implementing and Achieving NDCS Sub Course C4: Projections of Greenhouse Gas Emissions and Removals. United Nations Framework Convention on Climate Change, 2023.
- Ministry of Natural Resources and Climate Change. Carbon Market Framework. Lilongwe, Malawi. 2025.
- Government of Malawi. Malawi’s Fourth National Communication/ First Biennial Transparency Report to the United Nations Framework Convention on Climate Change. Lilongwe, Malawi, 2025.
- Missanjo, E. and Kadzuwa, H. Greenhouse Gas Emissions and Mitigation Measures within the Forestry and Other Land Use Subsector in Malawi. International Journal of Forestry Research, 2021, Article ID: 5561162.
- IPCC. 2019 Refinement to the 2006 IPCC Guidelines for National Greenhouse Gas Inventories. Kanagawa, Japan, the National Greenhouse Gas Inventories Programme, the Intergovernmental Panel on Climate Change, Hayama. 2019.
- Ministry of Forestry and Natural Resources. Malawi’s First Biennial Update Report to the Conference of Parties (CoP) of the United Nations Framework Convention on Climate Change (UNFCCC). Lilongwe, Malawi, 2021.
- Nieman, W.A., Wilgen, B.W. and Leslie, A.J. A Reconstruction of the Recent Fire Regimes of Majete Wildlife Reserve, Malawi, Using Remote Sensing. Fire Ecology, 2021, 17, Article No. 4. [CrossRef]
- Kachamba, D.J., Eid, T. and Gobakken, T. Above- and Belowground Biomass Models for Trees in Miombo Woodlands of Malawi. Forests, 2016, 7, Article No. 38. [CrossRef]
- Hirata, Y., Takao, G., Sato, T. and Toriyama, J. REDD-Plus Cookbook. REDD Research and Development Center, Forestry and Forest Products Research Institute, Tsukuba. 2012.
- Pan, Y., Birdsey, R.A., Fang, J., Houghton, R., Kauppi, P.E., Kurz, W.A., Hayes, D., et al. A Large and Persistent Carbon Sink in the World’s Forests. Science, 2011, 333, 988-993. [CrossRef]
- Missanjo, E., and Kamanga-Thole, G. Estimation of Biomass and Carbon stock for Miombo Woodland in Dzalanyama Forest Reserve, Malawi. Research Journal of Agriculture and Forestry Sciences, 2015, 3(3), 7–12. https://www.isca.me/AGRI_FORESTRY/Archive/v3/i3/2.ISCA-RJAFS-2014-074.php.
- FAO. Enhanced Transparency Framework (ETF) on Climate Change. IPCC Inventory Software v2.98. 2025.
- Rueva, Y., Strasser, T., and Klug, H. Comparison of Sentinel-2 Multitemporal Approaches for Tree Species Mapping Within Natura 2000 Riparian Forest. Remote Sensing, 2025, 17(18). [CrossRef]
- GoM. Malawi’s Updated Nationally Determined Contribution. Lilongwe, Malawi. 2021.
- GoM. The Third National Communication of the Republic of Malawi to the Conference of the Parties (COP) of the United Nations Framework Convention on Climate Change (UNFCCC). Lilongwe, Malawi. 2021.
- Houghton, R. A., and Castanho, A.D.A. Annual emissions of carbon from land use, land-use change, and forestry from 1850 to 2020. Earth System Science Data, 2023, 15, 2025–2054. [CrossRef]
- Bellassen, V and Leguet, B. The emergence of voluntary carbon offsetting. [Technical Report] 11, auto-saisine. 2007, 36 p. ffhal-01190163f.
- Berry, T. Crossley, D. and Jewell, J. Check Out Carbon: The Role of Carbon Labeling in Delivering a Low Carbon Shopping Basket, Forum for the Future. London, UK. 2008.
- Skole, D.L.; Samek, J.H.; Dieng, M.; Mbow, C. The Contribution of Trees Outside of Forests to Landscape Carbon and Climate Change Mitigation in West Africa. Forests, 2021, 12, 1652. [CrossRef]
- Wear, D.N and Wibbenmeyer, M. Land-use change, no-net-loss policies, and effects on carbon dioxide removals. Carbon Balance and Management, 2024, 19, 40. [CrossRef]
- Uwamahoro, S., Kayiranga, A., Ochege, F.U., Muhirwa, F., and Bao, J. Expanding Forest carbon sinks to mitigate climate change in Africa. Renewable and Sustainable Energy Reviews, 2025, 207, 114849. [CrossRef]
- Gondwe, M.F.K., Geldenhuys, C.J., Chirwa, P.W.C., Assédé, E.S.P., Syampungani, S., and Cho, M.A. Tree Species Composition and Diversity in Miombo Woodlands between Co-Managed and Government-Managed Regimes, Malawi. African Journal of Ecology, 2021, 59, 225-240. [CrossRef]
- Mostefaoui, M., Ciais, P., McGrath, M.J., Peylin, P., Patra, P.K, and Ernst, Y,. Greenhouse gas emissions and their trends over the last 3 decades across Africa. Earth System Science Data, 2024,16, 245–275. [CrossRef]
- Grassi, G., Conchedda, G., Federici, S., Viñas, R.A., Korosuo, A., Melo, J., Rossi, S., Sandker, M., Somogyi, Z., Vizzarri, M., and Tubiello, F.N. Carbon fluxes from land 2000–2020: bringing clarity to countries’ reporting. Earth System Science Data, 2022, 14, 4643–4666. [CrossRef]
- UNFCCC. Malawi’s Second National REDD+ Forest Reference Level Report. United Nations REDD+ Programme Submission. Lilongwe, Malawi. 2024.
- Climate Analytics. LULUCF sector pathways and emissions projections. 1p5ndc-pathways. 2025.
- Carbon Pulse. Transparency gaps in carbon removal, forestry raise doubts over 2050 net zero targets — report. (2025). Carbon Pulse, 2025.
- Qian, Z., Bathiany, S., Liu, T., et al. Decadal sink-source shifts of forest aboveground carbon since 1988. arXiv. 2025. https://arxiv.org/pdf/2506.11879.
- Zhang, L.; Zhang, Z. Wildfires and Climate Change as Key Drivers of Forest Carbon Flux Variations in Africa over the Past Two Decades. Fire, 2025, 8, 333. [CrossRef]
- Bowa, E. Makungwa, B. and Missanjo, E. The Lustrum Performance on Government Revenue Collection for Eastern Zone Forestry Stations in Malawi (2019-2023). Journal of Economics and Trade, 2024, 9(1), 32 – 49.
- Biah, I., Azihou, A.F., Guendehou, S., and Sinsin, B. Land use/land cover change and carbon footprint in tropical ecosystems in Benin, West Africa. Trees, Forests and People, 2024, 15, 100488. [CrossRef]
- Carbon Pulse. Malawi finalises carbon trading regulatory framework, registers 11 projects. Carbon Pulse. 2024. https://carbon-pulse.com/289763/?
- World Bank. Malawi Country Climate and Development Report. The World Bank Group, Washington. 2022.
- Ke, P., Ciais, P., Sitch, S., et al. Low latency carbon budget analysis reveals a large decline of the land carbon sink in 2023. arXiv. 2024. https://arxiv.org/pdf/2407.12447.
- UNFCCC. Reporting and accounting of LULUCF activities under the Kyoto Protocol. United Nations Framework Convention on Climate Change. 2025.
- UNFCCC. Land Use, Land-Use Change and Forestry (LULUCF). UNFCCC – Land Use Workstream. 2025. https://unfccc.int/topics/land-use/workstreams/land-use--land-use-change-and-forestry-lulucf?
Figure 1.
Location of Malawi. Source [2]
Figure 1.
Location of Malawi. Source [2]
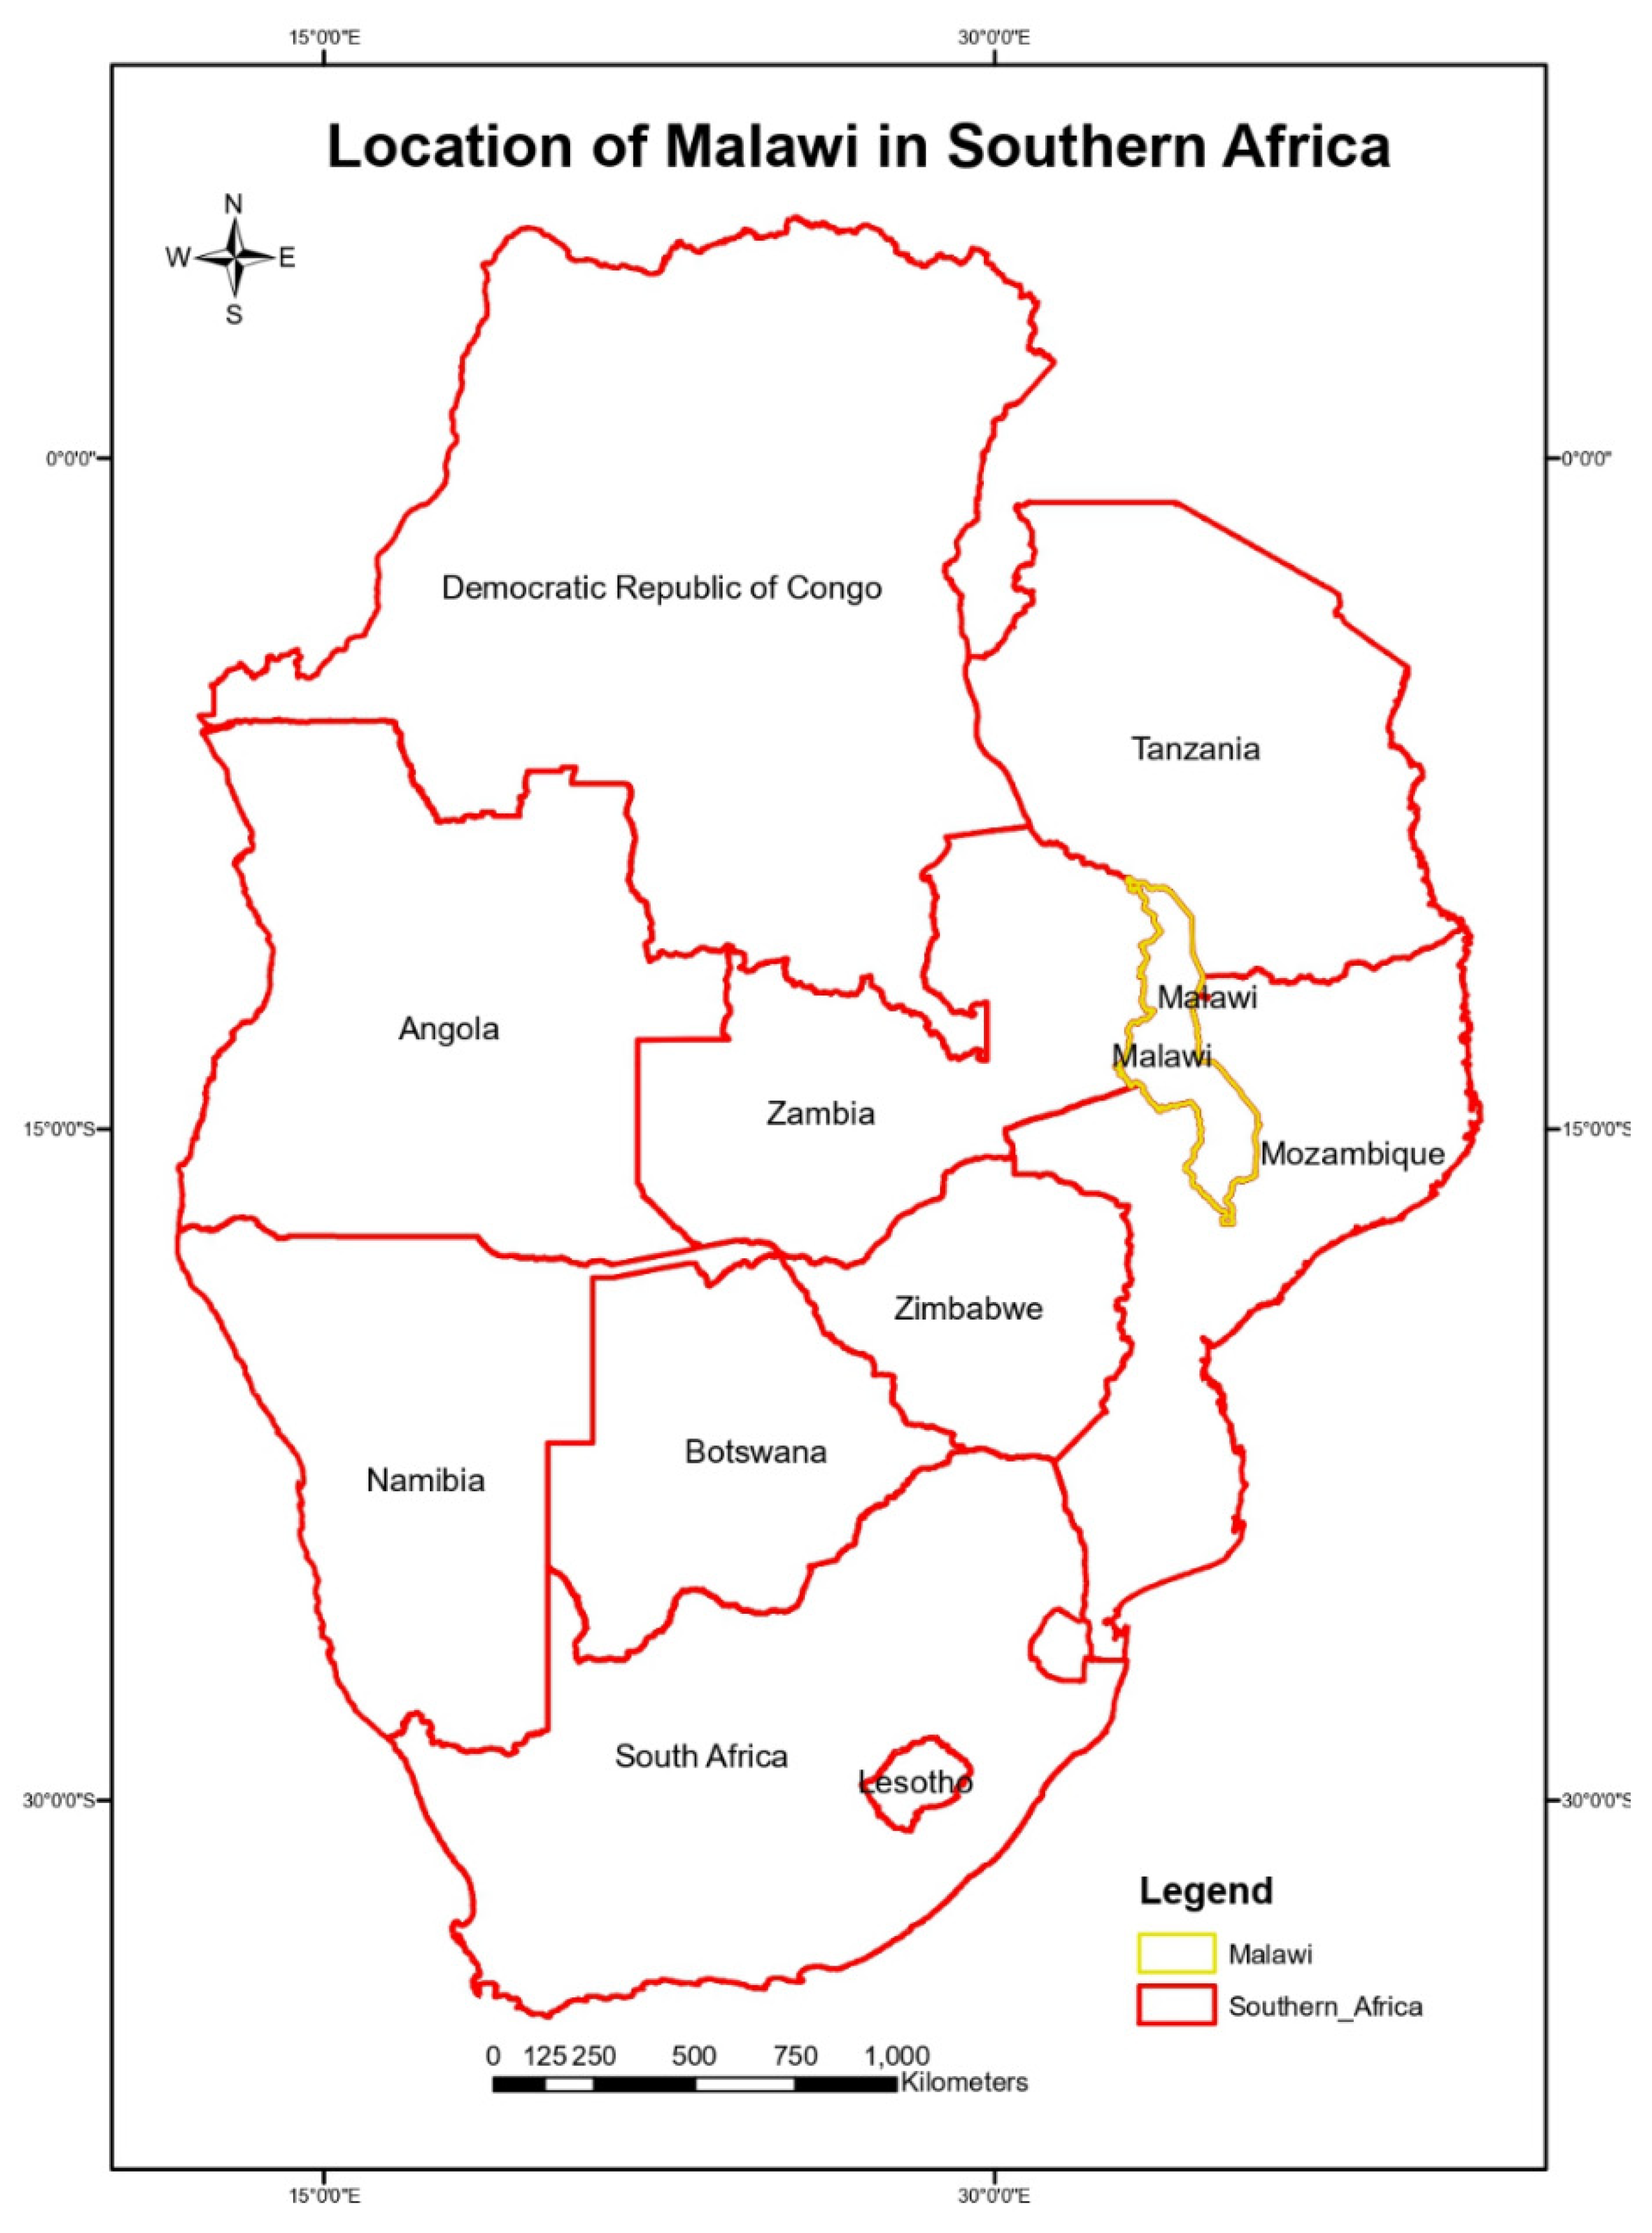
Figure 2.
Emission Trends in LULUCF Sector from 2018 to 2022.
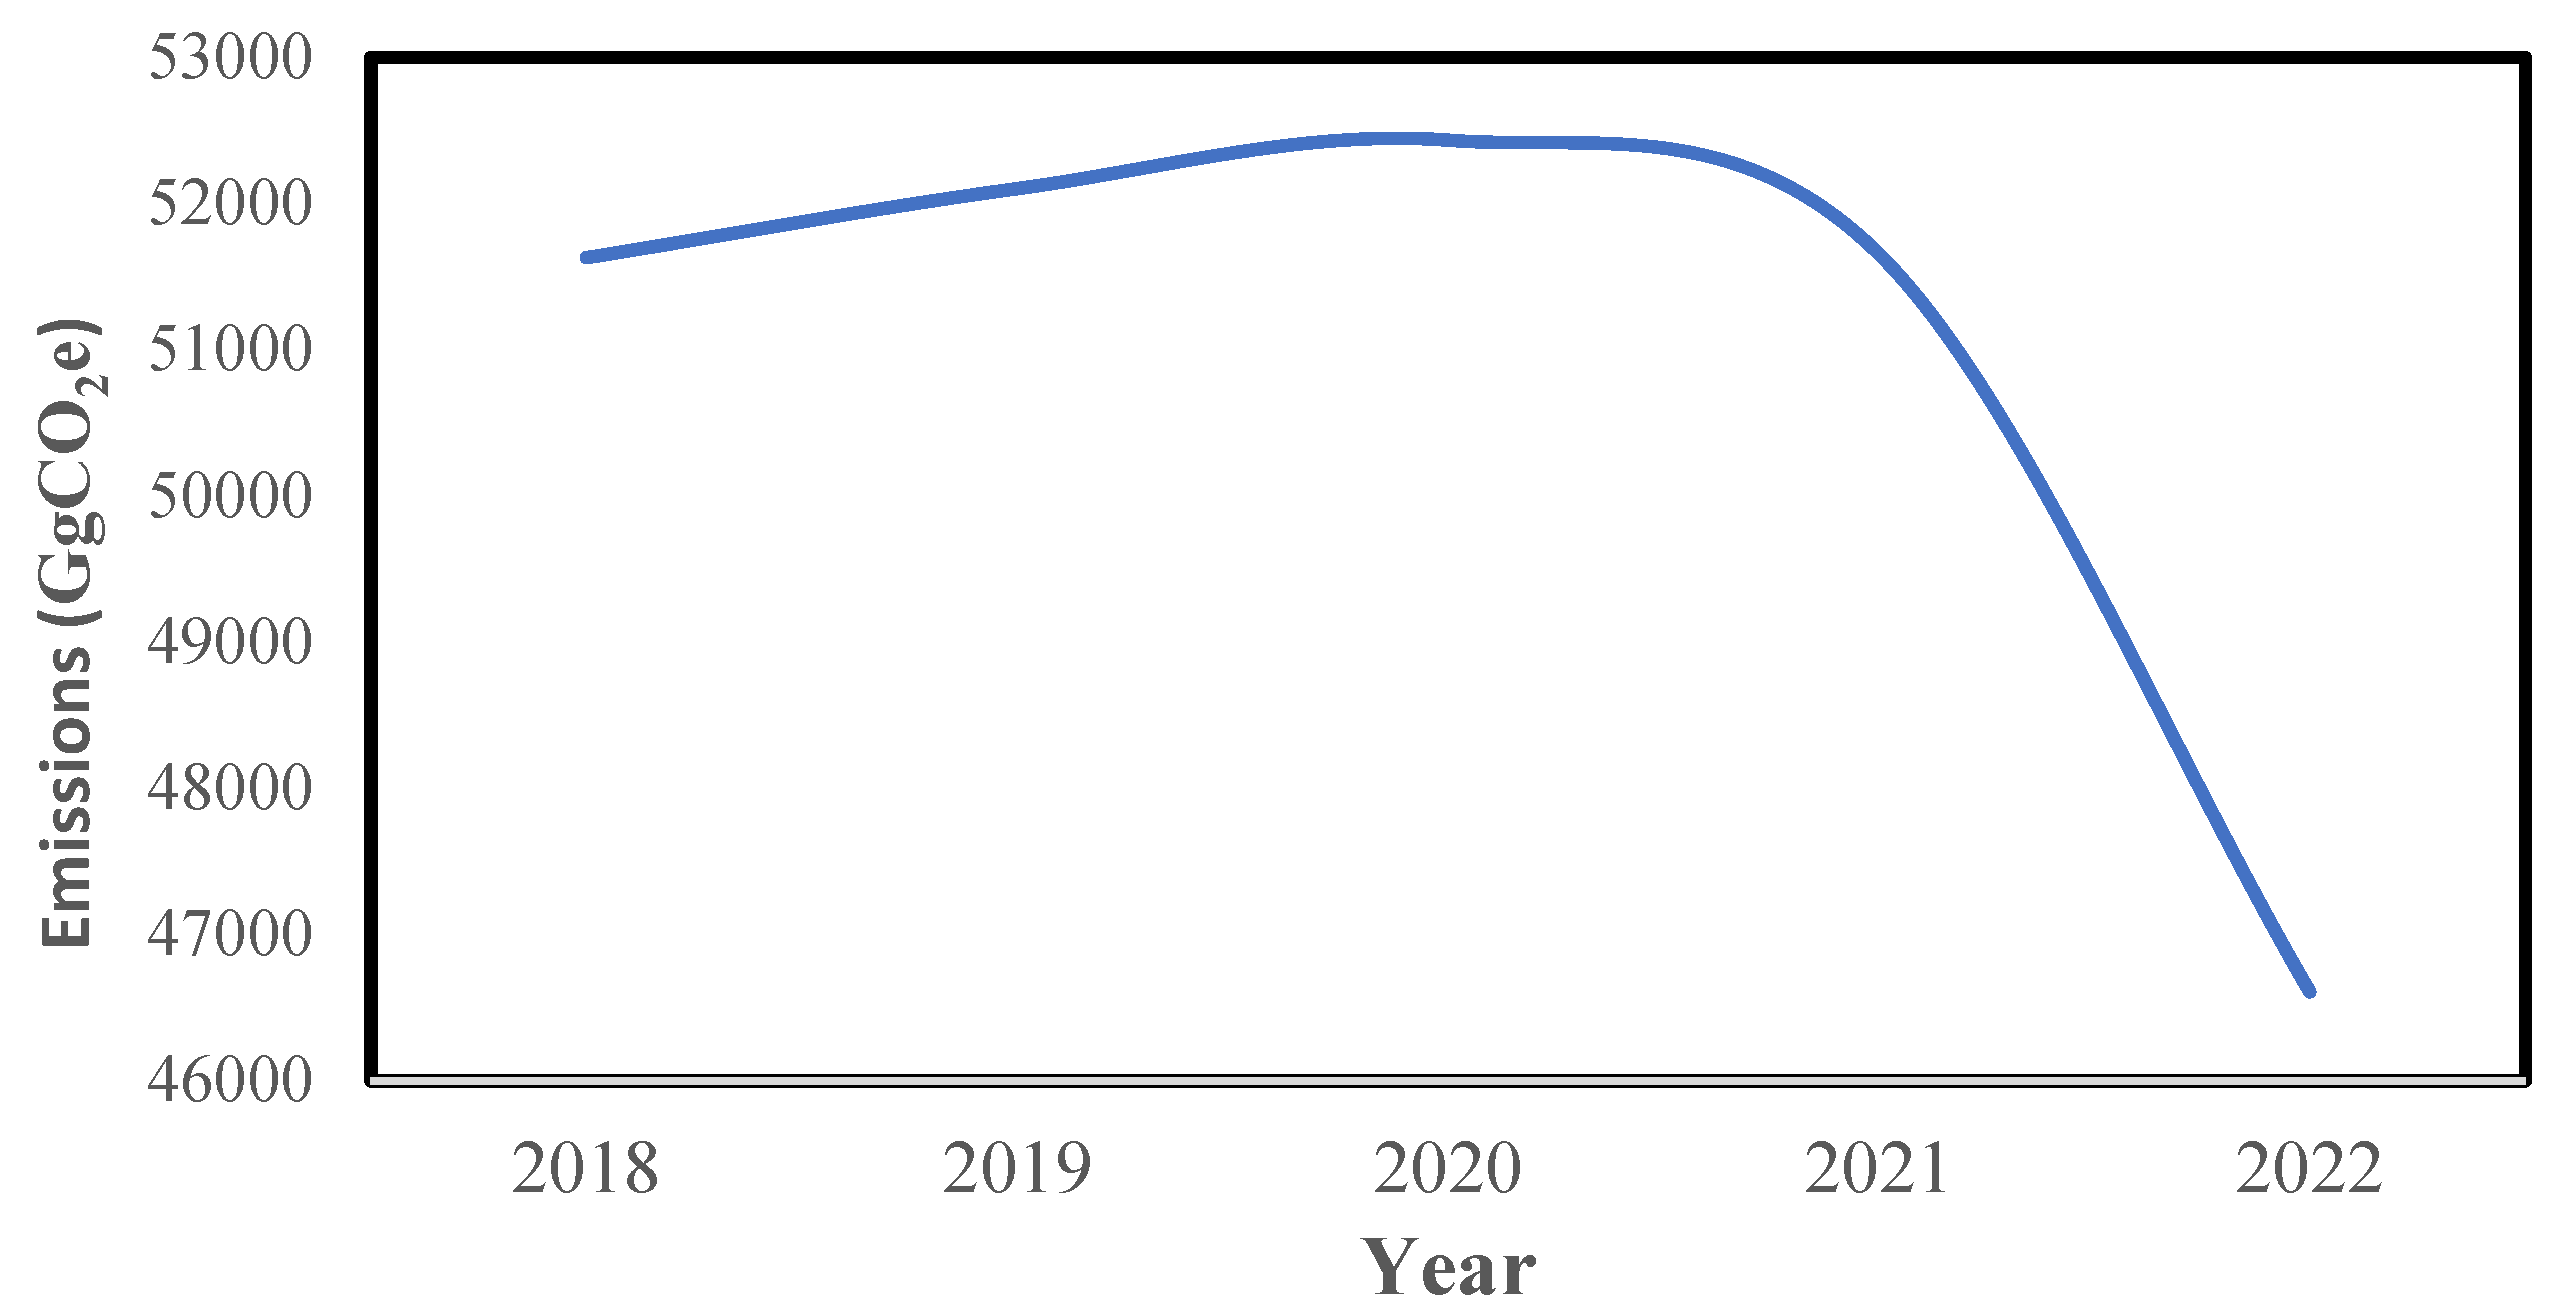
Figure 3.
LULUCF Sector Emissions by Category from 2018 to 2022.
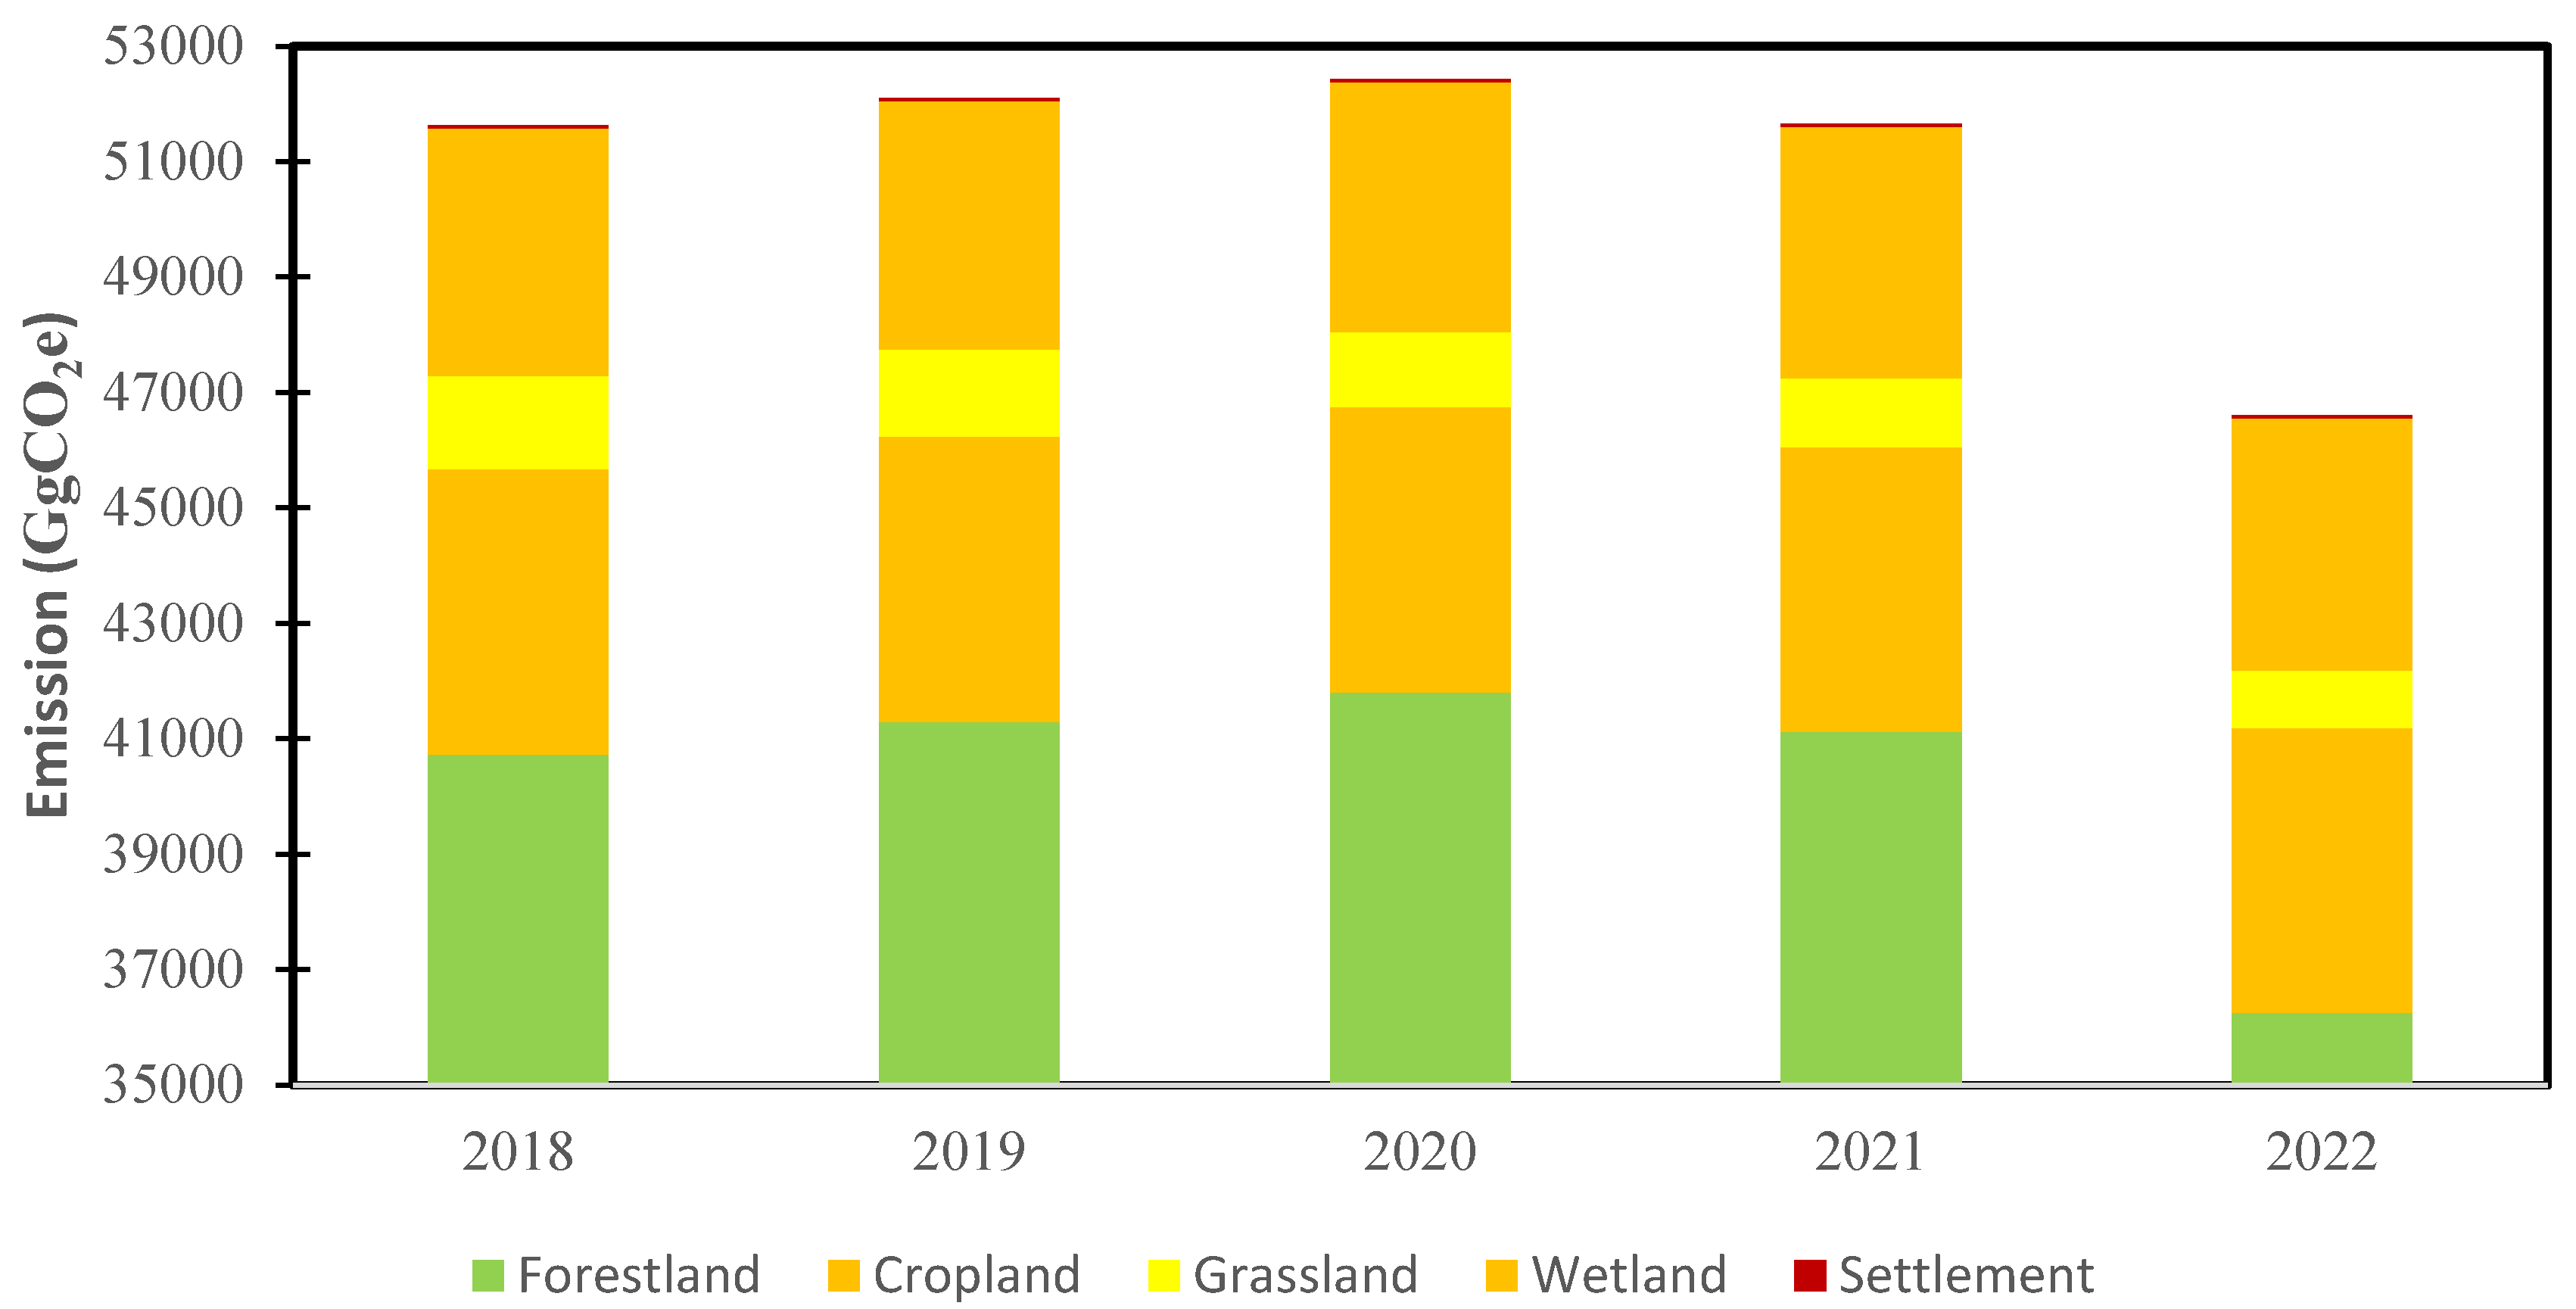
Figure 4.
Total Contribution of Emissions by Different Categories in LULUCF Sector, 2018 to 2022.
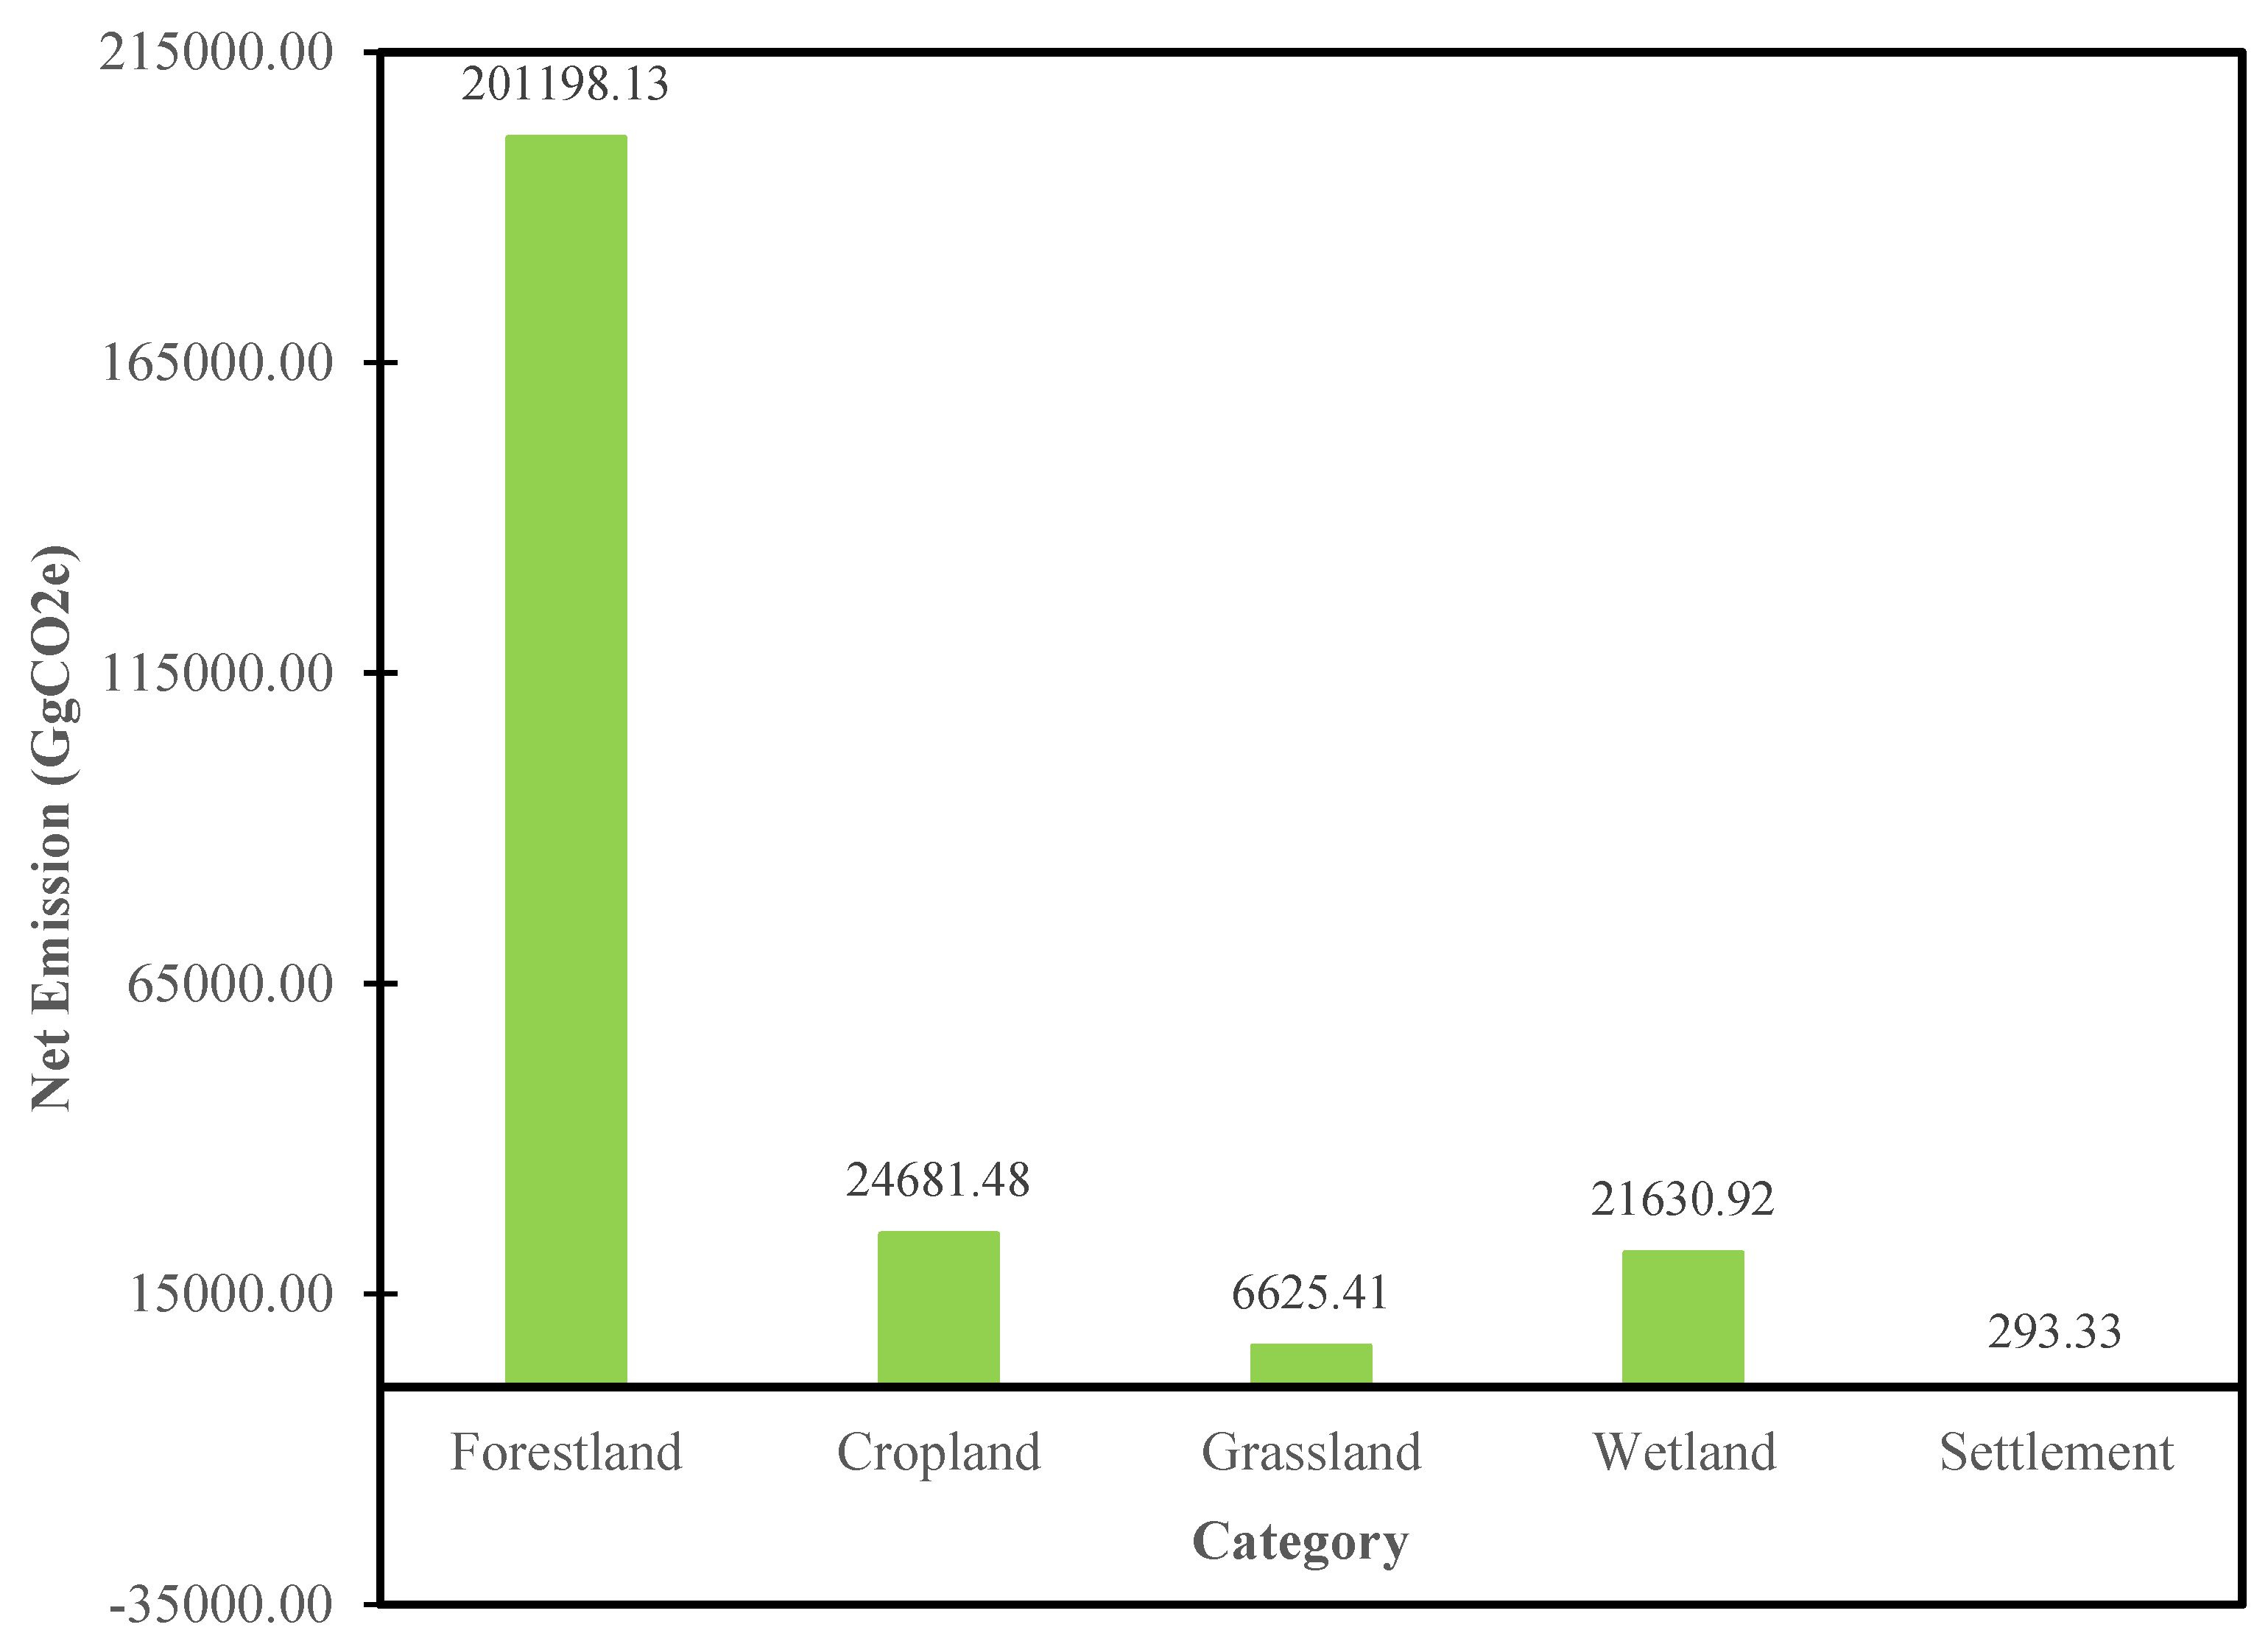
Figure 5.
Net emissions from harvested wood products.
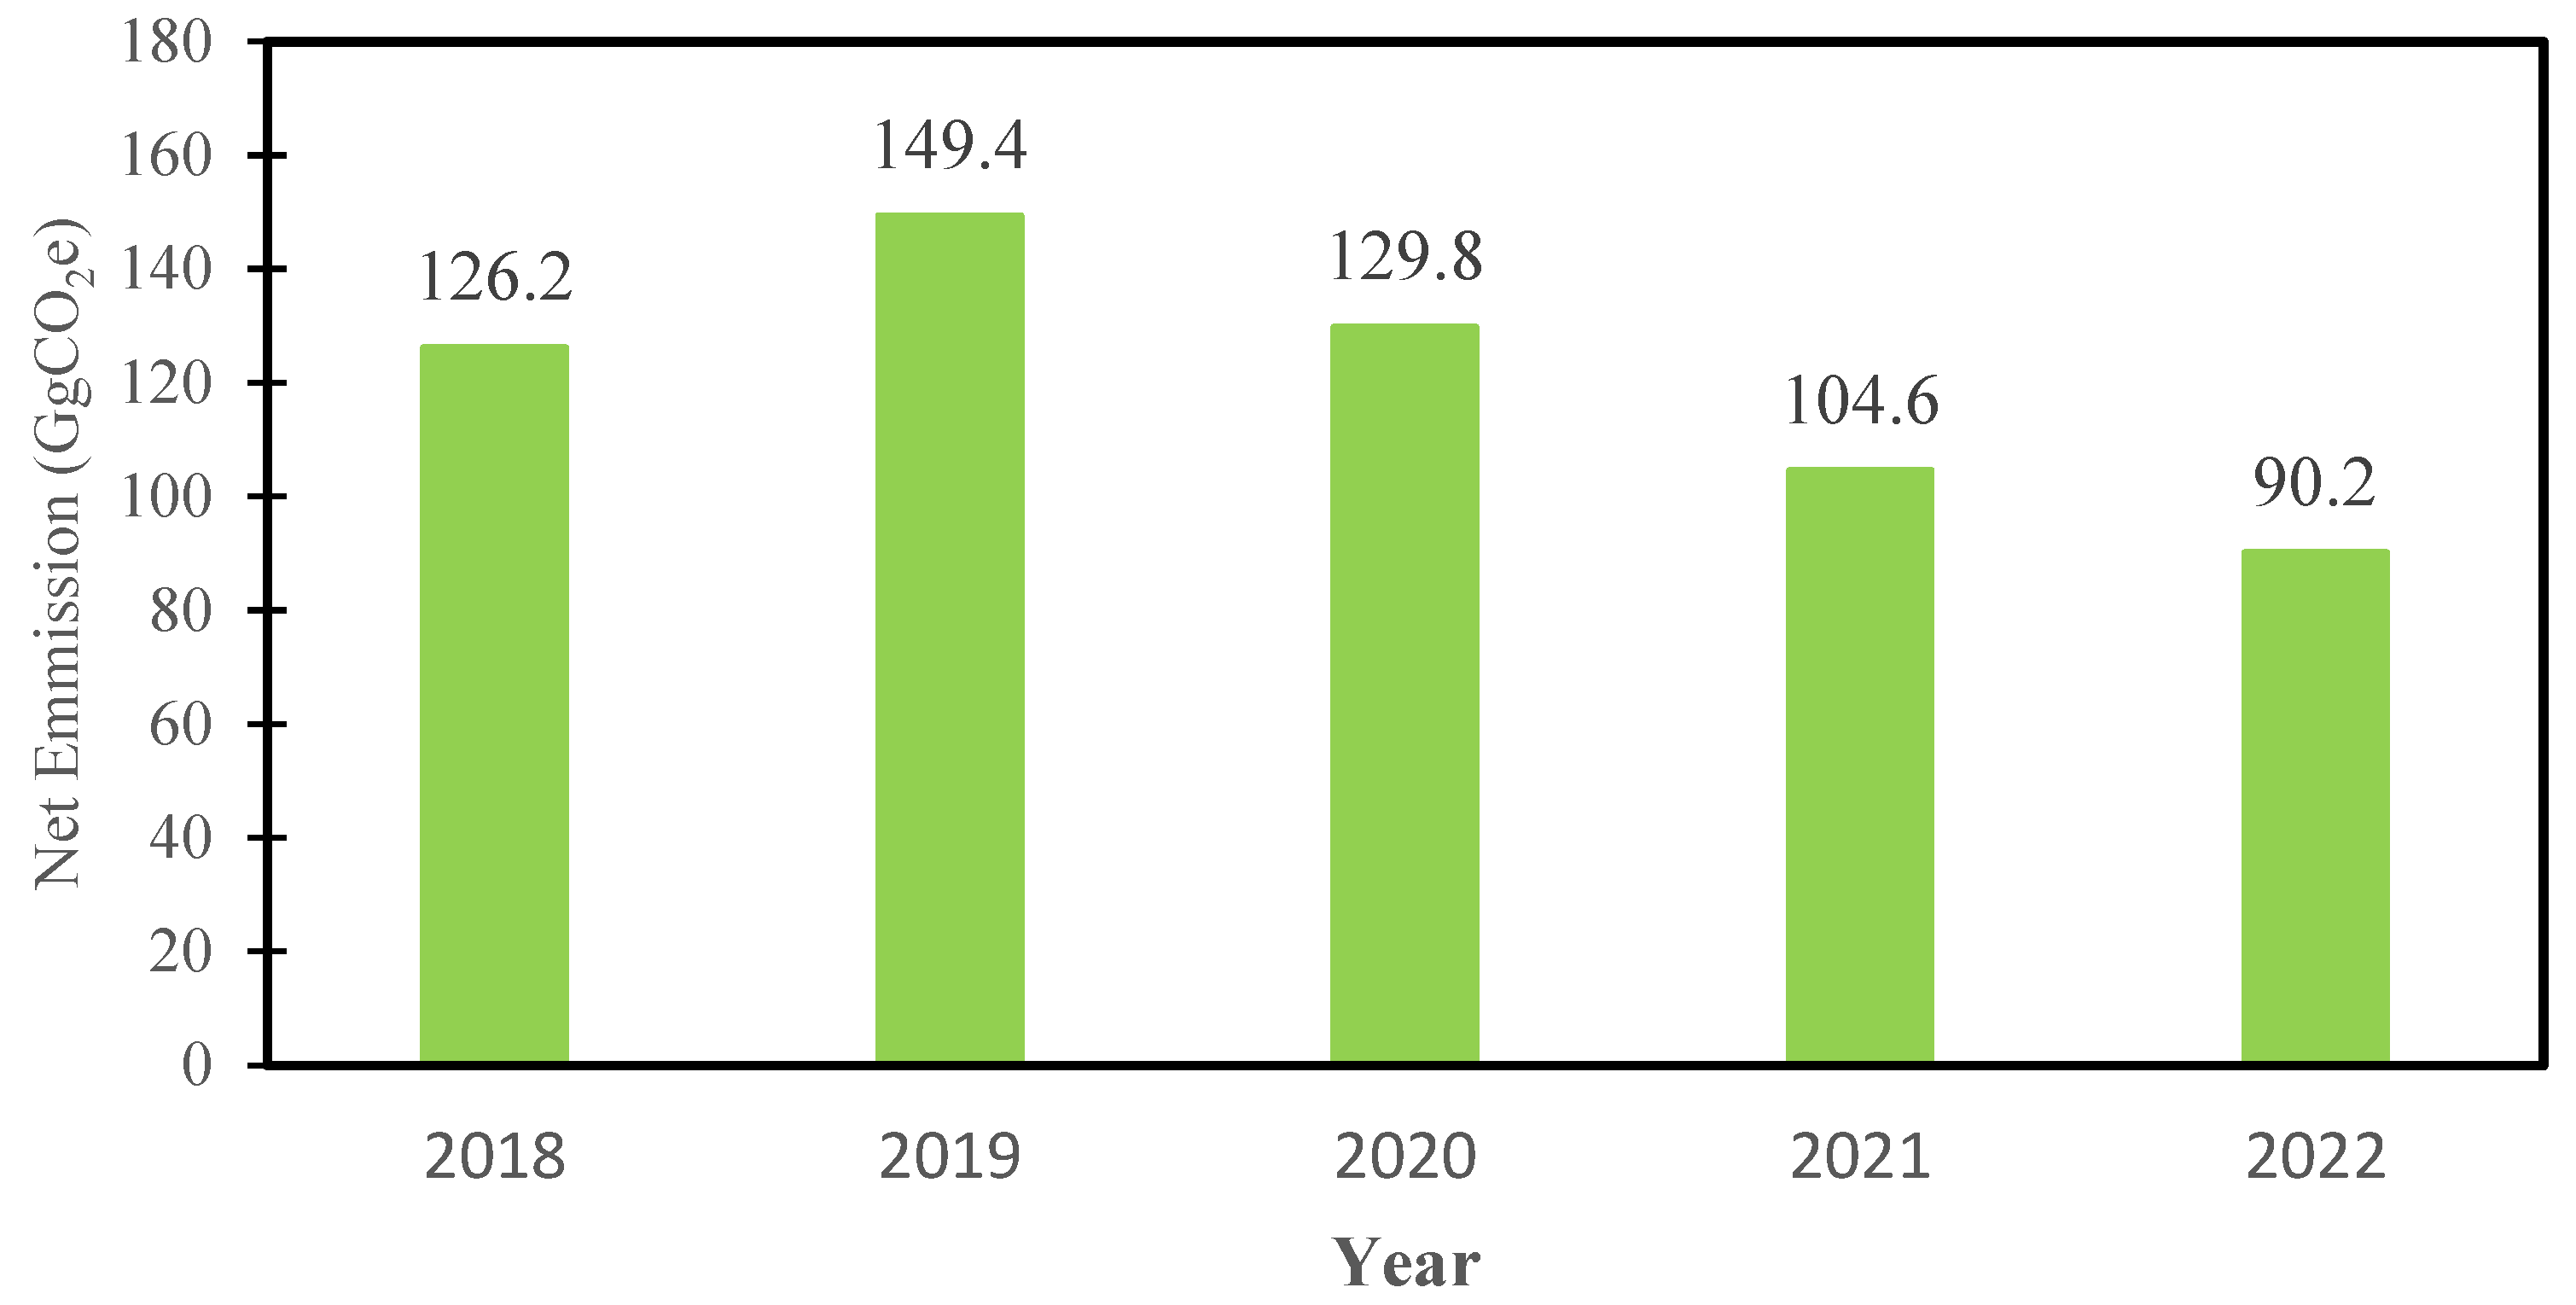
Figure 6.
Net emissions from Cropland remaining Cropland.
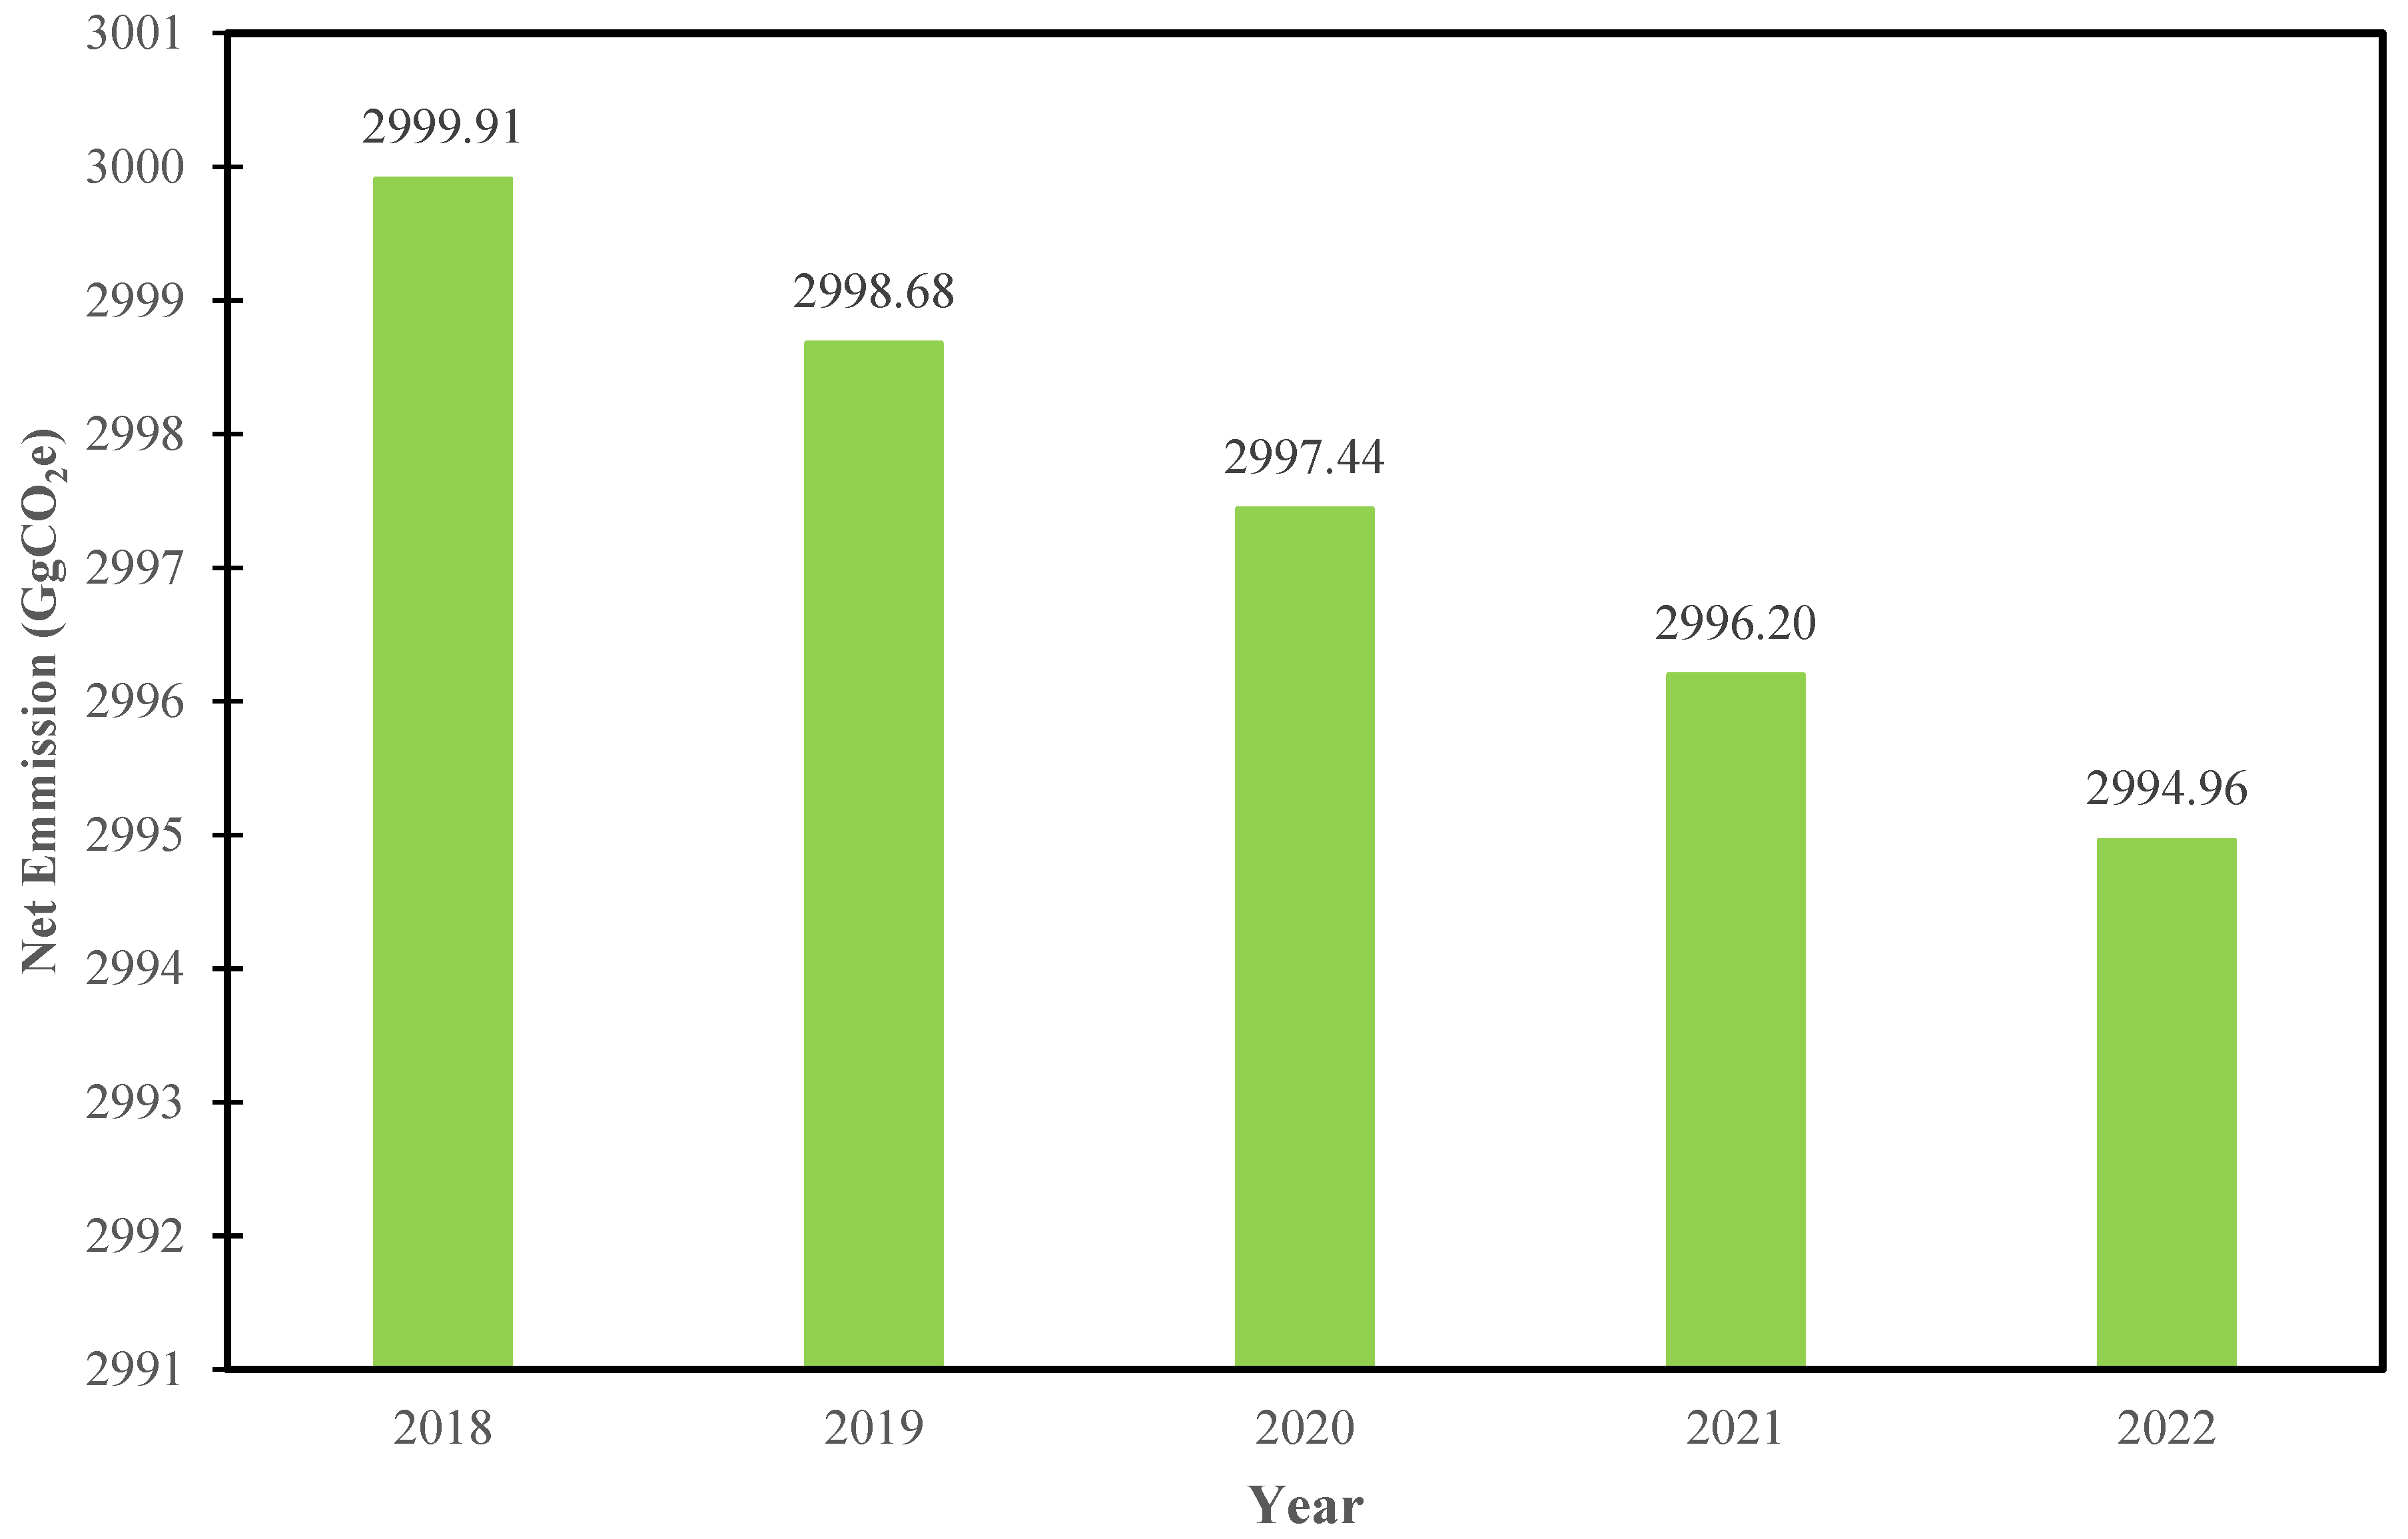
Figure 7.
Net emissions from grassland remaining grassland.
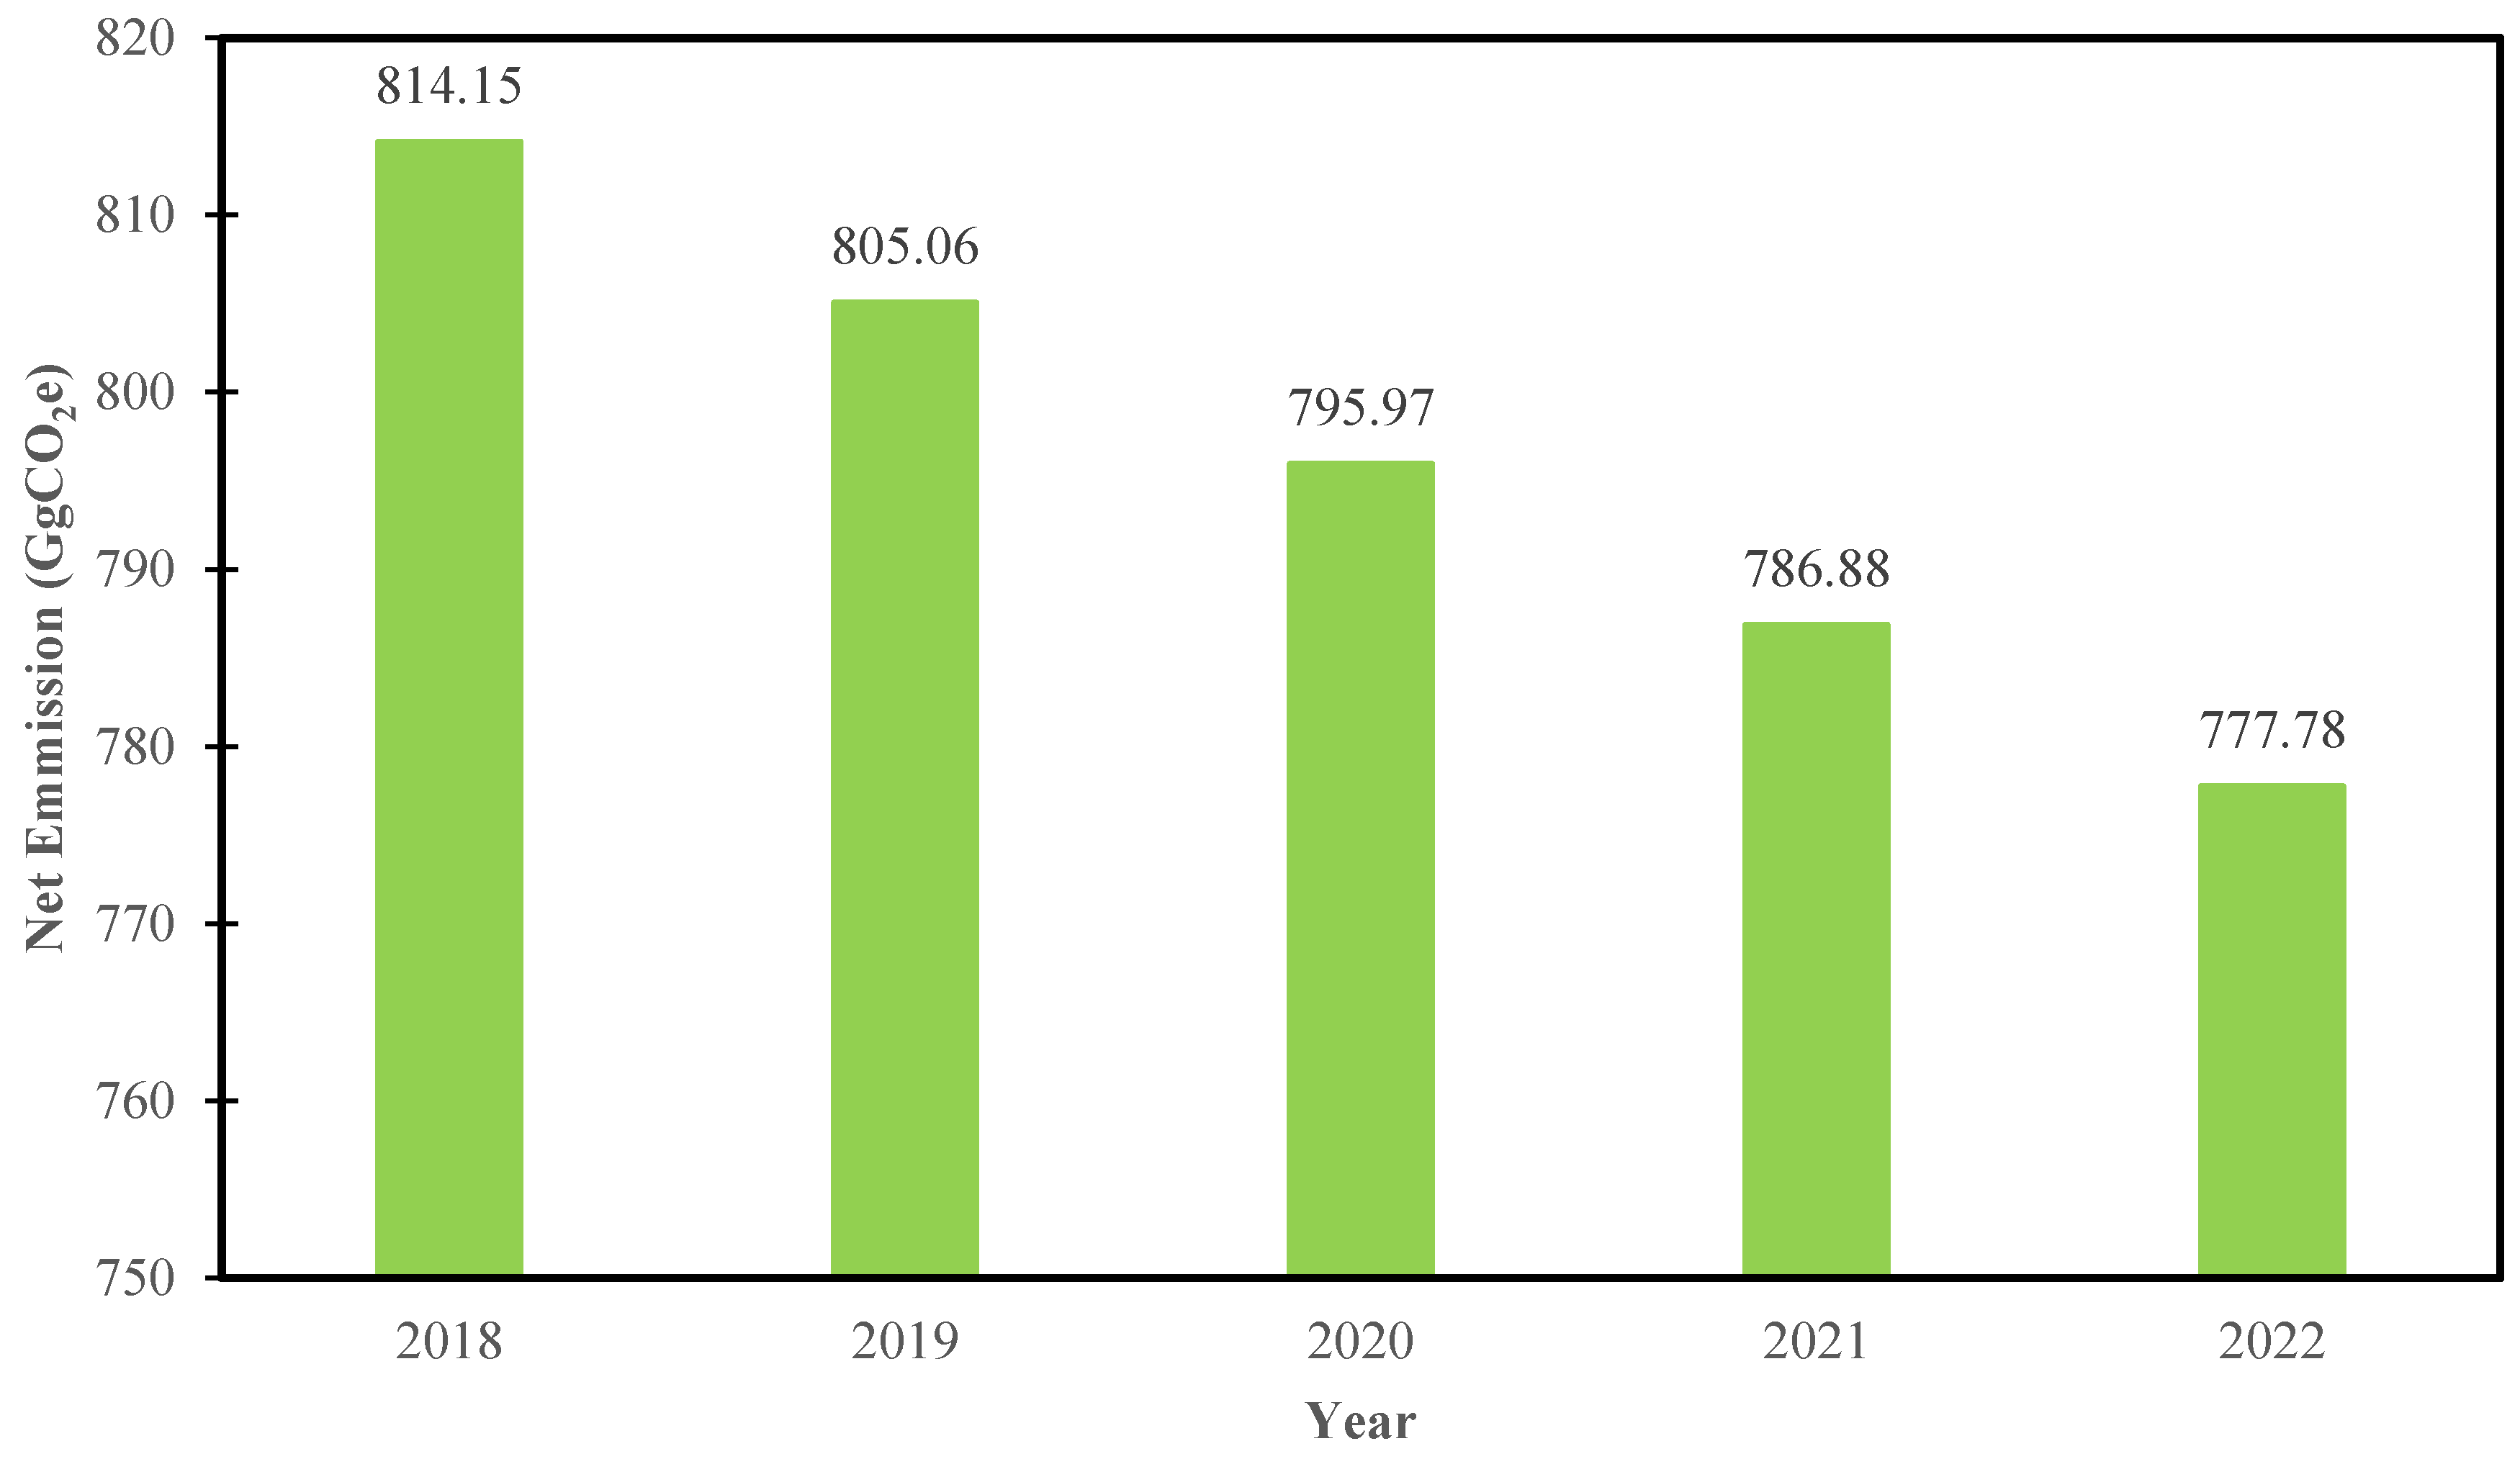
Figure 8.
Net emissions from wetland remaining wetland.
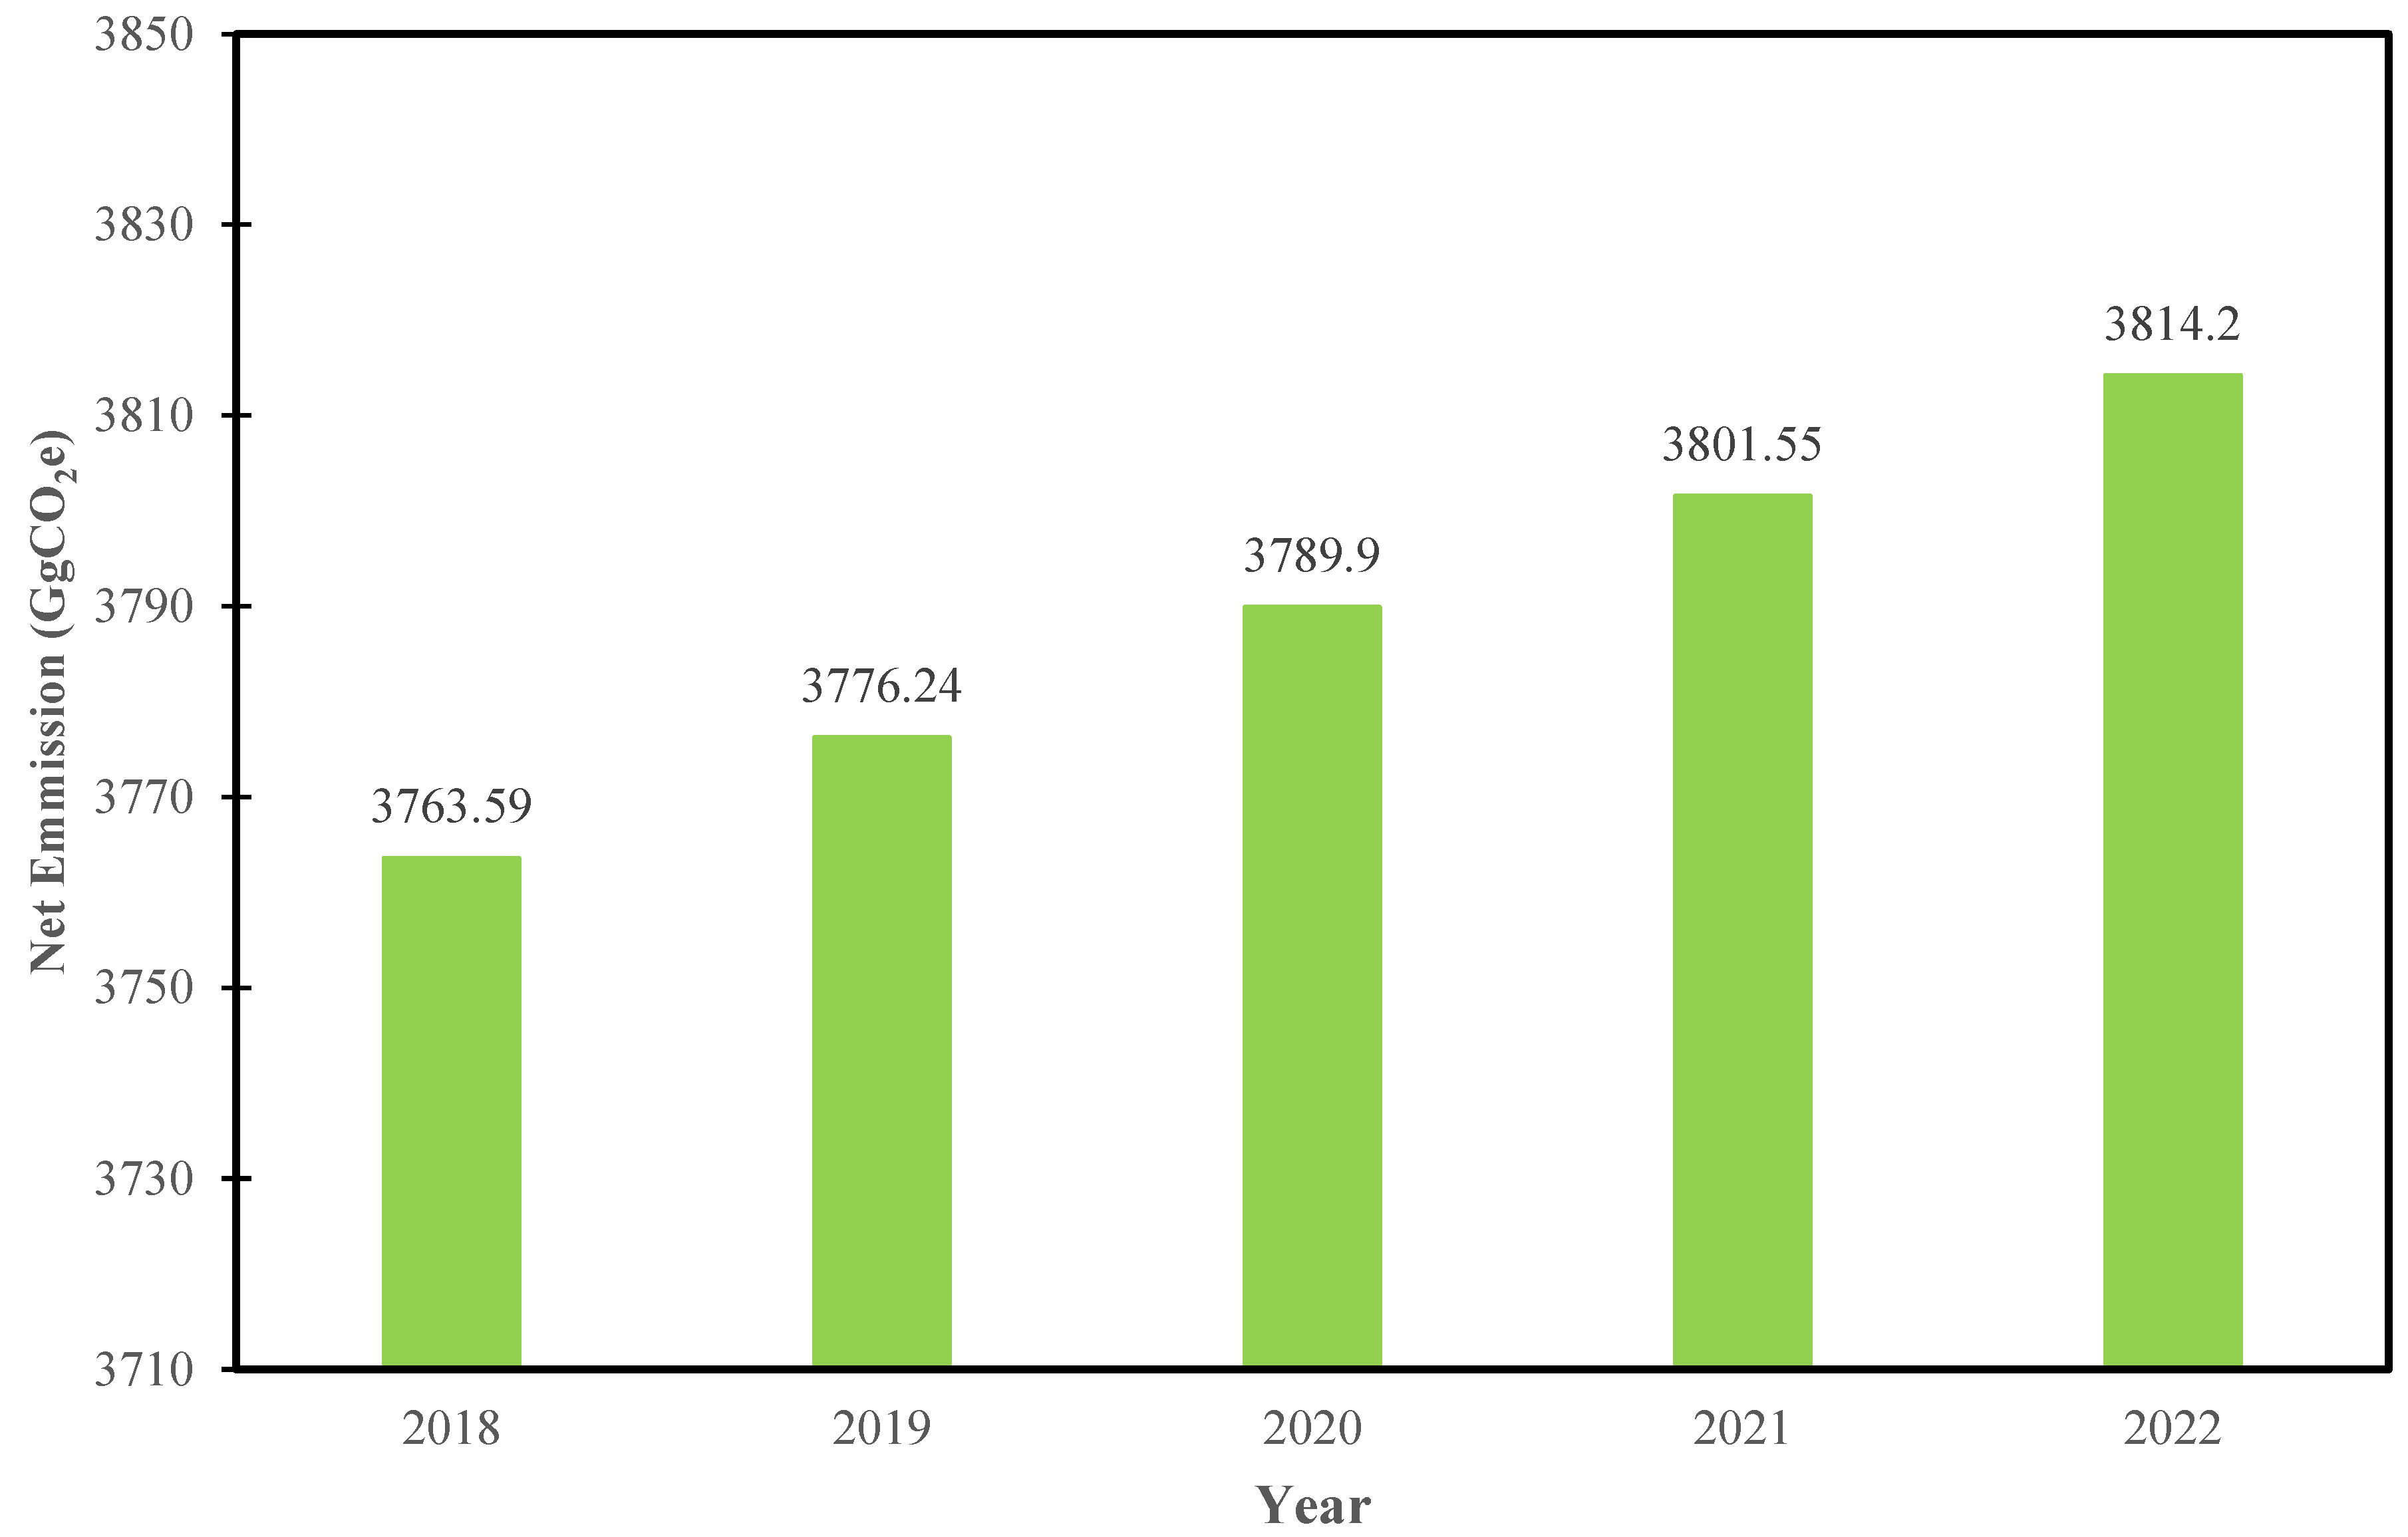

Table 1.
Malawi’s land use classes and their definitions
| No. | Land use class | Definition |
| 1 | Forestland | Land with woody vegetation consistent with thresholds used to define forest land. These thresholds are minimum mapping area or unit (MMU), minimum crown closure at maturity, minimum height, and minimum width of linear features. Recommended definition thresholds for the GoM are a minimum mapping area of 0.5 hectare, a minimum 10% crown closure, a minimum height of 5 meters, and a minimum linear feature width of 20 meters. |
| 2 | Cropland | Arable and tillage land, and agroforestry systems where vegetation falls below the thresholds used to define forest land. The FAO Land Cover Classification System (LCCS) calls these Agriculture Lands. |
| 3 | Grassland | Rangelands and pastureland that is not considered cropland. |
| 4 | Wetland | Land that is covered or saturated by water for all or part of the year and that does not fall into the previous categories or settlements. |
| 5 | Settlements | developed land, including transportation infrastructure and human settlements of any size unless they are already included under other categories |
| 6 | Other land | Bare ground, rock, and all unmanaged land not in the previous categories. |
Source [12].
Table 2.
Emission factors used in LULUCF sector
| No. | Category | Description | Sub-Category / parameter | Emission Factor (tCO2e) | Notes |
| 1 | Forestland | Forest land remaining forest land and Land converted to forestland | Miombo Woodland | 13.66 | Developed by Missanjo & Kadzuwa (2024) [2]. The EF was chosen because it has a low uncertainty (2.44%), and it encompasses three carbon pools (AGC, BGC, & SOC). Unlike the one developed by NFI (2018) [91.8 t.d.mha-1yr-1 ≈ 158.09 tCO2eha-1yr-1] which only encompasses two carbon pools (AGC & BGC) and no uncertainty was determined making it unreliable, reduced credibility, failure to detect variability, and decision-makers may make flawed choices. |
| Pine Plantations | 17.23 | Default value [11] | |||
| Eucalyptus plantations | 34.47 | Default value [11] | |||
| Burning Biomass | CO2 | 6.05 | Default value [11] | ||
| CH4 | 0.025 | Default value [11] | |||
| N2O | 0.00073 | Default value [11] | |||
| CO | 0.40337 | Default value [11] | |||
| HWP | Miombo | 1.082 | Default value [11] | ||
| Pine | 0.8244 | Default value [11] | |||
| Eucalyptus | 0.8244 | Default value [11] | |||
| 2 | Cropland | Crop land remaining crop land and Land converted to cropland | - | 0.48 | Default value [11] |
| Burning Biomass | CO2 | 5.54 | Default value [11] | ||
| CH4 | 0.0099 | Default value [11] | |||
| N2O | 0.00026 | Default value [11] | |||
| CO | 0.3374 | Default value [11] | |||
| 3 | Grassland | Grass land remaining grassland and Land converted to grassland | - | 2.578 | Default value [11] |
| Burning Biomass | CO2 | 5.79 | Default value [11] | ||
| CH4 | 0.0143 | Default value [11] | |||
| N2O | 0.00044 | Default value [11] | |||
| CO | 0.33003 | Default value [11] | |||
| 4 | Wetland | Wet land remaining wetland and Land converted to wetland | - | 1.247 | Default value [11] |
| 5 | Settlement | Settlement remaining settlement and Land converted to settlement | Miombo | 13.66 | Developed by Missanjo & Kadzuwa (2024) [2] |
| Pine | 17.23 | Default value [11] | |||
| Eucalyptus | 34.47 | Default value [11] |
Table 3.
Categorization of wood types for harvested wood products in Malawi
| No. | Wood type | Sub-categories |
| 1 | Round wood | Wood fuel, coniferous; Wood fuel, non-coniferous; and Wood fuel, all species. |
| 2 | Sawnwood | Sawnwood, coniferous; and Sawnwood, non-coniferous |
| 3 | Wood based panels | Veneer sheets; Plywood; Particle board and OSB; Particle board; OSB; Hardboard; MDF/HDF; Other fibreboard; and Fibreboard, compressed |
| 4 | Wood pulp and recovered paper | Mechanical wood pulp; Semi-chemical wood pulp; Chemical wood pulp; Chemical wood pulp, sulphate, bleached and unbleached; Dissolving wood pulp; Pulp from fibres other than wood; Recovered fibre pulp; Recovered paper; Newsprint; Printing and writing papers; Printing and writing papers, uncoated, mechanical; Printing and writing papers, uncoated, wood free; and Printing and writing papers, coated. |
| 5 | Paper and paperboard | Other paper and paperboard; Household and sanitary papers; Wrapping and packaging paper and paperboard; Case materials; Carton board; Wrapping papers; Other papers mainly for packaging; and other paper and paperboard not elsewhere specified |
| 6 | Industrial roundwood | Industrial roundwood, coniferous; Industrial roundwood, non-coniferous; Sawlogs and veneer logs, coniferous; Sawlogs and veneer logs, non-coniferous; Other industrial roundwood, coniferous; Other industrial roundwood, non-coniferous; and Other industrial roundwood, all species |
| 7 | Chips and particles | Wood chips and particles |
| 8 | Wood charcoal | Wood charcoal |
| 9 | Wood residues | Wood residues |
Table 4.
LULUCF Subsector Emissions by Category for the Year 2022 With Changes since, 2018, 2019, 2020, and 2021.
Table 4.
LULUCF Subsector Emissions by Category for the Year 2022 With Changes since, 2018, 2019, 2020, and 2021.
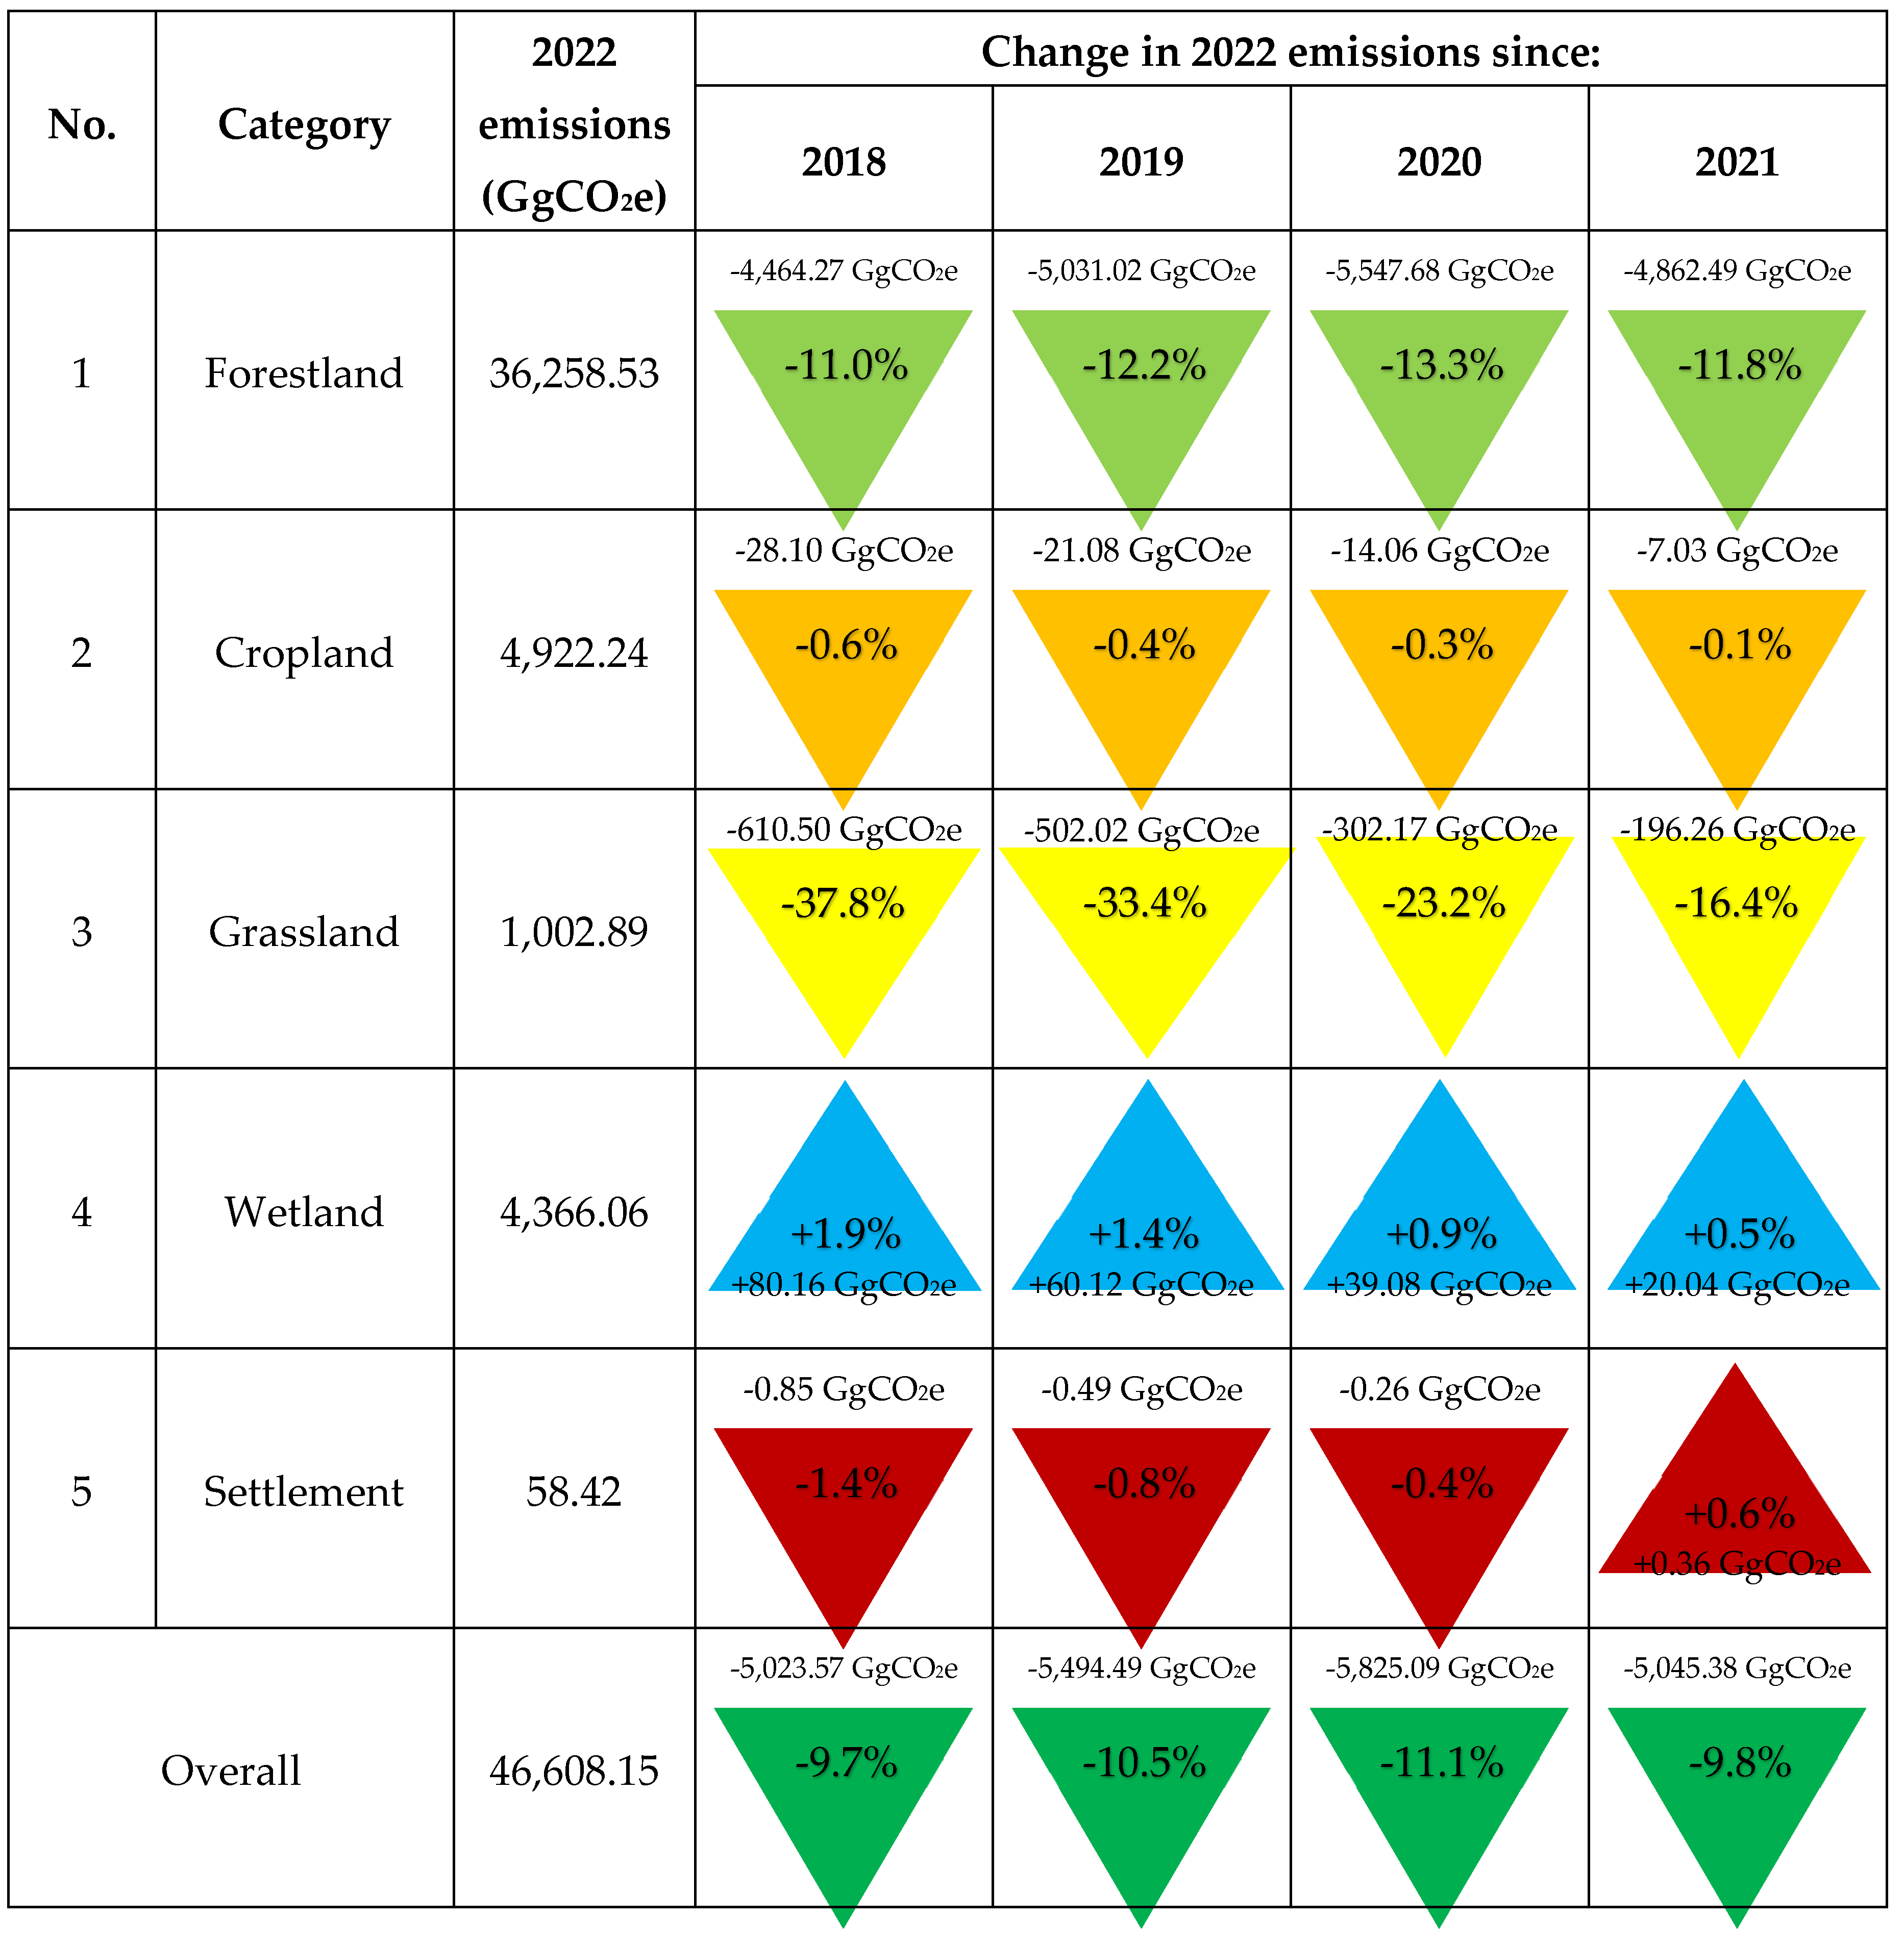 |
Table 5.
Emissions and removals (GgCO2e) from forestland remaining forestland.
| Year | Miombo woodland | Pine plantations | Eucalyptus plantations | Total |
| 2018 | 26652.02 | 1133.17 | 6045.34 | 33830.53 |
| 2019 | 26585.86 | 1130.36 | 6030.33 | 33746.55 |
| 2020 | 26519.70 | 1127.55 | 6015.33 | 33662.58 |
| 2021 | 26453.55 | 1124.73 | 6000.32 | 33578.60 |
| 2022 | 26387.39 | 1121.92 | 5985.32 | 33494.63 |
Table 6.
Annual area in hectares for land converted to forestland.
| Year | Cropland converted to forestland | Grassland converted to forestland | Wetlands converted to forestland | Total |
| 2018 | 137183.36 | 28180.00 | 28773.36 | 194136.70 |
| 2019 | 130947.53 | 28945.00 | 27465.03 | 187357.60 |
| 2020 | 124711.70 | 29710.00 | 26156.70 | 180578.40 |
| 2021 | 118475.87 | 30475.00 | 24848.37 | 173799.20 |
| 2022 | 112240.00 | 31240.00 | 23540.00 | 167020.00 |
Table 7.
Annual net emissions (GgCO2e) for land converted to forestland.
| Year | Cropland converted to forestland | Grassland converted to forestland | Wetlands converted to forestland | Total | ||||||
| Miombo | Pine | Eucalyptus | Miombo | Pine | Eucalyptus | Miombo | Pine | Eucalyptus | ||
| 2018 | 1667.79 | 70.91 | 378.30 | 342.60 | 14.57 | 77.71 | 349.81 | 14.87 | 79.35 | 2995.90 |
| 2019 | 1591.98 | 67.69 | 361.10 | 351.90 | 14.96 | 79.82 | 333.90 | 14.20 | 75.74 | 2891.28 |
| 2020 | 1516.17 | 64.46 | 343.90 | 361.20 | 15.36 | 81.93 | 318.00 | 13.50 | 72.13 | 2786.67 |
| 2021 | 1440.36 | 61.24 | 326.71 | 370.50 | 15.75 | 84.04 | 302.09 | 12.84 | 68.52 | 2682.05 |
| 2022 | 1364.55 | 58.02 | 309.51 | 379.80 | 16.15 | 86.15 | 286.19 | 12.17 | 64.91 | 2577.44 |
Table 8.
Annual area burnt and net emissions for burning biomass in forestland.
| Year | Area burnt (ha) | Emissions from CO2 (GgCO2e) | Emissions from CH4 (GgCO2e) | Emissions from N2O (GgCO2e) | Emissions from CO (GgCO2e) | Total Emissions (GgCO2e) |
| 2018 | 581898.33 | 3520.48 | 14.55 | 0.42 | 234.72 | 3770.18 |
| 2019 | 694899.00 | 4204.14 | 17.37 | 0.51 | 280.30 | 4502.32 |
| 2020 | 806773.33 | 4880.98 | 20.17 | 0.59 | 325.43 | 5227.17 |
| 2021 | 734017.07 | 4440.80 | 18.35 | 0.54 | 296.08 | 4755.77 |
| 2022 | 14857.93 | 89.89 | 0.37 | 0.01 | 5.99 | 96.27 |
Table 9.
Annual Area (hectares) for Land Converted to Cropland.
| Year | Forestland converted to cropland | Wetlands converted to cropland | Total |
| 2018 | 269913.6 | 108490.0 | 378403.6 |
| 2019 | 257645.3 | 103560.0 | 361205.3 |
| 2020 | 245377.0 | 98630.0 | 344007.0 |
| 2021 | 233108.7 | 93700.0 | 326808.7 |
| 2022 | 220840.0 | 88770.0 | 309610.0 |
Table 10.
Annual net emissions (GgCO2e) for land converted to cropland.
| Year | Forestland converted to cropland | Wetlands converted to cropland | Total |
| 2018 | 129.56 | 52.08 | 181.63 |
| 2019 | 123.67 | 49.71 | 173.38 |
| 2020 | 117.78 | 47.34 | 165.12 |
| 2021 | 111.89 | 44.98 | 156.87 |
| 2022 | 106.00 | 42.61 | 148.61 |
Table 11.
Annual area burnt and net emissions for burning biomass in cropland.
| Year | Area burnt (ha) | Emissions from CO2 (GgCO2e) | Emissions from CH4 (GgCO2e) | Emissions from N2O (GgCO2e) | Emissions from CO (GgCO2e) | Total Emissions (GgCO2e) |
| 2018 | 300430.00 | 1664.38 | 2.97 | 0.08 | 101.37 | 1768.80 |
| 2019 | 300849.13 | 1666.70 | 2.98 | 0.08 | 101.51 | 1771.27 |
| 2020 | 301268.25 | 1669.03 | 2.98 | 0.08 | 101.65 | 1773.73 |
| 2021 | 301687.38 | 1671.35 | 2.99 | 0.08 | 101.79 | 1776.20 |
| 2022 | 302106.50 | 1673.67 | 2.99 | 0.08 | 101.93 | 1778.67 |
Table 12.
Cumulative area and net emissions for land converted to grassland.
| Year | Cumulative area (ha) of forestland converted to grassland | Emissions (GgCO2e) forestland to grassland |
| 2018 | 18770.0 | 51.77 |
| 2019 | 17917.5 | 49.42 |
| 2020 | 17065.0 | 47.07 |
| 2021 | 16212.5 | 44.71 |
| 2022 | 15360.0 | 42.36 |
Table 13.
Annual area burnt and net emissions for burning biomass in grassland.
| Year | Area burnt (ha) | Emissions from CO2 (GgCO2e) | Emissions from CH4 (GgCO2e) | Emissions from N2O (GgCO2e) | Emissions from CO (GgCO2e) | Total Emissions (GgCO2e) |
| 2018 | 121842.67 | 705.47 | 1.74 | 0.05 | 40.21 | 747.48 |
| 2019 | 106024.63 | 613.88 | 1.52 | 0.05 | 34.99 | 650.44 |
| 2020 | 75312.08 | 436.06 | 1.08 | 0.03 | 24.86 | 462.02 |
| 2021 | 59913.83 | 346.90 | 0.86 | 0.03 | 19.77 | 367.56 |
| 2022 | 29789.00 | 172.48 | 0.43 | 0.01 | 9.83 | 182.75 |
Table 14.
Cumulative area in hectares and net emissions for land converted to wetland.
| Year | Cumulative Area (ha) forestland converted to wetland | Emissions (GgCO2e) forestland to wetland |
| 2018 | 38236.7 | 522.31 |
| 2019 | 38777.5 | 529.70 |
| 2020 | 39318.3 | 537.09 |
| 2021 | 39859.2 | 544.48 |
| 2022 | 40400.0 | 551.86 |
Table 15.
Area gain and net emissions of sparse woody vegetation, settlements remaining settlements.
Table 15.
Area gain and net emissions of sparse woody vegetation, settlements remaining settlements.
| Year | Area gain (ha) | Net emission (GgCO2e) |
| 2018 | 1443 | 19.71 |
| 2019 | 1440 | 19.67 |
| 2020 | 1447 | 19.77 |
| 2021 | 1425 | 19.47 |
| 2022 | 1475 | 20.15 |
Table 16.
Cumulative area in hectares and net emissions for land converted to settlement.
| Year | Cumulative Area (ha) forestland converted to settlement | Emissions (GgCO2e) forestland (Miombo) to settlement | Emissions (GgCO2e) forestland (Pine plantation) to settlement | Emissions (GgCO2e) forestland (Eucalyptus plantation) to settlement | Total Emissions (GgCO2e) forestland to settlement |
| 2018 | 2563.3 | 31.16 | 1.32 | 7.07 | 39.55 |
| 2019 | 2542.5 | 30.91 | 1.31 | 7.01 | 39.23 |
| 2020 | 2521.7 | 30.66 | 1.30 | 6.95 | 38.91 |
| 2021 | 2500.8 | 30.40 | 1.29 | 6.90 | 38.59 |
| 2022 | 2480.0 | 30.15 | 1.28 | 6.84 | 38.27 |
Table 17.
Uncertainty assessment by category in FOLU Sub-sector.
| No. | Category | Uncertainty (%) |
| 1 | Forestland | 4.92 |
| 2 | Cropland | 0.20 |
| 3 | Grassland | 6.05 |
| 4 | Wetland | 0.64 |
| 5 | Settlement | 0.69 |
| Overall | 4.16 | |
Disclaimer/Publisher’s Note: The statements, opinions and data contained in all publications are solely those of the individual author(s) and contributor(s) and not of MDPI and/or the editor(s). MDPI and/or the editor(s) disclaim responsibility for any injury to people or property resulting from any ideas, methods, instructions or products referred to in the content. |
© 2026 by the authors. Licensee MDPI, Basel, Switzerland. This article is an open access article distributed under the terms and conditions of the Creative Commons Attribution (CC BY) license (http://creativecommons.org/licenses/by/4.0/).
Copyright: This open access article is published under a Creative Commons CC BY 4.0 license, which permit the free download, distribution, and reuse, provided that the author and preprint are cited in any reuse.


