
Submitted:
19 January 2026
Posted:
20 January 2026
You are already at the latest version
Abstract
This paper investigates the operational performance and stability of a regional power grid with a high penetration of small hydropower plants operating under rated conditions. Grid monitoring and simulation results reveal that voltage levels frequently exceed permissible limits and exhibit significant fluctuations. The primary radial configuration of the network is the cause of often the outages of transmission lines that occur at times of peak generation. These conditions adversely affect generator operation and may contribute to equipment degradation. To enhance grid reliability and ensure stable hydropower plant operation, several mitigation measures are proposed, including the reinforcement of the transmission network through the construction of new lines to enable a ring configuration, the mandatory implementation of excitation control systems for generating units, the establishment of a real-time grid operation center, and the deployment of real-time diagnostic tools for optimized generator utilization. The proposed measures give a very handy scheme to raise voltage stability, operational reliability, and the safe inclusion of distributed hydropower generation into regional power systems.
Keywords:
synchronous generators
; hydropower plant
; renewable energy
; power systems
; PSS/E
1. Introduction
Small and medium hydropower plants (SHPs) play an increasingly important role in the diversification of electricity generation and the enhancement of energy security worldwide [1,2,3,4,5,6]. The hydropower generation capacity of Albania has been witnessing a remarkable increase, particularly attributed to the establishment of small hydropower plants (SHPs) through private investments and concession-based schemes [7]. This trend does not only mean the more efficient use of the already existing hydropower resources but also the better support of the national electricity grid in terms of reliability.
The geographical distribution of small hydropower (SHP) plants has been very large and this practice has been very beneficial for the performance of the entire power system by the aforementioned factors, especially in the case of rural and outlying areas [8,9,10]. New plants coming online and old ones getting better through rehabilitation have shown to give the grid better energy and quality [11,12]. Over the past few years, around 630 MW of SHPs have been connected to the Albanian power grid, thus raising the country's electricity output considerably and enhancing system reliability [13].
Despite these advantages, the integration of SHPs as distributed generation sources introduces technical challenges related to system operation and stability [14]. System monitoring has revealed voltage fluctuations and various transmission line faults that can adversely affect the operation of synchronous generators connected to the grid [15,16]. Disturbances like short circuits may produce severe electromechanical transients, potentially leading to loss of synchronism and compromising system security if not properly addressed [17].
Transient stability analysis in this context is indispensable for evaluating the ability of synchronous generators in hydropower plants to keep operating without major disturbances [18]. The commonly accepted definition of power system stability is that it is the system's ability to recover to the normal operating condition after being disturbed [19]. In case the forces that bring the system back to its stable condition are weaker than those that disturb it, then instability could occur which will lead to generator desynchronization and, in the worst-case scenario, complete system failure [20]. Transient stability analysis usually takes into account disturbances like the ones mentioned, such as short circuits, sudden load changes, or loss of generation [21].
This paper investigates the transient stability of a medium-power hydropower plant connected to the Albanian transmission network. A typical area with several hydropower plants is chosen as the basis for the case study. The dynamic response of the synchronous generator is studied considering different faults on the transmission line, such as single-phase, two-phase, two-phase-to-ground, and three-phase short circuits. Time-domain simulations are performed with the assistance of the PSS®E software package and for the most critical disturbance scenario which is a three-phase short circuit, the relay protection operating time is calculated as the critical time [22].
Unlike existing studies, this work presents a protection-oriented transient stability analysis of a medium-power hydropower synchronous generator connected to the Albanian transmission network, explicitly determining critical clearing times under realistic transmission line fault scenarios using PSS®E simulations.
2. The Current Landscape of Small and Medium Hydropower Plants
In the late 1990s, small hydropower plants accounted for approximately 10% of the total installed generation capacity in Albania [25,26]. The installed capacity of individual plants ranged between 100 and 400 kW.
Over the past decade, interest from private investors in small hydropower development has increased significantly. As a consequence, nearly 80 concession agreements have been granted for the development and operation of small hydropower plants, representing an installed capacity of roughly 650 MW and an estimated annual electricity generation of about 1,827 GWh. The total investment required for the construction of these plants is estimated at approximately €289 million.
Table 1 depicts selected small and medium hydropower plants constructed in recent years in Albania, based on data from the [27]
It should be noted that, until the 1990s, the power system operated under a conventional unidirectional scheme, with electricity flowing from generating units through transmission lines to the distribution network. In recent years, however, the commissioning of new generating units particularly small and medium hydropower plants (SHPs) has altered this operating paradigm. As a result, power flows have increasingly reversed direction, from the distribution network toward the transmission system.
Most SHPs were linked to the power system via radial transmission lines at voltage levels of 10 kV, 35 kV, or 110 kV. In many cases, the energy produced by these plants exceeds the transmission line capacity. This situation especially occurs during the rainy season, when SHPs operate at their maximum capacity.
To analyze the electrical system parameters under these conditions, operational data were obtained from the Transmission System Operator (OST), complemented by measurements collected using a Fluke power analyzer was employed on the low-voltage side of the 110 kV Burrel–Peshkopi transmission line. The recorded data indicate that voltage levels at various nodes along the transmission line fluctuate within wide limits, leading to operational challenges for the power system.
In many situations, particularly during the rainy season, full-capacity operation of SHPs results in transmission line overloading. Consequently, OST is forced to curtail generation from these units. Frequent transmission line outages were also observed, adversely affecting the proper operation of the generating units and, in some cases, causing damage to turbine generator assemblies. Furthermore, when generating units operate at full capacity, voltage levels often exceed permissible limits, and power quality issues such as voltage flicker are observed within the system.
3. Synchronous Generator Model
3.1. Mathematical Model of a Synchronous Generator
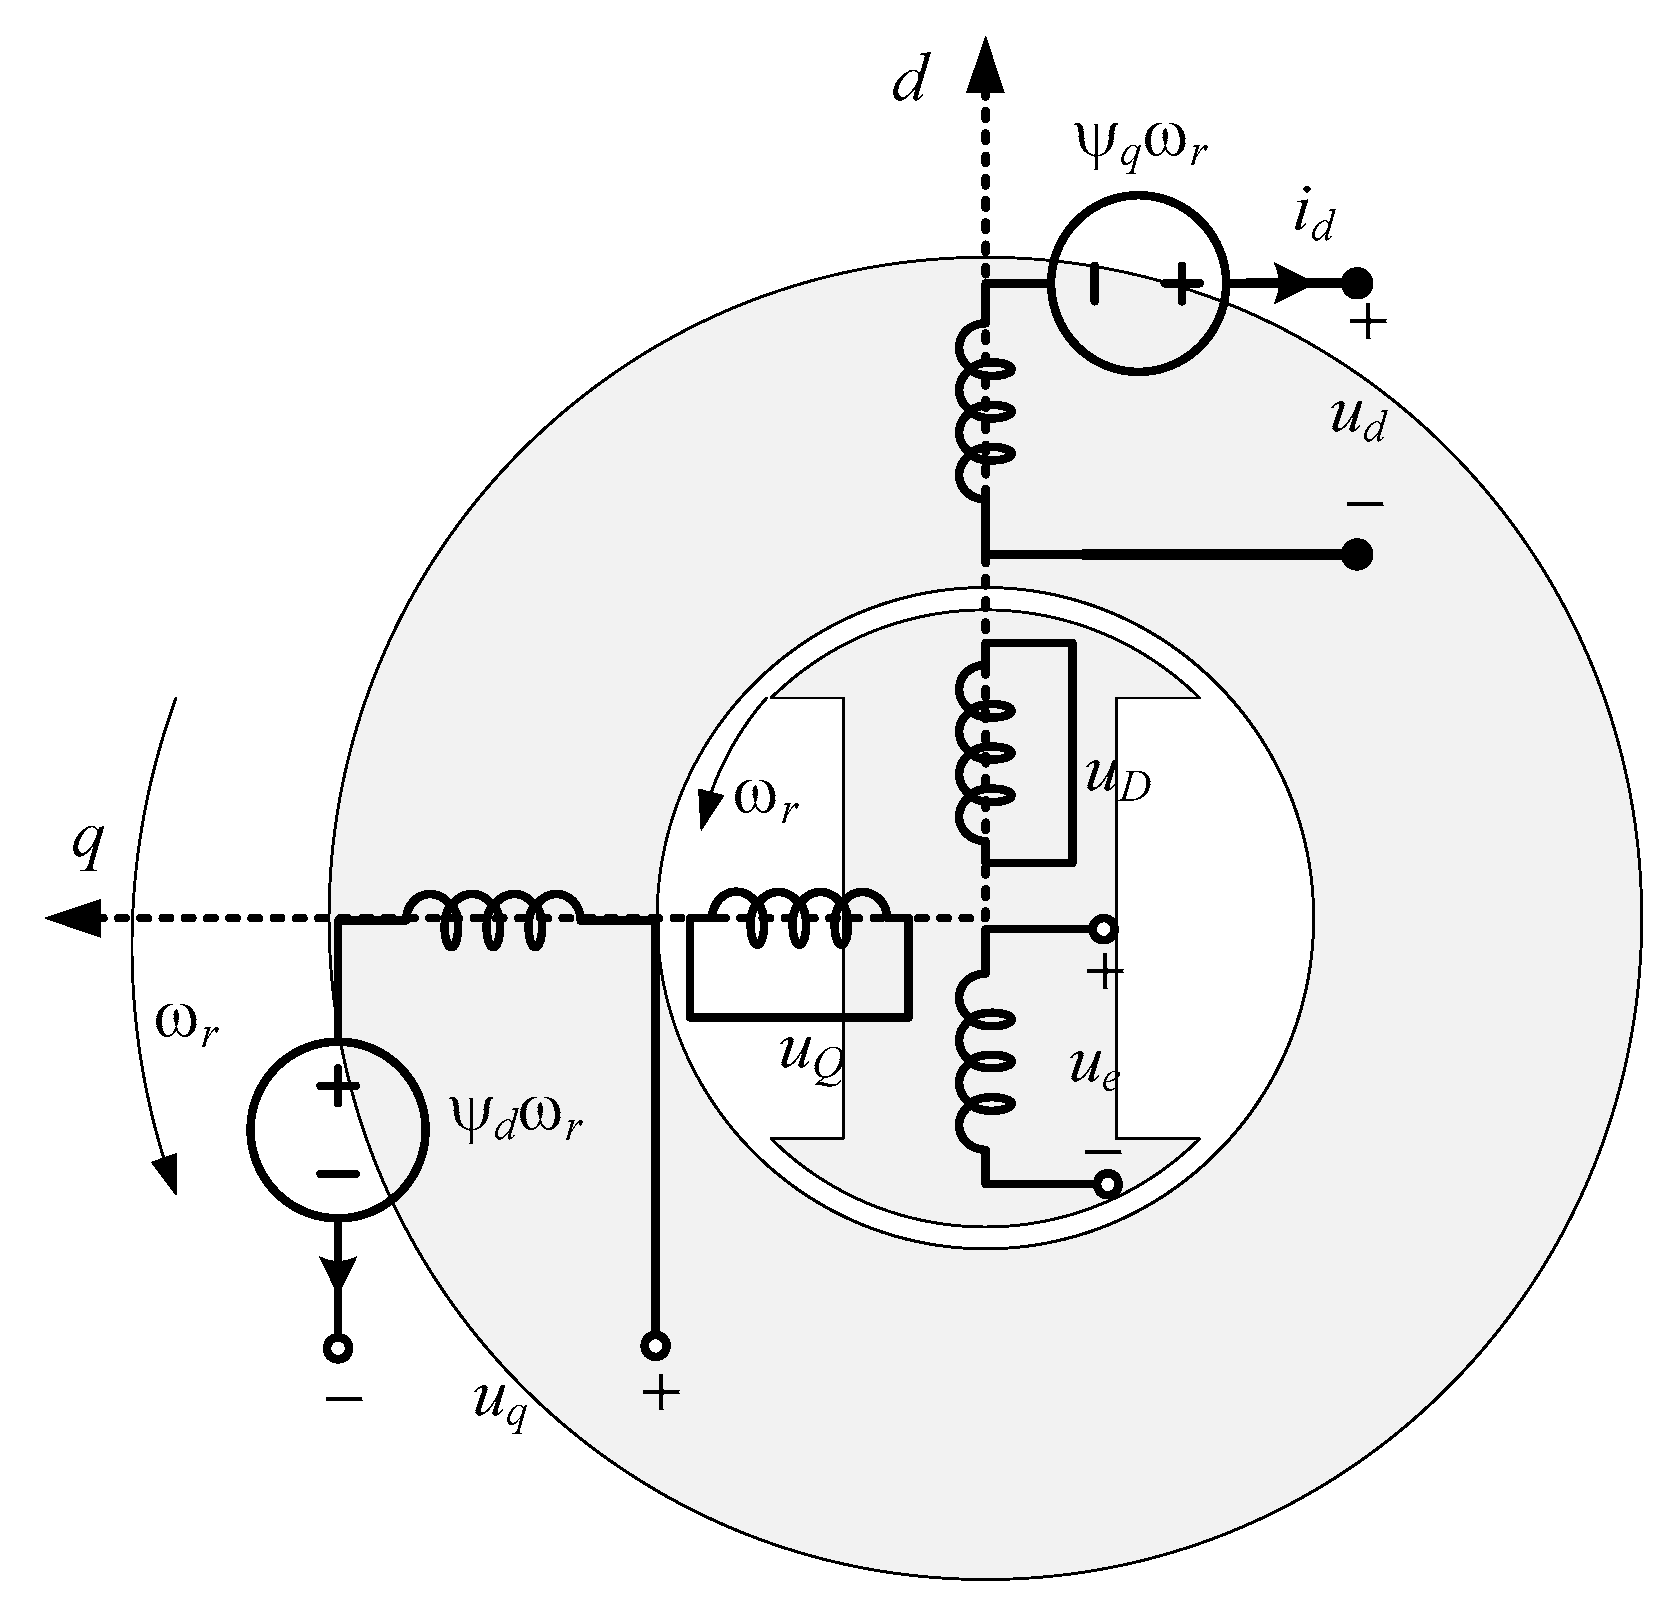
As highlighted above, one of the problems in the power system is the improper operation of synchronous generators in generating units. Figure 1 circuit representation of an idealized a synchronous generator, salient – pole type. As shows by figure 1, synchronous generator has three phase stator windings (a, b, c) and three rotor windings, field winding f, direct damper winding D and quadrature damper winding Q. The mathematical equations of the circuit model shown in figure 1 are given as follows:
Where:
ψa, ψb, ψc instantaneous values of the stator flux linkages in stator phases a, b, c respectively.
ia, ib, ic instantaneous values the stator currents in phases a, b, c.
ua, ub, uc instantaneous values of the stator voltages in phases a, b, c.
ue, the value of excitation voltage.
rs, the resistance of a stator phase winding.
re, the resistance of excitation winding.
ψe, ψD, ψQ instantaneous values of the rotor flux linkages windings, (field, direct, and quadrature damper windings.
ie, iD, iQ instantaneous values of currents in the rotor windings e, D, Q respectively.
rQ, the resistance of q-axis damper winding.
rD, the resistance of d-axis damper winding.
tm, mechanical torque.
te, instantaneous values of electromagnetic torque.
D damping coefficient.
J moment of inertia
ω rotor speed
p the pole pairs.
The total flux linkages in the stator phases in terms of winding currents, if it assumed that the magneto motive forces distribution is sinusoidal in space (the effect of space harmonics are neglected) and if there are no zero-sequence stator current, are expressed as follows [14]:
Where
L0 constant value of self-inductance of the stator phase winding
Lδ2 the amplitude of the harmonic self-inductance vary by θr of stator phase winding.
Mae=Mbe=Mce the magnitude of the mutual inductance between a stator phase and the excitation windings.
MaD=MbD=McD the magnitude of the mutual inductance between a stator phase and the d-axis damper windings.
MaQ=MbQ=McQ the magnitude of the mutual inductance between a stator phase and the q-axis damper windings.
Lee, LDD, LQQ the self – inductance of excitation, d-axis, and q-axis windings.
MeD=MDe the amplitude of mutual inductance between field (excitation) and d-axis damper windings.
The set of equations (1) till (7), together with the rotor motion equation (8), represents the mathematical model of the synchronous machine expressed in phase coordinates. As can be observed, this model consists of differential equations with variable coefficients, since both self and mutual inductances depend on the rotor position . The time-varying nature of these coefficients introduces significant computational challenges when equations (1) till (7) were used to directly solve for phase quantitie.
3.2. Park’s Transformation
The equations described in the previous paragraph define the mathematical model of the synchronous machine, in which the inductances vary with the rotor angle , resulting in differential equations with variable coefficients that are difficult to solve. To overcome this issue, the stator quantities are transformed into the rotating rotor reference frame. By applying the transformation matrix , the stator voltage equations are expressed in coordinates [28]:
Where
Tdq0(θr) is a matrix transformation applied only to the stator winding quantities
By expanding equation (14), synchronous generator’s mathematical model is derived in the dq0 reference frame, with equations along d and q axis:
The flux linkage in terms of winding currents are as follow:
Electromagnetic torque expression
Where
usd, usq are the instantaneous direct- and quadrature-axis components of the stator voltage, respectively, expressed in the rotor reference frame.
isd, isq are the instantaneous direct- and quadrature-axis components of the stator current, expressed in the rotor reference frame.
Lσd, Lσq are the leakage inductance on the d – axis and q-axis.
Lad, Laq are the common mutual inductance on the d – axis and q-axis.
LσD, Lσ are the leakage inductance of direct and quadrature windigs.
The equations (7), (15), (16) and (17) denotes the synchronous machine mathematical model in the dq0 rotor reference frame. As observed, this model consists of differential equations with constant coefficients, since self and mutual inductances do not vary by rotor position θr.
Figure 2.
Schematic representation of the two-phase synchronous machine in dq0 reference frame.
Since the zero-sequence component is neglected in the generator analysis, the two-reaction representation is simplified, thereby facilitating the formulation of the generator equations.
4. Case Study: Simulation of Seta Hydropower Plant Under Different Power System Scenarios.
The northeastern part of Albania known as the Dibra region spans both sides of the Drini i Zi Valley, which hosts one of the country’s major river systems. Eight small hydropower plants (SHPs) in the Dibra area link to the main power grid via 110/35 kV transmission lines. All SHPs considered in this study are of the water-diversion type, i.e., run-of-river (RoR) plants. This section analyzes a representative medium-capacity generating unit, namely the Setës Hydropower Plant, focusing on operational issues observed in the electrical power system. Figure 4 presents the single-line diagram of the Dibra regional power system used for the analysis.
The voltage profile of Seta bus bars monitoring for 24 h are shown in Figure 5.
To assess the dynamic stability of the generators at the Seta Hydropower Plant, transient simulations were carried out using a comprehensive system model, assuming operation at rated capacity. The Seta Hydropower Plant is represented by three generating units, each equipped with its respective control systems. The excitation systems are modeled using standard block-diagram representations of static excitation schemes commonly adopted in power system studies. For each analyzed scenario, four graphical results will be focused on:
- Rotor angle (degrees)
- Slip of synchronous generator (p.u.)
- Active power of synchronous generator (p.u.)
- Voltage bus profile (p.u.)
All simulations are conducted over 10 seconds, with the fault occurring at t = 1 s. In the table 2 are shown the data of synchronous generator installed at Seta hydropower plant.

Table 2.
Data of synchronous generator installed at Seta hydropower plant.
| Discription | Parameter | Value |
|---|---|---|
| Rated power | S | 6200 kVA |
| Rated voltage | V | 6000 V |
| Rated current | I | 597 A |
| Syncronous speed | ns | 500 rpm |
| Phase stator resistive winding | rs | 0.015 p.u. |
| Current ratio | SCR | 0,73 |
| d-axis transient reactance | x’d | 0,25 p.u. |
| q-axis synchronous reactance | xq | 0.5 p.u. |
| d-axis synchronous reactance | xd | 0.85 p.u. |
| Stator leakage reactance | xl | 0.1 p.u. |
| q-axis transient reactance | x’q | 0.15 p.u. |
| d-axis subtransient reactance | x’’d | 0.15 p.u. |
| q-axis subtransient reactance | x’’q | 0.2 p.u. |
| Negative reactance | x(2) | 0.06 p.u. |
| zero reactance | x(0) | 0.1 p.u. |
| q-axis open-circuit subtransient time constant | T’’q0 | 0,05 s |
| d-axis open-circuit subtransient time constant | T’’d0 | 0,03 s |
| d-axis open-circuit transient time constant | T’d0 | 5 s |
| Negative time constant | Ta | 0,15 s |
| Inertia constant | H | 1.3 s |
4.1. Analysis of Fault Scenarios
This section presents simulation results for the synchronous generator under different fault scenarios occurring on the transmission line. Four different fault cases were simulated: three-phase, two-phase, two-phase-to-ground, and single-phase short circuits, all with clearing time t = 0.02 s. Figure 6 illustrates rotor angle variations, and slip of synchronous machine. It has been shown that the most severe condition occurs during a three-phase short-circuit fault, which results in significant rotor angle deviations.
4.2. Determination of Critical Clearing Time
To determine critical clearing time, three-phase Short-circuit faults at the 110 kV bus bars were simulated by increasing fault duration time. Figure 8 shows rotor angle variation for different clearing times. The critical clearing time is identified as 0.34 s.
5. Summary and Conclusions
Monitoring of the power grid reveals that voltage levels exceed allowable limits and experience fluctuations. Due to the radial structure of the network, frequent line outages occur, especially when generating units operate at rated capacity. Transmission lines operate over loaded, activating protection systems. Voltage fluctuations and frequent outages disrupt generator operation and may cause damage. To mitigate these effects, the following measures are recommended:
- Construction of new transmission lines to transform the radial network into a ring structure.
- Mandatory use of excitation regulators for generating units.
- Establishment of a real-time operation center.
- Implementation of real-time diagnostics for efficient generator utilization.
Author Contributions
Conceptualization, all authors; methodology, all authors; validation, B.L., and A.E.; investigation, K.D.; data curation, A.B. and A.P; writing—original draft preparation, A.B. and K.D. All authors have read and agreed to the published version of the manuscript.
Funding
This work was supported by the Polytechnic University of Tirana, Albania.
Data Availability Statement
Data are contained within the article.
Conflicts of Interest
The authors declare no conflicts of interest.
References
- Paish, O. Small hydro power: Technology and current status. Renew. Sustain. Energy Rev. 2002, 6(6), 537–556. [CrossRef]
- Vataj, G., Ismayilov, M., & Sejfijaj, Z. Energy Generation from Water Systems: A Technical and Cost-Benefit Analysis. International Journal of Innovative Technology and Interdisciplinary Sciences, 2025, 8(3), 537–549. [CrossRef]
- Karakoyun, Y. Determination of Effective Parameters for Hydropower Plants’ Energy Generation: A Case Study. Appl. Sci. 2024, 14, 2069. [CrossRef]
- Alcani, M., Shuli, M., & Hoxha, A. Pumped-Storage Energy Systems for the Drin River Cascade: A Case Study. Journal of Transactions in Systems Engineering, 2025, 3(3), 508–521. [CrossRef]
- Kaunda, C.S.; Kimambo, C.Z.; Nielsen, T.K. Hydropower in the context of sustainable energy supply: A review of technologies and challenges. ISRN Renew. Energy 2012, 2012, 1–15. [CrossRef]
- Vataj, G., Ismayilov, M., Sejfijaj, Z., & Vataj, E. (2025). Modelling Transient Hydraulic Hammer Behavior in Pumped Systems Using WHAMO Software. International Journal of Innovative Technology and Interdisciplinary Sciences, 2025, 8(4), 970–993. [CrossRef]
- International Renewable Energy Agency: Albania’s Renewable Energy Sector. Available online: https://www.irena.org (accessed on 10 December 2024).
- Ackermann, T.; Andersson, G.; Söder, L. Distributed generation: A definition. Electr. Power Syst. Res. 2001, 57, 195–204. [CrossRef]
- Jenkins, N.; Allan, R.; Crossley, P.; Kirschen, D.; Strbac, G. Embedded Generation; The Institution of Engineering and Technology: London, UK, 2000.
- Bardhi, A.; Eski, A.; Leka, B.; Dhoska, K. The Impact of Solar Power Plants on the Electricity Grid: A Case Study of Albania. Eng 2025, 6, 35. [CrossRef]
- Walczak, N. Operational Evaluation of a Small Hydropower Plant in the Context of Sustainable Development. Water, 2018, 10, 1114. [CrossRef]
- Bardhi, A.; Pjeri, A.; Koxha, A.; Haxhiraj, E. “Impact of Small Hydropower Plants on Voltage Fluctuations: A Case Study”, International Conference on Renewable Energies and Smart Technologies (REST-22), 28-29 Korrik 2022, Tiranë, Shqipëri (IEEE), pp. 198-205. Proceeding book ISBN: 978-1-6654-0971-1. https://ieeexplore.ieee.org/document/10023297.
- Albanian Power Corporation (KESH). Annual Report on Electricity Generation and Transmission; KESH: Tirana, Albania, 2022.
- Kundur, P.; Malik, O.P. Power System Stability and Control; 2nd ed.; McGraw-Hill: New York, NY, USA, 2022.
- Milano, F. Power system modelling and scripting. Springer: London, UK, 2010.
- Bensiali, H.; Khoucha, F.; Benrabah, A.; Benhamimid, L.; Benbouzid, M. Virtual Synchronous Generator Control of Grid Connected Modular Multilevel Converters with an Improved Capacitor Voltage Balancing Method. Appl. Sci. 2025, 15, 2865. [CrossRef]
- Anderson, P.M.; Fouad, A.A. Power System Control and Stability, 2nd ed.; IEEE Press: Piscataway, NJ, USA, 2003.
- IEEE Power & Energy Society. IEEE Guide for Synchronous Generator Modeling Practices and Applications in Power System Stability Analyses; IEEE Std 1110-2019; IEEE: New York, NY, USA, 2019.
- Kundur, P. Definition and classification of power system stability. IEEE Trans. Power Syst. 2004, 19, 1387–1401.
- Sauer, P.W.; Pai, M.A. Power System Dynamics and Stability; Prentice Hall: Upper Saddle River, NJ, USA, 1998.
- Machowski, J.; Bialek, J.W.; Bumby, J.R. Power System Dynamics: Stability and Control, 3rd ed.; Wiley: Chichester, UK, 2020.
- Siemens PTI. PSS®E 35.0 Program Application Guide; Siemens Power Technologies International: Schenectady, NY, USA, 2022.
- Khosal, S., De, D., Kar Ray, D., & Roy, T. (2023). Condition Monitoring of Fixed and Dual Axis Tracker using Curve Fitting Technique. International Journal of Innovative Technology and Interdisciplinary Sciences, 6(4), 1264–1272. [CrossRef]
- Hatziargyriou, N. (Ed.) Microgrids: Architectures and Control; Wiley-IEEE Press: Hoboken, NJ, USA, 2014.
- Kojinović, D.; Petrović, M. Energy transition in the Balkans: The case of hydropower dependence. Energy Rep. 2019, 5, 438–444.
- Walling, R.A.; Saint, R.; Dugan, R.C.; Burke, J.; Kojovic, L.A. Summary of the impact of distributed resources on power distribution systems. IEEE Trans. Power Delivery. 2008, 23, 1636–1644.
- Energy Regulator Authority, Annual Report 2024. Available online: https://www.ere.gov.al/en/publications/annual-reports/annual-report-2024 (Access Date 11 Dec 2025).
- Krause, P.C.; Wasynczuk, O.; Sudhoff, S.D. Analysis of Electric Machinery and Drive Systems; Wiley-IEEE Press: Hoboken, NJ, USA, 2013.
Figure 1.
Circuit representation of an idealized synchronous generator, salient – pole type.
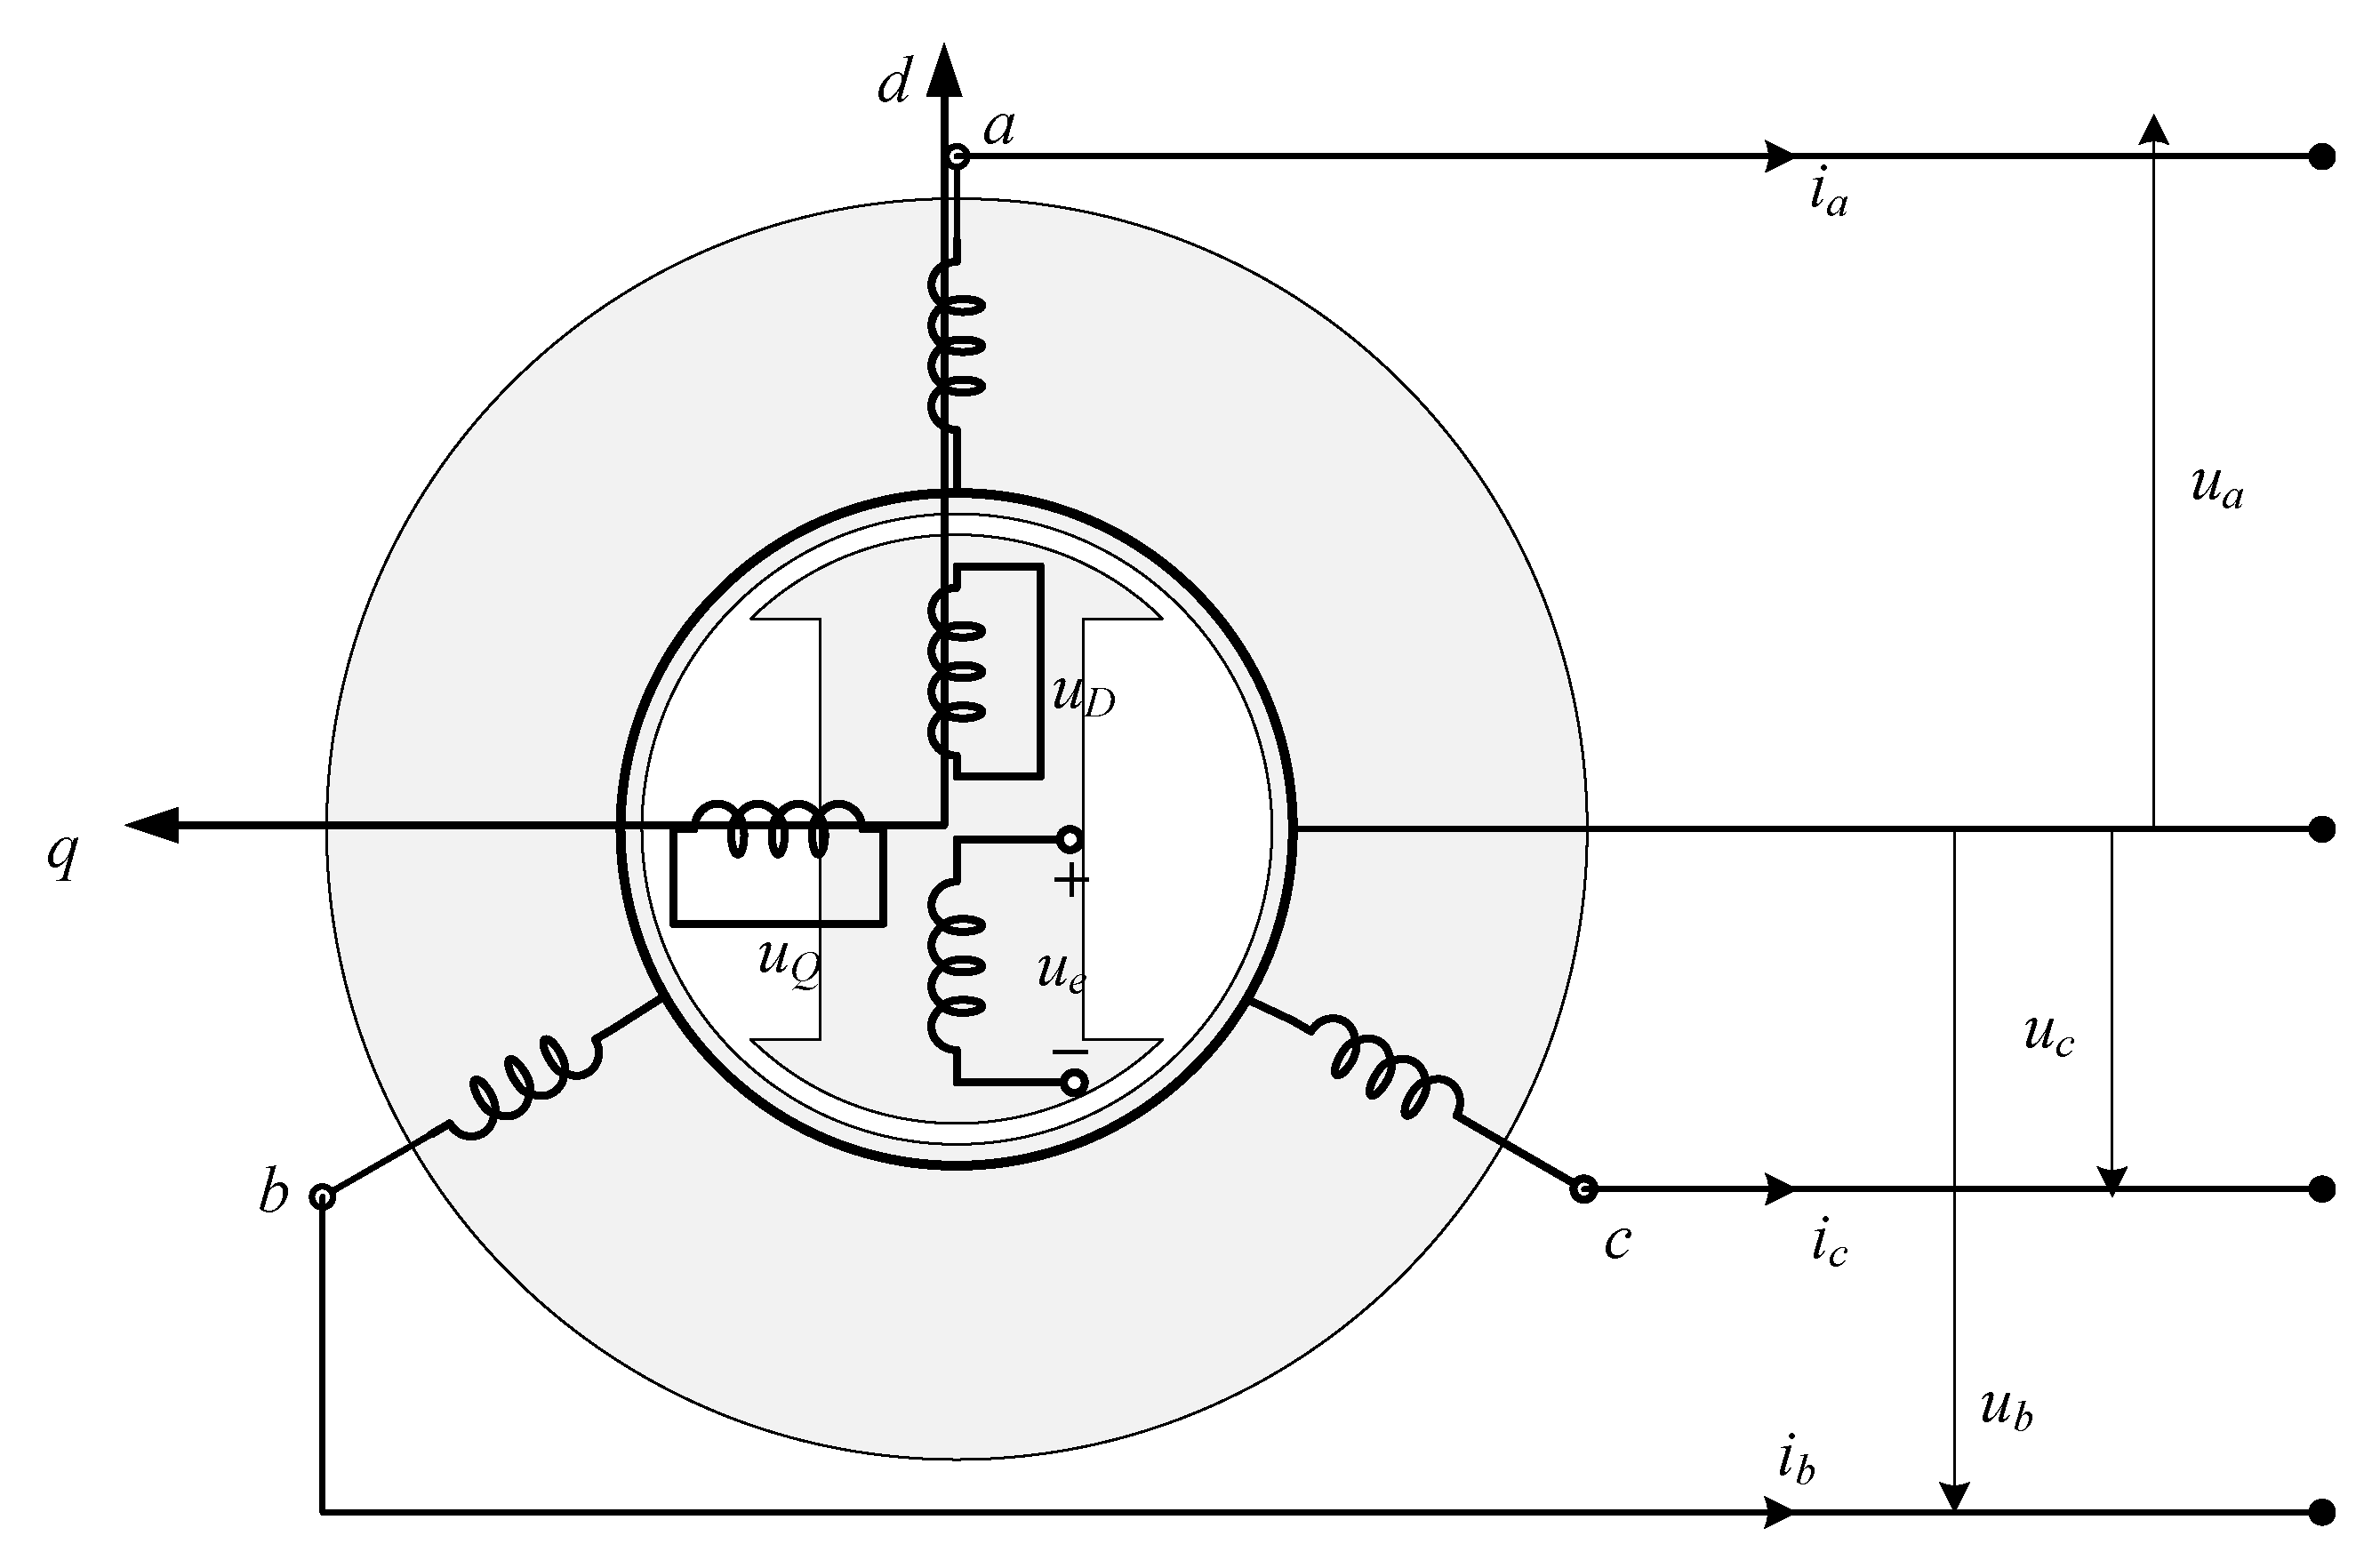
Figure 4.
Single-line diagram of the region of power system analysis.
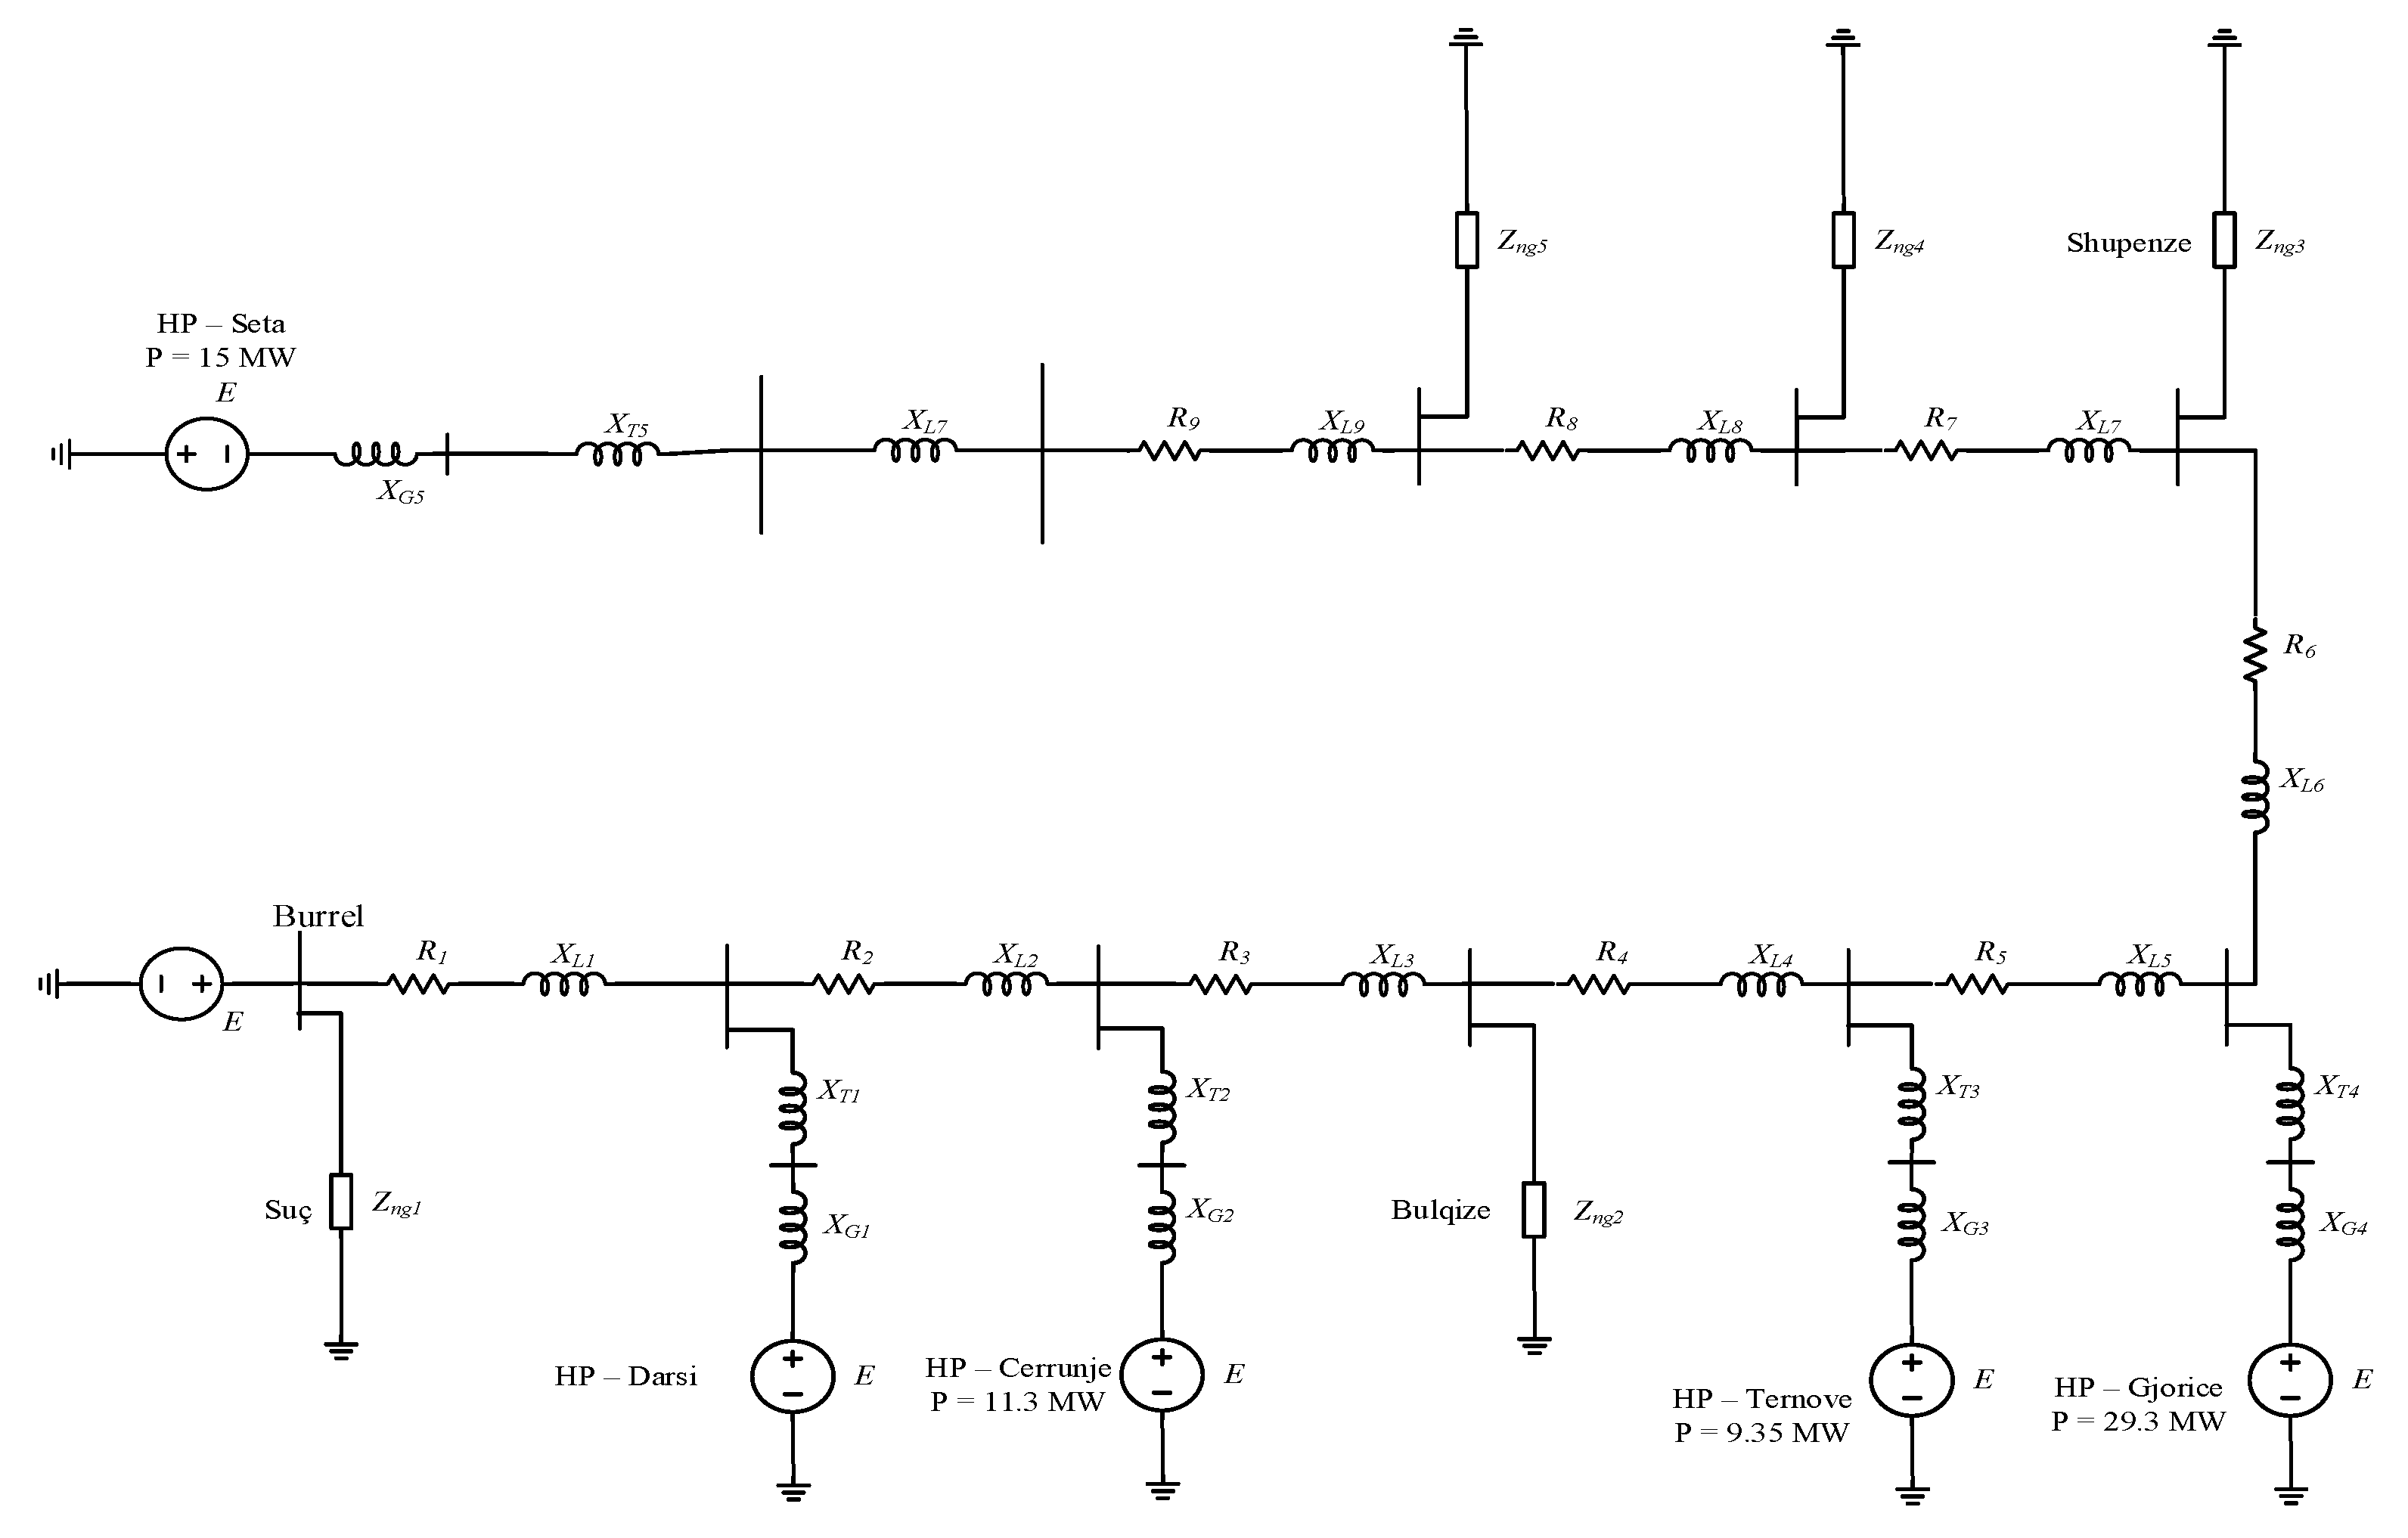
Figure 5.
The voltage profile of Seta bus bars monitoring for 24 h.
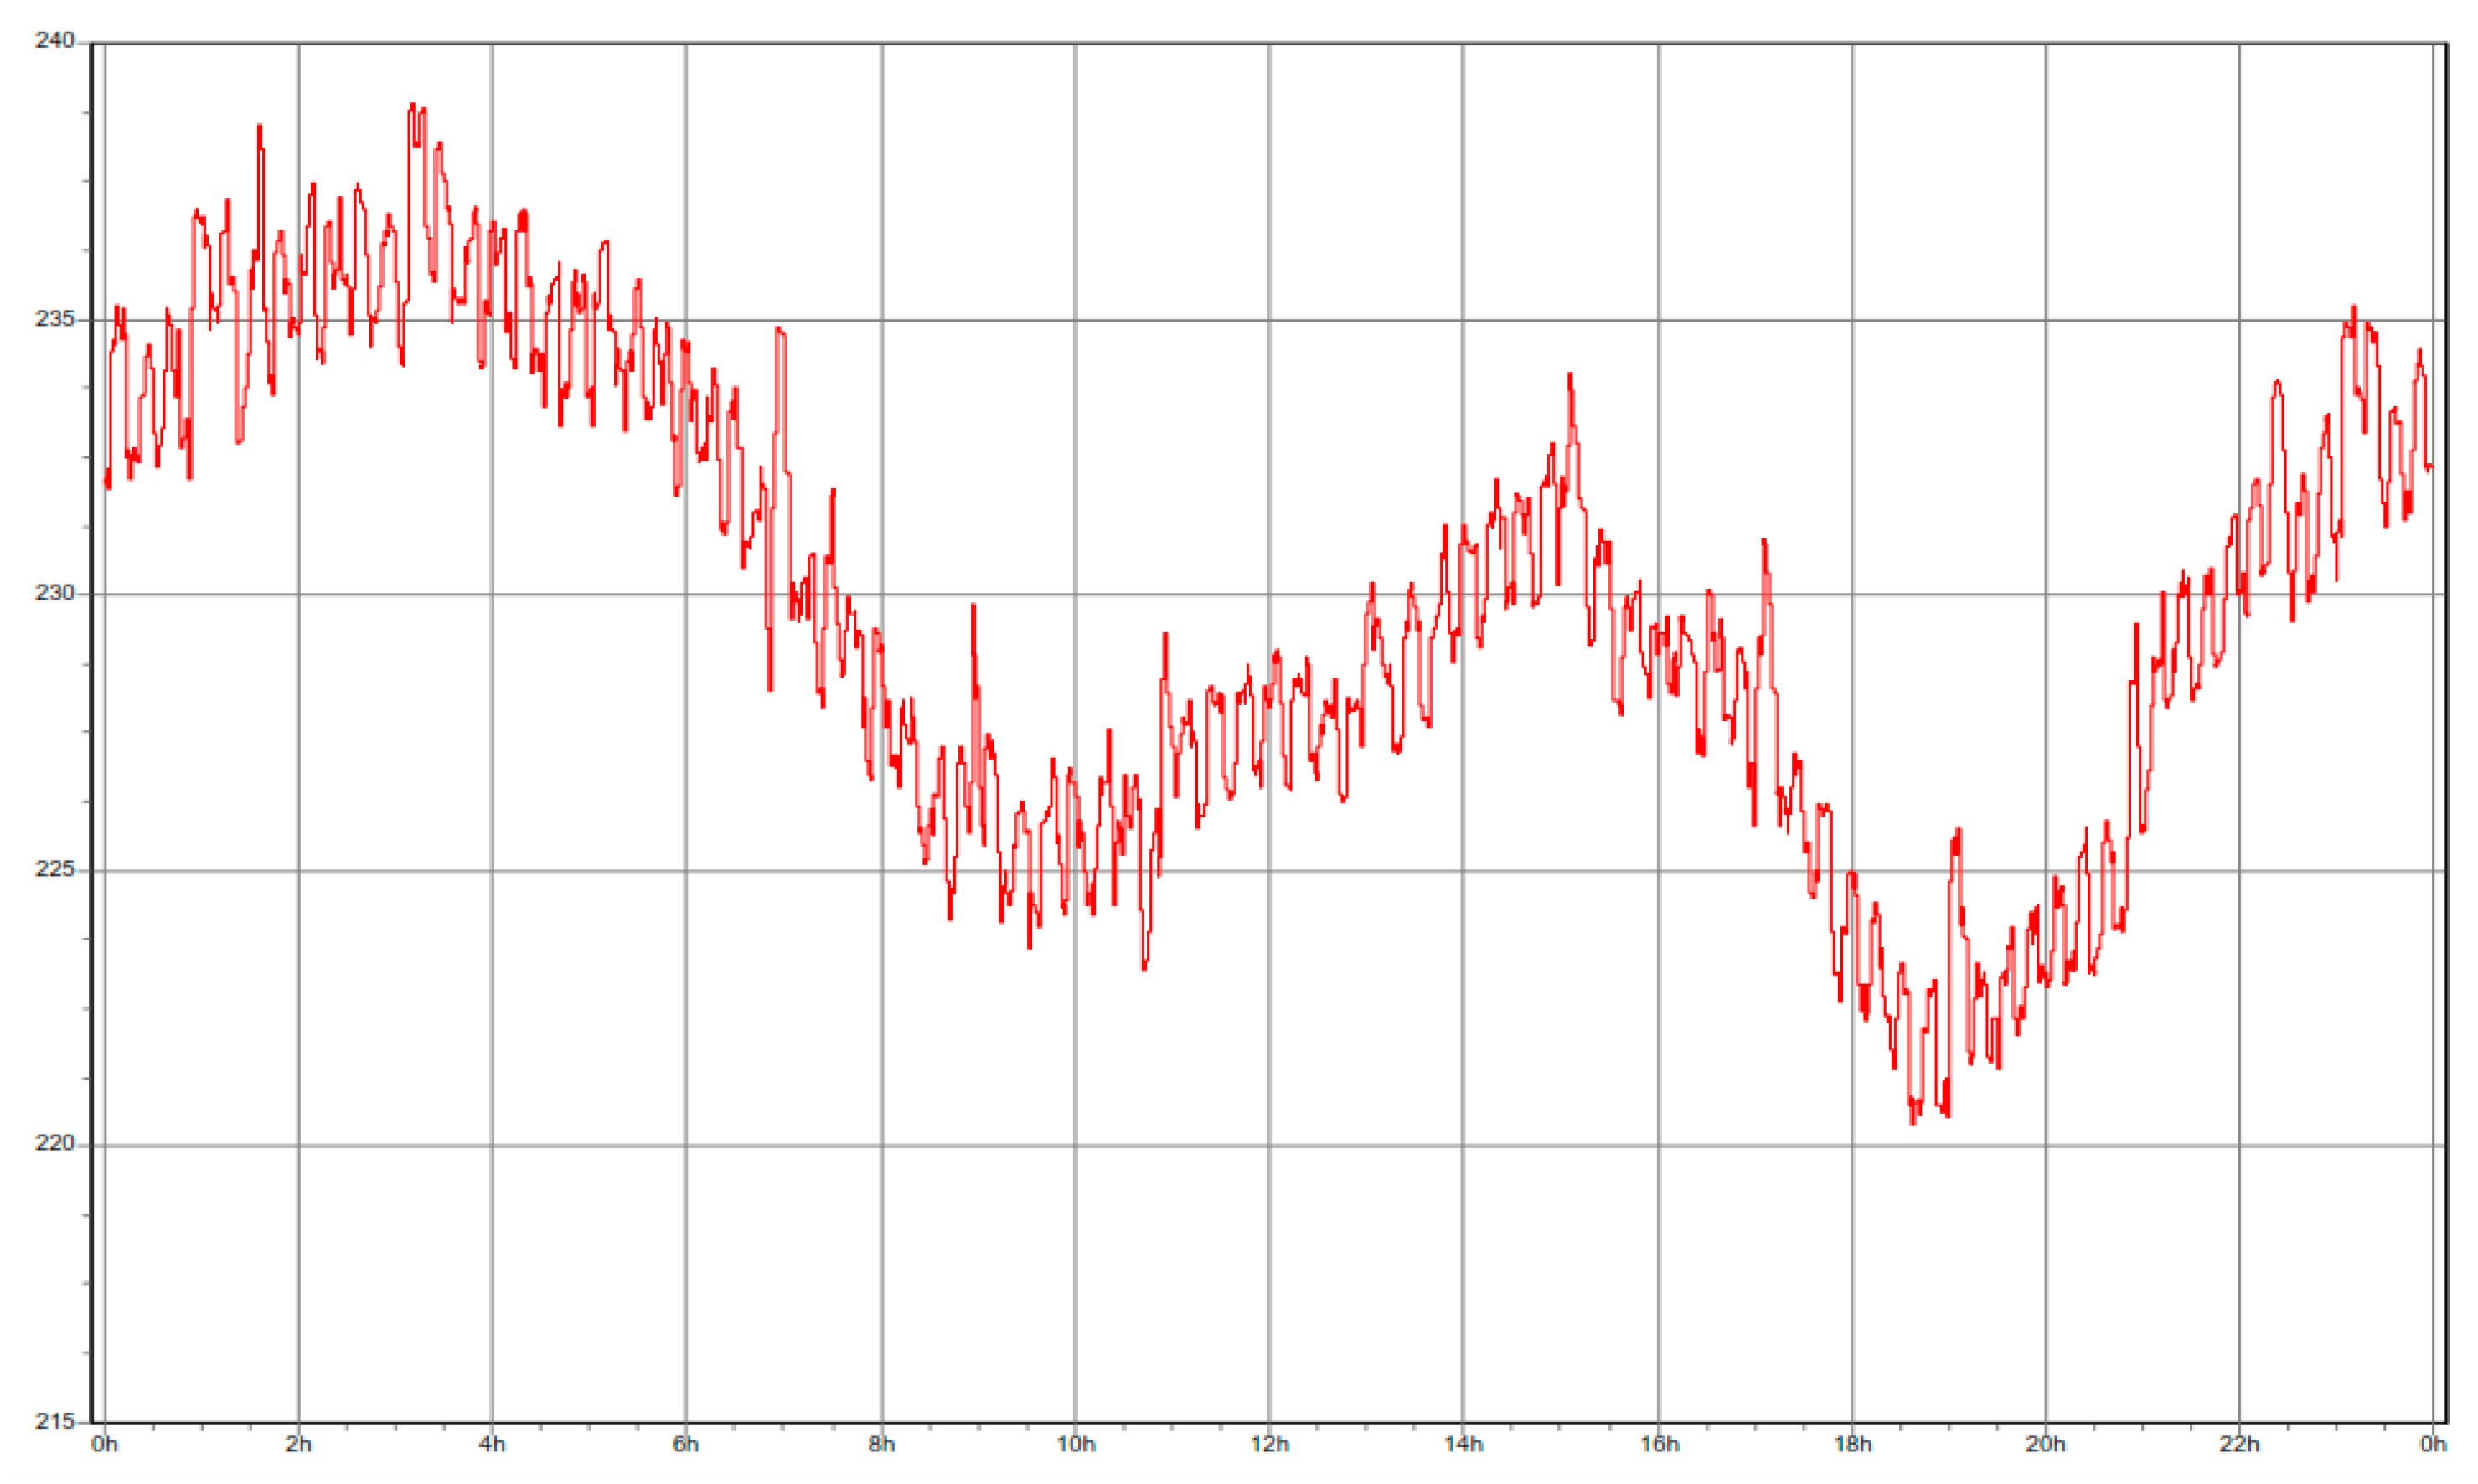
Figure 6.
(a)-rotor angle (b)-slip of synchronous generators under faults conditions.
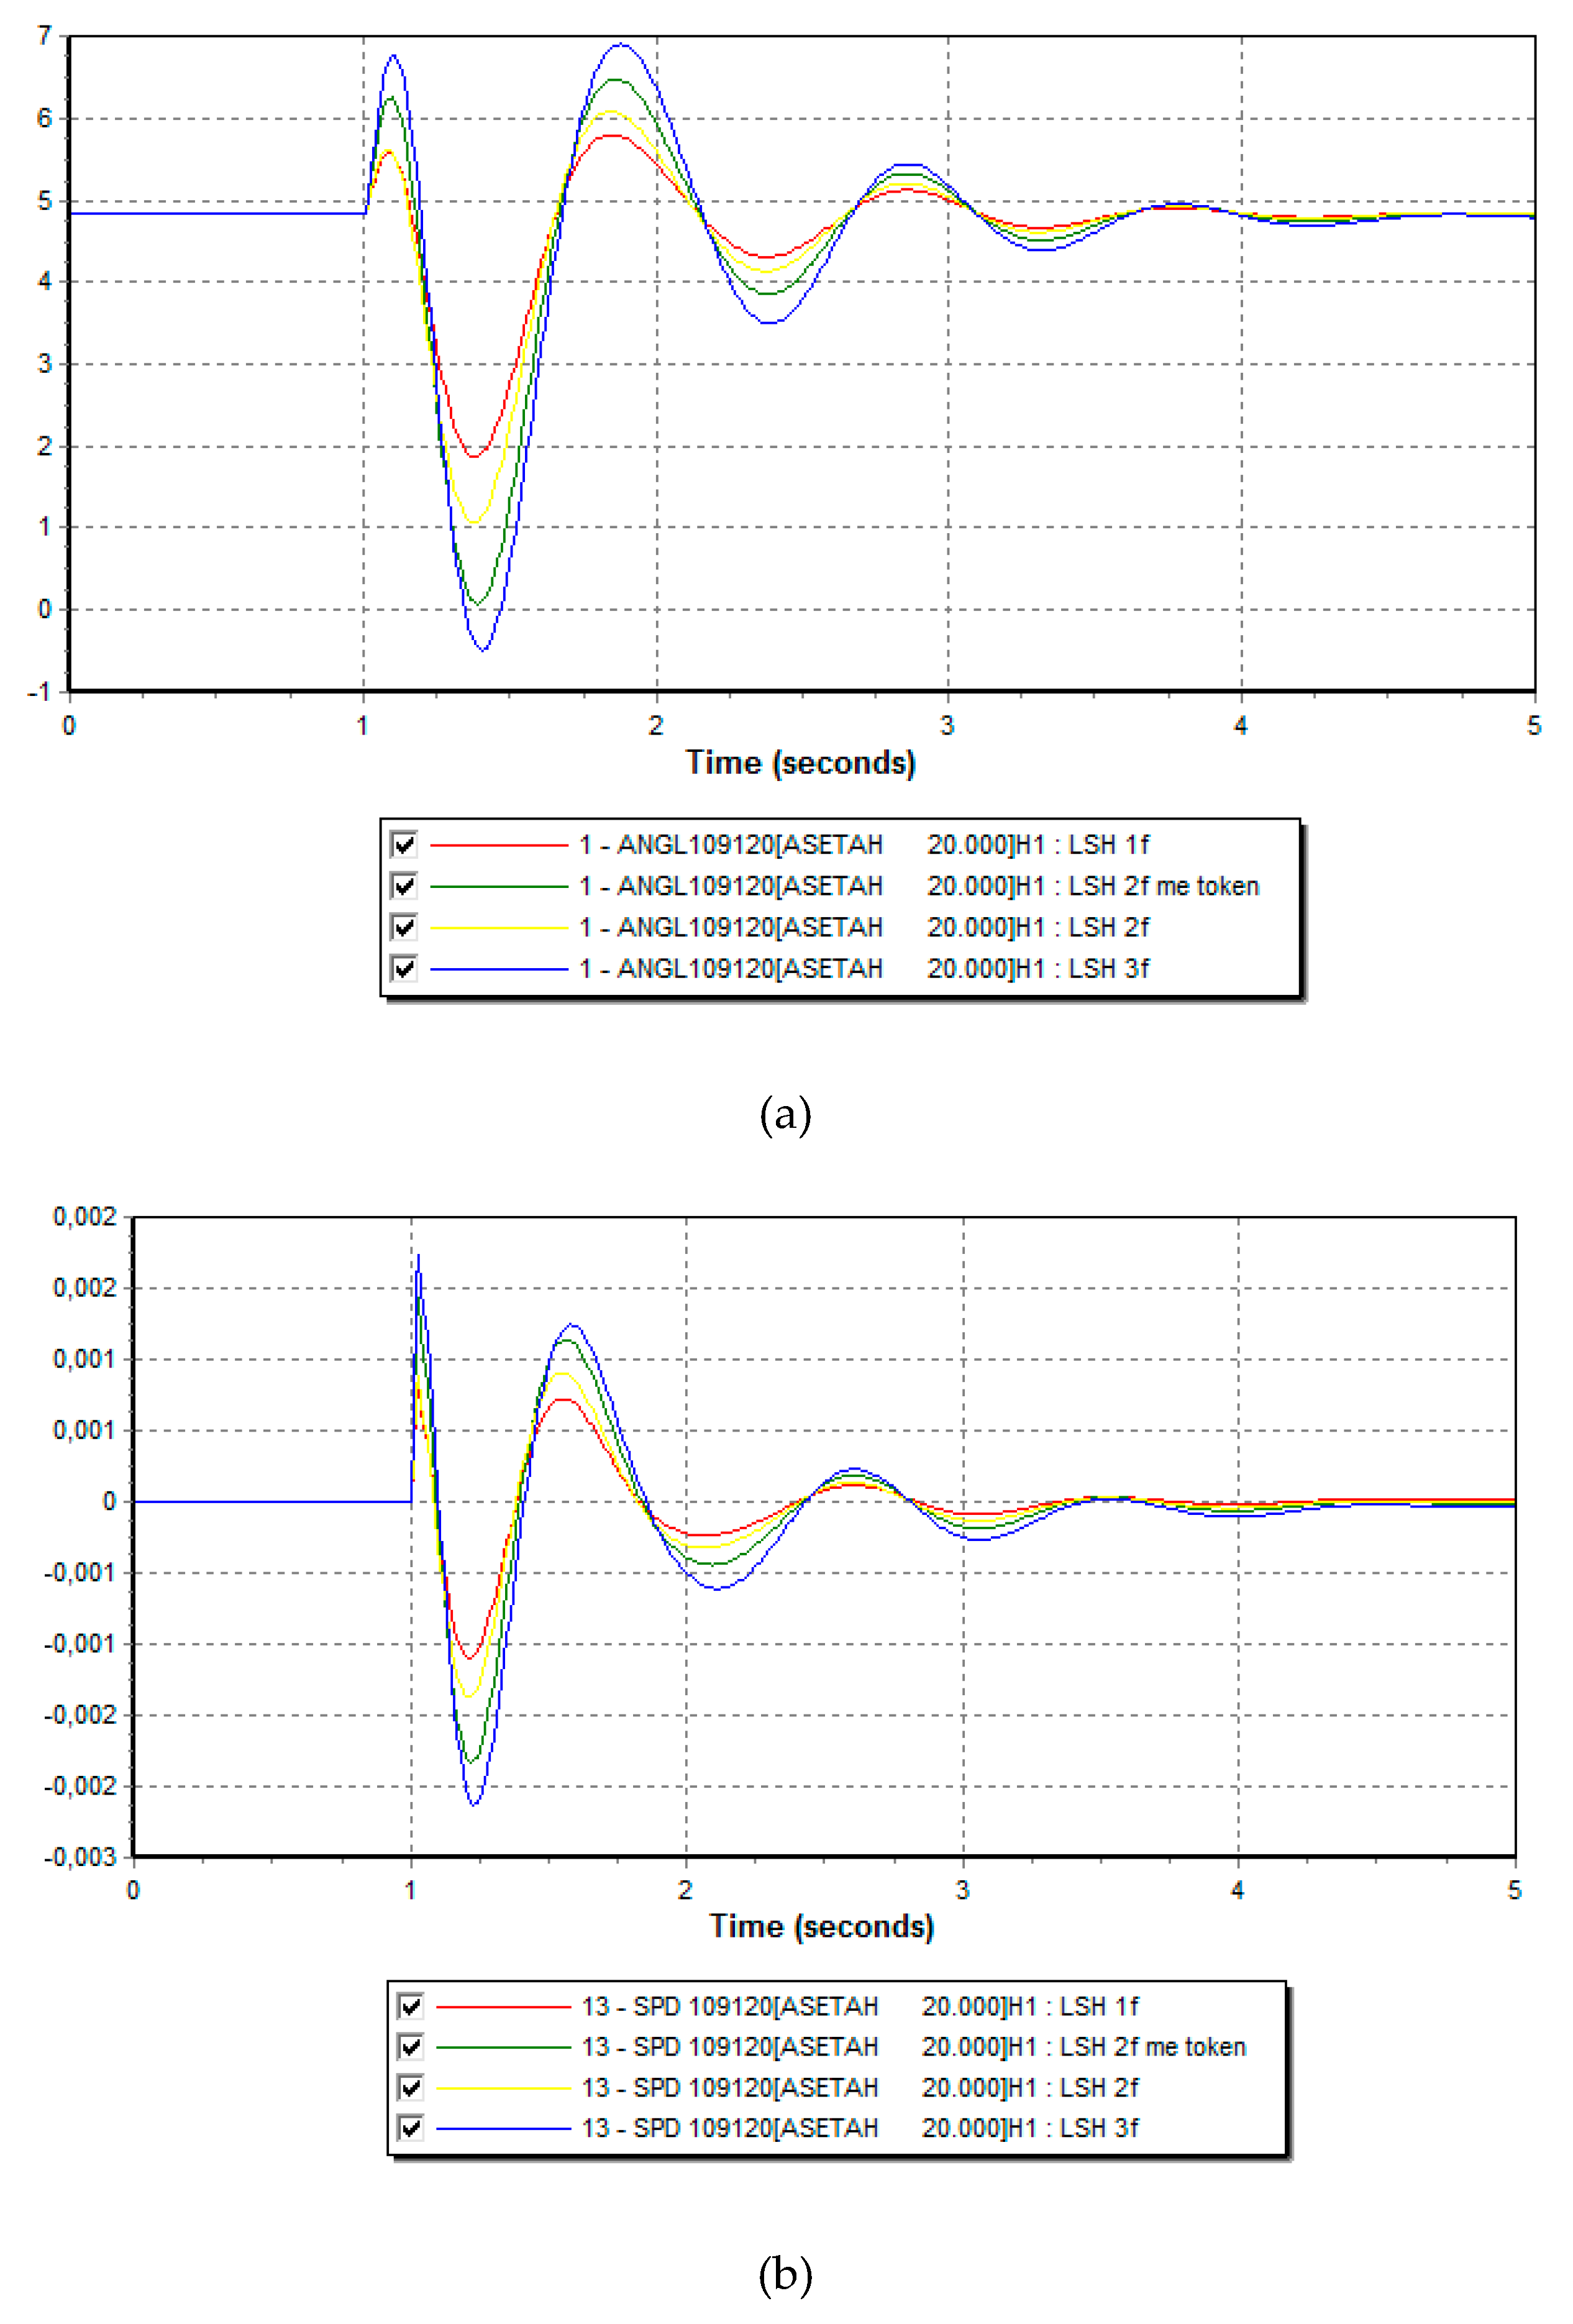
Figure 7.
(a)-Active power (b)-bus bars voltage profile under different faults.
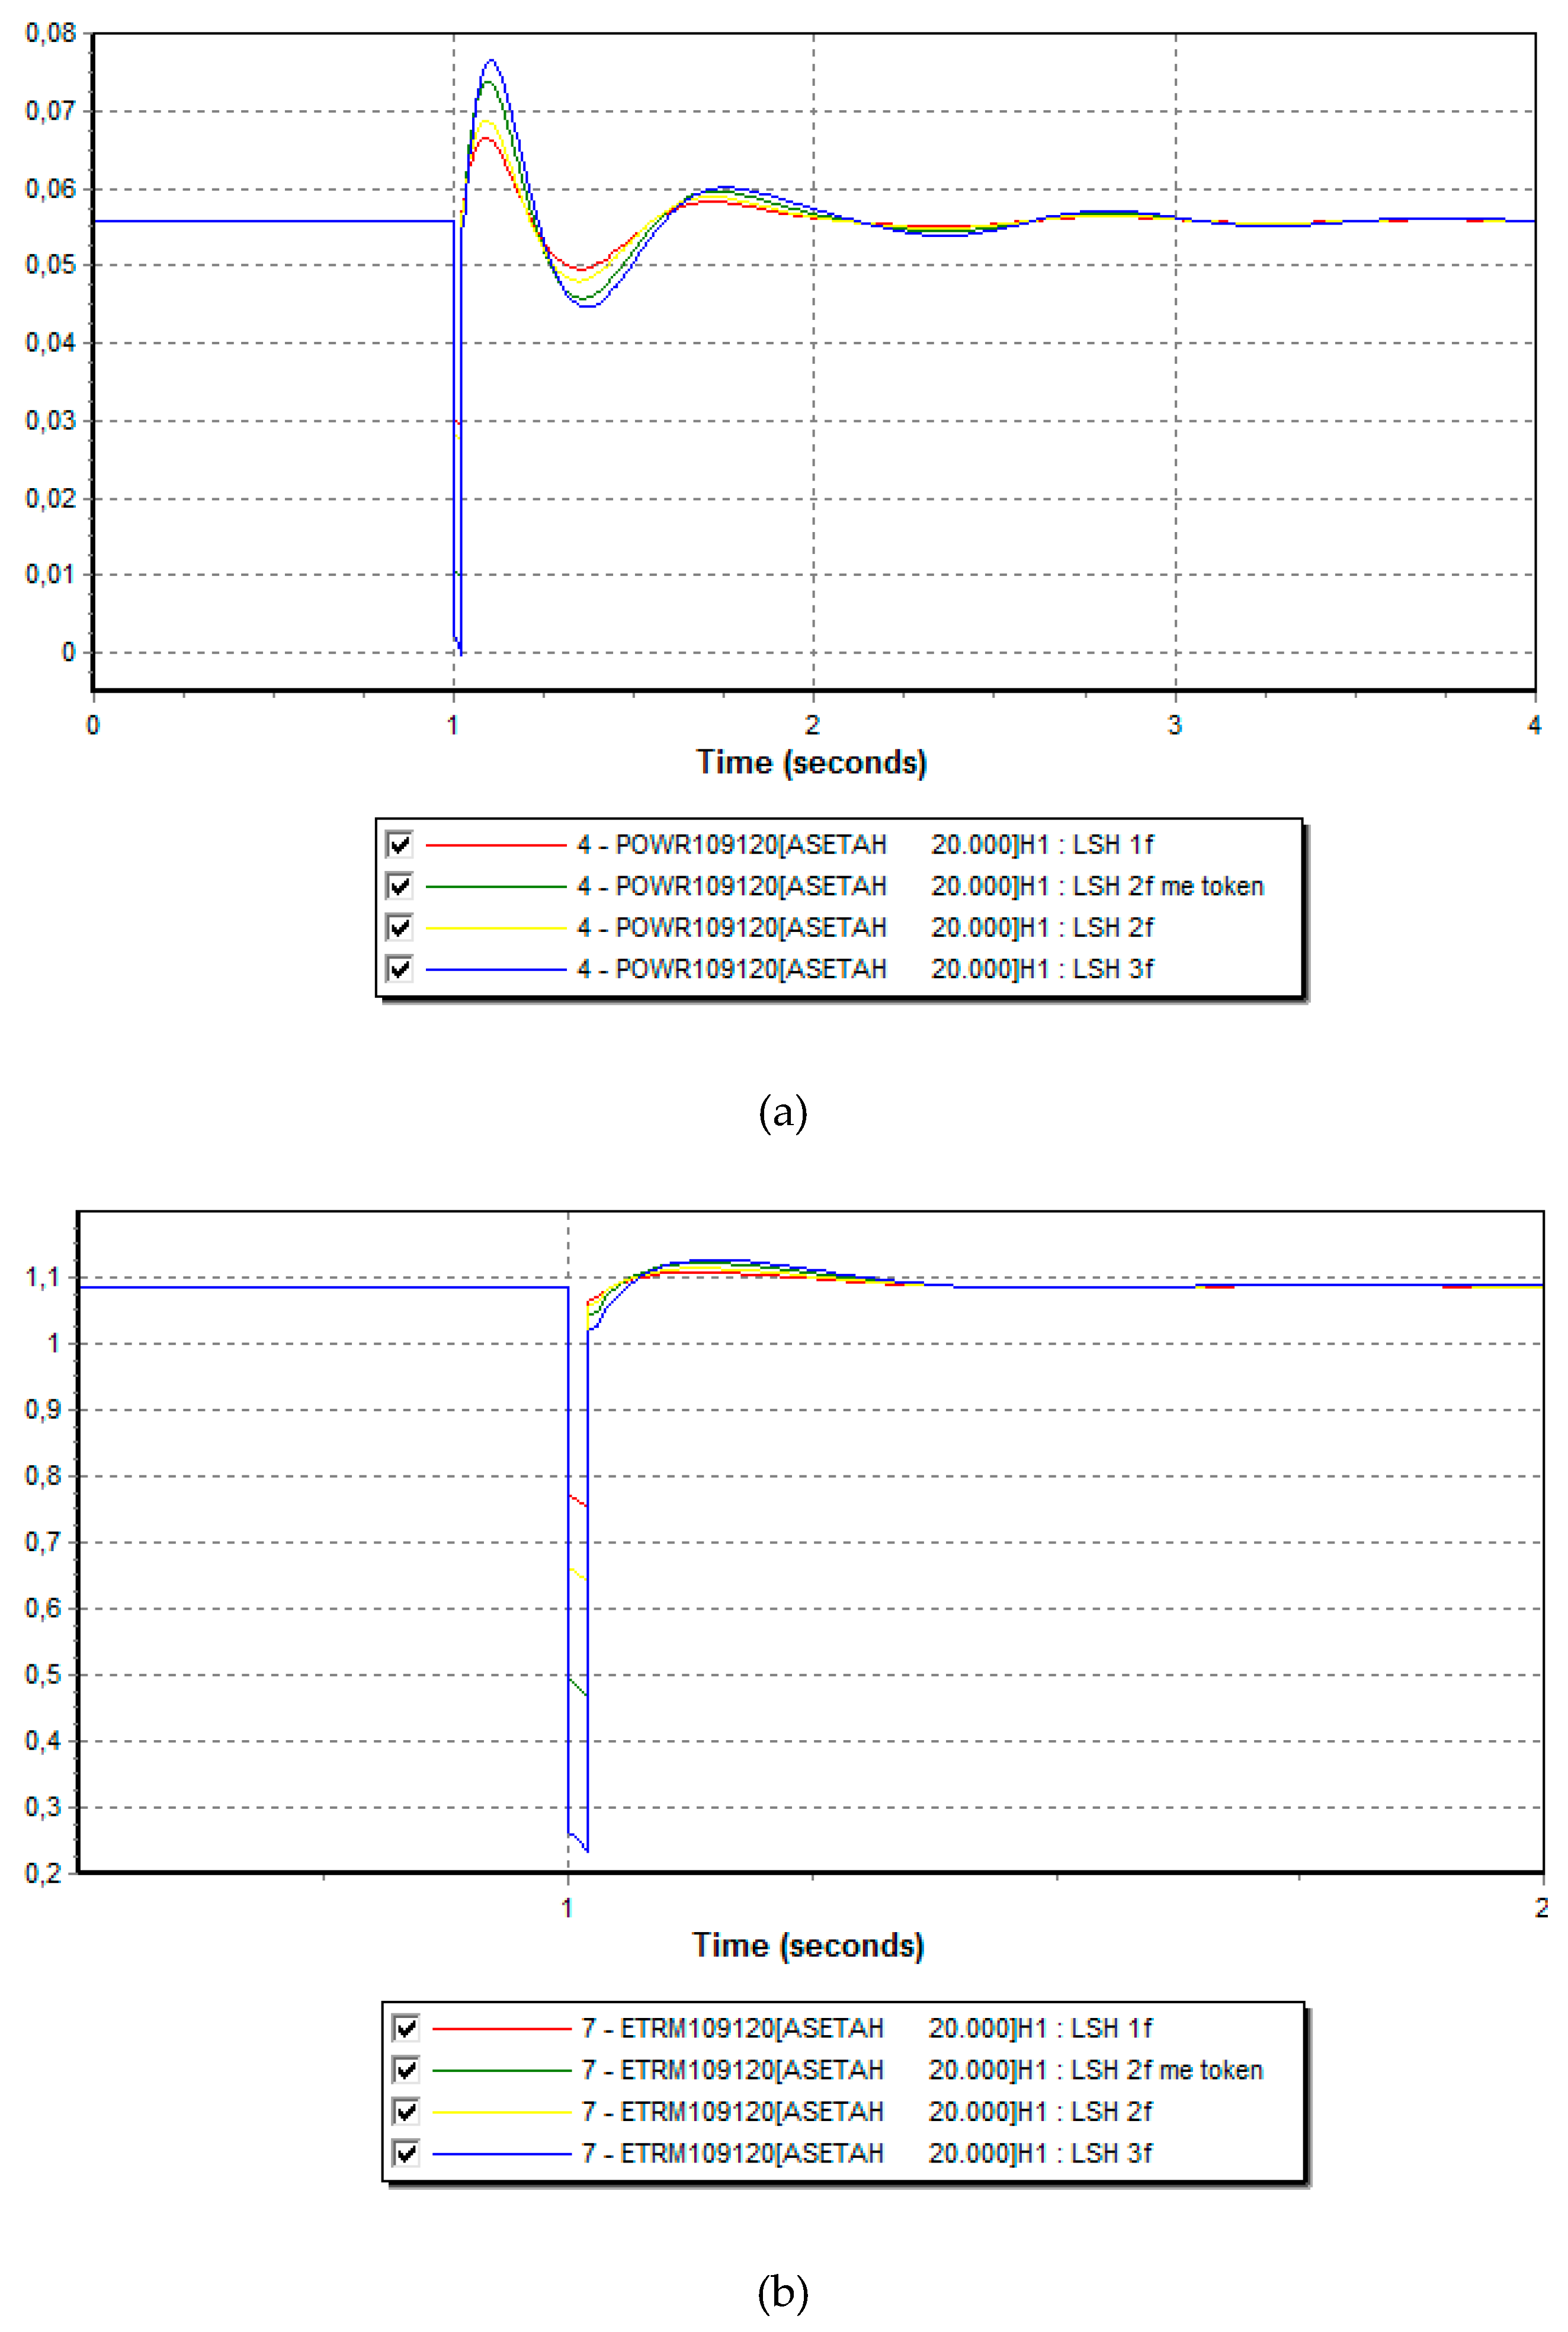
Figure 8.
(a) - Rotor angle (b) - bus voltage profile under different clearing times.
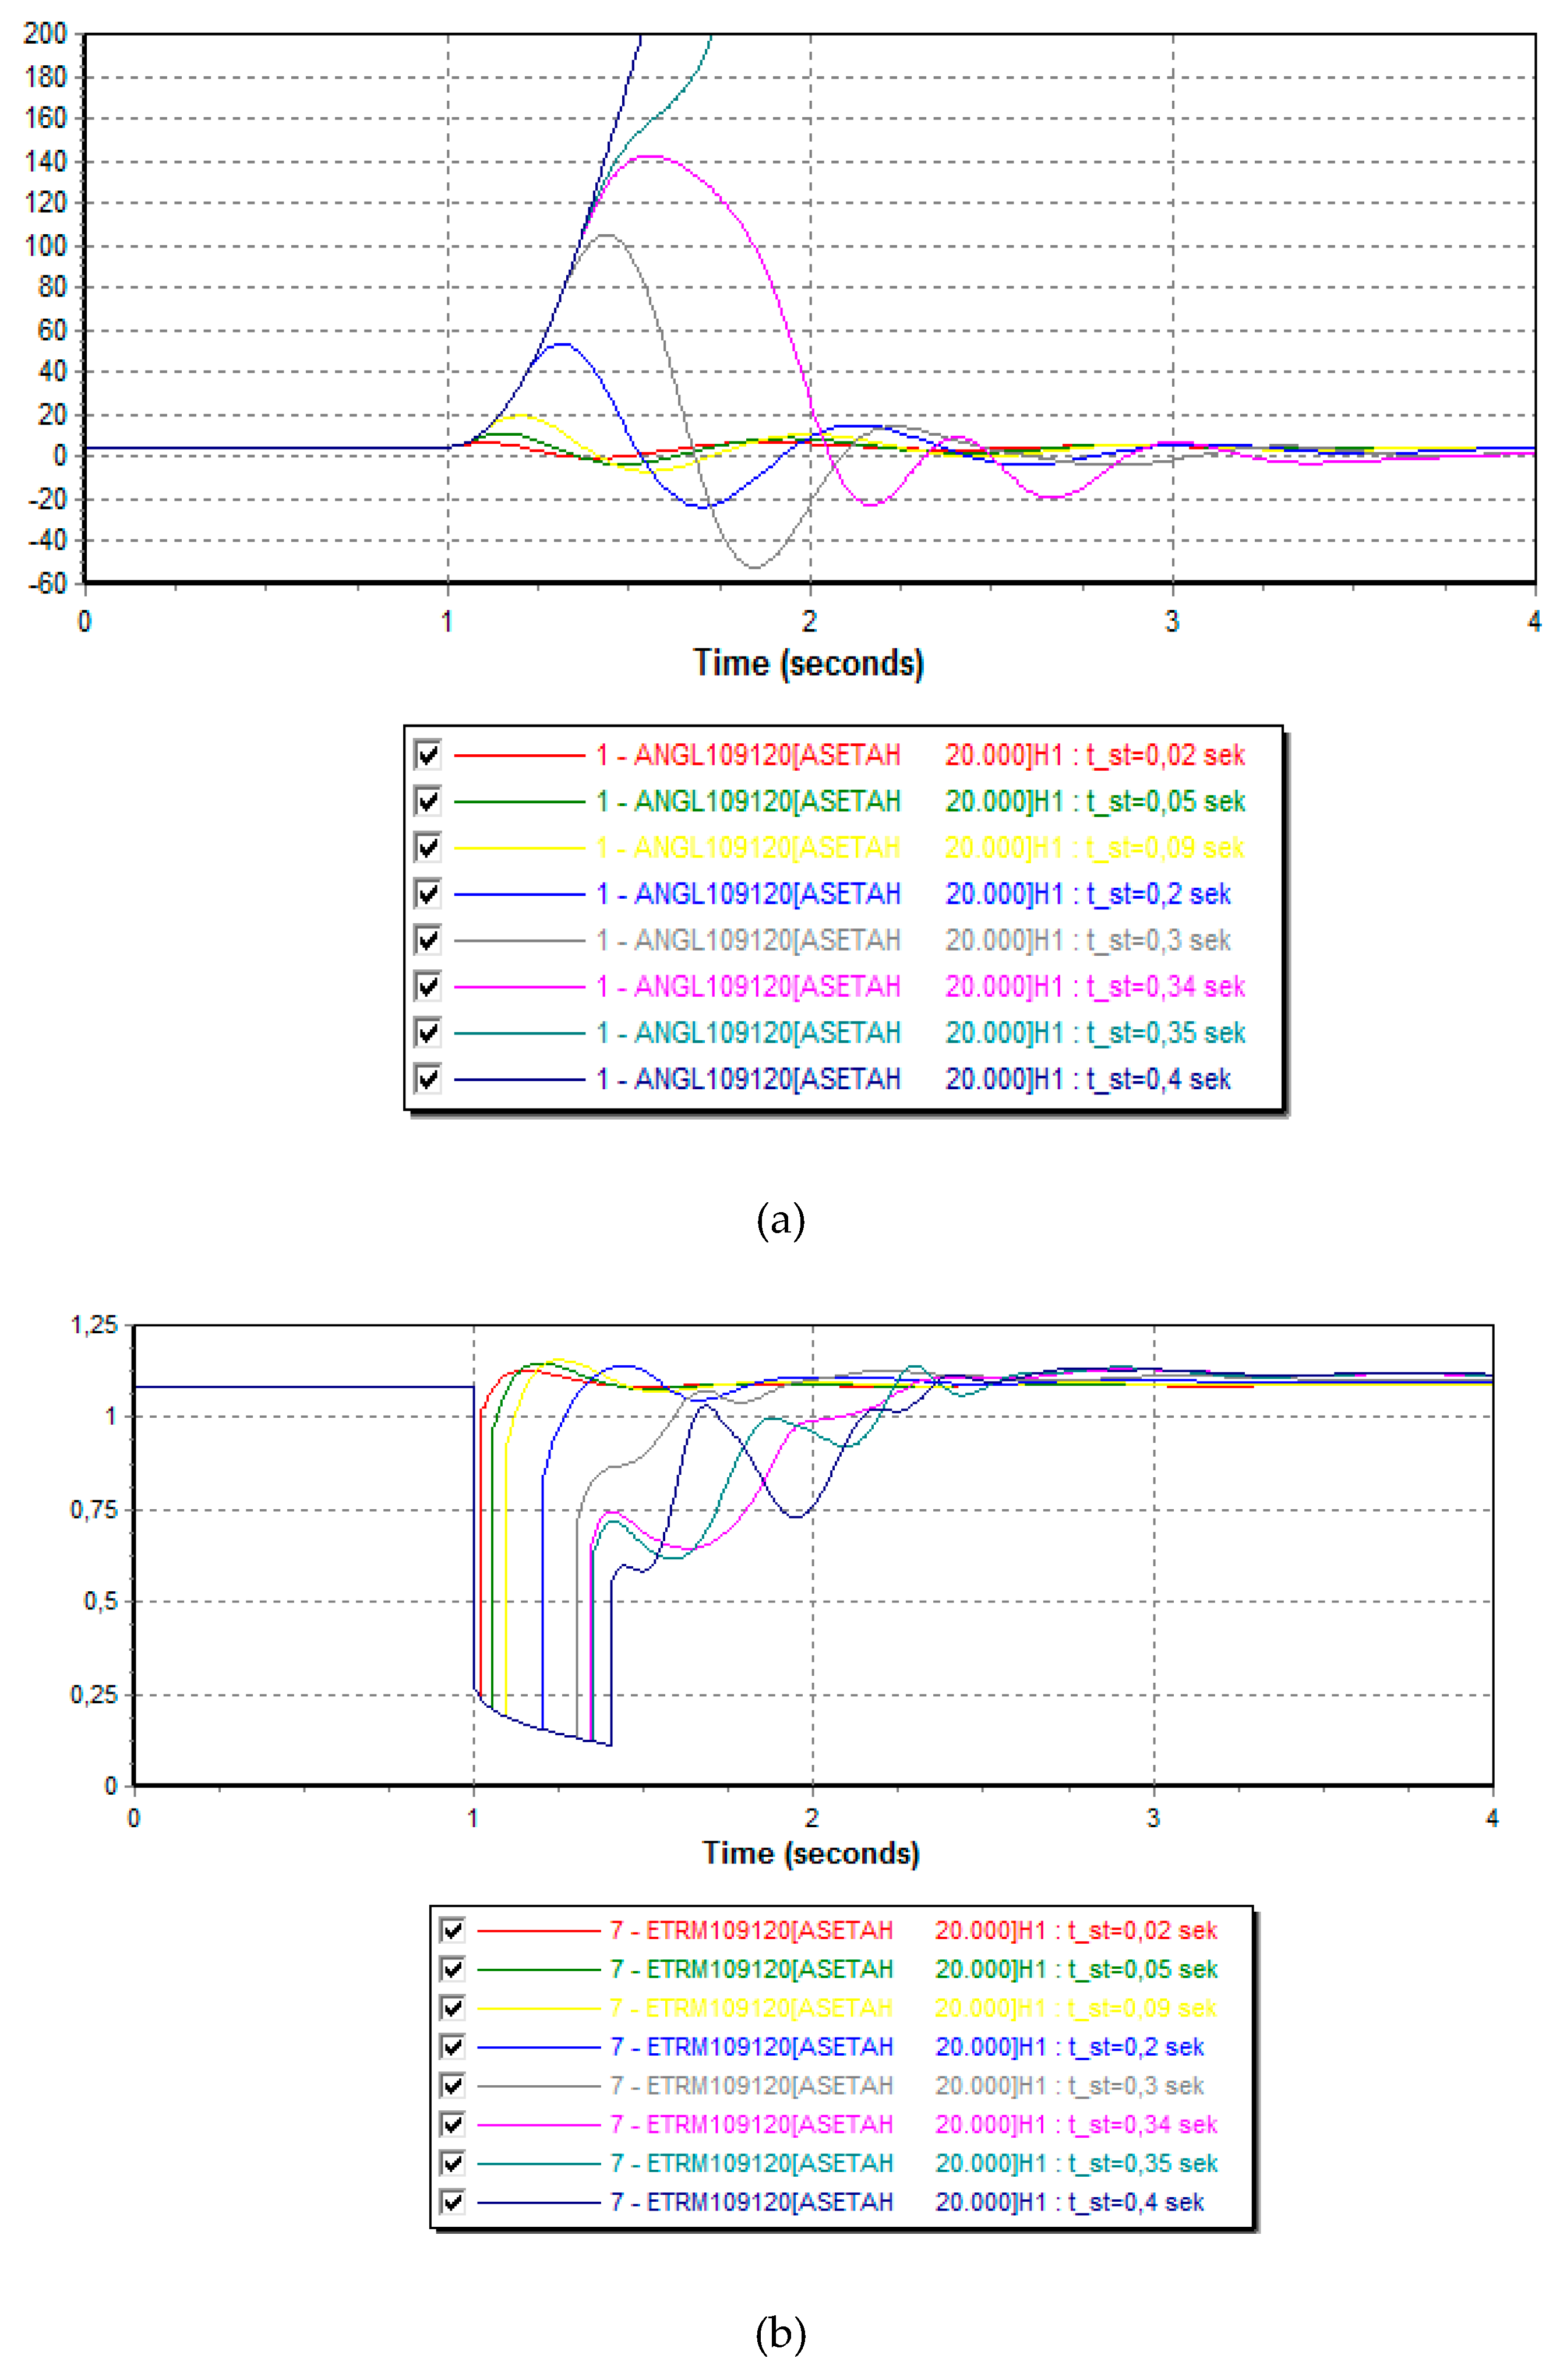
Figure 9.
(a) - rotor angle (b) slip of synchronous generator during fault
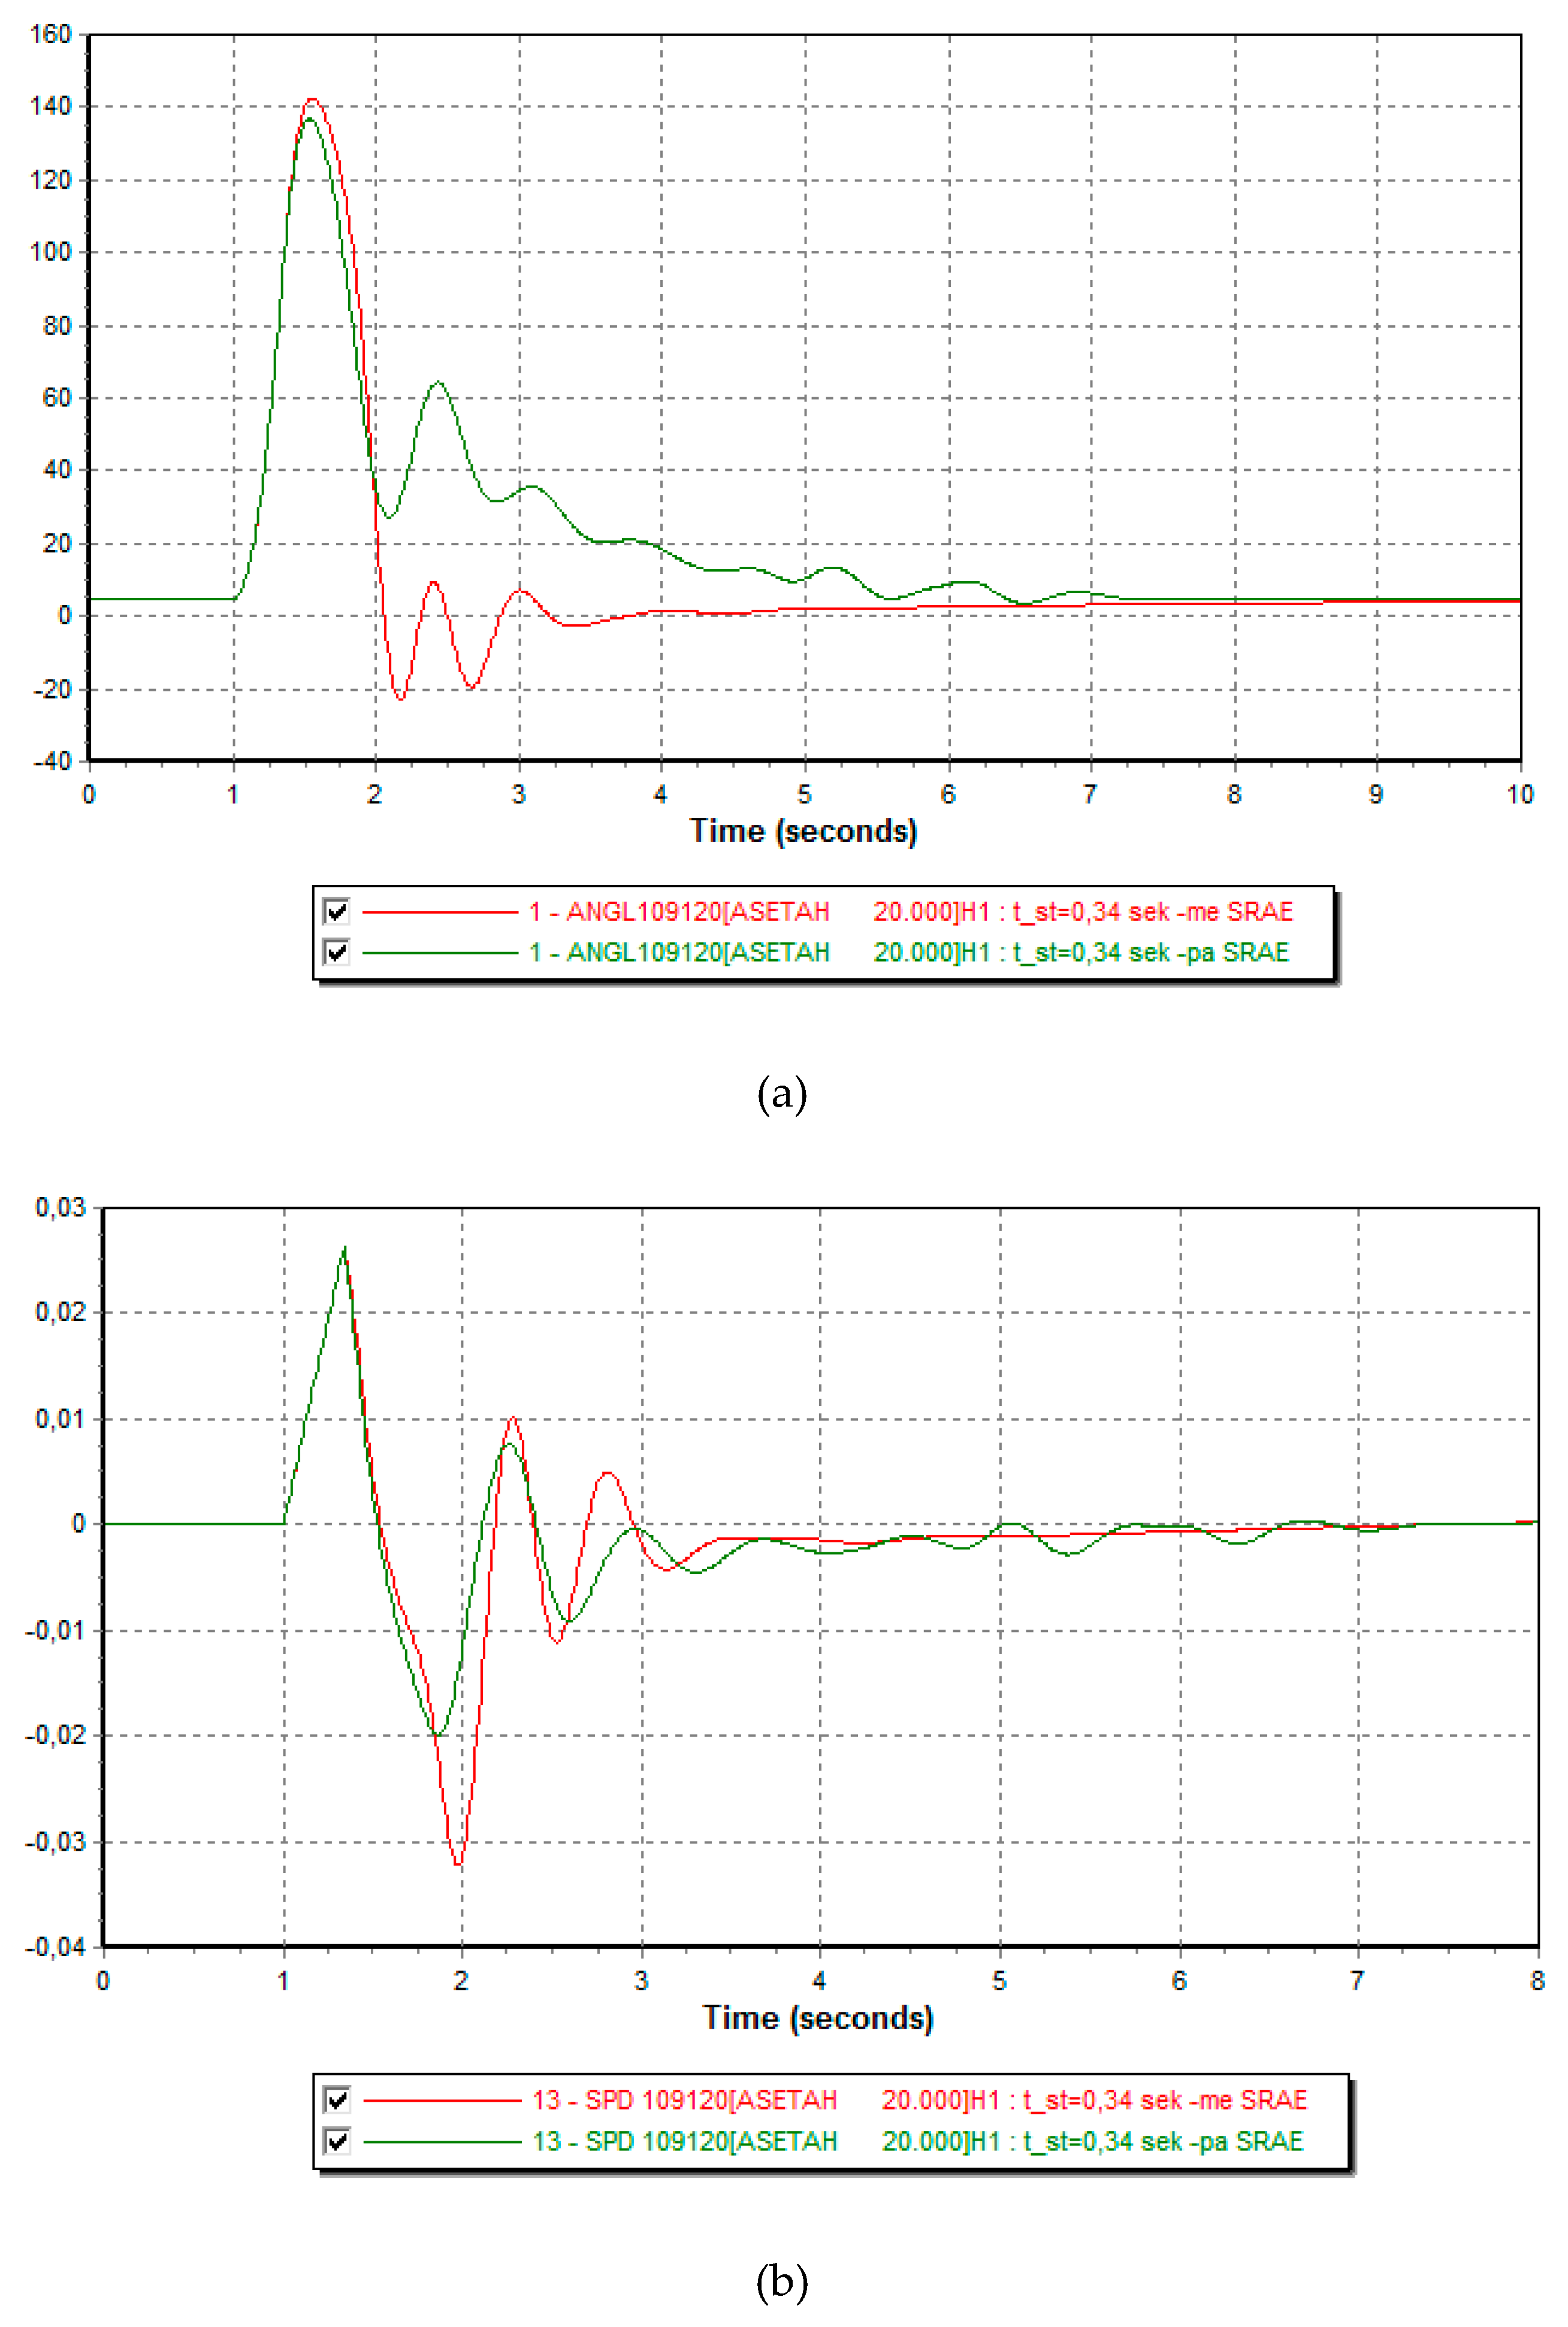
Figure 10.
(a) - active power (b) - bus voltage with a three-phase short-circuit fault.
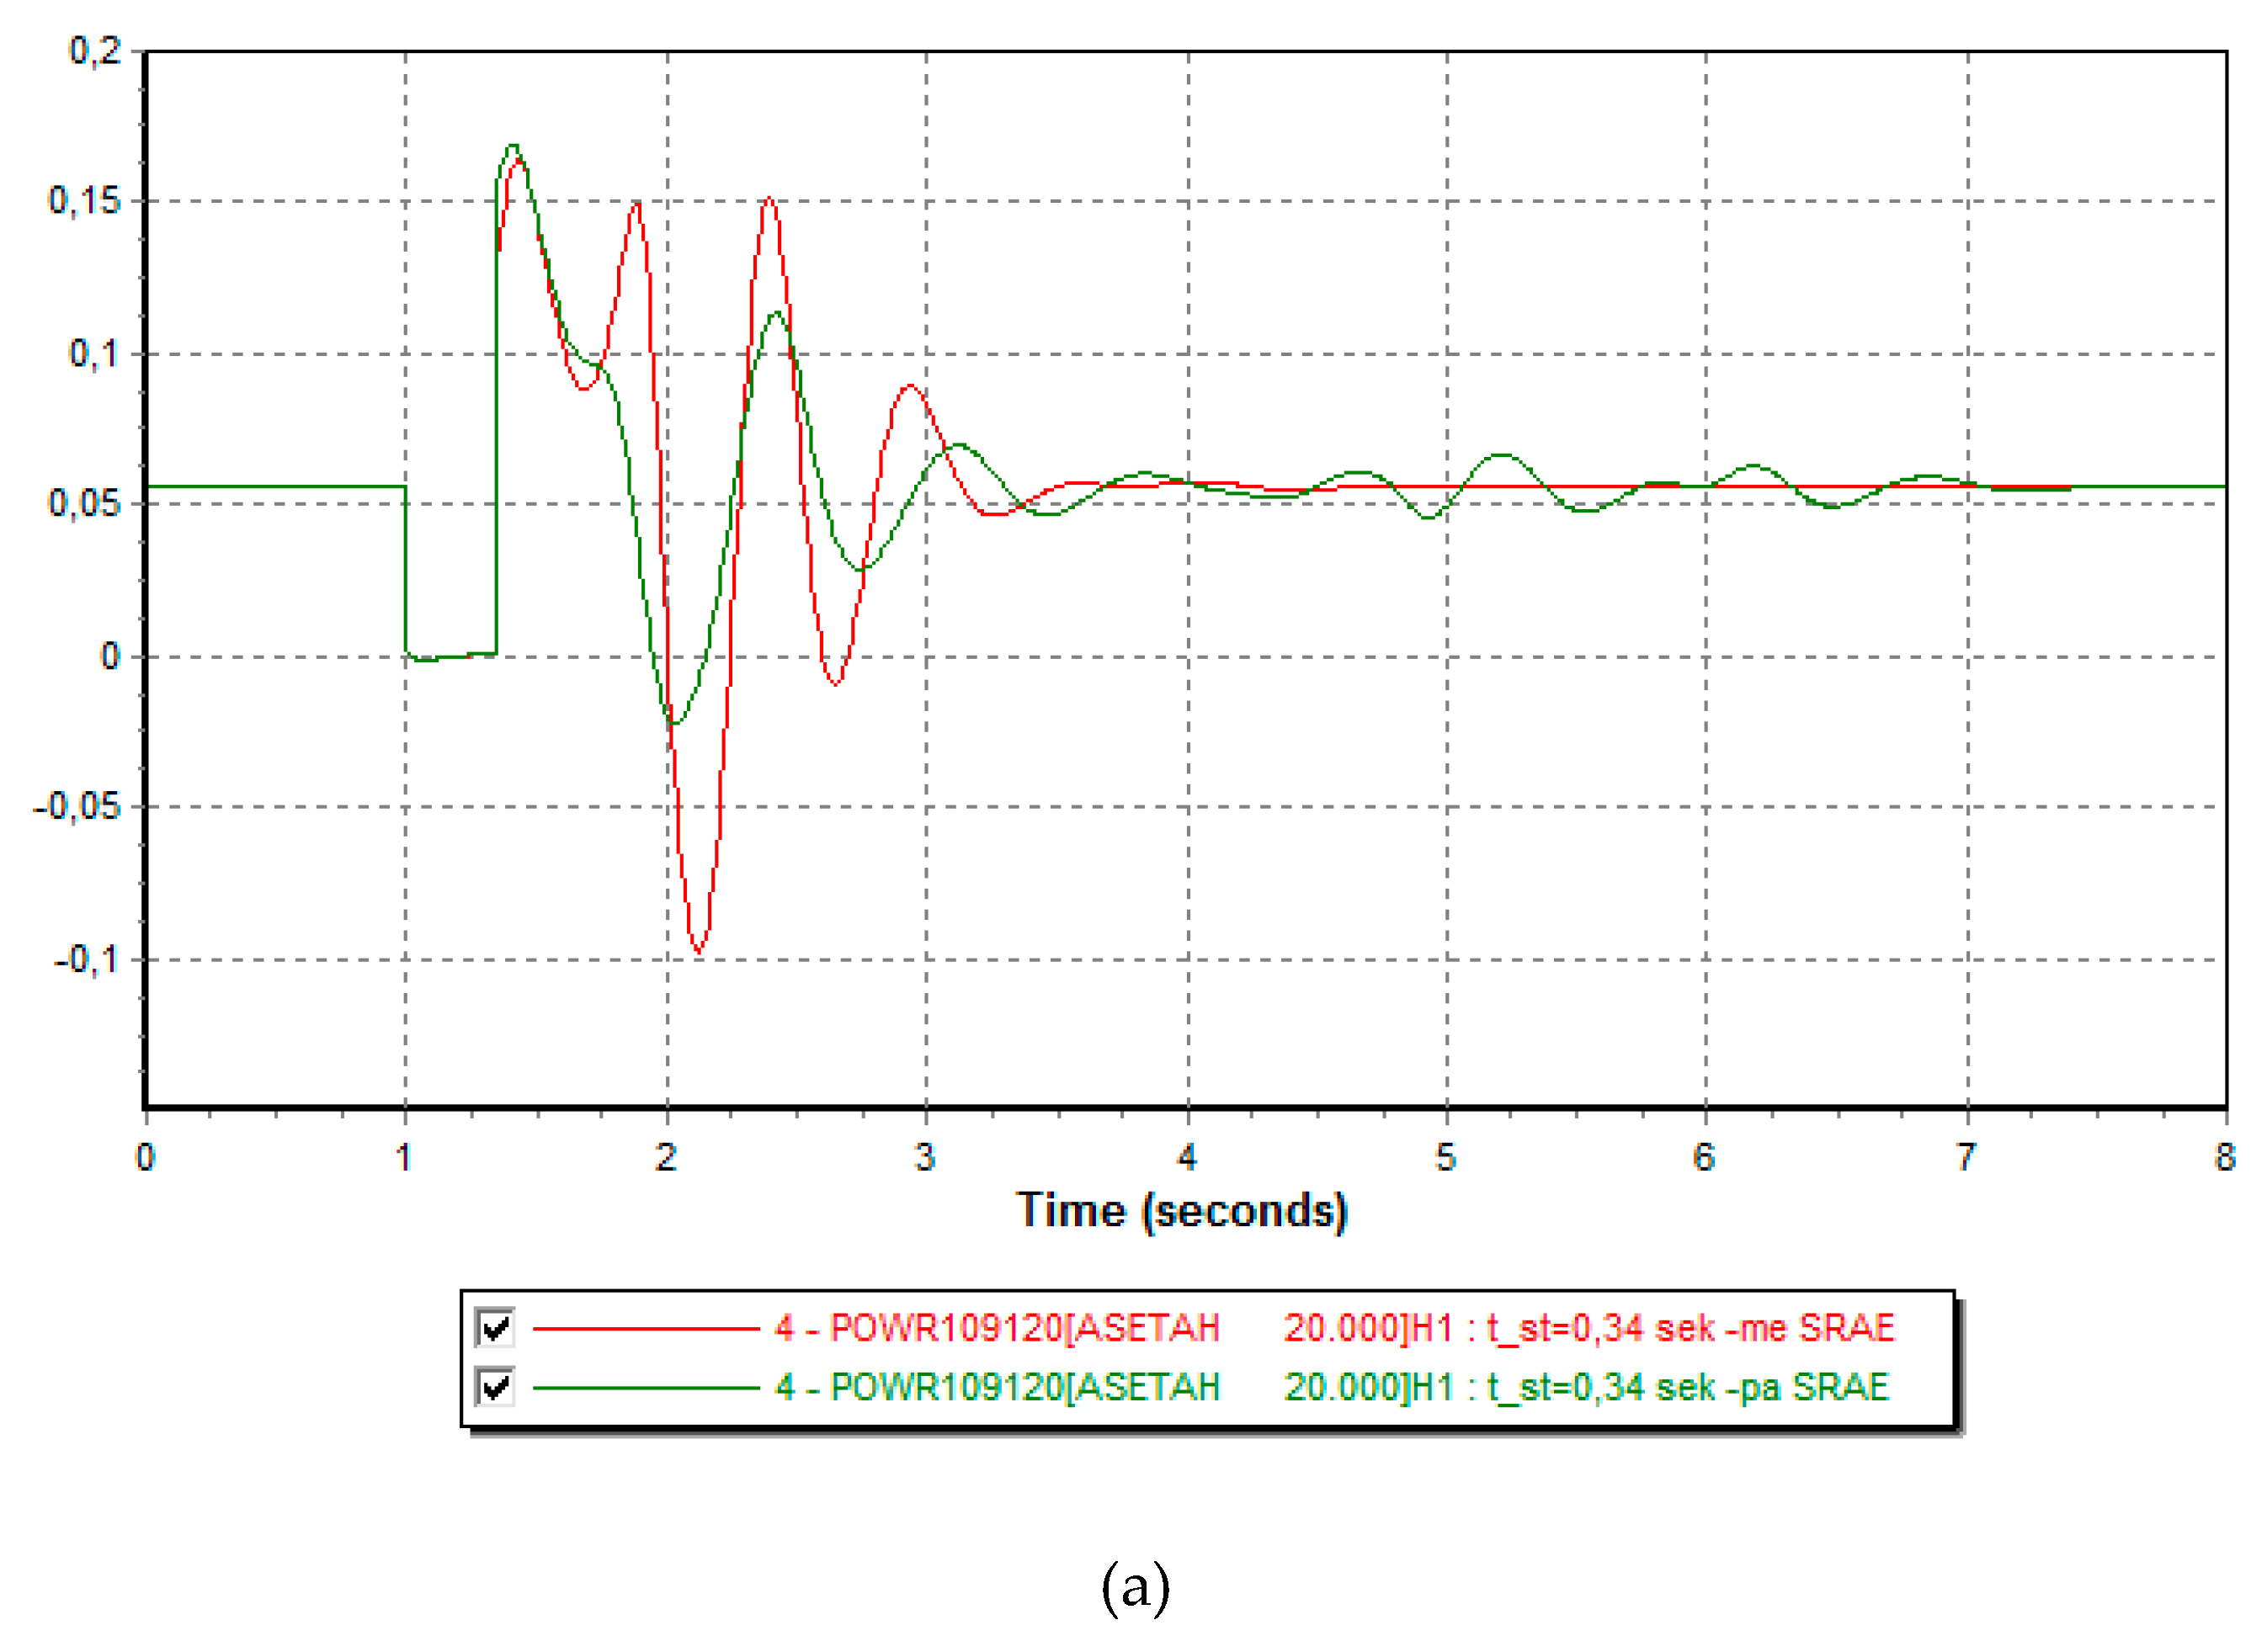
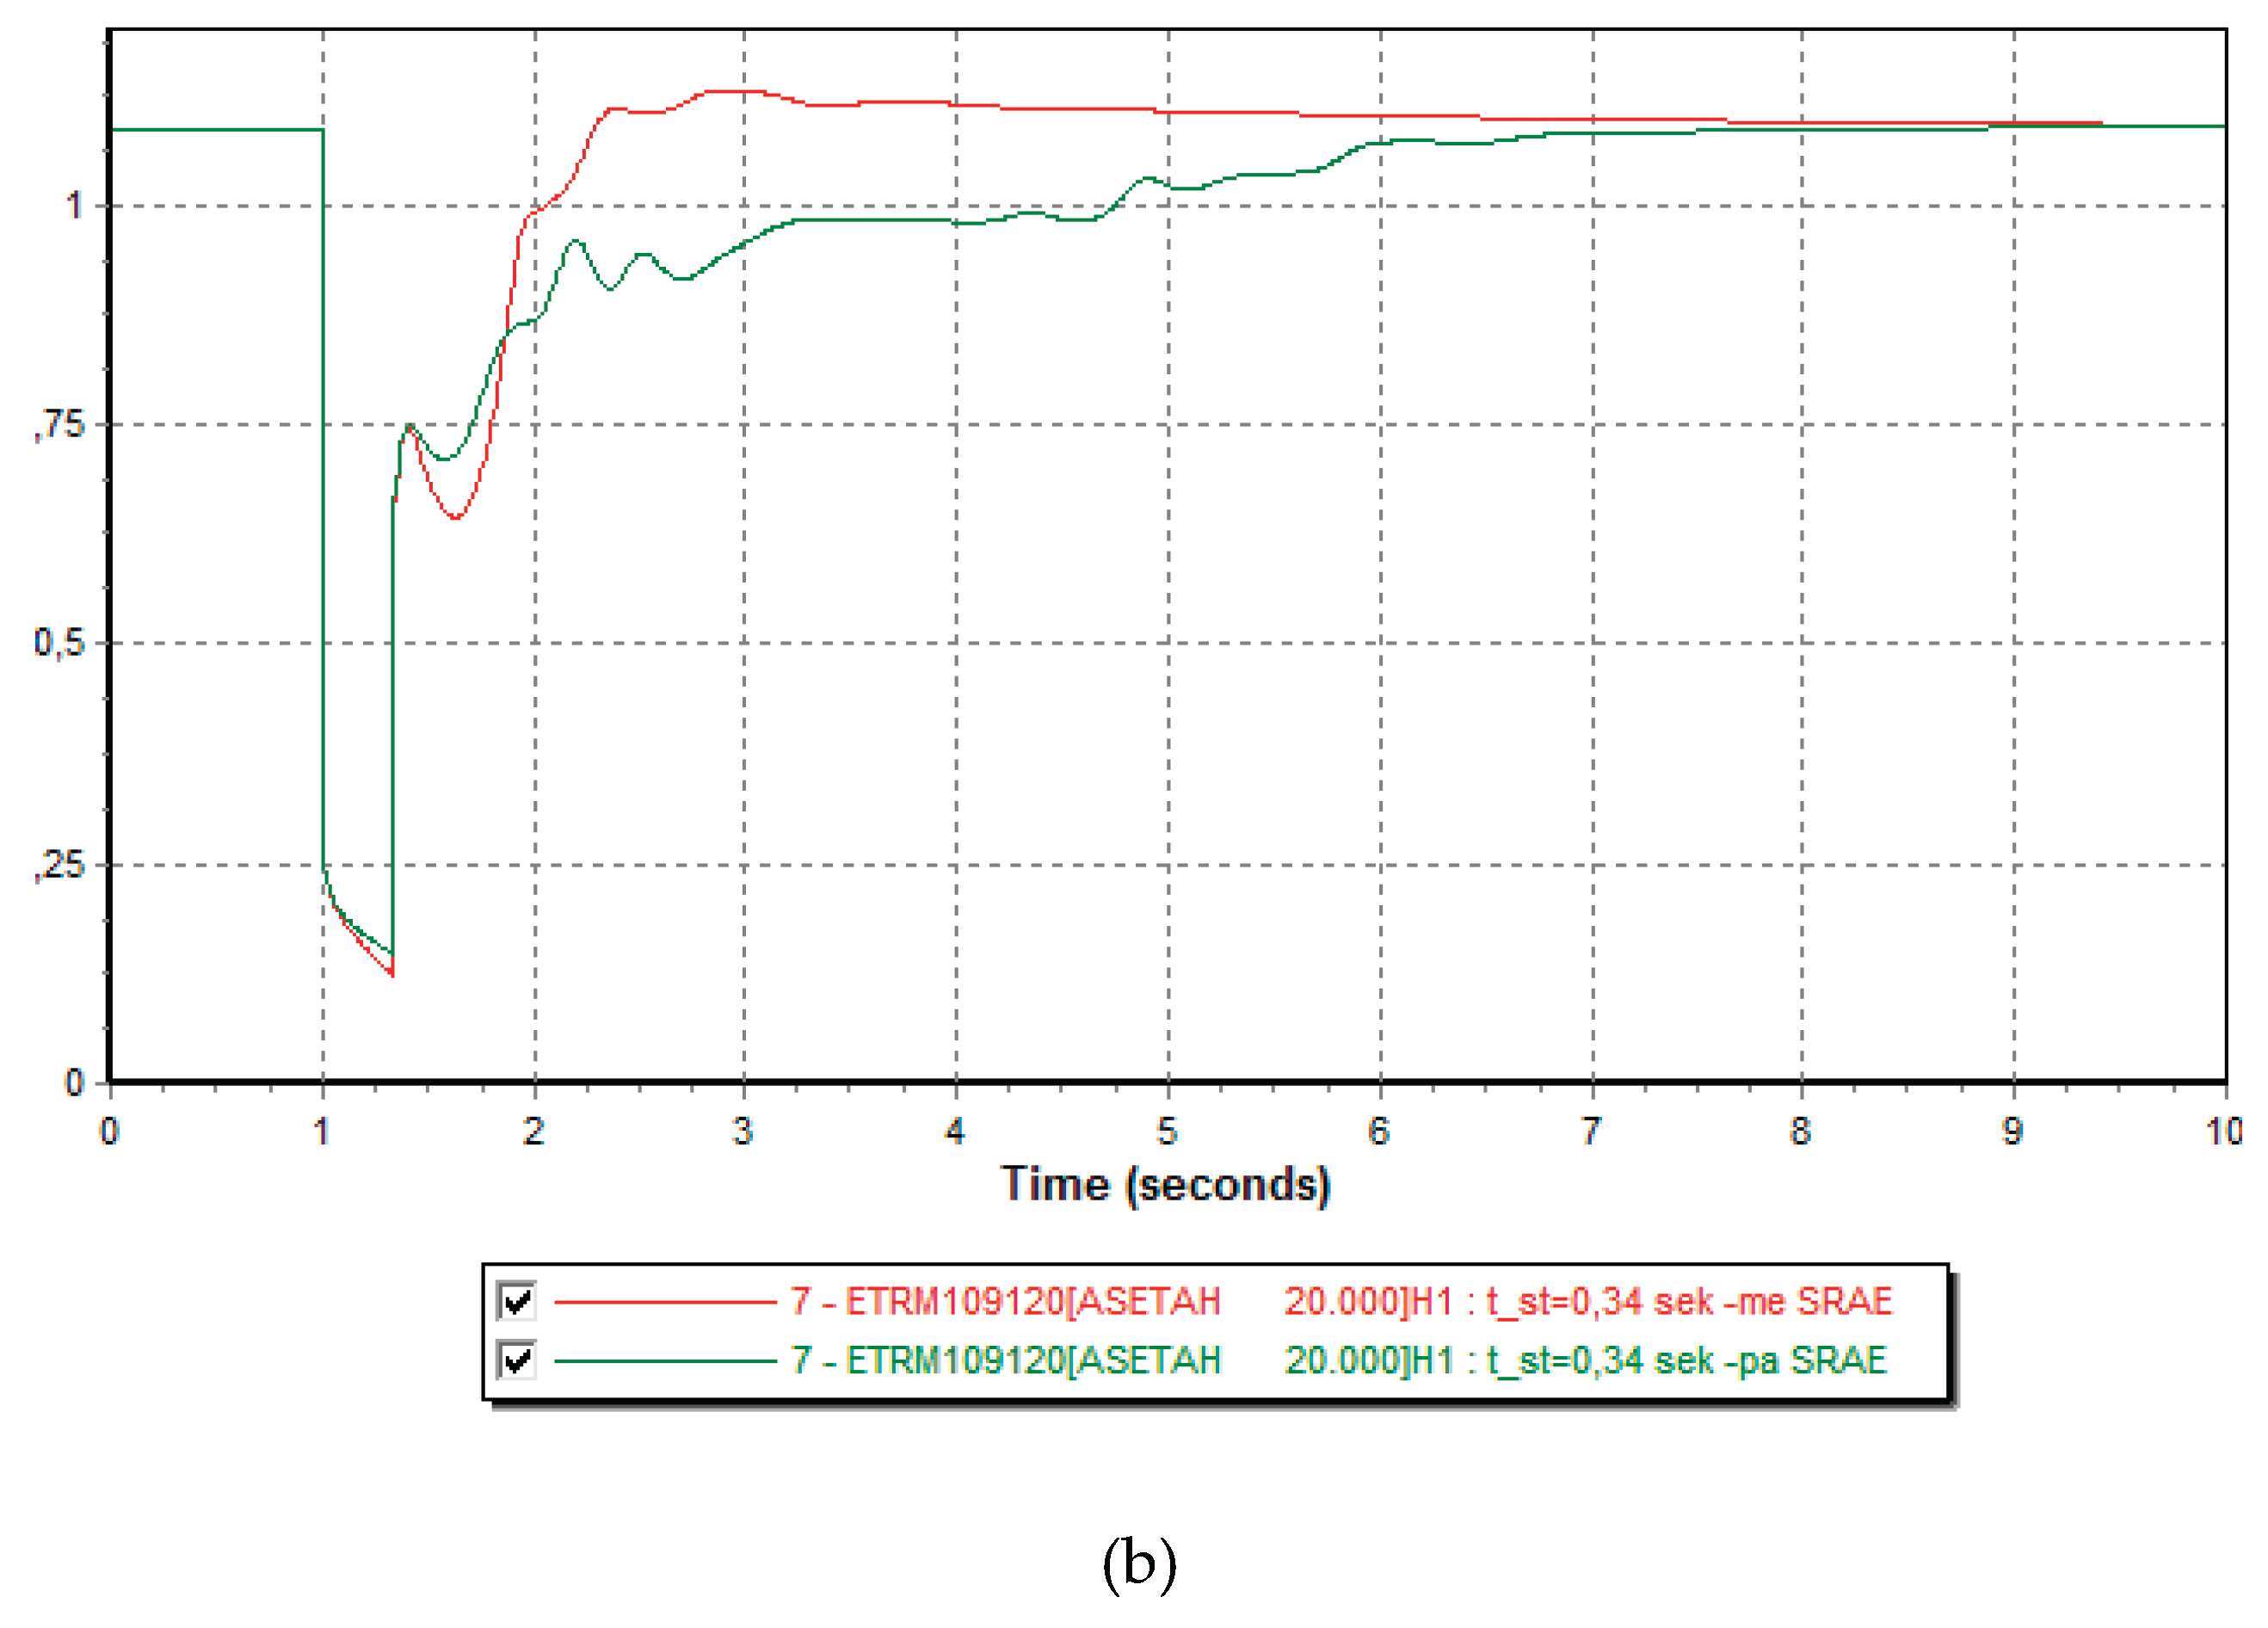
Table 1.
Small and medium hydropower built.
| Generation plant | installed capacity [MW] |
|---|---|
| HPP “Smokthine” | 9.2 |
| HPP “Sranik” | 4.6 |
| HPP “Arras” | 4.8 |
| HPP “Xhyre” | 4.8 |
| HPP “Pobreg” | 12.3 |
| HPP “Vlushe” | 14.2 |
| HPP “Faqe kuq” | 6.4 |
| HPP “Martanesh” | 10.5 |
| HPP “Verba” | 5 |
| HPP “Sasaj” | 10.6 |
| HPP “Tervol” | 10.6 |
| HPP “Streka” | 5.35 |
| HPP “Kabash” | 5.8 |
| HPP “Stavec” | 6.52 |
| HPP “Zall xhuxhe” | 4.7 |
| HPP “Mireshi” | 4.47 |
Disclaimer/Publisher’s Note: The statements, opinions and data contained in all publications are solely those of the individual author(s) and contributor(s) and not of MDPI and/or the editor(s). MDPI and/or the editor(s) disclaim responsibility for any injury to people or property resulting from any ideas, methods, instructions or products referred to in the content. |
© 2026 by the authors. Licensee MDPI, Basel, Switzerland. This article is an open access article distributed under the terms and conditions of the Creative Commons Attribution (CC BY) license (http://creativecommons.org/licenses/by/4.0/).
Copyright: This open access article is published under a Creative Commons CC BY 4.0 license, which permit the free download, distribution, and reuse, provided that the author and preprint are cited in any reuse.


