
Submitted:
11 July 2024
Posted:
12 July 2024
You are already at the latest version
Abstract
The hybrid AC/DC grid, based on a significant share of renewable energy sources, is gradually becoming an essential configuration of the modern energy system. The integration of intermittent renewable generators into contemporary energy systems is accompanied by the decommissioning of power plants containing synchronous generators. Consequently, this leads to a reduction in system inertia and an increase in the risks of stability disruption. The abrupt disconnection of the primary generator or power line can result in an unanticipated mismatch between power generation and consumption. This discrepancy can trigger substantial and swiftly evolving alterations in power distribution, angular speed, load flow, and the frequency of generators. The risks of an energy system collapse can be mitigated through automation, enabling rapid adjustments to generation and load capacities as well as power flows in the electrical network. This article justifies the utilisation of a power control method for high-voltage power line interconnections. The technology of hydro storage power plants and measurements of voltage phasors are employed. The potential for easing power flow restrictions and realising substantial economic benefits is supported by the results obtained using simplified dynamic model of the Baltic power system and Nord Pool electricity market model.
Keywords:
energy storage
; flexibility
; transient stability
; electricity market
; hydro pumped storage
; renewables
; climate change mitigation
1. Introduction
1.1. Motivation
The urgency of the climate crisis demands immediate action to implement mitigation measures and reduce greenhouse gas emissions [1]. A pivotal strategy for achieving this involves the widespread development of renewable energy sources (RES). The integration of intermittent RES into modern power systems is rapidly increasing, aligning with the decommissioning of fossil fuel energy plants. Some countries already have RES capacity capable of meeting more than 100% of the demand [2]. However, the widespread adoption of RES exacerbates challenges related to reliability, stability, and adequacy, demanding comprehensive solutions [3,4,5]. The intermittent nature of RES generation, combined with the variable and challenging-to-control nature of consumption, emphasises the need for capital-intensive energy reserve and storage. This intricacy further complicates the delicate balance between generation and consumption. Consequently, the widespread adoption of RES necessitates substantial efforts and investments to simultaneously achieve four key objectives: system adequacy, reliability, stability, and economic effectiveness [6].
In power systems (PSs) with an extensive share of RES, inertia can exhibit large variations over time and across different regions. PSs are permanently subjected to a variety of troubles, such as a short circuit in a transmission grid, a fault of, and damage to, a large generator. Large disturbances occur relatively rarely, however, they can lead to loss of synchronism among generators and damage to PS equipment, resulting in enormous economic and social consequences [7,8]. The transition from synchronous generators to renewables significantly reduces system inertia [2,4,5,9]. Low-inertia zones are particularly predisposed to the loss of dynamic and transient stability, increased rates of change of frequency (ROCOF), reduced frequency stability, an increased likelihood of cascading outages, and a decrease in the number of generation units available for primary and secondary frequency regulation [3,10,11]. On the one hand, with the reduction of total system inertia and the associated faster frequency dynamics, the existing emergency control and under-frequency load shedding (UFLS) schemes are becoming obsolete [12]. The increased risk manifests itself in an increased probability of load shedding, transmission power line tripping, and generation outages. This challenge is even more pronounced in cases of limited power capacity of interconnecting lines [2,8]. The stability of AC power systems, encompassing frequency [13], transient voltage, angular, and thermal stabilities [10], forms the bedrock of secure and reliable operation in contemporary power systems. The importance of stability is particularly high in power systems of relatively small volume connected to neighbouring power systems by lines with a limited transmission capacity. Figure 1 depicts a power system consisting of several subsystems: PS1 is a relatively small power system, connected by a high-voltage AC transmission line (TL) with PS2 and by high-voltage direct current (HVDC) lines with subsystem PS3.
Normally, operators of the considered system are obligated to ensure its functionality in the event of a sudden failure (disconnection) of any of the major elements (the N-1 criterion [14]). Let us assume that the failure leads to a reduction in generation in subsystem PS1 by an amount represented by . To justify the admissibility of the power jump, the operator, in accordance with the N-1 criterion, employs dynamic models of the energy system containing synchronous generators based on equations of the form [15]:
where, and are the mechanical, electrical and accelerating power (per unit), respectively; since PS1 is an importing PS, the accelerating power is negative or decelerating; is synchronous (angular) speed; is the total system inertia; angular acceleration of rotor; in our case, a negative value represents deceleration.
Equations (1) and (2) delineate a process triggered by a disturbance in balance capable of instigating a frequency drop or power oscillations between generators and potentially resulting in the collapse of the power system. We can conclude that the rate of changes in system frequency and rotor angle deviation are inversely proportional to the total system inertia. Fluctuations in the angular speed and frequency of generators over time can cause significant alterations in the power flow within the transmission network. This may result in the overloading of power transmission lines, ultimately leading to their disconnection. We can see that the loss of system inertia causes a faster fall in frequency and rotor angle change for the same power imbalance (1) and increases the hazard of large-scale accidents and blackouts [16]. The risk of potential cascading events and catastrophic blackouts can be reduced by using three distinct methods. Firstly, by augmenting the overall system inertia , attained by incorporating additional synchronous machines (such as synchronous condensers) or by introducing synthetic inertia [17,18]. Secondly, by minimizing the value of achieved through constraining the power from the energy sources in use. It is worth noting that adherence to this constraint often necessitates the use of less profitable generators. Thirdly, by immediately reducing imbalances during dangerous processes [19]. To attain this goal, two primary steps must be undertaken: a) employing suitable automation and measurement methods to identify unforeseen disconnections of energy sources and assess the magnitude of imbalance between production and consumption; b) taking corrective actions by influencing generators or loads to promptly rectify the power mismatch between energy production and energy consumption. The implementation of the first two measures listed is often blocked by substantial costs since enhancement can be attained through either constraining the influence of economically efficient sources or reinforcing the capacity of power transmission lines. A more economically appealing option emerges with the deployment of Special Protection Systems (SPS) or Remedial Action Schemes (RAS) when carrying out the above measures is considered impractical or undesirable. A rapid reduction in can be achieved through timely remedial actions, including, but not limited to, load shedding [20], system segment isolation [8], generator tripping, generator reconnection, and utilisation of braking resistors [19,21,22]. SPS are designed to take fixed, remedial action to preserve system integrity and ensure suitable system performance [23].
While the rapid connection or disconnection of spare capacities to and from the network can address the need for stability, it introduces challenges related to connection speed. The maximum allowable time for taking stability assurance measures depends on the type of the problem. Angular and frequency stability issues typically require the fastest resolution [24], within a matter of a few cycles, but usually less than one second. Actions to alleviate steady-state stability problems and slow voltage collapse may have an available time period of several seconds. Thermal overload issues may allow several minutes before action is required. The connection of significant generation capacities takes time, typically measured in tens of seconds or more. As noted in [25], generally, hydro turbines are much faster than conventional steam turbine coal plants, which exhibit typical ramp rates of 1% of rated power in MW/min. In fact, hydro turbines have a response comparable to heavy duty and aero-derivative gas turbines, providing up to 20 and 30 MW/min per unit, respectively. The Dinorwig power plant is one of the fastest ramping pumped hydroelectric storage power plants (PHSPP) in the world and is able to increase power from 0 to 1,320 MW in 12 seconds [26]. At the same time, the switching of loads can be performed much more rapidly, typically within a time of approximately ten milliseconds. To address this task, load shedding schemes are commonly employed. The cutting off of loads requires prompt identification of threats associated with emergency processes. To achieve this, emergency automation features such as UFLS and out-of-step protection (OSP) are employed most widely [27,28,29,30]. However, it is important to recognise that the UFLS method leads to economic and social losses since it is implemented by disconnecting energy consumers from the network. Additionally, UFLS identifies the need for load shedding by detecting a decrease in system frequency. However, the time required to make a decision may become unacceptably long, considering the need to ensure angular stability conditions and prevent the occurrence of asynchronous modes, for whose elimination out-of-step protection automation is employed. The standard OSP automation divides the power system into segments, which ultimately leads to an imbalance and the disconnection of a portion of consumers. OSP automation identifies stability disruption by using PMU and measuring phasors’ angles [31]. In this case, restoring the power system to a stable state is achieved through disconnecting consumers, resulting in economic losses due to power interruptions.
It should be noted that the ongoing electrification of specific engineering infrastructures is causing a notable rise in both the quantity and capacity of consumers that are highly sensitive to interruptions in power supply, particularly in terms of economic losses. Involving consumers who are sensitive to operational pauses can impede the efforts to prevent the development of frequency breakdowns, thus significantly restricting the available options for implementing UFLS and OSP in emergency modes. Fortunately, along with these challenges, new opportunities emerge to address or circumvent them. The development of rapid communication networks presents promising opportunities for the distribution and transmission of information, as well as for control actions. Wide area protection and phasor measurement systems are extensively discussed in the scientific literature [32]. These technological advancements offer a way to improve the coordination and efficiency of energy management and control systems, especially when considering increased sensitivity among specific consumers. In addition, the significance and capacities of energy storage systems are experiencing growth. Experts unanimously emphasise that green hydrogen is an inevitable component of the future solution [33]. Concurrently, various other types of energy storage are either in use or under study [34]. These technologies include but are not limited to: pumped hydroelectric storage power plants (currently, the most widely-used technology [35]), battery energy storage systems [36,37], compressed air stations, and synchronous condenser technology [18]. Energy storage can be used for the rapid substitution of an unplanned power outage [38]; however, achieving this requires ensuring sufficient speed and cost-effectiveness in managing the storage operation. In the featured article [38], a feedback control strategy that modulates the real power injected or absorbed by distributed energy-storage devices is proposed. Regrettably, the analysis has been carried out under the assumption that there are no physical constraints on the operational rate of the system.
Dynamic braking [22,39] uses an artificial load near generators during a fault of a grid to consume the power of the generators in order to reduce rotor acceleration. Shunt resistors have been used by switching resistors for about 0.5 seconds following a fault. The dynamic braking method is not suitable in cases of a power deficit.
The integration of joint management operations for energy storage and flows of HV TLs has been thoroughly analysed in [29,40]. It has been pointed out [41] that such a structure makes possible the utilisation of reserves from neighbouring PSs and provides additional opportunities for management, control, and electricity market. The potential benefits of this approach depend on the transmission capacity of power lines, emphasising the importance of increasing its maximum capacity as a key factor in achieving stability goals. The dynamic line rating (DLR) technology represents a method for enhancing line capacity [42]. It is important to recognise that the effectiveness of the DLR technology relies on the line conductor thermal capacity limit and is applicable when this element is the weakest one in the route. However, long transmission lines with high nominal voltages often face constraints due to their impact on transient or post-contingency system stability. This recognition emphasises the need for a comprehensive approach to enhancing line capacity, considering both thermal limitations and concerns about system stability. We propose a new mode of operation for pumped hydroelectric storage plants, which involves simultaneous running of both the pump and the generator. While this mode increases energy consumption, it also makes possible a higher power flow in interconnected power lines. This can compensate for energy losses and can be economically viable.
1.2. Aim and Contribution
The assumption of the technical and economic viability of simultaneous use of pump and generation modes of a PSHPP forms the main hypothesis, the justification of which constitutes the core of this article. The purpose of the paper is to demonstrate how the proposed technology would detect additional transmission capacity on an interconnection transmission line, and how utilities and regional transmission operators might incorporate such a DLR into real-time operations.
To validate the above-stated hypothesis, we set and solve the following tasks:
- By using a simple dynamic model of the power system, we demonstrate the potential for increasing the maximum allowable power of a TL connecting two PSs.
- Via an abridged dynamic model and the parameters of the power systems of the Baltic Sea region, we show the possibility of maintaining stability during sudden outages of large energy sources.
- By utilising data from the Nordic Power Exchange (Nord Pool) market [43], we conduct an example of assessing the economic efficiency of the proposed approach.
It is worth noting that a brief disconnection of the pump of a pumped storage hydroelectric power plant operating in combined pump and generator mode during a stability threat can be easily implemented, incurring acceptable economic losses, and is practically feasible.
1.3. The Structure of the Paper
The structure of this paper unfolds as follows: Section 2 lays out the fundamentals of the proposed control method, elucidating the instability phenomenon through the equal area criterion and detailing the proposed operational mode of pumped storage plants. In Section 3, case studies are presented to substantiate the efficacy of the proposed strategy. Finally, Section 4 offers concluding remarks to wind up the paper.
2. Materials and Methods
2.1. Instability Arising from Generation Surges
Let us return to the analysis of the PS, comprising two subsystems interconnected by a transmission line (AC TL, please refer to Figure 1), and consider a scenario where each subsystem is composed of a single synchronous generator harmoniously matched with its respective load. Moreover, within subsystem PS1 holds the distinction of being the predominant primary energy source, while the maximum allowable capacity of the power line has been definitively determined and set. The sudden and unplanned disconnection of both of these elements could potentially lead to instability in the analysed system. The transmission system operators (TSOs) of subsystems PS1 and PS2 are responsible for ensuring stability, setting constraints when choosing operating modes for each subsystem and the transmission lines between them. Additionally, let us assume that both subsystems, PS1 and PS2, are part of a single electricity market and are managed by an electricity market operator (EMO) whose main task is to ensure consumers with the cheapest energy offered by generating companies. Ultimately, the operating mode is determined by formulating and solving an optimisation problem with two primary objectives:
- Minimising energy generation costs while adhering to specified constraints, some of which relate to stability conditions.
The mentioned bi-objective problem is typically decomposed into two separate tasks. Firstly, there is a search for operating modes that are acceptable in terms of stability. Secondly, there is a minimisation of costs while considering the constraints obtained from the first step.
To elucidate and elaborate on the proposed method, we will employ a widely used approach that includes the dependence of transmitted power on the phase angle between the voltages of equivalent generators in two interconnected power systems (see Figure 2 (a)). We assume that the first subsystem (PS1) has limited inertia and power capacity and acts as an importer of energy from the second subsystem (PS2). When synthesising the model of the system, we will use the assumption that all the components of subsystems PS1 and PS2 are located in one node (copperplate model, [44]). We suppose that the model satisfies the power balance equation at any point in time. We will examine two modes: 1) a steady-state one, characterised by power balance equation (3); and 2) a transient one, determined by (4), assuming that a power outage has occurred in subsystem PS1.
where represents the aggregated generation in PS1, stands for a power outage; denotes the exchange with the neighbouring subsystem, represents the aggregated load, and denotes the decelerating power in PS1.
The power losses due to transmission and distribution are neglected. A power outage introduces angular changes, which are described by (2). Because of the highly nonlinear behaviour, it is problematic to obtain pure analytical solutions to the system equations and the graphical method, also known as the Equal Area Criterion (EAC), is often used to determine whether or not the system will lose stability after a disturbance [45].
For the system presented in Figure 2 (a), it is assumed that PS1 is a power deficient system with the generators of PS1 operating at their maximum capacity.
The PS1 deficit is overcome by importing power from PS2 over the TL (point a in Figure 2 (b)). For a sudden outage of the major generation source in PS1, power deficit occurs and a number of things happen. Immediately after the generation loss, the power deficit will be redistributed among the remaining generators of PS1 and PS2. The kinetic energy of the rotational mass of the generators’ rotors ensures power balance at the very first moment but, as inertial response decays, the generators start to decelerate and the system frequency starts to decline. In response to the frequency decline, the generators gradually increase their power, but the generators of PS1 are already operating at their maximum power and thus the power transfer over the TL will be gradually increased by the amount of (from point a to point c, Figure 2 (b)). In case the acceleration energy of generator PS2 (area abc in Figure 2 (b)) that is needed to regain power balance in point c becomes greater than the maximum available deceleration energy (area cde in Figure 2 (b)), angular instability may arise between the generators of PS1 and PS2, resulting in loss of synchronism and an out-of-step condition along the transmission line.
To avoid the out-of-step condition, the power transfer over the TL must be reduced from to (Figure 3 (a), (b)), thus increasing the deceleration area cde, cdef (Figure 3 (a), (b)). This can be achieved by disconnecting some load in PS1 (an undesirable method) or by fast injection of a significant amount of power in PS1.
Such fast injection of additional power in PS1 can be implemented on a rising slope of the power-angle curve (Figure 3 (a)) or even on a falling slope, when the angle exceeds π/2 (Figure 3 (b)). Fast injection of power assumes that there must be generation capacities in PS1 system which are already in operation, synchronised with the system, but without supplying any power.
2.2. Fixing a Large-Scale Imbalance. Out-of-Step Protection
To detect the threat of instability, we will utilise methods commonly used in SPSs. There are two main types of special protection schemes: event-based and response-based schemes [23,46,47]. Event-based SPSs initiate the shedding of low-priority loads or generators as soon as a forced outage of one or more power generators or loads occurs. The distinction between event-based and response-based SPSs, along with their limitations, can be summarised as follows:
- An event-based special protection scheme is typically activated by changes in the position of switches, promptly disconnecting loads or generators immediately after a predetermined outage occurs [42]. In contrast, a response-driven special protection scheme incorporates measurement elements that introduce time delays.
- An event-based SPS typically necessitates a communication system for transmitting control signals, whereas a response-driven scheme, such as a UFLS, conducts local parameter measurements and initiates local shedding actions. Both schemes involve shedding of loads or generators and can be implemented either together or separately.
It is possible to combine both of the mentioned approaches. To ensure the stability of high-voltage power transmission lines, protections against out-of-step conditions have become widely adopted. One method of such protection involves monitoring the angle between the voltages of equivalent generators connected to opposite ends of the line [48,49,50]. This approach can be implemented by using local protective terminals (see Figure 4; [51]) or a system of phasor measurement units of voltage vectors.
As described in [51], each terminal models equivalent generator electromotive force vectors according to (5). It is supposed that is equivalent to the emf of the power plant, which in turn may consist of several generator units.
where is the voltage at the station bus; is the total current of the generation source; and is the equivalent impedance of the generation source.
Phasor measurement units (PMUs) can be strategically deployed throughout the network to conduct real-time synchronised measurements of phase angles. The collected data is subsequently aggregated and processed by the SPS. In the event of a significant disturbance, the SPS detects anomalies based on real-time angle differences, which allows to initiate adjustments or line disconnections when instability becomes imminent. Using equations (5), it is a straightforward task to identify the threat of stability disruption. For example, when angle exceeds the preset maximum threshold
2.3. A pumped Hydroelectric Storage Plant as a Rapid Power Injection System
Pumped hydroelectric storage power plants represent the world’s most widely used storage technology with a total capacity reaching 159.5 GW [34,35,52,53,54]. PHSPP systems are designed to efficiently transfer water from a lower reservoir to an upper reservoir during periods of low-cost power generation, such as windy and sunny days [55]. Conversely, during times of increased demand or supply shortages, such as during the evening, the water is returned to the lower reservoir through a turbine, enabling electricity generation. PHSPPs have a relatively swift response (from zero to nominal power in a time span of 20 s to a few minutes. Typically, hydro-power plants have from 2 to 10 (or more) runners and the power of the units can reach hundreds of megawatts and the round-trip efficiency reaches 0.8 [25,54]. It is important to emphasise that these units typically operate either in pump mode or in generator mode and these two cannot function simultaneously (see Figure 5), as highlighted by Natalia Naval [52]. However, the restriction on simultaneous operation of these modes is driven by economic considerations, as in this case, the energy consumed by the pump exceeds the energy generated by the generator, leading to seemingly unjustified economic losses.
The situation changes significantly when we consider the ability of the above mode to swiftly adjust the PS operation in response to a sudden imbalance in PS1. To succeed in this, deactivating the pump of the PSHPP (as shown in Figure 5) is a feasible option.
In such a scenario, it becomes possible to execute the transition depicted in Figure 3, moving from Figure 3 (a) to Figure 3 (b), and ultimately selecting a higher volume of permissible energy imports ( in Figure 3) for enhanced stability. Given favourable prices for imported energy, the costs associated with implementing the aforementioned mode is justified.
2.4. Modelling Methodology and Tools
The selection of operational modes for power systems in many countries is governed by the regulations and guidelines established by electricity market rules, such as those of Nord Pool. The selection process typically involves the following main steps:
- Determination of commitments for generator units.
- Verification of compliance with technical and environmental restrictions.
The first step is carried out by numerous energy retailers [57,58] while the second and third steps are performed by market and transmission system operators (TSOs). Typically, this problem is addressed by considering restrictions established by the TSO and by minimising the costs of energy demand. Detailed power system models are necessary for the performance of the above procedures, particularly for the study of electromechanical processes and energy system stability. Even for simulating minor electromechanical transition processes in PSs, solving high-order systems of differential equations and having a comprehensive database of real PS element parameters are necessary. Industrial software is used to create these models. The models embody mathematical descriptions of specific PS components: generators, transformers, high-voltage lines, loads, and automatic control actions (in the form of differential-algebraic equations [42,56]). To analyse the stability control method under consideration, we can utilise the above software and draw upon the existing experience of the operators, as the PS is only slightly modified by adding one generator and load. However, we need to compare the energy costs of two cases (see Figure 6):
- A simulation of the system without the simultaneous operation of the generator and pump of the PHSPP (ordinary network transfer capacity (NTC)).
- A system with simultaneous operation of the generator and pump of the PHSPP (increased NTC).
Below in the case study, we will present a portion of the Baltic power system. The full diagram includes elements of the Estonian, Latvian and Lithuanian power systems as well as the connections with Finland, Sweden, and Poland.
3. Results: Case Studies
3.1. The Baltic Power System
The Baltic power system (BPS) has been chosen to demonstrate the proposed approach. The BPS combines the power systems of the three Baltic States, namely, the Estonian, Latvian and Lithuanian power systems. It is a relatively small PS with a peak load of 4683 MW (EE: 1552, LV: 1100, LT: 2031), historically operated synchronously with the Unified Power System of Russia (UPS), which provides vast frequency and inertia reserves. To improve energy independence and security, a political decision [59] was taken to disconnect the Baltic PS from the UPS and to establish a new synchronous interconnection with the continental Europe network via Poland in 2025 (through one double-circuit 400 kV AC line) [20]. The integration process has been started by introducing new HVDC connections with Finland, Sweden and Poland. There is an HVDC interconnection between Estonia and Finland consisting of two DC cables (Estlink 1 and Estlink 2, the total capacity is 1.05 GW) (in 2024). The LitPol Link is an electricity link between Poland and Lithuania which connects the Baltic transmission system to the synchronous grid of Continental Europe. It has a capacity of 500 MW and since 2021 it can operate in a synchronous regime. Another HVDC interconnector, NordBalt, connects the PSs of Lithuania and Sweden; its maximum capacity is 700 MW. To strengthen the BPS, three synchronous condensers rated ca. 305 MVA each per each Baltic country will be installed by 2025 [60]. It is planned to build a 500 MW underground pumped hydro energy storage plant in Paldiski, Estonia by 2031. The planned storage capacity of 6 GWh during a 12-hour storage cycle is equivalent to Estonian households’ average daily electricity consumption [61]. In the future, up to 2050, a major transformation of the existing system is planned: high-capacity solar, wind and synthetic methane power plants will be built and plants producing atmospheric CO2 emissions will be shut down. The Polish national energy and climate plan provisions building nuclear power plants in the 2030s, as well as developing wind energy [6]. As regards interconnections, it is important to note that the TSOs are planning to increase the import/export capacity of the synchronous interconnections with Germany, the Czech Republic and Slovakia by 2000 MW.
As is presented in Figure 7, the electricity generation mix in the BPS includes hydro, biomass, wind and solar power plants, comprising large PHSPPs and natural gas-fired CHP plants.
The powerful PSHPP that actually exists in Lithuania (Kruonis PSHPP) is taken as the facility to be reviewed. The plant is connected to the 330 kV transmission grid, which does not impose restrictions when choosing plant operating modes. When planning the operation, we assume the following: the water levels in the upper reservoir at the beginning and at the end of the planning period are equal to the maximum permissible level and the pump-turbine units at each hour can work only with the rated power and, furthermore, the combination of the generation mode and the pumping mode is impossible. Parameters of Kruonis PSHPP are presented in Table 1.
3.2. Modelling of the Baltic Power Grid
To evaluate the transient processes and behaviour of the BPS in case of generation loss or major transmission line short circuits, ETAP version 12.5 has been used [63]. A simplified 330 /400 kV network model has been created, representing each country with a single busbar with aggregated loads and equivalent generators (Figure 8). A diagram of the modelled grid is represented in Figure 8.
Generation of Estonia and Lithuania is represented by an equivalent synchronous turbo generator for each country. Generation of Latvia is represented by an equivalent HPP generator. The generation and load values for the simulation are taken from a typical spring situation in the BPS in the recent years – a situation when a full production from Latvian hydropower plants can be expected. The Estonian PS is importing electricity (250 MW) and the Lithuanian PS is importing energy from Sweden (700 MW) and Poland (700 MW or 1100 MW for different scenarios S1…S6). Kruonis PSHPP of the Lithuanian PS is modelled with two synchronous generators (G1 and G3) and two synchronous motors operating in water pump mode (M2 and M4). The NordBalt HVDC link (L3) is represented with a dedicated busbar and transmission cable. Interconnection with Poland PS is accomplished by means of two AC transmission lines L1 and L2. All Baltic generators’ angles are referenced to a Poland generator which is chosen as the swing-generator. The parameters of the modelled AC transmission lines correspond to equivalent of the real AC lines interconnecting the Baltic power grid. Table 2 summarizes an overview of the parameters of the modelled system.
Below, we present the results of calculating the most intriguing transient regimes for the selected scenarios.
3.3. Simulation Results
A brief description of the data and assumptions used are provided in Table 3. A comparison of these results will form the basis for conclusions regarding the effectiveness of the proposed control method.
3.3.1. Test Case Set: Loss of Generation (Scenario S1, S2, S3)
The first three scenarios have been designed to assess PS stability in case of loss of a large generation source by tripping the NordBalt line between Lithuania and Sweden (L3) and disconnecting 700 MW of the power transferred to BPS at t=0.5s.
In Scenario S1 (see Figure 9) the power deficit of 700 MW leads to a significant increase in the amount of power transmitted from Poland (L1+L2) which, in turn, resulted in an out-of-step condition at 2.65 s. The inability to transfer power due to the out-of-step condition resulted in a further frequency decline and operation of five steps of UFLS at the following times: t=3.278, 3.442, 3.545, 3.759 and 3.823 s.
This case demonstrates that an excessive power transfer from Poland can potentially lead to angular instability, which is unacceptable, and such a regime should be avoided.
In Scenario S2 (see Figure 10), the operation of the OSP is simulated. The OSP disconnects transmission lines L1 and L2 as soon as the angle between Poland and the BPS exceeds 115 electric deg at time 2.4 s. As a result of the inability to meet the power deficit, 6 steps of UFLS have been triggered at the following times: t=2.935 s, 3.025, 3.097, 3.161, 3.222 and 3.292 s. The BPS remains in operation with a decreased system frequency of 47.5 Hz ~ 0.95 % fnom.
Scenarios S1 and S2 demonstrate that the power transfer over the Poland – BPS synchronous link must be intentionally limited to avoid a possible development of instability and significant load shedding actions. Additional simulations show that angular and frequency stability of the BPS is preserved when the maximum power transfer from Poland is limited to 400 MW.
In Scenario S3 (see Figure 11), the proposed control automation disconnects pumps/motors (M2 and M4) of Kruonis PSHPP at t=1.0 s, thus preventing development of dangerous processes such as an out-of-step condition along the lines L1 and L2 and consequent frequency instability of the BPS. Kruonis PSHPP generators G1 and G3 provide the power system with additional 400 MW of power, thus stabilising the system frequency of the BPS.
This case shows that fast actions, intended for quick redirection of a significant amount of power from non-critical load (Kruonis PSHPP pumps) to the network, allow preventing hazardous scenarios with frequency instability. Therefore, the power transfer margin from Poland can be increased without the risk of losing stability.
3.3.2. Test Case Set: Short Circuit on Transmission Line (Scenario S4, S5, S6)
The next set of scenarios demonstrates the performance of the proposed automation in case of short circuit in one of two Poland – BPS interconnecting lines (L1 and L2) and its impact on the stability of the BPS. The power transfer from Poland is close to the thermal and static stability margin.
In Scenario S4 (see Figure 12), short circuit on L1 at t = 0.5 s is simulated. The short circuit was disconnected after 50 ms and the power transfer over remaining line L1 resulted in an out-of-step condition at 2.6 s.
In Scenario S5 (see Figure 13), short circuit on L1 at t = 0.5 s is simulated. The short circuit has been disconnected after 50 ms and, to prevent an out-of-step condition, the OSP disconnects line L2 at 2.2 s. As a result of the significant power deficit, three steps of UFLS have been triggered. The PSs remain in operation with a decreased frequency of 48.75 Hz (97.5 % fnom).
As was expected, the line short circuit leads to consequences similar to cases S1 and S2. The power transfer over lines L1 and L2 should be intentionally limited to avoid angular and frequency instability of the BPS.
In Scenario S6 (see Figure 14), short circuit on L1 at t = 0.5 s has been simulated. The short circuit was disconnected after 50 ms and the proposed control automation disconnects the pumps (400 MW) of Kruonis PSHPP at t=1.0 s.
An additional injection of 400 MW from the Kruonis generators prevents an out-of-step condition along the remaining line L2, thus preventing development of frequency instability in the BPS.
Scenario S6 demonstrates the efficiency of the proposed approach in the prevention of angular and frequency instability even when the transmission link is operating close to it is maximal capacity. For all the simulated scenarios, if the proposed method is implemented, the restrictions of the power transfer limit can be relaxed without the risk of losing stability. For the cases presented, the power transfer over the Poland – BPS link could be increased from 400 MW up to 800 MW.
3.4. The Impact of the Line Capacity on the Market Price
Taking into consideration that both the producers and consumers of the energy systems participate in the Nord Pool electricity market, let us examine the impact of increasing the TL capacity on the market price of electricity. All the participants are required to submit their bids for buying and selling electricity to the Electricity Market Operator (EMO).The market bids indicate how much the seller or the buyers are willing to buy or sell and for which price. Bid acceptance in Nord Pool is based on the market price formation and is managed by the EMO. The EMO aggregates all the bids and determines the accepted/rejected generation and consumption bids and sets a market clearing price (MCP) for each hour [64]. The selection of the cheapest generators is ensured, provided that there is guaranteed balance and adherence to energy flow limitations along the transmission lines. Generators’ bids with a price lower than the MCP and purchase bids with a price higher than the MCP are accepted whereas the remaining bids are rejected. In this auction scheme, all the accepted participants are paid the market clearing price. Thus, the MCP determines the income of power plants and the costs of power consumers. The diagrams in Figure 15 illustrate the situations arising in cases of excess cheap energy in the Polish power system and a deficit in the Baltic power system.
Figure 15 (a) presents a diagram illustrating the situation of generator selection in the absence of power transmission limitations along the LitPol line. We can see that, thanks to imports from Poland, a low MCP is established. Figure 15 (b) depicts the situation of generator selection in the presence of a limitation on the transmitted power along the LitPol line. Figure 15 (c) illustrates the situation of alleviating the limitation on the transmitted power along the LitPol line through the simultaneous use of a pump and a generator at Kruonis PSHPP. We can observe an increase in the power consumed by the BPS by the amount of and a significantly greater in the transmission capacity of the LitPol line (see Figure 15 (c)). The economic gain in this case, denoted as , can be expressed as follows:
where parameters , , and correspond to Figure 15.
To evaluate the scale of the gain, we will utilise the market prices registered in the Baltic region on February 9, 2024, as depicted in Figure 16.
Using the market price data on February 9 (Figure 16) and assuming that the transmission capacity of the LitPol line can be increased by 400 MW, based on the previous calculations, we obtain the diurnal gain (the number of hours when the prices are above 74% of the price in the PL area to observe efficiency: 12 hours, average price difference: 80.4367 EUR/MWh.):
A similar situation (high prices in the LT area and low prices in the PL area) was observed in September 2023 (Figure 17). The difference in the day-ahead prices between the LT and PL areas is presented in Figure 18. The prices in the LT area were higher than in the PL area at 202 hours (28%) during this period (the average difference was 62.3 EUR/MWh).
To evaluate the economic gain of the proposed solution we consider the hours with LT prices above 74% of the price in the PL area, thus taking into account efficient cycle use rate of Kruonis PSHPP (Table 1). There were 113 hours with LT prices above the 74% threshold; the distribution of the prices in the LT area above 74% of the price in the PL area is shown in Figure 19, the average price difference for these hours was 95.03 EUR/MWh.
The economic gain for this period could be:
The possibility of saving more than four million per month could be considered as economically attractive, since the implementation of this solution only requires financing for constructing the automation.
4. Discussion
The hybrid AC/DC grid, incorporating a substantial proportion of intermittent renewables, is becoming a vital configuration in modern energy systems. The energy transition results in a reduction of system inertia, consequently elevating the risks of stability disruption. A sudden loss of large generation or cross-border interconnection can lead to an unexpected energy imbalance, posing significant challenges for grid stability and reliability. Therefore, power system operators restrict operating conditions, in particular by decreasing the transfer capacity of a weakly interconnected power system. One negative consequence of such restrictions under electricity market conditions is significant price variance between different price areas. We can observe similar market behaviour and price changes in cases when an important interconnection or generator has been disconnected.
In this paper, an analysis has been carried out to evaluate the technical feasibility and economic viability of leveraging pumped storage power plants. The proposed control automation allows for enhancing stability of a weakly interconnected power system (in particular, the Baltic power system) and alleviates cross-border transfer capacity limitations due to a decrease in inertia. There are cases when simultaneous operation of generators and pumps of a PSHPP is feasible. The preliminary results (§3.3) have shown that it is possible and that power system stability can be enhanced by applying the proposed control automation, employing measurements of voltage phasors. The two most probable cases of disturbances were assessed: loss of large-scale generation and trip of cross-border interconnection due to a short-circuit. In the first case (Scenario S3), the disconnection of the PSHPP’s pumps prevents development of dangerous processes such as an out-of-step condition along the lines (L1 and L2) and the consequent frequency drop. Generators of Kruonis PSHPP (G1 and G3) provide the power system with an additional 400 MW of power, thus stabilising the BPS system frequency (the transient frequency deviation does not exceed 1 %). In the second case (Scenario S6), the short circuit was eliminated by tripping the line (by relay protection) and the proposed control automation disconnects the pumps (400 MW) of Kruonis PSHPP. An additional injection of 400 MW from Kruonis generators prevents an out-of-step condition along the remaining line (L2), thus preventing the development of frequency instability in the BPS (the transient frequency remains in the range of 99.7–100.8 %).
To evaluate the economic gain, the historical market prices have been used. The results obtained (§3.4) prove the economic viability of the proposed solution (saving could reach 4 295 356 EUR per month).
Future research will focus on refining the current model to enhance the effectiveness of our proposed method. This includes identifying optimal conditions for its application and further development the method’s accuracy and reliability in diverse scenarios. Through iterative testing and analysis, we aim to establish clear guidelines for when and how to best utilise the proposed method for maximum impact.
Author Contributions
Conceptualization, A.S..; methodology, A.S., A.U. and D.Z.; software, A.U.; validation, A.U. and D.Z.; formal analysis, A.S., A.U. and D.Z; writing—original draft preparation, A.S.; writing—review and editing, A.S., A.U., and D.Z.; visualization, A.U. and D.Z.; supervision, A.S.. All authors have read and agreed to the published version of the manuscript.
Funding
This research is funded by the Latvian Council of Science, project No. Lzp – 2023/ 1- 0376 “Innovative emergency control of RES-dominated low-inertia power systems (INNOVA)”.
Data Availability Statement
The data presented in this study are available on request from the corresponding author.
Conflicts of Interest
The authors declare no conflicts of interest.
References
- The European Council The 2030 Climate and Energy Framework. Available online: https://www.consilium.europa.eu/en/policies/climate-change/2030-climate-and-energy-framework (accessed on 17 May 2024).
- Milano, F.; Dorfler, F.; Hug, G.; Hill, D.J.; Verbic, G. Foundations and Challenges of Low-Inertia Systems (Invited Paper). In Proceedings of the 2018 Power Systems Computation Conference (PSCC); IEEE, June 2018; pp. 1–25.
- L., L.; Swarup, K.S. Inertia Monitoring in Power Systems: Critical Features, Challenges, and Framework. Renew. Sustain. Energy Rev. 2024, 190, 114076. [CrossRef]
- Johnson, S.C.; Rhodes, J.D.; Webber, M.E. Understanding the Impact of Non-Synchronous Wind and Solar Generation on Grid Stability and Identifying Mitigation Pathways. Appl. Energy 2020, 262, 114492. [CrossRef]
- Prabhakar, K.; Jain, S.K.; Padhy, P.K. Inertia Estimation in Modern Power System: A Comprehensive Review. Electr. Power Syst. Res. 2022, 211, 108–222. [CrossRef]
- International Energy Agency Available online: https://www.iea.org/.
- Alhelou, H.H.; Hamedani-Golshan, M.E.; Njenda, T.C.; Siano, P. A Survey on Power System Blackout and Cascading Events: Research Motivations and Challenges. Energies 2019, 12, 1–28. [CrossRef]
- Zalostiba, D. Power System Blackout Prevention by Dangerous Overload Elimination and Fast Self-Restoration. In Proceedings of the IEEE PES ISGT Europe 2013; IEEE, October 2013; pp. 1–5.
- Ørum, E.; Kuivaniemi, M.; Laasonen, M.; Bruseth, A.I.; Jansson, E.A.; Danell, A.; Elkington, K.; Modig, N. ENTSO Report - Future System Inertia; 2015.
- Hatziargyriou, N.; Milanovic, J.; Rahmann, C.; Ajjarapu, V.; Canizares, C.; Erlich, I.; Hill, D.; Hiskens, I.; Kamwa, I.; Pal, B.; et al. Definition and Classification of Power System Stability - Revisited & Extended. IEEE Trans. Power Syst. 2021, 36, 3271–3281. [CrossRef]
- Guzs, D.; Utans, A.; Sauhats, A.; Junghans, G.; Silinevics, J. Resilience of the Baltic Power System When Operating in Island Mode. In Proceedings of the 2020 IEEE 61th International Scientific Conference on Power and Electrical Engineering of Riga Technical University (RTUCON); IEEE, November 5 2020; pp. 1–6.
- Markovic, U.; Stanojev, O.; Aristidou, P.; Vrettos, E.; Callaway, D.; Hug, G. Understanding Small-Signal Stability of Low-Inertia Systems. IEEE Trans. Power Syst. 2021, 36, 3997–4017. [CrossRef]
- Scherer, M.; Andersson, G. How Future-Proof Is the Continental European Frequency Control Structure? 2015 IEEE Eindhoven PowerTech, PowerTech 2015 2015. [CrossRef]
- Zbunjak, Z.; Bašić, H.; Pandžić, H.; Kuzle, I. Phase Shifting Autotransformer, Transmission Switching and Battery Energy Storage Systems to Ensure n-1 Criterion of Stability. J. Energy - Energ. 2015, 64, 285–298. [CrossRef]
- Machowski, J.; Bialek, J.W.; Bumby, J.R. Power System Dynamics. Stability and Control; 3rd ed.; John Wiley & Sons, Ltd, 2012; ISBN 978-0-470-72558-0.
- Sauhats, A.; Chuvychin, V.; Bockarjova, G.; Zalostiba, D.; Antonovs, D.; Petrichenko, R. Detection and Management of Large Scale Disturbances in Power System. In Lecture Notes in Computer Science (including subseries Lecture Notes in Artificial Intelligence and Lecture Notes in Bioinformatics); 2016; Vol. 8985, pp. 147–152 ISBN 9783319316635.
- Ratnam, K.S.; Palanisamy, K.; Yang, G. Future Low-Inertia Power Systems: Requirements, Issues, and Solutions - A Review. Renew. Sustain. Energy Rev. 2020, 124, 109773. [CrossRef]
- Nguyen, H.T.; Yang, G.; Nielsen, A.H.; Jensen, P.H. Combination of Synchronous Condenser and Synthetic Inertia for Frequency Stability Enhancement in Low-Inertia Systems. IEEE Trans. Sustain. Energy 2019, 10, 997–1005. [CrossRef]
- Ali, M.H.; Murata, T.; Tamura, J. Effect of Coordination of Optimal Reclosing and Fuzzy Controlled Braking Resistor on Transient Stability during Unsuccessful Reclosing. IEEE Trans. Power Syst. 2006, 21, 1321–1330. [CrossRef]
- Sauhats, A.; Utans, A.; Silinevics, J.; Junghans, G.; Guzs, D. Enhancing Power System Frequency with a Novel Load Shedding Method Including Monitoring of Synchronous Condensers’ Power Injections. Energies 2021, 14. [CrossRef]
- Elliott, R.T.; Choi, H.; Trudnowski, D.J.; Nguyen, T. Real Power Modulation Strategies for Transient Stability Control. IEEE Access 2022, 10, 37215–37245. [CrossRef]
- Saluja, R.; Ali, M.H. Novel Braking Resistor Models for Transient Stability Enhancement in Power Grid System. 2013 IEEE PES Innov. Smart Grid Technol. Conf. ISGT 2013 2013, 1–6. [CrossRef]
- L; 23. Power Systems Engineering Research Center System Protection Schemes : Limitations , Risks , and Management; 2010.
- Tower, N. Special Protection Systems ( SPS ) and Remedial Action Schemes ( RAS ): Assessment of Definition , Regional Practices , and Application of Related Standards. 2013, 1–48.
- Beevers, D.; Branchini, L.; Orlandini, V.; De Pascale, A.; Perez-Blanco, H. Pumped Hydro Storage Plants with Improved Operational Flexibility Using Constant Speed Francis Runners. Appl. Energy 2015, 137, 629–637. [CrossRef]
- Koritarov, V.; Ploussard, Q.; Kwon, J.; Balducci, P. A Review of Technology Innovations for Pumped Storage Hydropower. 2022.
- Mahmoudi, M.M.; Kincic, S.; Zhang, H.; Tomsovic, K. Implementation and Testing of Remedial Action Schemes for Real-Time Transient Stability Studies. IEEE Power Energy Soc. Gen. Meet. 2018, 2018-Janua, 1–5. [CrossRef]
- Ojetola, S.; Wold, J.; Trudnowski, D.; Wilches-Bernal, F.; Elliott, R. A Real Power Injection Control Strategy for Improving Transient Stability. IEEE Power Energy Soc. Gen. Meet. 2020, 2020-Augus. [CrossRef]
- Gonzalez-Longatt, F.; Adiyabazar, C.; Martinez, E.V. Setting and Testing of the Out-of-Step Protection at Mongolian Transmission System. Energies 2021, 14, 1–35. [CrossRef]
- Ojetola, S.; Wold, J.; Trudnowski, D. Multi-Loop Transient Stability Control via Power Modulation from Energy Storage Devices. IEEE Trans. Power Syst. 2021, 36, 5153–5163. [CrossRef]
- Sauhats, A.S.; Utans, A. Out-of-Step Relaying Principles and Advances. Scientific Monograph; RTU Press, 2022.
- Rudez, U.; Mihalic, R. Trends in WAMS-Based under-Frequency Load Shedding Protection. In Proceedings of the IEEE EUROCON 2017 -17th International Conference on Smart Technologies; IEEE, July 2017; pp. 782–787.
- What Is Green Hydrogen and Why Do We Need It? An Expert Explains Available online: https://www.weforum.org/agenda/2021/12/what-is-green-hydrogen-expert-explains-benefits/.
- Nikolaidis, P.; Poullikkas, A. A Comparative Review of Electrical Energy Storage Systems for Better Sustainability. J. Power Technol. 2017, 97, 220–245.
- Šćekić, L.; Mujović, S.; Radulović, V. Pumped Hydroelectric Energy Storage as a Facilitator of Renewable Energy in Liberalized Electricity Market. Energies 2020, 13. [CrossRef]
- Koltermann, L.; Drenker, K.K.; Celi Cortés, M.E.; Jacqué, K.; Figgener, J.; Zurmühlen, S.; Sauer, D.U. Potential Analysis of Current Battery Storage Systems for Providing Fast Grid Services like Synthetic Inertia – Case Study on a 6 MW System. J. Energy Storage 2023, 57, 1–8. [CrossRef]
- Angenendt, G.; Zurmühlen, S.; Figgener, J.; Kairies, K.P.; Sauer, D.U. Providing Frequency Control Reserve with Photovoltaic Battery Energy Storage Systems and Power-to-Heat Coupling. Energy 2020, 194, 116923. [CrossRef]
- Ojetola, S.T.; Wold, J.; Trudnowski, D. Feedback Control Strategy for Transient Stability Application. Energies 2022, 15, 1–20. [CrossRef]
- Ebadian, M.; Alizadeh, M. Improvement of Power System Transient Stability Using Fault Current Limiter and Thyristor Controlled Braking Resistor. 2009 Int. Conf. Electr. Power Energy Convers. Syst. EPECS 2009 2009, 1–6.
- Guzmán, A.; Tziouvaras, D.A.; Schweitzer, E.O.; Martin, K. Local- and Wide-Area Network Protection Systems Improve Power System Reliability. Power Syst. Conf. 2006 Adv. Metering, Prot. Control. Commun. Distrib. Resour. PSC 2006, 174–181. [CrossRef]
- Dai, Y.; Preece, R.; Panteli, M. Risk Assessment of Cascading Failures in Power Systems with Increasing Wind Penetration. Electr. Power Syst. Res. 2022, 211. [CrossRef]
- ENTSO-E ENTSO-E Guideline for Cost Benefit Analysis of Grid Development Projects. Final - Approved by the European Commission. 27. September 2018. Entso-E 2018, 71.
- Nord Pool Available online: https://www.nordpoolgroup.com.
- Hess, D.; Wetzel, M.; Cao, K.K. Representing Node-Internal Transmission and Distribution Grids in Energy System Models. Renew. Energy 2018, 119, 874–890. [CrossRef]
- Kimbark, E.W. Power System Stability, Volume I; IEEE Press Classic Reissue, 1995; ISBN 978-0-780-31135-0.
- Hong, Y.Y.; Hsiao, C.Y. Event-based Under-frequency Load Shedding Scheme in a Standalone Power System. Energies 2021, 14. [CrossRef]
- Stanković, S.; Hillberg, E.; Ackeby, S. System Integrity Protection Schemes: Naming Conventions and the Need for Standardization. Energies 2022, 15. [CrossRef]
- Antonovs, D.; Sauhats, A.; Utans, A.; Svalovs, A.; Bochkarjova, G. Protection Scheme against Out-of-Step Condition Based on Synchronized Measurements. Proc. - 2014 Power Syst. Comput. Conf. PSCC 2014 2014, 1–8. [CrossRef]
- Sauhats, A.; Svalova, I.; Svalovs, A.; Antonovs, D.; Utans, A.; Bochkarjova, G. Two-Terminal out-of-Step Protection for Multi-Machine Grids Using Synchronised Measurements. 2015 IEEE Eindhoven PowerTech, PowerTech 2015 2015, 1–5. [CrossRef]
- Sauhats, A.; Utans, A.; Biela-Dailidovicha, E. Wide-Area Measurements-Based out-of-Step Protection System. 2015 56th Int. Sci. Conf. Power Electr. Eng. Riga Tech. Univ. RTUCON 2015 2015, 5–9. [CrossRef]
- Sauhats, A.; Utans, A.; Antonovs, D.; Svalovs, A. Angle Control-Based Multi-Terminal out-of-Step Protection System. Energies 2017, 10. [CrossRef]
- Naval, N.; Yusta, J.M.; Sánchez, R.; Sebastián, F. Optimal Scheduling and Management of Pumped Hydro Storage Integrated with Grid-Connected Renewable Power Plants. J. Energy Storage 2023, 73. [CrossRef]
- Kougias, I.; Aggidis, G.; Avellan, F.; Deniz, S.; Lundin, U.; Moro, A.; Muntean, S.; Novara, D.; Pérez-Díaz, J.I.; Quaranta, E.; et al. Analysis of Emerging Technologies in the Hydropower Sector. Renew. Sustain. Energy Rev. 2019, 113, 109257. [CrossRef]
- Carrieann Stocks Largest Pumped Storage Plants in Operation and Development Available online: https://www.nsenergybusiness.com/features/largest-pumped-storage-plants/.
- Harby, A.; Sauterleute, J.; Korpås, M.; Killingtveit, Å.; Solvang, E.; Nielsen, T. Pumped Storage Hydropower. In Transition to Renewable Energy Systems; Wiley Blackwell, 2013; pp. 597–618 ISBN 9783527673872.
- Chiodi, A.; Deane, J.P.; Gargiulo, M.; Ó’Gallachóir, B.P. Modelling Electricity Generation - Comparing Results: From a Power Systems Model and an Energy Systems Model. Environ. Res. Inst. 2011, 1–25.
- Ottesen, S.Ø.; Tomasgard, A.; Fleten, S.E. Multi Market Bidding Strategies for Demand Side Flexibility Aggregators in Electricity Markets. Energy 2018, 149. [CrossRef]
- Iria, J.; Soares, F.; Matos, M. Optimal Supply and Demand Bidding Strategy for an Aggregator of Small Prosumers. Appl. Energy 2018, 213, 658–669. [CrossRef]
- European Commission Energy Security: The Synchronisation of the Baltic States’ Electricity Networks - European Solidarity in Action Available online: https://ec.europa.eu/commission/presscorner/detail/en/IP_19_3337.
- AST Synchronisation with Europe Available online: https://www.ast.lv/en/projects/synchronisation-europe.
- Press Release: Estonia’s First Pumped Hydro Energy Storage Facility Has Issued an Invitation to Tender Available online: https://zeroterrain.com/press-release-estonias-first-pumped-hydro-energy-storage-facility-invitation-to-tender/.
- ignitis gamyba Kruonis Pumped Storage Hydroelectric Power Plant (KPSHP) Available online: https://ignitisgamyba.lt/en/our-activities/electricity-generation/kruonis-pumped-storage-hydroelectric-power-plant-kpshp/4188.
- etap software Etap Software. Available online: https://etap.com/ (accessed on 17 May 2024).
- Cai, T.; Dong, M.; Chen, K.; Gong, T. Methods of Participating Power Spot Market Bidding and Settlement for Renewable Energy Systems. Energy Reports 2022, 8, 7764–7772. [CrossRef]
Figure 1.
Interconnected power systems.
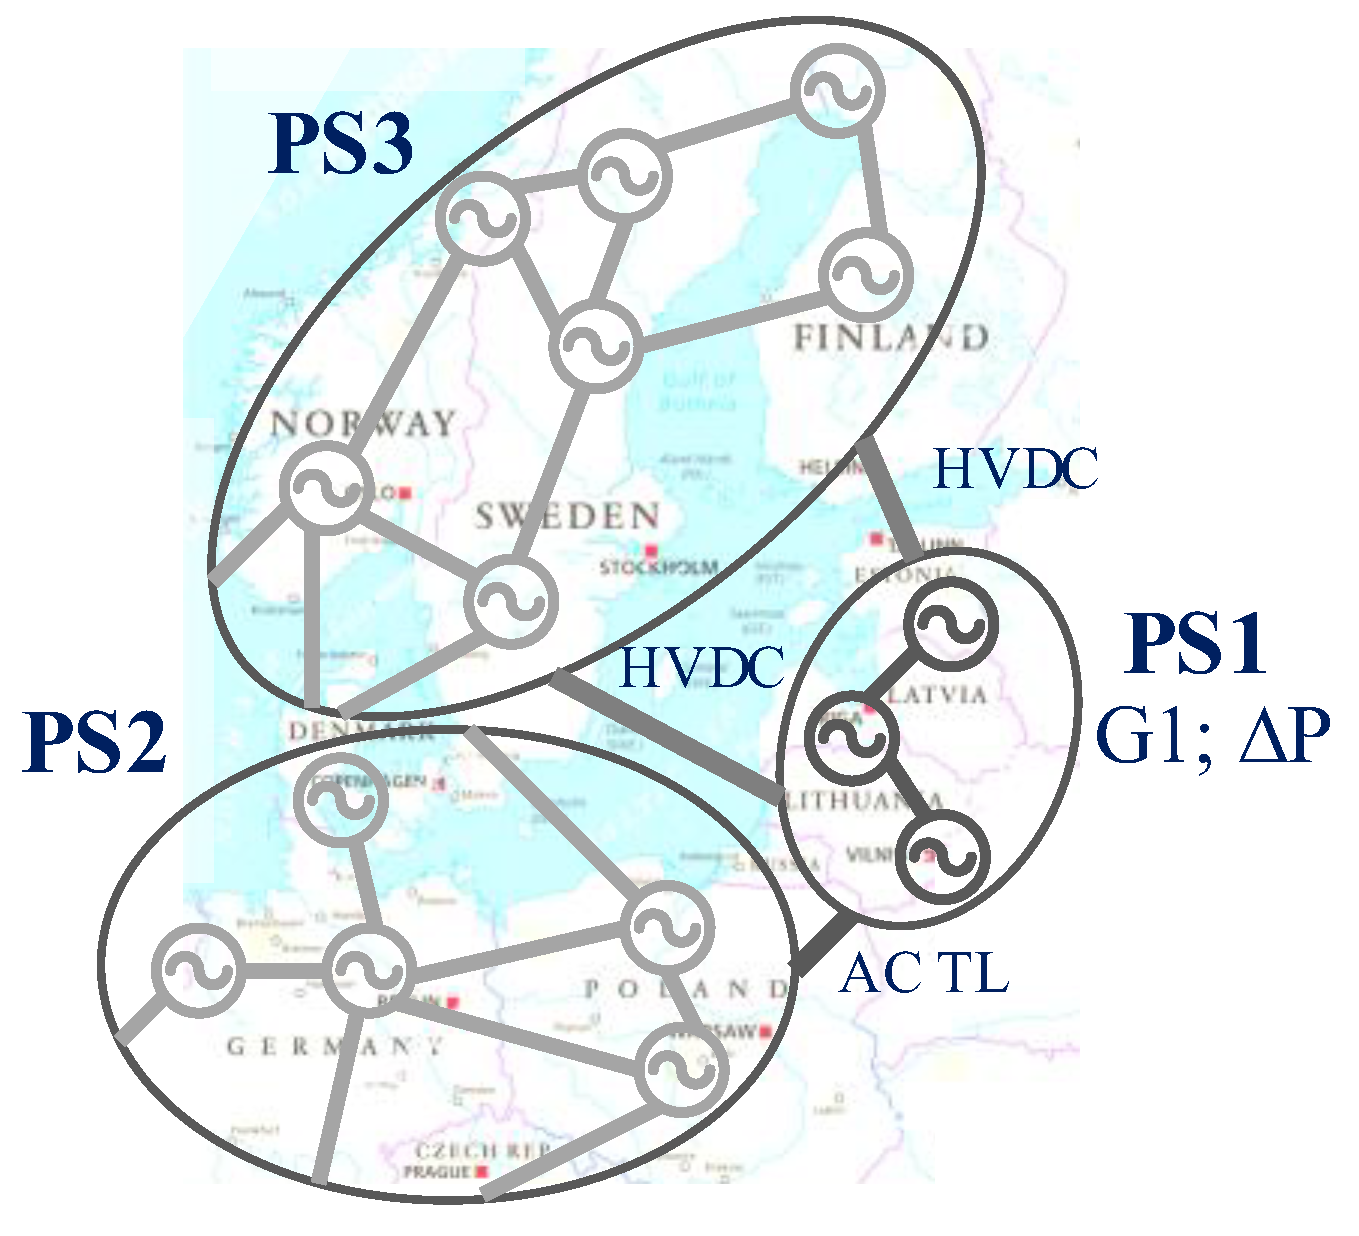
Figure 2.
(a) A simplified diagram of the interconnected power system, and (b) a representation of a sudden outage, using the EAC.
Figure 2.
(a) A simplified diagram of the interconnected power system, and (b) a representation of a sudden outage, using the EAC.
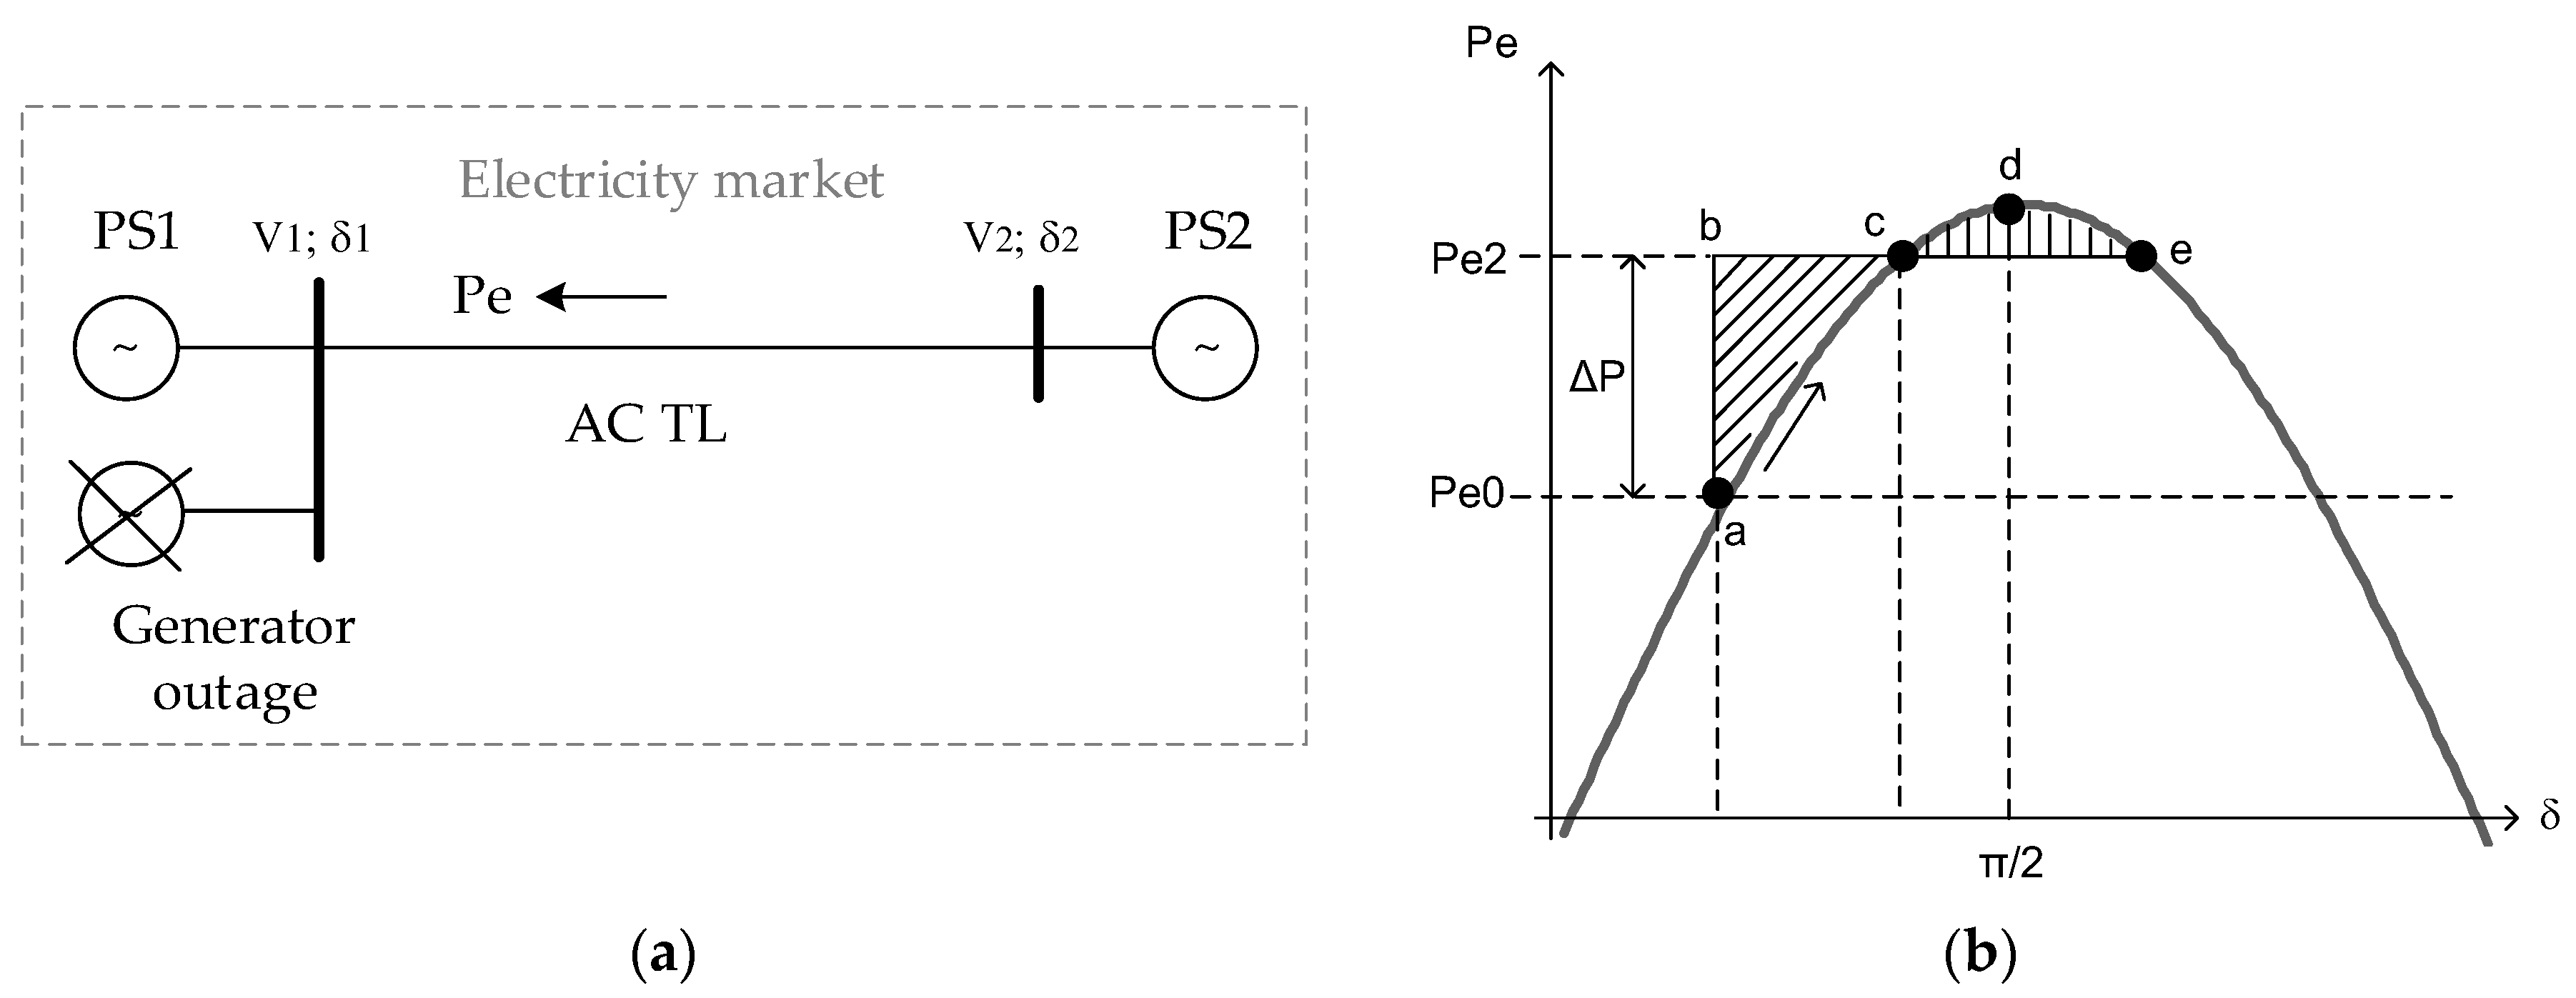
Figure 3.
Representation of (a) fast injection of additional power in PS1 on rising slope and (b) fast injection of additional power in PS1 on falling slope, using the EAC.
Figure 3.
Representation of (a) fast injection of additional power in PS1 on rising slope and (b) fast injection of additional power in PS1 on falling slope, using the EAC.
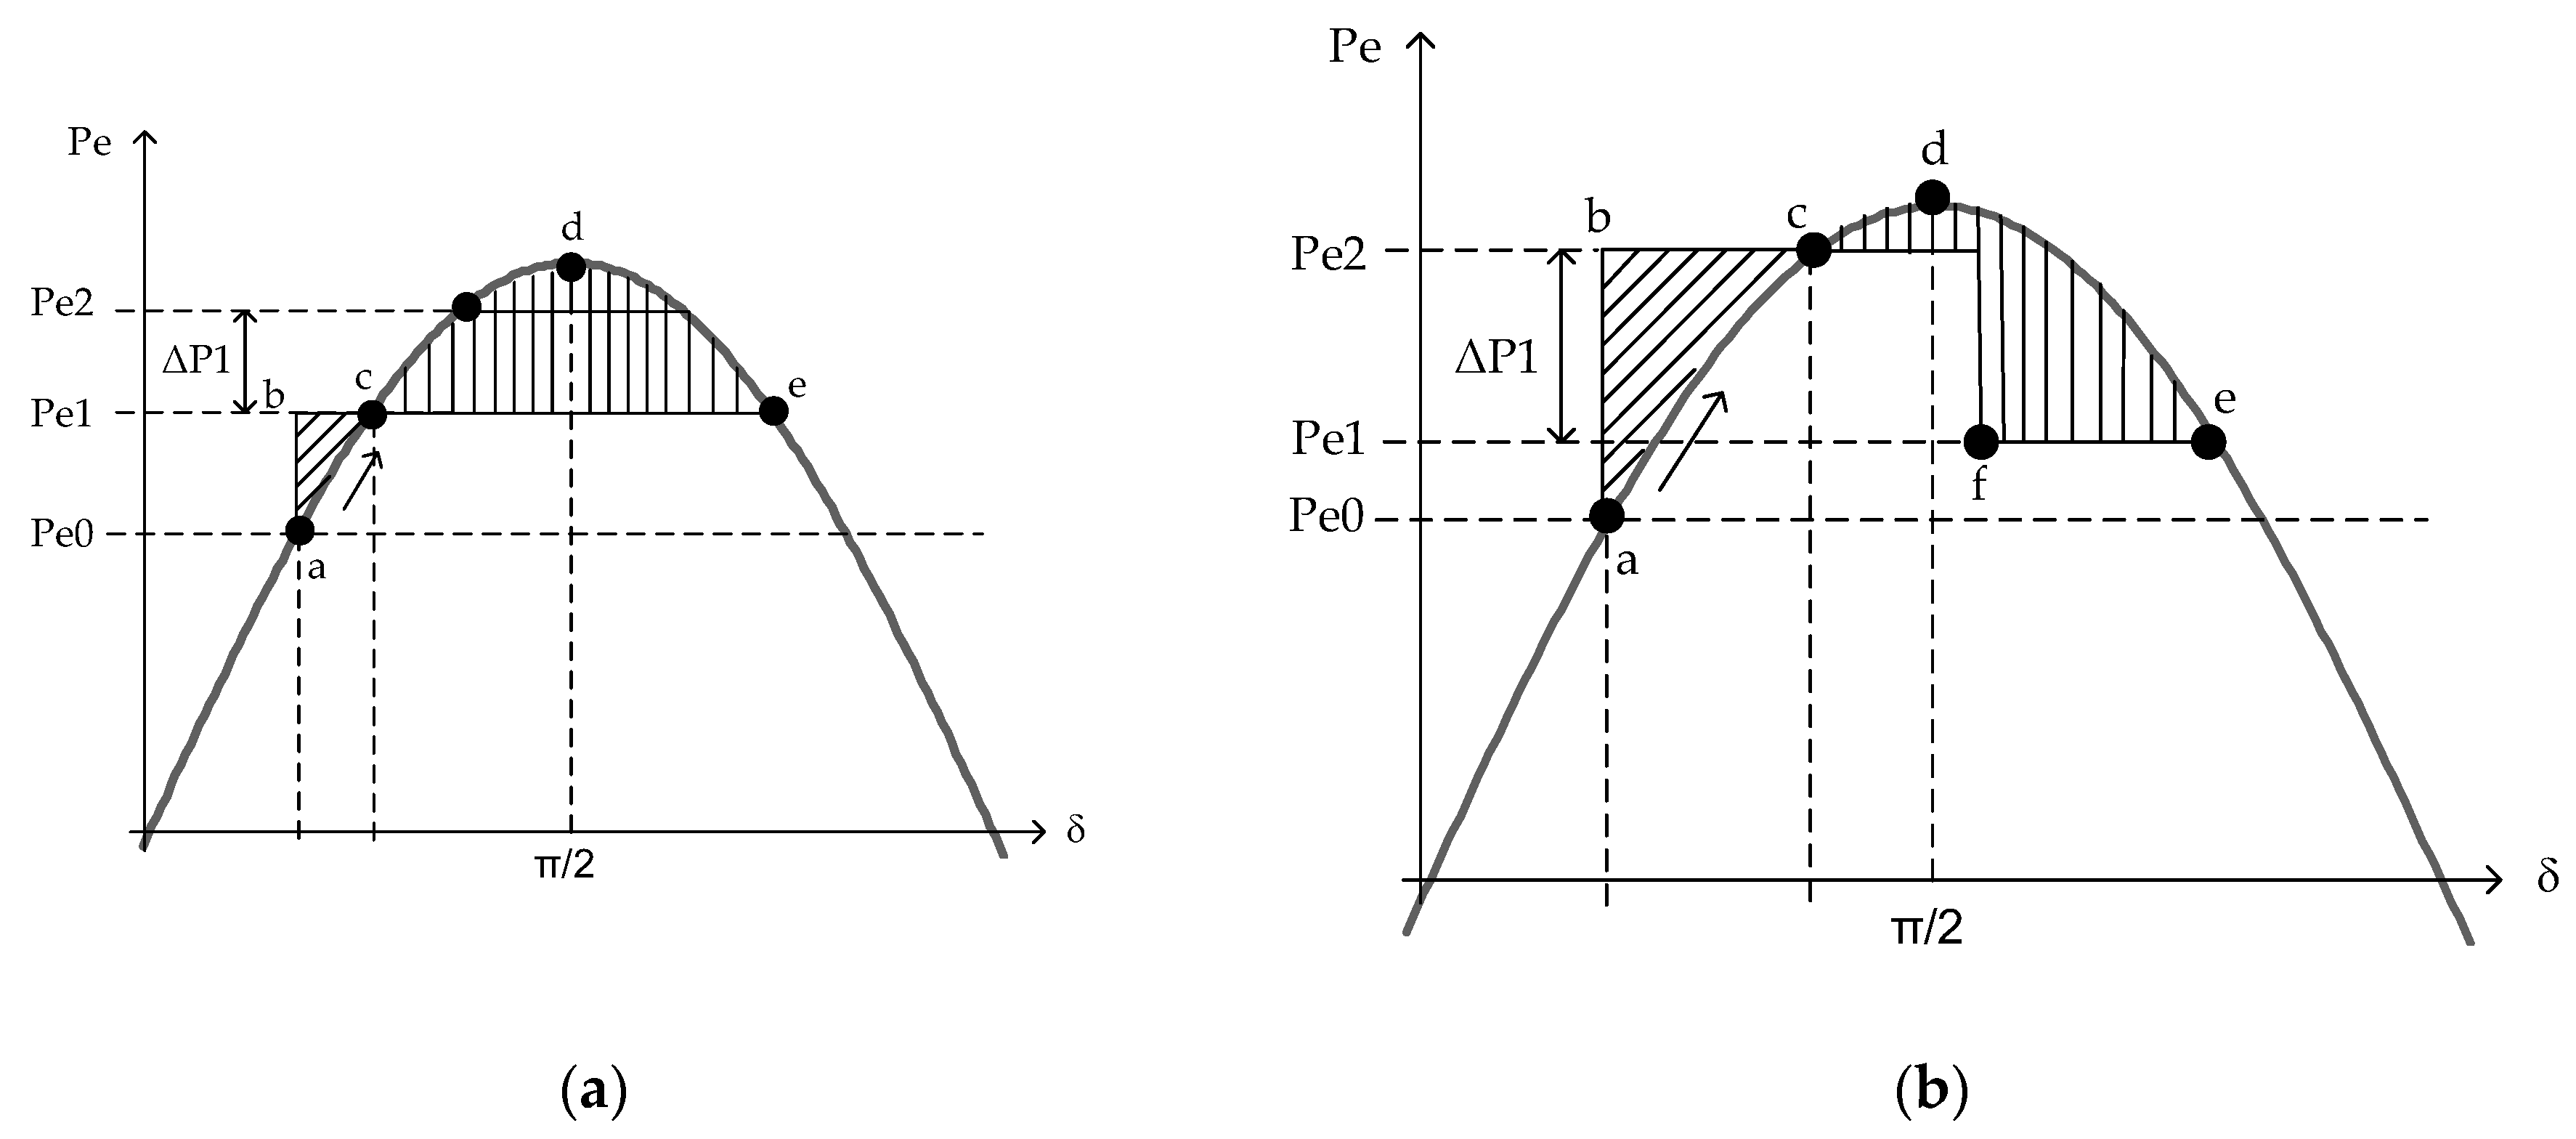
Figure 4.
Angle-control-based OOS protection.
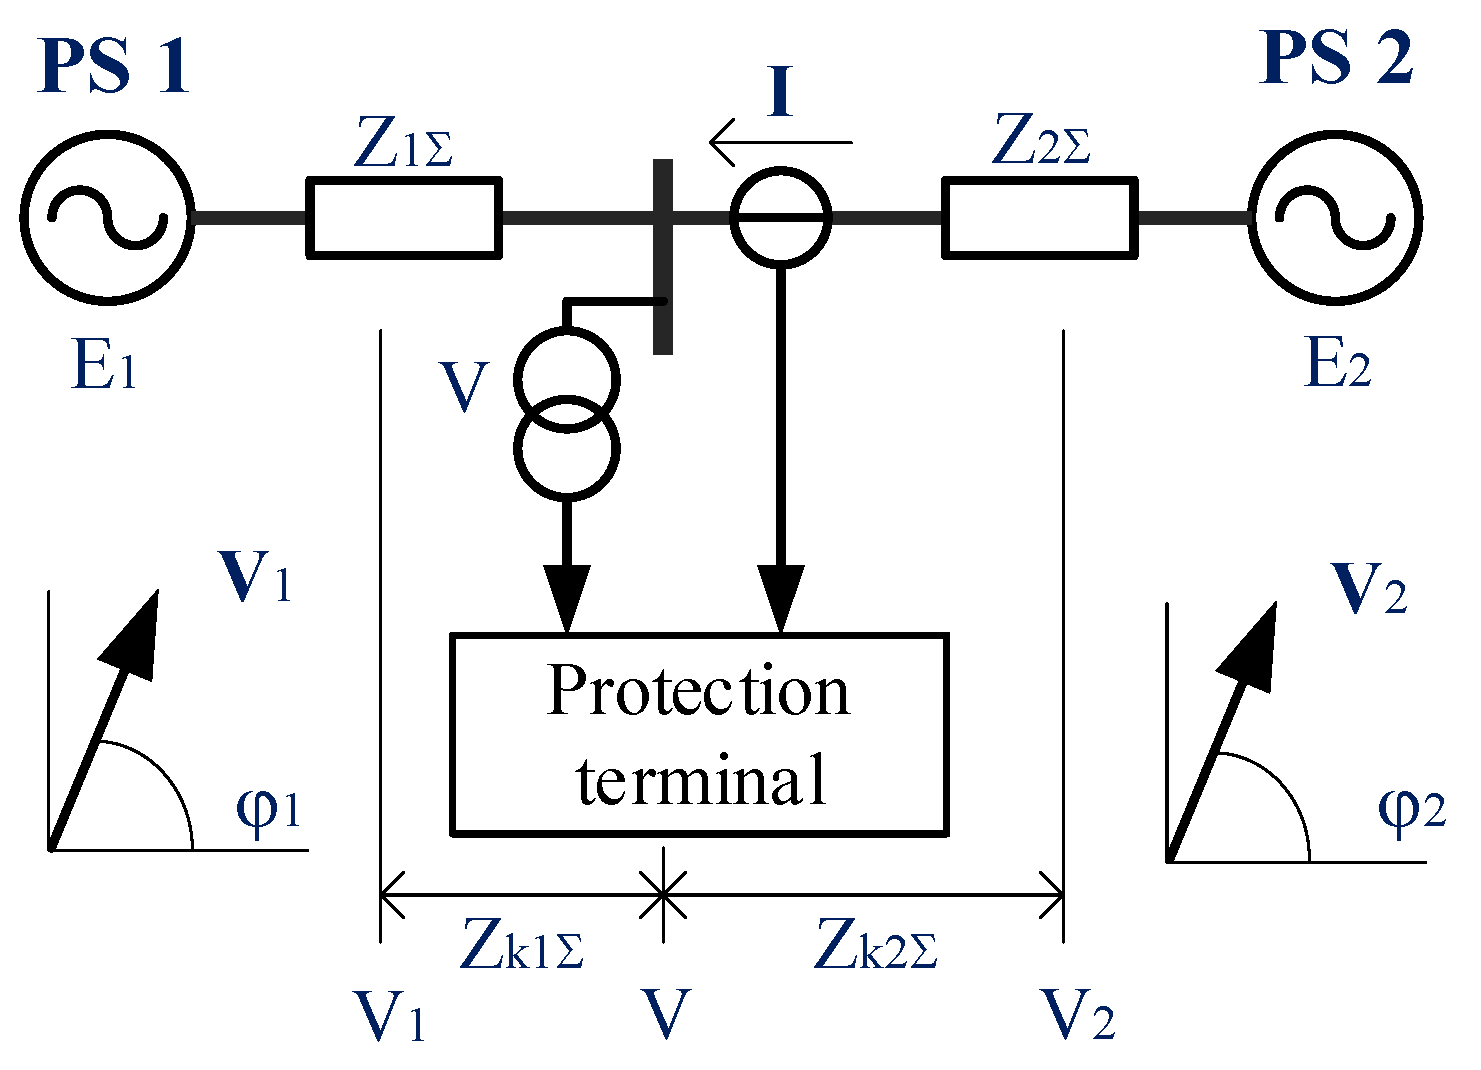
Figure 5.
Structural block diagram of a system with a PSHPP.
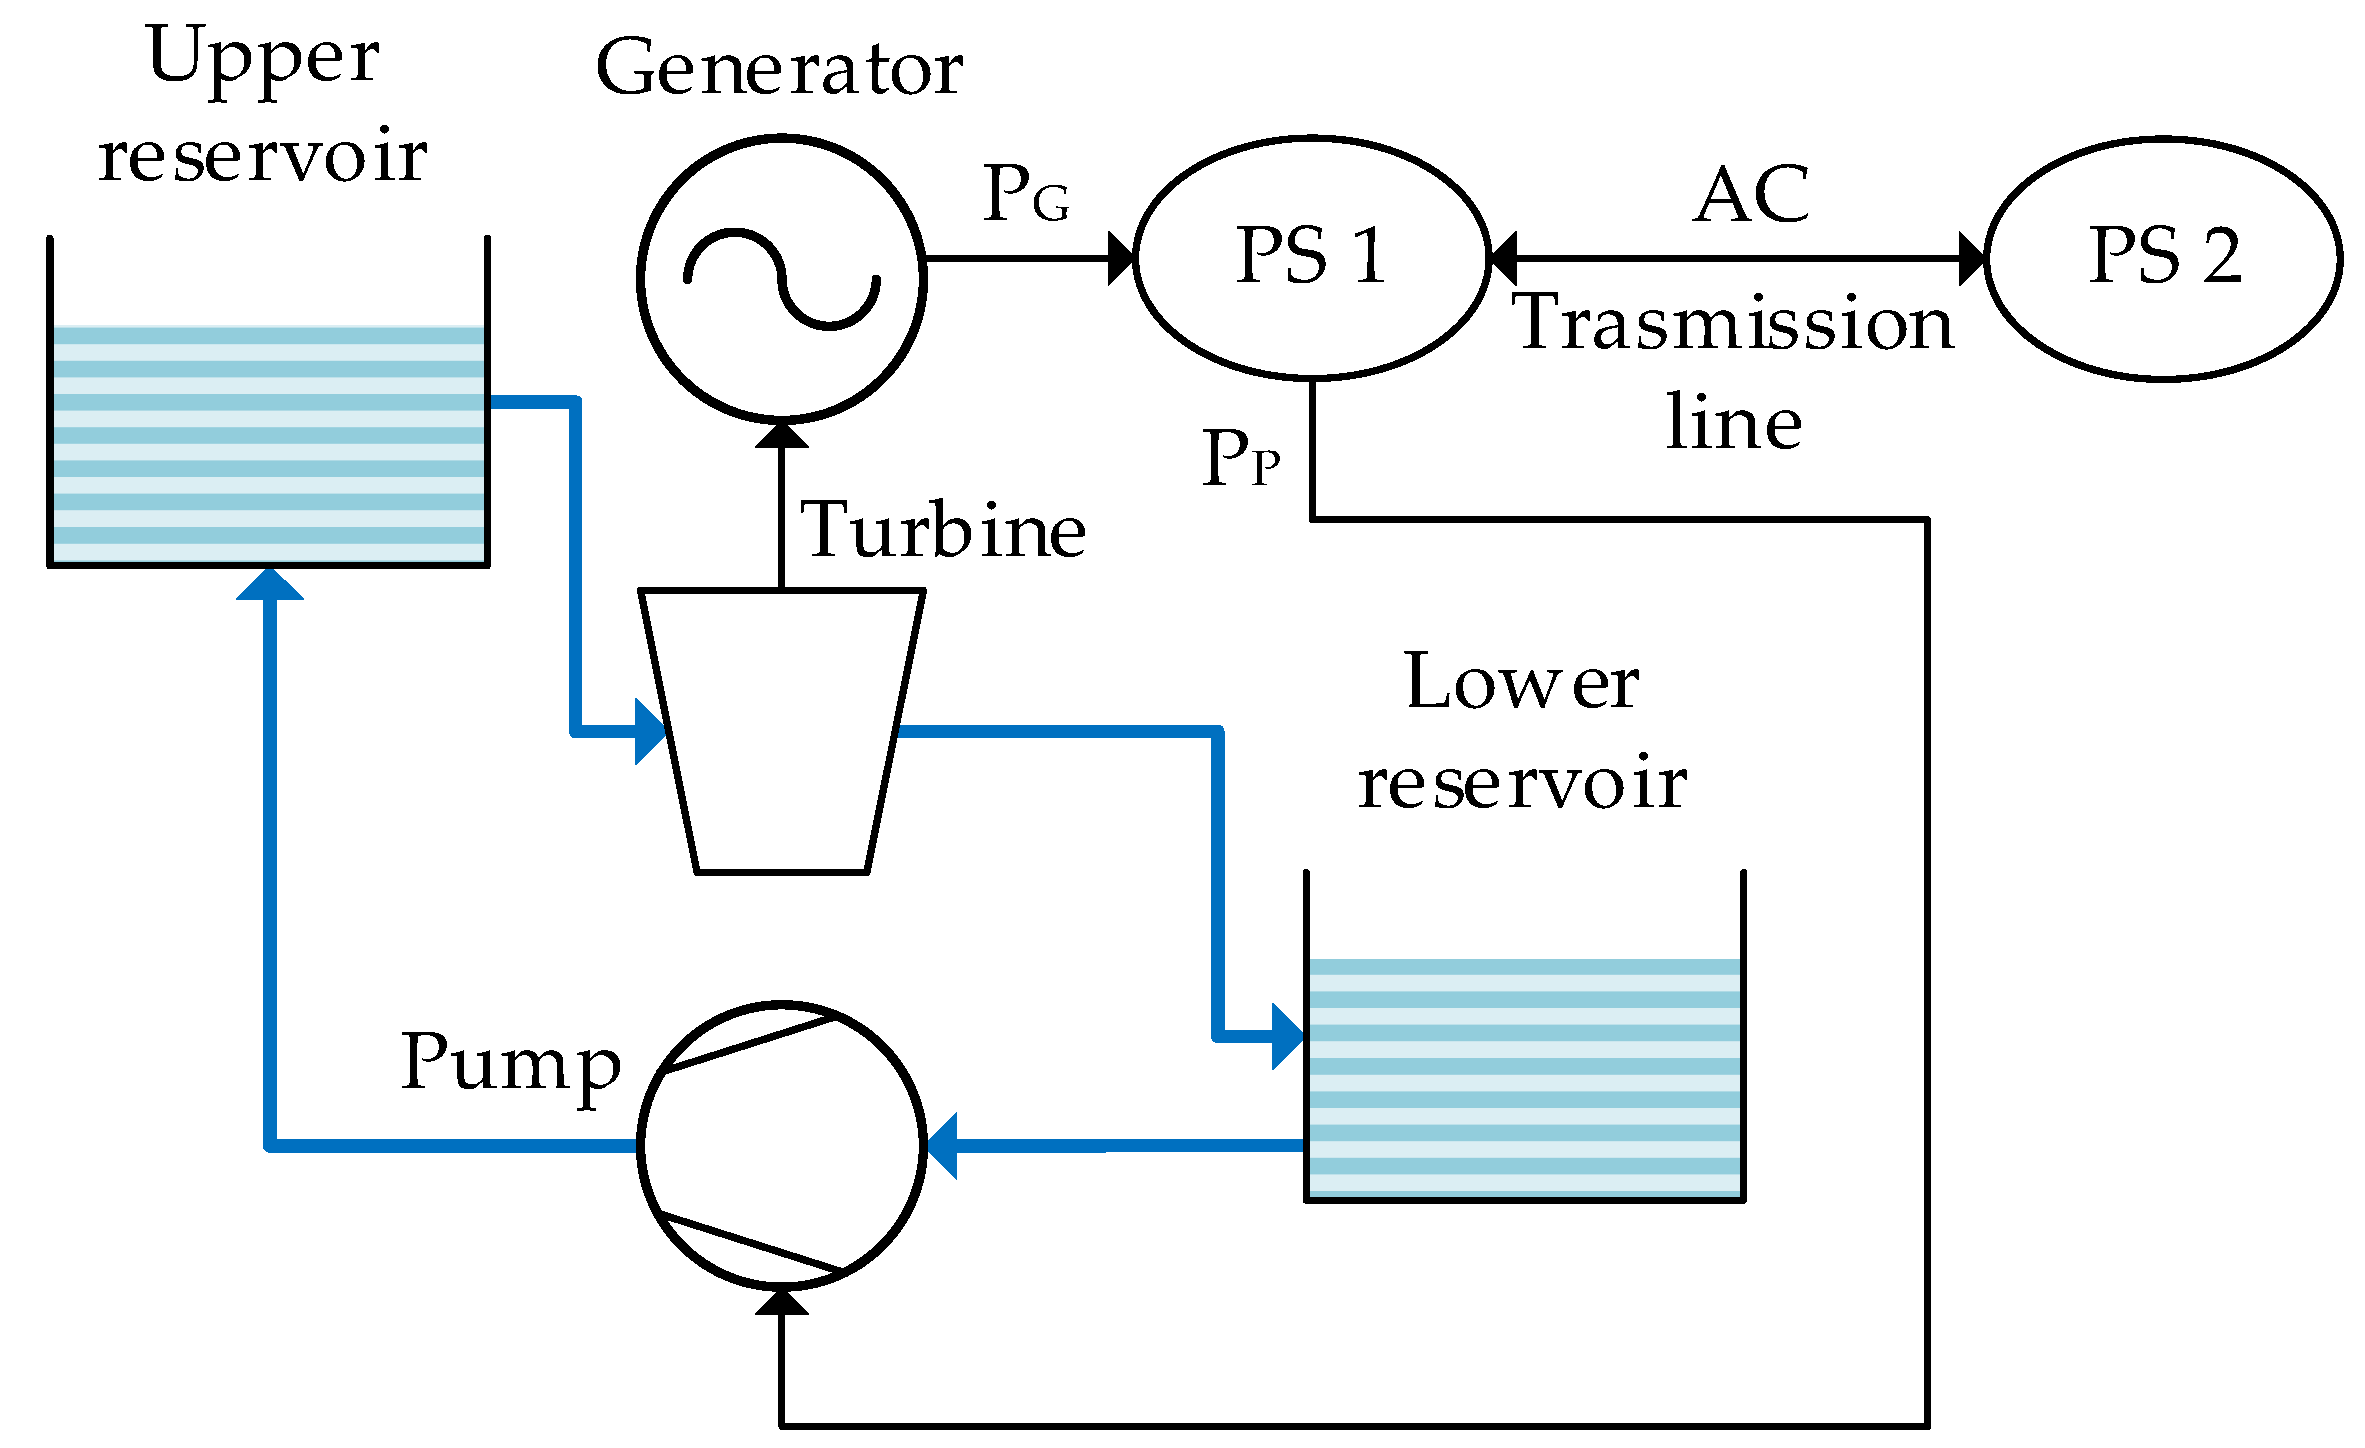
Figure 6.
Assessment structure of the impact of restrictions on the estimation of consumption costs (MS1– market simulation, case 1; MS – simulation of power market, case 2; Δ MS – cost difference).
Figure 6.
Assessment structure of the impact of restrictions on the estimation of consumption costs (MS1– market simulation, case 1; MS – simulation of power market, case 2; Δ MS – cost difference).
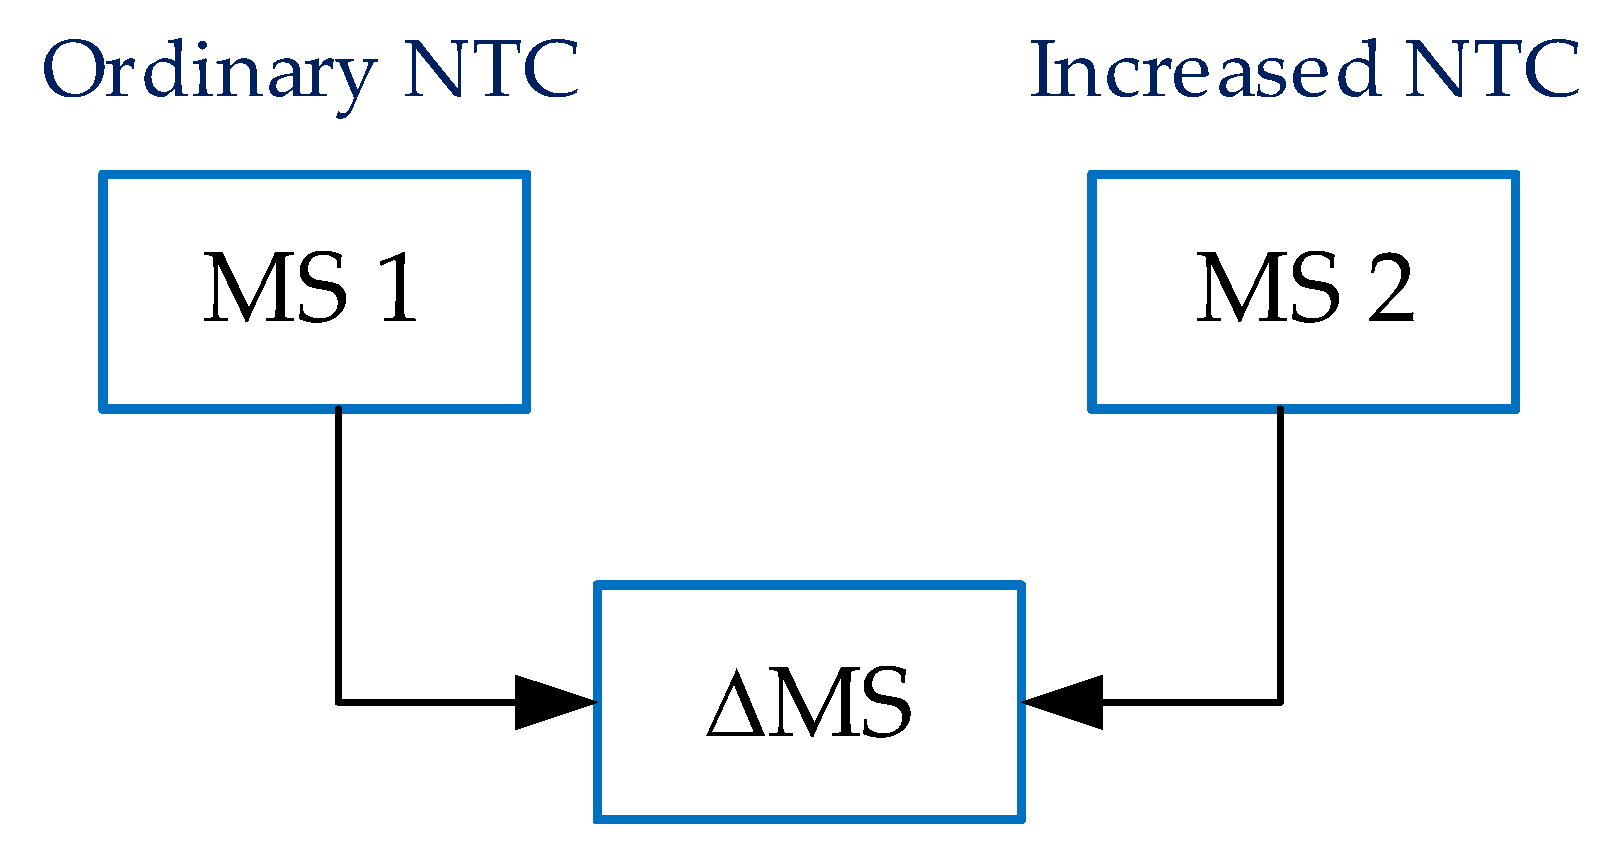
Figure 7.
The portfolio of the power plants and interconnections: pumped storage hydropower plant (PSHPP), hydropower plant (HPP), solar power plant (SPP), wind power plant (WPP), seasonal energy storage (SES), combined heat and power plant (CHPP); electricity loads (Demand) and interconnections.
Figure 7.
The portfolio of the power plants and interconnections: pumped storage hydropower plant (PSHPP), hydropower plant (HPP), solar power plant (SPP), wind power plant (WPP), seasonal energy storage (SES), combined heat and power plant (CHPP); electricity loads (Demand) and interconnections.
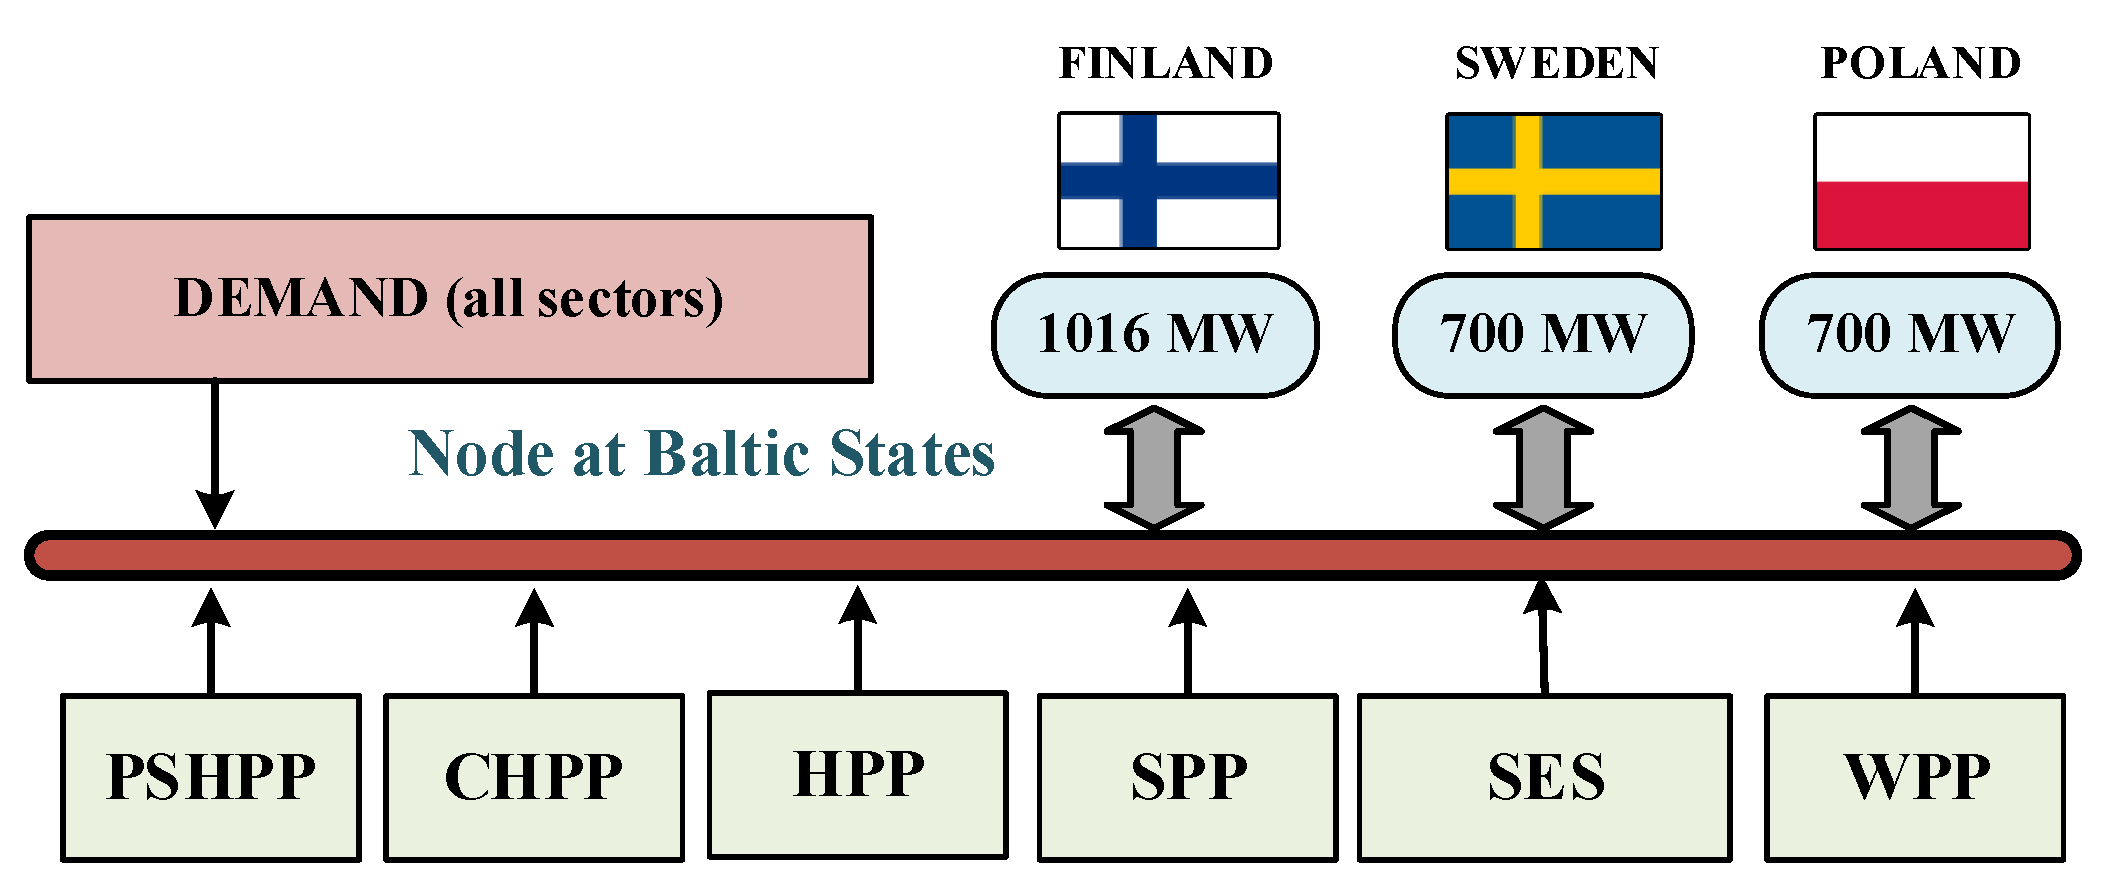
Figure 8.
Modelled Baltic power systems.
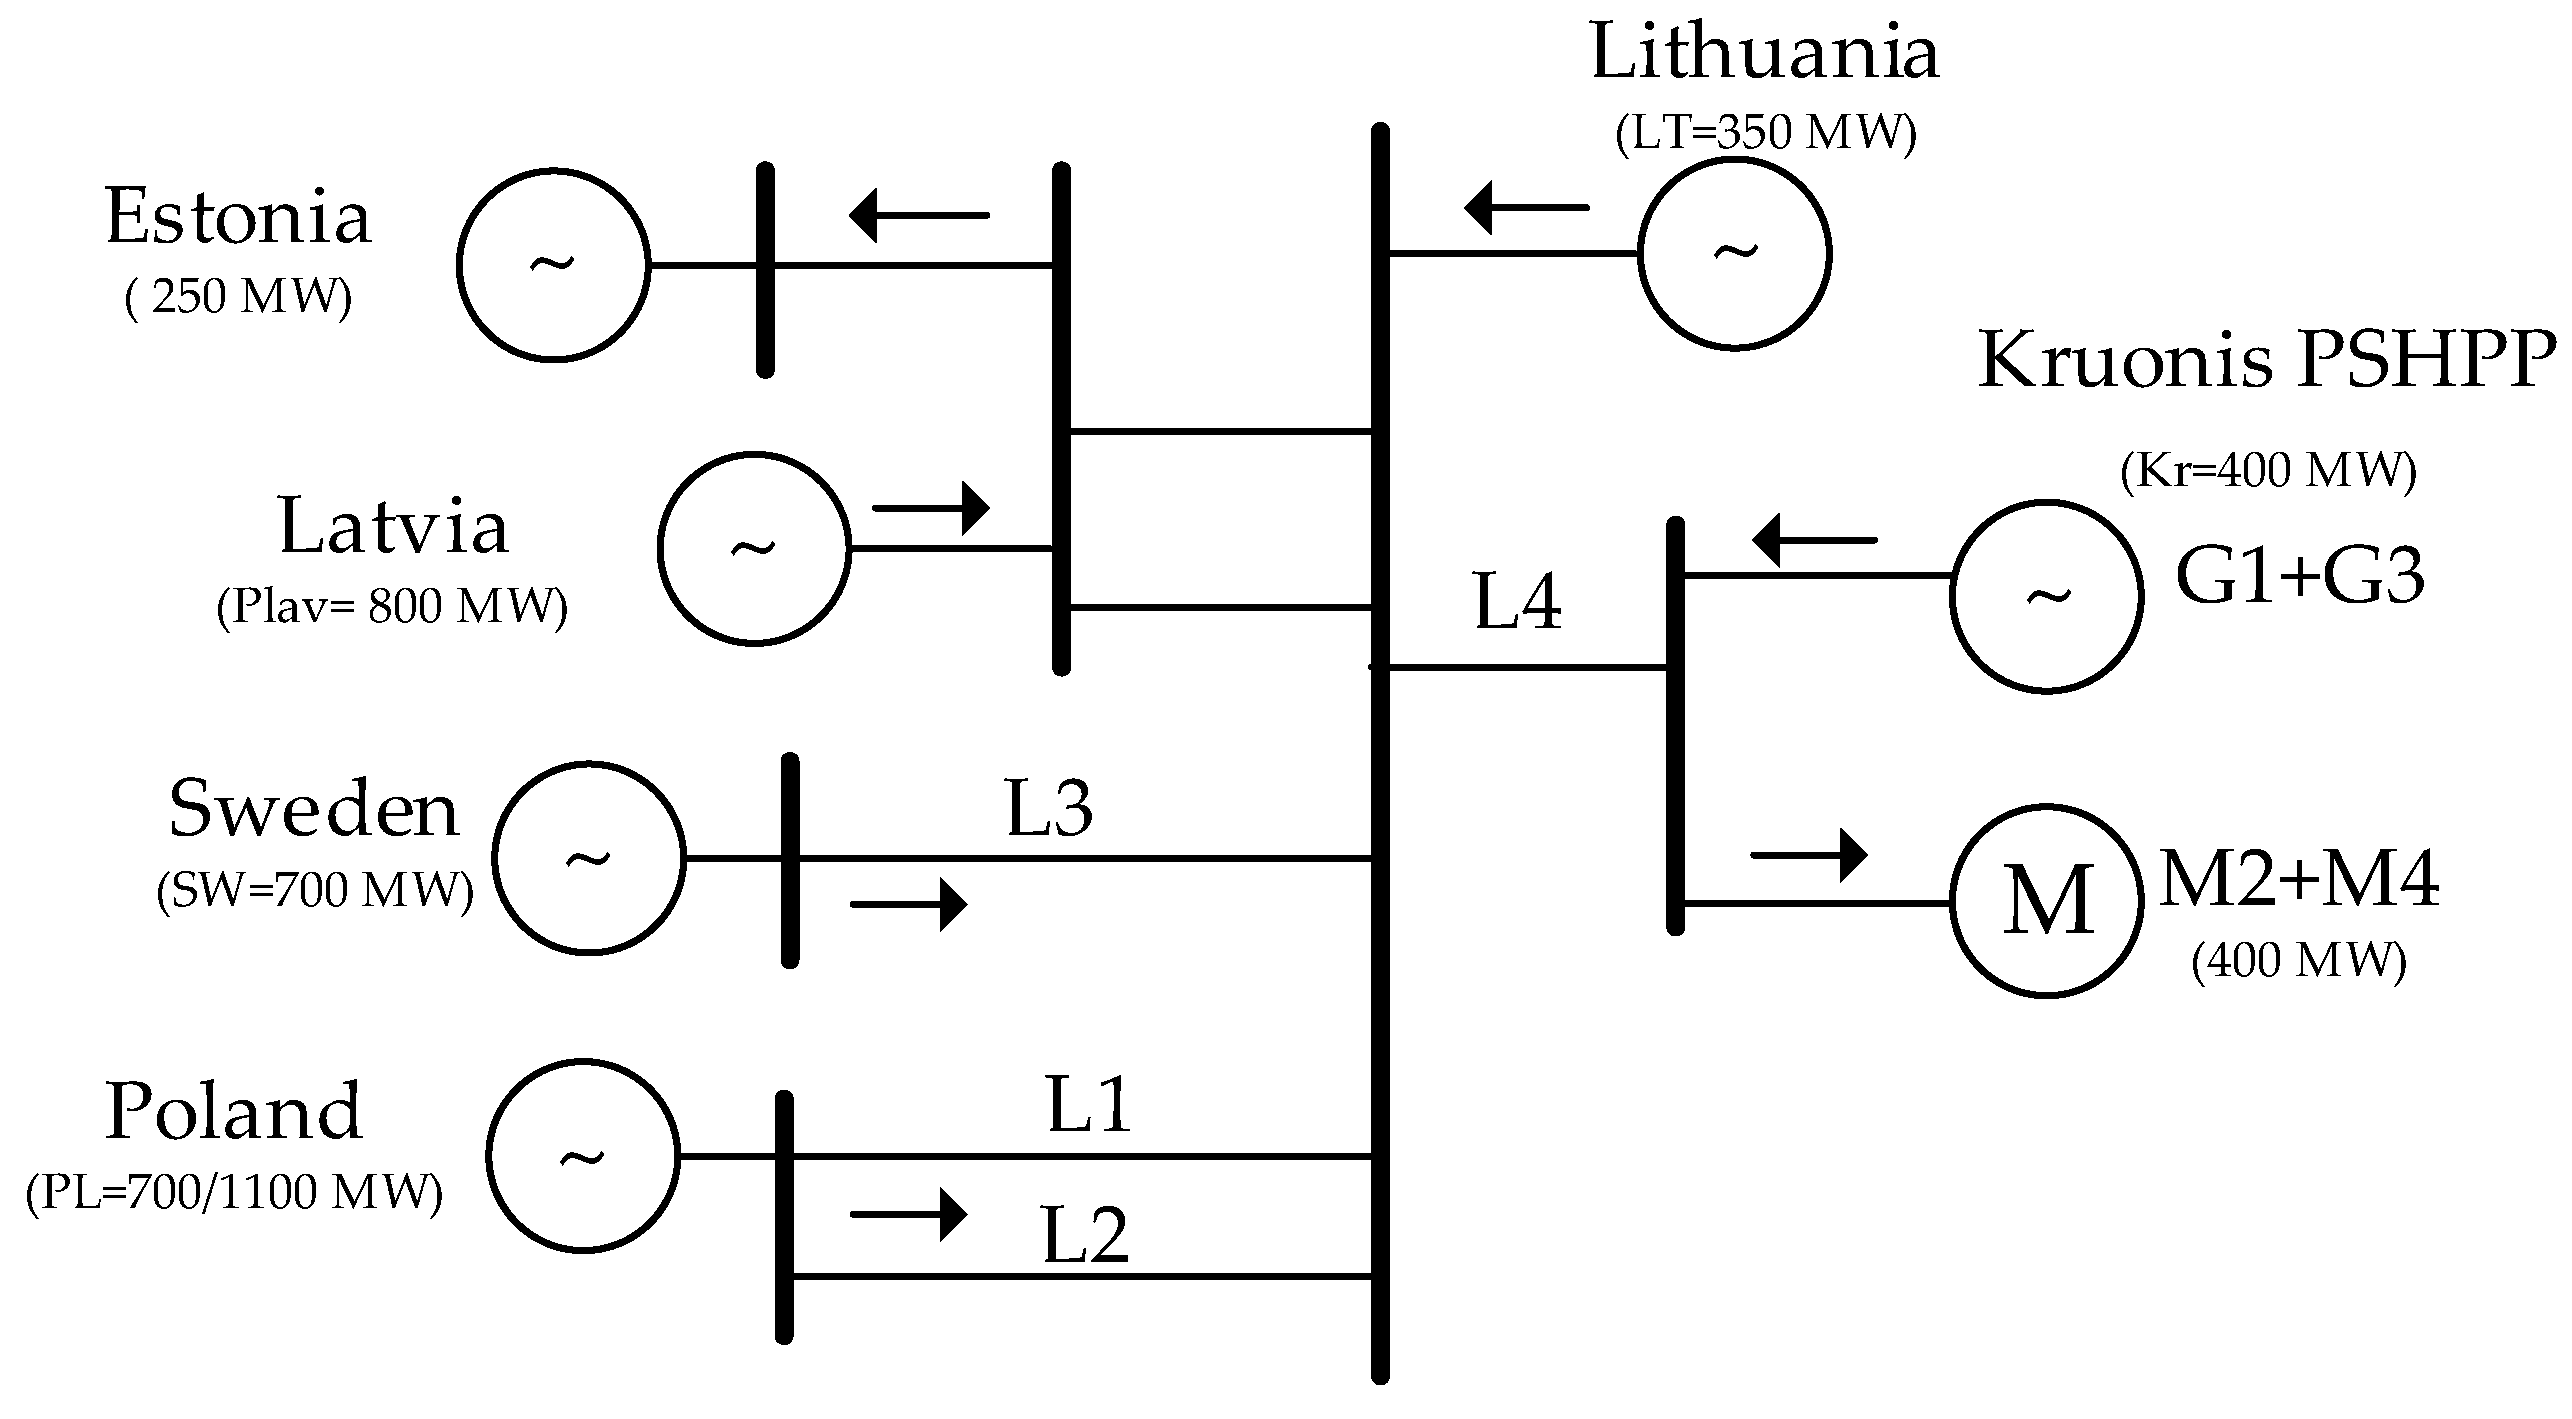
Figure 9.
Scenario S1: (a) generator active power (Pe): at Pļaviņas HPP (LV), Kruonis PSHPP (LT), generation units at LT and PL; (b) generator angle and system frequency; (c) power flow through lines L1 and L2.
Figure 9.
Scenario S1: (a) generator active power (Pe): at Pļaviņas HPP (LV), Kruonis PSHPP (LT), generation units at LT and PL; (b) generator angle and system frequency; (c) power flow through lines L1 and L2.
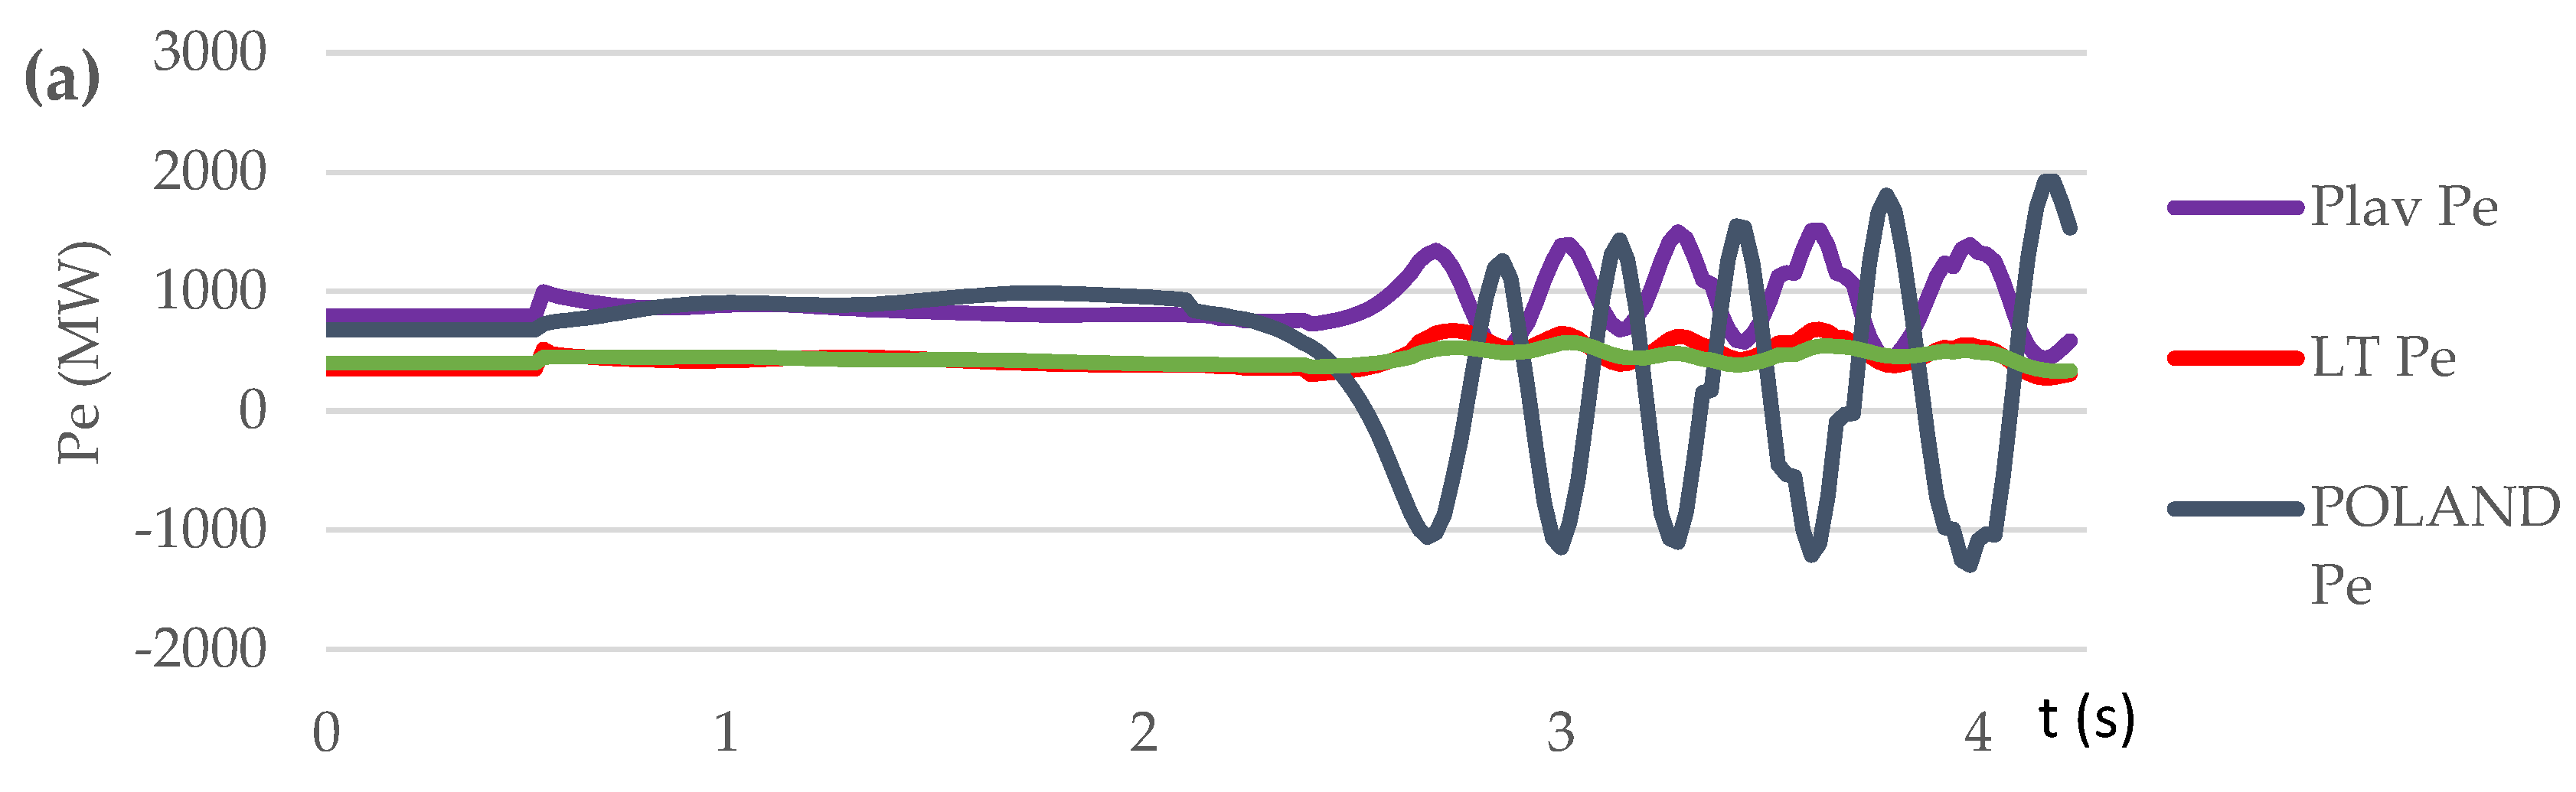
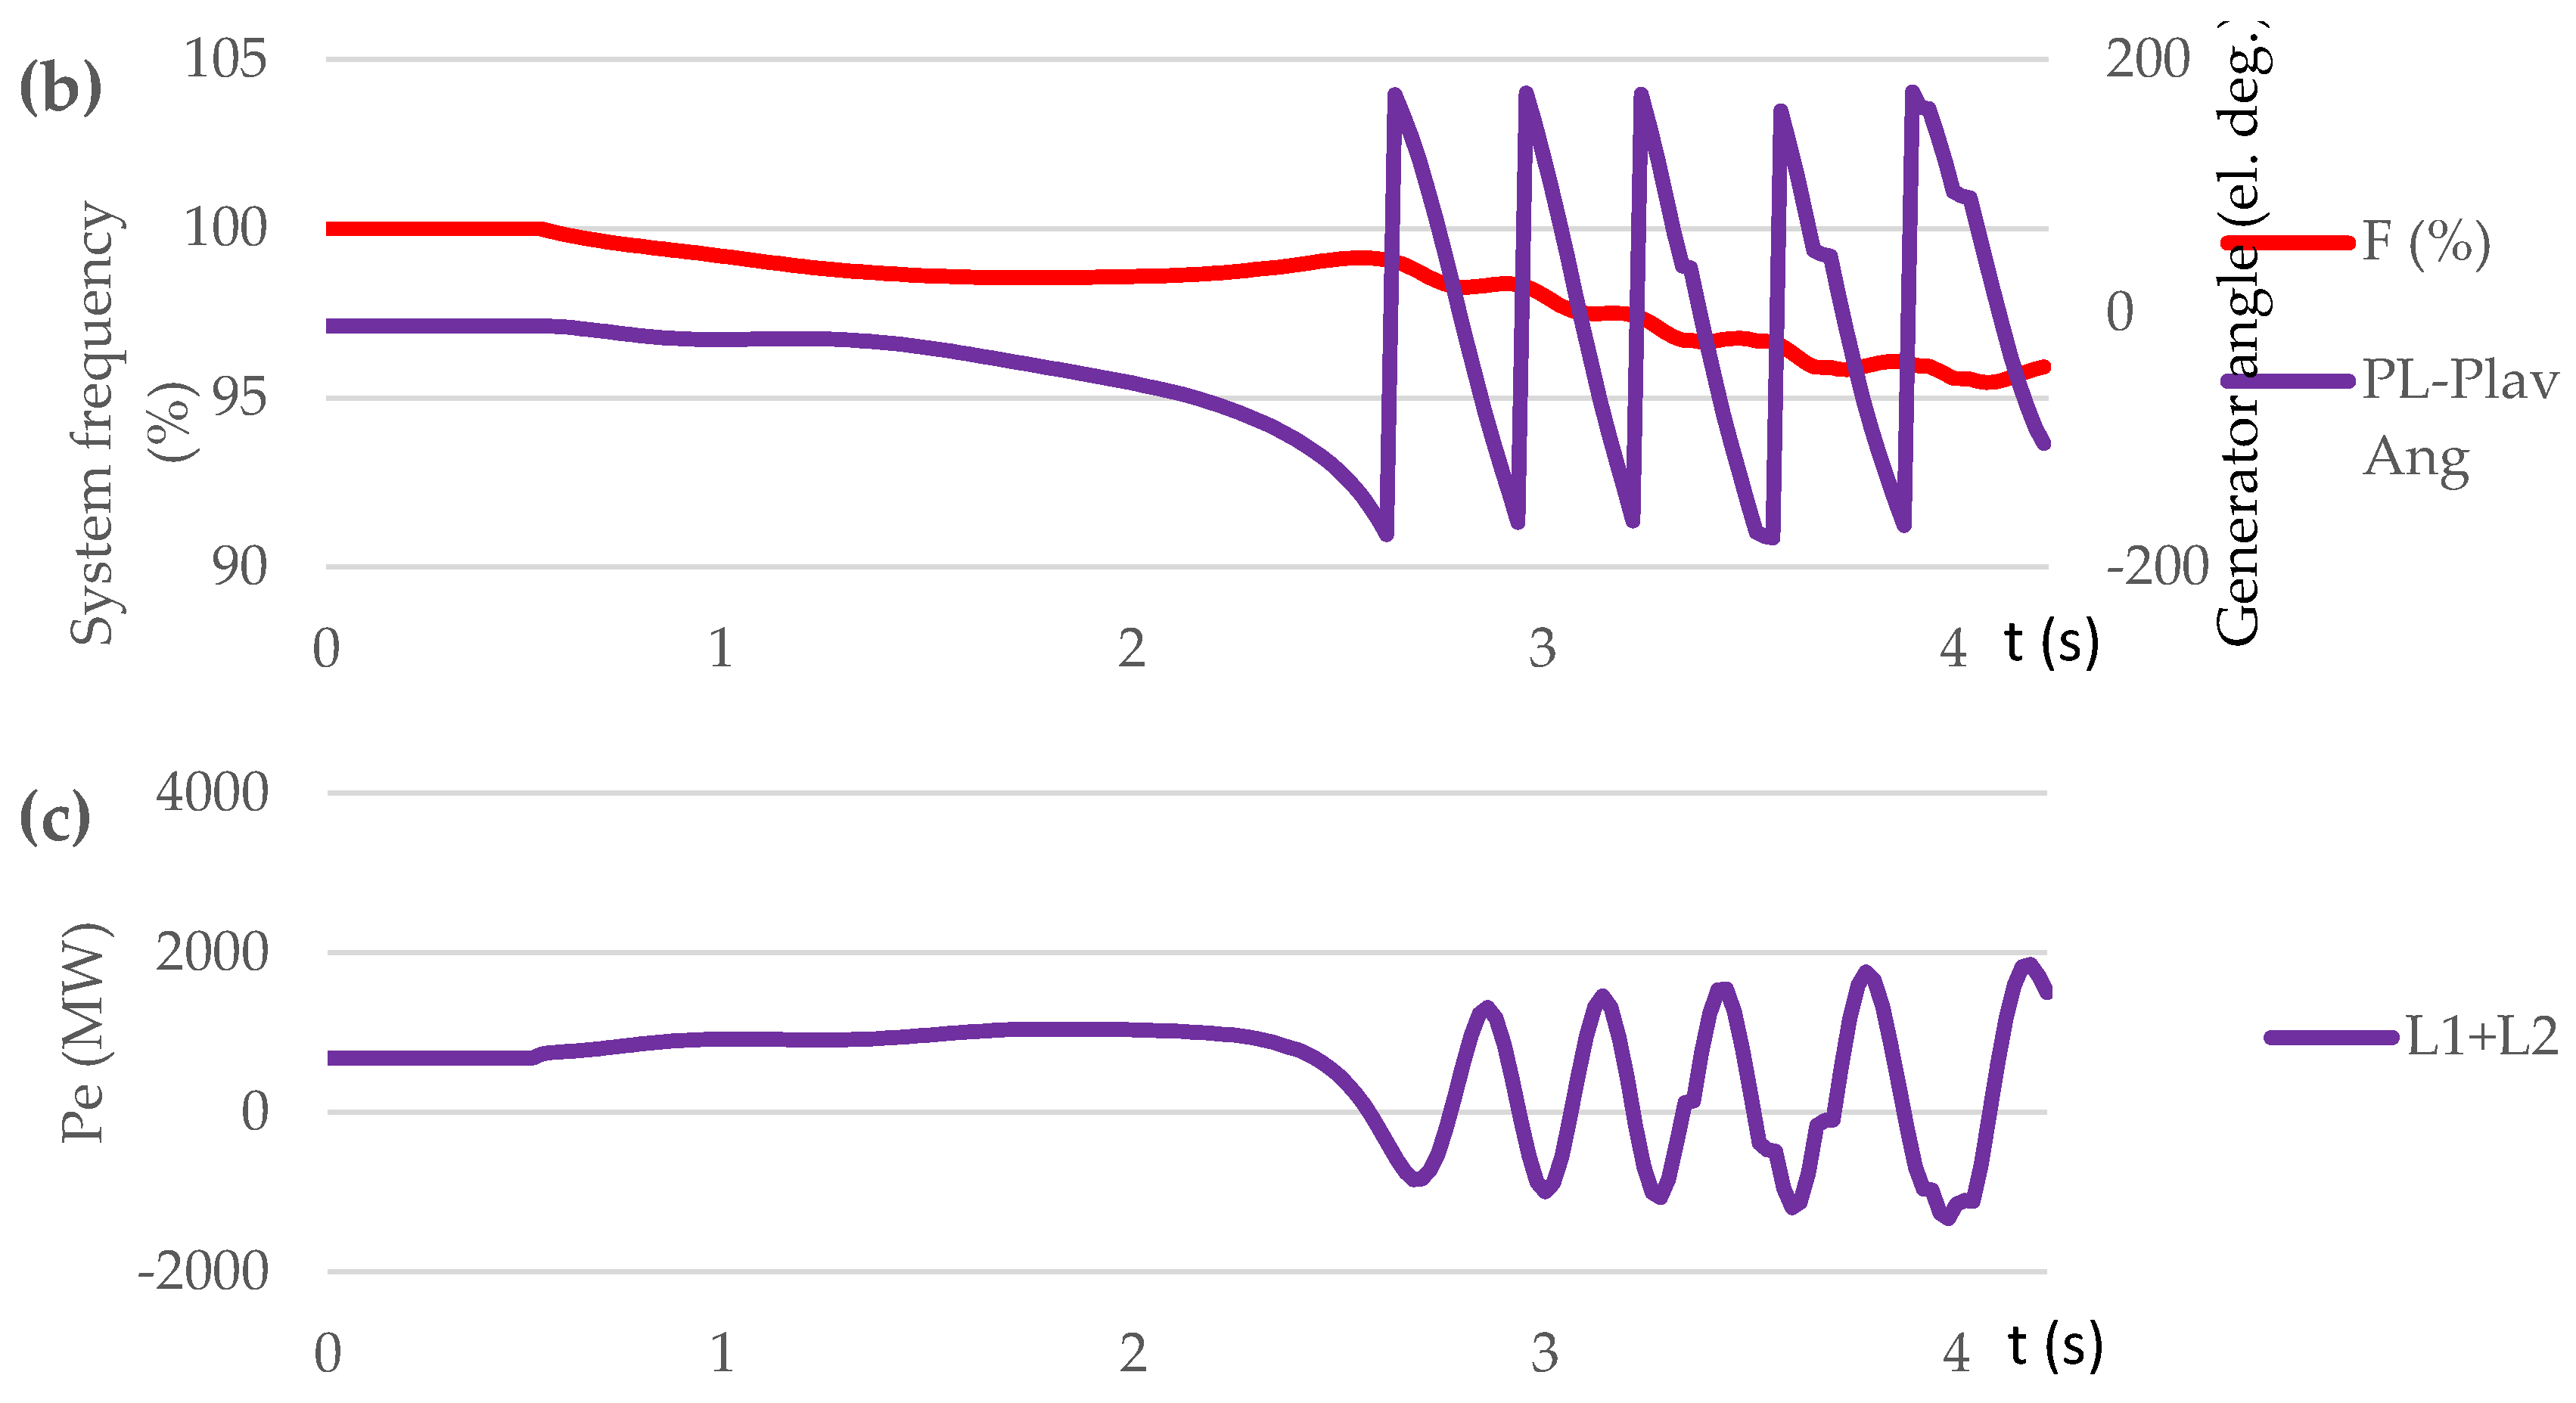
Figure 10.
Scenario S2: (a) generator active power (Pe): at Pļaviņas HPP (LV), Kruonis PSHPP (LT), generation units at LT and PL; (b) generator angle and system frequency; (c) power flow through lines L1 and L2.
Figure 10.
Scenario S2: (a) generator active power (Pe): at Pļaviņas HPP (LV), Kruonis PSHPP (LT), generation units at LT and PL; (b) generator angle and system frequency; (c) power flow through lines L1 and L2.
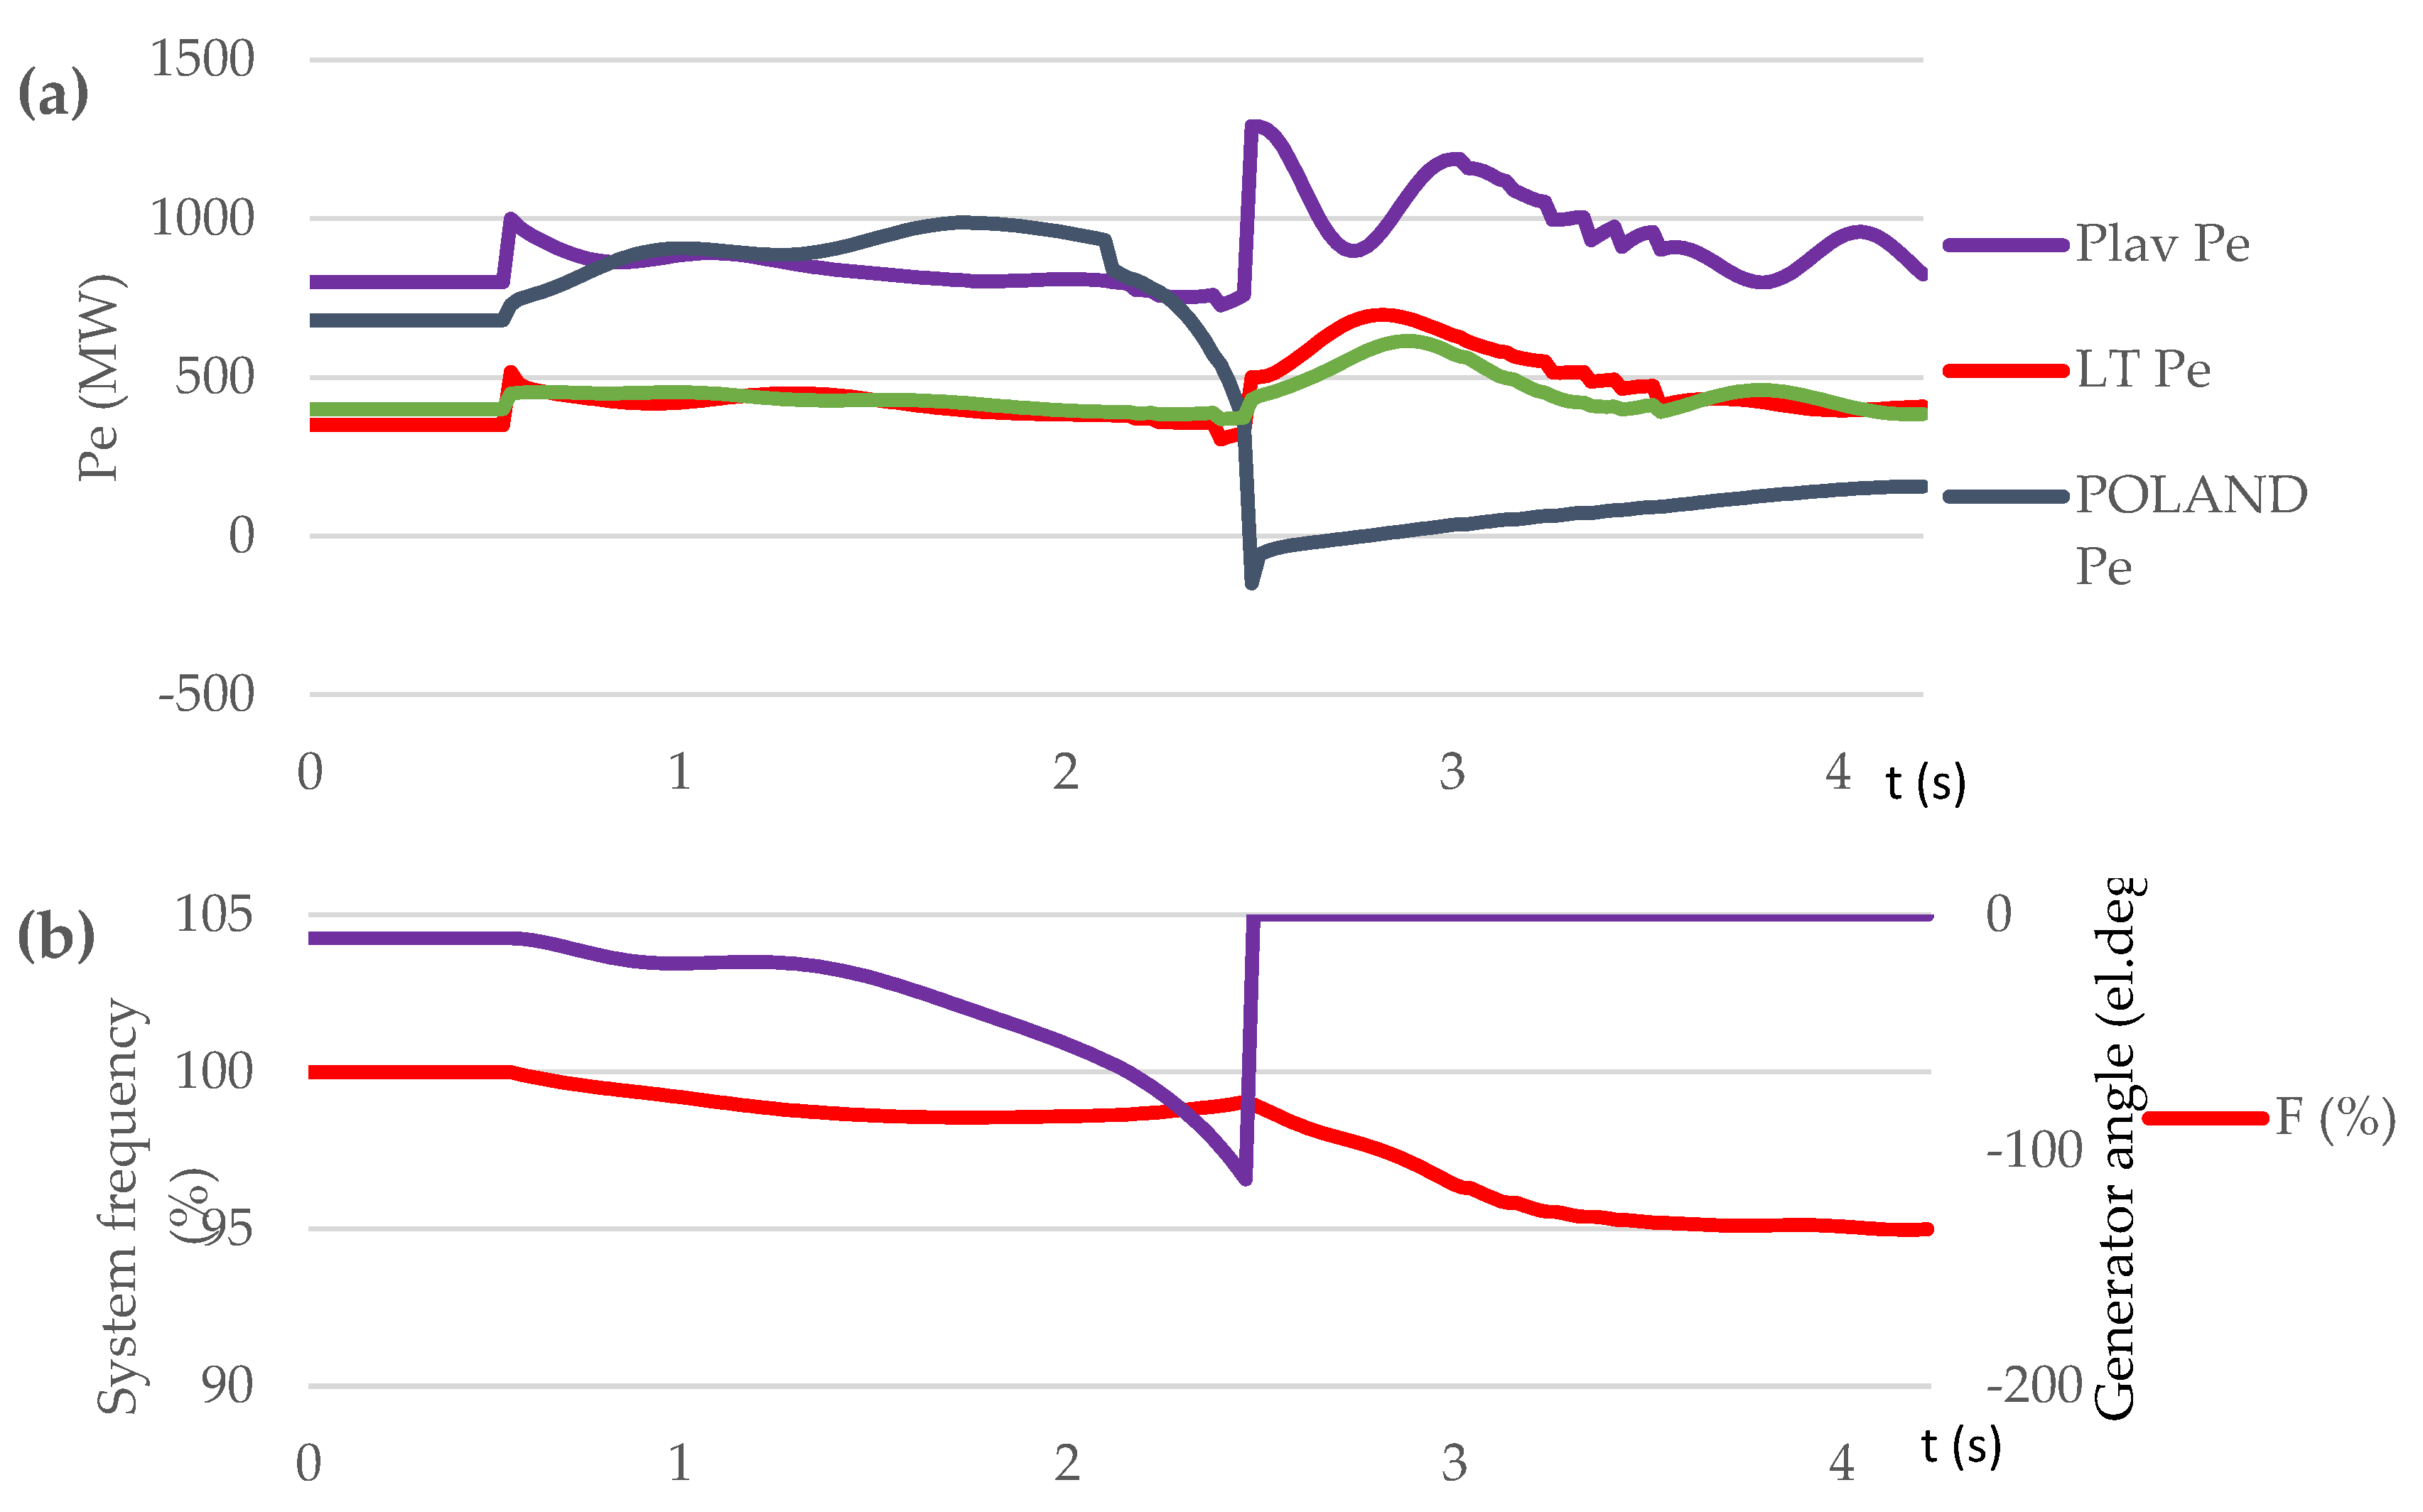
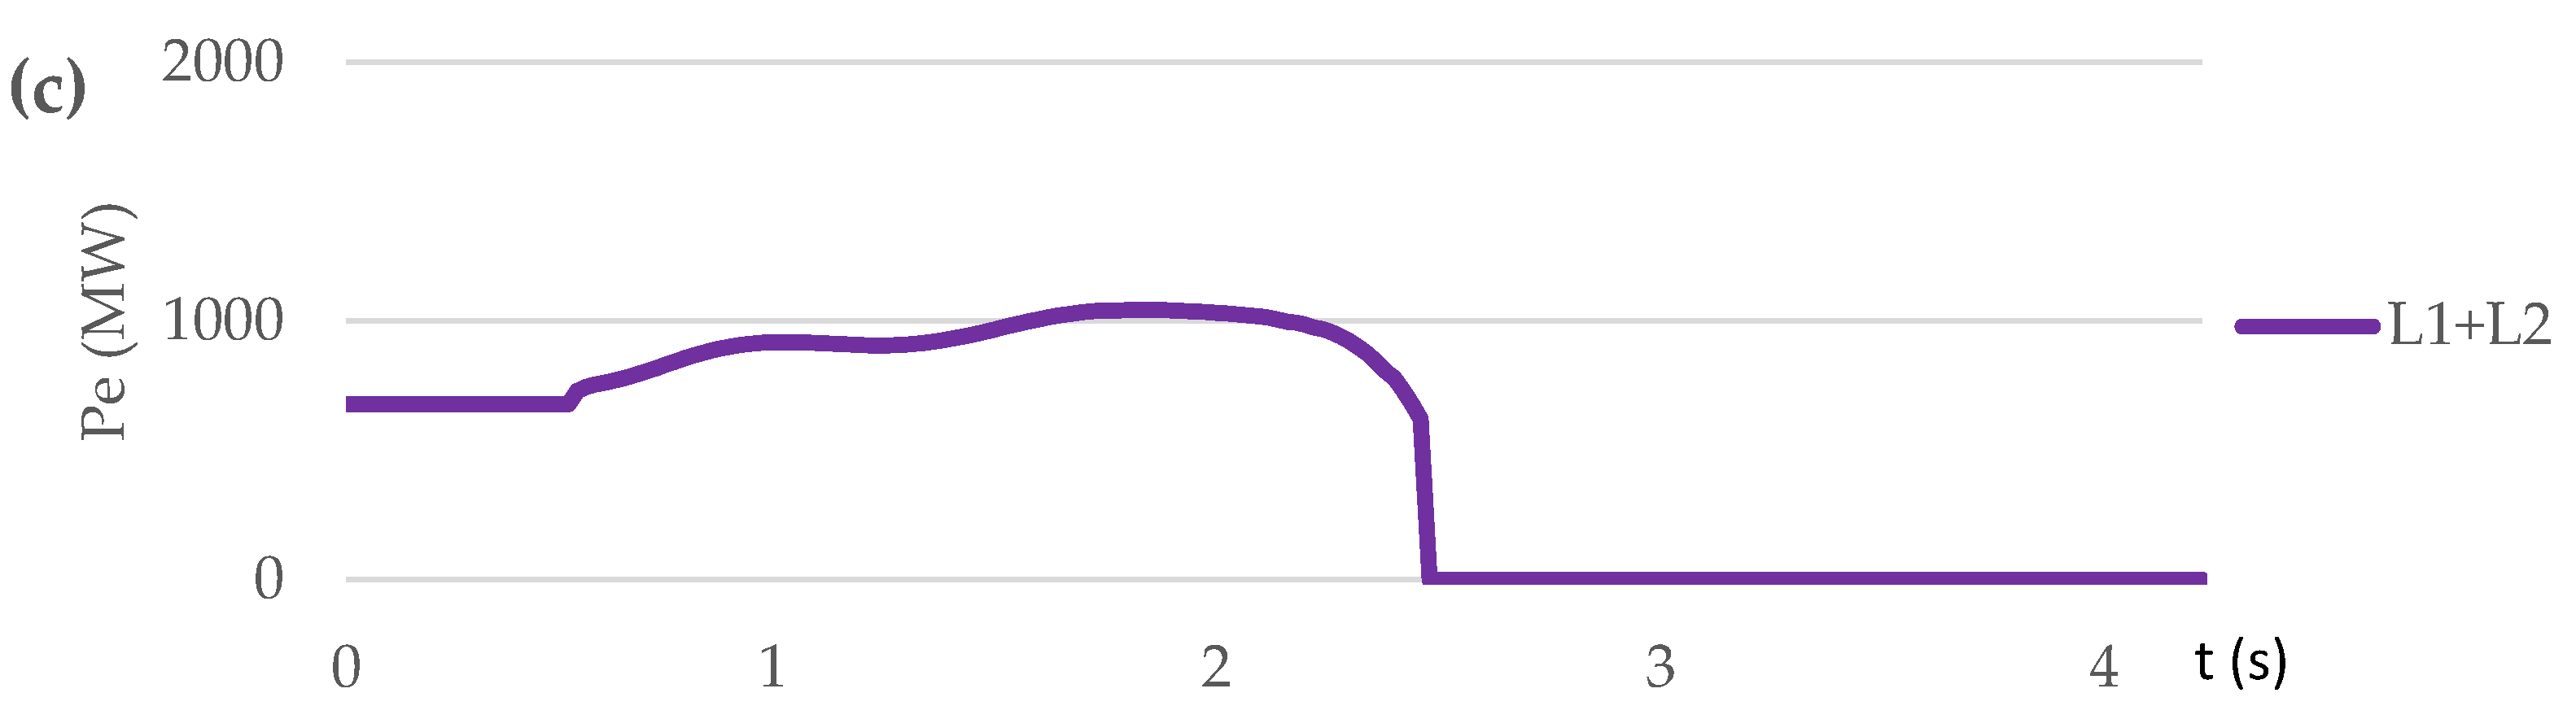
Figure 11.
Scenario S3: (a) generator active power (Pe): at Pļaviņas HPP (LV), Kruonis PSHPP (LT), generation units at PL; (b) generator angle and system frequency; (c) power flow through line L4.
Figure 11.
Scenario S3: (a) generator active power (Pe): at Pļaviņas HPP (LV), Kruonis PSHPP (LT), generation units at PL; (b) generator angle and system frequency; (c) power flow through line L4.
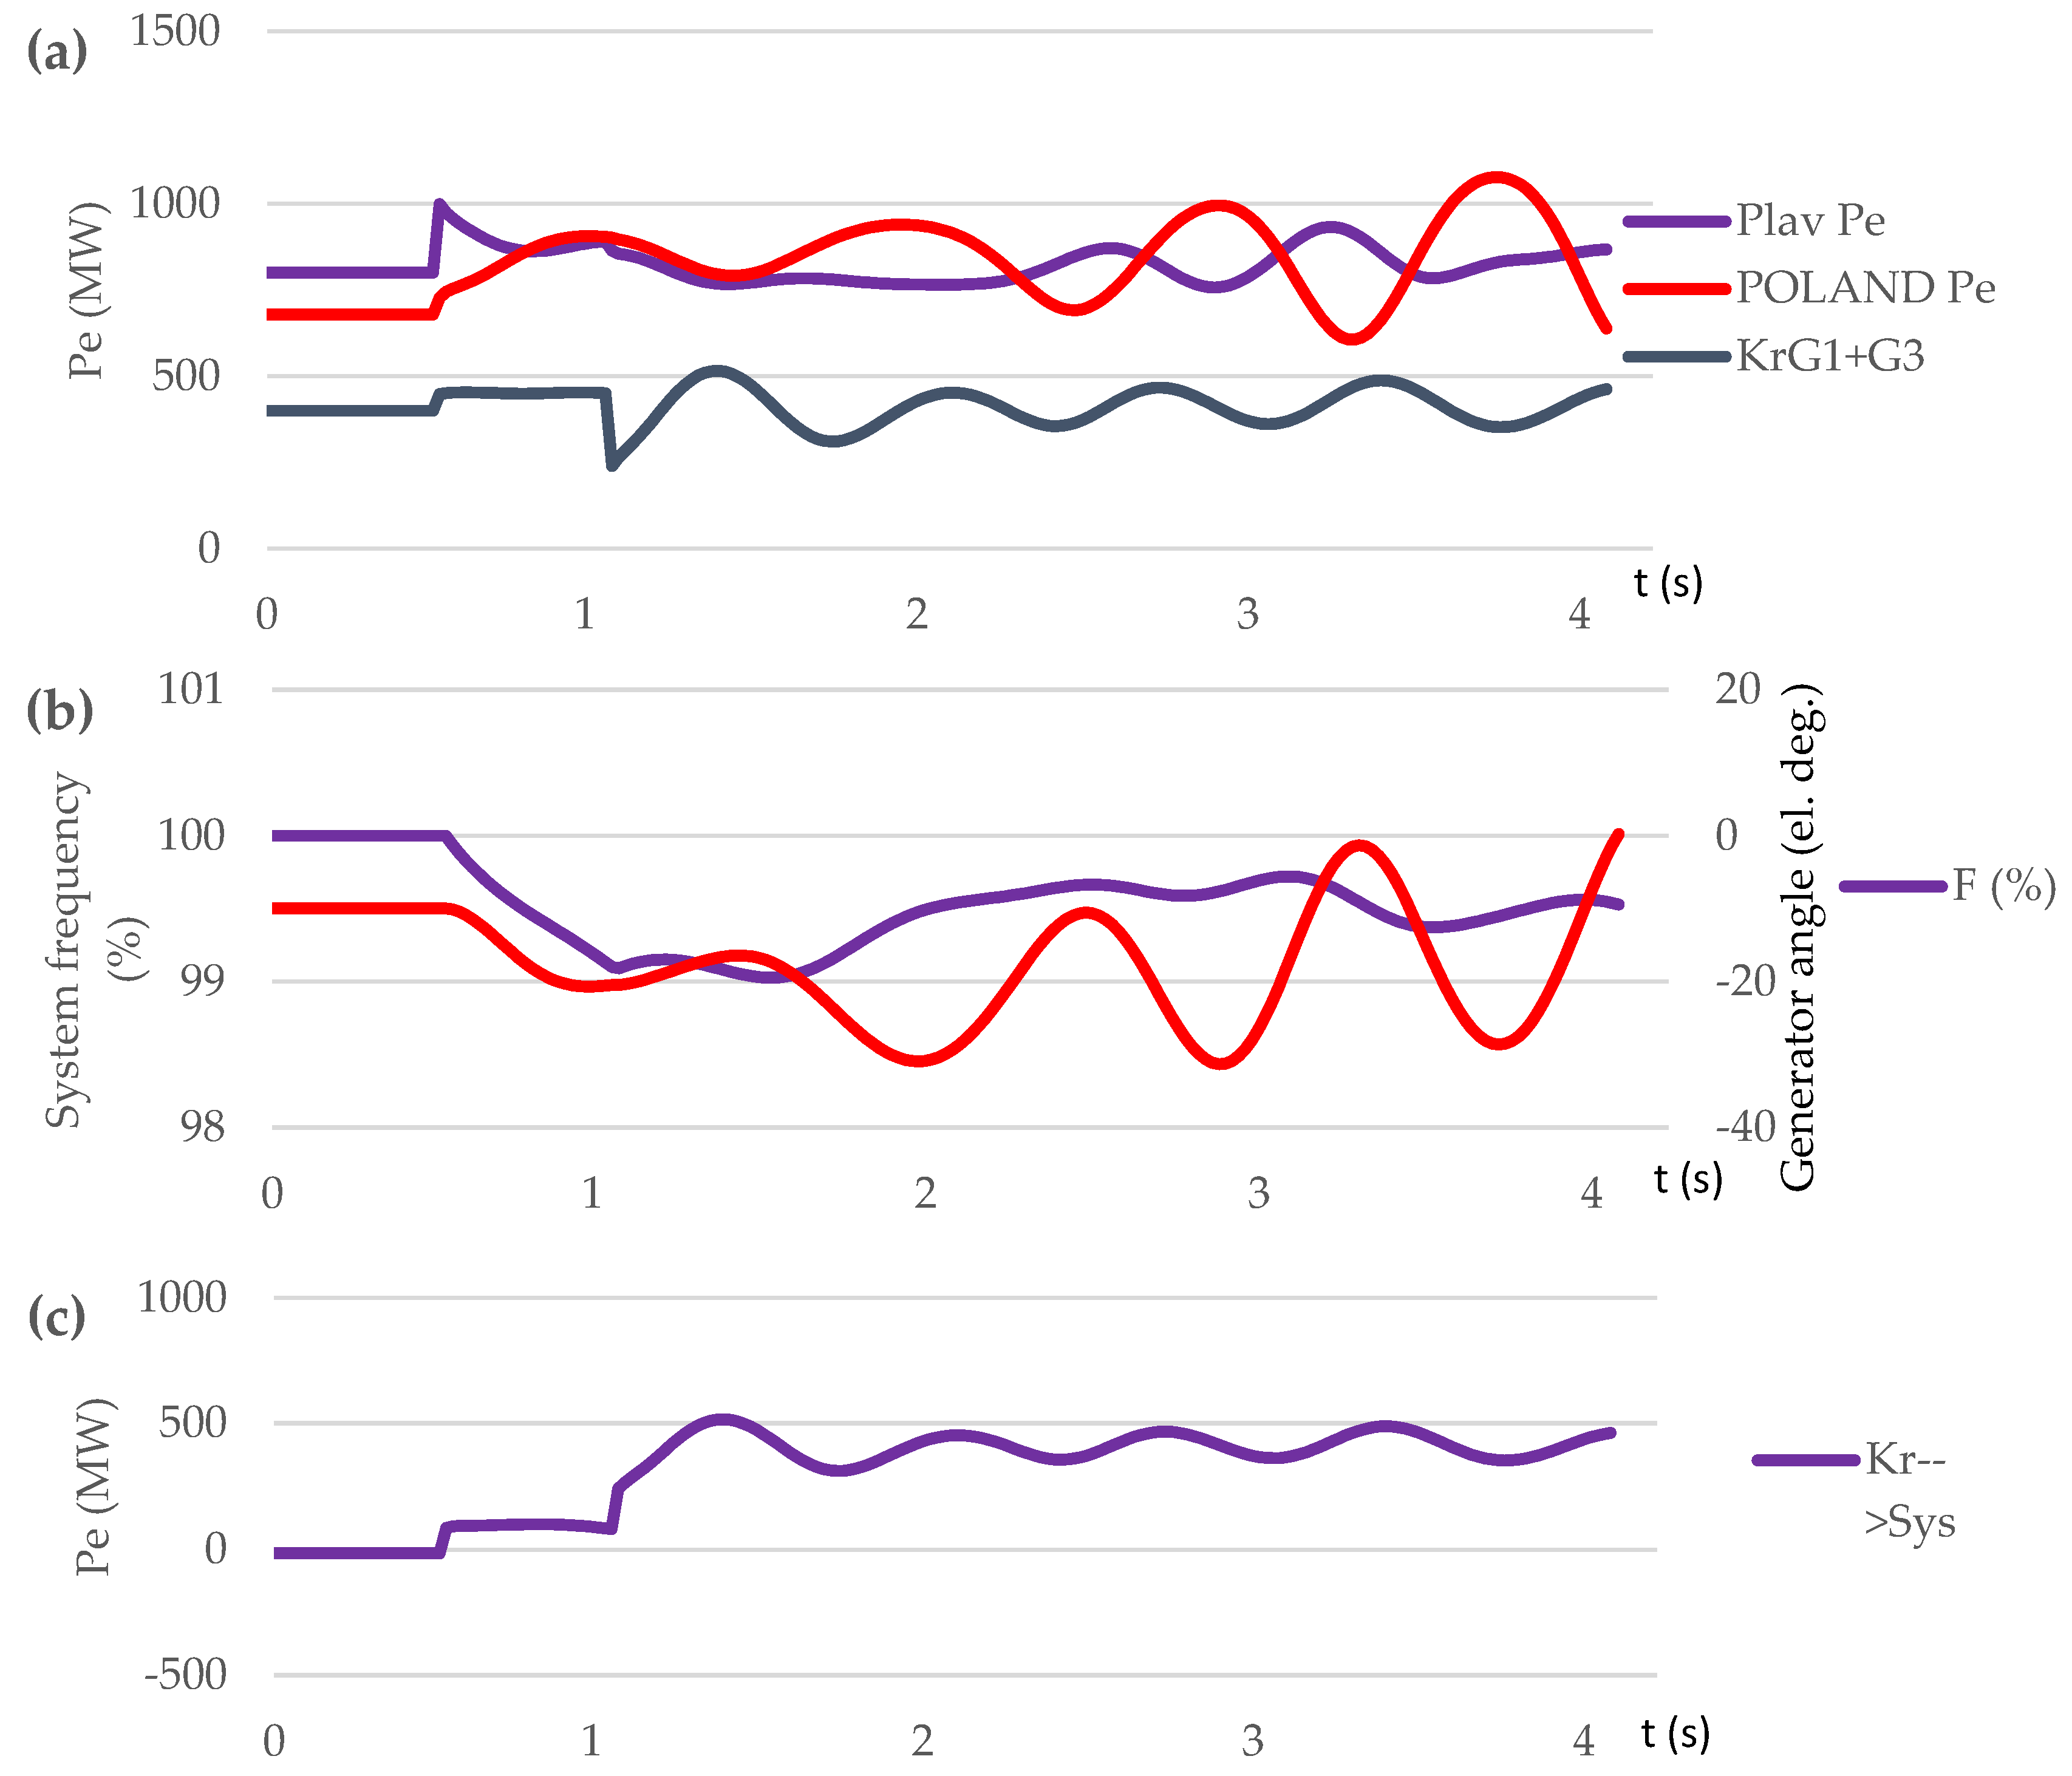
Figure 12.
Scenario S4: (a) generator active power (Pe): generation units at EE, LV, LT and PL; (b) generator angle and system frequency; (c) power flow through line L1 and L2.
Figure 12.
Scenario S4: (a) generator active power (Pe): generation units at EE, LV, LT and PL; (b) generator angle and system frequency; (c) power flow through line L1 and L2.
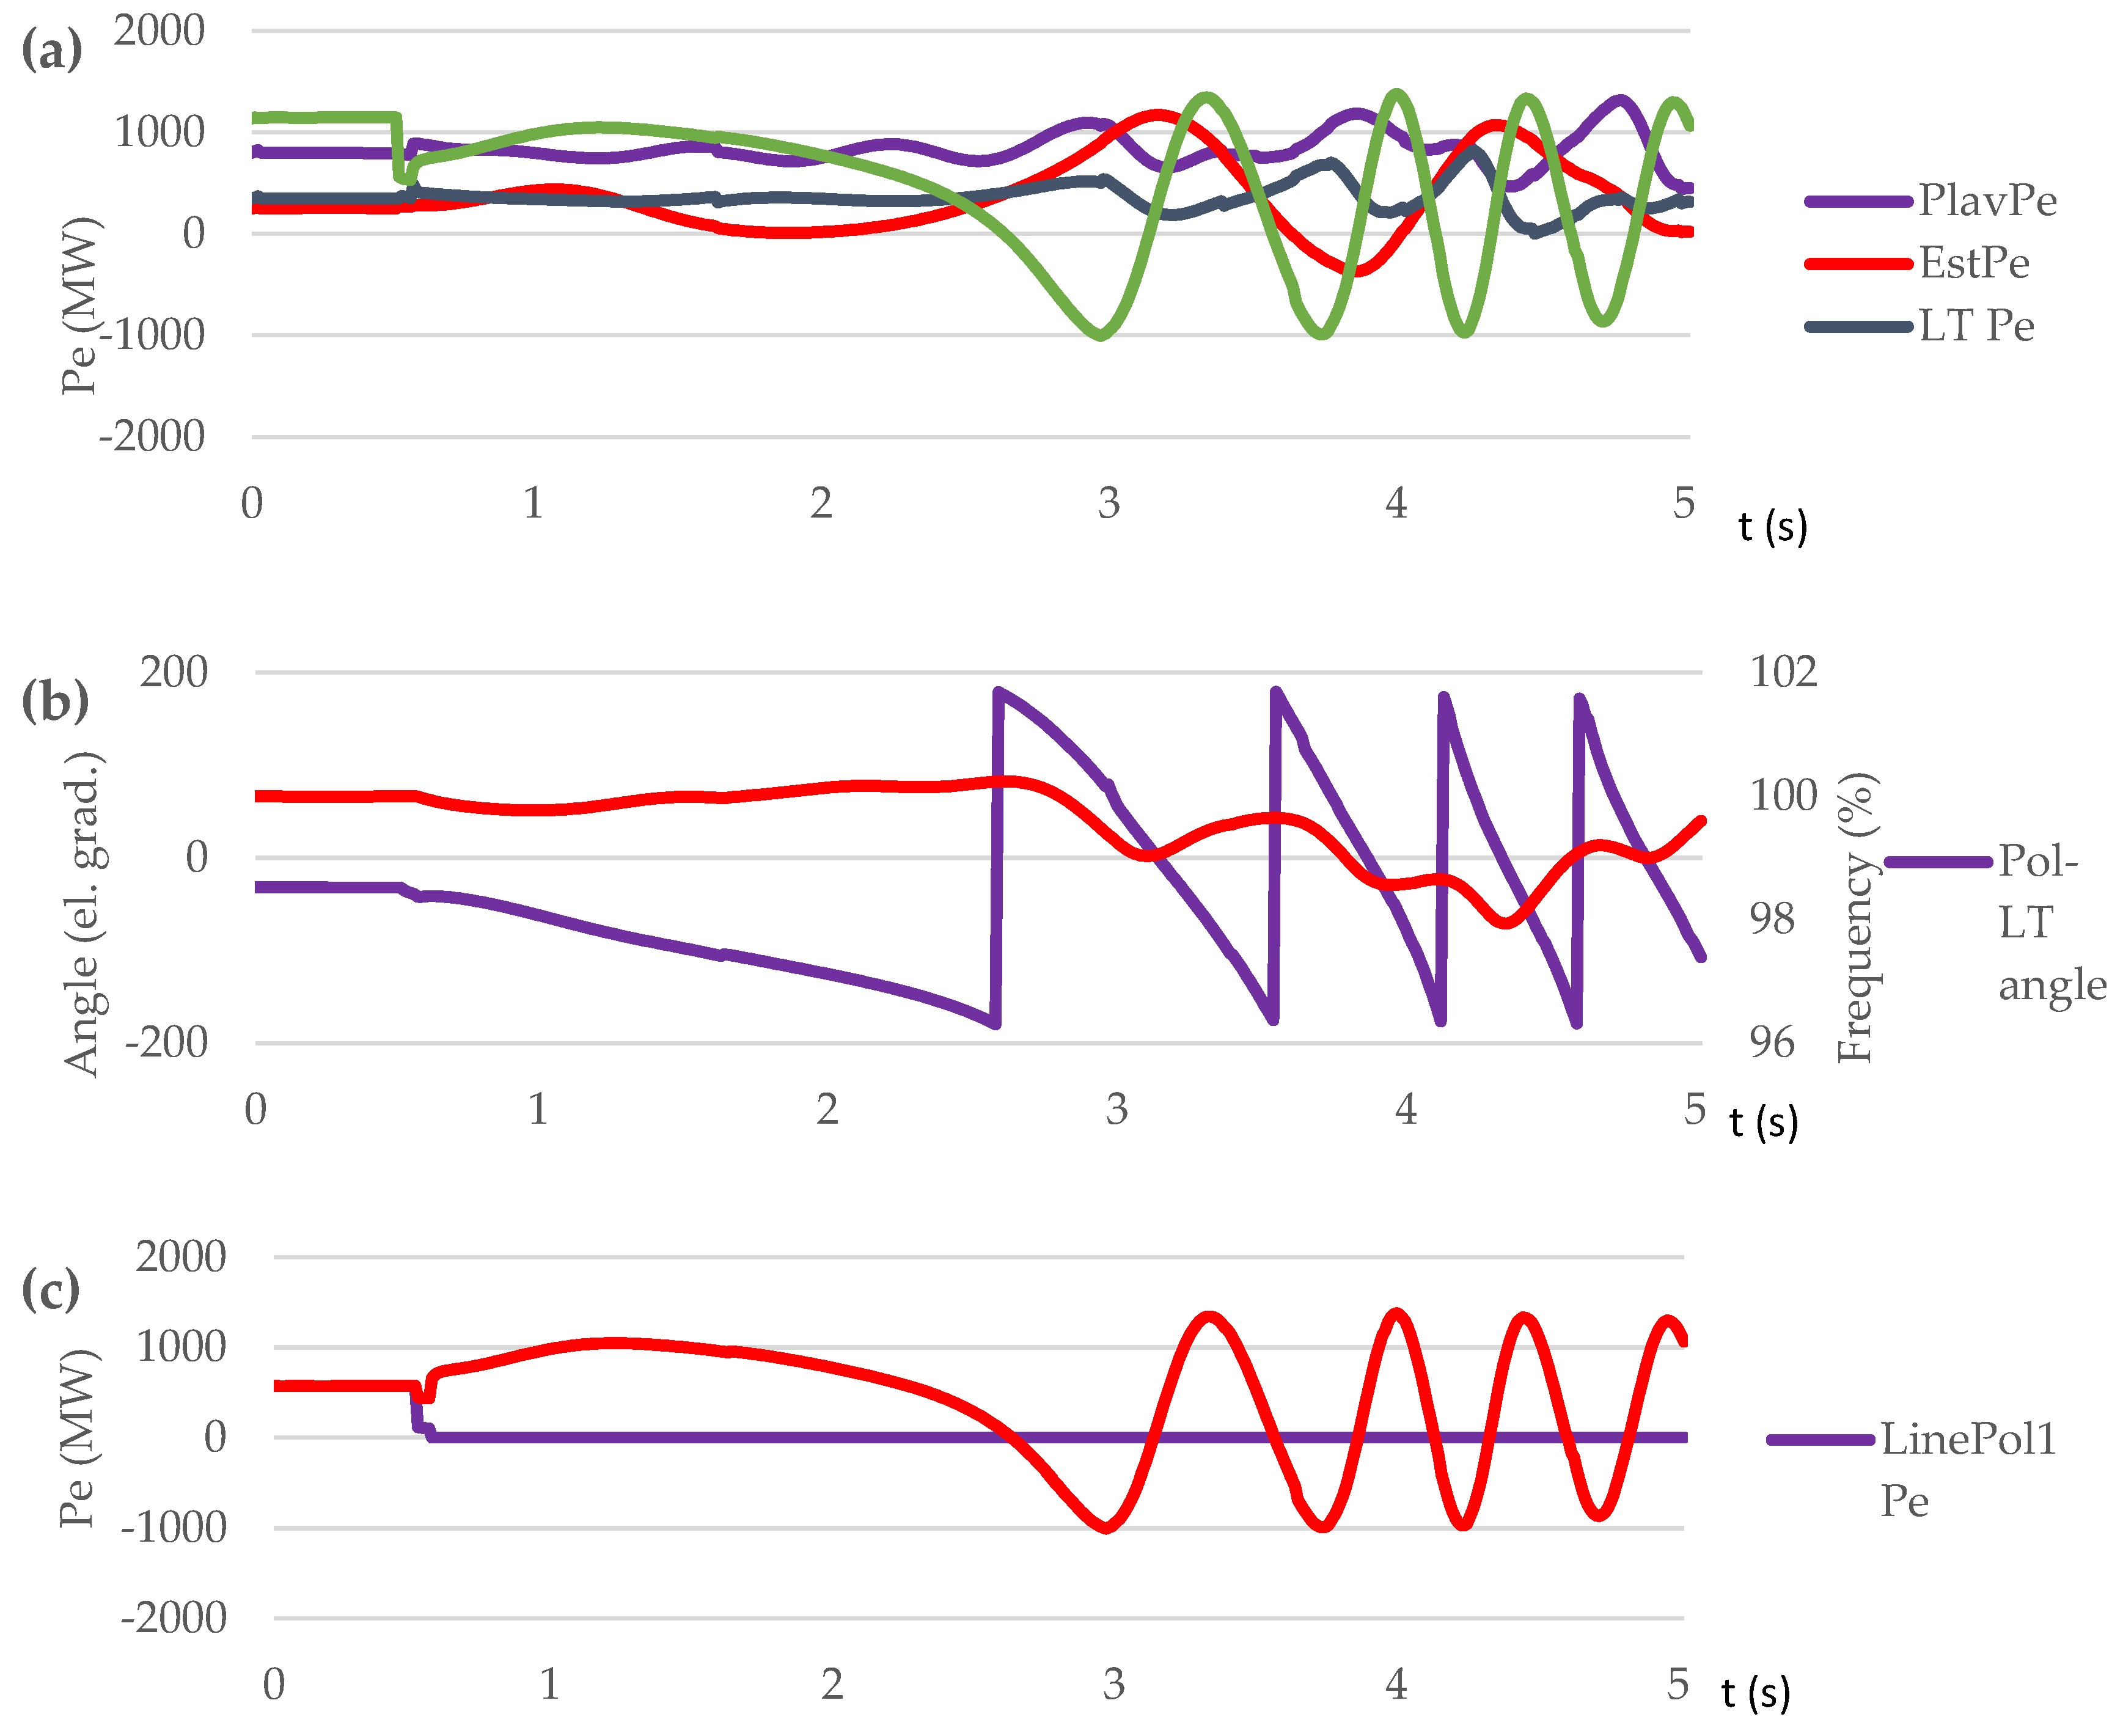
Figure 13.
Scenario S5: (a) generator active power (Pe): generation units at EE, LV, LT and PL; (b) generator angle and system frequency; (c) power flow through L1 and L2.
Figure 13.
Scenario S5: (a) generator active power (Pe): generation units at EE, LV, LT and PL; (b) generator angle and system frequency; (c) power flow through L1 and L2.
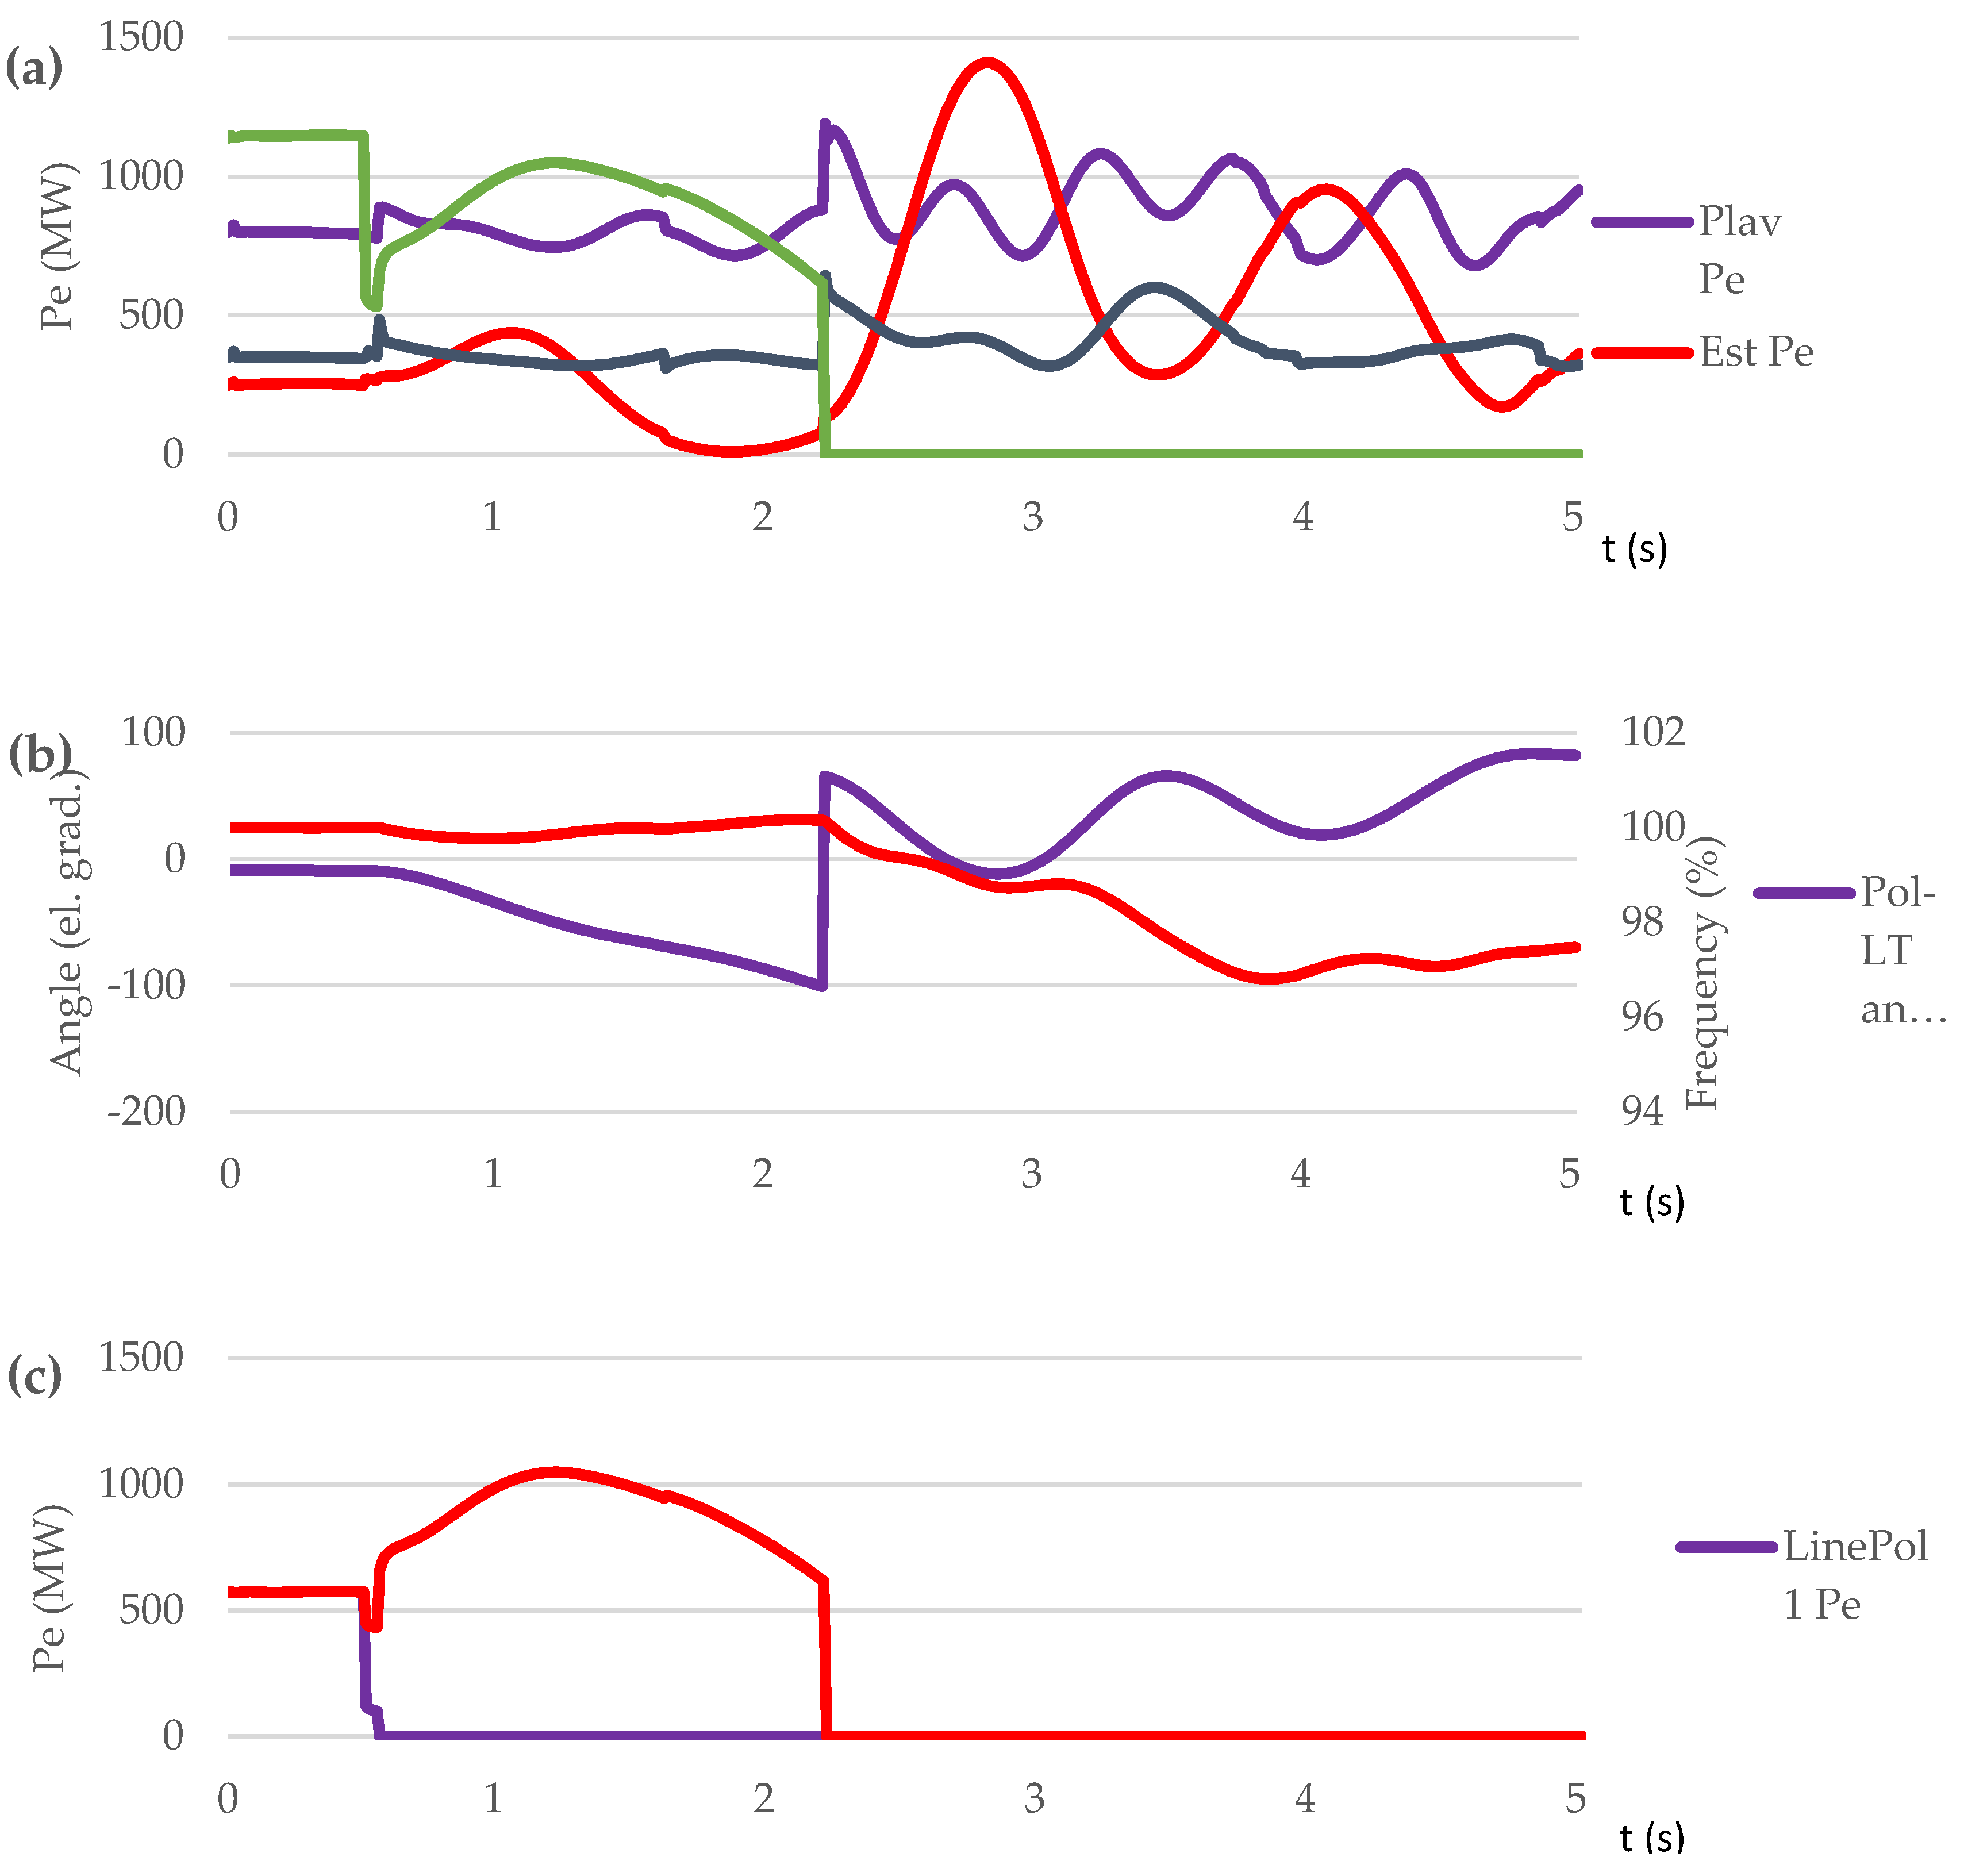
Figure 14.
Scenario S6: (a) generator active power (Pe): generation units at EE, LV, LT and PL; (b) generator angle and system frequency; (c) power flow through line L2.
Figure 14.
Scenario S6: (a) generator active power (Pe): generation units at EE, LV, LT and PL; (b) generator angle and system frequency; (c) power flow through line L2.
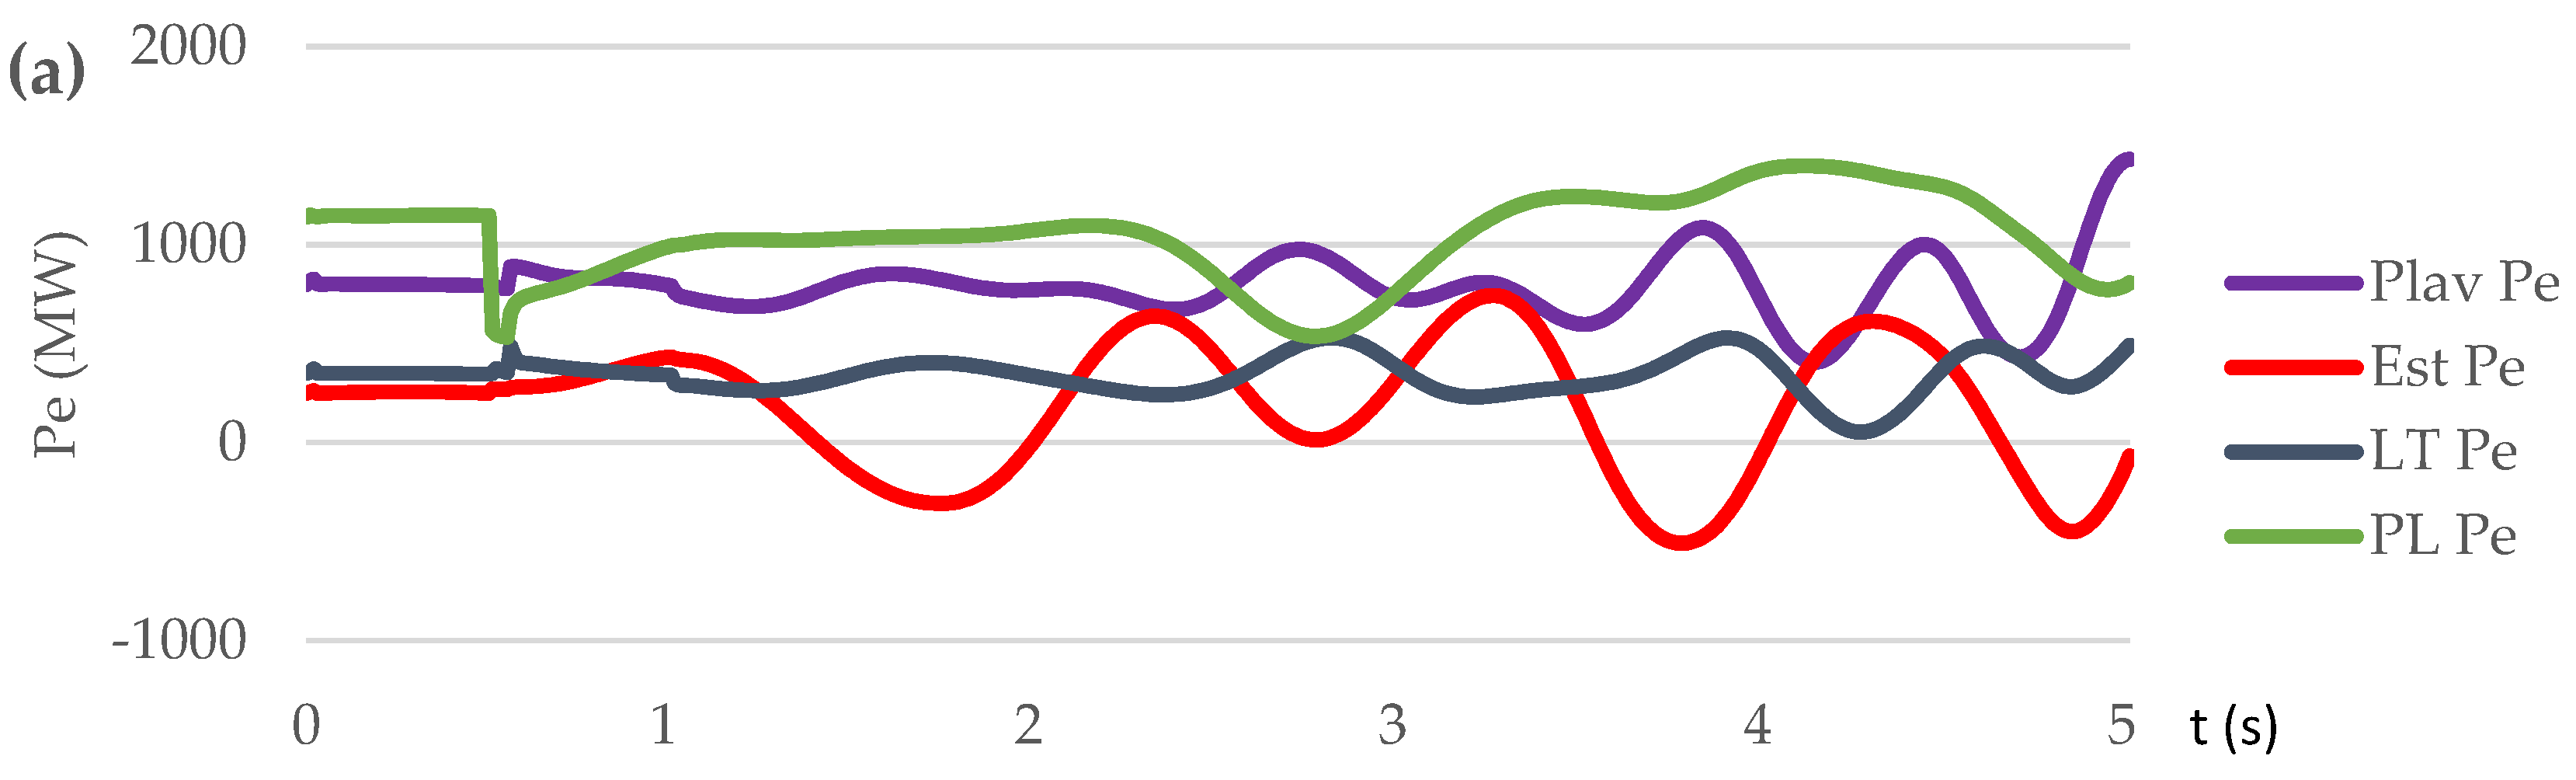
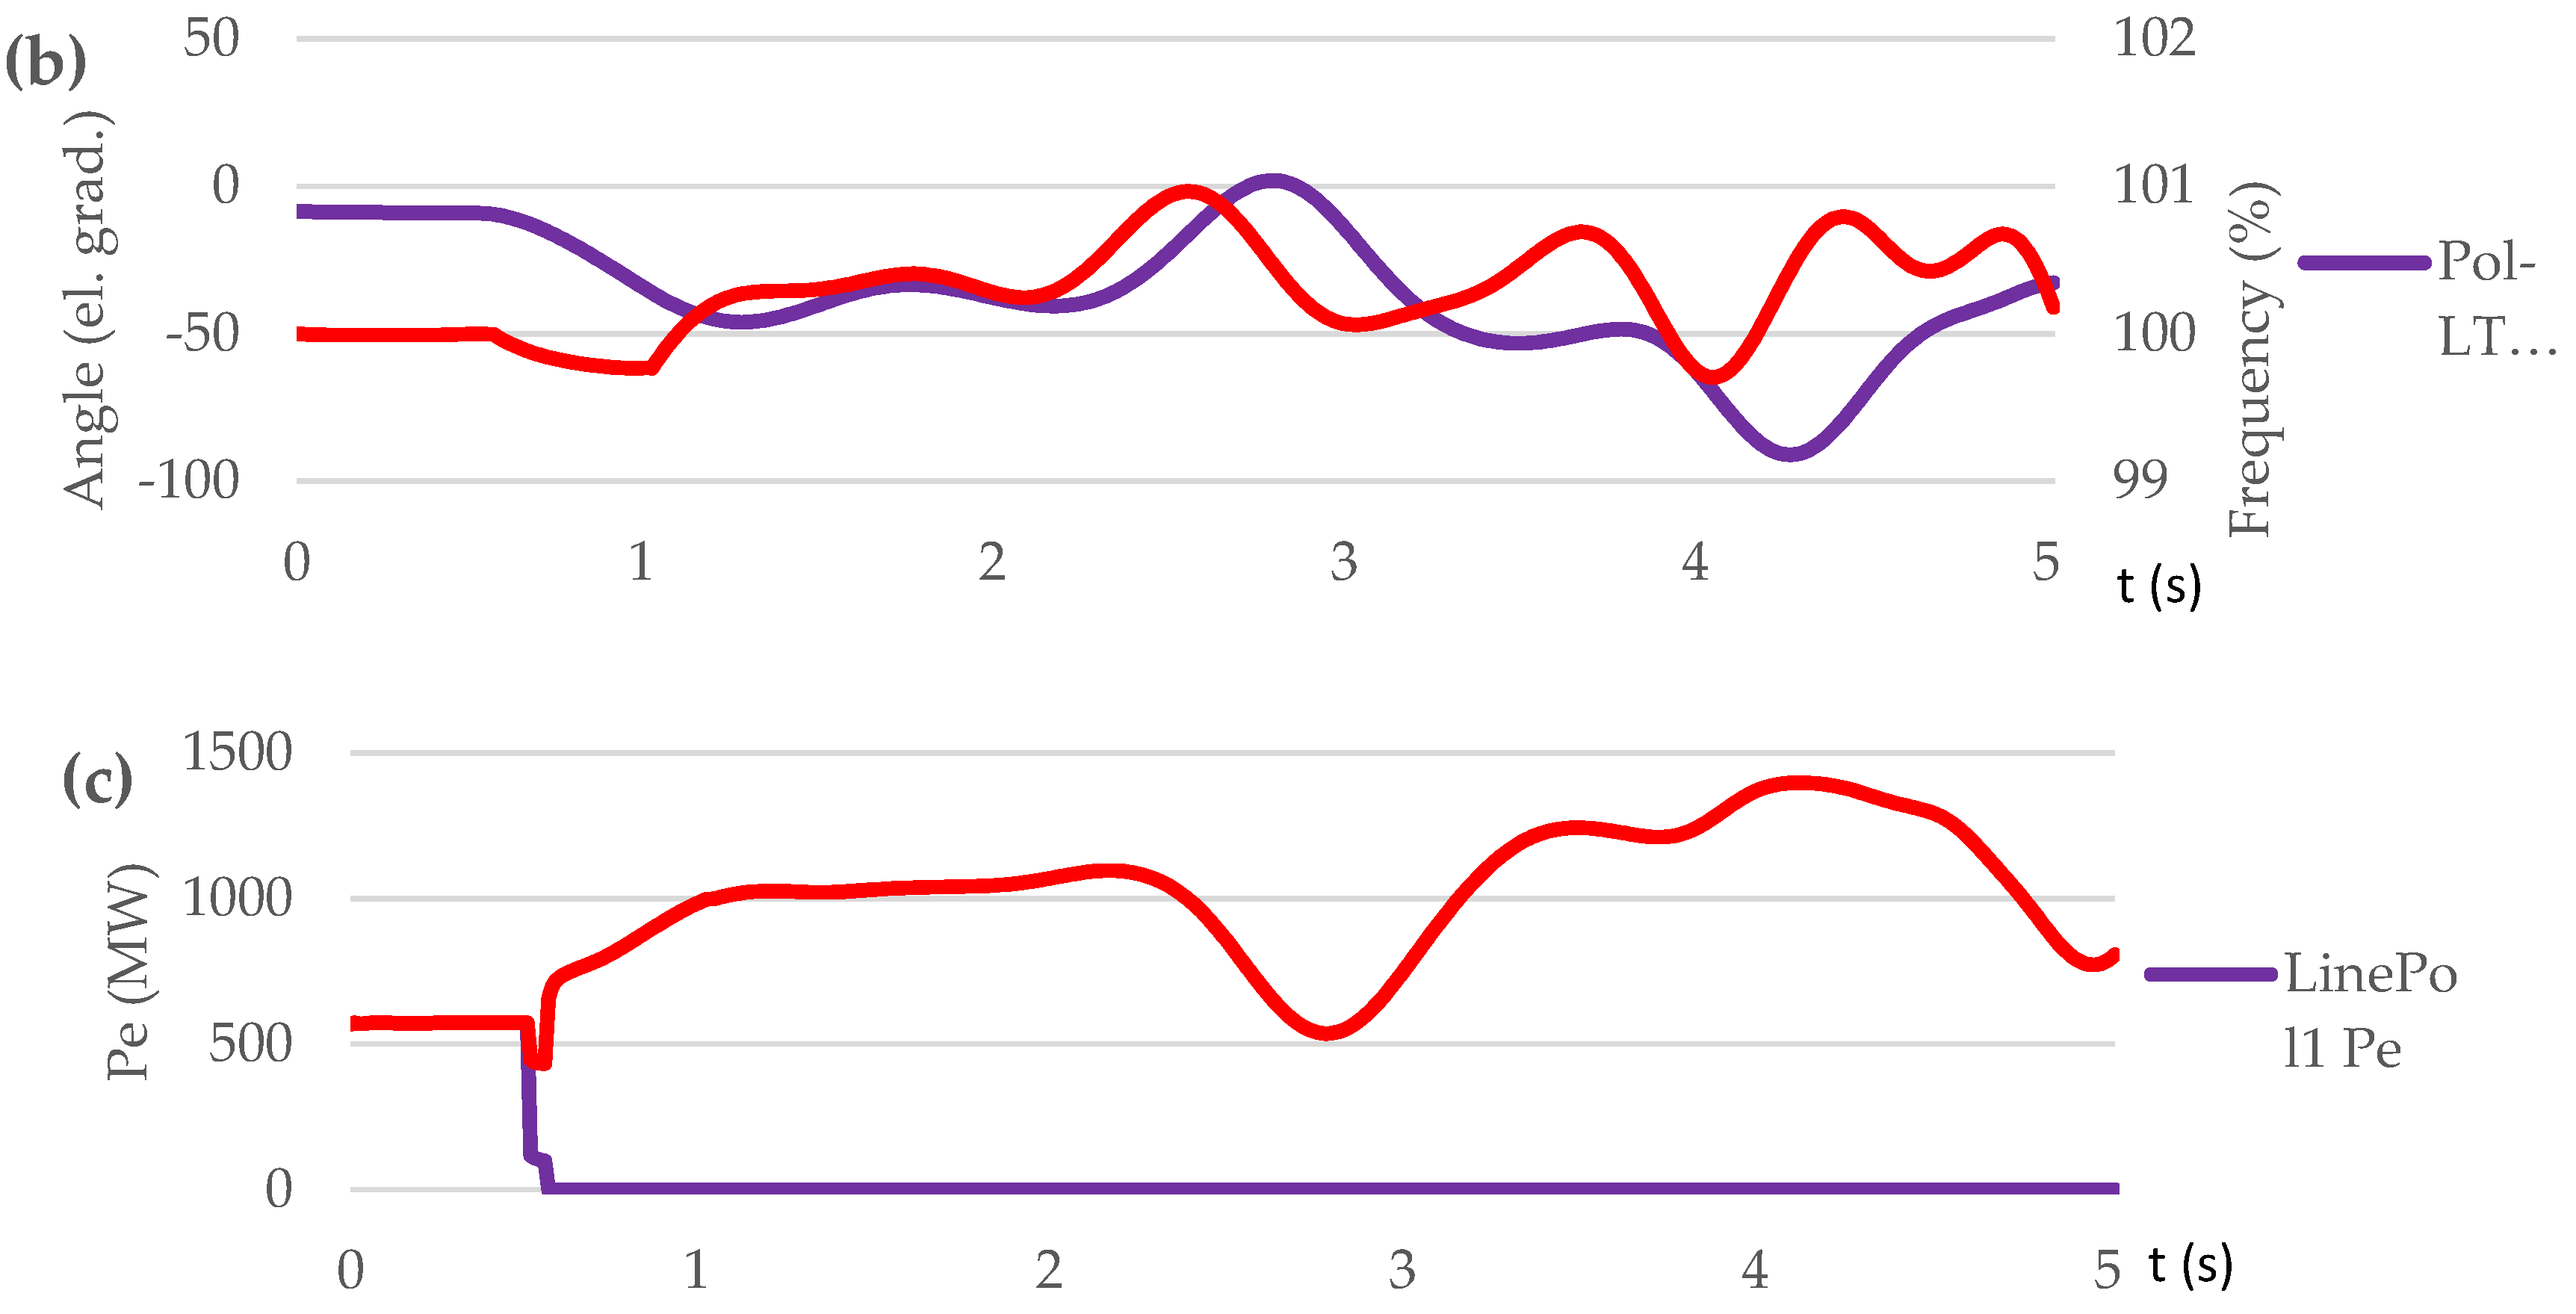
Figure 15.
Representation of the impact of the power limitations on the MCP: (a) without a power transmission limitation along the LitPol line/-s, (b) with a limitation on the transmitted power along the LitPol line/s, (c) alleviating the limitation through simultaneous use of a pump and a generator at Kruonis PSHPP.
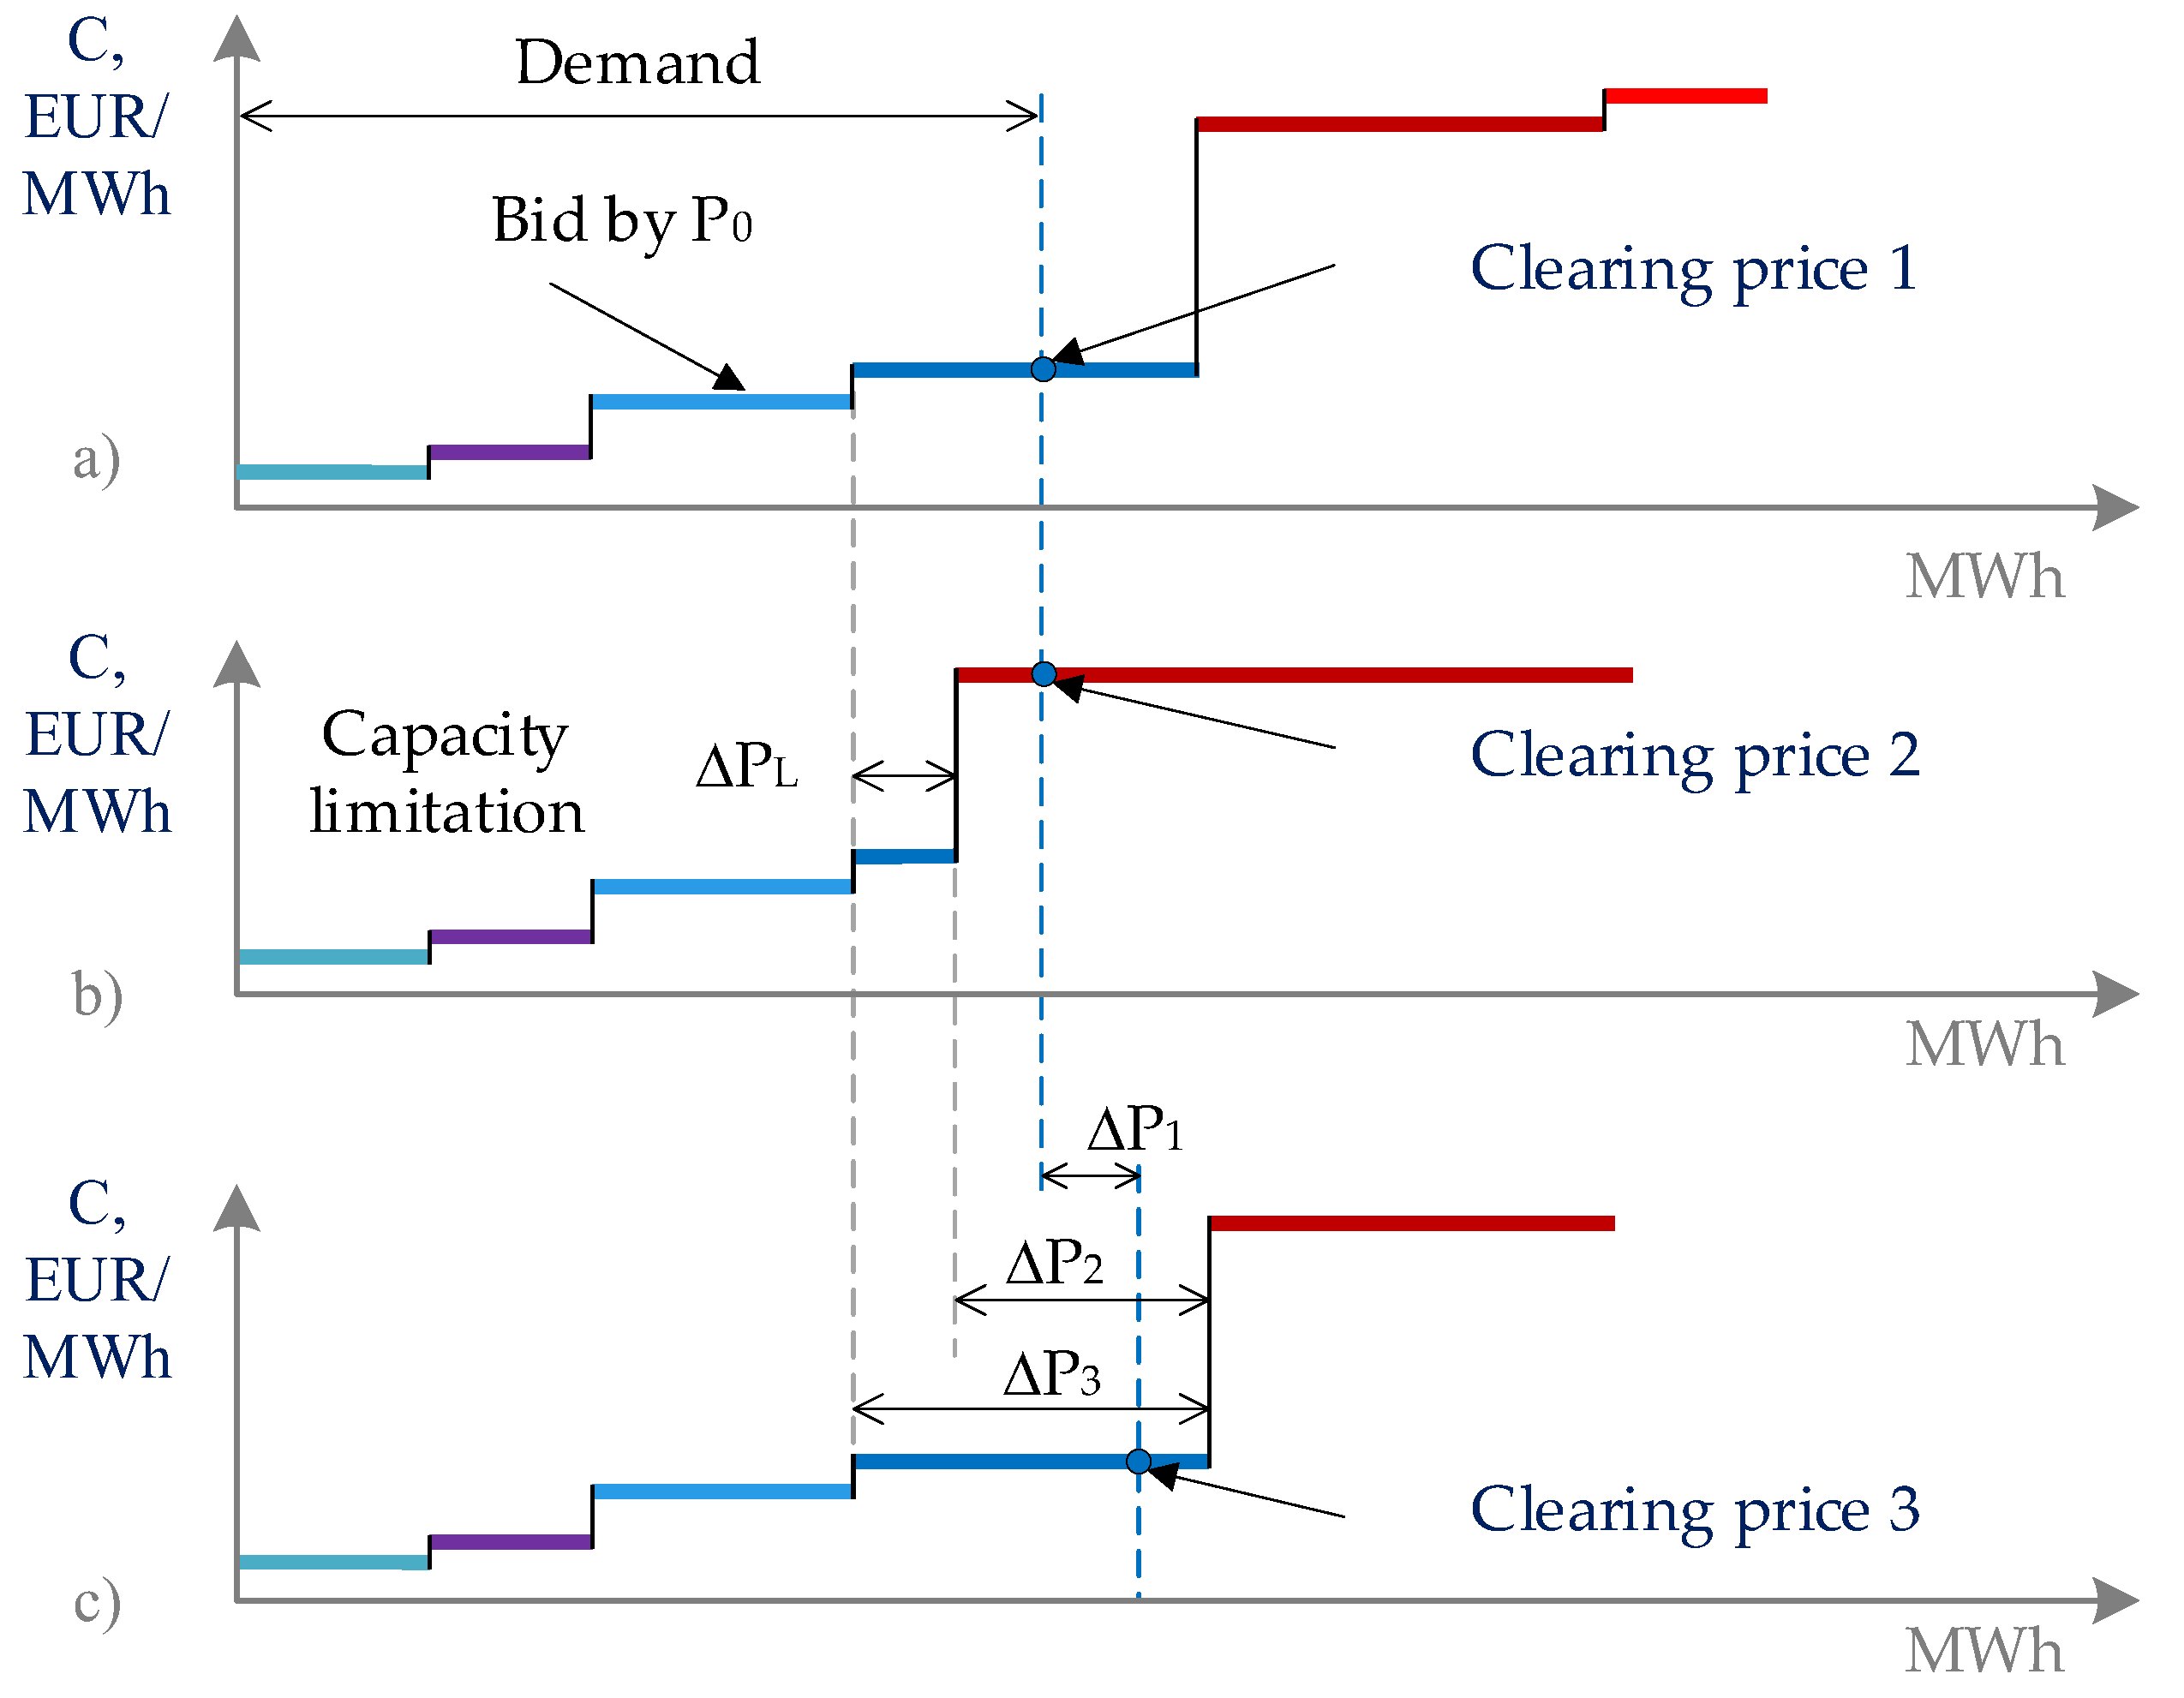
Figure 16.
Nord Pool market prices on February 9, 2024.
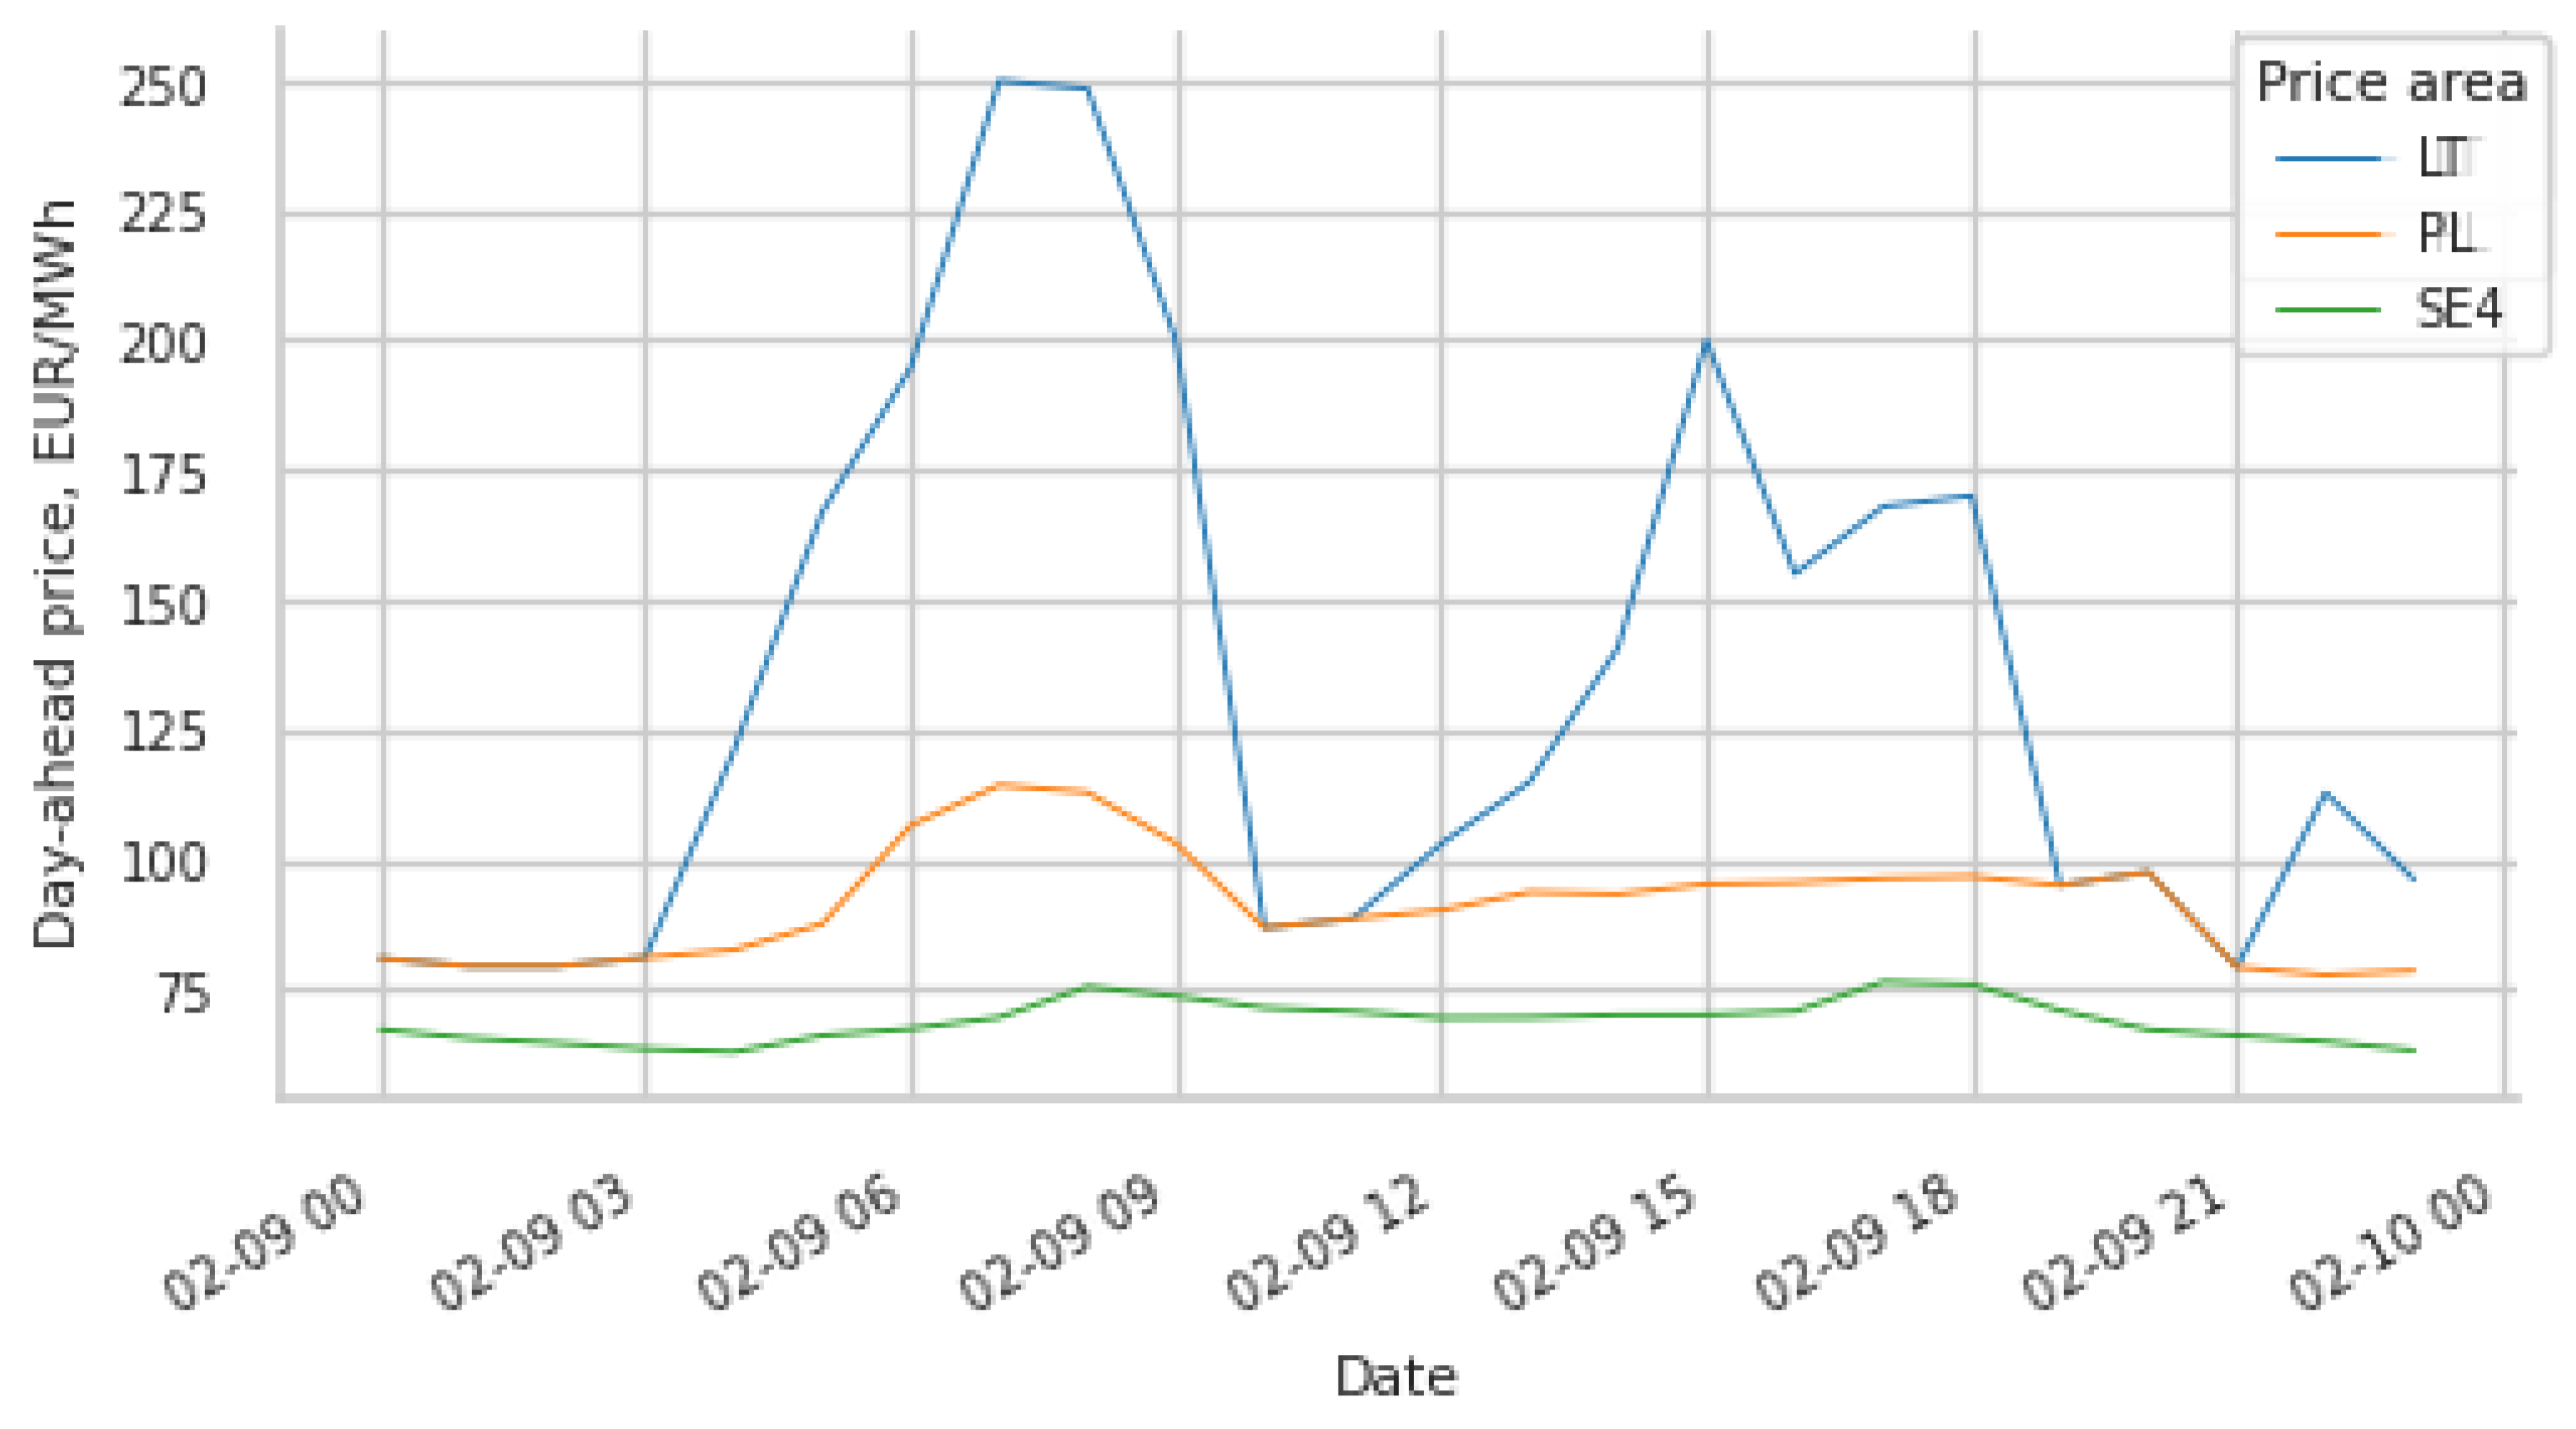
Figure 17.
Nord Pool day-ahead prices in the PL and LT areas in September 2023.
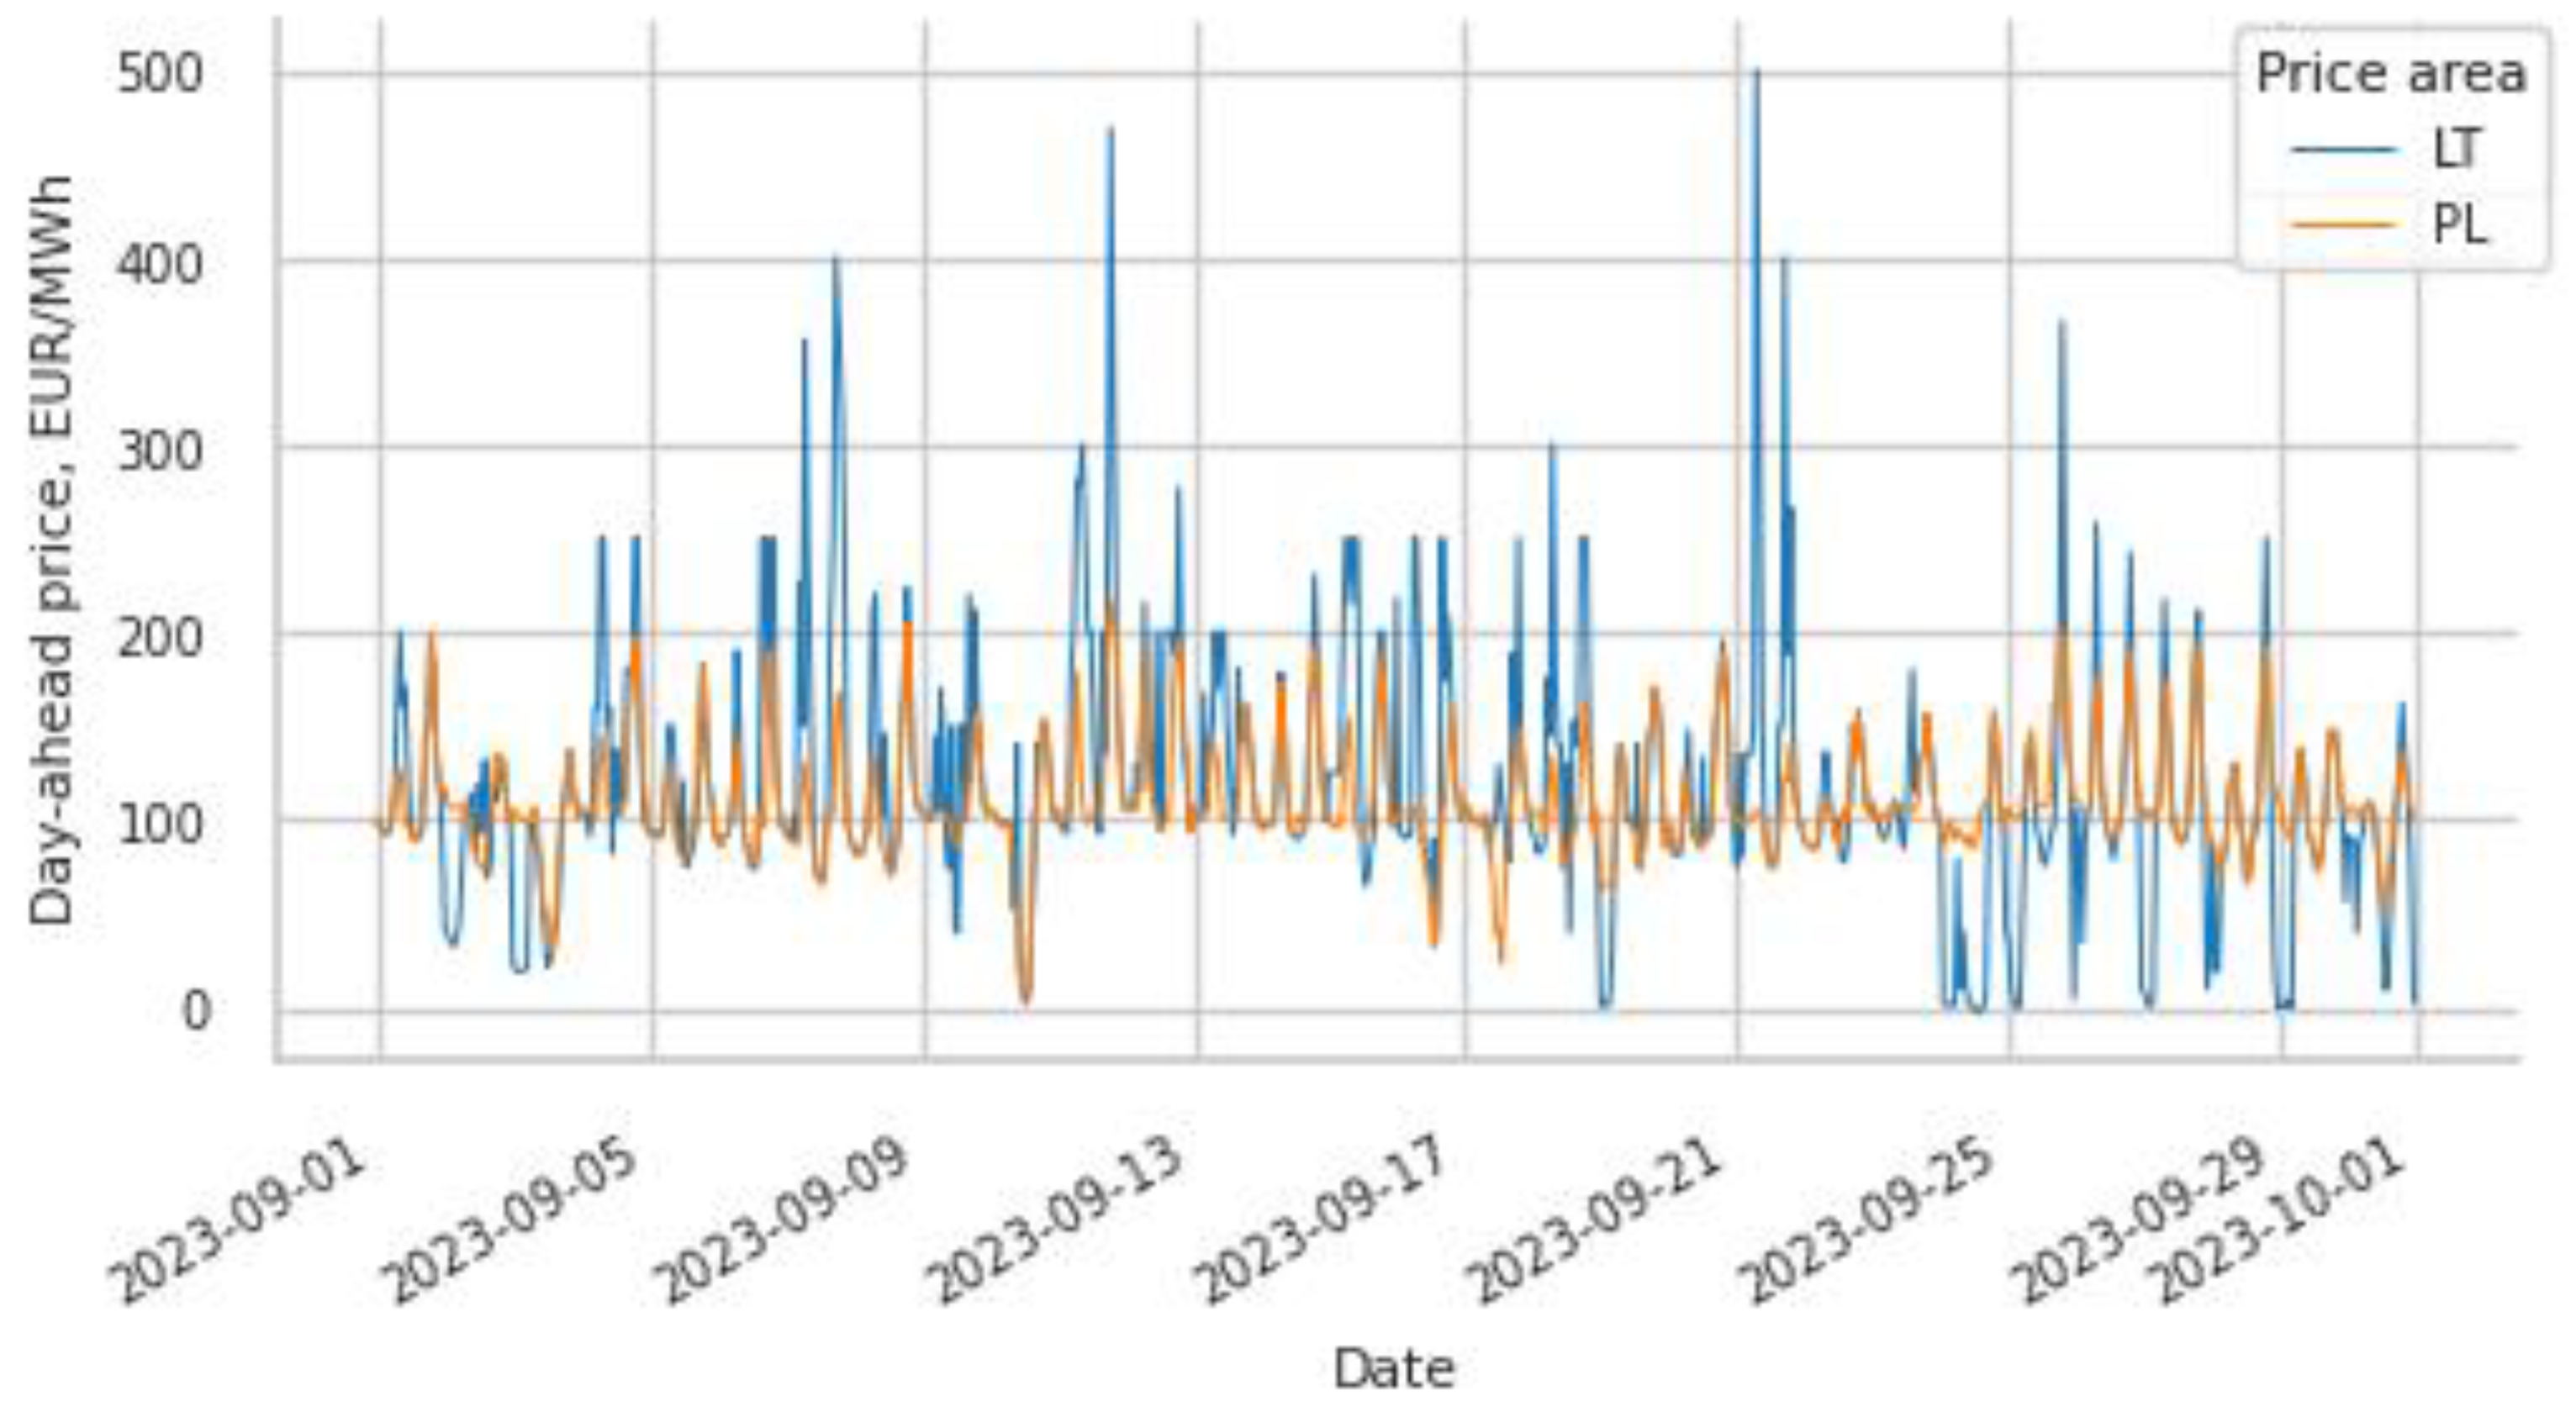
Figure 18.
The difference in the Nord Pool day-ahead prices between the LT and PL areas in September 2023.
Figure 18.
The difference in the Nord Pool day-ahead prices between the LT and PL areas in September 2023.
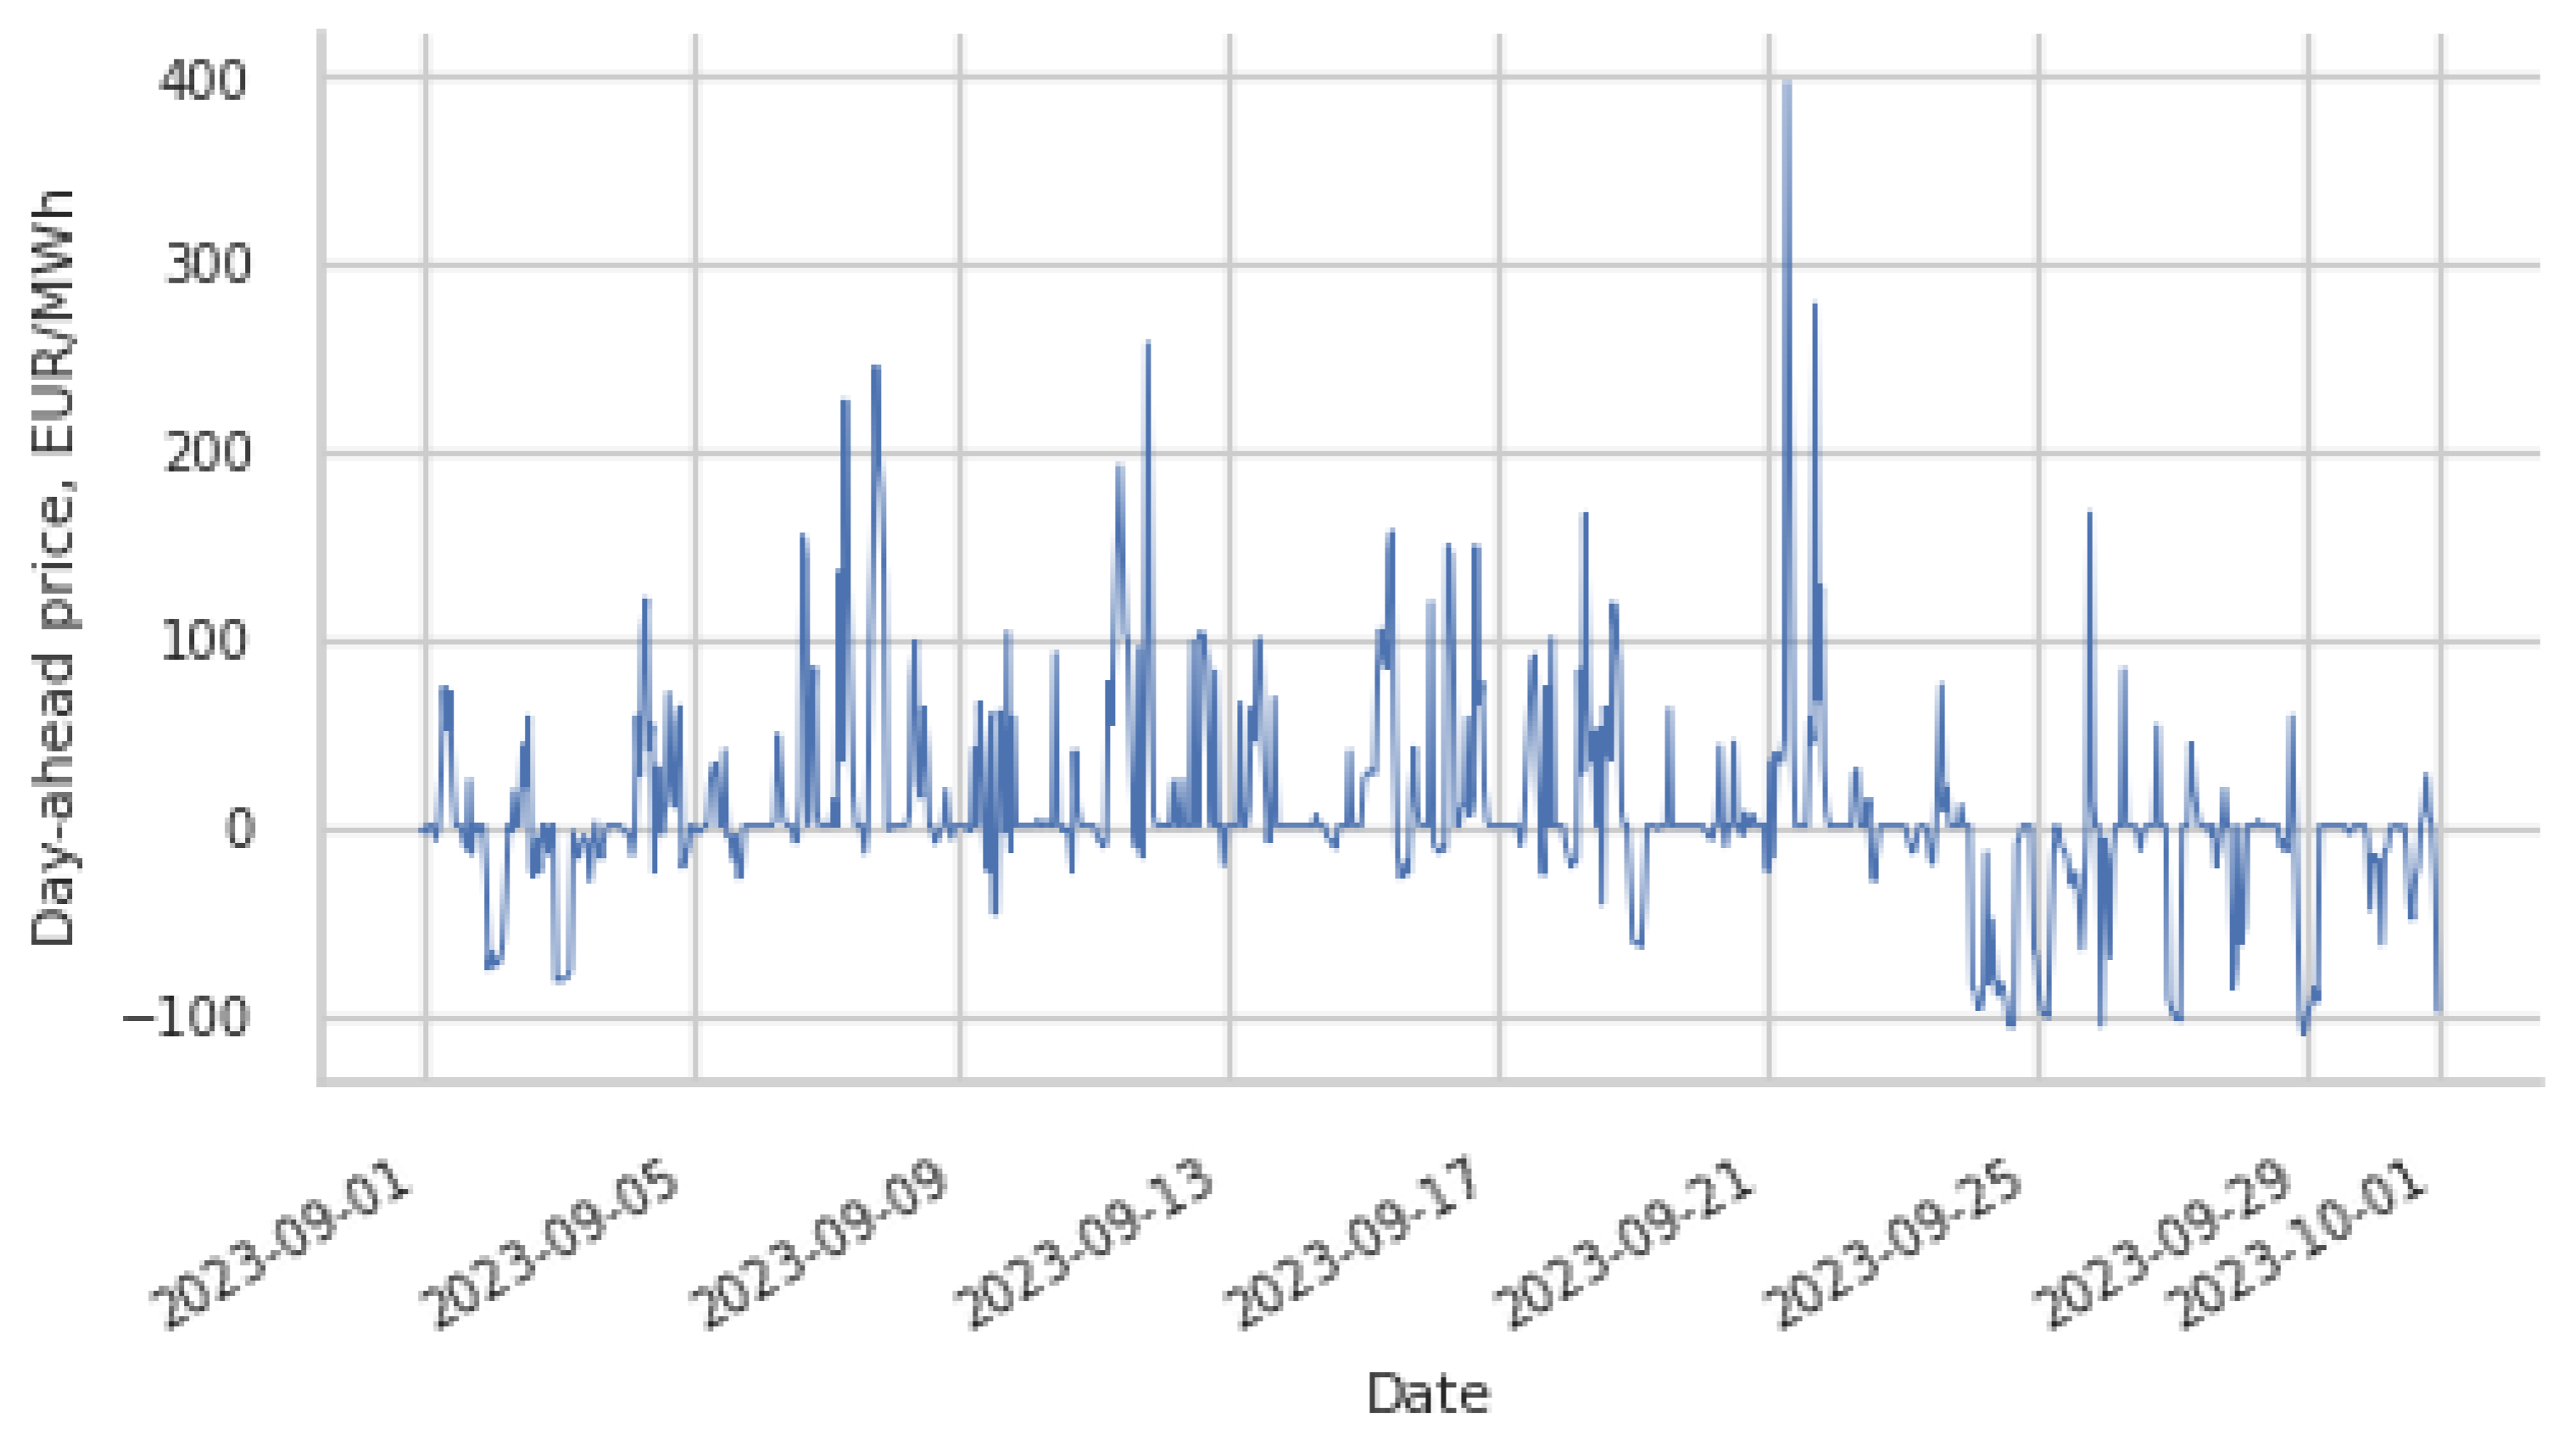
Figure 19.
The distribution of Nord Pool day-ahead prices in the LT area above 74% of the price in the PL area and the distribution of the difference of these prices in September 2023.
Figure 19.
The distribution of Nord Pool day-ahead prices in the LT area above 74% of the price in the PL area and the distribution of the difference of these prices in September 2023.
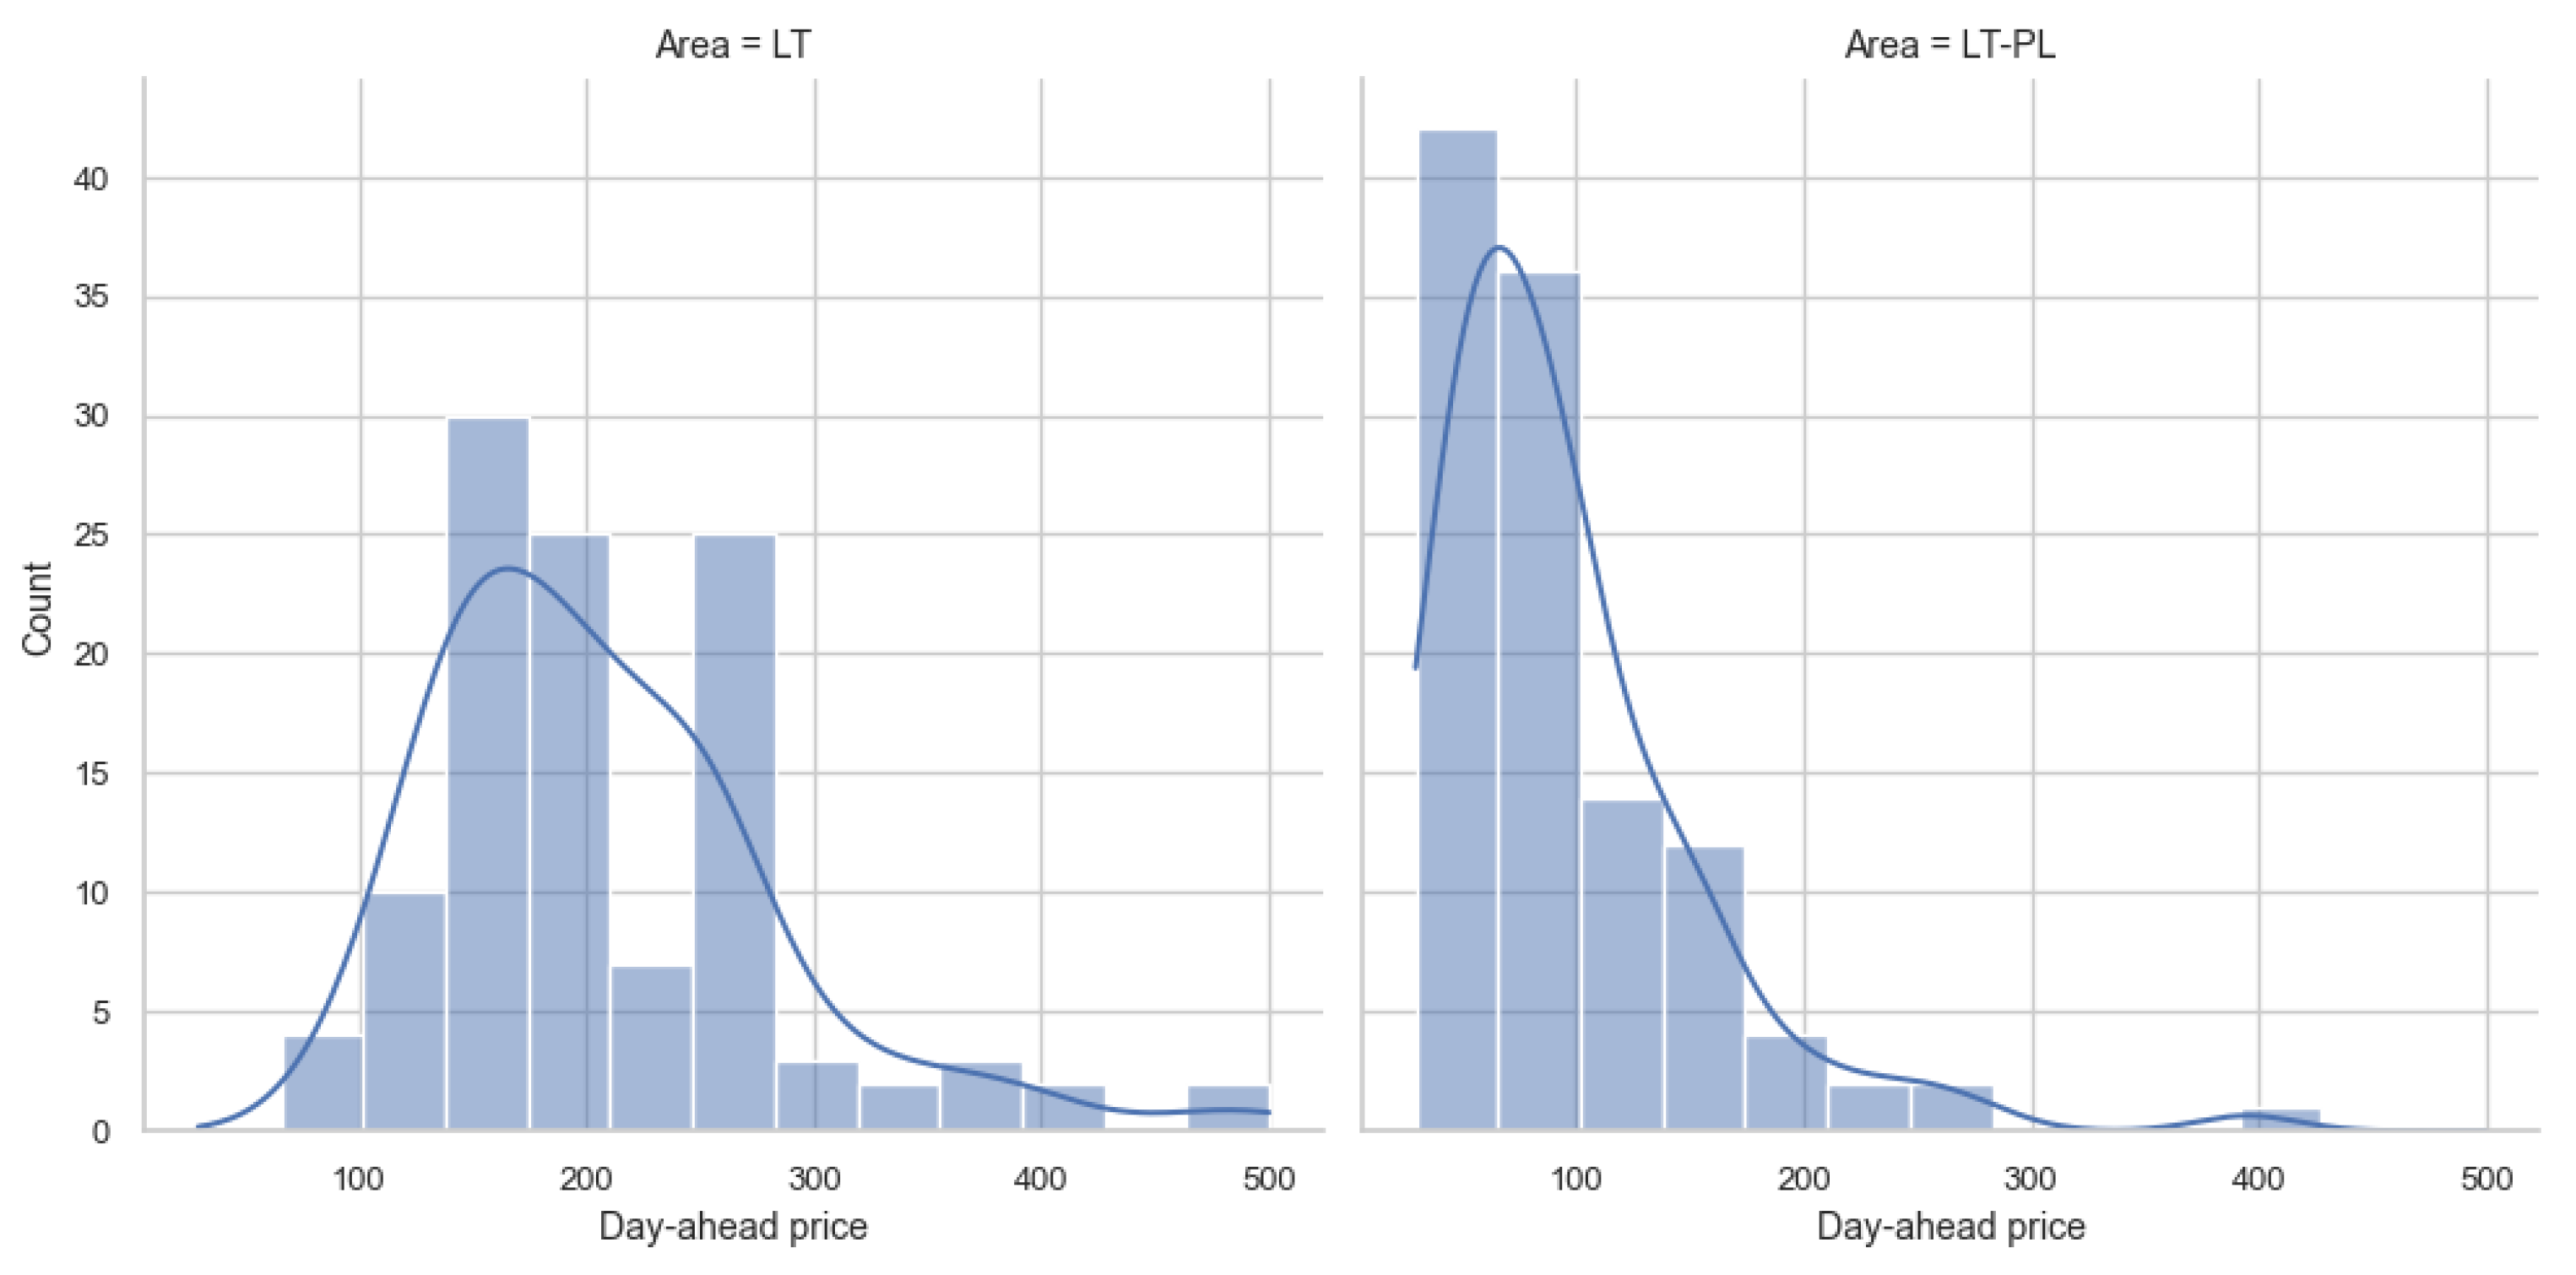

Table 1.
Parameters of Kruonis PSHPP [62].
Table 1.
Parameters of Kruonis PSHPP [62].
| Parameter | Value |
|---|---|
| Capacity | 900 MW |
| Reversible pump-turbine units | 4 units |
| Rated capacity in generation mode (per unit) Rated capacity in pumping mode (per unit) |
225 MWh/h 220 MWh/h |
| Efficiency in generation/ pumping mode | 90.0 / 80.0 % |
| Cycle efficient use rate | 0.74 |
| Upper reservoir area | 3.05 km2 |
| Maximum water head | 113.5 m |
| Minimum water head | 105.5 m |
| Total pool capacity | 48,000,000 m3 |
Table 2.
The main parameters of the modelled PS.
| Parameter |
Value (scenarios S1…S3 / S4…S6) |
| Total generation before disruption | 1550 / 1850 MW |
| Total import | 1400 / 1100 MW |
| Total export | 250 MW |
| Total inertia | 8.64 s |
Table 3.
The results of disturbances and the transient process.
| Contingency type | Scenario | Proposed control method implementation | OOS protection operation | The consequence of transient process / frequency nadir (%) |
|---|---|---|---|---|
| Sweden-Lithuania off. 700 MW lost | S1 | NO | NO | Out-of-step condition. 5 steps UFLS triggered / 95.45 % |
| S2 | NO | YES | Out-of-step condition. OSP operation. 6 steps UFLS triggered. / 94.9 % | |
| S3 | YES | YES | No out-of-step condition. No UFLS triggered. / 99 % | |
| Short circuit on L1 at t=0,5 s | S4 | NO | NO | Out-of-step condition. No UFLS triggered. / 97.97 % |
| S5 | NO | YES | Out-of-step condition. OSP operation. 3 steps UFLS triggered. / 96.8 % | |
| S6 | YES | YES | No out-of-step condition. No UFLS triggered. / 99.7÷100.8 % |
Disclaimer/Publisher’s Note: The statements, opinions and data contained in all publications are solely those of the individual author(s) and contributor(s) and not of MDPI and/or the editor(s). MDPI and/or the editor(s) disclaim responsibility for any injury to people or property resulting from any ideas, methods, instructions or products referred to in the content. |
© 2024 by the authors. Licensee MDPI, Basel, Switzerland. This article is an open access article distributed under the terms and conditions of the Creative Commons Attribution (CC BY) license (http://creativecommons.org/licenses/by/4.0/).
Copyright: This open access article is published under a Creative Commons CC BY 4.0 license, which permit the free download, distribution, and reuse, provided that the author and preprint are cited in any reuse.


