
Submitted:
17 January 2026
Posted:
19 January 2026
You are already at the latest version
Abstract
We propose a centralized Activity Retrieval and Detection Intelligence (ActivityRDI) solution framework, demonstrate its application performance in Network Threat Detection in detail, and show its generalization in other domains. Network threat detection is challenging due to the complex nature of attack activities and the limited historically revealed threat data to learn from. To help enhance the existing methods (e.g., analytics, machine learning, and artificial intelligence) to detect the network threats, we propose a multi-agent AI solution for agile threat detection. In this solution, a Knowledge Graph is used to analyze changes in user activity patterns and calculate the risk of unknown threats. Then, an Imbalanced Learning Model is used to prune and weigh the Knowledge Graph, and also calculate the risk of known threats. Finally, a Large Language Model (LLM) is used to retrieve and interpret the risk of user activities from the Knowledge Graph and the Imbalanced Learning Model. The preliminary results show that the solution improves the threat capture rate by 3\%-4\% and adds natural language interpretations of the risk predictions based on user activities. Furthermore, a demo application has been built to show how the proposed solution framework can be deployed and used.
Keywords:
activity-based intelligence
; network threat detection
; knowledge graph
; large language model
; imbalanced learning
; multi-agent AI
1. Introduction
Activity-based Intelligence (ABI) discovers the insights and patterns from the activities associated with entities of interest through intelligent algorithmic analysis [1,2,3,4]. Thanks to the technology advancement, the activities are widely captured in variant systems nowadays. That brings opportunities and also challenges in the activity analysis in many domains. One important domain is Network Threat Detection, which is challenging due to the complex nature of attack activities and the limited historically revealed threat data to learn from despite the huge amount of activity data in general.
Network threats have brought significant financial losses and public safety issues in recent years. The total reported loss from cybercrimes is more than $12. 5 billion in the US in 2023 according to the FBI’s Internet Crime Complaint Center (IC3) report [5]. Moreover, public safety systems face increasing disruption in emergency communication systems and operations due to malicious attacks [6]. These are caused by more complicated and new network attack activities that are not detected in time [7]. This presents a significant need for Agile Threat Detection, which aims to identify and respond to evolving threats rapidly and proactively [8].
The analytics, machine learning (ML) and artificial intelligence (AI) methods have been widely used by researchers and practitioners to discover the patterns of known threats and detect unusual signals of unknown threats from the activities of users. Traditional ML/AI models typically need a lot of historical data to learn from to guarantee good model performance. However, there are very limited historical data on known threats that have been observed but are not detected every time they occur. And there is no data on unknown threats that have never been observed before. These challenge traditional ML/AI models to predict network threats accurately.
Compared to other ML / AI models only, Knowledge Graph shows a higher efficiency in analyzing user activities and their relationships to discover abnormalities. However, it has three challenges. The first is to prune and weigh the information properly in the graph to filter out weak or redundant information for network threats. The second is to include large texts as a part of graphs and graph analysis. The third is to unravel, diagnose, and interpret the complex activities and relationships of users in the graph.
To overcome the challenges above, we propose Activity Retrieval and Detection Intelligence (ActivityRDI), a centralized and principled framework for activity-based intelligence that integrates dynamic knowledge graphs, imbalanced learning, and large language models. Unlike existing approaches that apply these components independently, ActivityRDI tightly couples them in a closed-loop architecture, where learning outcomes actively shape activity representations and support real-time retrieval and interpretation. The framework is designed to address both known and previously unseen threats, while producing human-interpretable explanations suitable for analyst decision-making.
In this framework, the Knowledge Graph is used to analyze changes in the user activity pattern and calculate the risk of unknown threats, the Imbalanced Learning Model is used to prune and weigh the Knowledge Graph and also calculate the risk of known threats, and LLM is used to retrieve and interpret the user activities from the Knowledge Graph and the Imbalanced Learning Model.
Using LLMs empowered with Knowledge Graphs enhanced by Imbalanced Learning as a set of AI agents, an adaptive and real-time monitoring framework can be implemented to achieve fast and early detection of malicious behaviors. This approach integrates the strengths of LLMs in contextual reasoning with the structured relationship modeling capabilities of Knowledge Graphs to monitor, predict, and explain potential threats as they unfold. The synergy between these components ensures both depth and immediacy in threat detection, making the system highly effective in dynamic environments.
Activity-based intelligence emphasizes understanding intent and risk through the analysis of observed activities rather than isolated events. ActivityRDI directly operationalizes this principle by representing activities as evolving relational structures, detecting deviations in activity patterns over time, and translating these deviations into actionable intelligence. In our framework, activities are captured and structured in a dynamic knowledge graph, changes in activity patterns are assessed through graph evolution and similarity measures, and risk hypotheses are quantified using imbalanced learning. Large language models then enable retrieval, synthesis, and interpretation of activity-level intelligence, supporting effective human-in-the-loop analysis. We demonstrate the effectiveness of ActivityRDI in network threat detection and further show that the framework naturally generalizes to other activity-centric domains.
2. Related Work
2.1. Knowledge Graphs
A knowledge graph is a data structure that encodes entities as nodes and relations as edges, often with rich attributes on both. By capturing complex multi-relational data, knowledge graphs facilitate reasoning about connections [9]. In addition, knowledge graphs are extremely efficient in representing sparse big data based on their relationships and discovering abnormal patterns [10,11].
Thanks to the flexibility of running different algorithms on graph data structures (e.g., similarity, centrality, community detection, path finding, shortest path, link prediction), knowledge graphs have become popular in many domains [12,13,14,15], including cybersecurity, for integrating heterogeneous logs and threat intelligence [16,17,18,19,20]. In a security context, a knowledge graph might include the nodes for entities (e.g., users, hosts, processes, and files) and edges for actions (e.g., logins, file accesses), enabling graph algorithms to detect suspicious patterns.
Despite all these advantages of the Knowledge Graph, it can be challenged by weak or redundant information in the graph. And it is not an efficient practice to include large text data either on nodes or edges in a graph, for example, actual article text that a user reads. In addition, it requires a lot of expert knowledge and experience to diagnose and interpret the information in the graph.
- First, how to prune and weigh the nodes and edges in a large graph properly?
- Second, how to incorporate large texts into the graph analysis?
- Third, how to retrieve and interpret information from both a graph and an imbalanced learning model efficiently?
The above challenges can be overcome by combining the knowledge graph with the imbalanced learning and the large language model.
2.2. Imbalanced Learning
In cybersecurity, malicious events are typically rare compared to benign events, referred to as imbalanced data, where a data set has fewer observations in the minority class (e.g., malicious event, threat) compared with majority classes (e.g., benign event, non-threat) [21]. Imbalanced Learning is the process of learning patterns from imbalanced data.
Imbalanced learning aims to eliminate the bias of traditional ML / AI models on imbalanced data in the learning process. Traditional models maximize overall accuracy, while imbalanced learning pays more attention to the accuracy of the minority class and maintains overall accuracy at a reasonable range. To adapt ML / AI models to the imbalanced data, common imbalanced learning techniques include sampling, weighting, and thresholding [22]. In extremely imbalanced data (for example, the data set with the minority class ratio less than 1%), the weighting approach, which is also called cost-sensitive or weighted classification, generally works better, especially combined with thresholding approaches [23]. The main reason is that the observations in the minority class are too few to do the sampling in a representative manner. In a weighting approach, the observations in the minority class are given higher weights in the loss function. For example, in logistic regression, one can use a weighted log-likelihood loss that assigns a higher weight of greater than 1 to threat observations and a weight of 1 to benign observations [24].
In our problem, imbalanced learning techniques are used to prune and weigh the nodes and edges in the graph, based on their relationships to the network threat. Generally speaking, a graph is pruned and weighed on the basis of the importance of the information represented on the nodes and edges in the graph. This typically depends on the problems that are being solved and the algorithms that are used. Wu used a graph hierarchy inference method based on the Agony model to eliminate noisy nodes or edges in the graph [25]. Chong derived the graph weights based on the graph adjacency structure [26]. Jarnac used bootstrapping via zero-shot analogical pruning to select relevant nodes or edges in the graph [27]. Given that our objective is to prune and weigh the nodes and edges in the graph based on their relationships to the network threat, a supervised learning approach is more suitable for our problem. And because there are less than 1% threat observations and more than 99% non-threat observations in the historical data, the Imbalanced Learning techniques are specifically used in our solution.
2.3. Large Language Models (LLMs)
Large Language Models are neural networks trained on massive text corpora that can understand and generate natural language [28,29,30]. Existing LLMs include ChatGPT, LLaMA, Gemini, Claude, etc. [31]. LLM have been used in applications of summarizing (e.g., summarizing user reviews for brevity), inferring (e.g., sentiment classification, topic extraction), transforming text (e.g., translation, spelling, and grammar correction), expanding (e.g., automatically writing emails), and Retrieval-Augmented Generation (e.g., reference on knowledge base beyond its training data before response) [32]. However, the standard LLM retrieval process is based on similarity [33], where the similarity between the user’s question and the documents in the database is measured and the most similar documents are selected to answer the user’s question, as shown in Figure 1.
Recent work has explored multi-agent LLM systems where multiple models collaborate to solve tasks. These agents can pose natural-language queries to each other and to external data sources [34,35]. This enables dynamically intelligent interactions and collaborations among LLMs and other models and tools that are typically required to work together to solve problems [35,36]. For example, to solve mechanical problems, a multi-agent AI platform MechAgents was developed with a comprehensive intelligent capability to retrieve and integrate relevant knowledge, theory and data, construct and execute codes, and analyze results using multiple numerical methods [35]. Another example is that multi-agent AI systems are used to enhance the decision support for smart city management, combining LLMs with existing urban information systems to process complex routing queries and generate contextually relevant responses, achieving 94-99% accuracy [37].
In our framework, LLM agents serve as query-and-reasoning engines: they translate user questions into graph queries, refine queries iteratively, and interpret results in human-readable explanations. For instance, an agent might summarize a subgraph or explain the rationale behind a flagged anomaly.
2.4. Graph Anomaly Detection
Detecting anomalies in graphs that evolve over time is a well-studied problem [38]. We focus on measures such as the weighted Jaccard similarity between successive graph snapshots. Given two weighted graphs G and H in the same node set, we define
which ranges in . if the graphs are identical and smaller values indicate a structural change. If at time t we have graph and at we add some edges or weights to get , then quantifies how much the graph changed. Intuitively, if few edges change, J stays close to 1, but a surge of new edges (an anomaly) will drop J.
In summary, our work uniquely integrates a graph backbone, imbalanced learning, and cooperative LLM reasoning into one framework, despite that their individual metrics have been studied in many literature and applications separately. Knowledge-graph-based methods have been applied to security analytics and threat intelligence. Graph-based semi-supervised learning and bootstrap methods have been used to handle noisy security data. Imbalanced learning approaches have been adopted for rare-event detection and for log anomaly detection. In parallel, transformer-based models have been explored in cybersecurity. Recent work on multi-agent LLMs highlights that cooperative LLM systems can solve complex tasks through natural-language dialogue, but their use in security has been limited.
3. Data
The evaluation in this paper is done on the CERT Insider Threat Test Dataset [39]. This public dataset simulates enterprise user activities (logins, file accesses, emails, etc.) for a set of users and devices, with labeled insider threats. The CERT dataset provides detailed event logs and ground-truth threat labels, making it suitable for testing detection frameworks. All experiments in this paper use this dataset.
4. Proposed Methodology
ActivityRDI has three core components including knowledge graph, imbalanced learning, and large language model. Each component serves a distinct and complementary role. Knowledge graphs provide a natural representation for heterogeneous activities and their temporal relationships, but on their own can suffer from noise and redundancy. Imbalanced learning is therefore used not only for threat classification, but also to prune and weight the knowledge graph, ensuring that activity representations emphasize threat-relevant signals under extreme class imbalance. Graph similarity measures enable the detection of anomalous behavioral shifts, allowing the system to identify potential unknown threats that are not captured by supervised models. Large language models are deliberately positioned outside the prediction loop and instead act as reasoning, retrieval, and explanation agents, translating structured activity intelligence into forms suitable for analyst understanding without requiring task-specific fine-tuning.
From implementation perspective, this framework consists of three cooperating LLM agents: two collaborators and one supervisor, as shown in Figure 2. Collaborator 1 maintains a dynamic Knowledge Graph. At each time step t it adds new events as edges to form , ensuring efficient online updates. Collaborator 2 trains and applies the weighted classifier on features derived from graph entities (e.g., node degrees, subgraph patterns) to estimate threat likelihoods. The two collaborators interact: if Collaborator 2 assigns high risk to certain events or nodes, Collaborator 1 increases their edge weights or marks them as unusual. Conversely, edges with low risk may be pruned to focus the graph on likely threats.
Periodically, Collaborator 1 also computes graph similarity: Measures the weighted Jaccard between the current user graph and a reference graph (e.g., or a baseline). A drop in this similarity score signals an anomalous shift in user behavior, even if the classifier did not flag it. These signals are stored for reporting.
The Supervisor agent handles user interaction. Upon a user query (e.g., ’What recent user behaviors look suspicious?’), the supervisor LLM generates structured queries for the graph database (using standard query languages or prompt-based retrieval). It may ask Collaborator 1 to list subgraphs around suspicious nodes, or ask Collaborator 2 for classification probabilities. It then synthesizes these into a human-readable interpretation (e.g., ’User X’s recent file access pattern is unusual given their history’ or ’A new device connection to server Y matches no known normal behavior’). The supervisor thus bridges the gap between automated graph analytics and analyst understanding.
Figure 3 illustrates how agents exchange information via natural language and graph queries. Each agent can translate between text and data operations: graph queries, classifier invocations, and explanation generation. Through iterative prompting, the agents refine their analysis: for example, the supervisor may refine a question like “Why is node X flagged?” and get successive clarifications from collaborators before answering.
Compared to the typical query process of LLM in Figure 1, the following additional functionalities are added to our multi-agent LLM query process.
- Multiple types of knowledge base including user-activity knowledge graph and documents: This ensures more comprehensive information to be considered.
- Interpretation from analytic models including graph similarity and imbalanced learning: This avoids the fine-tuning of LLM for specific purposes, saving money and improving efficiency.
5. Modeling Process and Results
5.1. Knowledge Graph Creation
A graph G uses the nodes and edges to represent relational information about users, computing devices, and activities, as shown in Figure 4.
- Nodes V: A node represents a user, user role, device, activity type (i.e., logon, email, file access, removable connect, removable disconnect, web visit, logoff) and activity time.
- Edges E: The edges connect the user, the user role, the device, the activity type, and the activity time, which describe what the user did what activity on the device at what time.
5.2. Graph Pruning and Graph Weighting using Imbalanced Learning Techniques
To reduce redundant and insignificant information in the Knowledge Graph and improve the algorithm efficiency, we prune and weigh the graph using Imbalanced Learning techniques, which evaluate how the information represented by the nodes and edges in the graph are related to the threats in the historical data. First, the numerical representations of the user activities in the graph and the historical threats are created as independent variables (i.e., features) and dependent variable respectively. Then, their relationships are examined through information value and variable clustering techniques filter out the independent variables with weak predictive power or redundant information. The nodes and edges representing weak or redundant information are pruned from the graph. Lastly, a predictive model is trained with a customized imbalanced learning technique to predict whether a logon session is a threat. The predicted value from this predictive model is used to weigh the nodes in the graph.
5.2.1. Feature Creation
In the predictive model, the dependent variable is a binary variable with 1 indicating a threat logon and 0 indicating a normal logon. The independent variables are 56 variables (that is, features) representing the current and past activities of the users, such as the number of executable files running in the current session and the number of executable files running in the past sessions.
5.2.2. Feature Selection
The relationships between these independent variables and the dependent variable are then examined through the information value, and the interrelationships among these independent variables are examined through the clustering of variables. 16 independent variables are selected to be used in the modelling. The nodes and edges representing the information of these 16 variables are kept.
5.2.3. Imbalanced Learning
In historical data, the percentage of threats detected is 0. 34%. To mitigate data bias, the weight of each training sample is first learned through a custom log-likelihood function [23], as shown in Equation 1, from the training data, where i is the training sample index, is the dependent variable value of the training sample i, is the independent variable vector value of the training sample i, and is the coefficient vector of independent variables. The training data are 70% of the historical data while the remaining 30% of historical data are used as validation data to evaluate the model performance later.
The learned sample weights are applied to the training process of machine learning models (e.g., Gradient Boosting Model). Two models are built in this experiment. Their performance is evaluated on the validation data based on the metrics of Gain and Area under Precision-Recall Curve, as shown in Table 1.
- Model 1: Gradient Boosting Model trained without learnable weights
- Model 2: Gradient Boosting Model trained with learnable weights from Equation 1
Compared to Model 1, Model 2 trained with learnable weights can capture 4% more true threats at the top of 3% predicted risky logons and 3% more of true threats at top 30% predicted risky logons. The overall improvement is around 2% under different probability cut-offs to convert the predicted threat probability into binary values. This can potentially prevent the loss of $0.2 billion in 2021, $0.3 billion in 2022, and $0.4 billion in 2023 [5].
Although the absolute performance improvements of Model 2 appear modest, they are significant in the context of insider threat detection, where malicious events account for less than one percent of observed activity. Even a small increase in early threat capture can substantially reduce missed detections, lower analyst workload, and enable earlier intervention. The observed 3–4% improvement therefore represents a meaningful operational gain in real-world detection environments characterized by extreme class imbalance.
5.2.4. Graph Similarity
To measure the change in user activity over time, we first build the current activity graph and the previous activity graph. Then the weighted similarity (e.g., Weighted Jaccard Similarity) between these two graphs is computed.
To show the result, take the user CSC0217 as an example in Figure 5. Its current activity graph shows it logs on the device PC5866 in the afternoon and connects to a removable device, while its past activity graph shows it logged on the devices PC3742, PC6377, and PC2288 in the morning and visited some websites. The Jaccard Similarity Score between these two graphs is very small, resulting in a high activity change score.
5.3. Graph Retrieval and Interpretation using Large Language Model
5.3.1. Graph Schema Creation - Extended
The Content of the user’s Email, File, and Web Visits are important behavior factors. Due to its long text size, it typically cannot be integrated efficiently using traditional knowledge graph techniques. Thanks to the advancement of text embedding and vector databases, they can be efficiently integrated into Knowledge Graph by linking to their embedding values stored in a vector database, as shown in Figure 6.
5.3.2. Large Language Model as Retriever and Interpreter
To more efficiently retrieve and interpret users’ activities and risks for network threat diagnosis and detection, LLM agents do the following work, as shown in Figure 3.
- LLM translates the user’s question in English into Graph Database query language and does the relationship-based search in Knowledge Graph.
- LLM standardizes the text data (e.g., user role) and improves the data quality in Knowledge Graph.
- LLM summarizes the user activity information and the content visited from the Knowledge Graph.
- LLM calls to compute the graph similarity between the current activity graph and the past activity graph for the likelihood of being an unknown threat.
- LLM calls to learn through the imbalanced learning model for the likelihood of being a known threat.
- LLM interprets the user’s activities for the user’s interest and intention based on its own training knowledge base from the whole Web.
An application demo of this process can be found in Figure 7. In the demo, after we ask about a user’s activity changes in the current time period compared with a historical time period or reference time period, we can get the answers about the user’s activity summaries, changes, and risk interpretations. For example, as shown in Figure 8, we ask about the user Lisa’s activity change in January 2024 compared to December 2023. In the generated answer, we can get to know Lisa’s activity changes by shifting from a mix of web visits and logon/logoffs in December 2023 to solely Logon/Logoffs with Removable Connect and Disconnect on different devices, which explains its likelihood of unknown threat is 80% and its likelihood of known threat is 70%.
In this experiment, the open source graph database Nebula is used to build and store user activity graphs, the Python package llama-index is used to index Knowledge Graph, the text-embedding model Text-embedding-3-large is used to vectorize the contents, and the LLM model GPT-4o mini is used to query and generate the answer.
For the content data used in this experiment, we first tested the contents in the Insider Threat Test Dataset, but got the response: “The text appears to be a mix of random words and phrases that do not form coherent sentences or convey a clear message. It seems to be a jumble of disconnected information that does not provide a clear context or topic. It is difficult to interpret any specific interest or meaning from this text. Alternatively, for demonstration purposes, we used the online public documents to build the content nodes in the graph.
6. Applications in Other Domains
The applicability of ActivityRDI beyond cybersecurity follows directly from its activity-centric abstraction rather than from domain-specific assumptions. Any domain characterized by heterogeneous entities, temporally evolving activities, rare critical events, and a need for human-interpretable intelligence can benefit from this framework.
To illustrate this generality, we present an application in customer engagement to demonstrate that ActivityRDI supports accurate, scalable, and timely retrieval and interpretation of activity intelligence across multiple systems. The customer activity data, including digital activities, in-person event activities, and customer identifier hierarchy at different levels, are captured and stored in 10+ systems. In our solution implementation, we have developed a centralized customer engagement knowledge graph that connects all activities at different identifier levels. By adding LLM-based natural language query functionality to this customer engagement graph, the preliminary results show 97% accuracy on the retrieved information in 4 seconds on average among 700+ tested questions. Accurate, agile, and centralized customer activity retrieval enables faster business actions and better business strategies to convince customers and convert deals.
7. Conclusions
Our centralized Activity Retrieval and Detection (ActivityRDI) solution framework helps enhance existing practices of using analytics, machine learning, and artificial intelligence methods to detect network threats. Particularly, the proposed multi-agent AI framework, helps effectively quantify the threat risk of users and computing devices based on their complex activities. In this solution, a Knowledge Graph is used to analyze user activity patterns and threat signals. Then, imbalanced learning techniques are used to prune and weigh the knowledge graph, and also calculate the risk of known threats. Finally, a LLM is used to retrieve and interpret information from Knowledge Graph and Imbalanced Learning Model. This approach integrates the strengths of LLMs in contextual reasoning with the structured relationship modeling capabilities of Knowledge Graphs to monitor, predict, and explain potential threats as they unfold. The synergy between these components ensures both depth and immediacy in threat detection, making the system highly effective in dynamic environments. The preliminary results show that the solution improves threat capture rate by 3%-4% and adds natural language interpretations of the risk predictions based on the user activities. Furthermore, a demo application has been built to show how the proposed solution can be deployed and used. Last but not least, the generalization ability of the proposed solution in other domains is shown through the application of customer engagement.
8. Limitations and Future Work
As with any activity-driven framework, the effectiveness of ActivityRDI depends on the quality and coverage of observed activity data. In environments where activity logs are sparse or highly noisy, graph similarity measures may be less stable, and LLM-based interpretations may require additional validation. These limitations suggest directions for future work on robustness and adaptive calibration rather than fundamental constraints of the proposed framework.
References
- Llinas, J.; Scrofani, J. Foundational technologies for activity-based intelligence—a review of the literature. 2014. [Google Scholar]
- Biltgen, P.; Ryan, S. Activity-based intelligence: principles and applications; Artech House, 2016. [Google Scholar]
- Lawrence, J.L. Activity-Based Intelligence: Coping with the" Unknown Unknowns" in Complex and Chaotic Environments. American Intelligence Journal 2016, 33, 17–25. [Google Scholar]
- Maksimov, N.; Klimov, V. Natural and Artificial Intelligence: An Activity-Based Approach. In Proceedings of the Biologically Inspired Cognitive Architectures Meeting; Springer, 2023; pp. 553–565. [Google Scholar]
- FBI. Internet Crime Report 2023. 2024. Available online: https://www.ic3.gov/AnnualReport/Reports/2023_IC3Report.pdf (accessed on 1 November 2024).
- CISA. Cyber Incident Response to Public Safety Answering Points: A State’s Perspective. 2023. Available online: https://www.cisa.gov/sites/default/files/publications/22_0414_cyber_incident_case_studies_state_final_508c.pdf (accessed on 1 November 2024).
- Zhu, Q.; Fung, C.; Boutaba, R.; Basar, T. GUIDEX: A game-theoretic incentive-based mechanism for intrusion detection networks. IEEE Journal on Selected Areas in Communications 2012, 30, 2220–2230. [Google Scholar] [CrossRef]
- Zhu, Q. Foundations of cyber resilience: The confluence of game, control, and learning theories. arXiv 2024, arXiv:2404.01205. [Google Scholar] [CrossRef]
- Hogan, A.; Blomqvist, E.; Cochez, M.; d’Amato, C.; de Melo, G.; Gutiérrez, C.; Neumaier, S.; Polleres, A.; Schurr, A.; Sequeda, J. Knowledge Graphs. ACM Computing Surveys 2021, 54, 71:1–71:37. [Google Scholar] [CrossRef]
- Ma, X.; Wu, J.; Xue, S.; Yang, J.; Zhou, C.; Sheng, Q.Z.; Xiong, H.; Akoglu, L. A comprehensive survey on graph anomaly detection with deep learning. IEEE transactions on knowledge and data engineering 2021, 35, 12012–12038. [Google Scholar] [CrossRef]
- Janev, V.; Graux, D.; Jabeen, H.; Sallinger, E. Knowledge graphs and big data processing; Springer Nature, 2020. [Google Scholar]
- Zhou, H.; Shen, T.; Liu, X.; Zhang, Y.; Guo, P.; Zhang, J. Survey of knowledge graph approaches and applications. Journal on Artificial Intelligence 2020, 2, 89–101. [Google Scholar] [CrossRef]
- Huang, H.; Chen, Y.; Lou, B.; Hongzhou, Z.; Wu, J.; Yan, K. Constructing knowledge graph from big data of smart grids. In Proceedings of the 2019 10th International Conference on Information Technology in Medicine and Education (ITME); IEEE, 2019; pp. 637–641. [Google Scholar]
- Zhao, Q.; Liu, J.; Sullivan, N.; Chang, K.; Spina, J.; Blasch, E.; Chen, G. Anomaly detection of unstructured big data via semantic analysis and dynamic knowledge graph construction. In Proceedings of the Signal processing, sensor/information fusion, and target recognition XXX. SPIE; 2021; Vol. 11756, pp. 126–142. [Google Scholar]
- Zhang, L.; Priestley, J.; DeMaio, J.; Ni, S.; Tian, X. Measuring customer similarity and identifying cross-selling products by community detection. Big data 2021, 9, 132–143. [Google Scholar] [CrossRef]
- Ren, Y.; Xiao, Y.; Zhou, Y.; Zhang, Z.; Tian, Z. CSKG4APT: A cybersecurity knowledge graph for advanced persistent threat organization attribution. IEEE Transactions on Knowledge and Data Engineering 2022, 35, 5695–5709. [Google Scholar] [CrossRef]
- Chen, T.; Dong, C.; Lv, M.; Song, Q.; Liu, H.; Zhu, T.; Xu, K.; Chen, L.; Ji, S.; Fan, Y. Apt-kgl: An intelligent apt detection system based on threat knowledge and heterogeneous provenance graph learning. IEEE Transactions on Dependable and Secure Computing, 2022. [Google Scholar]
- Sui, Y.; Zhang, Y.; Sun, J.; Xu, T.; Zhang, S.; Li, Z.; Sun, Y.; Guo, F.; Shen, J.; Zhang, Y.; et al. Logkg: Log failure diagnosis through knowledge graph. IEEE Transactions on Services Computing 2023, 16, 3493–3507. [Google Scholar] [CrossRef]
- Sikos, L.F. Cybersecurity knowledge graphs. Knowledge and Information Systems 2023, 65, 3511–3531. [Google Scholar] [CrossRef]
- Rastogi, N.; Dutta, S.; Christian, R.; Gridley, J.; Zaki, M.; Gittens, A.; Aggarwal, C. Predicting malware threat intelligence using KGs. arXiv 2021, arXiv:2102.05571. [Google Scholar]
- Chen, Z.; Yan, Q.; Han, H.; Wang, S.; Peng, L.; Wang, L.; Yang, B. Machine learning based mobile malware detection using highly imbalanced network traffic. Information Sciences 2018, 433, 346–364. [Google Scholar] [CrossRef]
- He, H.; Ma, Y. Imbalanced learning: foundations, algorithms, and applications. 2013. [Google Scholar]
- Zhang, L.; Geisler, T.; Ray, H.; Xie, Y. Improving logistic regression on the imbalanced data by a novel penalized log-likelihood function. Journal of Applied Statistics 2022, 49, 3257–3277. [Google Scholar] [CrossRef]
- Zhang, L.; Ray, H.; Priestley, J.; Tan, S. A descriptive study of variable discretization and cost-sensitive logistic regression on imbalanced credit data. Journal of Applied Statistics 2020, 47, 568–581. [Google Scholar] [CrossRef]
- Wu, C.; Zeng, Z.; Yang, Y.; Chen, M.; Peng, X.; Liu, S. Task-driven cleaning and pruning of noisy knowledge graph. Information Sciences 2023, 646, 119406. [Google Scholar] [CrossRef]
- Chong, Y.; Ding, Y.; Yan, Q.; Pan, S. Graph-based semi-supervised learning: A review. Neurocomputing 2020, 408, 216–230. [Google Scholar] [CrossRef]
- Jarnac, L.; Couceiro, M.; Monnin, P. Relevant entity selection: Knowledge graph bootstrapping via zero-shot analogical pruning. In Proceedings of the Proceedings of the 32nd ACM International Conference on Information and Knowledge Management, 2023; pp. 934–944. [Google Scholar]
- Min, B.; Ross, H.; Sulem, E.; Veyseh, A.P.B.; Nguyen, T.H.; Sainz, O.; Agirre, E.; Heintz, I.; Roth, D. Recent advances in natural language processing via large pre-trained language models: A survey. ACM Computing Surveys 2023, 56, 1–40. [Google Scholar] [CrossRef]
- Brown, T.B.; Mann, B.; Ryder, N.; Subbiah, M.; Kaplan, J.; Dhariwal, P.; Neelakantan, A.; Shyam, P.; Sastry, G.; Askell, A.; et al. Language Models are Few-Shot Learners. OpenAI Technical Report 2020. [Google Scholar]
- OpenAI. GPT-4 Technical Report, 2023; OpenAI Blog.
- Zhao, W.X.; Zhou, K.; Li, J.; Tang, T.; Wang, X.; Hou, Y.; Min, Y.; Zhang, B.; Zhang, J.; Dong, Z.; et al. A survey of large language models. arXiv 2023, arXiv:2303.182231. [Google Scholar] [PubMed]
- Guastalla, M.; Li, Y.; Hekmati, A.; Krishnamachari, B. Application of large language models to ddos attack detection. In Proceedings of the International Conference on Security and Privacy in Cyber-Physical Systems and Smart Vehicles; Springer, 2023; pp. 83–99. [Google Scholar]
- Steck, H.; Ekanadham, C.; Kallus, N. Is cosine-similarity of embeddings really about similarity? In Proceedings of the Companion Proceedings of the ACM Web Conference; 2024; 2024, pp. 887–890. [Google Scholar]
- Park, J.S.; O’Brien, J.; Cai, C.J.; Morris, M.R.; Liang, P.; Bernstein, M.S. Generative agents: Interactive simulacra of human behavior. In Proceedings of the Proceedings of the 36th annual acm symposium on user interface software and technology, 2023; pp. 1–22. [Google Scholar]
- Ni, B.; Buehler, M.J. MechAgents: Large language model multi-agent collaborations can solve mechanics problems, generate new data, and integrate knowledge. Extreme Mechanics Letters 2024, 67, 102131. [Google Scholar] [CrossRef]
- Talebirad, Y.; Nadiri, A. Multi-agent collaboration: Harnessing the power of intelligent llm agents. arXiv 2023, arXiv:2306.03314. [Google Scholar] [CrossRef]
- Kalyuzhnaya, A.; Mityagin, S.; Lutsenko, E.; Getmanov, A.; Aksenkin, Y.; Fatkhiev, K.; Fedorin, K.; Nikitin, N.O.; Chichkova, N.; Vorona, V.; et al. LLM Agents for Smart City Management: Enhancing Decision Support Through Multi-Agent AI Systems. Smart Cities (2624-6511) 2025, 8. [Google Scholar] [CrossRef]
- Akoglu, L.; Tong, H.; Koutra, D. Graph-based anomaly detection and description: a survey. Data Mining and Knowledge Discovery 2015, 29, 626–688. [Google Scholar] [CrossRef]
- Lindauer, B. Insider Threat Test Dataset. 2020. Available online: https://doi.org/10.1184/R1/12841247.v1 (accessed on 1 November 2024).
Figure 1.
LLM Question-Answer Process.
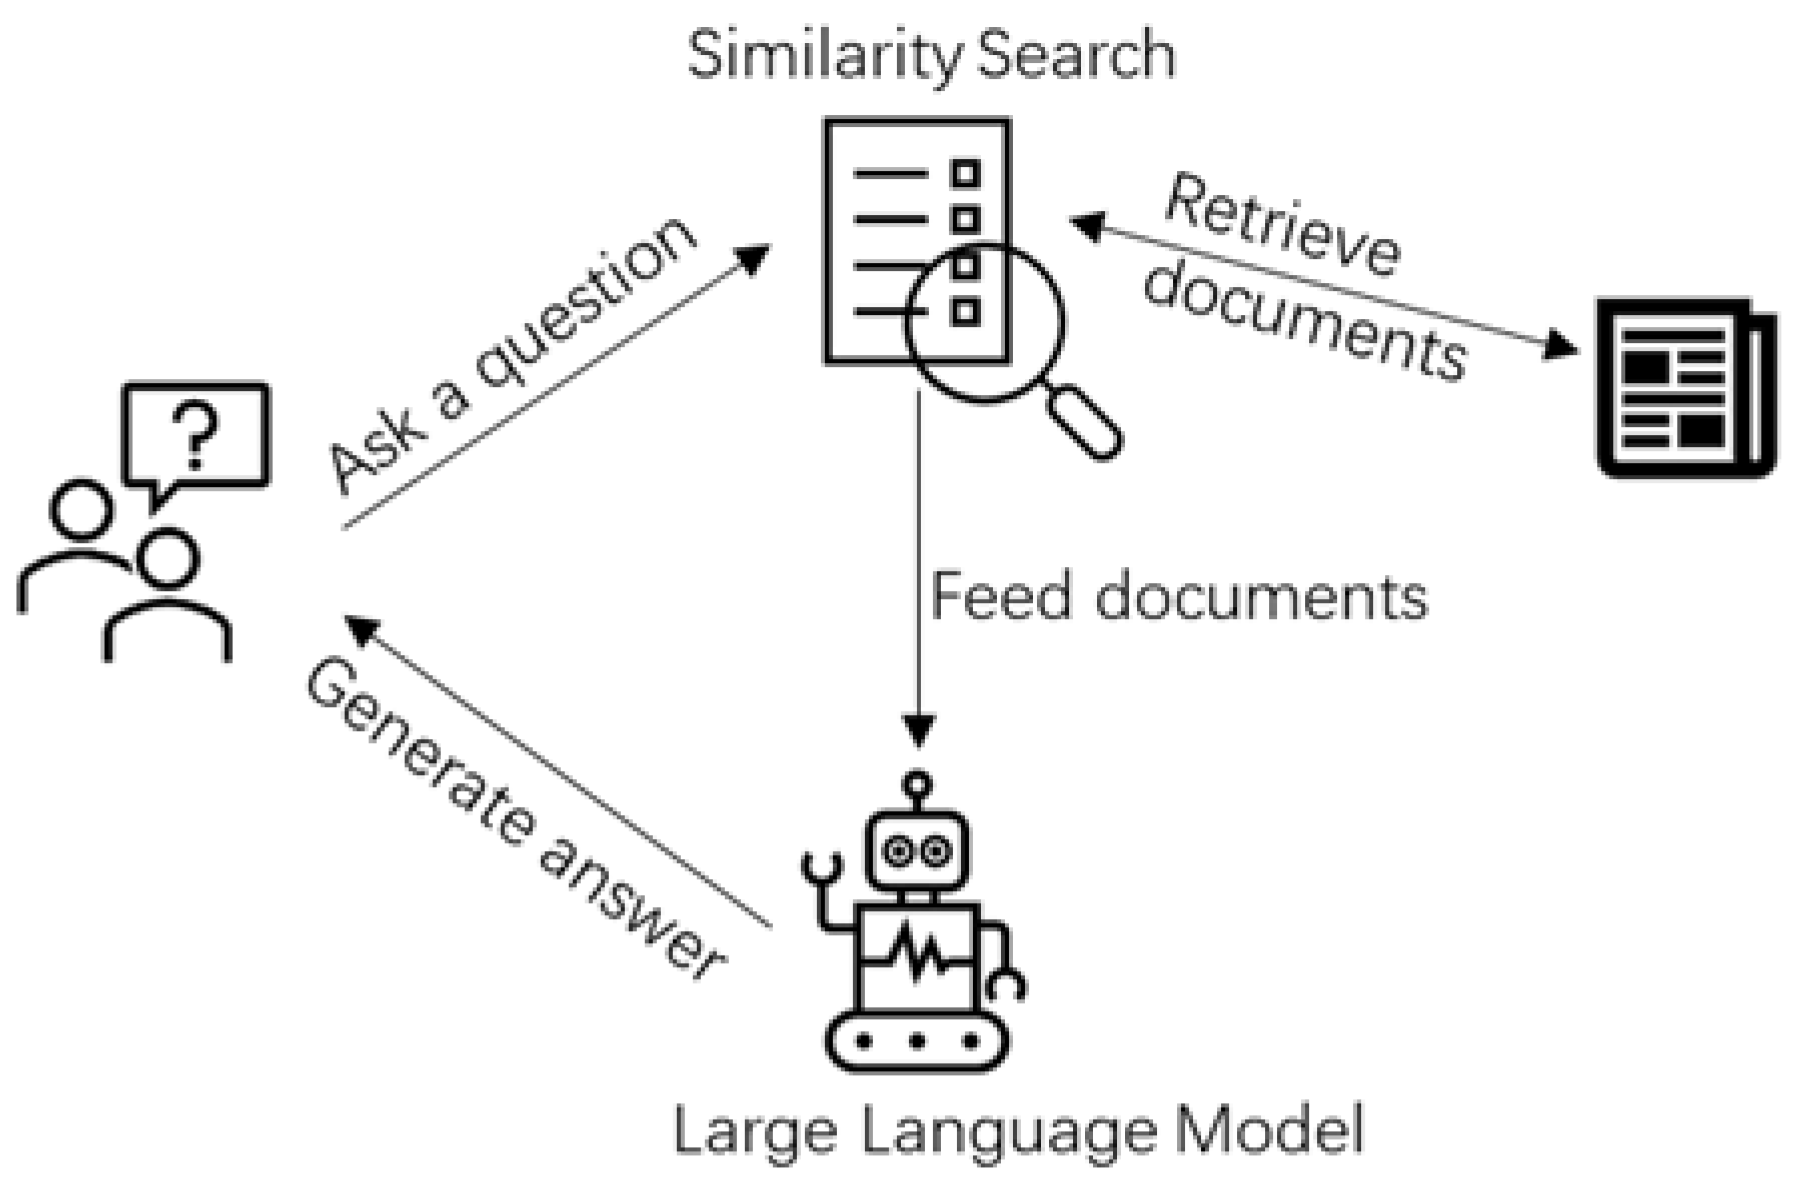
Figure 2.
Multi-agent AI Framework of Network Threat Detection.
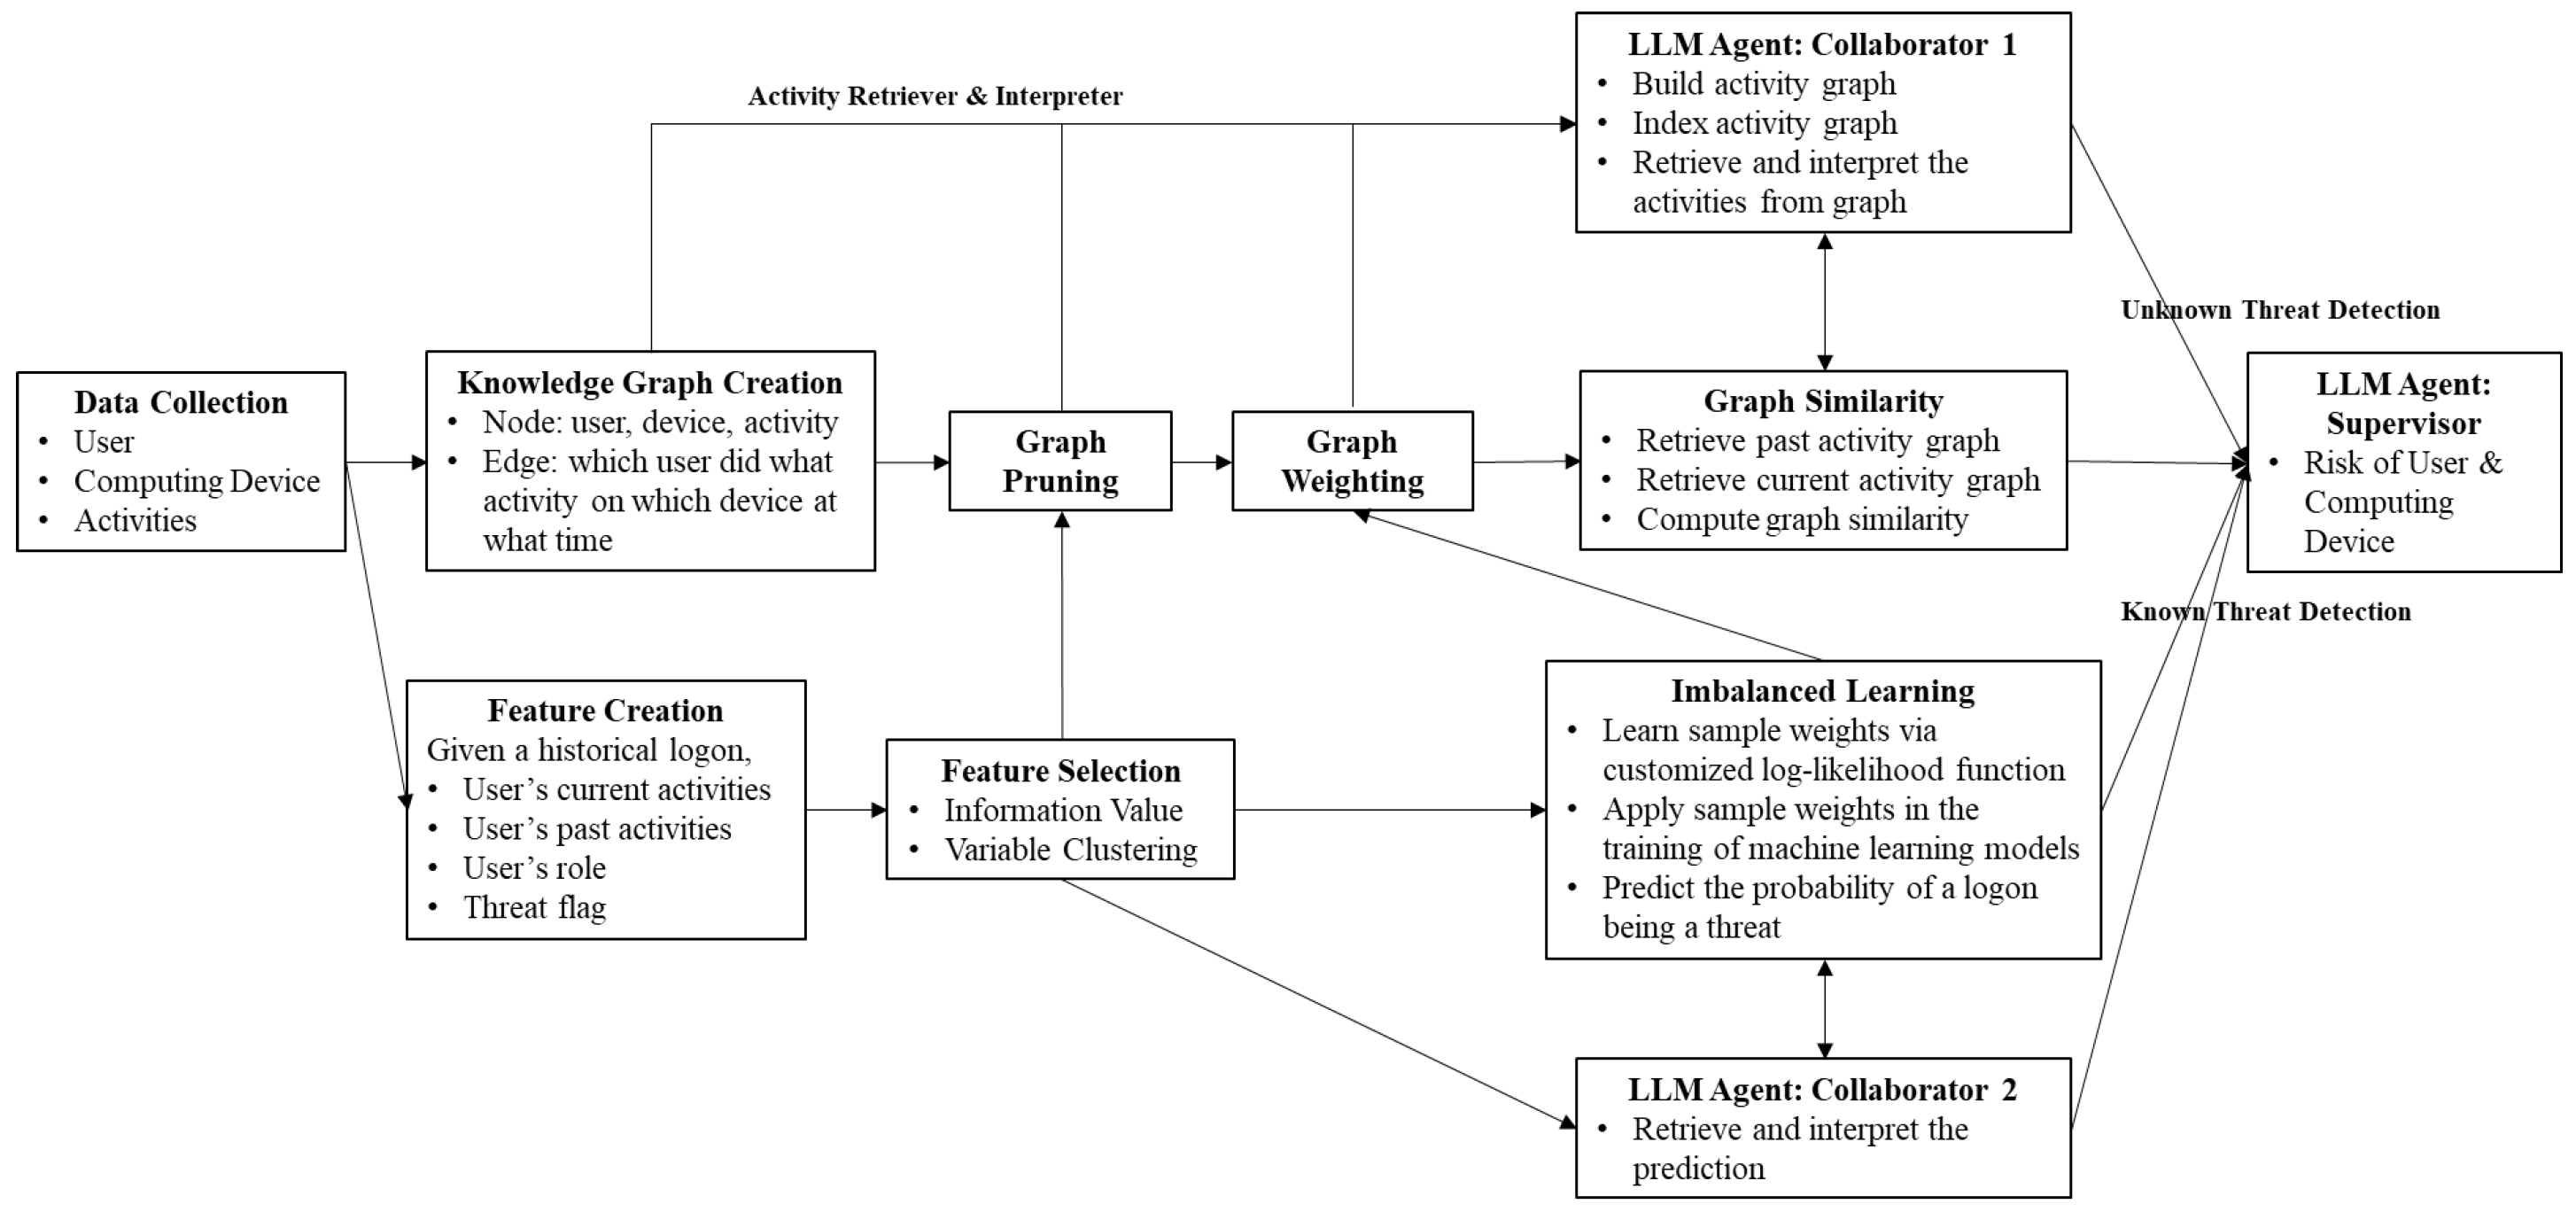
Figure 3.
ActivityRDI: LLM-based Knowledge Graph Retriever and Interpreter.
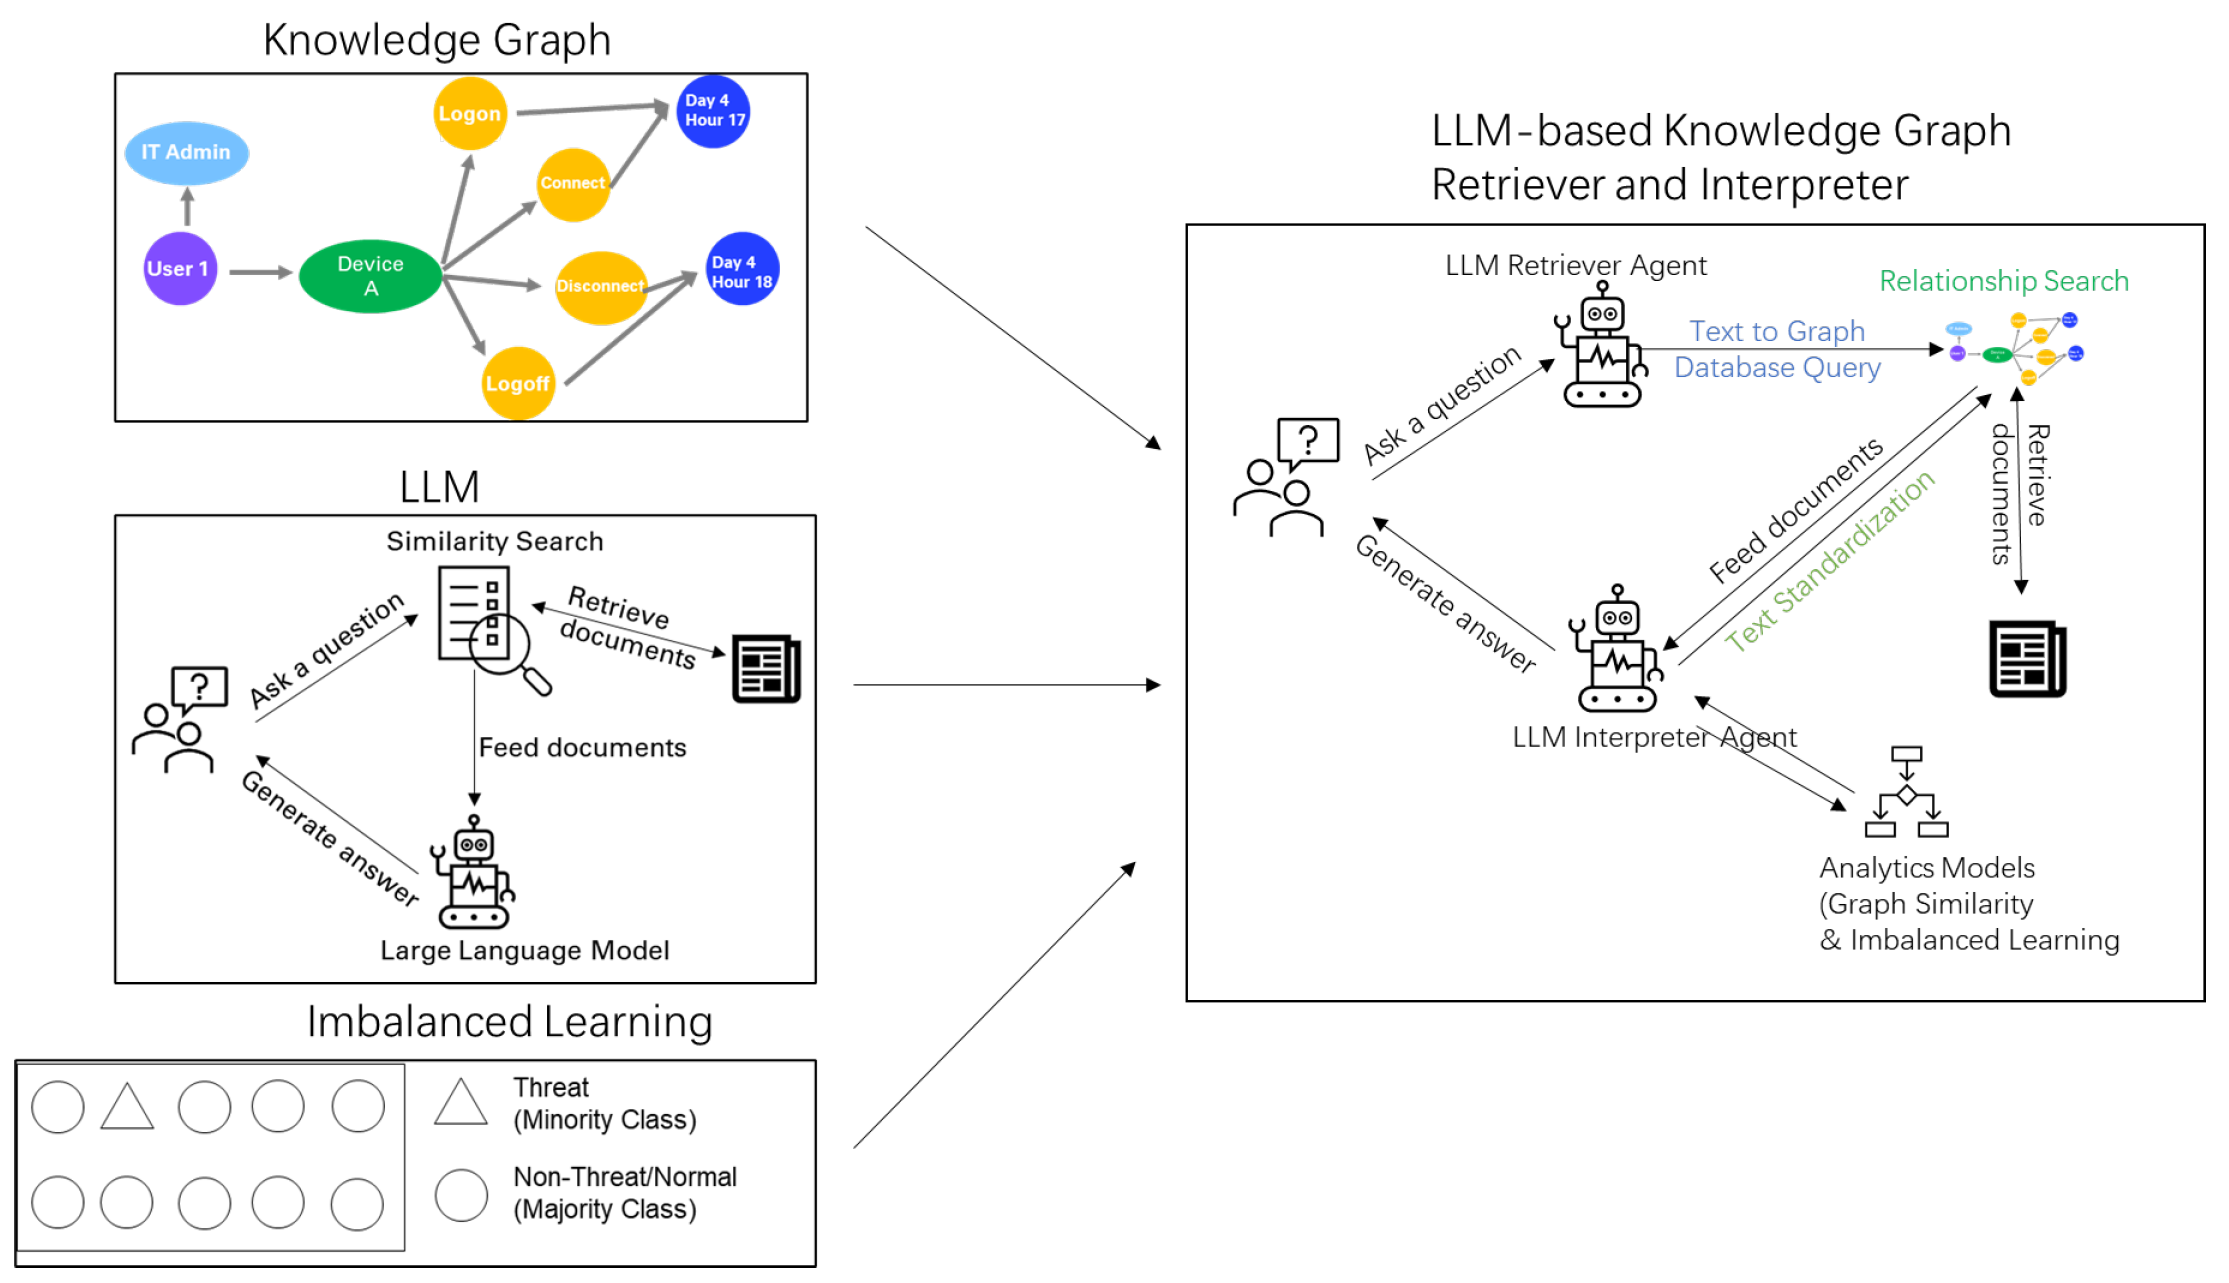
Figure 4.
User-Activity Knowledge Graph Schema.
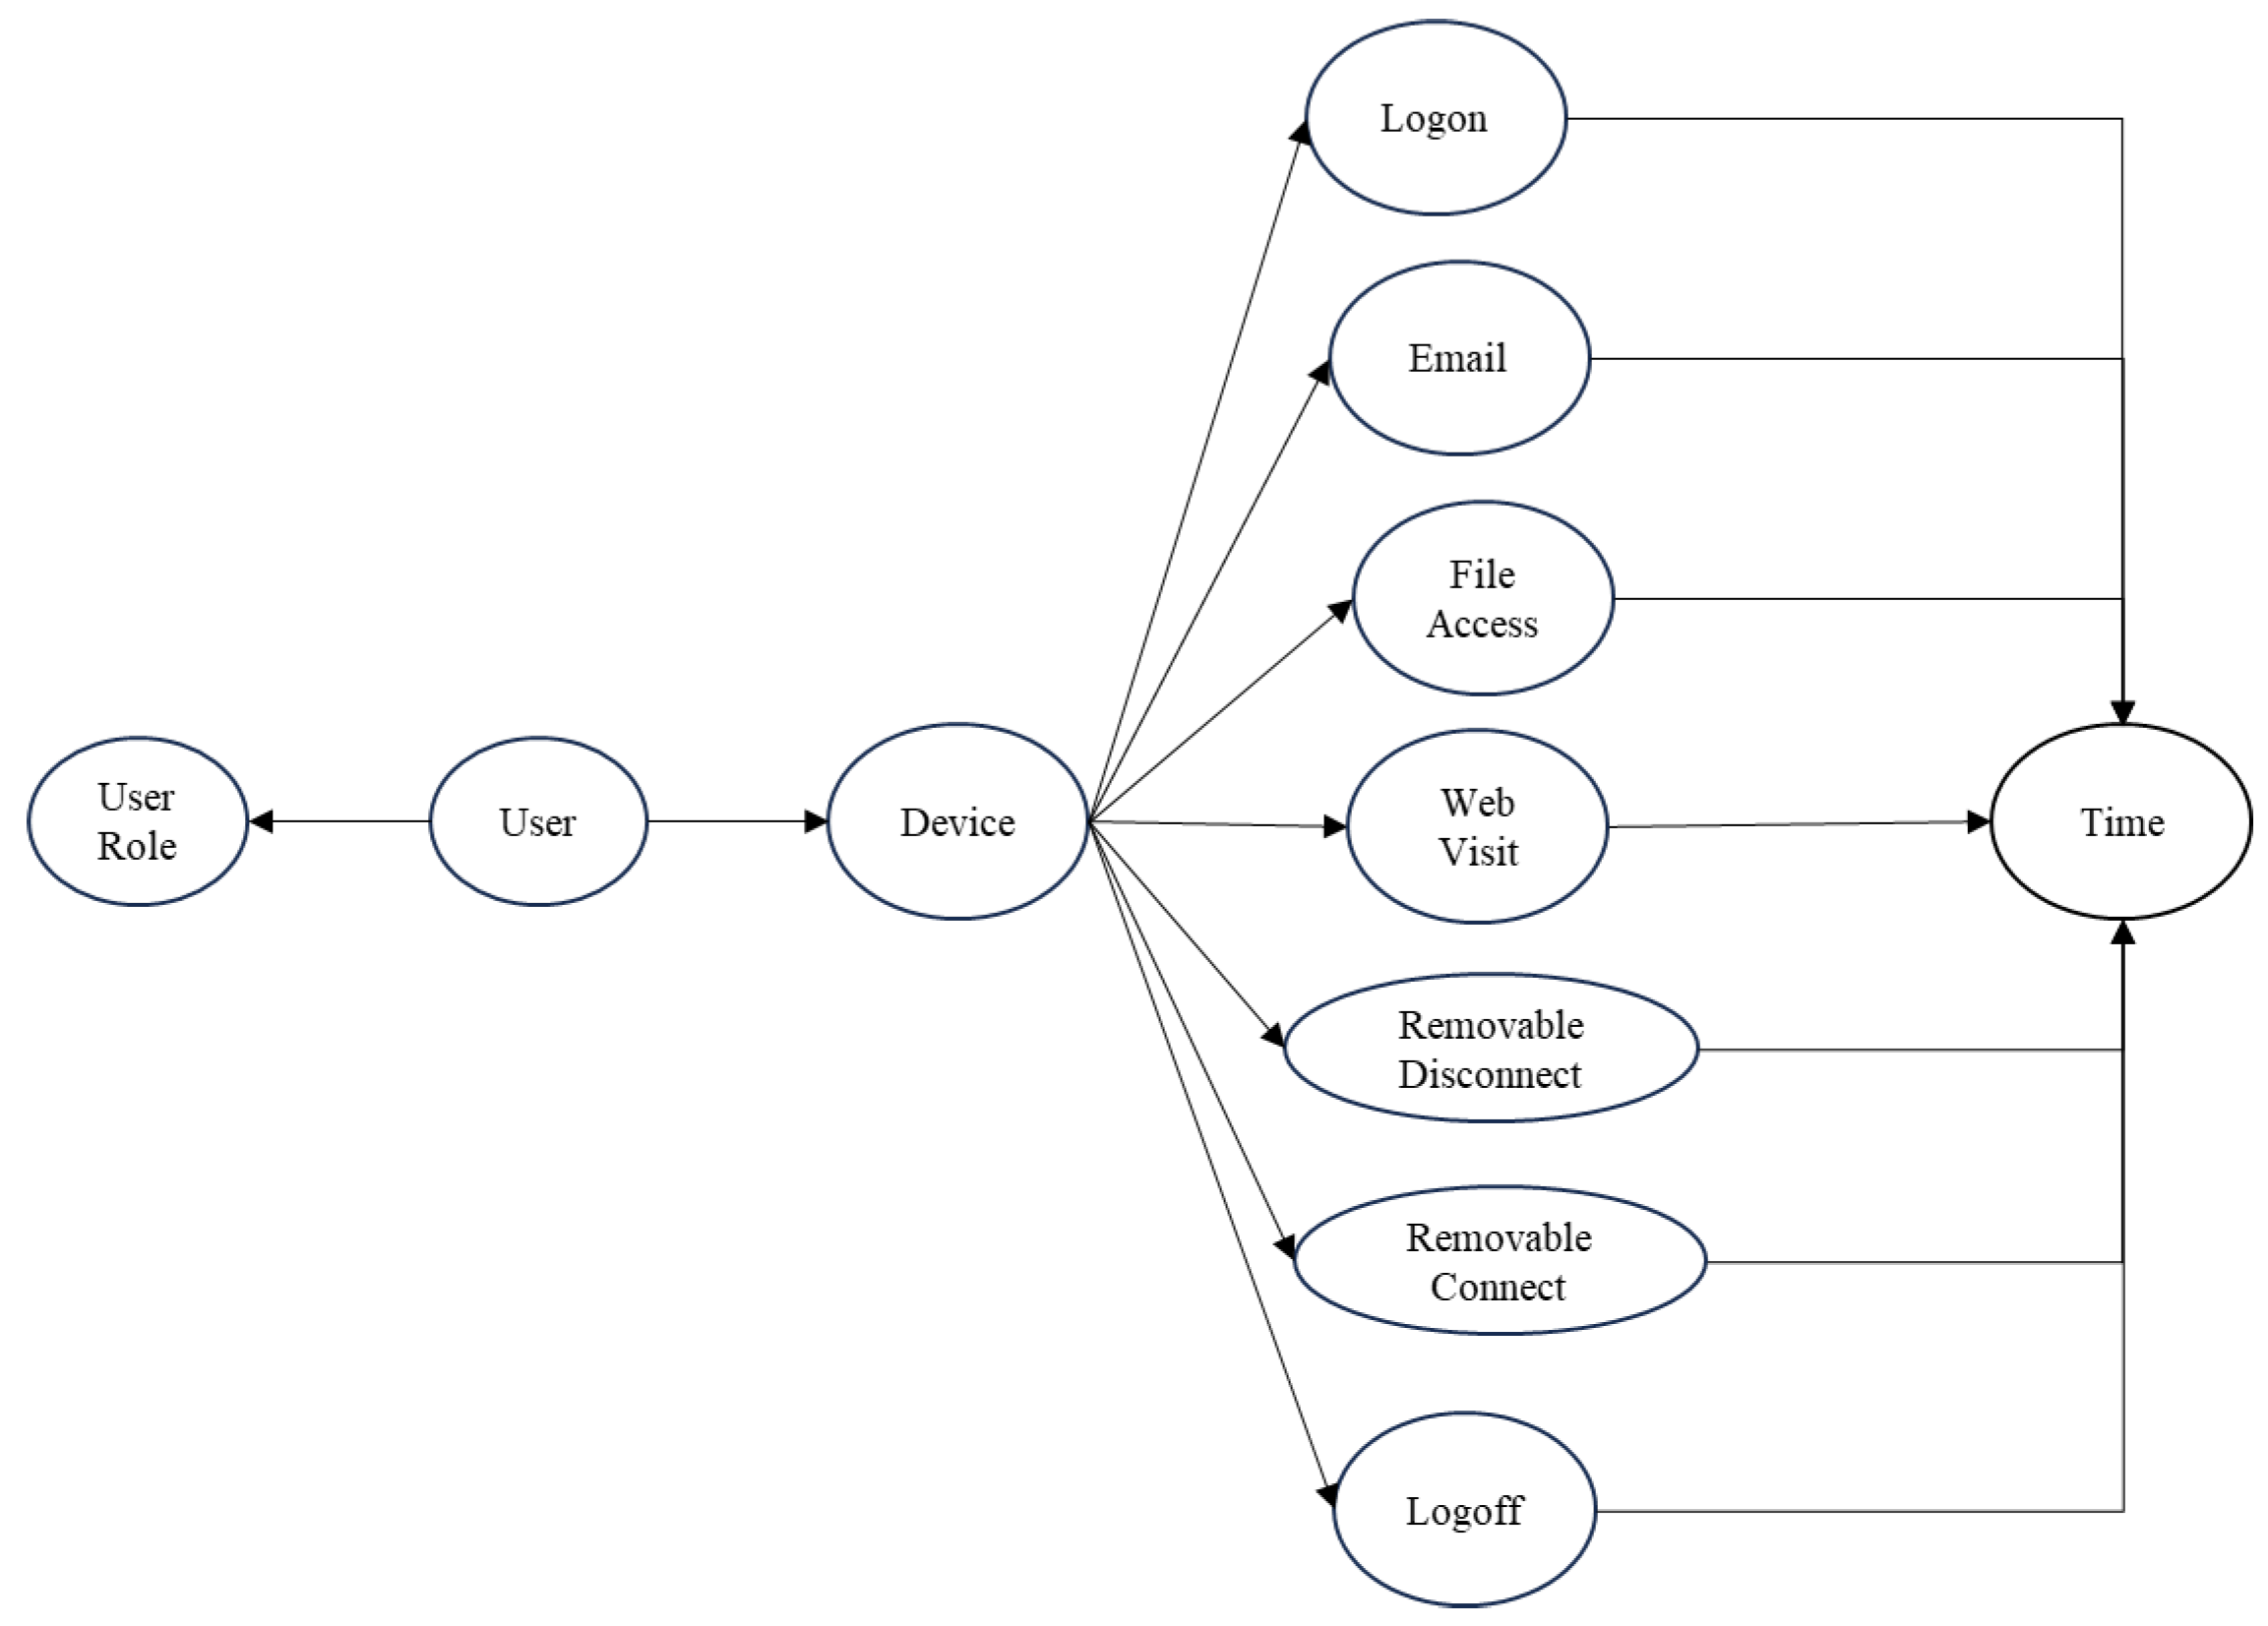
Figure 5.
User CSC0217 Activity Graph and Change Score.
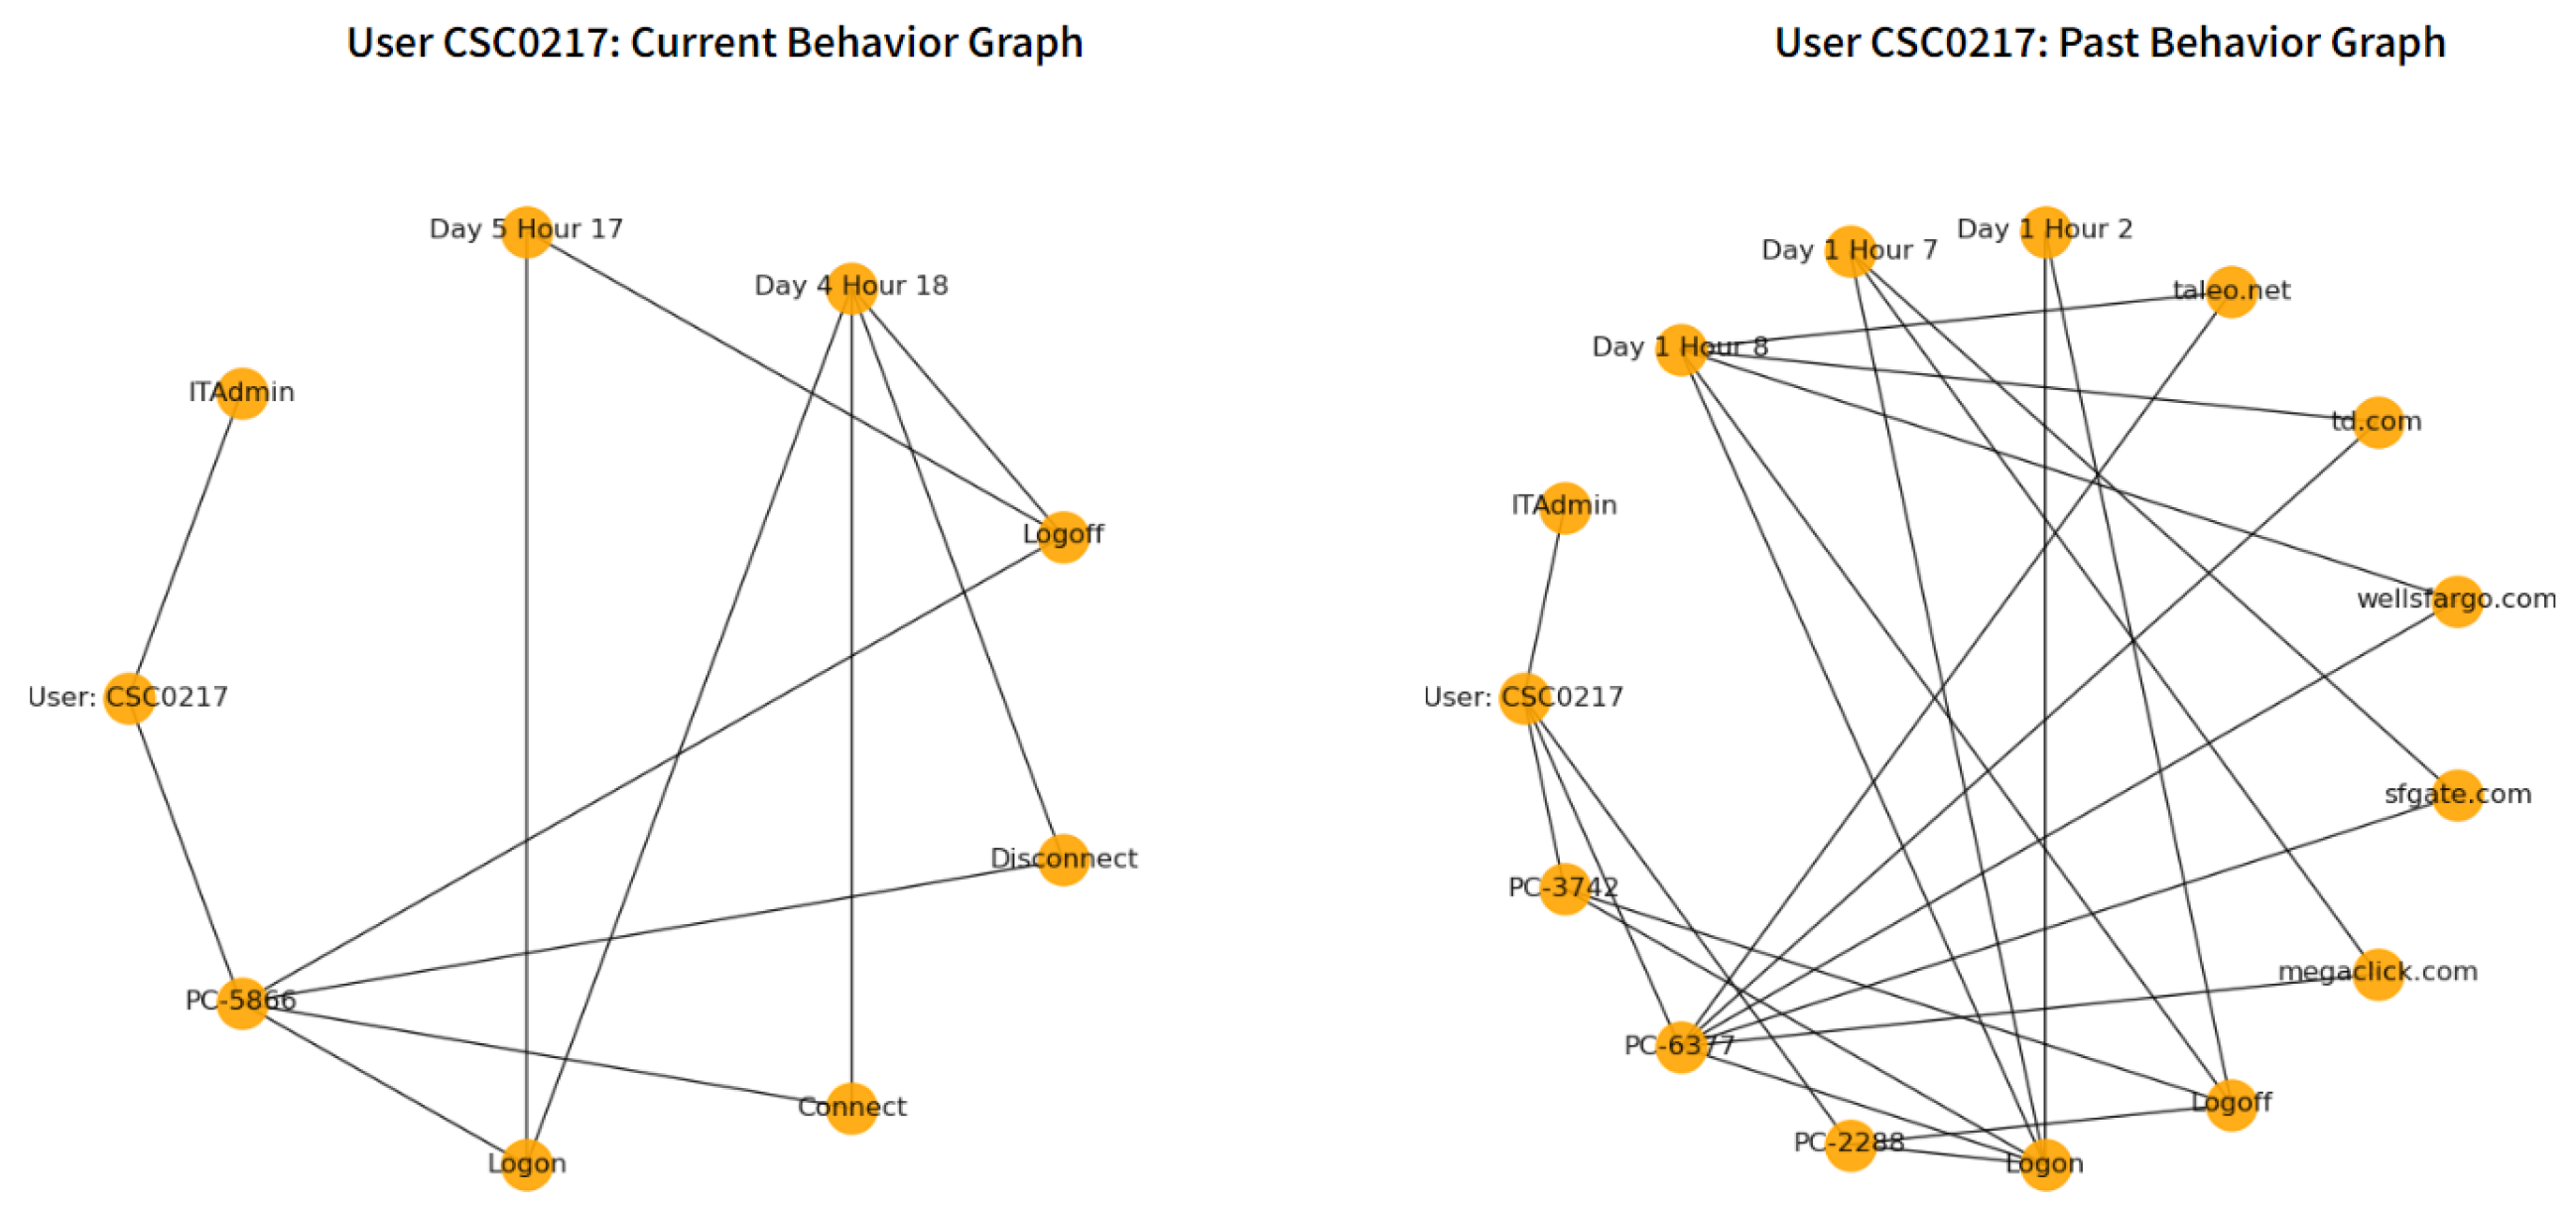
Figure 6.
User-Activity Knowledge Graph Schema Extended with Content Texts.
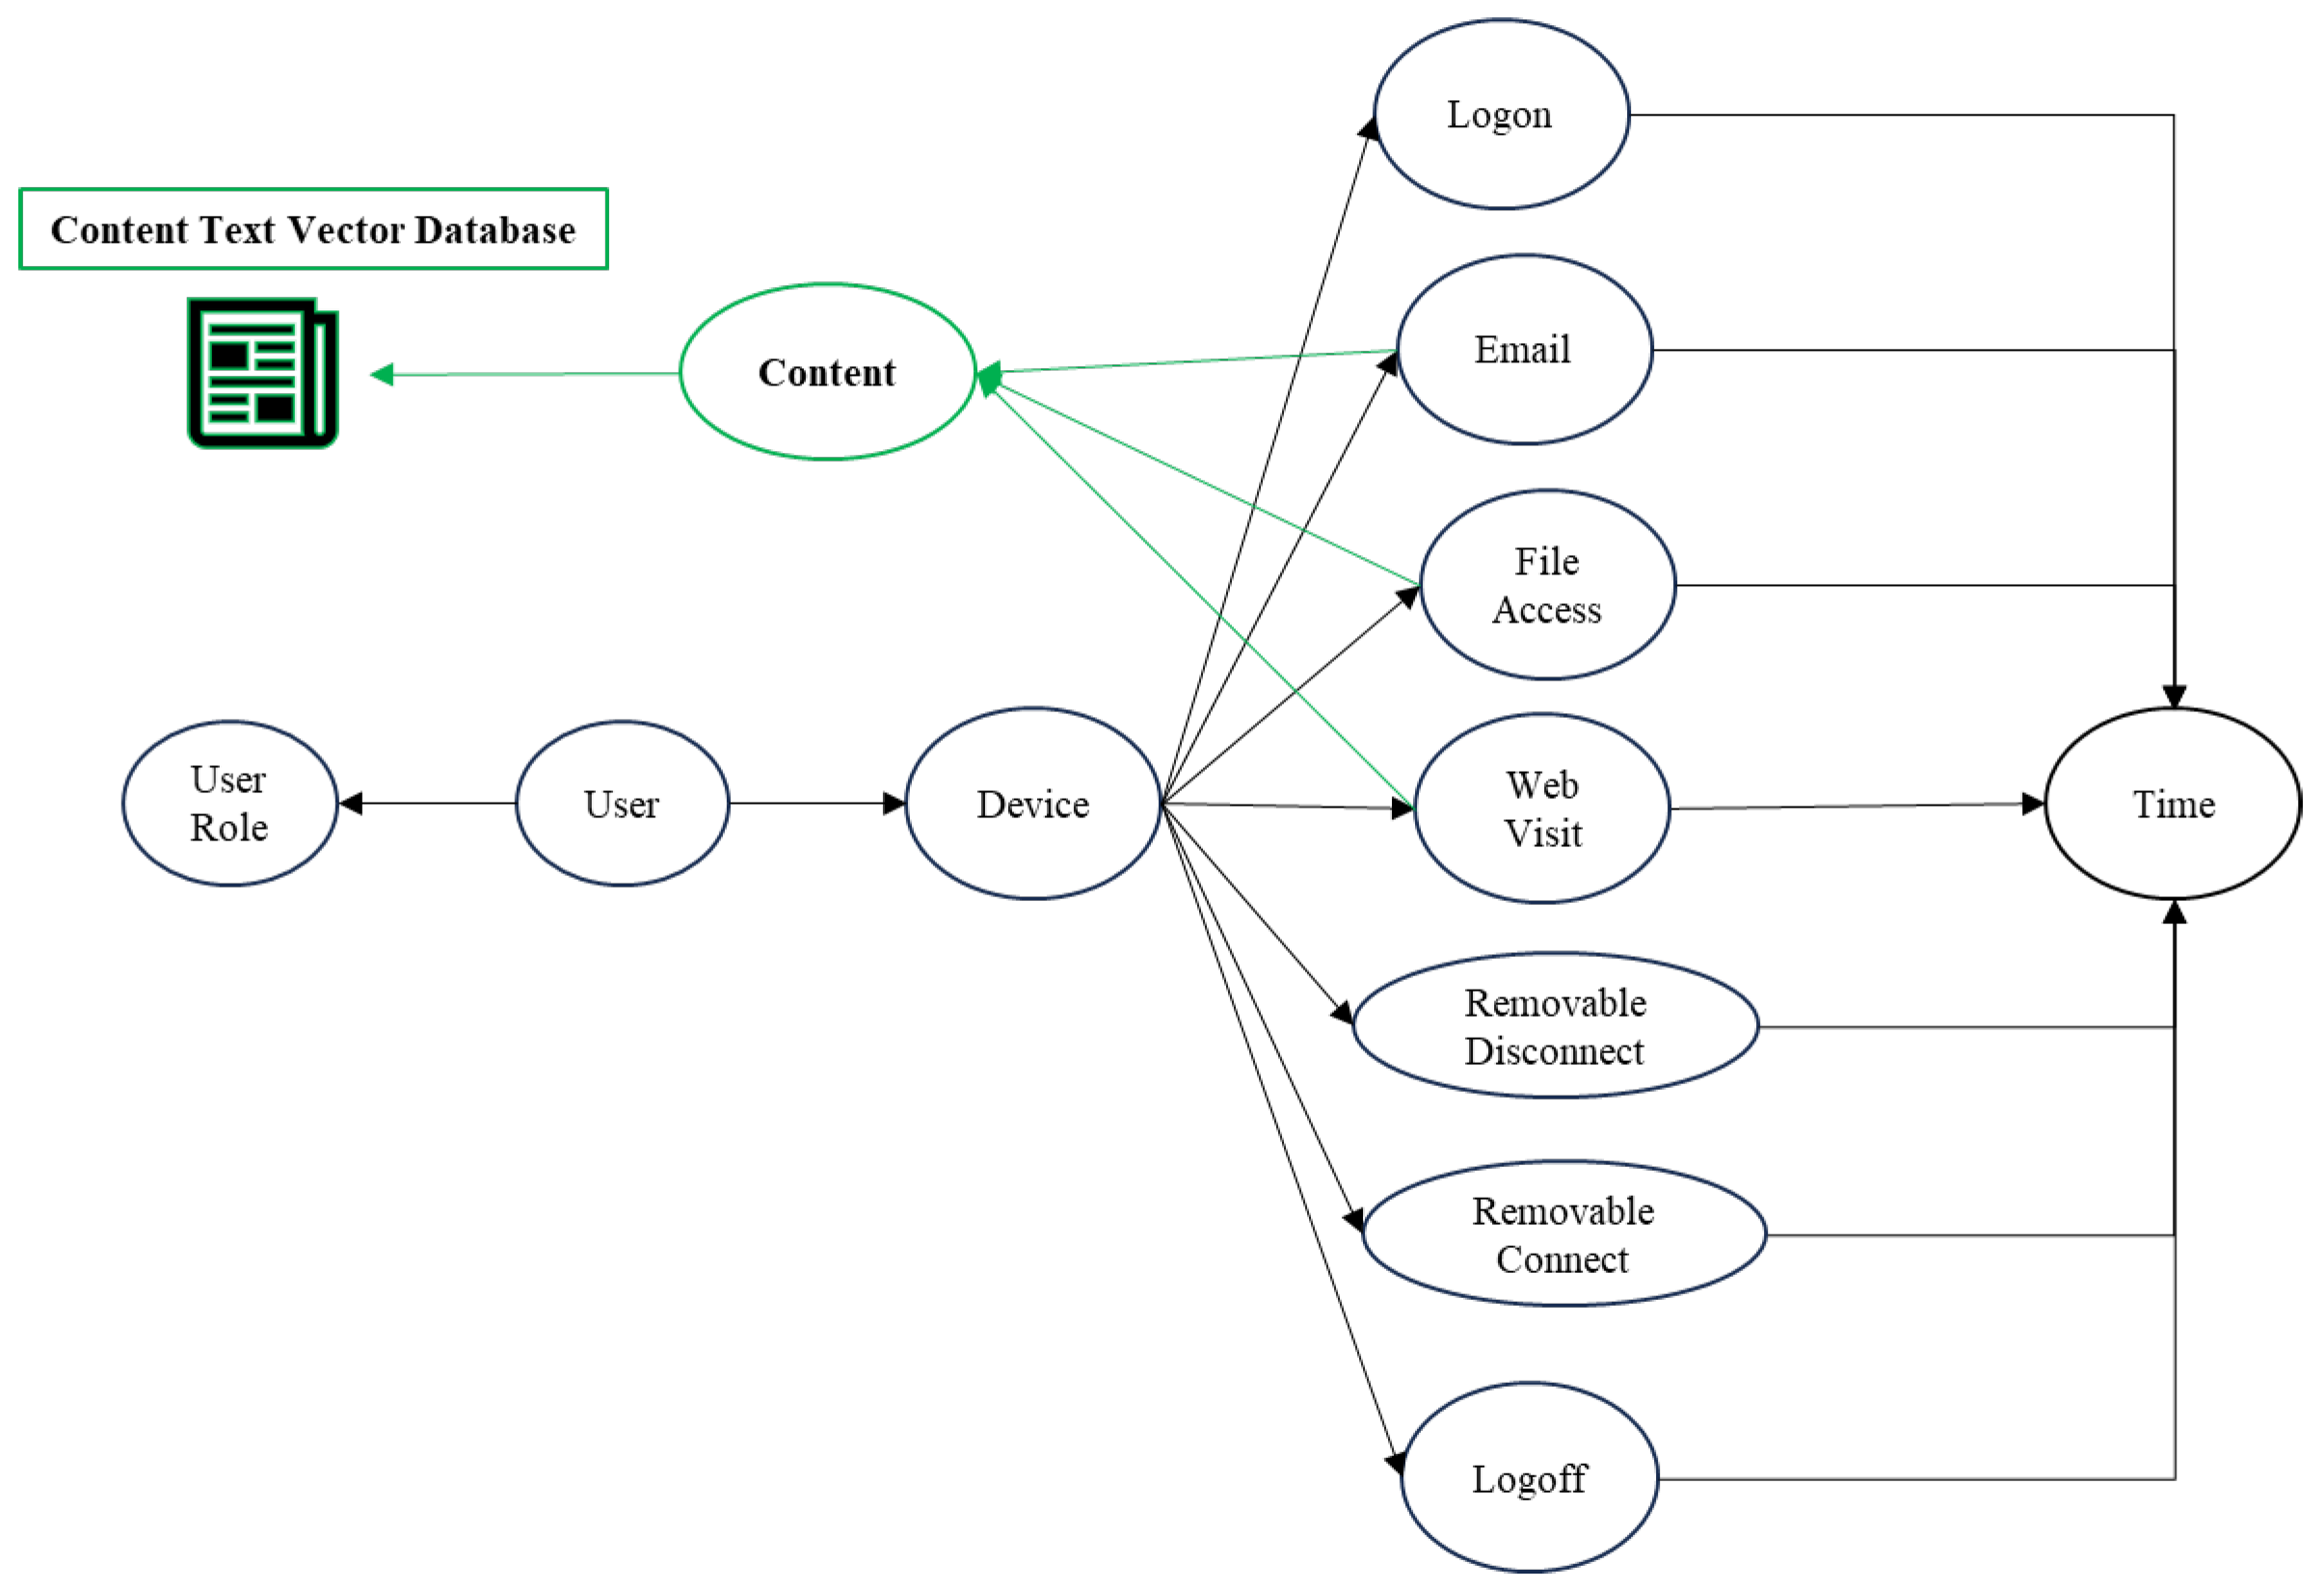
Figure 7.
Application Demo Data Workflow.
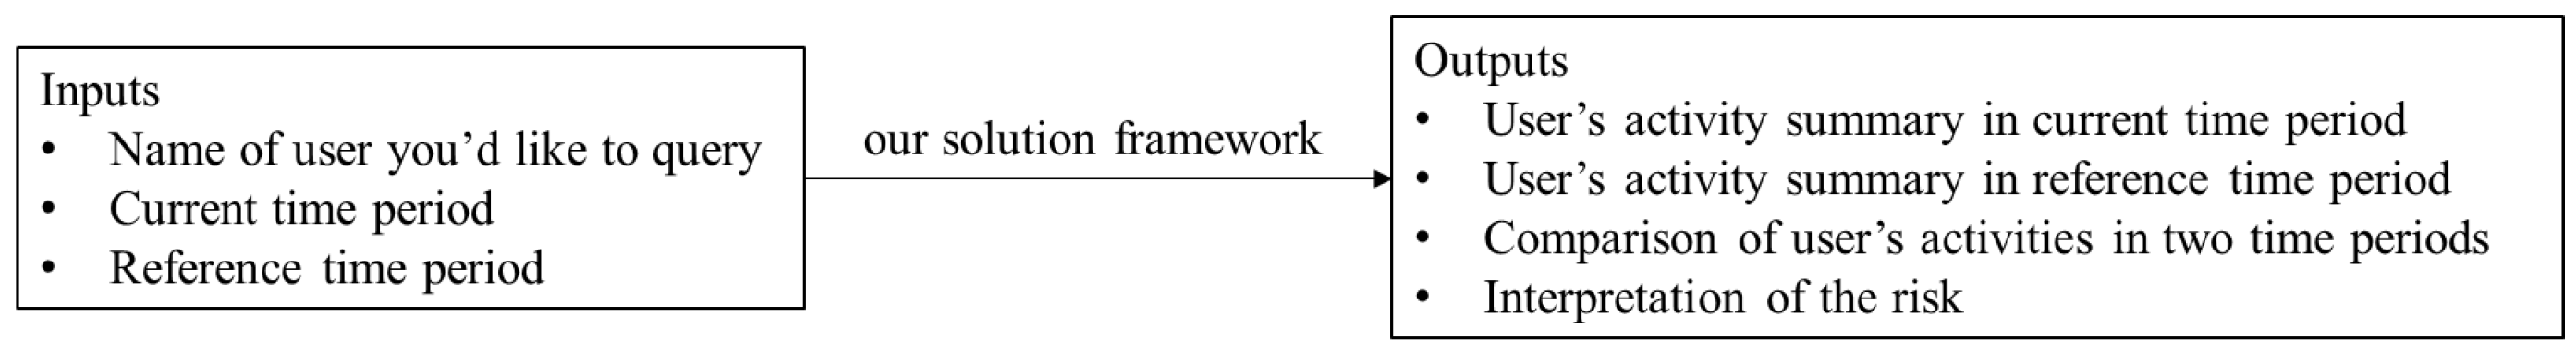
Figure 8.
Application Demo Results.
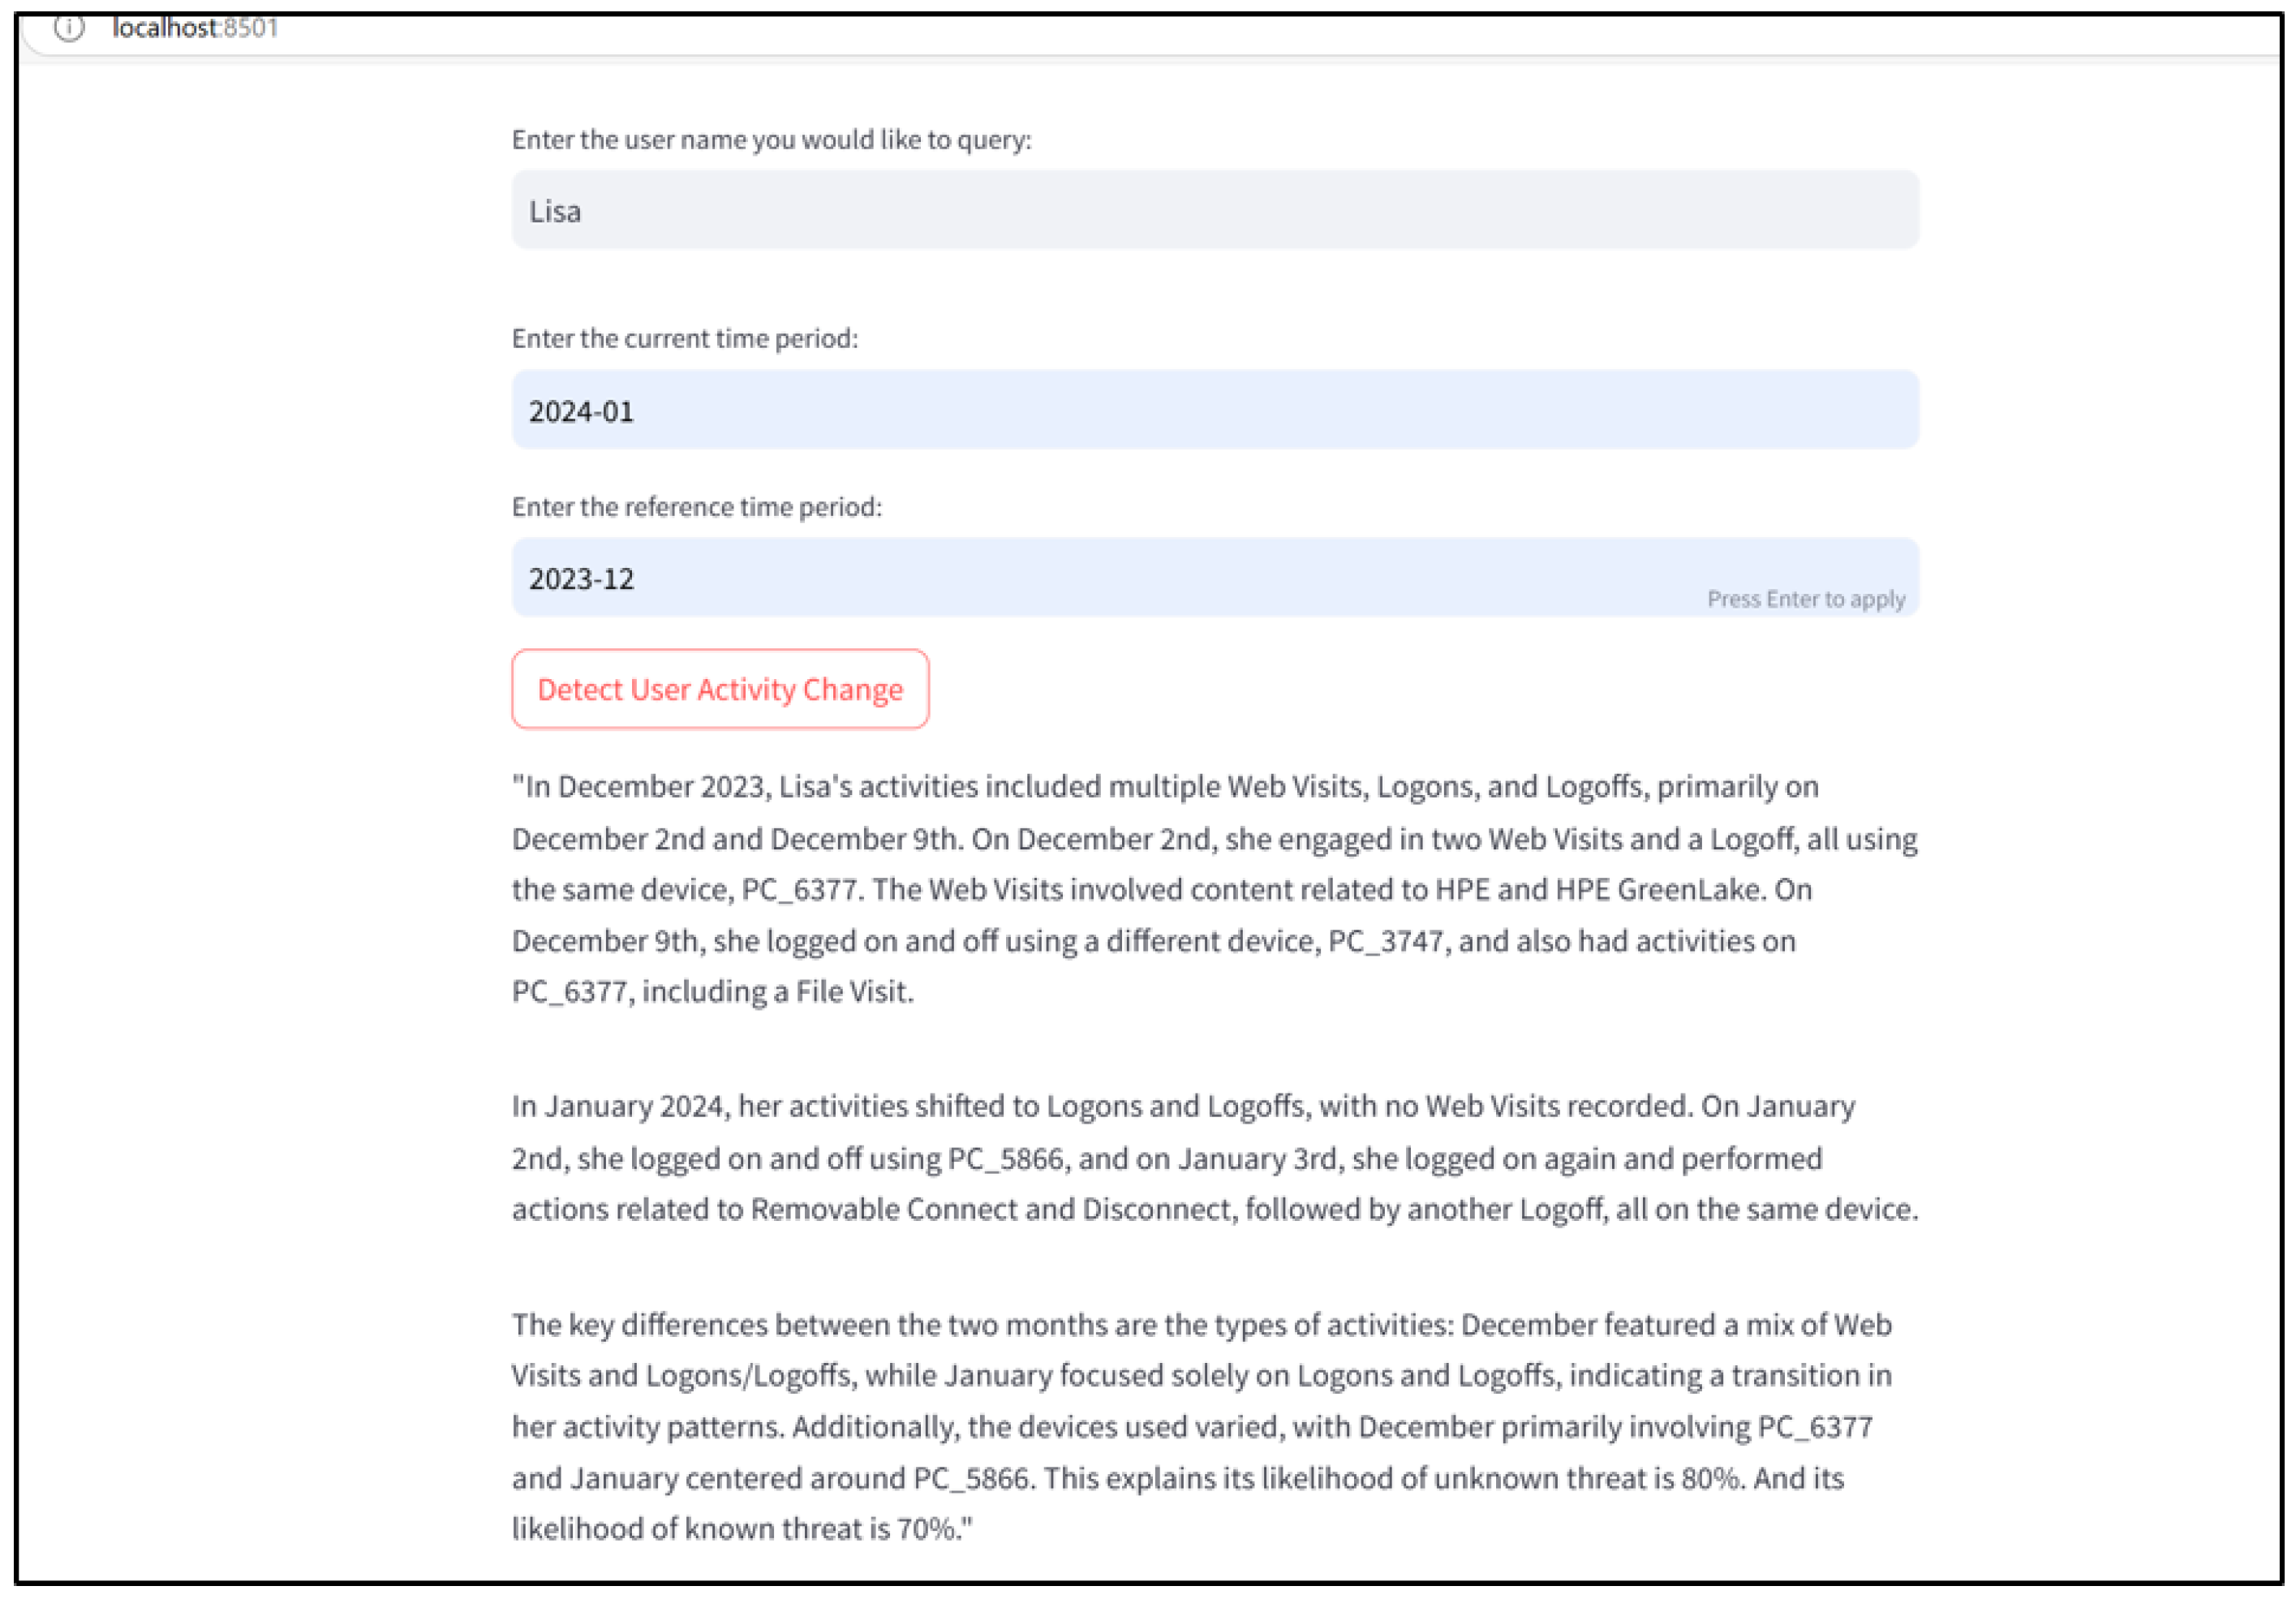

Table 1.
Model Performance.
| Performance Metric | Model 1 | Model 2 |
|---|---|---|
| % captured true threats | ||
| among all true threats (gain) | ||
| at top 3% predicted risky logons | 56% | 60% |
| % captured true threats | ||
| among all true threats (gain) | ||
| at top 30% predicted risky logons | 95% | 98% |
| Area under Precision-Recall Curve | 0.186 | 0.204 |
Disclaimer/Publisher’s Note: The statements, opinions and data contained in all publications are solely those of the individual author(s) and contributor(s) and not of MDPI and/or the editor(s). MDPI and/or the editor(s) disclaim responsibility for any injury to people or property resulting from any ideas, methods, instructions or products referred to in the content. |
© 2026 by the authors. Licensee MDPI, Basel, Switzerland. This article is an open access article distributed under the terms and conditions of the Creative Commons Attribution (CC BY) license (http://creativecommons.org/licenses/by/4.0/).
Copyright: This open access article is published under a Creative Commons CC BY 4.0 license, which permit the free download, distribution, and reuse, provided that the author and preprint are cited in any reuse.


