
Submitted:
18 January 2026
Posted:
20 January 2026
You are already at the latest version
Abstract
Evaluating national climate policy performance requires frameworks that integrate multiple dimensions while accommodating diverse development pathways. This study develops a Multi-Attribute Utility Theory (MAUT) framework to construct a Climate Policy Performance Index (CPPI) for 187 countries. The index integrates four dimensions—mitigation, adaptation, economic capacity, and governance—using explicit utility functions and policy-aligned weights derived from climate policy priorities. Data are drawn from the Global Carbon Project, ND-GAIN Country Index, and World Bank indicators. Results reveal substantial cross-national heterogeneity, with CPPI scores ranging from 33.67 (Turkmenistan) to 78.46 (Norway). Nordic countries lead with balanced excellence across dimensions, while alternative high-performance pathways emerge through mitigation leadership (Uruguay, Costa Rica) or governance-economy strength (Singapore). Regional analysis identifies Europe as the top-performing region (mean = 59.92), whereas Sub-Saharan Africa achieves unexpectedly high rankings despite low emissions, owing to weak institutional capacity. The relationship between income and climate performance is non-monotonic: lower-middle-income countries achieve comparable aggregate scores to high-income nations, with near-perfect mitigation performance compensating for weaker governance. Sensitivity analysis shows that ranking robustness is comparable across equal, adaptation-focused, and multiplicative weighting schemes (Spearman's ρ > 0.83), whereas mitigation-focused weights yield substantially different orderings (ρ = 0.47). The CPPI correlates moderately with ND-GAIN (r = 0.40) and weakly negatively with CO₂ per capita (r = −0.28), indicating the framework captures distinct aspects of climate policy performance. The proposed methodology advances beyond existing indices by providing axiomatic foundations, transparent utility specifications, and comprehensive sensitivity analysis, offering a theoretically grounded tool for cross-national climate policy evaluation.
Keywords:
climate policy
; multi-attribute utility theory
; composite index
; climate change mitigation
; adaptation capacity
; governance
; sustainable development
; multi-criteria decision analysis
1. Introduction
The imperative to address climate change has positioned environmental policy at the forefront of the global governance agenda. Following the Paris Agreement of 2015, nations have committed to limiting the rise in global average temperature to well below 2°C above pre-industrial levels, with the aim of limiting warming to 1.5°C [1]. Achieving these targets requires coordinated action across multiple policy dimensions, encompassing greenhouse gas mitigation, adaptation to climate impacts, economic transformation, and institutional capacity building [2]. However, evaluating and comparing national climate policy performance presents substantial methodological challenges, as countries pursue diverse pathways shaped by their unique economic structures, resource endowments, and governance capabilities [3].
The multidimensional nature of climate policy defies simple ranking approaches. A country may demonstrate exceptional performance in renewable energy deployment while lagging in emissions reduction or exhibit strong governance frameworks without commensurate adaptation capacity. This complexity necessitates analytical frameworks that integrate heterogeneous criteria, accommodate trade-offs among competing objectives, and provide transparent, theoretically grounded comparisons [4]. Multi-Criteria Decision Analysis (MCDA) methods offer promising approaches to address these challenges, yet their application to cross-national climate policy evaluation remains underdeveloped [5].
This paper develops and applies a Multi-Attribute Utility Theory (MAUT) framework for evaluating national climate policy performance across 187 countries. Drawing on established decision-theoretic foundations [6,7] and leveraging publicly available data from the Global Carbon Project, ND-GAIN Index, and World Bank, the proposed Climate Policy Performance Index (CPPI) integrates four fundamental dimensions: mitigation effectiveness, adaptation capacity, economic readiness, and governance quality. The framework advances beyond existing indices by providing explicit utility functions, axiomatic foundations, and comprehensive sensitivity analysis.
Multi-Attribute Utility Theory emerged from the foundational work of von Neumann and Morgenstern [8] on expected utility and was systematically developed by Keeney and Raiffa [6] in their seminal treatise on decisions with multiple objectives. The theory provides a rigorous framework for constructing preference functions over alternatives characterised by multiple attributes, enabling decision-makers to quantify trade-offs and aggregate diverse criteria into coherent evaluations. Central to MAUT are axioms of preferential independence and utility independence, which permit decomposition of complex multiattribute utility functions into tractable additive or multiplicative forms [9].
Dyer [10] provides a comprehensive review of MAUT methodology, emphasising the distinction between value functions that measure the strength of preference under certainty and utility functions that capture risk attitudes under uncertainty. The additive utility model, U(x) = Σwᵢuᵢ(xᵢ), remains the most widely applied form, requiring mutual preferential independence among attributes—a condition that preferences over any subset of attributes are independent of fixed levels of remaining attributes [6]. When this condition holds, single-attribute utility functions can be assessed independently and aggregated through weighted summation, substantially simplifying practical application.
Applications of MAUT span diverse domains, including infrastructure planning [11], healthcare resource allocation [12], and environmental management [13]. Ananda and Herath [14] applied MAUT to evaluate public risk preferences in forest land-use choices, demonstrating the methodology's capacity to integrate stakeholder values with technical performance metrics. In the energy sector, MCDA approaches have been extensively employed for technology assessment [15], renewable energy planning [16], and sustainability evaluation [17]. However, the systematic application of MAUT to cross-national comparisons of climate policy remains notably absent from the literature.
Several indices currently assess national climate performance, each with distinct methodological approaches and coverage. The Climate Change Performance Index (CCPI), developed by Germanwatch, NewClimate Institute, and Climate Action Network, evaluates 63 countries and the European Union across four categories: greenhouse gas emissions (40%), renewable energy (20%), energy use (20%), and climate policy (20%) [18]. Published annually since 2005, the CCPI combines quantitative indicators from the International Energy Agency and UNFCCC with qualitative expert assessments of national climate policies. Notably, no country has achieved the highest performance category, with Denmark consistently ranking fourth (the highest occupied position) in recent editions [19].
The Notre Dame Global Adaptation Initiative (ND-GAIN) Country Index takes a complementary approach, measuring climate vulnerability and adaptation readiness across 185 countries [20]. Vulnerability assessment encompasses six life-supporting sectors—food, water, health, ecosystem services, human habitat, and infrastructure—while readiness captures the economic, governance, and social dimensions that enable investment in adaptation [21]. The ND-GAIN methodology employs 45 indicators aggregated through simple averaging, providing comprehensive coverage but lacking explicit preference modelling or trade-off analysis.
Additional frameworks include the Environmental Performance Index (EPI) from Yale and Columbia Universities, which tracks environmental health and ecosystem vitality across 180 countries [22], and the Low Carbon Economy Index from PwC, which focuses specifically on the decarbonization progress of G20 nations [23]. While these indices provide valuable comparative information, they share common methodological limitations: reliance on ad hoc weighting schemes without theoretical justification, absence of explicit utility or preference modelling, limited sensitivity analysis, and restricted country coverage (particularly the CCPI's focus on major emitters only).
Multi-criteria decision analysis has gained substantial traction in sustainability assessment, though applications predominantly focus on project or technology evaluation rather than cross-national comparison. Diaz-Balteiro et al. [24] review MCDA applications in renewable energy, identifying the Analytic Hierarchy Process (AHP) as the most frequently employed method, used in nearly 50% of studies that incorporate social criteria. Løken [25] surveys decision analysis approaches in energy planning, noting the growing use of outranking methods (ELECTRE, PROMETHEE) alongside value-based techniques for accommodating incommensurable criteria.
Recent applications demonstrate MCDA's utility for sustainability assessment at various scales. Wulf et al. [26] developed the HELDA software tool, implementing multiple MCDA methods for energy technology sustainability assessment, emphasising the need for transparent criteria weighting and sensitivity analysis. Jóhannesson et al. [27] combined systems dynamics modelling with MCDA and stakeholder engagement for Icelandic energy transition planning, illustrating the methodology's potential for integrating diverse sustainability themes. Shmelev and Rodríguez-Labajos [28] applied MCDA to evaluate sustainable development indicators across European cities, though without the explicit utility-theoretic foundations that characterise MAUT.
In the context of climate policy evaluation, Konidari and Mavrakis [29] proposed a multi-criteria framework for assessing climate change mitigation policy instruments, applying the AHP to weight environmental effectiveness, economic efficiency, and political feasibility. Roumasset and colleagues [30] developed a social welfare approach to climate adaptation investment prioritisation, incorporating economic efficiency alongside equity considerations. However, these applications typically address policy instrument selection within individual countries rather than systematic cross-national performance comparison.
Despite substantial progress in both MAUT methodology and climate performance assessment, a significant gap exists at their intersection. Existing climate indices lack the theoretical rigour of utility-based frameworks and rely on ad hoc weighting schemes without axiomatic justification or explicit preference modelling. Conversely, MAUT applications in sustainability remain confined to project-level analysis, with no systematic application to cross-national climate policy evaluation. Furthermore, the integration of adaptation capacity and governance quality with mitigation performance remains underdeveloped in existing frameworks.
This paper addresses these gaps through three principal contributions. First, we develop a comprehensive MAUT framework explicitly designed for climate policy evaluation, providing axiomatic foundations, specified utility functions, and transparent aggregation procedures. Second, we construct the Climate Policy Performance Index (CPPI) covering 187 countries—substantially expanding coverage beyond the 63-country CCPI—by leveraging open-source data from established repositories. Third, we conduct extensive sensitivity analysis across alternative weighting schemes, utility function specifications, and aggregation methods, demonstrating the robustness and limitations of the proposed framework.
2. Literature Review: From Stochastic Events to Structural Fiscal Risk
2.1. Data
This study integrates multiple open-access datasets to construct a comprehensive framework for evaluating national climate policies across mitigation and adaptation dimensions. The final sample comprises 187 countries with complete data for the core multi-attribute utility analysis, covering approximately 98% of global CO₂ emissions and 96% of the world population.
Emissions and climate data. Carbon dioxide and greenhouse gas emissions data were obtained from the Global Carbon Budget 2024 [31], accessed through the Our World in Data repository. This dataset provides internationally comparable emissions estimates based on territorial production, including CO₂ from fossil fuel combustion and cement production, methane (CH₄), and nitrous oxide (N₂O) emissions. The emissions data cover the period 1990–2023, with 2023 values used for the cross-sectional analysis.
Energy system indicators. Energy consumption and renewable energy deployment data were sourced from the Energy Institute Statistical Review of World Energy 2024, which is also available via Our World in Data. Key indicators include the share of renewable energy in total primary energy consumption, the degree of dependence on fossil fuels, and the carbon intensity of electricity generation. The most recent complete data are for 2022, covering 79 countries and providing comprehensive energy statistics.
Climate adaptation and vulnerability. The Notre Dame Global Adaptation Initiative (ND-GAIN) Country Index provides standardised measures of climate vulnerability and adaptation readiness for 192 countries from 1995 to 2023 [32]. The ND-GAIN framework integrates 45 indicators across six vulnerability sectors (food, water, health, ecosystem services, human habitat, and infrastructure) and three readiness dimensions (economic, governance, and social). We employ the release of the index for 2023.
Economic indicators. Gross domestic product (GDP) in current US dollars and population data were obtained from the World Bank’s World Development Indicators, with 2022 values used to calculate GDP per capita and to classify income groups according to World Bank thresholds.
Table 1 presents the key variables employed in the multi-attribute utility analysis, organized by evaluation dimension.
Table 2 presents descriptive statistics for the key variables included in the analysis. The sample exhibits substantial heterogeneity across all dimensions, reflecting the diverse economic development levels and climate policy approaches of the countries examined.
Per capita CO₂ emissions range from 0.06 tonnes in Burundi to 40.13 tonnes in Qatar, with a mean of 4.61 tonnes. The share of renewable energy ranges from near zero in several oil-exporting economies to 82% in Iceland. The ND-GAIN Index spans from 24.99 (Chad) to 76.79 (Norway), indicating substantial variation in climate adaptation capacity across countries.
Table 3 presents mean values by World Bank income classification, revealing systematic patterns in climate policy performance across development levels.
High-income countries exhibit significantly higher per capita emissions (7.64 t) but also demonstrate greater adaptation capacity (ND-GAIN = 58.57) and lower vulnerability (0.35). Conversely, low-income countries show minimal emissions (0.12 t per capita) but face the highest vulnerability scores (0.56), highlighting the climate justice dimension of the policy evaluation framework.
Regional analysis (Table 4) reveals that Europe has the highest average ND-GAIN score (60.83) and substantial renewable energy deployment (22.09%), whereas Sub-Saharan Africa exhibits the lowest adaptation capacity (38.17) despite minimal per capita emissions (0.87 t).
Table 5 presents the correlation matrix for key variables, informing the independence assumptions underlying the additive multi-attribute utility function.
The strong positive correlation between CO₂ per capita and GDP per capita (r = 0.73) reflects the emissions-development nexus, while the moderate negative correlation between CO₂ emissions and vulnerability (r = −0.45) indicates that higher-emitting countries generally possess greater adaptive capacity. The strong correlations among the ND-GAIN Index, readiness, and GDP per capita (r > 0.80) suggest that economic development remains a primary determinant of adaptation capacity, thereby motivating the inclusion of GDP-adjusted utility specifications in the sensitivity analysis.
Several limitations should be acknowledged. First, the renewable energy data coverage is limited to 79 countries, potentially introducing selection bias toward larger and more developed economies. Second, the use of territorial emissions does not account for consumption-based emissions embedded in international trade. Third, the ND-GAIN vulnerability assessments are based on exposure and sensitivity indicators that may not fully capture country-specific climate risks. Fourth, the cross-sectional design does not account for dynamic policy trajectories; future research should extend this framework to panel data analysis. Despite these limitations, the integrated dataset provides the most comprehensive openly available foundation for multi-criteria evaluation of national climate policies.
2.2. Theoretical Framework
This study employs Multi-Attribute Utility Theory (MAUT) to develop a comprehensive index for evaluating the performance of national climate policy. MAUT provides a rigorous axiomatic foundation for aggregating multiple, potentially conflicting criteria into a single measure of overall utility [6,33]. The approach is particularly suited for climate policy evaluation, where decision-makers must balance mitigation efforts, adaptation investments, economic costs, and social equity considerations.
The fundamental premise of MAUT is that an overall utility function U(x) can be decomposed into component utility functions for individual attributes, provided certain independence conditions are satisfied. For a decision alternative characterized by n attributes (x₁, x₂, …, xₙ), the overall utility is expressed as:
where uᵢ(xᵢ) represents the single-attribute utility function for attribute i, scaled to the [0, 1] interval.
2.2.1. Attribute Hierarchy
Following the structure of climate policy evaluation frameworks [2] we organize the assessment into a three-level hierarchy:
- Level 1: Overall Climate Policy Performance Index (CPPI)
- Level 2: Four evaluation dimensions - D₁: Mitigation performance - D₂: Adaptation capacity- D₃: Economic efficiency - D₄: Governance quality
- Level 3: Specific indicators (attributes)
Table 6 presents the complete attribute hierarchy with corresponding variables.
2.2.2. Single-Attribute Utility Functions
For each attribute, we specify a utility function uᵢ(xᵢ) that maps raw indicator values to the normalised utility scale [0, 1]. Following the multi-criteria decision analysis (MCDA) methodological approach [35], we employ both linear and nonlinear functional forms, depending on the attributes' characteristics.
2.2.3. Linear Utility Functions
For attributes exhibiting approximately constant marginal utility across the observed range, we apply linear normalisation:
For attributes where higher values are preferred (+ direction):
For attributes where lower values are preferred (− direction):
where and represent the minimum and maximum observed values across all countries in the sample.
2.2.4. Non-Linear Utility Functions
For certain attributes, theoretical considerations suggest diminishing marginal utility. Following the functional forms established in utility theory (Pratt, 1964), we specify exponential utility functions for emissions-related attributes:
where α > 0 is the risk aversion parameter controlling the degree of curvature. Higher values of α imply stronger diminishing marginal utility, reflecting the principle that initial emissions reductions yield greater utility gains than equivalent reductions at already low levels.
For the CO₂ per capita attribute, we calibrate α based on the assumption that reducing emissions from 10 to 5 tonnes per capita yields approximately 1.5 times the utility gain of reducing from 5 to 0 tonnes. This yields α ≈ 0.15.
2.2.5. Logarithmic Transformation for GDP
For GDP per capita, we apply a logarithmic transformation prior to linear scaling, consistent with the established relationship between income and well-being [35]:
This specification implies that proportional increases in income yield constant utility gains, regardless of the initial income level.
2.2.6. Aggregation Model
Under the assumption of mutual preferential independence among attributes [6], we employ the additive aggregation model:
where:
and: - U(x) is the overall Climate Policy Performance Index for country x - wⱼ is the weight assigned to dimension j (∑wⱼ = 1) - Dⱼ(x) is the dimension-level score - wⱼᵢ is the weight of attribute i within dimension j (∑wⱼᵢ = 1 for each j) - uⱼᵢ(xⱼᵢ) is the utility value for attribute i of dimension j
The additive form assumes that trade-offs between dimensions are constant across all performance levels—i.e., a unit improvement in mitigation has the same value regardless of adaptation performance. We test this assumption through sensitivity analysis with a multiplicative specification.
2.2.7. Weight Elicitation
Determining appropriate weights is a critical challenge in multi-criteria evaluation. We employ three complementary approaches to ensure robustness:
As a baseline specification, we assign equal weights across all dimensions and attributes:
Equal weighting provides a transparent benchmark and avoids imposing subjective value judgments on the relative importance of climate policy dimensions.
Based on the structure of the Paris Agreement and UNFCCC framework, which emphasises both mitigation and adaptation while recognising common but differentiated responsibilities, we specify policy-aligned weights:

Table 7.
Policy-aligned weight specification
| Dimension | Weight | Rationale |
|---|---|---|
| D₁ Mitigation | 0.35 | Primary objective of Paris Agreement |
| D₂ Adaptation | 0.30 | Growing emphasis in Global Stocktake |
| D₃ Economic | 0.15 | Enabling condition for climate action |
| D₄ Governance | 0.20 | Implementation capacity |
2.2.8. Analytic Hierarchy Process (AHP)
For the robustness analysis, we derive weights using the Analytic Hierarchy Process [36]. AHP structures weight elicitation as a series of pairwise comparisons, with consistency checks to ensure a coherent preference ordering.
The pairwise comparison matrix A for the four dimensions is constructed based on expert judgment regarding relative importance:
Weights are obtained as the normalised principal eigenvector of A, with consistency verified through the consistency ratio (CR < 0.10).
2.2.9. Handling Missing Data
Given the incomplete coverage of certain indicators (particularly renewable energy share), we implement the following approach:
- Core analysis: Conducted on the subset of 79 countries with complete data across all attributes.
- Extended analysis: For countries with missing renewable energy data, we estimate dimension scores using available attributes and adjust weights proportionally:where denotes the set of observed attributes for dimension 1.
- Imputation sensitivity: We conduct a sensitivity analysis using multiple imputation based on regional averages and income-group patterns.
2.2.10. Sensitivity and Robustness Analysis
To assess the stability of country rankings, we conduct a comprehensive sensitivity analysis:
We systematically vary dimension weights within ±50% of baseline values and compute the rank correlation (Spearman’s ρ) between baseline and perturbed rankings:
where dᵢ is the difference in ranks for country i.
We compare results across three utility function specifications: - Linear normalization (baseline) - Exponential (risk-averse) specification - Power function: with γ ∈ {0.5, 1, 2}
4.7.3. Multiplicative aggregation
As an alternative to the additive model, we test a multiplicative specification that penalises unbalanced performance:
This formulation implies that zero performance on any dimension yields zero overall utility, reflecting a non-compensatory perspective on climate policy evaluation.
2.2.11. Comparison with Existing Indices
To validate the proposed index, we compare country rankings with established climate performance measures:
- Climate Change Performance Index (CCPI): Produced by Germanwatch, NewClimate Institute, and Climate Action Network, covering 63 countries.
- ND-GAIN Index: The adaptation-focused index that serves as input to our framework.
- Environmental Performance Index (EPI): Yale University’s biennial assessment of environmental health and ecosystem vitality.
We compute rank correlations and identify systematic differences to assess the value-added of the MAUT-based approach.
All analyses were conducted using Python 3.11 with the following packages: pandas (data manipulation), NumPy (numerical computation), SciPy (optimisation and statistical tests), and Matplotlib and seaborn (visualisation). The complete analytical code and data are available in the supplementary materials to ensure reproducibility.
3. Results
5.1. Overview of CPPI Scores
The Climate Policy Performance Index (CPPI) was calculated for 187 countries using the policy-aligned weighting scheme (w₁ = 0.35, w₂ = 0.30, w₃ = 0.15, w₄ = 0.20). The index ranges from 0 to 100, with higher values indicating better climate policy performance across the dimensions of mitigation, adaptation, economic capacity, and governance. Detailed calculation procedures and worked examples are provided in Appendix B.
Table 8 presents the descriptive statistics for the CPPI and its component dimension scores. The mean CPPI of 55.86 (SD = 8.03) indicates moderate overall performance, with substantial cross-national variation ranging from 33.67 (Turkmenistan) to 78.46 (Norway). Among the four dimensions, mitigation (D1) exhibits the highest mean (0.757) but also the greatest variability (SD = 0.248), reflecting the wide dispersion of per capita emissions across countries. Governance (D4) shows the lowest mean (0.373), indicating that institutional quality represents a binding constraint for many nations.
Figure 1 displays the distribution of CPPI scores across the sample. The distribution is approximately normal with slight negative skewness (−0.24), indicating a modest concentration of countries in the upper-middle performance range. The median (56.62) exceeds the mean (55.86), consistent with the negative skew. The interquartile range spans from 50.82 to 61.23, with most countries clustered within one standard deviation of the mean.
5.2. Country Rankings
Table 9 presents the top 15 countries ranked by CPPI under policy-aligned weights. Norway leads the global ranking with a CPPI of 78.46, followed by Sweden (74.02), Denmark (73.59), and Iceland (73.38). The complete rankings for all 187 countries are provided in Appendix B. Nordic countries dominate the top positions, collectively achieving the highest scores through balanced excellence across all four dimensions rather than exceptional performance in any single area.
Figure 2 visualises the CPPI scores for the top 20 countries, highlighting the performance gap between the leading Nordic nations and remaining top performers. Norway's score exceeds the 20th-ranked country (Costa Rica, 65.89) by more than 12 points, indicating substantial differentiation even within the top decile.
The dimension-level analysis reveals diverse pathways to high aggregate performance. Figure 3 presents the dimension scores for the top 10 countries, illustrating distinct performance profiles. Norway achieves the highest overall score through balanced excellence, with particularly strong economic capacity (D3 = 0.958) and governance (D4 = 0.897). In contrast, Uruguay (rank 8) and Georgia (rank 6) achieve top-10 positions primarily through exceptional mitigation performance (D1 > 0.92), compensating for moderate governance scores.
Table 10 presents the 20 lowest-ranked countries. Turkmenistan ranks last (CPPI = 33.67), followed by Trinidad and Tobago (34.38), Qatar (36.88), and Bangladesh (37.35). The lowest performers fall into two distinct categories. First, fossil fuel-dependent economies (Qatar, Kuwait, Trinidad and Tobago, Bahrain) exhibit near-zero mitigation scores due to extremely high per capita emissions (exceeding 20 tonnes CO₂), despite strong economic indicators. Second, countries facing governance deficits (Turkmenistan, Venezuela, Bangladesh) perform poorly across multiple dimensions, reflecting systemic institutional weaknesses.
5.3. Regional Analysis
Figure 4 displays the distribution of CPPI scores across eight world regions. Table 11 provides the corresponding summary statistics. Europe leads with the highest mean CPPI (59.92, SD = 7.72), driven primarily by strong governance (D4 = 0.601) and adaptation capacity (D2 = 0.547). The regional breakdown by country is provided in Appendix B.
Sub-Saharan Africa achieves the third-highest regional mean (56.56) despite having the lowest economic (D3 = 0.315) and governance (D4 = 0.222) scores. This counterintuitive result reflects exceptionally high mitigation performance (D1 = 0.971), attributable to low per capita emissions rather than deliberate climate policy. The Middle East and North Africa (MENA) region ranks lowest (CPPI = 49.12), primarily due to weak mitigation performance (D1 = 0.538) in fossil fuel-exporting economies. Regional leaders are: Europe—Norway (78.46); East Asia & Pacific—New Zealand (67.48); Sub-Saharan Africa—Mauritius (67.67); Latin America & Caribbean—Uruguay (70.26); South Asia—Bhutan (66.32); North America—Canada (60.91); MENA—Tunisia (63.01).
5.4. Income Group Analysis
The relationship between national income and climate performance is examined through two complementary analyses. Figure 5 presents a scatter plot of CPPI against per capita CO₂ emissions, with countries coloured by region. The weak negative correlation (r = −0.275) indicates that the multidimensional CPPI framework partially decouples climate performance from emissions intensity, as strong governance and adaptation capacity can compensate for moderate emissions levels.
Figure 6 compares CPPI performance across World Bank income classifications. Panel A shows the distribution of overall scores, while Panel B presents mean dimension scores by income group.
The relationship between income and CPPI is non-monotonic: high-income countries achieve the highest mean CPPI (57.09) through strong adaptation, economic, and governance capacity, but face lower mitigation scores due to higher emissions. Lower-middle-income countries achieve comparable aggregate performance (56.05) through near-perfect mitigation scores (D1 = 0.988) that compensate for weaker institutional dimensions.
5.5. Dimension Profiles and Performance Archetypes
Figure 7 presents radar plots depicting the dimension profiles for the top five countries, enabling visual comparison of performance configurations. The analysis reveals three distinct archetypes among high-performing nations.
(1) Balanced performers (Norway, Denmark, Finland): These countries achieve high scores across all four dimensions, reflecting comprehensive climate policy frameworks supported by strong institutions and economic resources. Norway exemplifies this archetype with no dimension score below 0.65.
(2) Mitigation leaders (Uruguay, Costa Rica): These countries achieve exceptional mitigation performance (D1 > 0.90) through low emissions and high renewable energy penetration, compensating for moderate governance and economic capacity scores.
(3) Governance-economy leaders (Singapore): Despite moderate mitigation scores (D1 = 0.393), Singapore achieves a top-20 ranking through exceptional governance (D4 = 0.926) and economic capacity (D3 = 0.955), demonstrating an alternative pathway to climate policy effectiveness.
5.6. Sensitivity Analysis
To assess the sensitivity of rankings to weighting assumptions, the CPPI was recalculated under four alternative schemes: equal weights, mitigation-focused, adaptation-focused, and multiplicative aggregation. Table 12 presents the weight specifications and resulting CPPI statistics. Detailed sensitivity results are provided in Appendix B.
Figure 8 displays the Spearman rank correlation matrix between weighting schemes. Rankings demonstrate moderate to high stability across most specifications. The policy-aligned scheme correlates strongly with equal weights (ρ = 0.838), adaptation-focused (ρ = 0.961), and multiplicative aggregation (ρ = 0.874). However, the mitigation-focused scheme exhibits notably weaker correlations with other approaches (ρ = 0.467 vs. equal weights), indicating that extreme emphasis on emissions reduction produces substantially different country orderings.
Figure 9 examines the relationship between CPPI and the ND-GAIN Climate Adaptation Index. The moderate positive correlation (r = 0.398, p < 0.001) indicates that CPPI captures related but distinct aspects of climate policy performance. Countries positioned above the regression line (e.g., Uruguay, Costa Rica) achieve higher CPPI rankings than their ND-GAIN scores would predict, primarily through strong mitigation performance. Conversely, countries below the line (e.g., Singapore, Australia) exhibit greater adaptation readiness relative to their overall CPPI rankings.
Table 13 presents the correlations between CPPI and key input indicators. The weak negative correlation with CO₂ per capita (r = −0.275) reflects the balancing effect of the multidimensional framework, whereby high emissions can be partially offset by strong performance in adaptation and governance dimensions. The moderate positive correlation with GDP per capita (r = 0.178) indicates that economic resources facilitate, but do not guarantee, strong climate performance.
Table 14 presents the CPPI rankings for EU-27 member states. The Nordic countries (Sweden, Denmark, Finland) dominate the EU ranking, achieving top-10 global positions. Central and Eastern European members generally rank lower, reflecting ongoing transitions in energy systems and governance structures. The EU-27 mean CPPI is 58.12 (SD = 6.94), significantly above the global average of 55.86 (independent-samples t-test: t = 2.18, p = 0.031), indicating the region's relative leadership in climate policy performance. The within-EU coefficient of variation (11.9%) indicates moderate heterogeneity despite common policy frameworks.
In summary, the CPPI results reveal substantial heterogeneity in national climate policy performance across 187 countries. Nordic nations consistently lead through balanced excellence across all dimensions, while alternative high-performance pathways exist through mitigation leadership or strong governance-economy profiles. The sensitivity analysis confirms that rankings are reasonably robust across weighting schemes, with the notable exception of mitigation-focused weights, which yield substantially different orderings. These findings provide an empirical foundation for the policy discussion that follows.
4. Discussion
4.1. Summary of Key Findings
This study developed and applied a Multi-Attribute Utility Theory framework to evaluate the performance of national climate policies across 187 countries. The resulting Climate Policy Performance Index (CPPI) integrates four dimensions—mitigation, adaptation, economic capacity, and governance—providing a theoretically grounded alternative to existing ad hoc indices. Several key findings emerge from the analysis.
First, Norway emerges as the global leader (CPPI = 78.46), followed by Sweden, Denmark, and Iceland. These Nordic countries achieve high scores by balancing excellence across four dimensions: moderate-to-low emissions, strong deployment of renewable energy, robust adaptation capacity, and high-quality governance institutions. This finding contrasts with indices that focus solely on emissions, in which low-income countries with minimal industrial activity often rank highest despite limited institutional capacity for sustained climate action.
Second, the analysis reveals distinct performance archetypes among high-ranking countries. Norway and Denmark exemplify the 'balanced performer' archetype with consistently high scores across dimensions. Uruguay represents the 'mitigation leader' pathway, achieving exceptional D1 scores (0.945) through low emissions and high renewable penetration, compensating for moderate governance capacity. Singapore illustrates an alternative 'governance-economy' pathway, where world-class institutions (D4 = 0.926) and economic readiness (D3 = 0.955) offset weaker mitigation performance (D1 = 0.393). These diverse pathways underscore that climate policy success admits multiple configurations, challenging one-size-fits-all policy prescriptions.
Third, the bottom of the ranking reveals two distinct failure modes. Fossil-fuel-dependent economies (Qatar, Kuwait, Trinidad and Tobago) exhibit near-zero mitigation scores despite strong economic indicators, whereas countries facing governance deficits (Turkmenistan, Venezuela) perform poorly across multiple dimensions. This bifurcation suggests that remedial strategies must be tailored to specific national circumstances—emissions reduction for petrostates versus institutional strengthening for governance-challenged countries.
4.2. Comparison with Existing Climate Indices
The CPPI both converges with and diverges from established indices in instructive ways. Compared with the Climate Change Performance Index (CCPI), our framework identifies the Nordic countries as leaders but yields notably different rankings for several country groups. The CCPI's exclusive focus on major emitters (63 countries) excludes many small island states and low-income countries that perform well under CPPI's broader coverage. Moreover, the CCPI deliberately leaves its top three positions vacant to signal that no country meets the Paris Agreement targets—a normative stance that our utility-theoretic approach does not impose.
The moderate correlation between CPPI and ND-GAIN (r = 0.398) indicates these indices capture related but distinct constructs. ND-GAIN emphasises vulnerability and adaptation readiness without explicit mitigation assessment, while CPPI integrates both dimensions. Countries with high ND-GAIN scores but moderate CPPI rankings (e.g., Singapore, Australia) typically exhibit strong adaptation capacity, but this capacity is undermined by high emissions. Conversely, low-emission developing countries (Rwanda, Bhutan) achieve higher CPPI rankings than their ND-GAIN positions would suggest, reflecting the credit CPPI assigns to mitigation performance.
A critical methodological distinction concerns the transparency of weighting. Existing indices typically employ fixed, expert-determined weights without systematic sensitivity analysis. The CPPI framework explicitly models weight uncertainty through four alternative schemes (equal, policy-aligned, mitigation-focused, adaptation-focused) and multiplicative aggregation. The high rank correlations among most schemes (ρ > 0.83) provide reassurance that rankings are reasonably robust, while the lower correlation with mitigation-focused weights (ρ = 0.47 vs. equal) reveals the substantive impact of normative choices regarding dimension priority.
4.3. Regional Patterns and the Development-Climate Nexus
The regional analysis reveals a nuanced relationship between development status and climate performance. Europe leads with the highest mean CPPI (59.92), driven primarily by strong governance and adaptation capacity rather than emissions performance alone. Sub-Saharan Africa achieves the third-highest regional mean (56.56) through exceptional mitigation scores (D1 = 0.971) that compensate for weaker institutional dimensions—a pattern reflecting low per capita emissions rather than deliberate climate policy success. This finding cautions against interpreting high mitigation scores in low-income contexts as policy achievements; they often reflect development deficits rather than climate leadership.
The Middle East and North Africa region ranks lowest (CPPI = 49.12), primarily due to weak mitigation performance in fossil fuel-exporting economies. This regional pattern aligns with broader research on the relationship between resource dependence and climate policy ambition. The 'resource curse' literature suggests that hydrocarbon wealth creates structural barriers to decarbonization through vested interests, Dutch disease effects, and reduced incentives for economic diversification [37]. Our findings provide empirical support for this hypothesis at the national level.
The non-monotonic relationship between income and CPPI merits particular attention. High-income countries achieve the highest mean score (57.09) but exhibit substantial internal variation, with Qatar and Kuwait among the lowest performers globally. Lower-middle-income countries achieve comparable aggregate performance (56.05) through fundamentally different dimension profiles. This finding challenges simplistic narratives that frame climate action as a luxury of wealthy nations; institutional quality and policy commitment appear at least as important as economic resources in determining climate performance.
4.4. European Union Performance and Policy Coherence
The EU-27 analysis reveals considerable internal heterogeneity despite common policy frameworks. Nordic members (Sweden, Denmark, Finland) occupy top-10 positions globally, whereas Central and Eastern European members cluster in the middle ranks. This variation persists despite uniform exposure to EU climate directives, suggesting that supranational policy frameworks interact with national institutional capacity to produce divergent outcomes. Recent research on EU decarbonization pathways confirms this heterogeneity, identifying distinct national trajectories shaped by energy system path dependencies and governance effectiveness [38].
The EU-27 mean CPPI of 58.12 significantly exceeds the global average (55.86), confirming the region's relative climate leadership. However, the within-EU standard deviation (6.94) indicates that this aggregate performance masks substantial variation across member states. Bulgaria and Hungary score below 51, while Nordic leaders exceed 71—a 20-point gap within a nominally integrated policy space. This dispersion has implications for EU climate governance, suggesting that uniform targets may impose disproportionate burdens on lower-capacity members while leaving higher-capacity members insufficiently challenged.
The dimension-level analysis reveals that EU performance advantages are concentrated in governance (D4) and adaptation (D2), rather than in mitigation (D1). Several EU member states exhibit moderate mitigation scores despite strong institutional frameworks, reflecting continued reliance on fossil fuels in their national energy mixes. Research on EU energy transitions indicates that policy discourse often outpaces actual decarbonization progress, with rhetorical commitments exceeding observed emission reductions [39]. The CPPI results corroborate this discourse-action gap, identifying countries where strong governance has not yet translated into proportionate emissions performance.
4.5. Policy Implications
The CPPI framework yields several policy-relevant insights. First, the identification of multiple high-performance pathways suggests that effective climate policy need not follow a single template. Countries with limited governance capacity but favourable renewable resources (e.g., Uruguay, Costa Rica) can achieve strong aggregate performance through mitigation excellence, whereas governance-strong countries can leverage institutional quality to offset historical emissions burdens. This finding supports differentiated national strategies within common global targets.
Second, the sensitivity analysis reveals that weight selection substantively affects country rankings, particularly for nations with unbalanced dimension profiles. Policymakers should recognise that index rankings reflect implicit value judgments about the relative importance of mitigation versus adaptation, current performance versus institutional capacity. The CPPI framework makes these trade-offs explicit, enabling informed interpretation rather than treating rankings as objective facts.
Third, the contribution of the governance dimension to aggregate performance underscores the importance of institutional quality for climate outcomes. Countries cannot purchase climate performance through wealth alone; effective governance translates resources into policy implementation. This finding aligns with research demonstrating that governance quality mediates the relationship between economic capacity and development outcomes [40]. Climate policy interventions should therefore attend to institutional strengthening alongside technical measures.
Fourth, the framework's global coverage (187 countries) enables assessment of nations excluded from major-emitter-focused indices. Small island developing states, low-income African nations, and post-Soviet states are systematically evaluated, revealing both unexpected leaders (Barbados, Georgia, Armenia) and underperformers (Turkmenistan) that escape scrutiny in narrower indices. This expanded coverage supports more equitable global climate governance by including all parties to international agreements.
4.6. Limitations
Several limitations warrant acknowledgement. First, the framework relies exclusively on publicly available data, constraining indicator selection to variables with broad country coverage. Important climate policy dimensions—including policy implementation quality, climate finance flows, and technological innovation capacity—lack consistent cross-national measurement and therefore remain unrepresented. The renewable energy indicator, available for only 77 countries with complete data, particularly limits the comprehensiveness of the mitigation dimension.
Second, the additive utility model assumes preferential independence among dimensions—a strong assumption that may not hold empirically. Countries achieving high scores through compensation (high mitigation offsetting weak governance) may represent fundamentally different policy configurations than balanced performers. The multiplicative aggregation variant partially addresses this concern by penalising unbalanced profiles, but more sophisticated interaction modelling could capture dimension complementarities more accurately.
Third, the weight elicitation procedures remain normatively contested. While we present four alternative schemes and conduct extensive sensitivity analysis, the 'correct' weights ultimately depend on value judgments about climate policy priorities. Stakeholder-based weight elicitation through Analytic Hierarchy Process or swing weighting could enhance legitimacy but would introduce additional complexity and potential inconsistency.
Fourth, the cross-sectional design captures a single temporal snapshot, precluding assessment of performance trajectories or policy effectiveness over time. Countries undertaking ambitious but recent reforms may score poorly on current indicators despite promising trends. A longitudinal extension of the CPPI framework could address this limitation, although data availability constraints may require the use of shorter time series for some indicators.
Fifth, consumption-based emissions accounting—which allocates emissions to final consumers rather than territorial producers—might yield substantially different mitigation rankings for trade-intensive economies. Countries that have outsourced emissions-intensive production while maintaining high consumption levels may appear stronger under territorial accounting than their true climate footprint warrants. Data limitations preclude consumption-based analysis at present, though this remains an important direction for methodological refinement.
5. Conclusions
This paper developed a Multi-Attribute Utility Theory framework for evaluating national climate policy performance and applied it to construct the Climate Policy Performance Index covering 187 countries. The CPPI integrates four dimensions—mitigation, adaptation, economic capacity, and governance—using explicit utility functions and transparent aggregation procedures grounded in established decision theory. Key findings include: (1) Nordic countries lead global rankings through balanced excellence across dimensions; (2) multiple high-performance pathways exist, with countries achieving strong aggregate scores through different dimension configurations; (3) the development-climate relationship is non-monotonic, with institutional quality mediating economic resources' translation into climate outcomes; and (4) rankings demonstrate reasonable robustness across alternative weighting schemes, though mitigation-focused weights produce substantially different orderings.
The principal methodological contribution is demonstrating that formal utility theory can be productively applied to cross-national climate policy evaluation, thereby providing axiomatic foundations missing from existing indices. By making weighting choices explicit and conducting systematic sensitivity analysis, the framework enables transparent interpretation of rankings as value-laden constructions rather than objective facts. The expanded country coverage (187 versus 63 in CCPI) includes nations previously excluded from major assessments, thereby supporting more equitable global climate governance.
Several directions merit future research. A longitudinal extension would enable trajectory analysis, distinguishing improving from deteriorating performers. Consumption-based emissions accounting could address the limitations of territorial accounting in trade-intensive economies. Stakeholder-based weight elicitation would enhance normative legitimacy. Finally, integration with scenario modelling could support forward-looking assessments of policy pathways consistent with the Paris Agreement targets. The CPPI framework provides a foundation for these extensions, contributing to the broader agenda of evidence-based global climate governance.
Author Contributions
Conceptualization O.P., O.L., K.P., K.J., Z.P. O.D., Y.V. and N.K.; methodology O.P., O.L., K.P., K.J., Z.P. O.D., Y.V. and N.K.; software O.P., O.L., K.P., K.J., Z.P. O.D., Y.V. and N.K.; validation O.P., O.L., K.P., K.J., Z.P. O.D., Y.V. and N.K.; formal analysis O.P., O.L., K.P., K.J., Z.P. O.D., Y.V. and N.K.; investigation TO.P., O.L., K.P., K.J., Z.P. O.D., Y.V. and N.K.; resources O.P., O.L., K.P., K.J., Z.P. O.D., Y.V. and N.K.; data curation O.L., K.P., O.P.; writing—original draft preparation O.P., O.L., K.P., K.J., Z.P. O.D., Y.V. and N.K.; writing—review and editing O.L., K.P., O.P.; visualization K.J., Z.P. O.D., Y.V. and N.K.; supervision O.L., K.P., O.P.; project administration O.L., K.P.; funding acquisition O.P., K.J., Z.P., Y.V. and N.K. All authors have read and agreed to the published version of the manuscript.
Funding
This work was supported by a subsidy from the Ministry of Education and Science for the AGH University of Kraków.
Data Availability Statement
The data used in this study are publicly available from the following sources: (1) Global Carbon Project (GCP) territorial CO₂ emissions data are available at https://globalcarbonproject.org/carbonbudget/ (accessed on 15 October 2025); (2) ND-GAIN Country Index data on climate vulnerability and readiness are available at https://gain.nd.edu/our-work/country-index/download-data/ (accessed on 15 October 2025); (3) World Bank Development Indicators on GDP per capita and population are available at https://databank.worldbank.org/source/world-development-indicators (accessed on 15 October 2025); (4) Energy Institute Statistical Review of World Energy data on renewable energy shares are available at https://www.energyinst.org/statistical-review (accessed on 15 October 2025). The compiled dataset and calculation spreadsheet supporting the findings of this study are available from the corresponding author upon reasonable request.
Future Research
Building on these findings, future research should explore integrated modelling approaches that link economic losses with climate exposure, vulnerability indicators, and socioeconomic trajectories. There is also scoped to analyse the effectiveness of existing EU adaptation funding mechanisms and to simulate the fiscal impact of alternative policy scenarios, including climate insurance, pooled risk funds, and climate-resilient debt instruments. Lastly, more work is needed to align macroeconomic planning with climate risk projections, including how loss trajectories interact with fiscal rules and budgetary stability mechanisms at both national and supranational levels.
Appendix A. Mathematical Foundations
A.1 Axiomatic Basis of Multi-Attribute Utility Theory
Axiom 1 (Completeness). For any two alternatives x and y, either x ≽ y, y ≽ x, or both (indifference).
Axiom 2 (Transitivity). If x ≽ y and y ≽ z, then x ≽ z.
Axiom 3 (Continuity). If x ≻ y ≻ z, there exists a probability p ∈ (0,1) such that y ~ px + (1-p)z.
Axiom 4 (Independence). If x ≽ y, then for any z and any p ∈ (0,1): px + (1-p)z ≽ py + (1-p)z.
Under these axioms, there exists a utility function U: X → ℝ such that x ≽ y if and only if U(x) ≥ U(y).
A.2 Preferential Independence Conditions
For the additive decomposition of multi-attribute utility, we require mutual preferential independence.
Definition A.1 (Preferential Independence). Attribute set Y is preferentially independent of attribute set Z if preferences over outcomes that differ only in Y do not depend on the levels of attributes in Z.
Definition A.2 (Mutual Preferential Independence). Attributes {X₁, X₂, …, Xₙ} are mutually preferentially independent if every subset Y is preferentially independent of its complement.
Theorem A.1. If attributes {X₁, X₂, …, Xₙ} are mutually preferentially independent and n ≥ 3, then the utility function has the additive form:
where and each is scaled such that and for worst () and best () levels.
Proof. See [6], Theorem 5.1.
A.3 Single-Attribute Utility Function Specifications
A.3.1 Linear Utility Function
For an attribute with range , the linear utility function is:
Properties: - - - (constant marginal utility)
For attributes where lower values are preferred (e.g., CO₂ emissions):
A.3.2 Exponential Utility Function
The exponential utility function captures risk aversion and diminishing marginal utility:
where α > 0 is the risk aversion coefficient.
Derivation. Starting from the constant absolute risk aversion (CARA) assumption:
This differential equation has the general solution:
Applying boundary conditions and :
Properties: - , - (monotonically increasing) - (strictly concave)
Parameter calibration. The risk aversion parameter α is calibrated using the midpoint certainty equivalent. Let . If the decision-maker’s certainty equivalent for a 50-50 lottery between and is , then:
Solving for α:
For CO₂ per capita with range [0, 40] t/capita, assuming t/capita (i.e., the decision-maker values emission reduction more at higher levels), numerical solution yields α ≈ 0.08.
A.3.3 Inverse Exponential for “Lower Is Better” Attributes
For attributes where lower values are preferred (emissions, vulnerability):
This ensures: - (best outcome) - (worst outcome) - Diminishing marginal gains from further reduction at low levels
A.3.4 Logarithmic Utility Function
For GDP per capita, the logarithmic specification reflects Bernoulli’s hypothesis of diminishing marginal utility of wealth:
Properties: - Coefficient of relative risk aversion: (constant) - Equal proportional income increases yield equal utility gains - (decreasing in x)
A.4 Aggregation Functions
A.4.1 Additive Aggregation
The additive multi-attribute utility function:
subject to:
Expanded form for our four-dimension model:
where:
A.4.2 Multiplicative Aggregation
When mutual utility independence holds but additive independence does not, the multiplicative form applies:
where K is a scaling constant satisfying:
Special cases: - If : K = 0, reduces to additive form - If : K < 0, substitutes (subadditive) - If : K > 0, complements (superadditive)
For computational convenience, when K ≠ 0, we can express:
A.4.3 Weighted Geometric Mean
An alternative multiplicative specification using the weighted geometric mean:
where .
Properties: - Non-compensatory: zero on any dimension yields zero overall - Bounded: if all - Penalises imbalance: for fixed sum , maximum when all equal
A.5 Weight Derivation via Analytic Hierarchy Process
A.5.1 Pairwise Comparison Matrix
For m dimensions, construct the m × m pairwise comparison matrix A:
where represents the relative importance of dimension j compared to dimension k, using Saaty’s 1-9 scale.
Properties of A: - (diagonal elements) - (reciprocity) - (consistency, holds for perfectly consistent judgments)
A.5.2 Weight Calculation
Weights are computed as the normalized principal eigenvector of A:
where is the largest eigenvalue.
Normalised weights: , where is the principal eigenvector.
Approximation method (geometric mean): .
A.5.3 Consistency Verification
The Consistency Index (CI):
The Consistency Ratio (CR):
where RI is the Random Index (average CI for random matrices):
| m | 1 | 2 | 3 | 4 | 5 | 6 | 7 | 8 |
| RI | 0 | 0 | 0.58 | 0.90 | 1.12 | 1.24 | 1.32 | 1.41 |
Decision rule: CR < 0.10 indicates acceptable consistency.
A.6 Sensitivity Analysis Framework
A.6.1 Weight Perturbation
Let be the baseline weights. Perturbed weights:
For single-dimension sensitivity, vary while proportionally adjusting others:
A.6.2 Rank Stability Measure
For N countries, let and denote baseline and perturbed ranks for country i.
Spearman’s rank correlation:
Kendall’s tau:
A.6.3 Critical Weight Ranges
For each dimension j, compute the range such that the top-k ranking remains unchanged:
A.7 Time-Dependent Utility Extension
For dynamic analysis of climate policy trajectories, we extend the static model to incorporate temporal discounting.
A.7.1 Discounted Utility Framework
Let denote the utility of outcome occurring at time t:
where is the discount function with and .
Exponential discounting:
where ρ > 0 is the constant discount rate.
Hyperbolic discounting:
where κ > 0 governs the degree of present bias.
A.7.2 Intertemporal Utility Aggregation
For a policy trajectory :
Discrete approximation:
This extension enables comparison of policy trajectories rather than single-period snapshots, addressing the dynamic nature of climate policy evaluation.
Appendix B
B1. Data Processing and Variable Construction
B1.1 Raw Data Sources
The analysis draws on four primary data sources:
1. Global Carbon Project (2024): Territorial CO₂ emissions from fossil fuels and land use change. Downloaded from https://robbieandrew.github.io/GCB2024/ .
2. Energy Institute Statistical Review (2024): Energy consumption by source and renewable energy shares. Accessed via Our World in Data.
3. ND-GAIN Country Index (2024): Climate vulnerability and readiness indicators for 192 countries, 1995–2023. Downloaded from https://gain.nd.edu.
4. World Bank Development Indicators: GDP per capita (current USD) and population for 2022.
B1.2 Sample Construction
Initial sample: 218 countries with CO₂ data (2023). After merging ND-GAIN: 187 countries. After merging GDP data: 161 countries. Complete energy data: 77 countries.
Table B1.
Variable definitions and data sources.
| Variable | Definition | Source | Direction |
| co2_per_capita | CO₂ emissions per person (tonnes) | GCP 2024 | Lower better |
| renewables_share | Renewable energy % of primary energy | Energy Inst. | Higher better |
| vulnerability | ND-GAIN vulnerability score | ND-GAIN | Lower better |
| readiness | ND-GAIN readiness score | ND-GAIN | Higher better |
| gdp_per_capita | GDP per capita (USD) | World Bank | Higher better |
B2. Utility Function Calculations
B2.1 Attribute Ranges
Table B2.
Observed ranges for utility function normalization
| Attribute | Minimum | Maximum | Unit |
| CO₂ per capita | 0.056 | 40.128 | tonnes |
| Renewables share | 0.000 | 100.000 | percent |
| Vulnerability | 0.251 | 0.640 | index |
| Readiness | 0.116 | 0.804 | index |
| GDP per capita | 670.38 | 128,152.77 | USD |
B2.2 Utility Function Formulas
Linear utility (positive direction):
Linear utility (negative direction):
Exponential utility (α = 0.08):
Logarithmic utility:
S2.3 Sample Calculation: Norway
Input values: CO₂ per capita = 7.043 t;
Renewables share = 66.74%;
Vulnerability = 0.307;
Readiness = 0.804;
Adaptive capacity = 0.811;
GDP per capita = $82,655.24
Step 1 - Single-attribute utilities:
u(CO₂) = (40.128 - 7.043) / 40.072 = 0.826;
u(Renewables) = 66.74 / 100 = 0.667;
u(Vulnerability) = (0.640 - 0.307) / 0.389 = 0.856;
u(Readiness) = 1.000;
u(GDP) = [ln(82655) - ln(670)] / [ln(128153) - ln(670)] = 0.917
Step 2 - Dimension scores:
D1 = 0.5 × 0.826 + 0.5 × 0.667 = 0.747; D2 = 0.33 × 0.856 + 0.33 × 1.000 + 0.34 × 0.932 = 0.929;
D3 = 0.959;
D4 = 0.902
Step 3 - CPPI (Policy weights):
CPPI = 100 × (0.35 × D1 + 0.30 × D2 + 0.15 × D3 + 0.20 × D4) = 78.46
B3. Summary Statistics
Table B3.
Utility value statistics (N = 187)
| Utility | Mean | SD | Min | Max |
| u(CO₂) linear | 0.894 | 0.139 | 0.000 | 0.999 |
| u(CO₂) exponential | 0.972 | 0.085 | 0.040 | 1.000 |
| u(Vulnerability) | 0.533 | 0.238 | 0.000 | 1.000 |
| u(Readiness) | 0.411 | 0.222 | 0.000 | 1.000 |
| u(GDP) log | 0.518 | 0.233 | 0.000 | 1.000 |
B4. Sensitivity Analysis Details
Table B4.
CPPI statistics under alternative weighting schemes
| Scheme | w(D1) | w(D2) | w(D3) | w(D4) | Mean | SD |
| Equal | 0.25 | 0.25 | 0.25 | 0.25 | 53.12 | 9.03 |
| Policy | 0.35 | 0.30 | 0.15 | 0.20 | 55.86 | 8.03 |
| Mitigation | 0.50 | 0.25 | 0.10 | 0.15 | 60.11 | 10.35 |
| Adaptation | 0.25 | 0.50 | 0.10 | 0.15 | 53.61 | 6.95 |
Table B5.
Spearman rank correlations
| Equal | Policy | Mitigation | Adaptation | |
| Equal | 1.000 | 0.838 | 0.467 | 0.922 |
| Policy | 0.838 | 1.000 | 0.835 | 0.961 |
| Mitigation | 0.467 | 0.835 | 1.000 | 0.699 |
| Adaptation | 0.922 | 0.961 | 0.699 | 1.000 |
B5. Regional Summary
Table B6.
Regional CPPI statistics
| Region | N | CPPI Mean | CPPI SD | D1 | D2 | D3 | D4 |
| Europe | 39 | 59.92 | 7.72 | 0.598 | 0.547 | 0.694 | 0.601 |
| Other | 27 | 57.24 | 11.19 | 0.829 | 0.475 | 0.612 | 0.379 |
| Sub-Saharan Africa | 48 | 56.56 | 4.81 | 0.971 | 0.439 | 0.315 | 0.222 |
| East Asia & Pacific | 19 | 55.62 | 7.01 | 0.636 | 0.507 | 0.637 | 0.448 |
| Latin America | 24 | 54.67 | 7.97 | 0.817 | 0.456 | 0.460 | 0.267 |
| North America | 3 | 53.75 | 8.99 | 0.451 | 0.536 | 0.705 | 0.564 |
| South Asia | 8 | 51.04 | 10.26 | 0.750 | 0.421 | 0.374 | 0.300 |
| MENA | 19 | 49.12 | 7.36 | 0.538 | 0.485 | 0.604 | 0.333 |
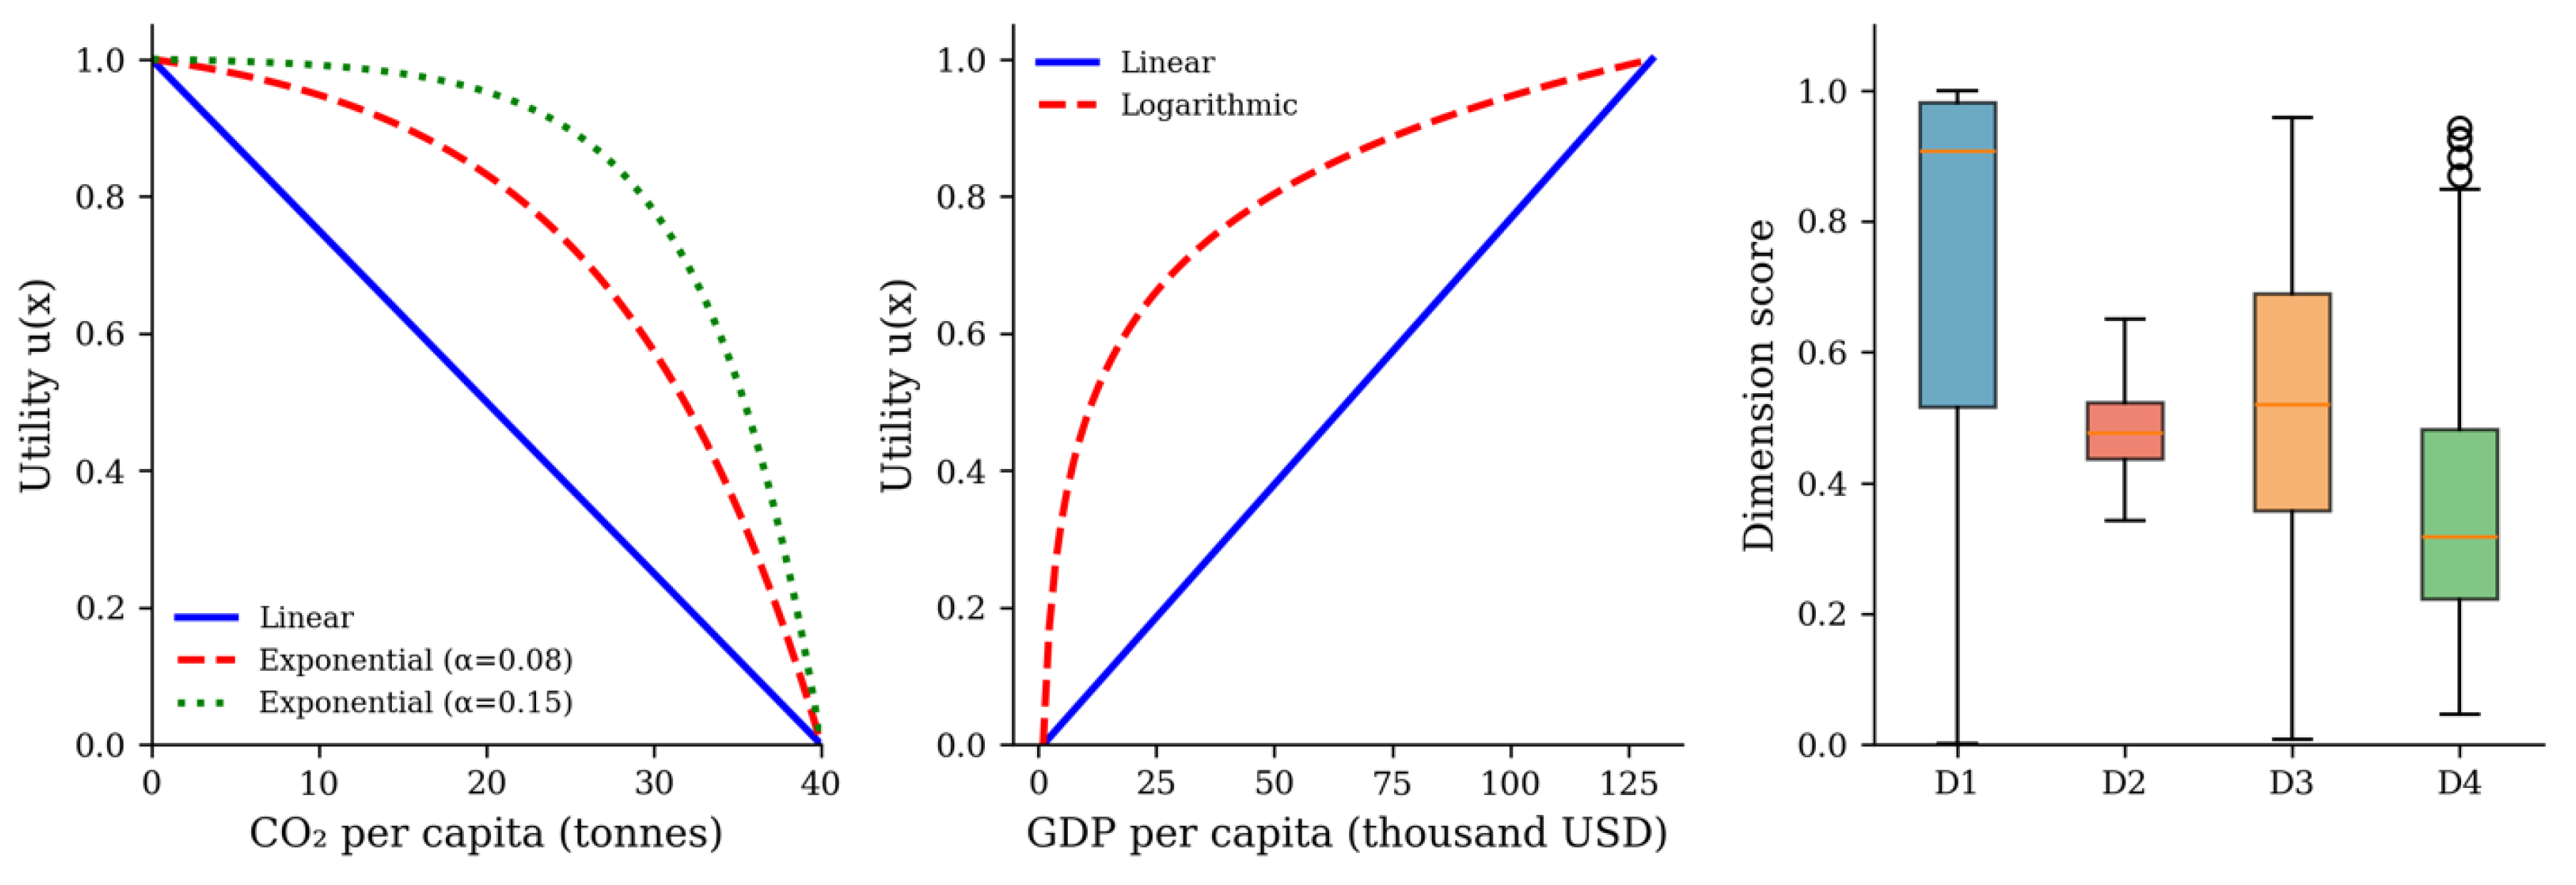
Figure B1.
Utility function specifications. (A) Linear vs. exponential utility for CO₂ per capita. (B) Linear vs. logarithmic utility for GDP per capita. (C) Distribution of dimension scores across all countries.
Figure B1.
Utility function specifications. (A) Linear vs. exponential utility for CO₂ per capita. (B) Linear vs. logarithmic utility for GDP per capita. (C) Distribution of dimension scores across all countries.
References
- UNFCCC. (2015). Paris Agreement. United Nations Framework Convention on Climate Change. https://unfccc.int/sites/default/files/english_paris_agreement.pdf.
- IPCC. (2023). Climate Change 2023: Synthesis Report. Contribution of Working Groups I, II and III to the Sixth Assessment Report. IPCC, Geneva. [CrossRef]
- Fankhauser, S., & Jotzo, F. (2018). Economic growth and development with low-carbon energy. WIREs Climate Change, 9(1), e495. [CrossRef]
- Greco, S., Ehrgott, M., & Figueira, J. R. (Eds.). (2016). Multiple Criteria Decision Analysis: State of the Art Surveys (2nd ed.). Springer. [CrossRef]
- Wang, J.-J., Jing, Y.-Y., Zhang, C.-F., & Zhao, J.-H. (2009). Review on multi-criteria decision analysis aid in sustainable energy decision-making. Renewable and Sustainable Energy Reviews, 13(9), 2263–2278. [CrossRef]
- Keeney, R. L., & Raiffa, H. (1993). Decisions with Multiple Objectives: Preferences and Value Trade-offs. Cambridge University Press. (Original work published 1976).
- Fishburn, P. C. (1970). Utility Theory for Decision Making. Wiley.
- von Neumann, J., & Morgenstern, O. (1947). Theory of Games and Economic Behavior (2nd ed.). Princeton University Press.
- Dyer, J. S., & Sarin, R. K. (1979). Measurable multiattribute value functions. Operations Research, 27(4), 810–822. [CrossRef]
- Dyer, J. S. (2016). Multiattribute Utility Theory (MAUT). In S. Greco, M. Ehrgott, & J. Figueira (Eds.), Multiple Criteria Decision Analysis (pp. 285–314). Springer. [CrossRef]
- Cohon, J. L. (2004). Multiobjective Programming and Planning. Dover Publications.
- Dolan, J. G. (2010). Multi-criteria clinical decision support. The Patient: Patient-Centered Outcomes Research, 3(4), 229–248. [CrossRef]
- Huang, I. B., Keisler, J., & Linkov, I. (2011). Multi-criteria decision analysis in environmental sciences: Ten years of applications and trends. Science of the Total Environment, 409(19), 3578–3594. [CrossRef]
- Ananda, J., & Herath, G. (2005). Evaluating public risk preferences in forest land-use choices using multi-attribute utility theory. Ecological Economics, 55(3), 408–419. [CrossRef]
- Pohekar, S. D., & Ramachandran, M. (2004). Application of multi-criteria decision making to sustainable energy planning—A review. Renewable and Sustainable Energy Reviews, 8(4), 365–381. [CrossRef]
- Diaz-Balteiro, L., González-Pachón, J., & Romero, C. (2017). Measuring systems sustainability with multi-criteria methods: A critical review. European Journal of Operational Research, 258(2), 607–616. [CrossRef]
- Cinelli, M., Coles, S. R., & Kirwan, K. (2014). Analysis of the potentials of multi criteria decision analysis methods to conduct sustainability assessment. Ecological Indicators, 46, 138–148. [CrossRef]
- Burck, J., Uhlich, T., Bals, C., Höhne, N., & Nascimento, L. (2024). Climate Change Performance Index 2025. Germanwatch, NewClimate Institute, and Climate Action Network. https://ccpi.org/.
- NewClimate Institute. (2025). Climate Change Performance Index 2026. https://newclimate.org/resources/publications/climate-change-performance-index-2026.
- Chen, C., Noble, I., Hellmann, J., Coffee, J., Murillo, M., & Chawla, N. (2015). University of Notre Dame Global Adaptation Index: Country Index Technical Report. ND-GAIN. https://gain.nd.edu/our-work/country-index/methodology/.
- Notre Dame Global Adaptation Initiative. (2024). ND-GAIN Country Index. University of Notre Dame. https://gain.nd.edu/.
- Wolf, M. J., Emerson, J. W., Esty, D. C., de Sherbinin, A., & Wendling, Z. A. (2022). 2022 Environmental Performance Index. Yale Center for Environmental Law & Policy. https://epi.yale.edu/.
- PwC. (2023). Net Zero Economy Index 2023. PricewaterhouseCoopers. https://www.pwc.co.uk/services/sustainability-climate-change/insights/net-zero-economy-index.html.
- Diaz-Balteiro, L., Alfranca, O., González-Pachón, J., & Romero, C. (2016). Multi-criteria decision analysis for renewable energies: Research trends, gaps and the challenge of improving participation. Sustainability, 13(6), 3515. [CrossRef]
- Løken, E. (2007). Use of multicriteria decision analysis methods for energy planning problems. Renewable and Sustainable Energy Reviews, 11(7), 1584–1595. [CrossRef]
- Wulf, C., Mesa Estrada, L. S., Haase, M., Tippe, M., Wigger, H., & Brand-Daniels, U. (2025). MCDA for the sustainability assessment of energy technologies and systems: Identifying challenges and opportunities. Energy, Sustainability and Society, 15(1), 45. [CrossRef]
- Jóhannesson, S. E., Davíðsdóttir, B., & Heinonen, J. (2024). Integrated energy systems modeling with multi-criteria decision analysis and stakeholder engagement for identifying a sustainable energy transition. Energies, 17(17), 4266. [CrossRef]
- Shmelev, S. E., & Rodríguez-Labajos, B. (2009). Dynamic multidimensional assessment of sustainability at the macro level: The case of Austria. Ecological Economics, 68(10), 2560–2573. [CrossRef]
- Konidari, P., & Mavrakis, D. (2007). A multi-criteria evaluation method for climate change mitigation policy instruments. Energy Policy, 35(12), 6235–6257. [CrossRef]
- Roumasset, J., Wada, C. A., & Kuo, N. (2016). Chapter 11 - Optimal climate-change adaptation: A social welfare approach. In M. Ruth (Ed.), Handbook on the Economics of Climate Change (pp. 274–302). Edward Elgar.
- Friedlingstein, P., O’Sullivan, M., Jones, M. W., Andrew, R. M., et al. (2024). Global Carbon Budget 2024. Earth System Science Data, 16, 5225–5350. [CrossRef]
- Chen, C., Noble, I., Hellmann, J., Coffee, J., Murillo, M., & Chawla, N. (2015). University of Notre Dame Global Adaptation Index: Country Index Technical Report. University of Notre Dame. https://gain.nd.edu/our-work/country-index/.
- Dyer, J. S. (2005). MAUT—Multiattribute Utility Theory. In J. Figueira, S. Greco, & M. Ehrgott (Eds.), Multiple Criteria Decision Analysis: State of the Art Surveys (pp. 265–292). Springer.
- Belton, V., & Stewart, T. J. (2002). Multiple Criteria Decision Analysis: An Integrated Approach. Springer.
- Stevenson, B., & Wolfers, J. (2008). Economic Growth and Subjective Well-Being: Reassessing the Easterlin Paradox. Brookings Papers on Economic Activity, 2008(1), 1–87. https://www.brookings.edu/wp-content/uploads/2008/03/2008a_bpea_stevenson.pdf.
- Saaty, T. L. (1980). The Analytic Hierarchy Process. McGraw-Hill.
- Ross, M. L. (2015). What have we learned about the resource curse? Annual Review of Political Science, 18, 239–259. [CrossRef]
- Sala, D., Liashenko, O., Pyzalski, M., Pavlov, K., Pavlova, O., Durczak, K., & Chornyi, R. (2025). The energy footprint in the EU: How CO₂ emission reductions drive sustainable development. Energies, 18(12), 3110. [CrossRef]
- Pavlova, O., Liashenko, O., Pavlov, K., Rutkowski, M., Kornatka, A., Vlasenko, T., & Halei, M. (2025). Discourse vs. Decarbonisation: Tracking the alignment between EU climate rhetoric and national energy patterns. Energies, 18(19), 5304. [CrossRef]
- Liashenko, O., Mykhailovska, O., Shestakovska, T., & Selyutin, S. (2024). Effectiveness of governance vs social development: A multivariate approach to countries' classification. Administratie si Management Public, 42, 6–24. [CrossRef]
Figure 1.
Distribution of Climate Policy Performance Index scores across 187 countries. Dashed line indicates mean (55.86); dotted line indicates median (56.62).
Figure 1.
Distribution of Climate Policy Performance Index scores across 187 countries. Dashed line indicates mean (55.86); dotted line indicates median (56.62).
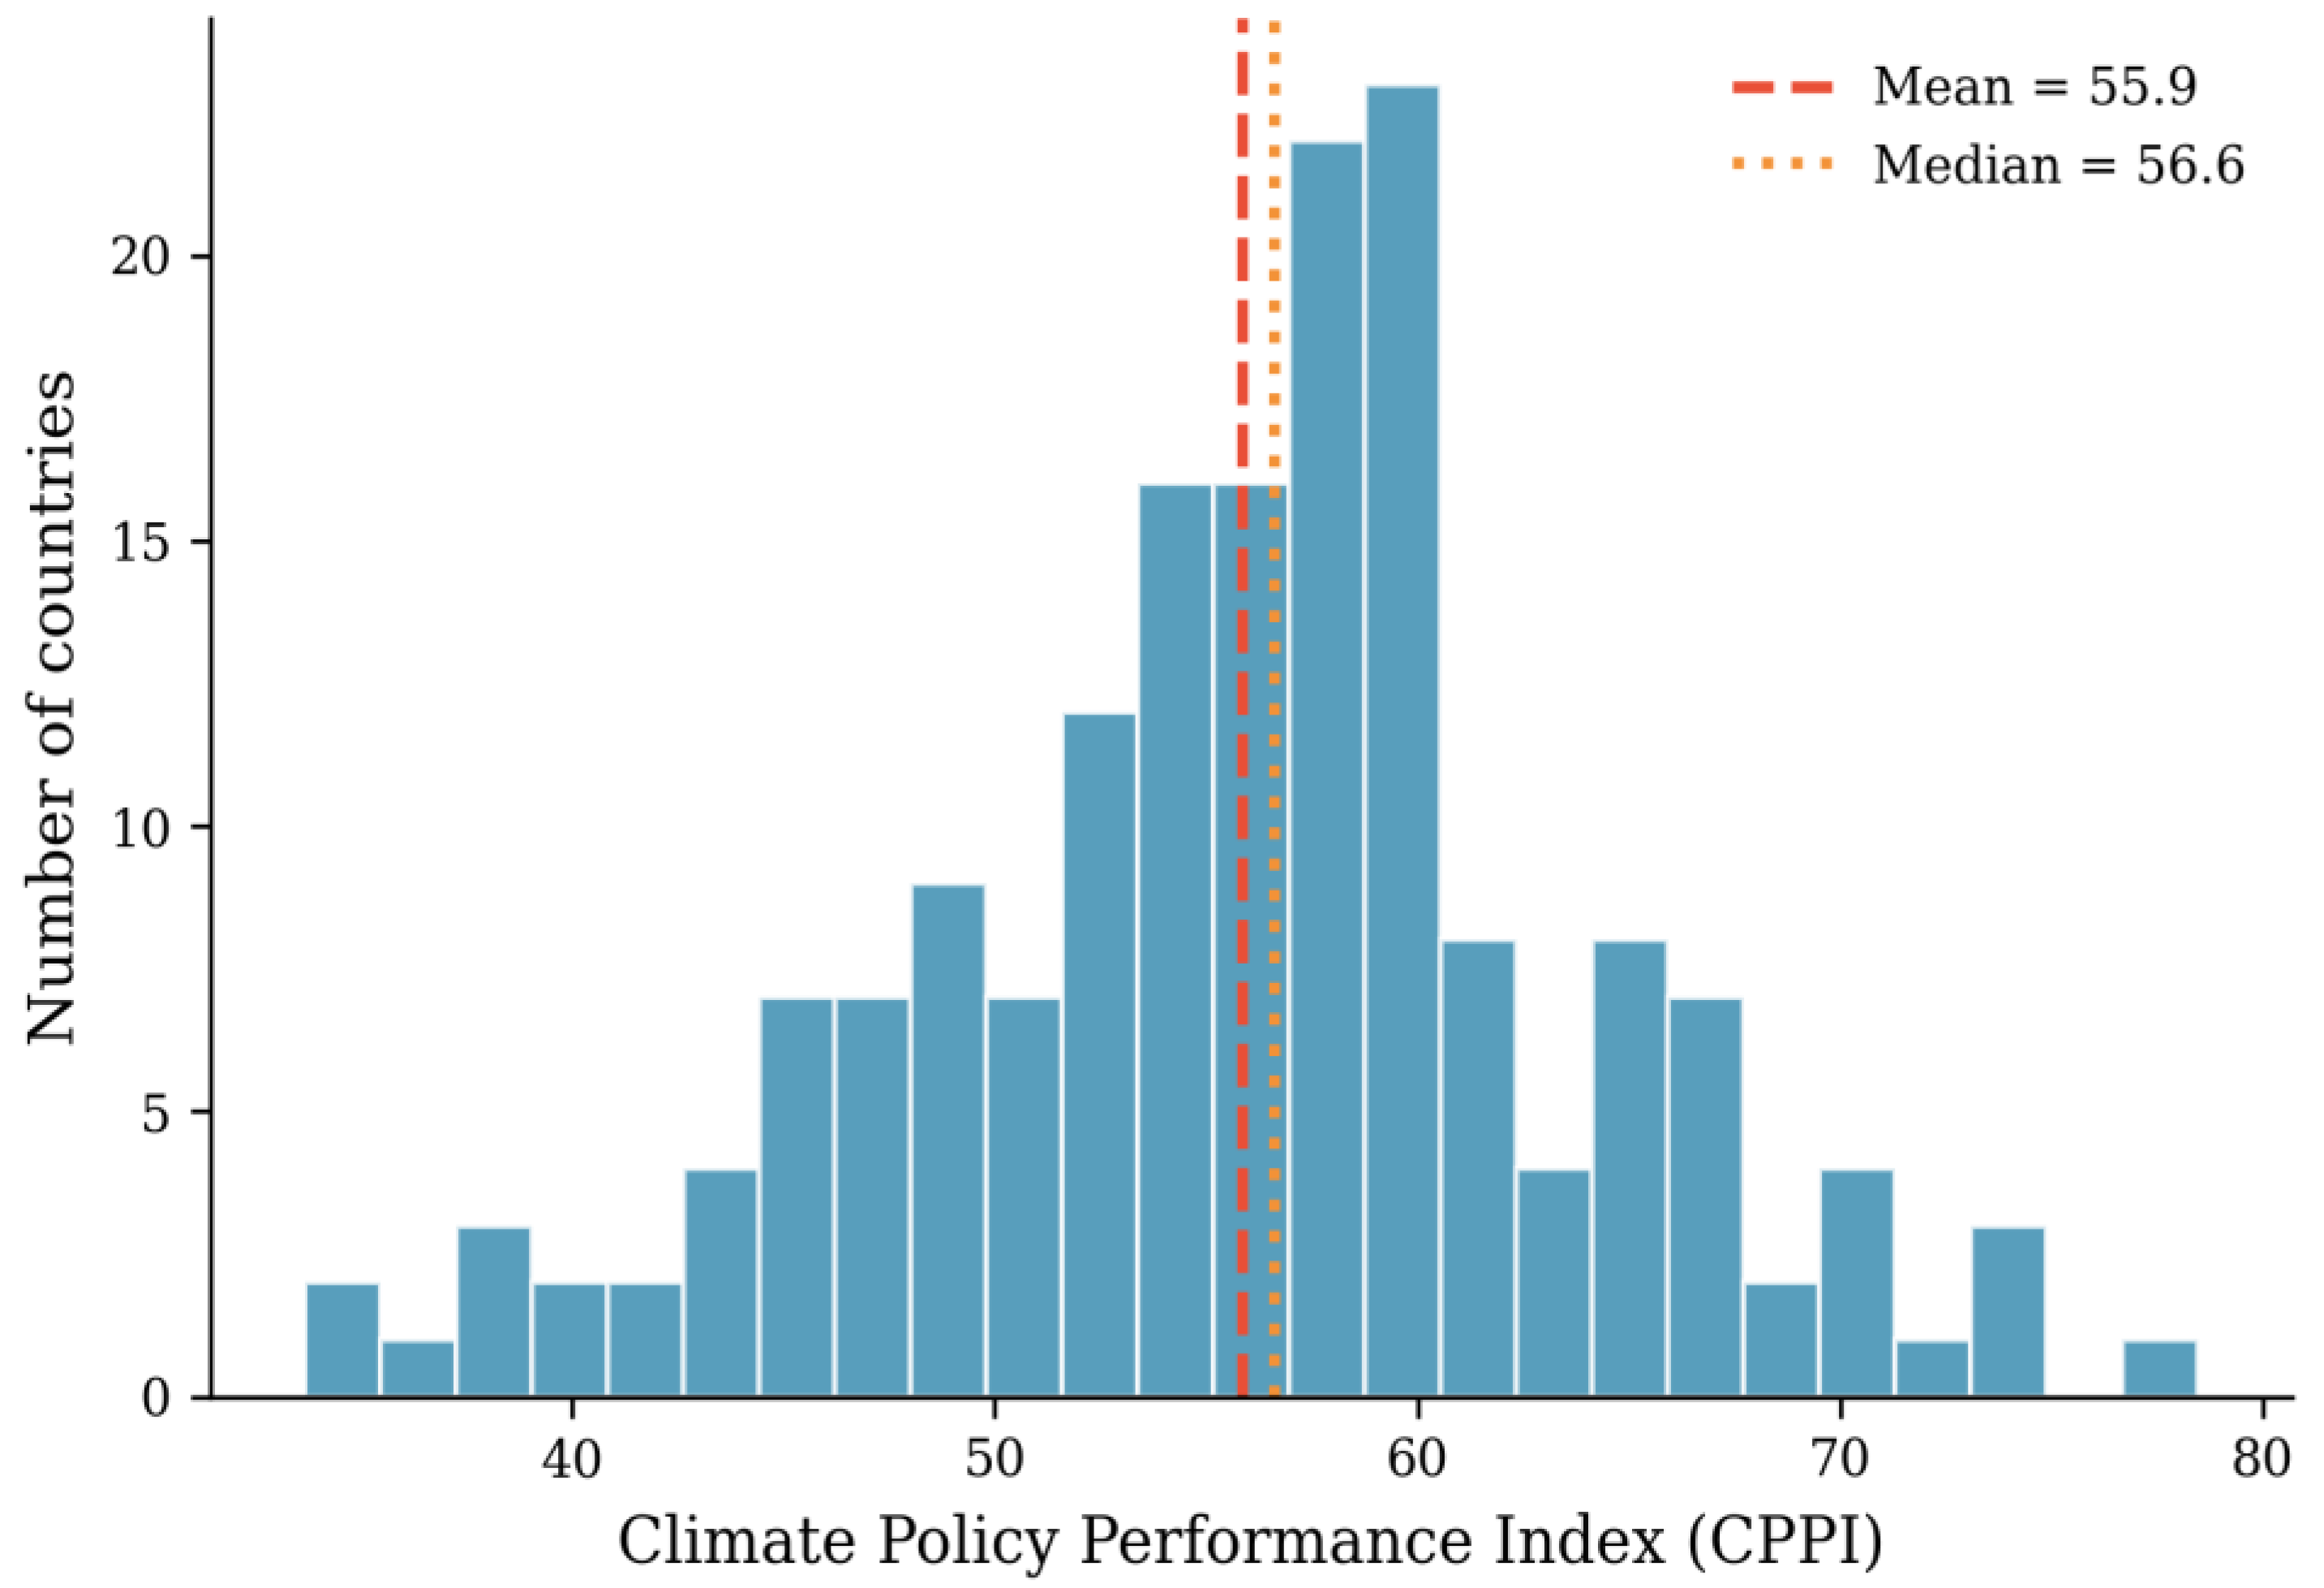
Figure 2.
Top 20 countries ranked by Climate Policy Performance Index (policy-aligned weights).
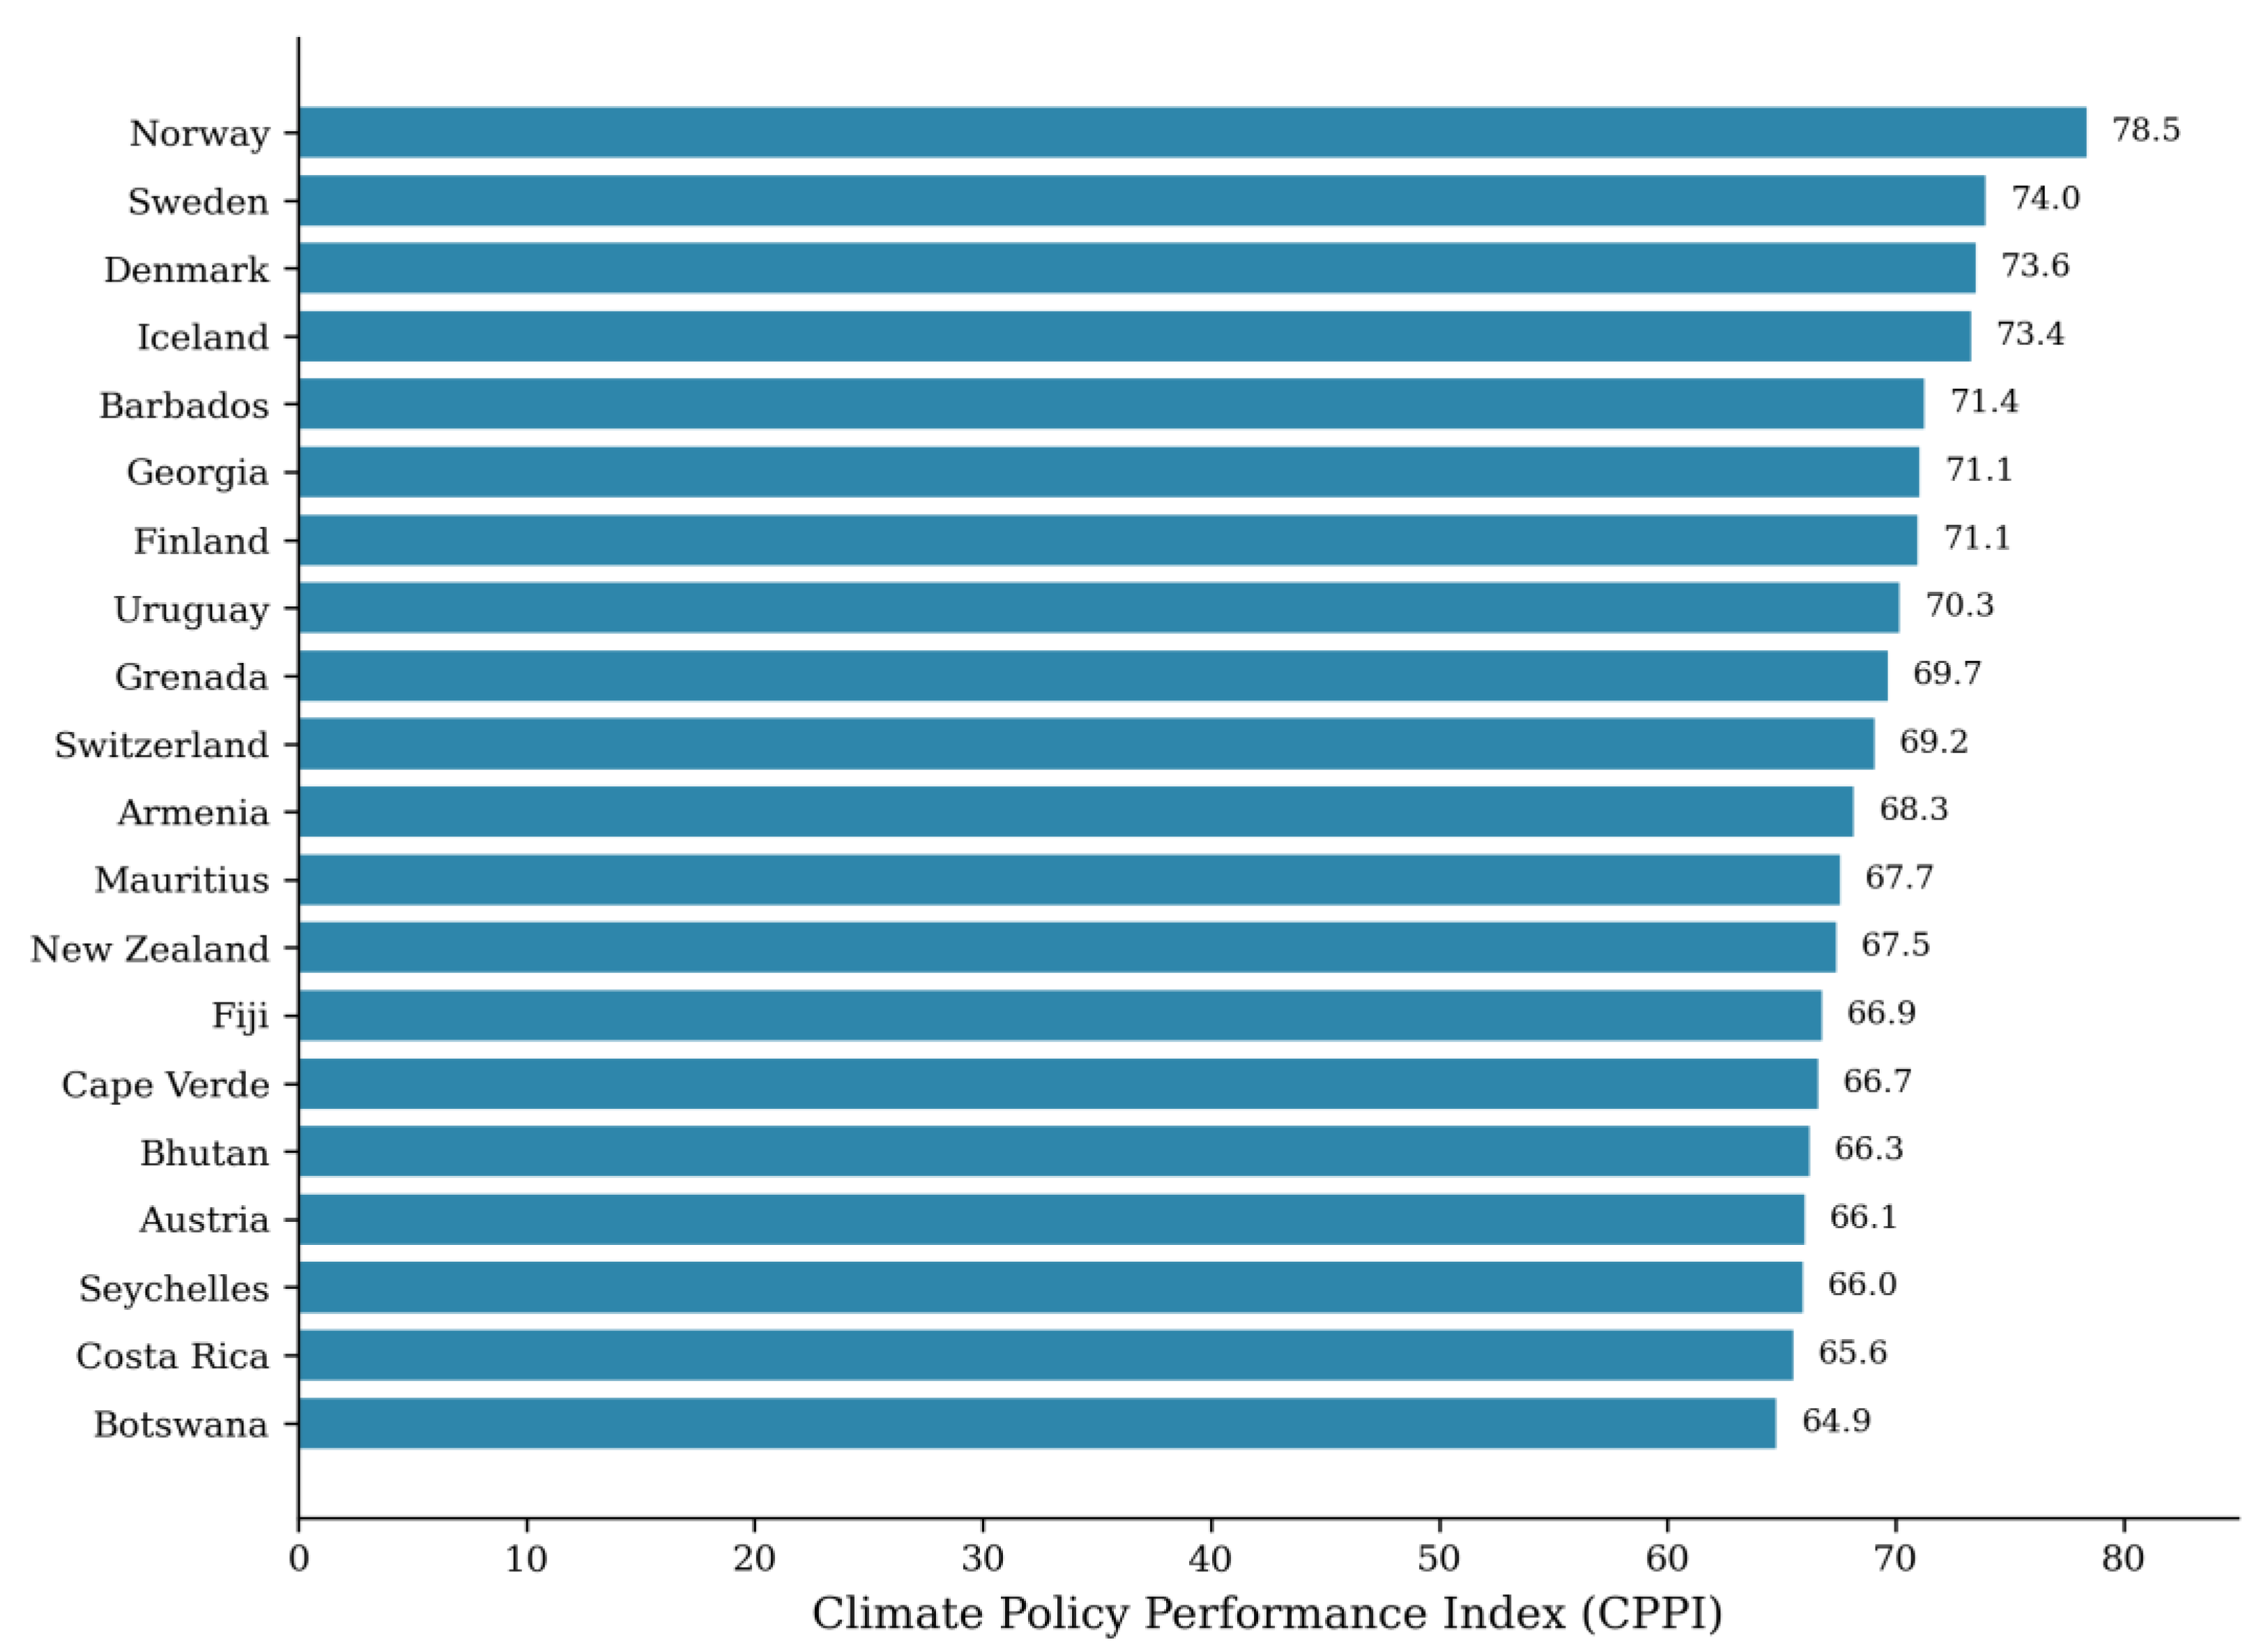
Figure 3.
Dimension scores for top 10 countries. D1 = Mitigation; D2 = Adaptation; D3 = Economic; D4 = Governance.
Figure 3.
Dimension scores for top 10 countries. D1 = Mitigation; D2 = Adaptation; D3 = Economic; D4 = Governance.
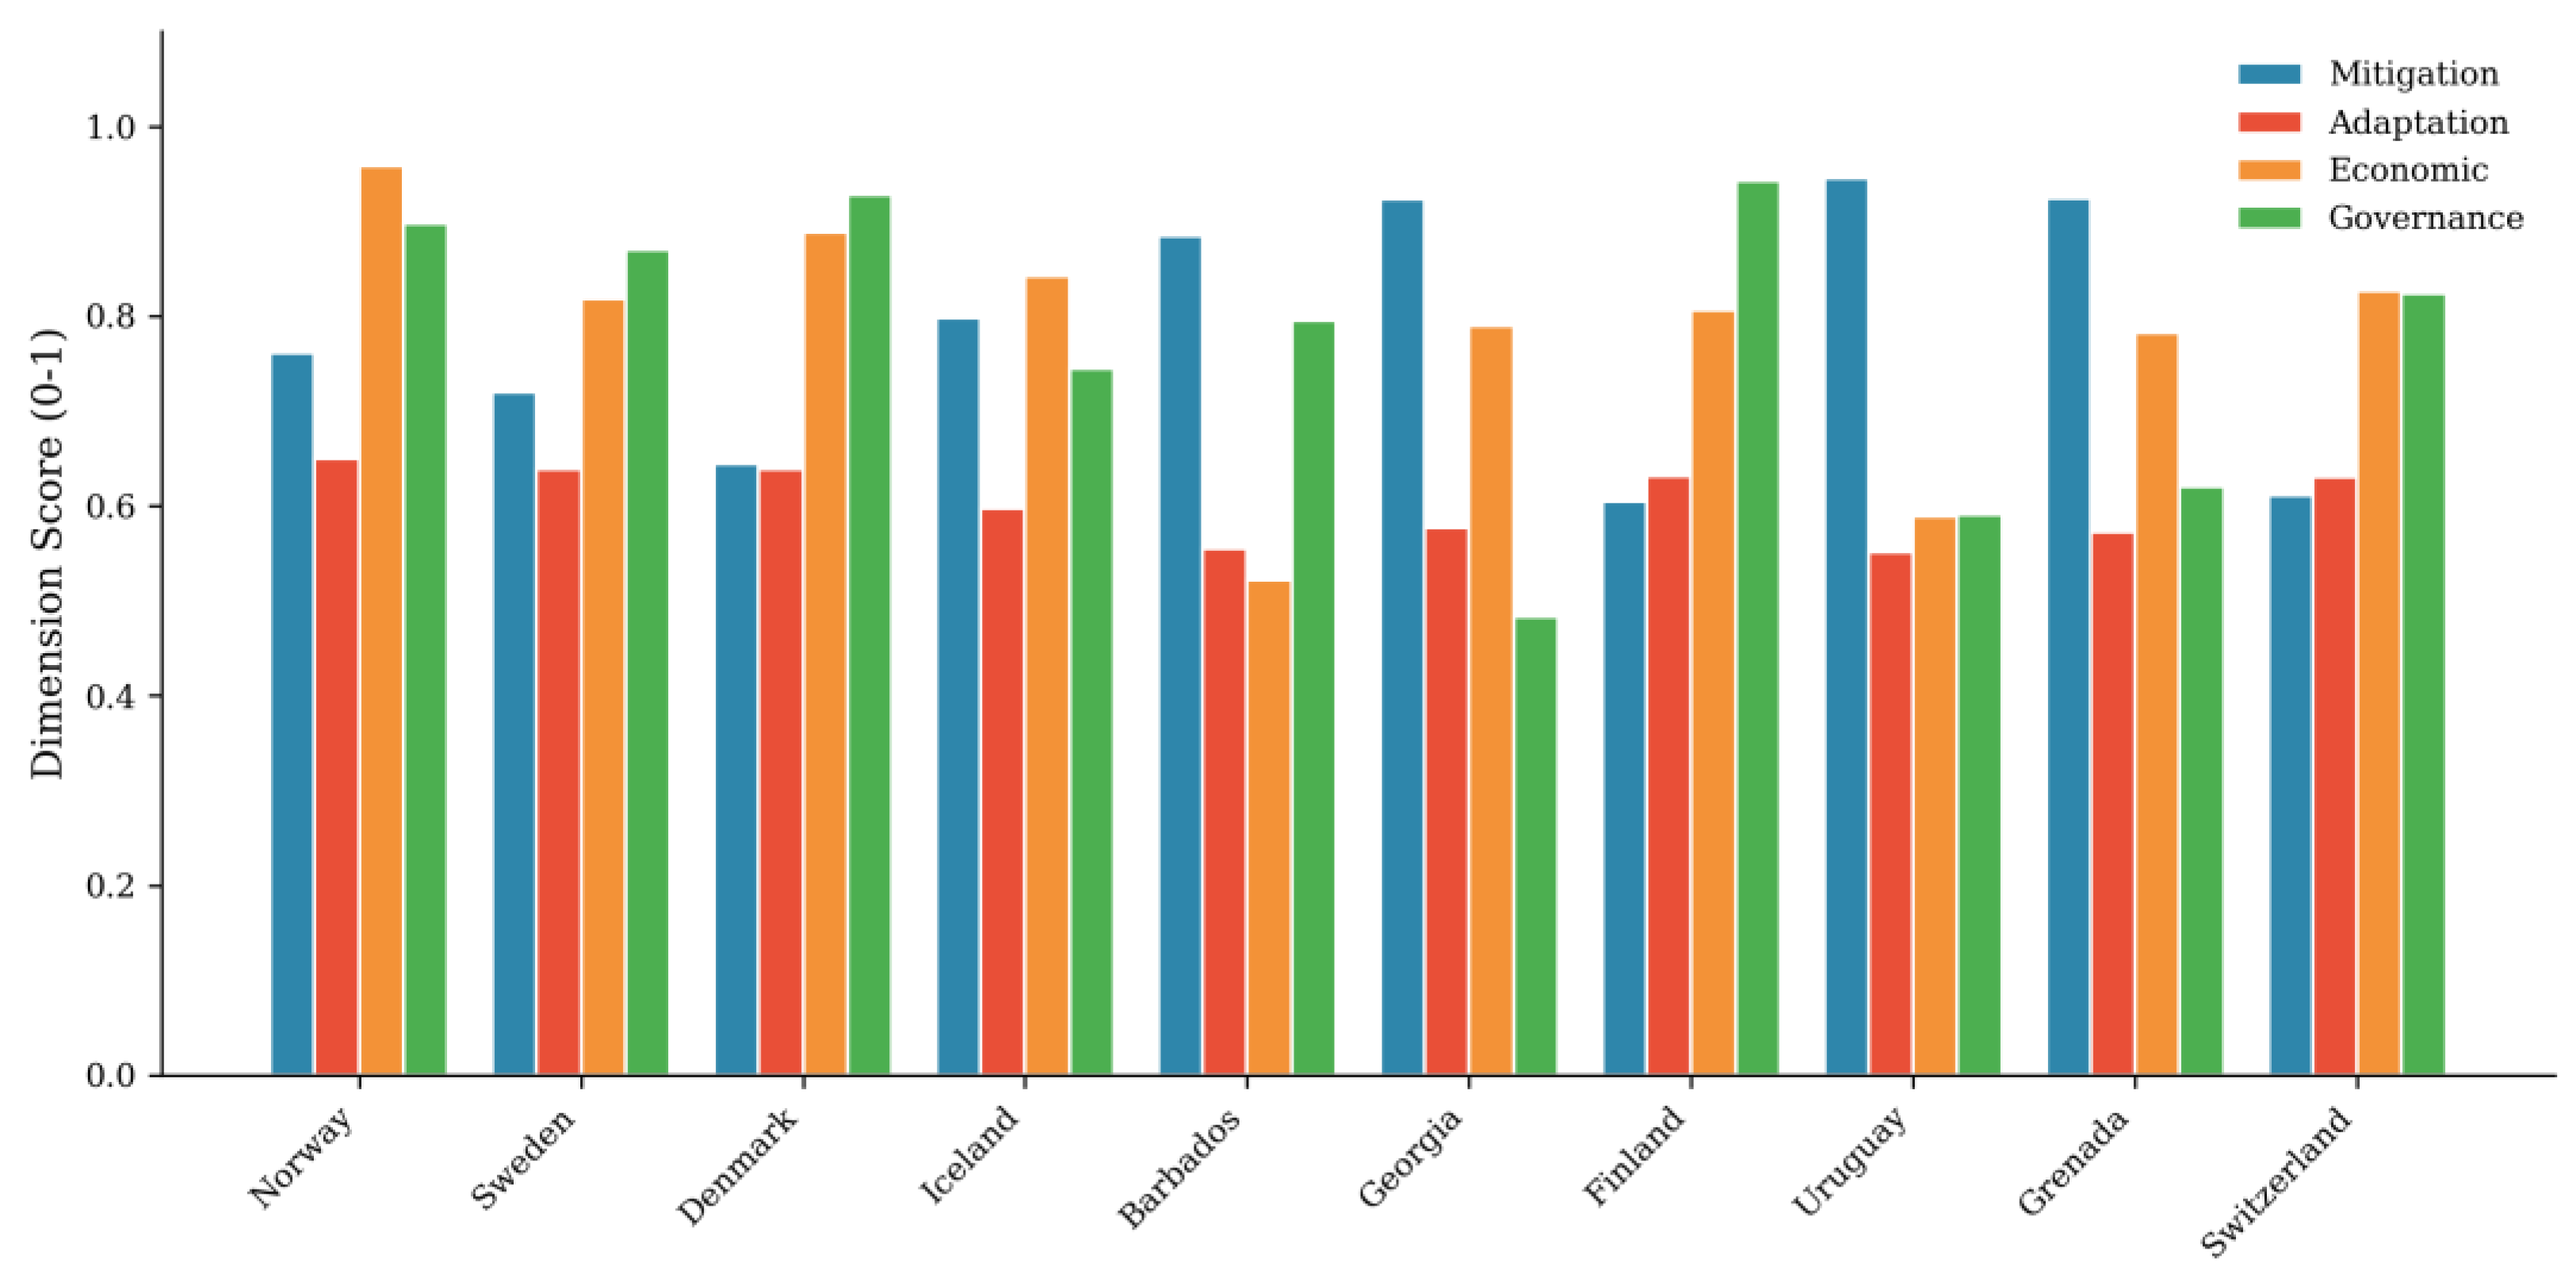
Figure 4.
Distribution of CPPI scores by world region. Box plots show median, interquartile range, and outliers.
Figure 4.
Distribution of CPPI scores by world region. Box plots show median, interquartile range, and outliers.
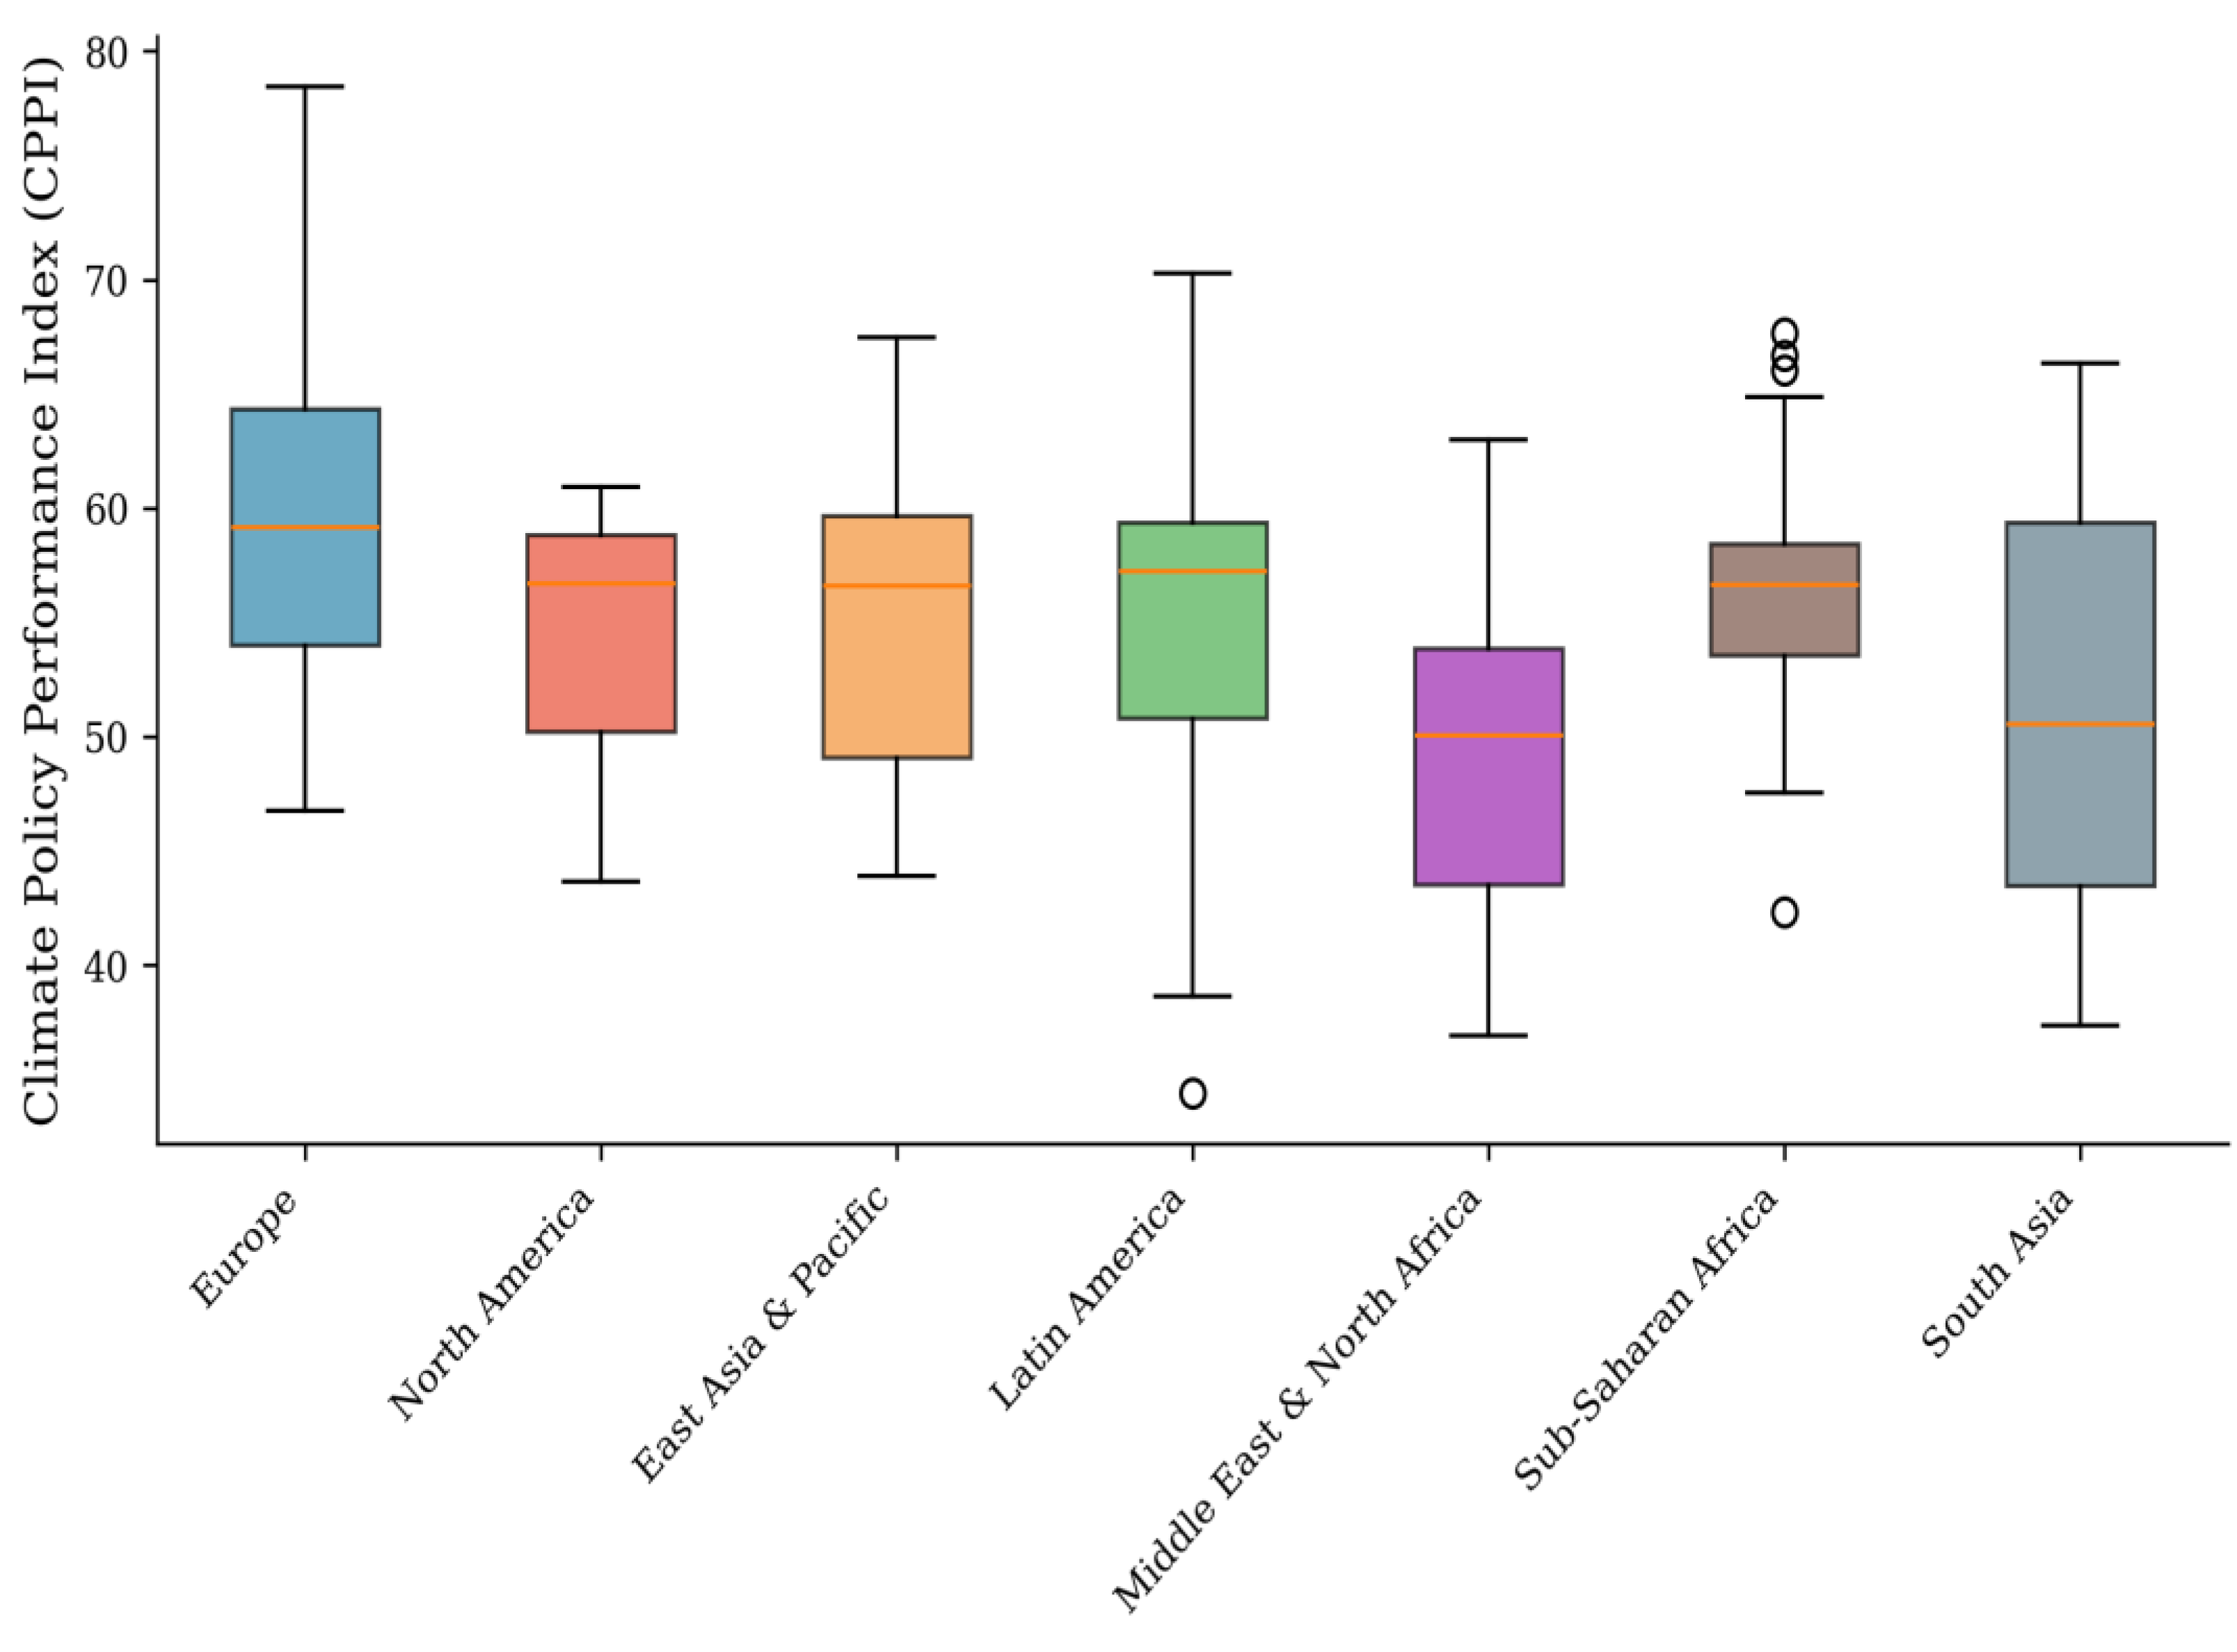
Figure 5.
Relationship between CPPI and CO₂ emissions per capita. Points coloured by region; selected countries labelled.
Figure 5.
Relationship between CPPI and CO₂ emissions per capita. Points coloured by region; selected countries labelled.
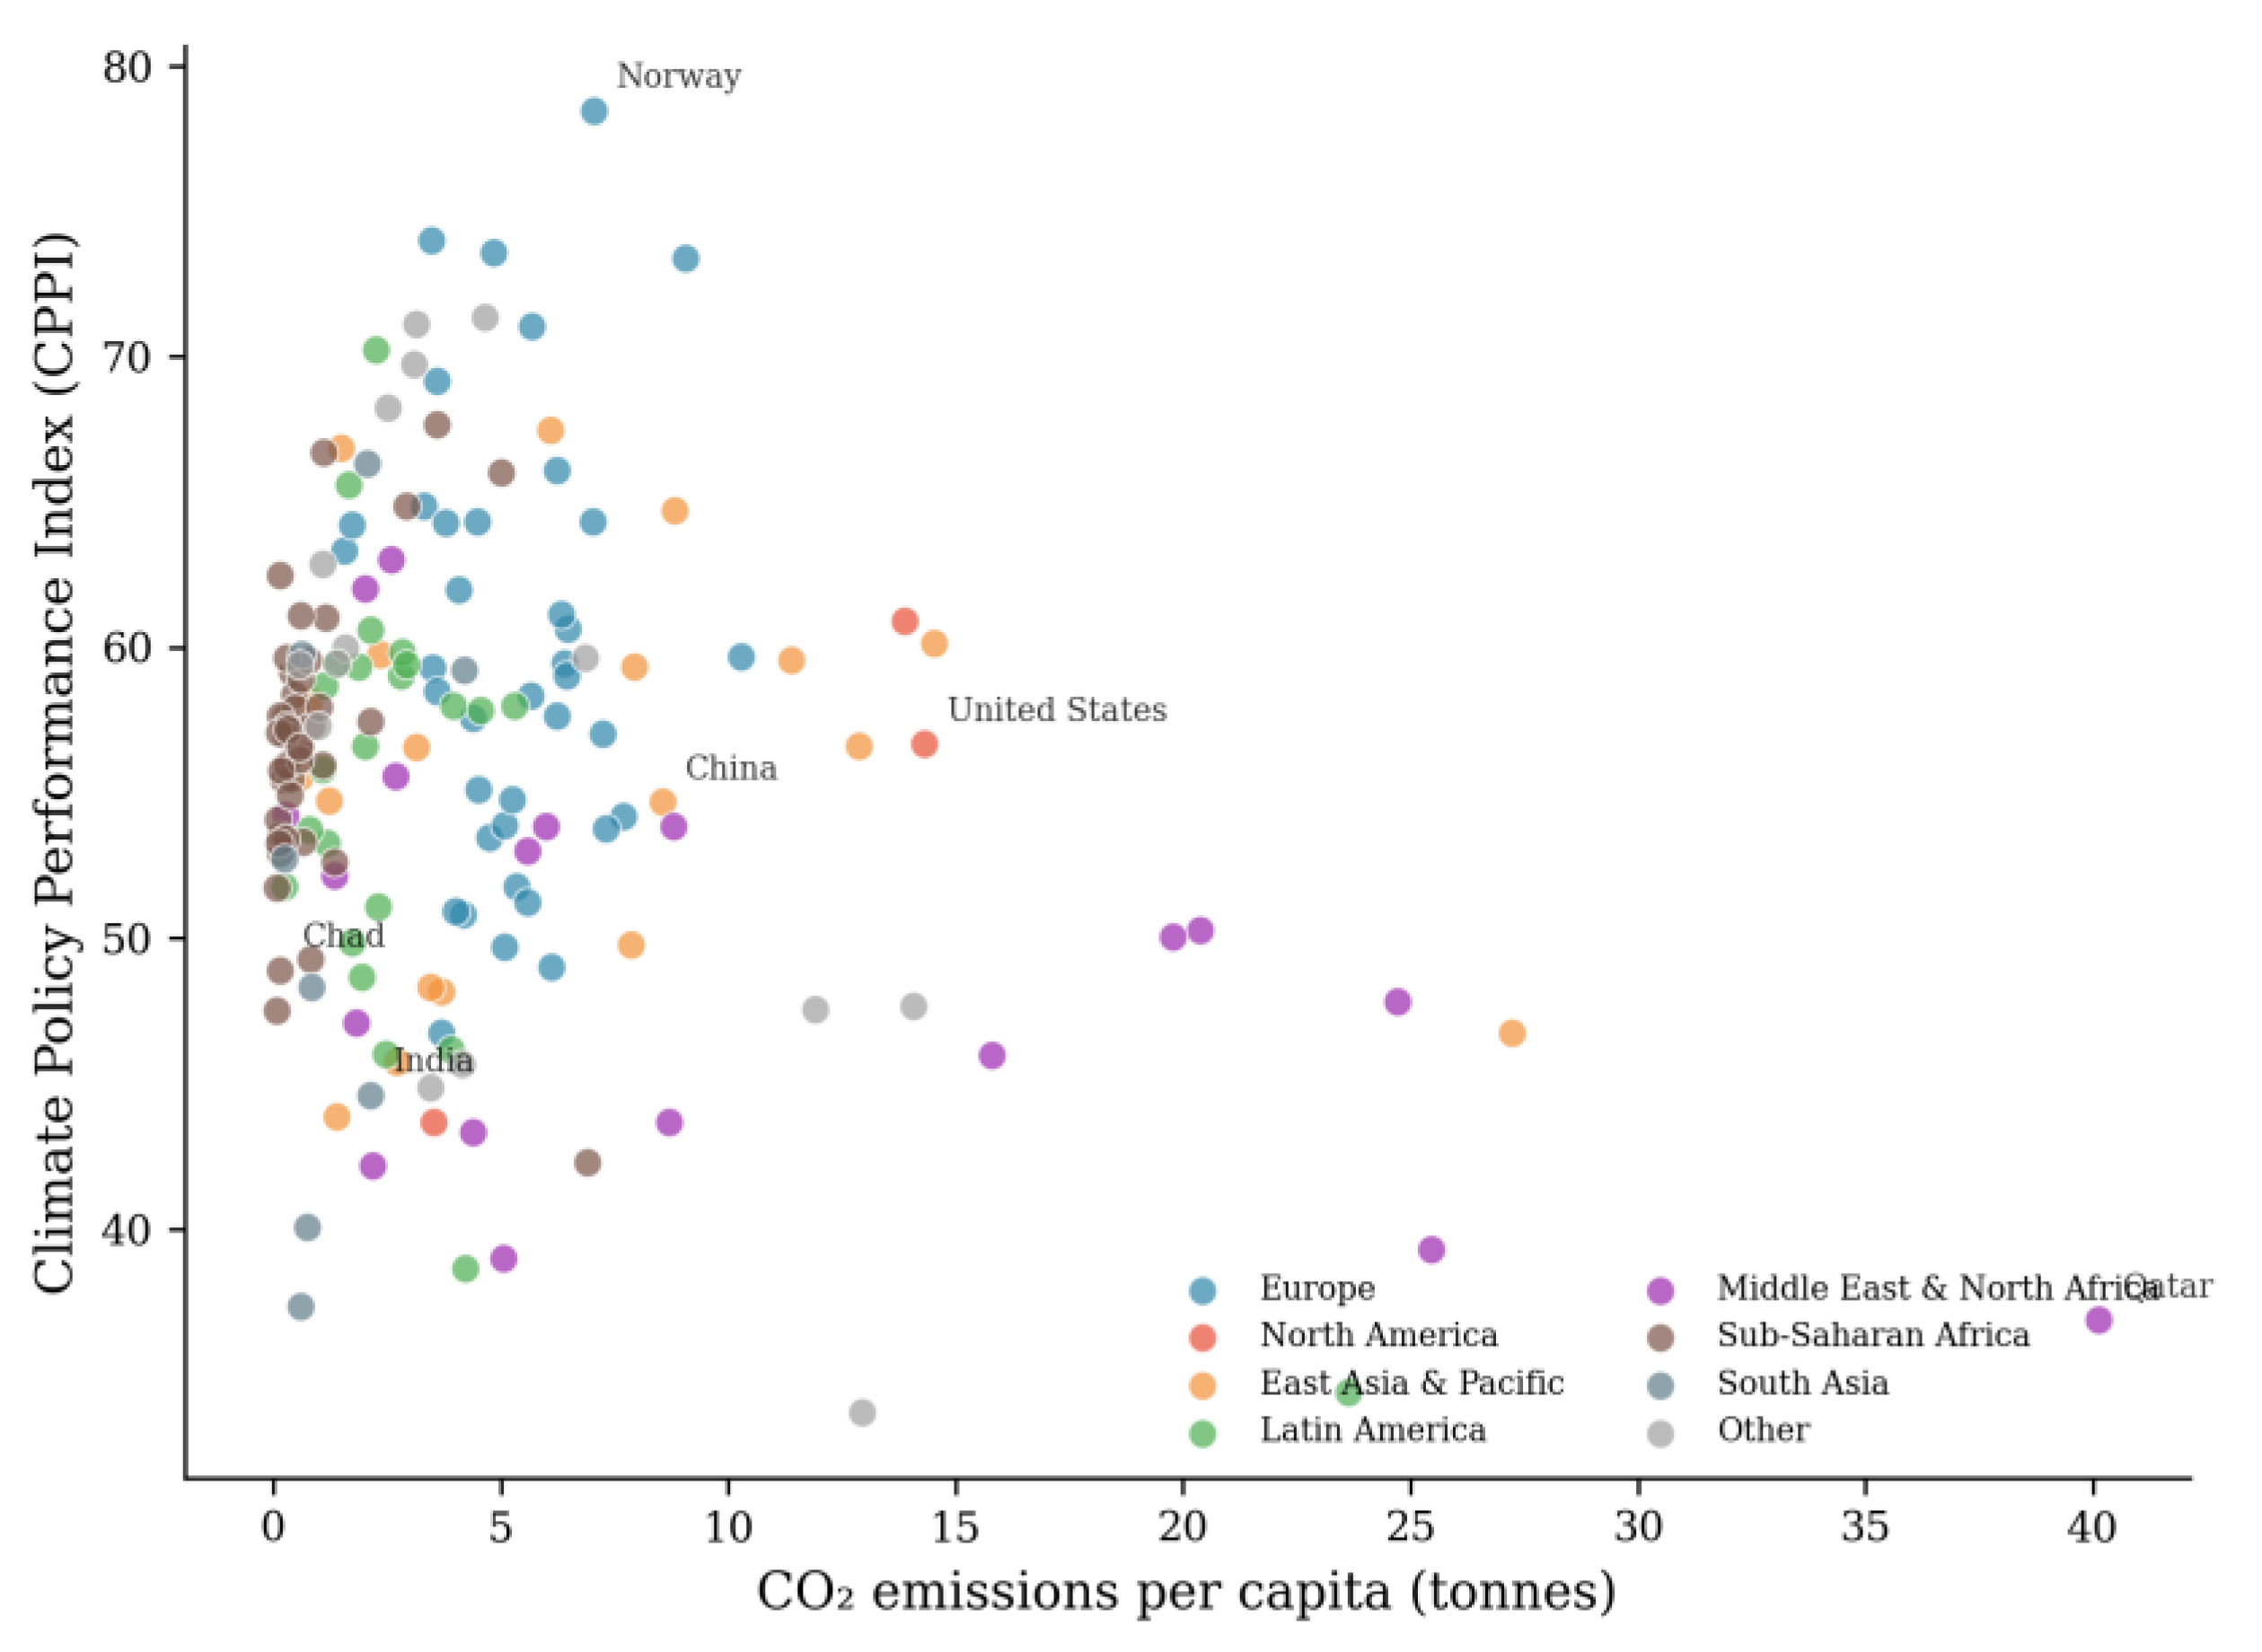
Figure 6.
CPPI scores by income group. (A) Distribution of overall CPPI scores. (B) Mean dimension scores by income classification.
Figure 6.
CPPI scores by income group. (A) Distribution of overall CPPI scores. (B) Mean dimension scores by income classification.
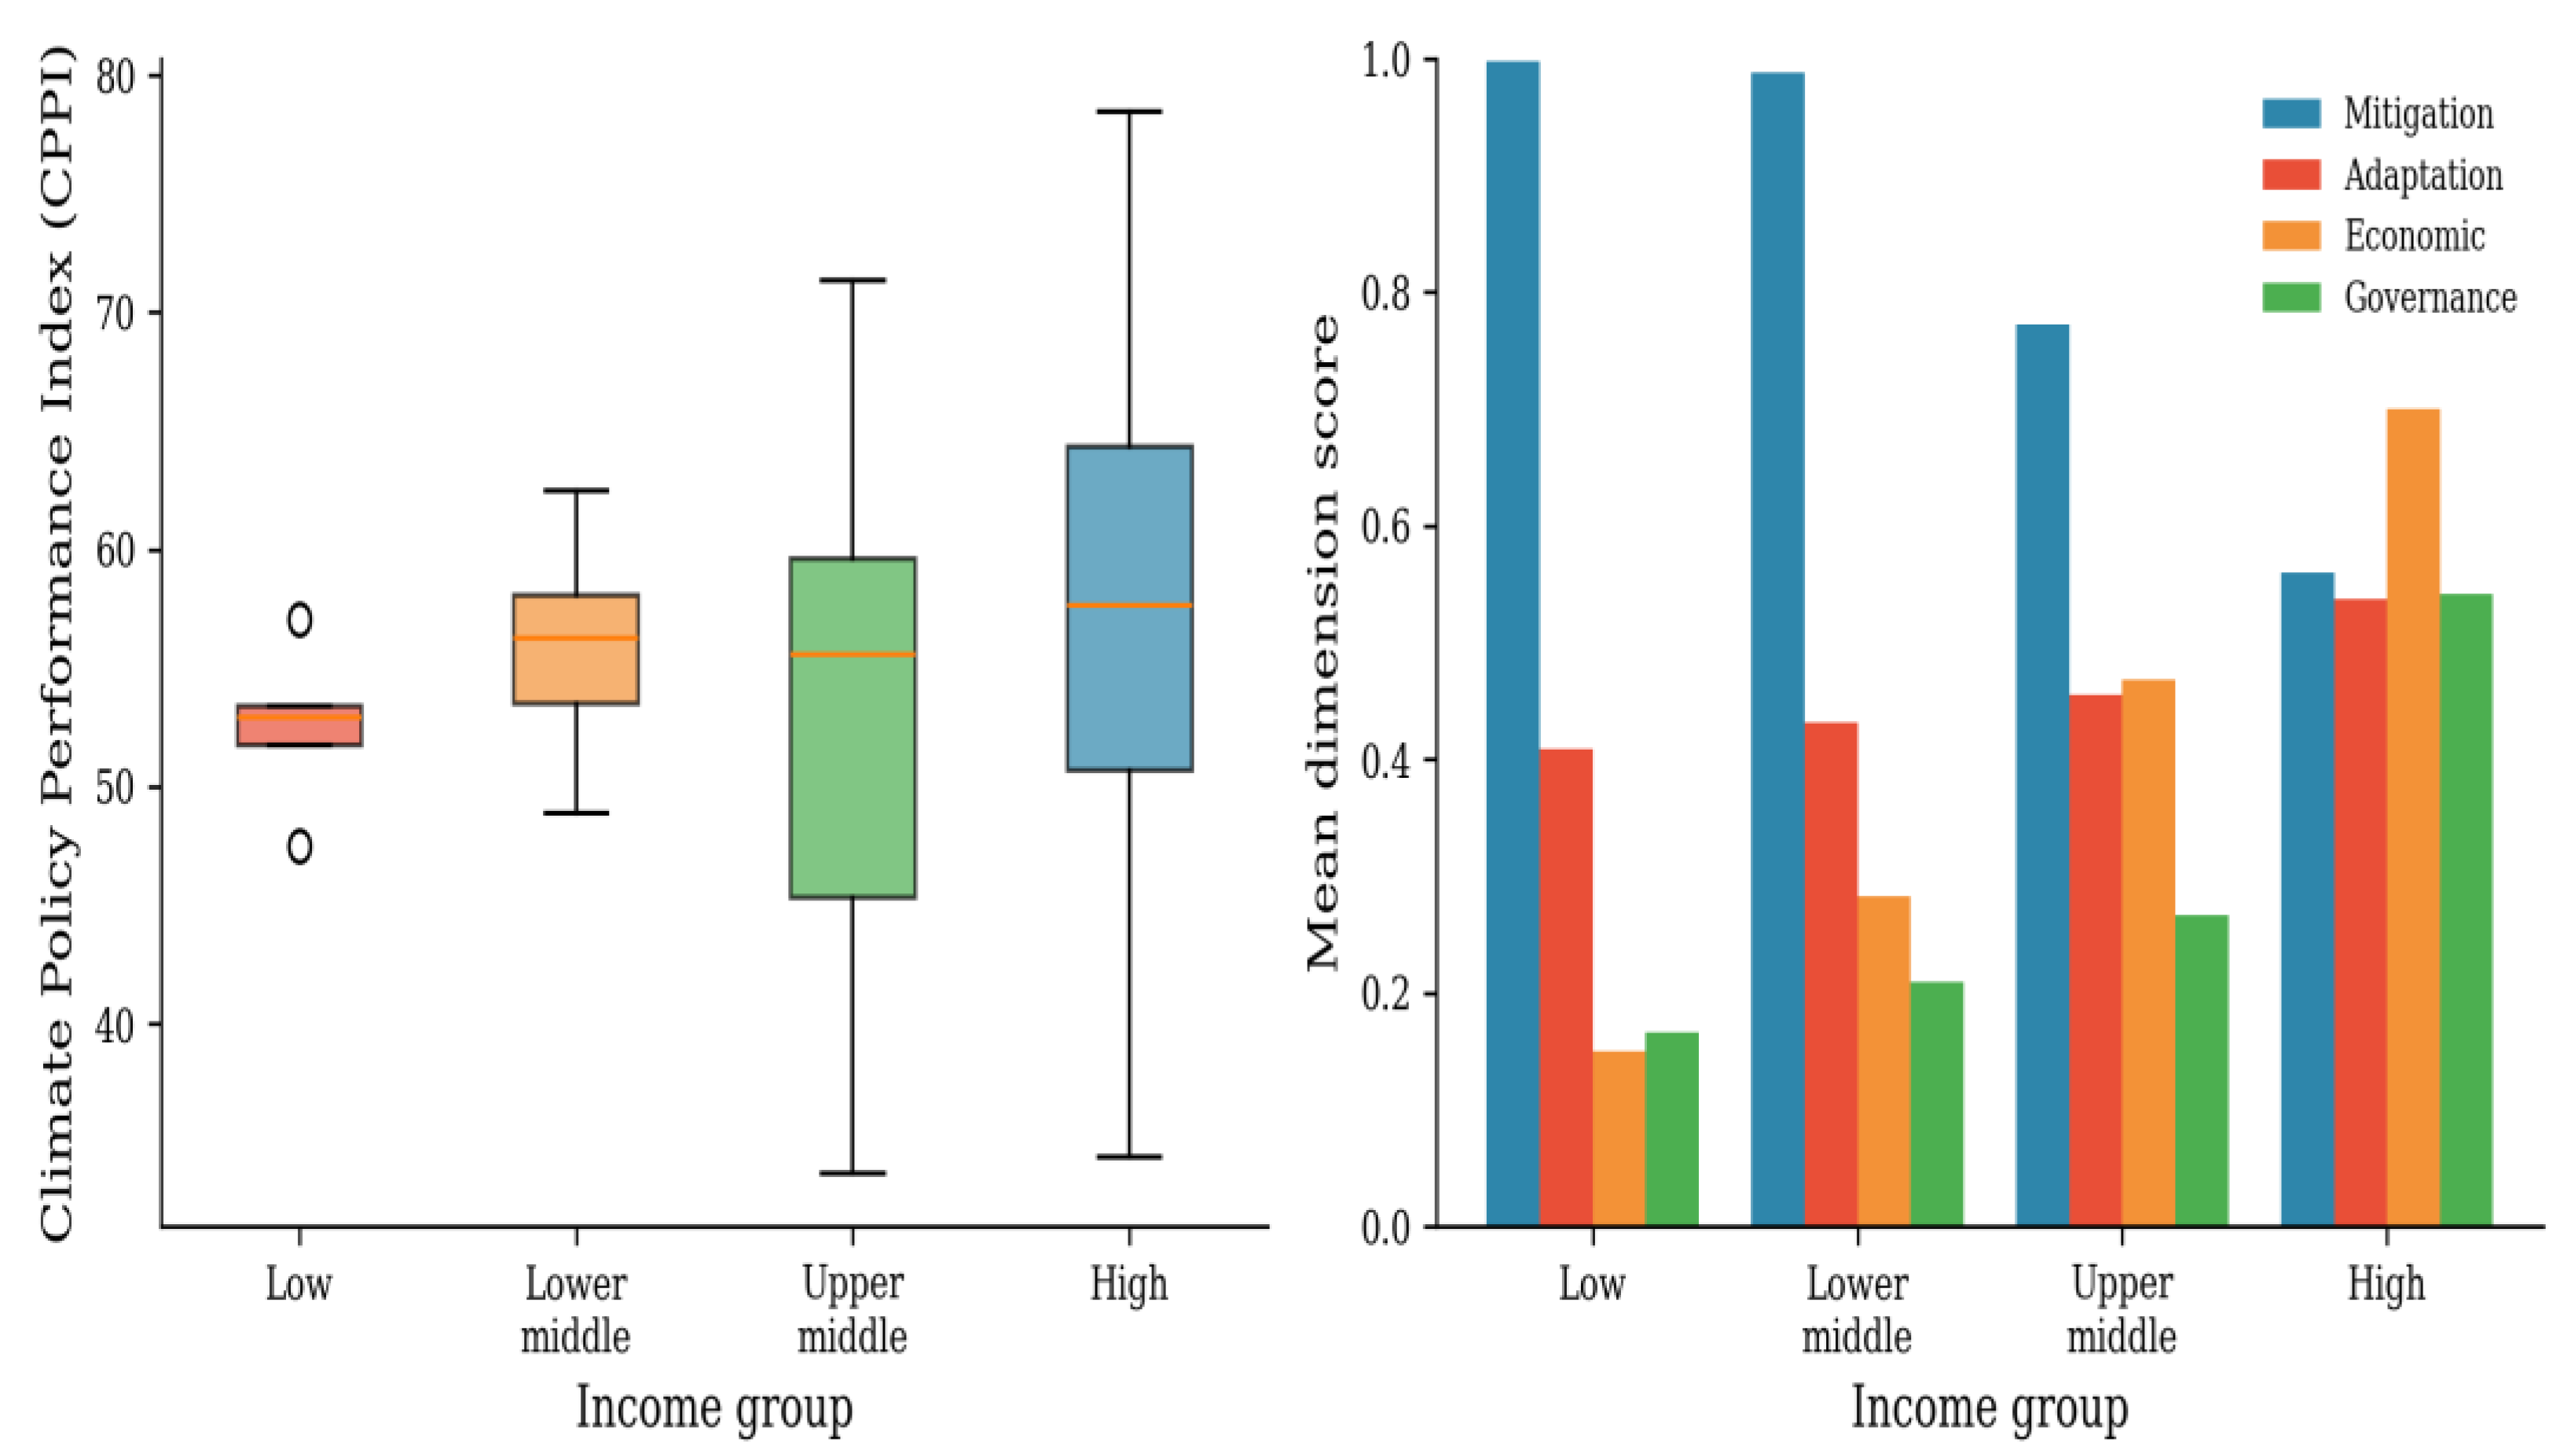
Figure 7.
Dimension profiles for top 5 countries. D1 = Mitigation; D2 = Adaptation; D3 = Economic; D4 = Governance.
Figure 7.
Dimension profiles for top 5 countries. D1 = Mitigation; D2 = Adaptation; D3 = Economic; D4 = Governance.
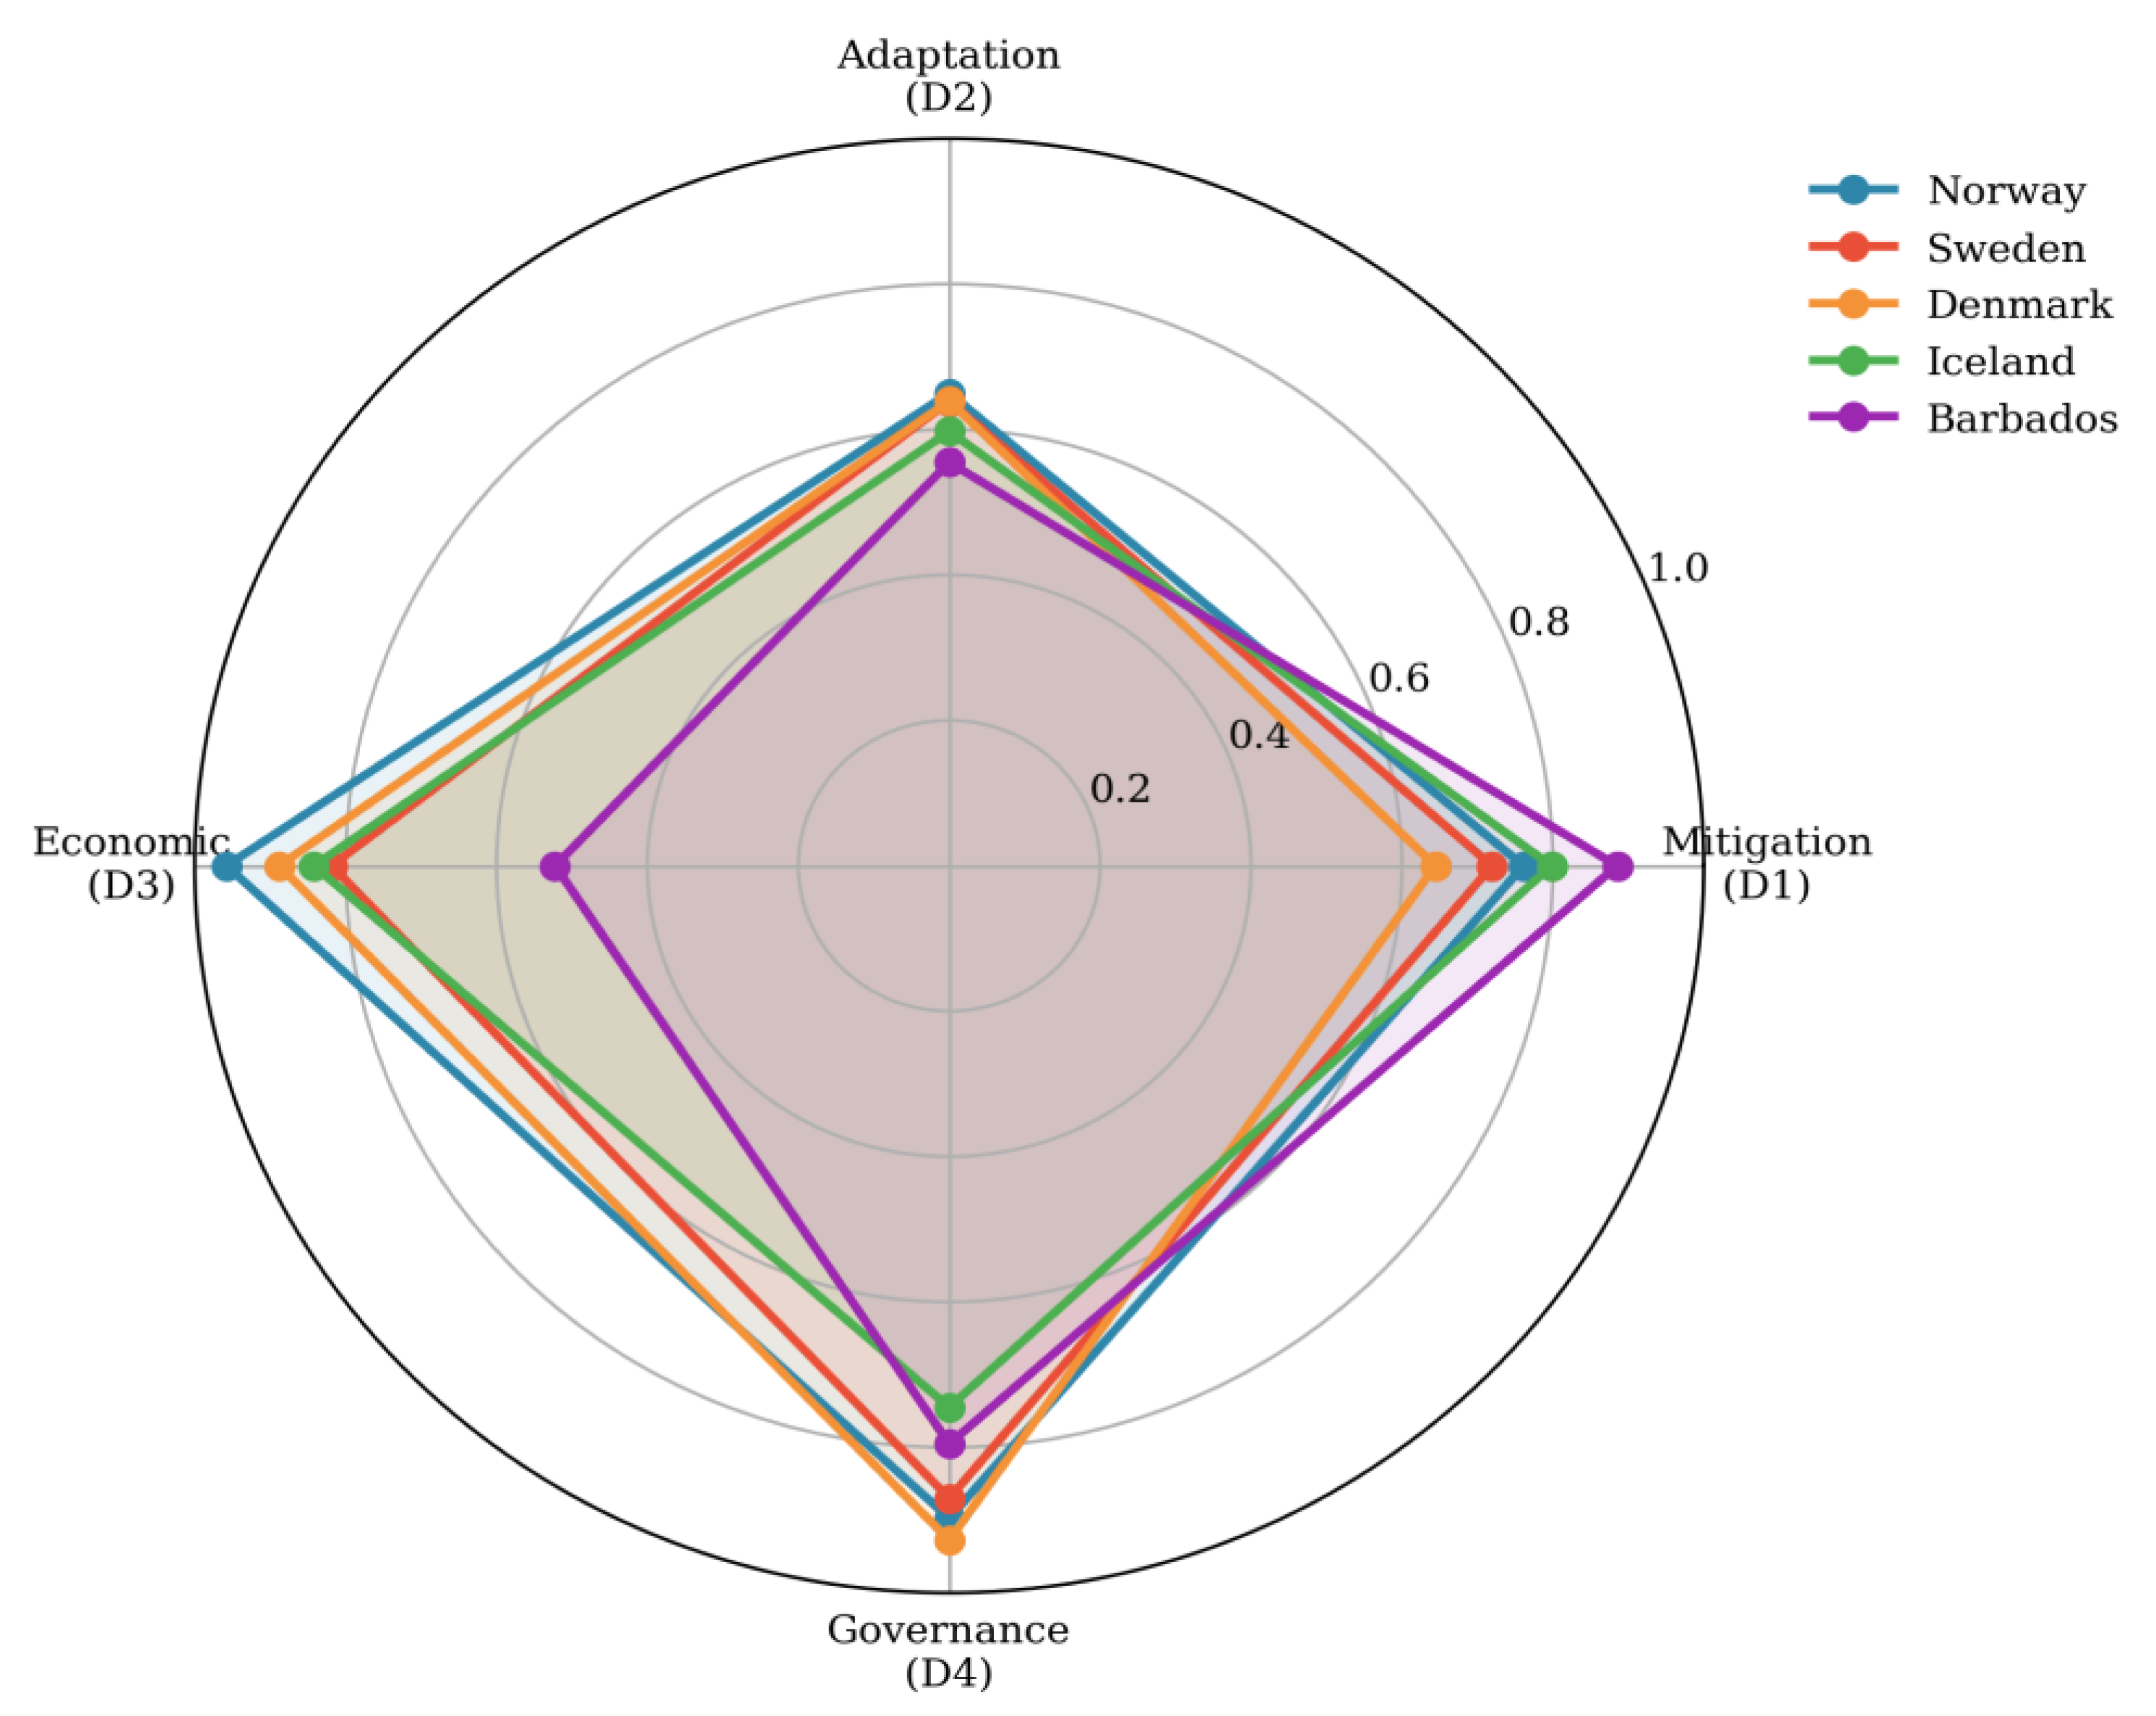
Figure 8.
Spearman rank correlations between alternative weighting schemes.
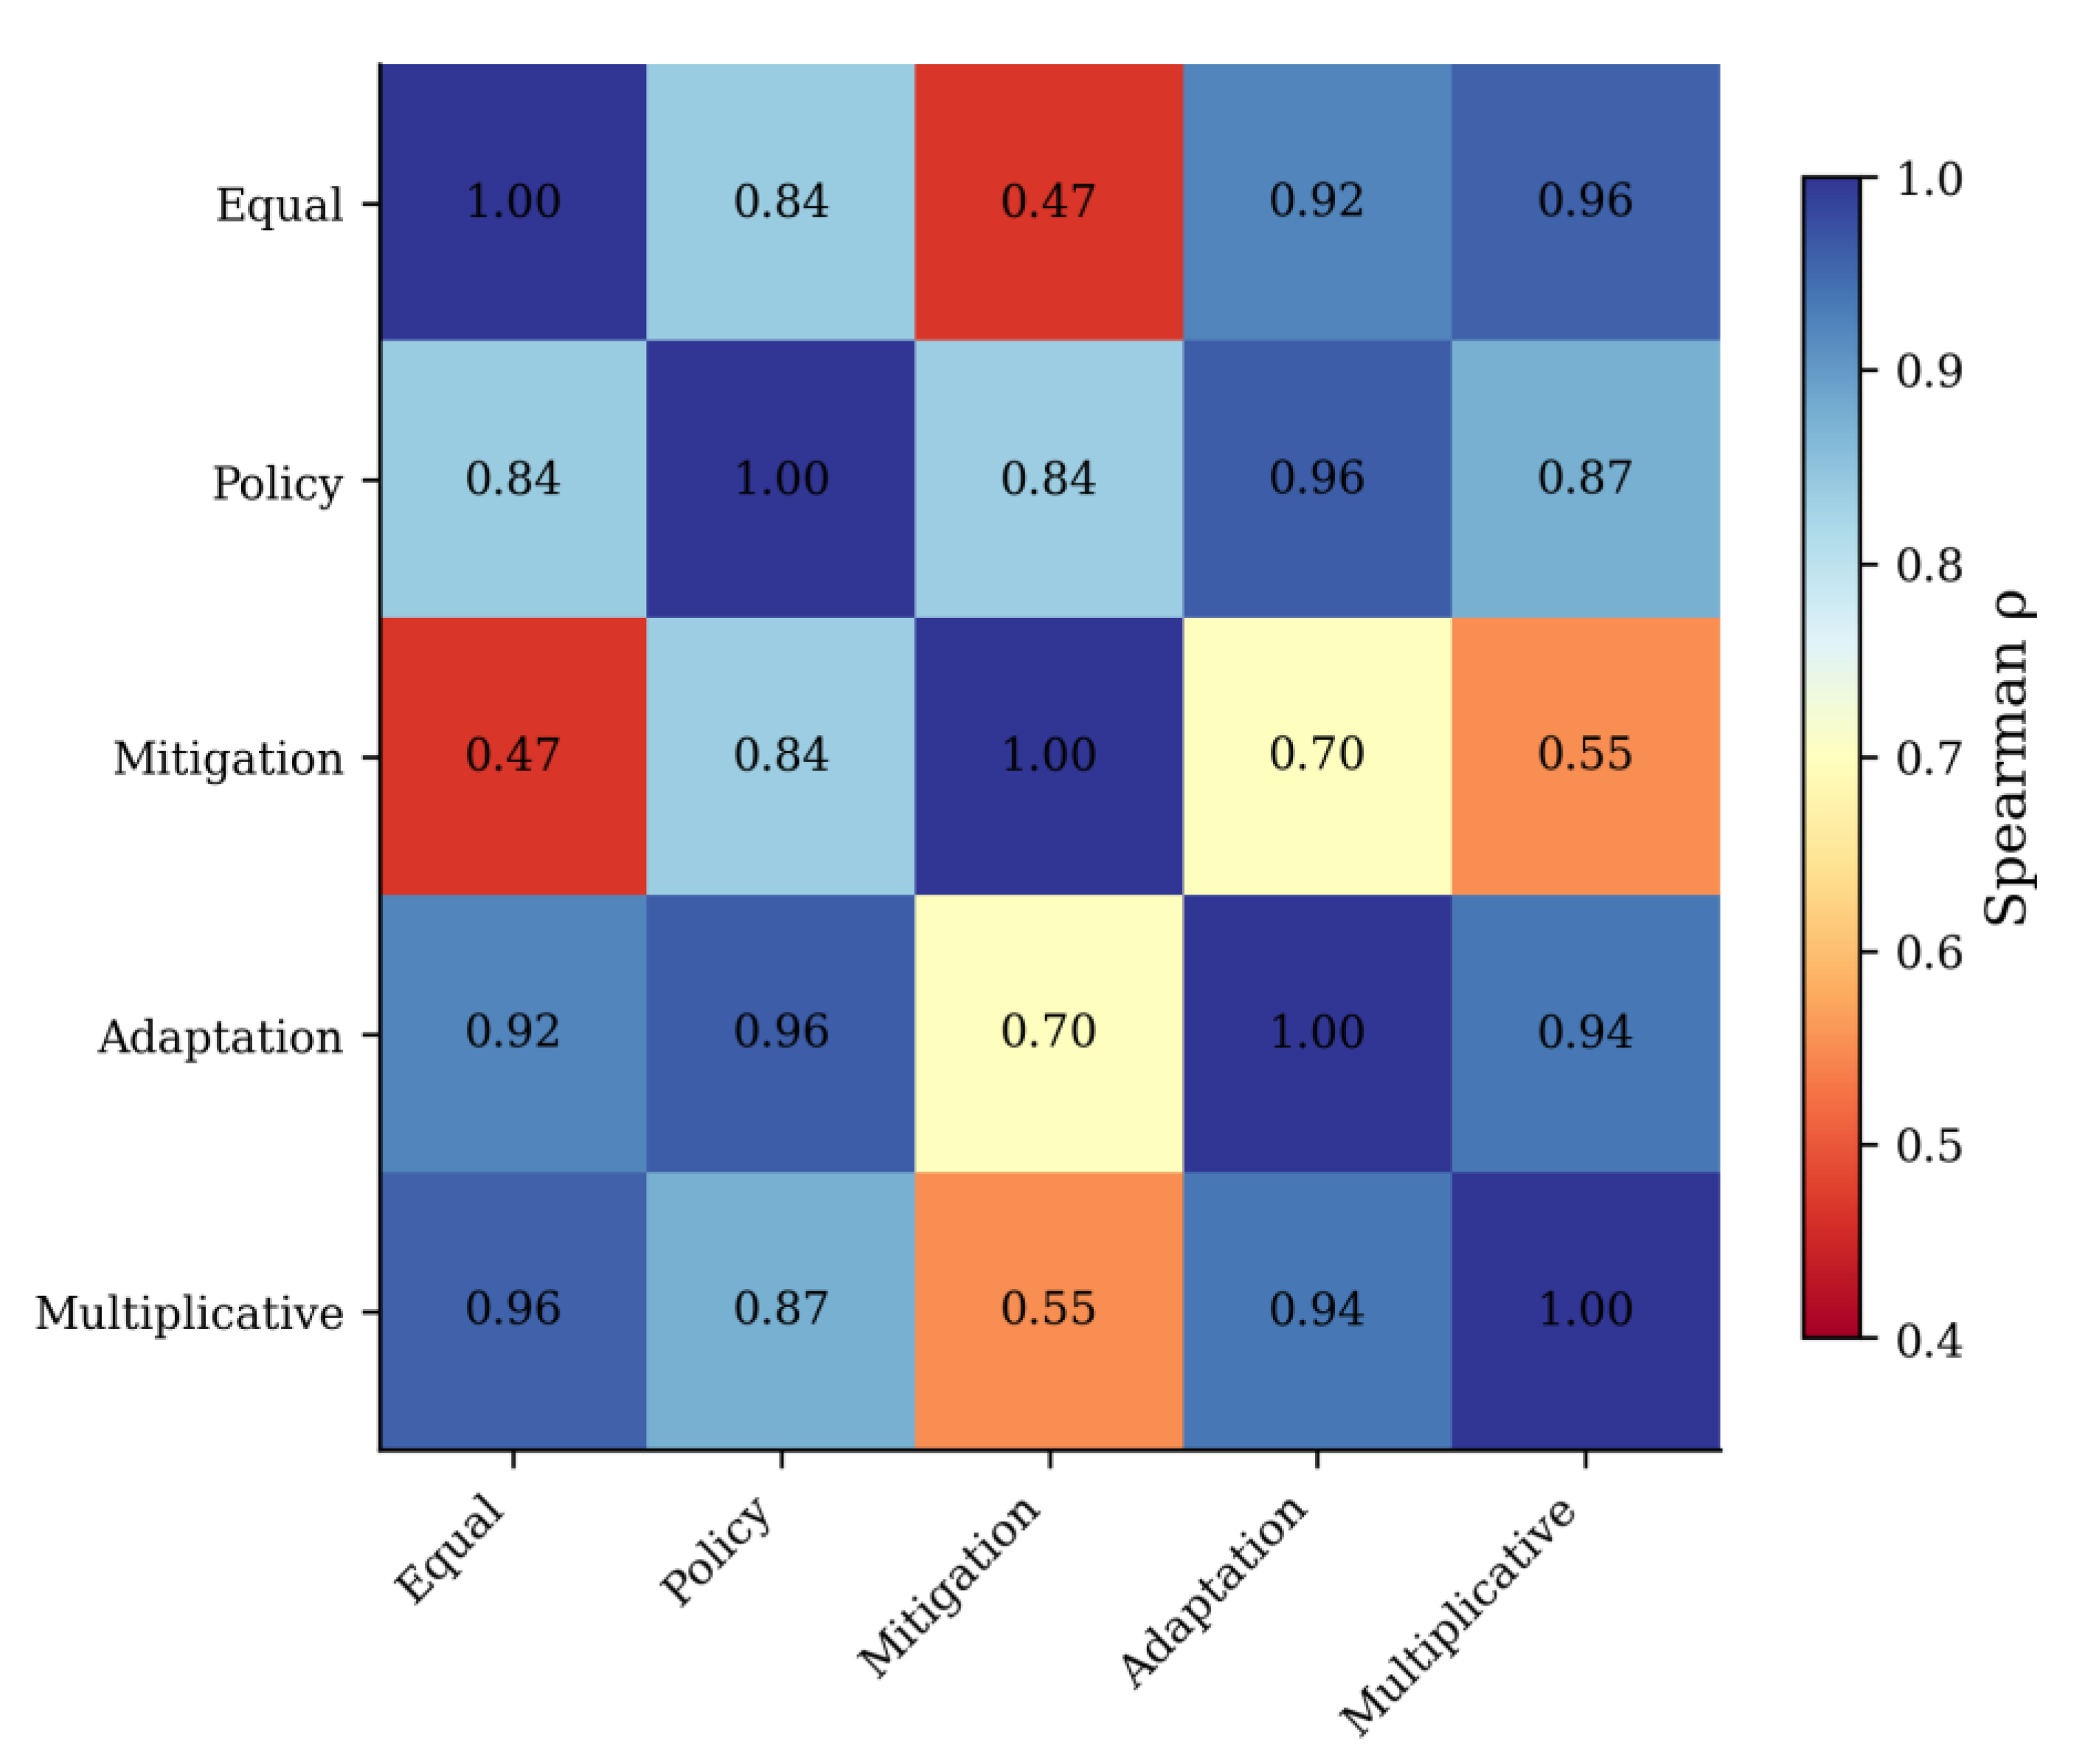
Figure 9.
Relationship between CPPI and ND-GAIN Climate Adaptation Index (r = 0.398, p < 0.001).
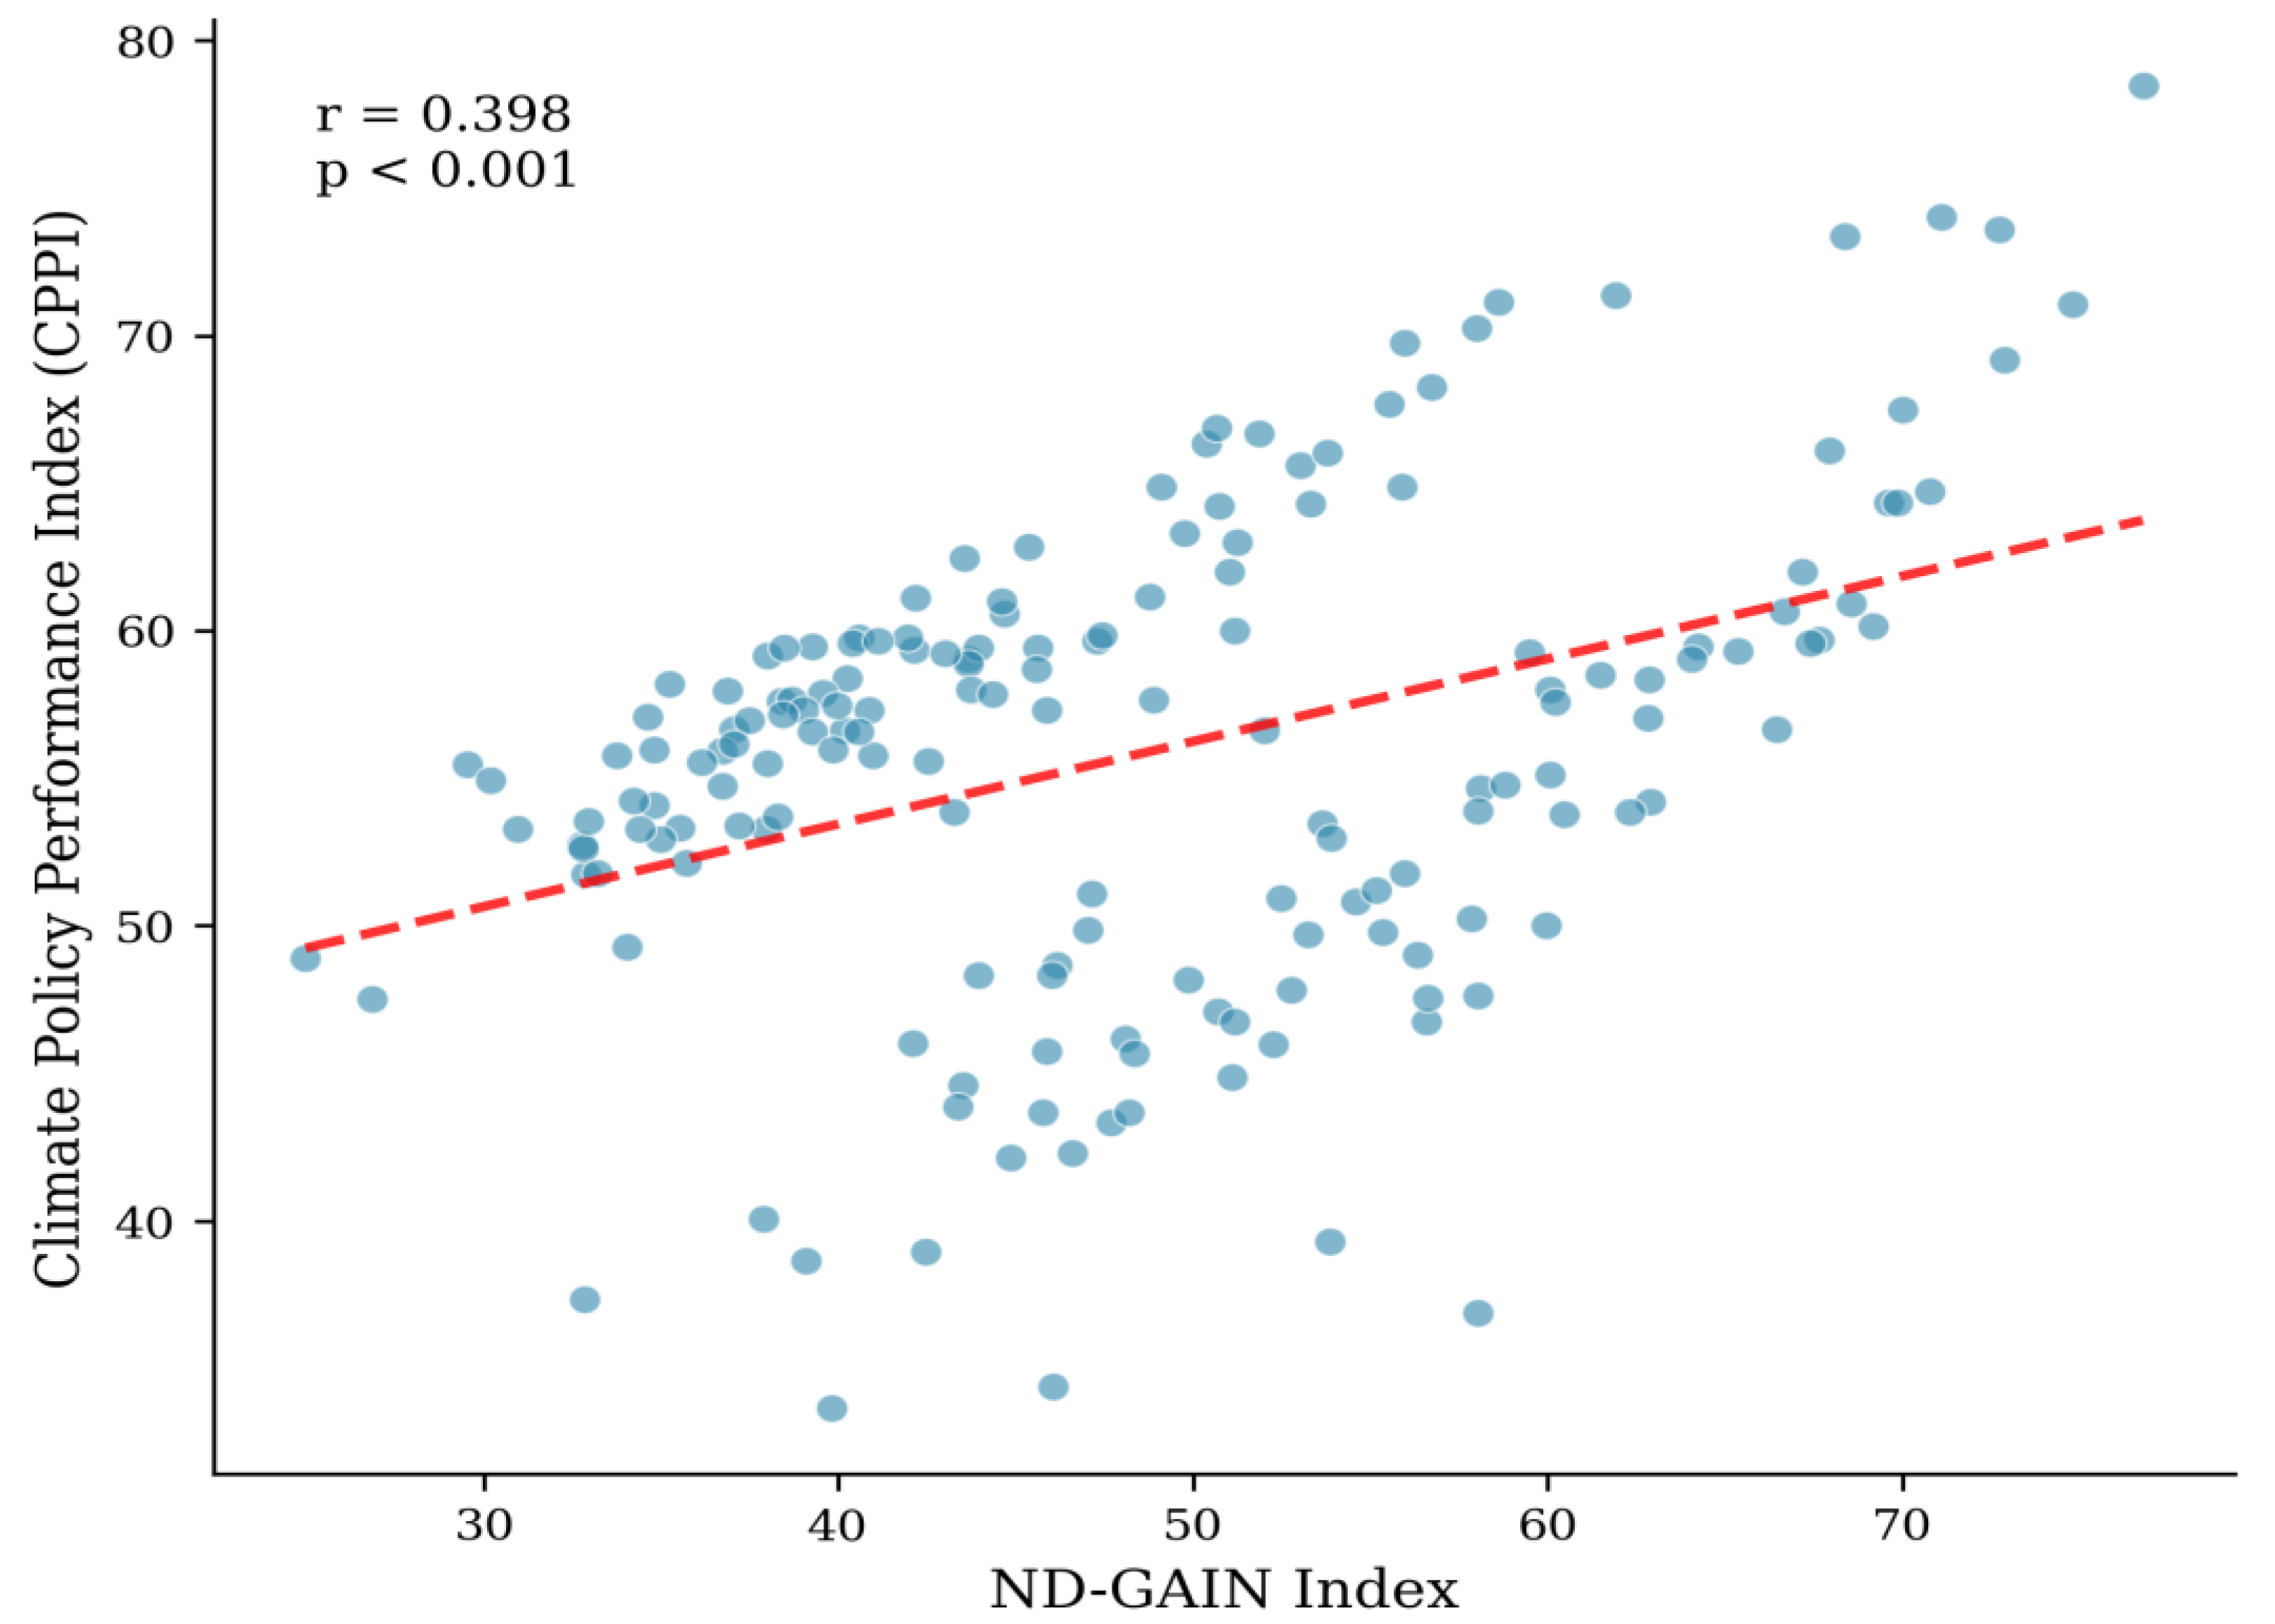
Table 1.
Variable definitions and data sources.
| Variable | Definition | Unit | Source |
| Mitigation dimension | |||
| CO₂ per capita | Annual CO₂ emissions per person | tonnes/capita | GCP 2024 |
| Renewables share | Renewable energy in primary energy mix | % | EI 2024 |
| Carbon intensity | CO₂ emissions per kWh of electricity | gCO₂/kWh | EI 2024 |
| Adaptation dimension | |||
| ND-GAIN Index | Overall climate adaptation performance | 0–100 | ND-GAIN 2024 |
| Vulnerability | Exposure, sensitivity, and adaptive capacity | 0–1 | ND-GAIN 2024 |
| Readiness | Economic, governance, and social preparedness | 0–1 | ND-GAIN 2024 |
| Economic context | |||
| GDP per capita | Gross domestic product per person | USD | WDI 2024 |
| Population | Total population | persons | WDI 2024 |
Notes: GCP = Global Carbon Project; EI = Energy Institute; ND-GAIN = Notre Dame Global Adaptation Initiative; WDI = World Development Indicators. Lower vulnerability scores indicate better performance; higher values for all other indicators represent better outcomes.
Table 2.
Descriptive statistics (N = 187 countries with complete MAUT data).
| Variable | Mean | SD | Min | Median | Max |
| CO₂ per capita (t) | 4.61 | 5.51 | 0.06 | 3.14 | 40.13 |
| Renewables share (%)* | 15.62 | 15.50 | 0.01 | 11.15 | 82.08 |
| ND-GAIN Index | 48.30 | 11.15 | 24.99 | 46.60 | 76.79 |
| Vulnerability | 0.43 | 0.09 | 0.25 | 0.42 | 0.64 |
| Readiness | 0.40 | 0.15 | 0.12 | 0.38 | 0.80 |
| GDP per capita (USD)** | 18,928 | 19,691 | 670 | 12,482 | 128,153 |
Notes: * n = 79 countries with complete energy data; ** n = 164 countries with GDP data. SD = standard deviation.
Table 3.
Mean values by income group.
| Income Group | N | CO₂/capita | Renewables (%) | ND-GAIN | Vulnerability |
| High income | 75 | 7.64 | 16.93 | 58.57 | 0.35 |
| Upper middle income | 46 | 2.87 | 11.16 | 45.30 | 0.42 |
| Lower middle income | 37 | 0.54 | — | 37.06 | 0.53 |
| Low income | 6 | 0.12 | — | 33.20 | 0.56 |
Notes: Renewables data unavailable for most low and lower-middle income countries. — indicates insufficient data.
Table 4.
Mean values by region.
| Region | N | CO₂/capita | Renewables (%) | ND-GAIN |
| Europe | 39 | 5.25 | 22.09 | 60.83 |
| North America | 3 | 10.58 | 16.54 | 60.26 |
| East Asia & Pacific | 21 | 6.77 | 12.04 | 52.03 |
| Middle East & N. Africa | 19 | 10.40 | 3.43 | 49.63 |
| Latin America | 24 | 3.26 | 24.40 | 44.94 |
| South Asia | 8 | 1.43 | 11.03 | 40.79 |
| Sub-Saharan Africa | 49 | 0.87 | 3.65 | 38.17 |
Table 5.
Pairwise correlations.
| (1) | (2) | (3) | (4) | (5) | (6) | |
| (1) CO₂ per capita | 1.00 | |||||
| (2) Renewables share | −0.27 | 1.00 | ||||
| (3) ND-GAIN Index | 0.48 | 0.41 | 1.00 | |||
| (4) Vulnerability | −0.45 | −0.31 | −0.85 | 1.00 | ||
| (5) Readiness | 0.43 | 0.40 | 0.95 | −0.64 | 1.00 | |
| (6) GDP per capita | 0.73 | 0.14 | 0.80 | −0.67 | 0.80 | 1.00 |
Table 6.
Attribute hierarchy for climate policy evaluation.
| Dimension | Attribute | Variable | Direction |
| D₁ Mitigation | A₁₁ Emissions intensity | CO₂ per capita | − |
| A₁₂ Clean energy | Renewables share | + | |
| A₁₃ Decarbonization | Carbon intensity of electricity | − | |
| D₂ Adaptation | A₂₁ Vulnerability | ND-GAIN vulnerability score | − |
| A₂₂ Readiness | ND-GAIN readiness score | + | |
| A₂₃ Adaptive capacity | ND-GAIN adaptive capacity | + | |
| D₃ Economic | A₃₁ Development level | GDP per capita | + |
| A₃₂ Economic readiness | ND-GAIN economic readiness | + | |
| D₄ Governance | A₄₁ Governance quality | ND-GAIN governance score | + |
| A₄₂ Social readiness | ND-GAIN social readiness | + |
Notes: Direction indicates whether higher values represent better (+) or worse (−) performance.
Table 8.
Descriptive statistics for CPPI and dimension scores (N = 187)
| Variable | Mean | SD | Min | Max | Median |
|---|---|---|---|---|---|
| CPPI (Policy weights) | 55.86 | 8.03 | 33.67 | 78.46 | 56.62 |
| D1: Mitigation | 0.757 | 0.248 | 0.001 | 0.998 | 0.818 |
| D2: Adaptation | 0.482 | 0.069 | 0.351 | 0.650 | 0.488 |
| D3: Economic | 0.523 | 0.210 | 0.150 | 0.958 | 0.519 |
| D4: Governance | 0.373 | 0.210 | 0.115 | 0.943 | 0.345 |
Table 9.
Top 15 countries by Climate Policy Performance Index
| Rank | Country | CPPI | D1 | D2 | D3 | D4 |
| 1 | Norway | 78.46 | 0.761 | 0.650 | 0.958 | 0.897 |
| 2 | Sweden | 74.02 | 0.719 | 0.639 | 0.819 | 0.870 |
| 3 | Denmark | 73.59 | 0.644 | 0.639 | 0.888 | 0.927 |
| 4 | Iceland | 73.38 | 0.798 | 0.597 | 0.842 | 0.745 |
| 5 | Barbados | 71.36 | 0.885 | 0.555 | 0.522 | 0.795 |
| 6 | Georgia | 71.14 | 0.923 | 0.577 | 0.790 | 0.483 |
| 7 | Finland | 71.06 | 0.604 | 0.632 | 0.807 | 0.943 |
| 8 | Uruguay | 70.26 | 0.945 | 0.551 | 0.589 | 0.591 |
| 9 | Grenada | 69.75 | 0.924 | 0.572 | — | 0.620 |
| 10 | Switzerland | 69.17 | 0.611 | 0.630 | 0.827 | 0.824 |
| 11 | Armenia | 68.26 | 0.938 | 0.555 | 0.684 | 0.426 |
| 12 | Mauritius | 67.67 | 0.912 | 0.520 | 0.760 | 0.439 |
| 13 | New Zealand | 67.48 | 0.641 | 0.589 | 0.857 | 0.725 |
| 14 | Fiji | 66.86 | 0.964 | 0.510 | — | 0.498 |
| 15 | Cape Verde | 66.70 | 0.974 | 0.544 | 0.520 | 0.425 |
Table 10.
Bottom 20 countries by Climate Policy Performance Index
| Rank | Country | CPPI | D1 | D2 | D3 | D4 |
| 168 | Libya | 44.24 | 0.547 | 0.413 | 0.463 | 0.115 |
| 169 | Brunei | 44.19 | 0.252 | 0.528 | 0.847 | 0.477 |
| 170 | Pakistan | 44.08 | 0.940 | 0.351 | 0.239 | 0.181 |
| 171 | Mongolia | 43.52 | 0.573 | 0.475 | 0.551 | 0.245 |
| 172 | Oman | 43.08 | 0.266 | 0.535 | 0.739 | 0.381 |
| 173 | Iraq | 42.75 | 0.641 | 0.415 | 0.458 | 0.177 |
| 174 | Kazakhstan | 42.10 | 0.361 | 0.515 | 0.698 | 0.305 |
| 175 | Russia | 41.77 | 0.384 | 0.537 | 0.682 | 0.215 |
| 176 | Saudi Arabia | 41.15 | 0.172 | 0.499 | 0.779 | 0.394 |
| 177 | Bahrain | 40.08 | 0.104 | 0.520 | 0.716 | 0.463 |
| 178 | Iran | 39.79 | 0.422 | 0.449 | 0.480 | 0.214 |
| 179 | Kuwait | 38.84 | 0.035 | 0.520 | 0.852 | 0.456 |
| 180 | Venezuela | 38.65 | 0.714 | 0.424 | — | 0.165 |
| 181 | Bangladesh | 37.35 | 0.946 | 0.368 | 0.179 | 0.158 |
| 182 | Qatar | 36.88 | 0.001 | 0.516 | 0.946 | 0.517 |
| 183 | Trinidad & Tobago | 34.38 | 0.081 | 0.480 | 0.598 | 0.348 |
| 184 | Turkmenistan | 33.67 | 0.377 | 0.451 | 0.612 | 0.115 |
Table 11.
Regional summary statistics
| Region | N | Mean | SD | D1 | D2 | D3 | D4 |
|---|---|---|---|---|---|---|---|
| Europe | 39 | 59.92 | 7.72 | 0.598 | 0.547 | 0.694 | 0.601 |
| Other | 27 | 57.24 | 11.19 | 0.829 | 0.475 | 0.612 | 0.379 |
| Sub-Saharan Africa | 48 | 56.56 | 4.81 | 0.971 | 0.439 | 0.315 | 0.222 |
| East Asia & Pacific | 19 | 55.62 | 7.01 | 0.636 | 0.507 | 0.637 | 0.448 |
| Latin America | 24 | 54.67 | 7.97 | 0.817 | 0.456 | 0.460 | 0.267 |
| North America | 3 | 53.75 | 8.99 | 0.451 | 0.536 | 0.705 | 0.564 |
| South Asia | 8 | 51.04 | 10.26 | 0.750 | 0.421 | 0.374 | 0.300 |
| MENA | 19 | 49.12 | 7.36 | 0.538 | 0.485 | 0.604 | 0.333 |
Table 12.
CPPI statistics under alternative weighting schemes
| Scheme | w(D1) | w(D2) | w(D3) | w(D4) | Mean | SD |
|---|---|---|---|---|---|---|
| Equal | 0.25 | 0.25 | 0.25 | 0.25 | 53.12 | 9.03 |
| Policy | 0.35 | 0.30 | 0.15 | 0.20 | 55.86 | 8.03 |
| Mitigation | 0.50 | 0.25 | 0.10 | 0.15 | 60.11 | 10.35 |
| Adaptation | 0.25 | 0.50 | 0.10 | 0.15 | 53.61 | 6.95 |
| Multiplicative | — | — | — | — | 48.73 | 12.84 |
Table 13.
Correlations between CPPI and input indicators
| Indicator | r | p-value | N |
|---|---|---|---|
| ND-GAIN Index | 0.398 | <0.001 | 187 |
| ND-GAIN Readiness | 0.491 | <0.001 | 187 |
| ND-GAIN Vulnerability | −0.197 | 0.007 | 187 |
| CO₂ per capita | −0.275 | <0.001 | 187 |
| GDP per capita | 0.178 | 0.024 | 161 |
| Renewables share | 0.312 | 0.006 | 77 |
Table 14.
EU-27 member states ranked by CPPI (top 10)
| EU Rank | Country | Global Rank | CPPI | D1 | D2 | D3 | D4 |
|---|---|---|---|---|---|---|---|
| 1 | Sweden | 2 | 74.02 | 0.719 | 0.639 | 0.819 | 0.870 |
| 2 | Denmark | 3 | 73.59 | 0.644 | 0.639 | 0.888 | 0.927 |
| 3 | Finland | 7 | 71.06 | 0.604 | 0.632 | 0.807 | 0.943 |
| 4 | Netherlands | 17 | 65.96 | 0.535 | 0.623 | 0.855 | 0.782 |
| 5 | Austria | 19 | 65.90 | 0.606 | 0.617 | 0.810 | 0.673 |
| 6 | Ireland | 22 | 64.89 | 0.528 | 0.597 | 0.877 | 0.737 |
| 7 | Luxembourg | 23 | 64.60 | 0.448 | 0.618 | 0.949 | 0.840 |
| 8 | Germany | 25 | 63.82 | 0.466 | 0.606 | 0.863 | 0.778 |
| 9 | France | 27 | 63.18 | 0.593 | 0.574 | 0.777 | 0.636 |
| 10 | Portugal | 28 | 62.83 | 0.694 | 0.539 | 0.636 | 0.529 |
Disclaimer/Publisher’s Note: The statements, opinions and data contained in all publications are solely those of the individual author(s) and contributor(s) and not of MDPI and/or the editor(s). MDPI and/or the editor(s) disclaim responsibility for any injury to people or property resulting from any ideas, methods, instructions or products referred to in the content. |
© 2026 by the authors. Licensee MDPI, Basel, Switzerland. This article is an open access article distributed under the terms and conditions of the Creative Commons Attribution (CC BY) license (http://creativecommons.org/licenses/by/4.0/).
Copyright: This open access article is published under a Creative Commons CC BY 4.0 license, which permit the free download, distribution, and reuse, provided that the author and preprint are cited in any reuse.


